KMI Wire and Cable, Tbk 60 IHSG - kabelmetal...
14
Page 1 of 14 pages Contact: Equity & Index Valuation Division Phone: (6221) 7278 2380 [email protected] “Disclaimer statement in the last page is an integral part of this report” www.pefindo.com KMI Wire and Cable, Tbk Primary Report Equity Valuation December 7 th , 2011 Target Price Low High 225 255 Cable Industry Historical Chart 0 20 40 60 80 100 120 140 0 500 1000 1500 2000 2500 3000 3500 4000 4500 Nov-10 Dec-10 Jan-11 Feb-11 Mar-11 Apr-11 May-11 Jun-11 Jul-11 Aug-11 Sep-11 Oct-11 Nov-11 IHSG KBLI Source : Bloomberg Stock Information Rp Ticker code KBLI Market price as of December 6 th , 2011 103 Market price – 52 week high 122 Market price – 52 week low 75 Market cap – 52 week high (bn) 489 Market cap – 52 week low (bn) 301 Market Value Added & Market Risk 0 0.1 0.2 0.3 0.4 0.5 0.6 0.7 0.8 0.9 (500.00) (450.00) (400.00) (350.00) (300.00) (250.00) (200.00) (150.00) (100.00) (50.00) - Sept-08 Sept-09 Sept-10 MVA Market risk Source: Bloomberg. Pefindo Equity & Index Valuation Shareholders (%) Javas Premier Venture Capital Limited 47.7 BNP Paribas Private Singapore 8.7 GS LND Clear A/C c/o Citibank NA 7.8 GSAF Risk Arbitage Investment 7.6 Public (each below 5% ownership) 28.3 Strong and Reliable Cable Manufacturer PT KMI Wire and Cable Tbk (“KBLI”) previously named PT GT Kabel Indonesia Tbk is a company that engaged in the manufacture of cables. KBLI was established in 1972 on 10- hectare area in Cakung, East Jakarta and started its operations to produce low voltage and telephone cable. KBLI has production capacity as many as 27,000 tons/year, in which consists of 12,000 tons/year for aluminum power cable and 15,000 tons/year for copper power cable. Currently, KBLI produces more than 2,000 type and size of cable, such as; low and medium voltage power cable, control and other cables. Approximately 90% of KBLI’s sales are for local market and the rest is for export. To respond the increasing cable demand, KBLI will add its production capacity by adding additional machineries, which is expected to operate in 2H12. Up to now, the production utilization of copper and aluminum cable are 80% and 50% respectively. Through long experience and consistency in maintaining its product quality, thus makes KBLI known as a strong and reliable cable manufacturer.
Transcript of KMI Wire and Cable, Tbk 60 IHSG - kabelmetal...
Page 1 of 14 pages
Contact: Equity & Index Valuation Division Phone: (6221) 7278 2380 [email protected]
“Disclaimer statement in the last page is an
integral part of this report”
www.pefindo.com
KMI Wire and Cable, Tbk Primary Report
Equity Valuation
December 7th, 2011
Target Price
Low High
225 255
Cable Industry
Historical Chart
0
20
40
60
80
100
120
140
0
500
1000
1500
2000
2500
3000
3500
4000
4500
No
v-1
0
De
c-1
0
Jan
-11
Fe
b-1
1
Ma
r-1
1
Ap
r-1
1
Ma
y-1
1
Jun
-11
Jul-
11
Au
g-1
1
Se
p-1
1
Oct-
11
No
v-1
1
IHSG
KBLI
Source : Bloomberg
Stock Information Rp
Ticker code KBLI
Market price as of December 6th, 2011 103
Market price – 52 week high 122
Market price – 52 week low 75
Market cap – 52 week high (bn) 489
Market cap – 52 week low (bn) 301
Market Value Added & Market Risk
0
0.1
0.2
0.3
0.4
0.5
0.6
0.7
0.8
0.9
(500.00)
(450.00)
(400.00)
(350.00)
(300.00)
(250.00)
(200.00)
(150.00)
(100.00)
(50.00)
-
Sept-08 Sept-09 Sept-10
MVA
Market risk
Source: Bloomberg. Pefindo Equity & Index Valuation
Shareholders (%)
Javas Premier Venture Capital Limited 47.7
BNP Paribas Private Singapore 8.7
GS LND Clear A/C c/o Citibank NA 7.8
GSAF Risk Arbitage Investment 7.6
Public (each below 5% ownership) 28.3
Strong and Reliable Cable Manufacturer
PT KMI Wire and Cable Tbk (“KBLI”) previously named PT GT Kabel Indonesia Tbk is a company that engaged in the manufacture of cables. KBLI was established in 1972 on 10- hectare area in Cakung, East
Jakarta and started its operations to produce low voltage and telephone cable. KBLI has production capacity as many as 27,000 tons/year, in
which consists of 12,000 tons/year for aluminum power cable and 15,000 tons/year for copper power cable. Currently, KBLI produces more than 2,000 type and size of cable, such as; low and medium voltage power cable, control and other cables. Approximately 90% of KBLI’s sales are for local market and the rest is for export. To respond the increasing
cable demand, KBLI will add its production capacity by adding additional machineries, which is expected to operate in 2H12. Up to now, the production utilization of copper and aluminum cable are 80% and 50% respectively. Through long experience and consistency in maintaining its product quality, thus makes KBLI known as a strong and reliable cable manufacturer.

“Disclaimer statement in the last page
is an integral part of this report”
www.pefindo.com
KMI Wire and Cable, Tbk
December 7th, 2011 Page 2 of 14 pages
Superior to Its Peers The increasing activities in national business due to better economic environment has made KBLI’s sales grow significantly in all segment of domestic markets. KBLI’s revenue in 3Q11 edged up by 42% or reached Rp 1,237 bn, in which already exceeded its revenue in 2010.
KBLI’s growth was mainly driven by strong national demand for cable both from government, household as well as private sector. That superb performance made KBLI’s gross, operating and net margins above the average. KBLI’s gross, operating and net margin was 9.2%, 5.2% and 4.0% respectively, while the average industry was only 8.5%, 4.7% and 3.0%. In line with high cable demand that triggered by robust national economic growth, we believe KBLI will be able to
book significant sales growth in coming years. Promising Production Ahead At present, KBLI’s production utilization for copper and aluminum cables are 80% and 50% respectively or around 12,000 tons/year and
6,000 tons/year. To anticipate surge demand of national cable, KBLI plans to gradually increase its total production by adding several new
machines. For such plan, KBLI has prepared capital expenditure as much as Rp 55 bn and the new machineries are expected to operate in 2H12. In line with the growing production of national cable industry that is predicted to reach 20% YoY in 2012, we estimate KBLI’s production will grow by 16% or reached 20,900 tons, consisting of copper cable as 13,200 tons and 7,700 aluminum cable in 2012 from
total of 18,000 tons this year. Developing New Product to Boost Growth As an effort in developing its products, KBLI successfully launched the new product called Aluminum Conductor with Composite Core (ACCC) since 2010. This type of conductor has better efficiency than conventional cable. Up to 3Q11, ACCC has contributed as much as 2%
of KBLI’s total revenue or reach Rp 28.2 bn. The first sales of this product has used for transmission project of PLN in Sumatera. In line
with high demand of cable and considering its sales performance as new product that already gave such contribution in its first year, thus we believe ACCC will provide more contribution to KBLI’s revenue in the years to come.
Business Prospect Better economic environment in Indonesia greatly impacts on national business improvement, both government and private sector. Despite the commodity prices such as copper and aluminum have high volatility, but we predict it will not hamper cable industry performance since the price change will be fully passed through to customers.
Moreover, amid low prices of raw material, the cable price is actually going up due to strong cable demand in domestic market. Also, the stability of Rupiah gives valuable contribution to KBLI. Through KBLI’s superb performance in 3Q11 which already booked Rp 1,237 bn or exceeded its revenue in 2010, thus we believe KBLI can generate
revenue as much as Rp 1,763 bn in 2011 or grow by 43% and 12% CAGR for 2011 – 2015 periods. Table 1: Performance Summary
2008 2009 2010 2011P 2012P
Revenue [Rp bn] 1,732 822 1,228 1,763 1,728
Pre-tax Profit [Rp bn] 48 33 67 107 116
Net Profit [Rp bn] 27 21 48 81 88
EPS [Rp] 7 5 12 20 22
EPS Growth [%] n.a (0.3) 1.4 0.7 0.1
P/E [x] 7.5 10.8 6.6 5.1* 4.7*
PBV [x] 1.0 1.0 1.1 0.5* 0.5*
Source:PT KMI Wire and Cable Tbk., Pefindo Equity & Index Valuation Estimates * Based on the KBLI’s share price as of December
6
th 2011 – Rp 103 / share.
INVESTMENT PARAMETER

“Disclaimer statement in the last page
is an integral part of this report”
www.pefindo.com
KMI Wire and Cable, Tbk
December 7th, 2011 Page 3 of 14 pages
Growth-Value Map provides overview of market expectations for the companies listed on IDX. Current Performance (“CP”) metric, running along the horizontal axis, is a portion of current stock market value that can be linked to the perpetuity of current company’s performance in profitability. Growth Expectations
(“GE”) metric, plotted on the vertical axis, is the difference between current stock market value and the value of current performance. Both metrics are normalized by the company’s book value. Growth-Value Map divides companies into four clusters, they are:
Excellent Value Managers (“Q-1”) Market expects companies in Q-1 to surpass their benchmark in profitability and growth.
Expectation Builders (“Q-2”) Market has relatively low expectations of profitability from companies in Q-
2 in the short term, but has growth expectations exceed the benchmark.
Traditionalists (“Q-3”)
Market has low growth expectations of companies in the Q-3, although they showed a good profitability in the short term.
Asset-loaded Value Managers (“Q-4”) Market has low expectations in terms of profitability and growth for
companies in Q-4.
Figure 1: Growth-Value Map of KBLI
-4
-3
-2
-1
0
1
2
3
4
5
6
0 1 2 3 4 5 6
Gro
wth
Exp
ecta
tio
ns
Current Performance (CP)
KBLI
Q-4
Q-2 Q-1
Q-3
Source: Bloomberg, Pefindo Equity & Index Valuation Division
Based on our valuation using KBLI’s financial report as of September 30th, 2011, and compared to other companies in this industry, we classify KBLI in Asset-loaded Value Managers cluster. However in term of performance, KBLI successfully booked better historical performance than its peers. Therefore, we assume that KBLI’s value is still overlooked in market. It may need better KBLI’s efforts to make investors realize the company potential. KBLI has opportunity to move to Excellent Value Managers’ cluster (quadrant 1) by three ways:
strengthen their internal growth capabilities, doing actions to drive market perceptions of their economic success and regularly update their significant information to public.
GROWTH VALUE MAP

“Disclaimer statement in the last page
is an integral part of this report”
www.pefindo.com
KMI Wire and Cable, Tbk
December 7th, 2011 Page 4 of 14 pages
Cable Industry Outlook: Stronger Cable Demand The improving national economy which is depicted by better GDP growth has triggered high consumption in all market segments, such as government, private and household sector. Therefore it will give positive impact to the industries such
as cable industry. For instance in 3Q11, the cable industry enjoyed significant sales growth such as KBLI which grew by 42%. In term of sales volume, we estimate KBLI’s sales volume will soar by 20% in 2011. It is in line with the growing of national cable revenue, in which already reached Rp 7,492 bn in 3Q11 or already exceeded its value in 2010 which was Rp 7,340 bn. Moreover, low portion of KBLI’s export sales, stability of Rupiah plus high buying power makes us convinced that KBLI has bright prospect ahead.
Reliable due to Its Quality of Product and Long Experience
In serving its customer, KBLI provides high-quality product that has national and
international standards. KBLI’s power cables have met the national standards, such as Standar Nasional Indonesia (SNI) and Standar Perusahaan Listrik Negara (SPLN), and also the international standard, such as standard from International Electrotechnical Commission (IEC), Australian Standard (AS), British Standard (BS), Verband Deutscher Elektrotechniker (VDE), Japanese Industrial Standard
(JIS) and Insulated Cable Engineers Association/National Electrical Manufacturers Association (ICEA/NEMA). Augmented with more than 30-year experience in this industry, thus make KBLI known as a reliable cable producer in Indonesia. Varied Range of Products As one of the biggest cable producers, KBLI produces more than 2,000 different
types and size of cables under the brand of “Kabelmetal” for domestic market and “KMI” for export. Of many types of the products, KBLI classifies its product into 3 (three) main categories, namely low-voltage power cable, medium-voltage power cable and instrument/specific cable. Low-voltage cable has power up to 1 kV,
while medium-voltage power has power up to 36 kV, and specific cables are made based on order. Compared to its peers, KBLI products rank third in national cable industry with 17% market share from total revenue of national cable which
was Rp 7,492 bn in 3Q11. Furthermore, the release of new products namely ACCC in 2010 is believed to give bright prospect in coming years.
Figure 2: National Cable Revenue
(Rp bn)
5,980
7,340 7,492
-
1,000
2,000
3,000
4,000
5,000
6,000
7,000
8,000
2009 2010 3Q11
in R
p b
n
National Cable Turnover
Source: Indonesia Stock Exchange., Pefindo Equity and Index Valuation Division
BUSINESS INFORMATION
“Disclaimer statement in the last page
is an integral part of this report”
www.pefindo.com
KMI Wire and Cable, Tbk
December 7th, 2011 Page 5 of 14 pages
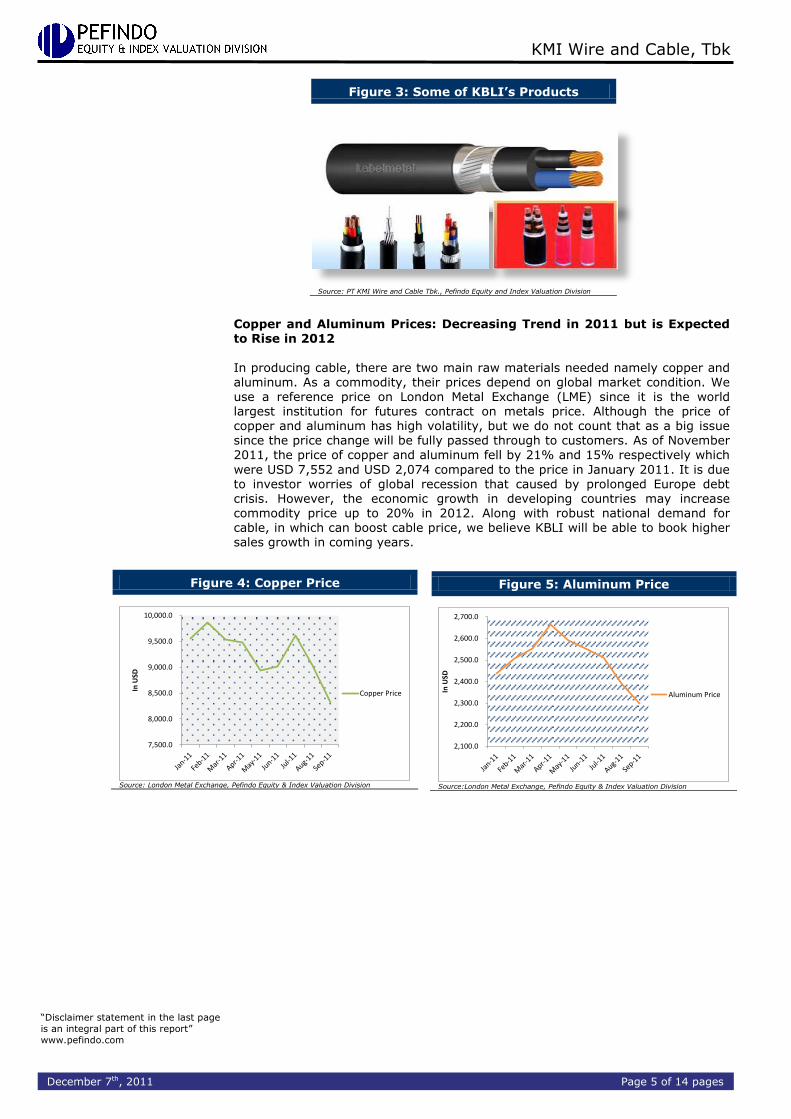
Copper and Aluminum Prices: Decreasing Trend in 2011 but is Expected to Rise in 2012
In producing cable, there are two main raw materials needed namely copper and aluminum. As a commodity, their prices depend on global market condition. We use a reference price on London Metal Exchange (LME) since it is the world largest institution for futures contract on metals price. Although the price of copper and aluminum has high volatility, but we do not count that as a big issue since the price change will be fully passed through to customers. As of November 2011, the price of copper and aluminum fell by 21% and 15% respectively which
were USD 7,552 and USD 2,074 compared to the price in January 2011. It is due to investor worries of global recession that caused by prolonged Europe debt crisis. However, the economic growth in developing countries may increase commodity price up to 20% in 2012. Along with robust national demand for cable, in which can boost cable price, we believe KBLI will be able to book higher sales growth in coming years.
Figure 3: Some of KBLI’s Products
Source: PT KMI Wire and Cable Tbk., Pefindo Equity and Index Valuation Division
Figure 5: Aluminum Price
2,100.0
2,200.0
2,300.0
2,400.0
2,500.0
2,600.0
2,700.0
In U
SD
Aluminum Price
Source:London Metal Exchange, Pefindo Equity & Index Valuation Division
Figure 4: Copper Price
7,500.0
8,000.0
8,500.0
9,000.0
9,500.0
10,000.0
In U
SD
Copper Price
Source: London Metal Exchange, Pefindo Equity & Index Valuation Division

“Disclaimer statement in the last page
is an integral part of this report”
www.pefindo.com
KMI Wire and Cable, Tbk
December 7th, 2011 Page 6 of 14 pages
Soaring Growth in 3Q11 KBLI recorded superb performance in 3Q11 by 42% YoY sales growth or reach Rp 1,237 bn, in which already exceeded its revenue in 2010. It is mainly due to increased in cable price that caused by high demand of cable in domestic. It impacts to KBLI’s gross, operating and net profit which also grew as much as
14%, 26% and 23 % respectively. Compared to its peers, KBLI booked better performance in term of gross, operating and net margin, namely 9.2%, 5.2% and 4.0%. While the average margins of its peers were only 8.0%, 4.0% and 2.0% respectively. In line with higher buying power, budget of government spending as well private investment, we believe KBLI can achieve sales growth at least 43% in 2011 or hit Rp 1,763 bn.
Smart Raw Materials Management Provide Better KBLI’s Gross Margin In its production activities, KBLI need raw material such as copper and aluminum,
in which their prices are fluctuated. Nonetheless, KBLI’s ability to implement its
raw material management is proved to be effective. According to historical performance, KBLI successfully suppressed lower COGS margin compared to the industry average. For instance in 1H11, KBLI booked COGS margin at 90.4%, while the industry average margins were as high as 92.0%. Consequently, KBLI succeeded to book better gross margin on that period at 9%, higher than the industry average which was only 8%. Later in 3Q11, KBLI’s COGS margin was
also below the average, namely 90.8%, while the industry average was 91.1%. We believe that KBLI has done well in their raw materials management to suppress COGS.
Figure 6: KBLI’s Sales up to 3Q11
(Rp bn)
822
1,228
748
1,237
0
200
400
600
800
1000
1200
1400
2009 2010 1H11 3Q11
In R
p bn
Sales
Source: PT KMI Wire and Cable Tbk, Pefindo Equity and Index Valuation Division
Figure 7: KBLI’s COGS Margin vs Peers Average Margin
(in %)
90%
91%
92%
91%
89%
90%
91%
92%
93%
June 2011 September 2011
KBLI
Peers Average
Source: PT KMI Wire and Cable Tbk, Pefindo Equity & Index Valuation Division
FINANCE

“Disclaimer statement in the last page
is an integral part of this report”
www.pefindo.com
KMI Wire and Cable, Tbk
December 7th, 2011 Page 7 of 14 pages
Faster Inventory Turnover over Its Peers
In manufacturing industry, the ability to convert the inventory to sales value determines company success. And KBLI’s effort in managing its inventory is proved to be effective. Therefore, KBLI can keep low working capital for inventory due to faster inventory turnover compared to its peers. For example in 3Q11, KBLI recorded its inventory turnover as 86 days, much lower than the industry
average that recorded as long as 124 days. As a result, KBLI was able to book sales growth of 42% during the period. In line with soaring demand of national cable, we believe KBLI is able to maintain its low inventory turnover. Booked Better Leverage in 3Q11 In 3Q11, KBLI did quasi-reorganization to eliminate deficit of retained earnings
by adjusting paid in capital balance and fixed asset revaluation. By doing so, its fixed asset has increased to become Rp 398 bn from Rp 41 bn in 3Q10. As a result, KBLI could book positive retained earnings as much as Rp 47 bn compared to the same period last year in which minus Rp 579 bn. By such action, KBLI could book better Debt to Equity Ratio (DER) in 3Q11 with 47%, while its peers
average were as high as 198%.
Develop New Product to Sustain Growth To anticipate the varying demand in market, KBLI successfully developed its new product namely Aluminum Conductor with Composite Core (ACCC) in 2010. In Indonesia, KBLI is the biggest ACCC producer since it is the pioneer to produce this product. The main strength of ACCC product is capable to carry twice of
electrical power than conventional conductor. In 3Q11, ACCC product contributes as much as Rp 28 bn or 2% from KBLI’s total sales. In 2010, the production, shipment and its installation have carried out for PLN in Sumatera. Along with high demand of cable in domestic and considering ACCC is more efficient, we believe ACCC will provide higher contribution to KBLI’s sales.
The Growth of Electricity Production Drives Strong Demand of Cable The rapid development of infrastructure in Indonesia both from government and
private sector trigger high production of electricity as well as cable as the conductor. Moreover PLN, as biggest electricity producer, is now running 10,000 MW-project which has been started since 2008. Such high demand of electricity
supply will directly impact on national cable production which is estimated to grow 20% per year. As a result, KBLI can enjoy satisfactory sales growth in 2011. Only up to 3Q11, KBLI’s sales already reached Rp 1,237 bn or exceeded its value in 2010. Currently, PLN contributes around 20% to KBLI’s total sales. By such big opportunity and augmented with KBLI’s new product namely ACCC, which is more efficient, we are confident that KBLI can grab more projects from PLN.
Figure 8: ACCC Product
Source: Data Processed by Pefindo Equity and Index Valuation Division

“Disclaimer statement in the last page
is an integral part of this report”
www.pefindo.com
KMI Wire and Cable, Tbk
December 7th, 2011 Page 8 of 14 pages
Meanwhile, the number of PLN’s subscriber in the past five years grew at CAGR
4.25%. That growth consists of household, industry, business, social sector and government. Along with high buying power in every market segment that
triggered by better national economy condition, we predict KBLI’s sales will be elevated around 43% in 2011. Local Sales Remains the Main Contributor to KBLI’s Revenue In terms of selling activity, KBLI classifies its customer into three segments,
namely free market, PLN and export. Their contribution to KBLI’s sales as of 3Q11 is 80%, 16% and 4% respectively, or each of them generates Rp 988 bn, 203 bn and Rp 46 bn. From that figure, it can be inferred that local sales give the highest contribution to KBLI’s total revenue. And it becomes one of KBLI’s strong points since national economy has better potential market for cable than export amid the global economy uncertainty. Onwards, we predict the cable demand will remain strong in line with continued economic improvement in Indonesia. By
such bright prospect in national cable industry and augmented by KBLI’s brand image in market, we believe KBLI’s revenue from local sales will continue to
increase.
Figure 9: Electricity Production and PLN’s
Subscriber
35,391
37,680 38,622
40,117
42,435
-
20,000
40,000
60,000
80,000
100,000
120,000
140,000
160,000
180,000
30,000
32,000
34,000
36,000
38,000
40,000
42,000
44,000
2006 2007 2008 2009 2010
in G
Wh
in t
ho
usa
nd
s
PLN's Subscriber
Electricity Production
Source: PLN., Pefindo Equity and Index Valuation Division
Figure 10: KBLI’s Sales by Market Segment
(in %)
80%
16%
4%
Free Market
PLN
Export
Source: PT KMI Wire and Cable Tbk., Pefindo Equity and Index Valuation Division
“Disclaimer statement in the last page
is an integral part of this report”
www.pefindo.com
KMI Wire and Cable, Tbk
December 7th, 2011 Page 9 of 14 pages
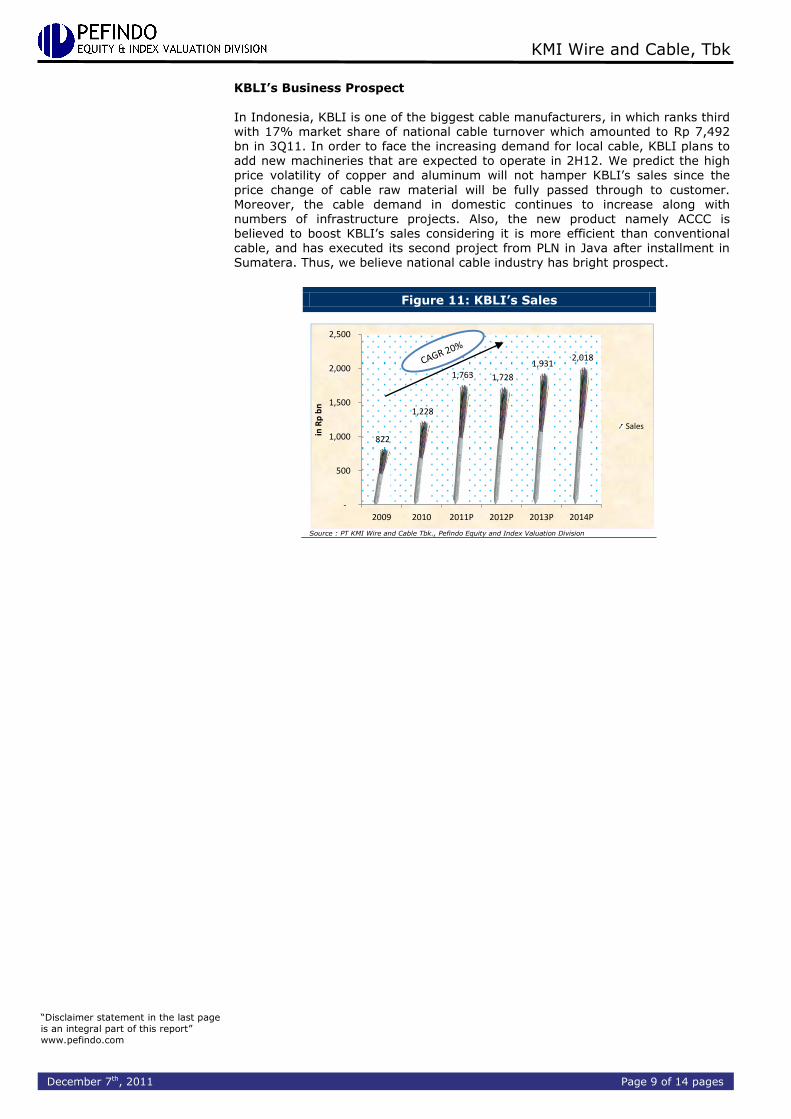
KBLI’s Business Prospect
In Indonesia, KBLI is one of the biggest cable manufacturers, in which ranks third with 17% market share of national cable turnover which amounted to Rp 7,492 bn in 3Q11. In order to face the increasing demand for local cable, KBLI plans to add new machineries that are expected to operate in 2H12. We predict the high price volatility of copper and aluminum will not hamper KBLI’s sales since the
price change of cable raw material will be fully passed through to customer. Moreover, the cable demand in domestic continues to increase along with numbers of infrastructure projects. Also, the new product namely ACCC is believed to boost KBLI’s sales considering it is more efficient than conventional cable, and has executed its second project from PLN in Java after installment in Sumatera. Thus, we believe national cable industry has bright prospect.
Figure 11: KBLI’s Sales
822
1,228
1,763 1,728
1,931 2,018
-
500
1,000
1,500
2,000
2,500
2009 2010 2011P 2012P 2013P 2014P
in R
p b
n
Sales
Source : PT KMI Wire and Cable Tbk., Pefindo Equity and Index Valuation Division

“Disclaimer statement in the last page
is an integral part of this report”
www.pefindo.com
KMI Wire and Cable, Tbk
December 7th, 2011 Page 10 of 14 pages
Table 2: SWOT Analysis
Strength Weakness
Has good track record in cable industry since 1972.
Having wide-range of products. Has launched new product namely
Aluminum Conductor with Composite Core (ACCC).
Equipped with national and international standard to ensure the product quality.
Not rely on one market segment.
High entry barrier.
Decline in global economic
condition could affect export sales.
Opportunity Threat
Strong local demand for cable from
government, household and private sectors.
Bright prospect for ACCC product since it is more efficient than conventional cable.
Decline in purchasing power. Rely on technological change.
Table 3: KBLI and Its Peers Performance Summary as of September 2011
KBLI IKBI KBLM JECC SCCO VOKS
Sales [Rp, bn] 1,237 987 601 912 2,295 1,460
Gross Profit [Rp, bn] 114 35 44 77 167 198
Operating Profit [Rp, bn] 65 (4) 27 41 108 117
Net Profit [Rp, bn] 50 (6) 13 24 73 74
Total Asset [Rp, bn] 1,036 1,166 557 676 1,439 1,397
Total Liabilities [Rp, bn] 333 196 319 528 961 937
Total Equity [Rp, bn] 703 970 238 122 478 459
Growth YoY
Sales [%] 42.2 14.9 46 57.9 43.5 69.4
Gross Profit [%] 14.0 (17.4) 77 163.8 44.0 109.5
Net Profit [%] 23.0 (851.3) 254 481.9 52.2 1,030.7
Profitability
Gross Margin [%] 9.2 3.5 7.3 8.4 7.3 13.5
Operating Margin [%] 5.2 (0.4) 4.5 4.5 4.7 8.0
Net Margin [%] 4.0 (0.6) 2.1 2.6 3.2 5.1
ROA [%] 4.8 (0.5) 2.3 3.5 5.1 5.3
ROE [%] 7.1 (0.6) 5.4 19.4 15.3 16.1
Leverage
DER [%] 0.47 0.20 1.34 4.33 2.01 2.04
Source: PT KMI Wire and Cable Tbk, PT Sumi Indo Kabel Tbk, PT Kabelindo Murni Tbk, PT Jembo Cable Company, PT Supreme Cable Manufacturing Corporation Tbk, PT Voksel Electric Tbk., Pefindo Equity & Index Valuation Division
SWOT ANALYSIS
“Disclaimer statement in the last page
is an integral part of this report”
www.pefindo.com
KMI Wire and Cable, Tbk
December 7th, 2011 Page 11 of 14 pages
VALUATION
Methodology We apply Discounted Cash Flow (DCF) method as the main valuation
approach considering the income growth is the value driver for KBLI instead of the asset growth. Furthermore, we also apply Guideline Company Method (GCM) as comparison method. This valuation is based on 100% KBLI’s shares price as of December 7th,
2011, using KBLI’s financial report as of September 30th 2011 for our fundamental analysis.
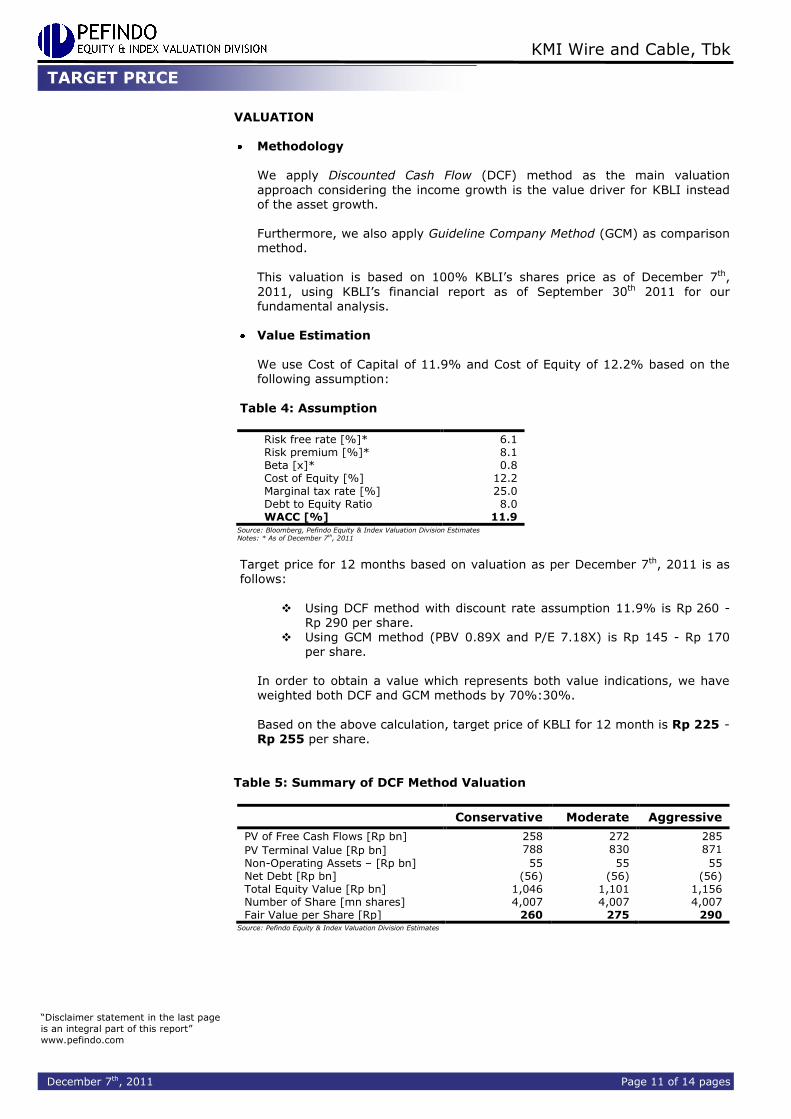
Value Estimation
We use Cost of Capital of 11.9% and Cost of Equity of 12.2% based on the following assumption:
Table 4: Assumption
Risk free rate [%]* 6.1 Risk premium [%]* 8.1 Beta [x]* 0.8 Cost of Equity [%] 12.2 Marginal tax rate [%] 25.0 Debt to Equity Ratio 8.0 WACC [%] 11.9
Source: Bloomberg, Pefindo Equity & Index Valuation Division Estimates Notes: * As of December 7
th, 2011
Target price for 12 months based on valuation as per December 7th, 2011 is as follows:
Using DCF method with discount rate assumption 11.9% is Rp 260 - Rp 290 per share.
Using GCM method (PBV 0.89X and P/E 7.18X) is Rp 145 - Rp 170 per share.
In order to obtain a value which represents both value indications, we have weighted both DCF and GCM methods by 70%:30%.
Based on the above calculation, target price of KBLI for 12 month is Rp 225 - Rp 255 per share.
Table 5: Summary of DCF Method Valuation
Conservative Moderate Aggressive
PV of Free Cash Flows [Rp bn] 258 272 285
PV Terminal Value [Rp bn] 788 830 871
Non-Operating Assets – [Rp bn] 55 55 55 Net Debt [Rp bn] (56) (56) (56) Total Equity Value [Rp bn] 1,046 1,101 1,156 Number of Share [mn shares] 4,007 4,007 4,007 Fair Value per Share [Rp] 260 275 290
Source: Pefindo Equity & Index Valuation Division Estimates
TARGET PRICE

“Disclaimer statement in the last page
is an integral part of this report”
www.pefindo.com
KMI Wire and Cable, Tbk
December 7th, 2011 Page 12 of 14 pages
Table 6: GCM Comparison
KBLI IKBI KBLM JECC SCCO VOKS Average
Valuation, December 7th, 2011
P/E, [x] n.a n.a 9.53 4.55 8.37 6.26 7.18
P/BV, [x] 0.61 0.76 0.54 0.68 1.34 1.40 0.89
Source: Bloomberg, Pefindo Equity & Index Valuation Division Estimates
Table 7: Summary of GCM Method Valuation
Multiples
(x)
Est. EPS
(Rp)
Est. BV/Share
(Rp)
Value
(Rp)
P/BV 0.89 - 196 170 P/E 7.18 20 - 145
Source: Bloomberg, Pefindo Equity & Index Valuation Division Estimates
Table 8: Fair Value Reconciliation
Fair Value per Share [Rp]
DCF GCM Average
Upper limit 290 170 255
Bottom limit 260 145 225
Weight 70% 30%
Source: Pefindo Equity & Index Valuation Division Estimates
“Disclaimer statement in the last page
is an integral part of this report”
www.pefindo.com
KMI Wire and Cable, Tbk
December 7th, 2011 Page 13 of 14 pages
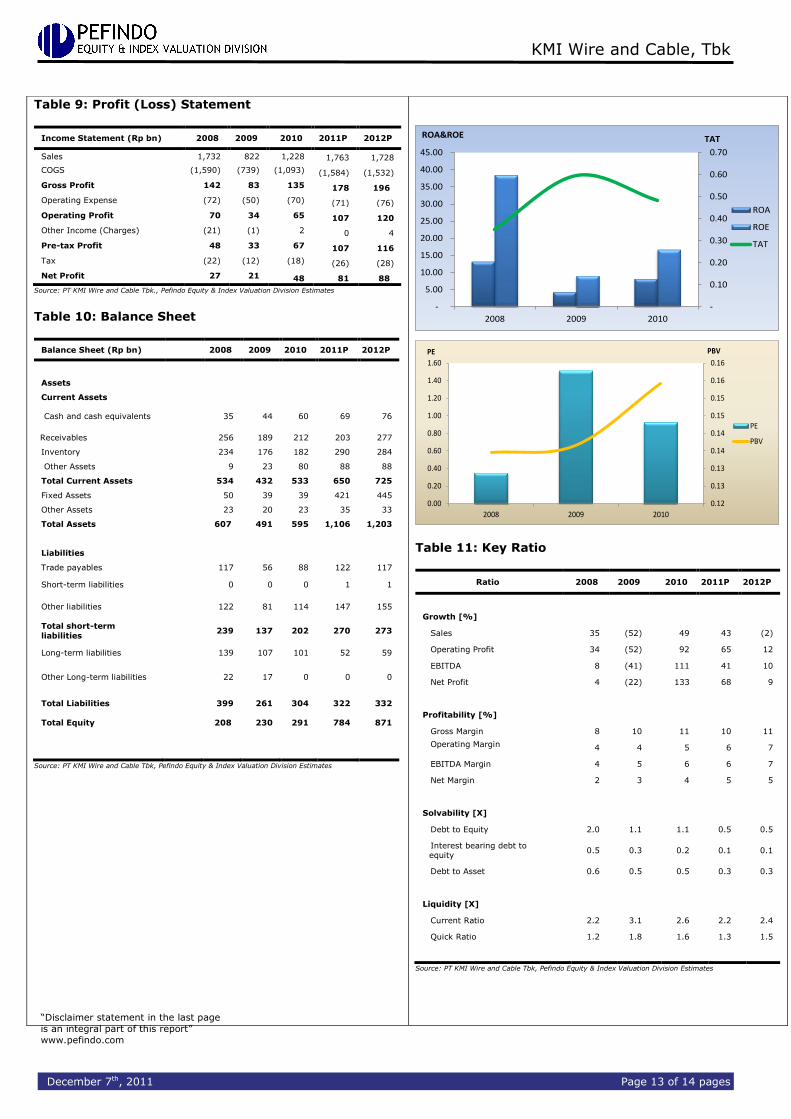
Table 9: Profit (Loss) Statement
Income Statement (Rp bn) 2008 2009 2010 2011P 2012P
Sales 1,732 822 1,228 1,763 1,728
COGS (1,590) (739) (1,093) (1,584) (1,532)
Gross Profit 142 83 135 178 196
Operating Expense (72) (50) (70) (71) (76)
Operating Profit 70 34 65 107 120
Other Income (Charges) (21) (1) 2 0 4
Pre-tax Profit 48 33 67 107 116
Tax (22) (12) (18) (26) (28)
Net Profit 27 21 48 81 88
Source: PT KMI Wire and Cable Tbk., Pefindo Equity & Index Valuation Division Estimates
Table 10: Balance Sheet
Balance Sheet (Rp bn)
2008 2009 2010 2011P 2012P
Assets
Current Assets
Cash and cash equivalents
35 44 60 69 76
Receivables 256 189 212 203 277
Inventory 234 176 182 290 284
Other Assets 9 23 80 88 88
Total Current Assets 534 432 533 650 725
Fixed Assets 50 39 39 421 445
Other Assets 23 20 23 35 33
Total Assets 607 491 595 1,106 1,203
Liabilities
Trade payables 117 56 88 122 117
Short-term liabilities
0 0 0 1 1
Other liabilities
122 81 114 147 155
Total short-term
liabilities
239 137 202 270 273
Long-term liabilities
139 107 101 52 59
Other Long-term liabilities
22 17 0 0 0
Total Liabilities
399 261 304 322 332
Total Equity 208 230 291 784 871
Source: PT KMI Wire and Cable Tbk, Pefindo Equity & Index Valuation Division Estimates
-
0.10
0.20
0.30
0.40
0.50
0.60
0.70
-
5.00
10.00
15.00
20.00
25.00
30.00
35.00
40.00
45.00
2008 2009 2010
TATROA&ROE
ROA
ROE
TAT
0.12
0.13
0.13
0.14
0.14
0.15
0.15
0.16
0.16
0.00
0.20
0.40
0.60
0.80
1.00
1.20
1.40
1.60
2008 2009 2010
PBVPE
PE
PBV
Table 11: Key Ratio
Ratio 2008 2009 2010 2011P 2012P
Growth [%]
Sales 35 (52) 49 43 (2)
Operating Profit 34 (52) 92 65 12
EBITDA 8 (41) 111 41 10
Net Profit 4 (22) 133 68 9
Profitability [%]
Gross Margin 8 10 11 10 11
Operating Margin
4 4 5 6 7
EBITDA Margin 4 5 6 6 7
Net Margin 2 3 4 5 5
Solvability [X]
Debt to Equity 2.0 1.1 1.1 0.5 0.5
Interest bearing debt to equity
0.5 0.3 0.2 0.1 0.1
Debt to Asset 0.6 0.5 0.5 0.3 0.3
Liquidity [X]
Current Ratio 2.2 3.1 2.6 2.2 2.4
Quick Ratio 1.2 1.8 1.6 1.3 1.5
Source: PT KMI Wire and Cable Tbk, Pefindo Equity & Index Valuation Division Estimates

“Disclaimer statement in the last page
is an integral part of this report”
www.pefindo.com
KMI Wire and Cable, Tbk
December 7th, 2011 Page 14 of 14 pages
DISCLAIMER
This report was prepared based on the trusted and reliable sources. Nevertheless, we do not guarantee its completeness, accuracy and adequacy. Therefore we do not responsible of any investment decision making based on this report. As for any assumptions, opinions and predictions were solely our internal judgments as per reporting date, and those judgments are subject to change without further notice.
We do not responsible for mistake and negligence occurred by using this report. Last performance could not always be used as reference for future outcome. This report is not an offering recommendation, purchase or holds particular shares. This report might not be suitable for some investors. All opinion in this report has been presented fairly as per issuing date with good intentions; however it could be change at any time without further notice. The price, value or income from each share of the Company stated in this report might lower than the investor
expectation and investor might obtain lower return than the invested amount. Investment is defined as the probable income that will be received in the future; nonetheless such return may possibly fluctuate. As for the Company which its share is denominated other than Rupiah, the foreign exchange fluctuation may reduce the value, price or investor investment return . This report does not contain any information for tax consideration in investment decision making.
The share price target in this report is a fundamental value, not a fair market value nor a
transaction price reference required by the regulations. The share price target issued by Pefindo Equity & Index Valuation Division is not a recommendation to buy, sell or hold particular shares and it could not be considered as an investment advice from Pefindo Equity & Index Valuation Division as its scope of service to, or in relation to some parties, including listed companies, financial advisor, broker, investment
bank, financial institution and intermediary, in correlation with receiving rewards or any other benefits from that parties. This report is not intended for particular investor and cannot be used as part of investment objective on particular shares and neither an investment recommendation on particular shares or an investment strategy. We strongly recommended investor to consider the suitable situat ion and condition at first before making decision in relation with the figure in this report. If it is
necessary, kindly contact your financial advisor.
PEFINDO keeps the activities of Equity Valuation separate from Ratings to preserve independence and objectivity of its analytical processes and products. PEFINDO has established policies and procedures to maintain the confidentiality of certain non-public information received in connection with each analytical process. The entire process, methodology and the database used in the preparation of the Reference Share Price Target Report as a whole is
different from the processes, methodologies and databases used PEFINDO in doing the rating. This report was prepared and composed by Pefindo Equity & Index Valuation Division with the objective to enhance shares price transparency of listed companies in Indonesia Stock Exchange (IDX). This report is also free of other party’s influence, pressure or force either from IDX or the listed company which reviewed by Pefindo Equity & Index Valuation Division. Pefindo Equity & Index Valuation
Division will earn reward amounting to Rp 20 mn each from IDX and the reviewed company for issuing report twice per year. For further information, please visit our website at http://www.pefindo.com This report is prepared and composed by Pefindo Equity & Index Valuation Division. In Indonesia, this report is published in our website and in IDX website.