KM World Conference Santa Clara, CA Oct. 30 – Nov. 01, 2001 Putting KM Principles into Practice:...
24
KM World Conference Santa Clara, CA Oct. 30 – Nov. 01, 2001 Putting KM Principles into Putting KM Principles into Practice: Practice: Canadian Forest Fire Situation Canadian Forest Fire Situation Report Report Dr. Albert J. Simard Caroline A. Cook
-
Upload
lucas-thornton -
Category
Documents
-
view
216 -
download
0
Transcript of KM World Conference Santa Clara, CA Oct. 30 – Nov. 01, 2001 Putting KM Principles into Practice:...

KM World Conference
Santa Clara, CAOct. 30 – Nov. 01, 2001
Putting KM Principles into Practice:Putting KM Principles into Practice:Canadian Forest Fire Situation ReportCanadian Forest Fire Situation Report
Dr. Albert J. Simard
Caroline A. Cook

“A new information revolution is well under way...It is not a revolution in technology, machinery, techniques, software, or speed. It is a revolution in CONCEPTS.”
Peter Drucker, Management Challenges for the 21st Century (1999)

PrinciplesPrinciples
• Use knowledge to transform data from multiple sources into synthesized information
• Focus on ease of understanding
• Technology is supporting, not driving
• Use existing systems and infrastructure
• Tacit knowledge is essential
• Lead by example

The SituationThe Situation
• Information collected by 17 jurisdictions
• Daily reports highly detailed & technical

Information source:Information source:3 years ago3 years ago

The SituationThe Situation
• Information collected by 17 jurisdictions
• Daily reports highly detailed & technical
• Delays between activity and reports
• Information in tabular and text formats only
• Information was disjointed, no synopsis
• Limited usefulness for non-professionals

The ContextThe Context
• Provinces & others manage forest fires
• Canadian Forest Service reports to Minister
• CFS is not an operational organization
• Inconsistent inputs precluded automation
• Report must be in plain language
• All documents must bilingual
• Report must be timely
• No budget

Design CriteriaDesign Criteria
• Use graphics for rapid understanding

The designThe design
0
500
1000
1500
2000
2500
3000
1 2 3 4 5 6 7 8 9 10 11 12 13 14 15 16 17 18 19 20
Hec
tare
s (x
1,00
0)
2001
10-yr avg.
May June July Aug. Sept.
Number of Fires
0
500
1000
1500
2000
Province
Nu
mb
er
10-yr
2001
10-yr 1765 148 814 314 627 434 1267 797 142 397 329 24 70
2001 1175 68 862 124 792 499 1516 980 187 441 439 29 94
BC YT AB NT SK MB ON QC NF NB NS PE PC
Seasonal Area Burned
0
250
500
750
1000
1 2 3 4 5 6 7 8 9 10 11 12 13 14 15 16 17 18 19 20
Nu
mb
er
AircraftPeoplePumps5-yr avg.
May June July Aug. Sept.
Interagency Resource MobilizationArea of Smoke by Satellite
0
20
40
60
80
100
120
140
160
1 6 11 16 21 26 31 5 10 15 20 25 30 5 10 15 20 25 30 4 9 14 19 24 29 3 8 13 18
Sq
uar
e k
ilom
eter
s (x
100
0)
May June July Aug. SeMay June July Aug. Sept.

Design CriteriaDesign Criteria
• Use graphics for rapid understanding
• Maximum one page of text to summarize the national situation
• Bilingual report published on the Web within 24 hours of receipt of inputs
• Link information from multiple sources to go beyond the facts
• Predict fire activity for coming week

The ApproachThe ApproachStatistics
Fire Information System MapsSatellite images
Weather forecasts
Tables and graphs
Weekly summary
Prognosis
Informationsources
Resources
The Product
Translation

Then what?Then what?
• Additions beyond the report is where you find more value added– the report
– archived reports
– links to provincial agencies
– links to other fire sites
– link to an expert

The reportThe report

Value-addedValue-added

Other agenciesOther agencies

Other fire sitesOther fire sites

Tacit knowledgeTacit knowledgeAn expertAn expert
Then what?Then what?
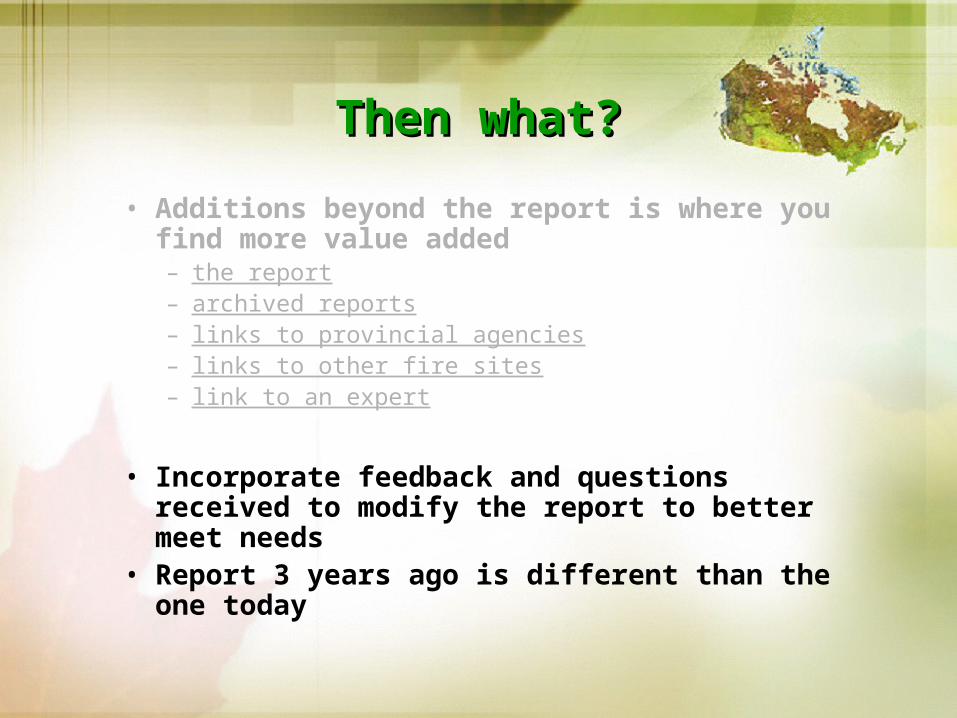
• Additions beyond the report is where you find more value added– the report– archived reports– links to provincial agencies– links to other fire sites– link to an expert
• Incorporate feedback and questions received to modify the report to better meet needs
• Report 3 years ago is different than the one today

EvaluationEvaluation
• Visits and users– 1998: 12,000 2001: 23,500 (to date)– Highest single access page for CFS-HQ– Media, tourists, students, companies, military
• Feedback– 1) Update military base commanders 2) Anticipate helicopter
deployment 3) Plan vacation 4) Prepare university project (5) Write newspaper article
• Efficiency– THEN: 48-hour turnaround (8-10 hrs work; 5 people; 10+ steps)– NOW : 24-hour turnaround (5-6 hrs work; 3 people; < 10 steps)
• Influence– From clients on the report– On information sources from the report– On other information providers from the report

Influence from clientsInfluence from clients
This addition in 2001 has reducedthe number of requests by 50%

Influence onInfluence oninformation sourcesinformation sources

Influence onInfluence oninformation sourcesinformation sources

Influence onInfluence onother sourcesother sources

Lessons learnedLessons learned
• Tools are tools – how you use them determines the success of a knowledge project
• People are central in knowledge organizations
• Capturing tacit knowledge is a challenge; adapting tools and processes is a solution.
• Leading by example does work.
• You can influence culture one project at a time.