KM 2006Q4AnalystSlides - final information...Q4 2006 GROUP NET INCOME 26 (1) 27-664 26 107 226 305...
34
Q406 FINANCIAL RESULTS Investor Community Conference Call KAREN MAIDMENT Chief Financial and Administrative Officer November 28 • 06
Transcript of KM 2006Q4AnalystSlides - final information...Q4 2006 GROUP NET INCOME 26 (1) 27-664 26 107 226 305...

Q406FINANCIAL RESULTS
Investor Community Conference Call
KAREN MAIDMENTChief Financial and Administrative Officer
November 28 • 06

F I N A N C I A L R E S U L T S - F O U R T H Q U A R T E R 2 0 0 6 1
FORWARD-LOOKING STATEMENTSCAUTION REGARDING FORWARD-LOOKING STATEMENTS Bank of Montreal’s public communications often include written or oral forward-looking statements. Statements of this type are included in this document, and may be included in other filings with Canadian securities regulators or the U.S. Securities and Exchange Commission, or in other communications. All such statements are made pursuant to the ‘safe harbor’ provisions of, and are intended to be forward-looking statements under, the United States Private Securities Litigation Reform Act of 1995 and any applicable Canadian securities legislation. Forward-looking statements may involve, but are not limited to, comments with respect to our objectives and priorities for 2006 and beyond, our strategies or future actions, our targets, expectations for our financial condition or share price, and the results of or outlook for our operations or for the Canadian and U.S. economies. By their nature, forward-looking statements require us to make assumptions and are subject to inherent risks and uncertainties. There is significant riskthat predictions, forecasts, conclusions or projections will not prove to be accurate, that our assumptions may not be correct and that actual results may differ materially from such predictions, forecasts, conclusions or projections. We caution readers of this document not to place undue reliance on our forward-looking statements as a number of factors could cause actual future results, conditions, actions or events to differ materially from the targets, expectations, estimates or intentions expressed in the forward-looking statements.The future outcomes that relate to forward-looking statements may be influenced by many factors, including but not limited to: general economic conditions in the countries in which we operate; interest rate and currency value fluctuations; changes in monetary policy; the degree of competition in the geographic and business areas in which we operate; changes in laws; judicial or regulatory proceedings; the accuracy and completeness of the information we obtain with respect to our customers and counterparties; our ability to execute our strategic plans and to complete and integrate acquisitions; critical accounting estimates; operational and infrastructure risks; general political conditions; global capital market activities; the possible effects on our business of war or terrorist activities; disease or illness that impacts on local, national or international economies, and disruptions to public infrastructure, such as transportation, communications, power or water supply; and technological changes.We caution that the foregoing list is not exhaustive of all possible factors. Other factors could adversely affect our results. For more information, please see the discussion on pages 29 and 30 of BMO’s 2005 Annual Report, which outlines in detail certain key factors that may affect BMO’s future results. When relying on forward-looking statements to make decisions with respect to Bank of Montreal, investors and others should carefully consider these factors, as well as other uncertainties and potential events, and the inherent uncertainty of forward-looking statements. Bank of Montreal does not undertake to update any forward-looking statement, whether written or oral, that may be made, from time to time, by the organization or on its behalf.Assumptions about the performance of the Canadian and U.S. economies in 2007 and how that will affect our businesses are material factors we consider when setting our strategic priorities and objectives and in determining our financial targets, including provisions for credit losses. Key assumptions include that the Canadian and U.S. economies will expand at a moderate pace in 2007 and that inflation will remain low. We have also assumed that interest rates in 2007 will remain little changed in Canada but decline in the United States and that the Canadian dollar will hold onto its recent gains in value relative to the U.S. dollar. In determining our expectations for economic growth, both broadly and in the financial services sector, we primarily consider historical economic data provided by the Canadian and U.S. governments and their agencies. Tax laws in the countries in which we operate, primarily Canada and the United States, are material factors we consider when determining our sustainable effective tax rate.

F I N A N C I A L R E S U L T S - F O U R T H Q U A R T E R 2 0 0 6 2
Earnings of $696MM, up 4.8% and EPS of $1.35, up 5.5%.
Net Income by Operating Group:
P&C Canada unchanged Y/Y as volume growth offset by NIM decline, higher expenses
P&C U.S. decreased $11MM Y/Y driven by acquisition integration costs and branch technology expenses
PCG increased $12MM, excluding gains on asset sales in Q4 05 (decreased $22MM as reported) through higher mutual fund fees and interest revenue
IBG decreased $40MM Y/Y due primarily to lower trading revenues and securities gains
$16MM PCL consisting of a $51MM specific provisions and a $35MM reduction in the general allowance
Tier 1 Capital ratio remains strong at 10.22%
Q4 2006 FINANCIAL HIGHLIGHTS
64.2%
10.22%
$51MM
19.4%
5.5%
CashProductivity
Tier 1Capital
SpecificPCL
ROE
EPSGrowth

F I N A N C I A L R E S U L T S - F O U R T H Q U A R T E R 2 0 0 6 3
10.30
0.13
61.4
60.5
9.4
16.3
20.0
20.6
1.28
1.32
664
Q4 2005
10.22
0.09
62.8
62.4
0.3
1.5
19.2
19.5
5.15
5.23
2,663
F2006
10.30
0.11
63.6
62.6
2.6
5.0
18.8
19.4
4.63
4.78
2,396
F2005
10.07
0.09
61.5
61.1
2.0
6.7
20.3
20.6
1.38
1.40
710
Q3 2006
64.2Cash Productivity Ratio (%)
64.6Productivity Ratio (%)
19.4Return on Equity (%) *
19.6Cash Return on Equity (%) *
1.35EPS – Diluted ($/share)
1.37Cash EPS – Diluted ($/share)
10.22
0.03
(0.9)
(5.9)
696
Q4 2006
Capital: Tier 1 Capital (%)
PCL/Avg. Loans Accept. (%) *
Expense Growth – Y/Y (%)
Performance Measure
Revenue Growth – Y/Y (%)
Net Income ($MM)
Q4 2006 FINANCIAL SUMMARY
* Annualized

F I N A N C I A L R E S U L T S - F O U R T H Q U A R T E R 2 0 0 6 4
Q4 2006 GROUP NET INCOME
26
(1)
27
-
664
26
107
226
305
34
271
Q4 2005
187
24
140
23
2,633
187
360
860
1,256
115
1,141
F2006
24
(120)
118
26
2,396
24
320
853
1,199
125
1,074
F2005
-23General PCL
48
6
42
710
48
85
201
376
31
345
Q3 2006
72Other Corporate
Corporate Services Details
85PCG
186IBG
294Total P&C
23P&C U.S.
131
36
696
131
271
Q4 2006
Total Corporate Services
Specific PCL
Total Bank
Group ($MM)
Corporate Services
P&C Canada

F I N A N C I A L R E S U L T S - F O U R T H Q U A R T E R 2 0 0 6 5
1.371.32
Q4 05 GeneralAllowance
SpecificPCL
Taxes OperatingGrowth
Other Q4 06
1.371.40
Q3 06 GeneralAllowance
SpecificPCL
Taxes OperatingGrowth
Other Q4 06
CASH EPS GROWTH
Q4 06 vs. Q4 05 ($/Share)
Q/Q Earnings Growth Drivers:
Softening markets, lower trading in IBG and compressed margins in P&C and IBG partly offset by volume growth Taxes benefited from favourableresolution of certain tax matters and a large number of small initiatives Other includes Q4 05 Harrisdirectgain, TSX share sale, sale of Calgary office tower and customer loyalty card adjustment
Operating growth declined with less robust capital markets in IBG and higher P&C U.S. expenses Taxes benefited from favourableresolution of certain tax matters and a large number of small initiatives Other includes the MasterCard IPO gain in Q3 06
Y/Y Earnings Growth Drivers:
↑↑↑↑ 0.11
Q4 06 vs. Q3 06 ($/Share)
↑↑↑↑ 0.21
↑↑↑↑ 0.04 0.01
↑↑↑↑ 0.04
0.120.05
0.120.09↑↑↑↑ 0.01

F I N A N C I A L R E S U L T S - F O U R T H Q U A R T E R 2 0 0 6 6
59.965.2 66.9
56.7 57.5
69.766.9 69.3 68.965.6
20.019.619.219.219.4
6.28.08.07.38.2
Q4 Q1 Q2 Q3 Q4
10.2210.0710.30 10.41 10.20
16.34 16.36 16.27 16.25 16.13
Q4 Q1 Q2 Q3 Q4
0605
149.9 150.9
161.7 162.8156.4
CAPITAL & RISK WEIGHTED ASSETSTier 1 capital ratio increased Q/Q as capital generation outpaced RWA growth Total Bank
IBG
P&C Canada
PCG & Other
Risk Weighted Assets ($B)
P&C U.S.
11.82 11.89 11.76 11.59 11.76
Tier 1 (%) Total Capital (%)
Assets-to-Capital Multiple (times)0605

F I N A N C I A L R E S U L T S - F O U R T H Q U A R T E R 2 0 0 6 7
Business growth declined due to lower interest income driven by compressed lending spreads in IBG and P&C, a sharp reduction of commodity derivatives trading and lower securities commissions and insurance income. These were in part offset by a credit card securitization gain and higher M&A feesOther Items represent gain on MasterCard IPO in Q3 06
Q4 06 vs. Q3 06 ($MM)
Q4 06 vs. Q4 05 ($MM)
-156 (-5.9%)
-39 (-1.5%)
3 (0.1%)
-30 (-1.1%)
-96 (-3.6%)
-109 (-4.2%)
0 (0.0%)
0 (0.0%)
-71 (-2.7%)
0 (0.0%)
REVENUE GROWTHQ/Q
Y/Y
-38 (-1.5%)
6 (0.2%)
Business Growth
OtherItems
AcquisitionsHarrisdirectU.S. Exchange
TotalGrowth
Increased volumes in PCG partly offset as volume growth in P&C Canada and U.S. mitigated by narrower margins and weaker commodity derivatives trading revenue in IBGVilla Park acquisition in P&C U.S.Other Items represent Q4 05 TSX share sale, sale of Calgary office tower and customer loyalty card adjustment

F I N A N C I A L R E S U L T S - F O U R T H Q U A R T E R 2 0 0 6 8
46 48 44
336 340 345 338 329
155160161162 155
47 53
257260252258270
Q4 Q1 Q2 Q3 Q4
Total Bank
IBG
P&C Canada
P&C Canada down due to competitive mortgage pricing in an aggressive market and total loans growing faster than deposits IBG margin down due to lower spreads on corporate loans in competitive rate environment in the U.S. and in interest-rate sensitive businesses, partially offset by higher trading interest revenueP&C U.S. down due to competitive pressures on loan pricing and total loans growing faster than deposits mitigated by pricing actions in certain deposit categories
P&C Canada down due to lower mortgage refinancing feesIBG margin down due to compressed spreads in interest-rate sensitive businesses, the run-off of non-core assets and reduced spreads on corporate banking assets P&C U.S. down due to loan spread compression combined with changing product mix
NET INTEREST MARGINS (bps)Q/Q
Y/Y
0605
P&C U.S.

F I N A N C I A L R E S U L T S - F O U R T H Q U A R T E R 2 0 0 6 9
QUARTERLY NON-INTEREST REVENUE
1,2461,3361,349Total
441457505Other NIR
Favourable claims experience in Q3 06495838Insurance
Gain on MC IPO in Q3 06 of $38MM465179Investment Securities Gains
1049299Underwriting and Advisory
55
130
105
69
247
Q4 06
$27MM gain on $1.5B credit card sec’n, booked primarily in Corporate
Loyalty program adjustment $40MM in Q4 05
Lower volatility in commodities
Lower trading commissions
10660Card Fees
163169Trading Revenues
2134Securitization Revenue
128109Mutual Fund Revenue
260256Securities Commissions
Q3 06Q4 05*BALANCES ($MM)
* Excludes the impact of Harrisdirect of $77MM

F I N A N C I A L R E S U L T S - F O U R T H Q U A R T E R 2 0 0 6 10
ANNUAL NON-INTEREST REVENUE
5,2414,868Total
Deposit payments, lending fees1,8061,916Other NIR
Growth in portfolio204162Insurance
145165Investment Securities Gains
Increased M&A, offset by lower equity underwriting407349Underwriting and Advisory
Positive net sales and appreciating asset values
$40MM customer loyalty card adjustment in F05
Higher commodities driven by volatility, F/X trading
Higher direct investing volumes, commission fees in trading products
396334Card Fees
633413Trading Revenues
100113Securitization Revenue
499404Mutual Fund Revenue
1,0511,012Securities Commissions
F06F05*BALANCES($MM)
* Excludes the impact of Harrisdirect of $184MM
2005 2006
NIR ($MM)
HD 184
4,868
5,2415,052

F I N A N C I A L R E S U L T S - F O U R T H Q U A R T E R 2 0 0 6 11
Business growth primarily consists of higher technology costs and expenses associated with higher branch volumes, marketing and branch maintenance costs in P&C U.S.
Y/Y
Q/Q Q4 06 vs. Q3 06 ($MM)
Q4 06 vs. Q4 05 ($MM)
EXPENSE GROWTH
13 (0.7%)
0 (0.0%) 1 (0.0%)
-13 (-0.9%)
8 (0.5%)
-20 (-1.3%)
-60 (-3.9%)
12 (0.7%)
0 (0.0%)
Acquisition Business Growth
Performance-Based
Compensation
HarrisdirectU.S. Exchange
TotalGrowth
56 (3.6%)
3 (0.2%)
0 (0.0%)
Business growth consists of retail and commercial sales force expansion and increased initiative and marketing in P&C Canada; acquisition integration costs, new branches and a new branch technology platform in P&C U.S.
Villa Park acquisition in P&C U.S.

F I N A N C I A L R E S U L T S - F O U R T H Q U A R T E R 2 0 0 6 12
ANNUAL EXPENSES
6,3536,089Total
1,0911,040Other
Advertising associated with Regeneration, BMO Capital Markets rebranding, P&C U.S. campaign
Relatively unchanged, despite investments made in P&C U.S. business
Additional costs for new data centre in Barrie
Increase driven by higher capital market related revenue in IBG & PCG
Over 1,000 additional FTEs, primarily in sales and frontline in P&C Canada partially offset by effective cost management
476436Premises & Equipment/Rental
1,3221,263Performance based compensation
253216Travel & Business Development
709696Computer costs
2,5022,438Salaries and Benefits
F06F05*BALANCES ($MM)
* Excludes the impact of Harrisdirect
2005 2006
NIX ($MM)
6,3536,332
HD 243
6,089

F I N A N C I A L R E S U L T S - F O U R T H Q U A R T E R 2 0 0 6 13
06
64.663.6
62.861.5
62.362.961.4
62.462.664.2
61.160.562.4 61.9
Q4 Q1 Q2 Q3 Q4 F05 F06
CASH PRODUCTIVITY RATIO
Cash (%) Accrual (%)
Revenue/expense growth differential of (5.0) percentage points in Q4 06 and 1.2 percentage points on an annual basis
Cash productivity ratio deteriorated 312 bps Q/Q and 369 bps Y/Y
25 bps annual improvement
05

F I N A N C I A L R E S U L T S - F O U R T H Q U A R T E R 2 0 0 6 14
FISCAL 2006 TARGETS
Target Met
100-150 bpsimprovement
25 bps improvementCash Productivity Ratio
5%-10%11.6%EPS Growth1
(base of $4.582)
$400MM or lessRevised to:
$250MM or less$211MMSpecific Provision for
Credit Losses
Minimum 8%
17%-19%
F2006 Target
10.22%
19.2%
F2006 ActualPerformance Measure
Tier 1 Capital Ratio
Return On Equity
1 Excluding changes in the general allowance2 Restated from $4.59 due to the retroactive application of a change in accounting policy for stock-based compensation

F I N A N C I A L R E S U L T S - F O U R T H Q U A R T E R 2 0 0 6 15
FISCAL 2007 TARGETS
100-150 bpsimprovement
25 bps improvement
Cash Productivity Ratio
5% to 10%11.6%EPS Growth1
(base of $5.11)
$400MM or less$211MMSpecific Provision for Credit Losses
NA2
18%-20%
F2007 Target
10.22%
19.2%
F2006 ActualPerformance Measure
Tier 1 Capital Ratio
Return On Equity
1 Excluding changes in the general allowance2 BMO’s policy is to maintain a Tier 1 Capital Ratio of at least 8%, but no longer states the ratio as an annual performance target

F I N A N C I A L R E S U L T S - F O U R T H Q U A R T E R 2 0 0 6 16
Appendix

F I N A N C I A L R E S U L T S - F O U R T H Q U A R T E R 2 0 0 6 17
271 266 259
345
271
58.354.9
57.156.258.7
Q4 Q1 Q2 Q3 Q4
1,2281,158
1,0971,108 1,096
P&C CANADA
Cash Productivity Ratio (%)
Revenue / Net Income ($MM)
Net Income Revenue
05 06
Q/Q net income declined as Q3 06 results included the $38MM ($25MM after-tax) MasterCard IPO gain and a $26MM income tax recovery. The balance of the decline was attributable to lower revenue as expense levels were comparable in both periods as we continue to invest in our businesses
Q/Q revenue decline driven by lower securitization revenue, lower insurance revenue as a result of unfavourable claims experience and reduced net interest margins as a result of decreased mortgage refinancing fees
Y/Y net income unchanged as strong volume growth was offset by lower net interest margins, increases in expenses and higher provision for credit losses
Y/Y net interest margins decreased due to competitive pressures on loan pricing, in particular aggressive mortgage pricing in the early part of the year, and loan growth outpacing deposit growth, partially offset by pricing actions in certain deposit categories
Y/Y expense growth due to an expanded workforce and increased project initiatives and marketing expenditures

F I N A N C I A L R E S U L T S - F O U R T H Q U A R T E R 2 0 0 6 18
24.224.825.025.325.2
12.6712.60 12.52 12.32 12.12
13.11 13.40 13.55 13.61 13.51
Q4 Q1 Q2 Q3 Q4
Personal Deposits ($B) - P&C Canada balances onlyPersonal Deposits Share (%) - Bank of Canada (2)BMO Cdn Mutual Fund Share (%) - IFIC (2)
18.618.3 19.519.0 19.9
63.863.362.160.558.4
10.40 10.42 10.41 10.44 10.40
14.5814.7414.6214.46 14.32
12.8513.0413.1513.1213.04
Pers'l Loans ($B) (Incl. Securitizations)Res Mtges ($B) (Incl. Securitizations)Pers'l Loans Share (Ex Cards; Incl. Securitizations) (%) - Bank of CanadaRes. Mtges Share (Incl. 3rd Party; Incl. Securitizations) (%) - CBATotal Pers'l Share (Incl. Securitizations) (%) (1)
P&C CANADA — Personal Banking
Notes
Personal share statistics are issued on a one-month lag basis. (Q4 06: September 2006)
Market share trends versus all FIs are consistent with the bank’s
(1) Total Personal Share includes Personal Deposits, Mutual Funds, Personal Loans (excluding Credit Cards) and Residential Mortgages (including 3rd Party)
(2) Term and Mutual Fund AUA/AUM reported in PCG Canada
Mortgage and personal loan volumes continued to grow. However, Q/Q personal market share declined due to a decrease in residential mortgages and PRS deposits.
Y/Y personal market share was 19 bps lower due to declines in deposits and residential mortgages partially offset by growth in mutual funds
Decline in personal deposits expected due to PRS pricing strategy modified in Q1 06 to improve spread
05 06

F I N A N C I A L R E S U L T S - F O U R T H Q U A R T E R 2 0 0 6 19
P&C CANADA – Commercial Banking
27.7 28.0 28.8 29.5 29.5
18.1 18.5 18.2 19.2 19.5
18.57 18.52 18.66 18.64 18.54
Q4 Q1 Q2 Q3 Q4
Commercial Loans & Acceptances ($B)Commercial Deposits ($B)Business Banking Loans ($0-5MM) Market Share (%)
Notes
Business loans (Banks) are issued by CBA on a one calendar quarter lag basis. (Q4 06: June 2006)
Market share restated to reflect the latest CBA data
05 06
BMO continued to rank second in business banking market share for business loans $5MM and below
Y/Y market share declined 3 bps to 18.54%. Q/Q market share declined 10 bps. The strongest performance was in the upper half of the market share category
In the $1 to $5 million segment we experienced growth of 7.1% and market share growth for the year of 36 bps while we declined 8 bps from the previous quarter
Simplified product offerings and expansion in the front-line sales force will provide more opportunities to serve our small business customers. During the quarter we announced the formation of three new operating units focused solely on commercial business in the key Toronto, Montreal and Vancouver markets
Growth in commercial or larger end of market very strong with balance growth of 17.6% in loans over $5MM and continue to view this as an area of competitive strength

F I N A N C I A L R E S U L T S - F O U R T H Q U A R T E R 2 0 0 6 20
69.3 67.873.4 70.7
76.1
Q4 Q1 Q2 Q3 Q4
212824
2928
189194
200205
200
Net Income Revenue
P&C U.S.
Cash Productivity Ratio (%)
Revenue / Net Income ($MM US)
05 06
Revenue trend reflects strong loan growth, acquisitions, new branches and improved deposit spread partly offset by lower loan spreads and in Q4’06, changing deposit mix
Loan volume continues to show strong Y/Y growth despite a highly competitive market; lower loan spreads reflect heightened competition
Q/Q net income decline reflects reduced revenue and increased expenses associated with higher technology costs, costs associated with higher business volumes, marketing and property maintenance costs
One time acquisition related costs increased US$3MM Y/Y and US$13MM YTD

F I N A N C I A L R E S U L T S - F O U R T H Q U A R T E R 2 0 0 6 21
Consumer loans continue to show strong growth, moderated by heightened competition and the economic environment
P&C U.S. – Consumer
Indirect Auto
Other Consumer
Loans *
Deposits *
Mortgages *
* Acquisitions include New Lenox, Mercantile and Villa Park
Y/Y Growth (%)
Volume ($B US)
4.0 4.0 4.2 4.3 4.4
0.2 0.2 0.2 0.2 0.2
13.5 14.2 13.5 11.0 9.6
Q4 Q1 Q2 Q3 Q4
Core Mortgages Acquisitions
7.1 7.2 7.4 7.5 7.6
3.3 3.2 3.3 3.2 3.0
1.31.41.21.21.3
4.3 4.5 1.2 1.3 2.2
Non-Core Deposits Core DepositsAcquisitions
3.1 3.3 3.4 3.6 3.6
0.2 0.2 0.2 0.2 0.1
16.9 14.6 14.3 14.3 13.9
Q4 Q1 Q2 Q3 Q4
Other Consumer Loans Acquisitions05 06
3.8 3.9 4.1 4.2 4.3
23.6 25.2 26.4 22.113.5
Indirect Auto
05 06

F I N A N C I A L R E S U L T S - F O U R T H Q U A R T E R 2 0 0 6 22
1.5 1.6 1.5 1.6 1.8
2.0 2.0 2.0 1.9 2.0
0.40.40.40.40.4
10.7 12.46.7 3.9 6.4
Q4 Q1 Q2 Q3 Q4
Non-Core Deposits Core DepositsAcquisitions
3.8 4.0 4.2 4.3 4.3
0.8 0.8 0.7 0.8 0.8
21.7 21.811.7 12.5 11.1
Q4 Q1 Q2 Q3 Q4
Core Loans Acquisitions
P&C U.S. – CommercialQ4 ’06 Commercial loan growth reflects heightened competition
Year-Over-Year Growth (%)
Volumes ($B US)
Deposits * Loans *
* Acquisitions include New Lenox, Mercantile, and Villa Park
0605 0605

F I N A N C I A L R E S U L T S - F O U R T H Q U A R T E R 2 0 0 6 23
05 06
71.371.368.869.1
65.8
Q4 Q1 Q2 Q3 Q4
10794 96
85 85
465477487464572
Net Income Revenue
Record net income in F2006 of $360MM up 27% excluding the prior year gains on sale of Harrisdirect ($49MM or $18MM after tax) and TSX shares ($25MM or $16MM after tax) or up 13% on a reported basis
Net income in Q4/06 up 18% Y/Y excluding the prior year gains or down 21% on a reported basis
Revenue decreased 3% Q/Q due primarily to lower direct investing commission revenue
Revenue increased 4% Y/Y (excluding Harrisdirect, asset sales and F/X) due to higher managed assets and net interest income
Cash productivity unchanged Q/Q but improved Y/Y by 127 bps and 214 bps annually excluding Harrisdirect and asset sales, on revenue growthand cost control
Revenue / Net Income ($MM)
Cash Productivity Ratio (%)
PRIVATE CLIENT GROUP

F I N A N C I A L R E S U L T S - F O U R T H Q U A R T E R 2 0 0 6 24
05 06
134 143 147 150 155
87 94 90 94 96
3735 34 36 36256
Assets under management and administration, including term deposits, grew 16% Y/Y (adjusted for F/X):
Assets under management grew 17%
Assets under administration grew 18%
Term deposits grew 8%
Y/Y U.S. net income relatively unchanged excluding Harrisdirect’s operating results and gain on sale
Q4 05 included the US$15MM after-tax gain on sale of Harrisdirect
104 1
-2
0
Q4 Q1 Q2 Q3 Q4
AUA / AUM ($B)
U.S. Net Income ($MM US)
AUM
Term
AUA
271
PRIVATE CLIENT GROUP
273 280 288

F I N A N C I A L R E S U L T S - F O U R T H Q U A R T E R 2 0 0 6 25
05 06
INVESTMENT BANKING GROUPRevenue decreased Q/Q due to lower trading revenues, commissions and cash collections on previously impaired loans offset partially by higher investment securities gains and M&A fees
Revenue decreased Y/Y due to lower trading revenues, equity underwriting and reduced spreads. This was offset partially by improved corporate banking assets levels, higher lending fees and investment securities gains (excluding the impact of the gain on the sale of the TSX shares in Q4 05)
Net Income decreased Q/Q and Y/Y due to lower revenues and higher expenses, offset partially by a lower effective tax rate
Productivity declined Q/Q and Y/Y driven by lower revenues on weaker capital markets activity and higher expenses. Q4 05 included a reduction to performance-based compensation costs to align with full year results
52.7 55.3 56.2 57.162.2
Q4 Q1 Q2 Q3 Q4
186201245228226
706 743 726 678 633
Net Income Revenue
Revenue / Net Income ($MM)
Cash Productivity Ratio (%)

F I N A N C I A L R E S U L T S - F O U R T H Q U A R T E R 2 0 0 6 26
05 06
17.316.0
21.922.019.7
INVESTMENT BANKING GROUP
52
79 7961 60
Q4 Q1 Q2 Q3 Q4
Cash ROE declined Q/Q and Y/Y due primarily to weaker capital markets. The impact of a stronger Canadian dollar negatively impacted results Y/Y
Q/Q U.S. results essentially unchanged as lower commodity derivatives trading revenues and commissions were offset by improved investment securities gains, M&A and lower expenses
Y/Y improvement in U.S. results due to higher investment securities gains, M&A, lending fees and lower expenses. Improved corporate banking assets levels were partially offset by lower spreads. Lower commodity derivatives trading revenues and equity underwriting partially offset the Y/Y improvement in net income
U.S. Net Income ($MM US)
Cash ROE (%)
F I N A N C I A L R E S U L T S - F O U R T H Q U A R T E R 2 0 0 6 27
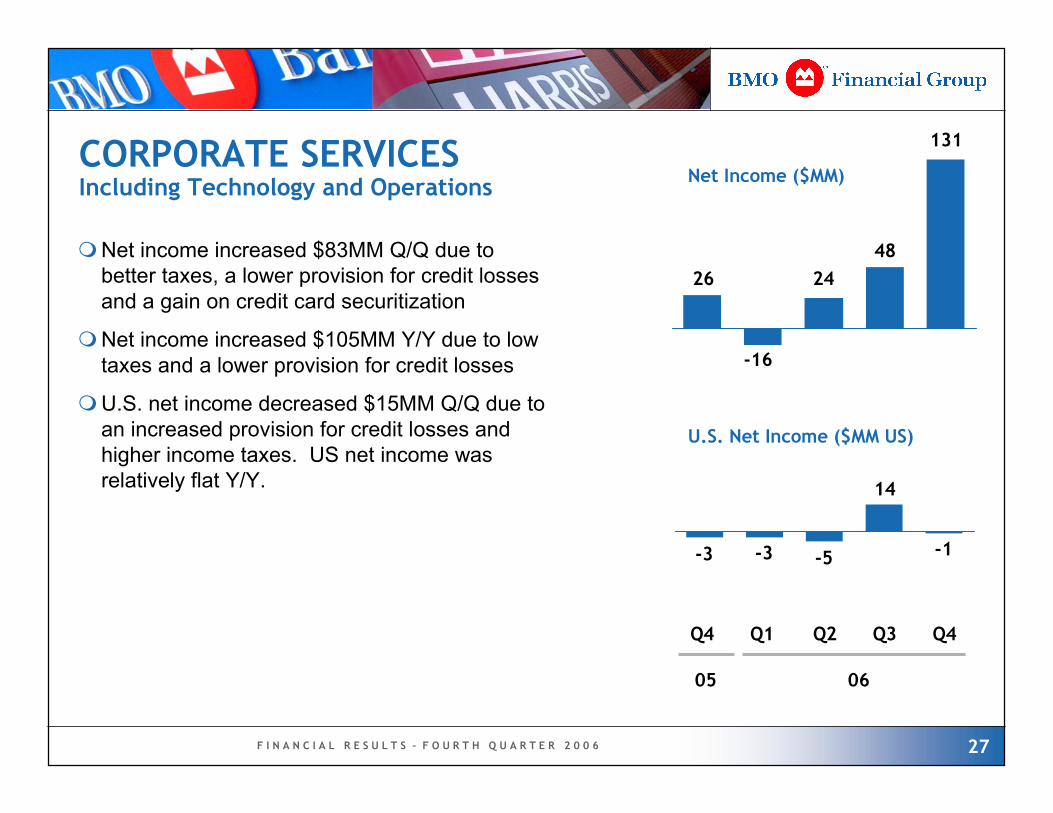
CORPORATE SERVICESIncluding Technology and Operations
131
482426
-3 -3 -5
14
-1
Q4 Q1 Q2 Q3 Q4
U.S. Net Income ($MM US)
Net Income ($MM)
Net income increased $83MM Q/Q due to better taxes, a lower provision for credit losses and a gain on credit card securitization
Net income increased $105MM Y/Y due to low taxes and a lower provision for credit losses
U.S. net income decreased $15MM Q/Q due to an increased provision for credit losses and higher income taxes. US net income was relatively flat Y/Y.
05 06
-16

F I N A N C I A L R E S U L T S - F O U R T H Q U A R T E R 2 0 0 6 28
ANNUAL REVENUE GROWTH ($MM)
154 (1.5%)
-253 (-2.7%)-170 (-1.7%)
605 (6.2%)
17 (0.2%)
-45 (-0.5%)
Business Growth
OtherItems
AcquisitionsHarrisdirectU.S. Exchange
TotalGrowth
Up 5.9% after excluding Harrisdirectand the weaker U.S. dollarBusiness growth consists of higher trading revenues in IBG; P&C Canada from volume growth, higher insurance and cards revenue partially offset by lower margins and securitization revenue; PCG due to higher mutual funds revenue and higher client trade volumes in direct investing Mercantile and Villa Park acquisitions in P&C U.S. Other represents the 2005 VIE gains, TSX gains and Calgary building sale partially offset by the 2006 MasterCard IPO gain and the 2005 customer loyalty card adjustment

F I N A N C I A L R E S U L T S - F O U R T H Q U A R T E R 2 0 0 6 29
ANNUAL EXPENSE GROWTH ($MM)
21 (0.3%)
-112 (-1.8%)
29 (0.5%)
314 (5.1%)
-25 (-0.4%)
-243 (-4.0%)
58 (0.9%)
Business Growth
Performance-Based
Compensation
Other Items
AcquisitionsHarrisdirectU.S. Exchange
TotalGrowth
Business growth consists of P&C Canada’s increased frontline workforce; IBG variable compensation, computer and professional fees; PCG’s higher revenue-based costs and professional fees; P&C U.S. for integration costs and new branchesVariable compensation increase in IBG and PCG, partly offset by lower costs in P&C Canada & U.S.Mercantile and Villa Park acquisitions in P&C U.S.Harrisdirect includes operating resultsOther includes a litigation provision recorded in Q2 05

F I N A N C I A L R E S U L T S - F O U R T H Q U A R T E R 2 0 0 6 30
17.5 13.716.6 18.522.8
23.326.7 25.6
22.325.4
Q4 Q1 Q2 Q3 Q4
U.S. RESULTS
Net Income (%) Revenue (%)
Net income from U.S.-based business of US$80MM or 13.7% of North American net income
Q/Q P&C U.S. net income decreased despite higher lending volumes, due to lower margins, a change in mix along with higher expenses related to higher business volumes and marketing costs
Q/Q IBG net income was flat as reductions in trading and commission revenues offset higher net investment securities gains, M&A fees and lower expenses
10114
61
(2)28
Q3 06
87(3)
52
1028
Q4 05
387(8)
284
8103
F05
3895
279
3102
F06
80TOTAL
Q4 06
Net Income ($MM US)
(1)
60
-21
Corporate
IBG
PCGP&C
U.S. to N.A. Revenue and Net Income ($MM CDE)
0605

F I N A N C I A L R E S U L T S - F O U R T H Q U A R T E R 2 0 0 6 31
06
70.7
76.1
69.972.0
63.2
59.2
65.4
60.562.2
73.4
67.869.3
60.2
64.2
Q4 Q1 Q2 Q3 Q4 F05 F060605
28 29 24 28
2134
21
2927
26
Q4 Q1 Q2 Q3 Q405
5049
Net Income($MM US)
P&C U.S. Reported
U.S. Mid-Market
Operations represent 32% of U.S. revenue and 21% of U.S. expenses in Q4 06
Cash Productivity Ratio(%)
Total P&C U.S. Reported
Total P&C U.S. Including U.S. Mid-Market
U.S. RETAIL AND MID-MARKET
5662
103 102
108
211
F05 F06
116
218
50

F I N A N C I A L R E S U L T S - F O U R T H Q U A R T E R 2 0 0 6 32
U.S./CANADIAN EXCHANGE
AnnualQuarterly
(9)
1
-
20
(30)
Y/Y
1
1
-
-
-
Q/Q
(51)
3
4
112
(170)
Y/Y
Reduced (Increased) Provision for Credit Losses
Hedging Gains (Losses)
Reduced (Increased) Expense
Total Pre - Tax Impact - Gain (Loss)
Increased (Reduced) Revenue
$MM
$1MM pre-tax earnings increase Q/Q and $9MM decline Y/Y
Annually pre-tax earnings decreased $51MM
Excluding hedging, a one cent change in the CDN/U.S. exchange rate changes quarterly earnings by approximately $1.5MM pre-tax

F I N A N C I A L R E S U L T S - F O U R T H Q U A R T E R 2 0 0 6 33
Viki LazarisSenior Vice President(416) [email protected]
INVESTOR RELATIONS CONTACT INFORMATIONSteven BoninDirector(416) [email protected]
Krista WhiteSenior Manager(416) [email protected]
www.bmo.com/investorrelationsE-mail: [email protected]
FAX: (416) 867-3367