Klingler, Jason final.pdf
49
Fecal Analysis of the Goose Creek Watershed in Mecklenburg County North Carolina By Jason Klingler Project submitted to the Graduate Faculty of North Carolina State University in partial fulfillment of the requirements for the Degree of Master of Environmental Assessment Raleigh, North Carolina 2013 Approved by advisory committee: Advisory Chair: Dr. Linda Taylor
Transcript of Klingler, Jason final.pdf

Fecal Analysis of the Goose Creek Watershed in Mecklenburg County North Carolina
By
Jason Klingler
Project submitted to the Graduate Faculty of North Carolina State University in partial
fulfillment of the requirements for the Degree of Master of Environmental Assessment
Raleigh, North Carolina
2013
Approved by advisory committee:
Advisory Chair:
Dr. Linda Taylor

2
Abstract
Klingler, Jason. Master of Environmental Assessment. Fecal Analysis of the Goose Creek
Watershed in Mecklenburg County North Carolina.
The Goose Creek Watershed is located in Southeastern Mecklenburg County and is found
almost entirely within the town limits or extraterritorial jurisdiction of Mint Hill. This specific
watershed has been designated a habitat for the federally listed, critically endangered Carolina
Heelsplitter Mussel. This designation has brought about the implementation of a Site Specific
Management Plan and the municipalities in the watershed were also required to develop a Water
Quality Recovery Program for Fecal Coliform, which was the result of a Fecal Coliform
TMDL(Total Maximum Daily Load).
During the implementation of the local Water Quality Recovery Plan for Goose Creek,
the level of Fecal Coliform Bacteria tapered off, resulting in Goose Creek being removed from a
TMDL. The resulting drop in Fecal Bacteria also correlated directly with The Great Recession
and stoppage of literally every construction project in the watershed. As the economy has
improved, it has driven an increase in development once again. Sediment levels have started to
increase in the watershed, and new septic systems are being installed on a dynamic subsurface
that straddles two distinctly different underlying substrates. The possible combination of these
factors has once again led to an increase in Fecal levels in the watershed. My investigation is
focused on the sediments creating a Fecal Bacteria reservoir within the stream, allowing the
bacteria to propagate within the waters, instead of actually being added by a non point source.
The geological composition of the underlying soils may also be allowing for a short circuit of the
septic system, allowing Fecal latent water to flow through rock fissures directly adding to water
recharge of the stream.

3
Biography
Jason Klingler is a graduate of Ohio University located in Athens, Ohio. He completed
his Bachelor of Science in Geography-Environmental Pre-law in the Spring of 2000. During his
college tenure in 1998 and 1999 he interned with the Ohio Environmental Protection Agency's
Southwest District Office in Dayton , Ohio. His major areas of responsibility included the
implementation of the General NPDES permit for construction activities in a 7 county area in
Southwest Ohio. His professional career began with the Pelham, NY based Sanborn Map
Company, the oldest mapping company in the Unites States. His specializations were in
environmental mapping and municipal map applications. Jason began his career with
Mecklenburg County in July of 2006. His major areas of focus now are implementation of the
Town of Mint Hill's municipal NPDES permit. This includes all facets of the NPDES permit,
including sediment and erosion control. Having walked the entire Mecklenburg County portion
of the Goose Creek watershed every year, he is knowledgeable in all areas of the watershed.

4
Acknowledgements
I personally would like to thank Mecklenburg County's Land Use and Environmental Services
division for support and information used in pursuing the Masters of Environmental Assessment.
Valuable watershed planning insight was provided by Mr. David Kroening. Statistical assistance
was provided Mr. Jeff Price. The Masters of Environmental Assessment staff, led by Dr. Linda
Taylor was invaluable in providing guidance through the pursuit of my Masters Degree. This
process could not have been completed without support from my family and wonderful wife-
thank you for your continuous support through this process.

5
TABLE OF CONTENTS
LIST OF FIGURES..................................................................................................6
LIST OF APPENDICIES.........................................................................................7
LIST OF TABLES....................................................................................................8
INTRODUCTION.....................................................................................................9
History...........................................................................................................9
Background.................................................................................................10
Stream Characteristics...............................................................................13
METHODS OF STUDY.........................................................................................14
Study Area...................................................................................................14
Study Design-Step One...............................................................................15
Study Design-Step Two...............................................................................20
Study Area-Step Three................................................................................21
Study Area-Step Four..................................................................................22
Data Collection.............................................................................................24
RESULTS..................................................................................................................24
Stream Assessment Findings.......................................................................24
Fecal Bacteria Results..................................................................................28
Catchment A.................................................................................................29
Catchment B.................................................................................................30
Catchment C.................................................................................................31
Catchment D.................................................................................................33
Catchment E.................................................................................................34
Non-Storm Impacted Results......................................................................35
Results Comparison.....................................................................................36
SUMMARY AND CONCLUSION........................................................................ 38
REFERENCES.........................................................................................................47

6
LIST OF FIGURES
Figure 1: Large Slate rock formations within streambed
Figure 2: Northern Section of Goose Creek
Figure 3: Streambed of hard rock
Figure 4: Stream Channel substrate change, Erosion and Narrowing.
Figure 5: Nalgene Easy Flow Sample Bottle and Hand Vacuum Pump
Figure 6: Agricultural Livestock Areas
Figure 7: Joli Cheval Horse Complex
Figure 8: Joli Cheval Outlet
Figure 9: Joli Cheval Outlet
Figure 10: Catchment A Results
Figure 11: MY9 Results
Figure 12: Catchment B Results
Figure 13: Catchment C Results
Figure 14: Catchment D Results
Figure 15: Catchment E Results
Figure 16: Non Impacted Sampling Averages
Figure 17: Overall Fecal Sampling Comparison
Figure 18: Statistical Significance Analysis

7
LIST OF APPENDICES
Appendix 1-Goose Creek and the Carolina Heelsplitter Current Range
Appendix 2-Baseline Fecal Sampling Locations
Appendix 3-MY9 Confluence Sampling Point
Appendix 4-Intensive Filtration Sampling Catchment
Appendix 5-Chain of Custody
Appendix 6-Streambed Transition Area Map

8
LIST OF TABLES
Table 1- Base flow Fecal Coliform sample results-2006
Table 2- Base flow Fecal Coliform sample results-2010
Table 3- General Goose Creek Background

9
INTRODUCTION
HISTORY
The preservation of Mecklenburg County's waterways has been an effort that started over
30 years ago. What has morphed from a simple plan to make the streams in the county smell
better is now a plan to ensure that over 80 percent of the streams in the county are safe for human
contact. As the program has progressed so have governmental requirements that must be met in
order to achieve not only the program goal, but to be in compliance with both state and federal
regulations. Requirements have morphed from simply monitoring the watershed, to
implementation of undisturbed buffers and threshold limits in the amount of Fecal Bacteria
found in the watershed. In Mecklenburg County the two greatest pollutants of concern in the
streams are Fecal Coliform Bacteria and sediment. This study addresses these pollutants in the
Goose Creek Watershed.
Fecal Bacteria are used to determine the possible presence of organisms that are
pathogenic to humans. Fecal Bacteria originate in the gut of animals, and thus are found in the
released feces, which also contain bacteria, viruses and protozoa that can cause a vast array of
intestinal illness(Alm et Al, 2003). Currently, only surface water counts of these bacteria are
measured by water quality agencies, as a measurement of Fecal Bacteria in the water column.
However, studies have shown that, "The association of Fecal Bacteria with re-suspendable
bottom sediments is not considered. Bacteria adherence and deposition to stream bottoms have
revealed that sediment counts at base flow conditions are hundreds to thousands times greater
than levels in the overlying water(Jolley et Al, 2008)". Therefore, Fecal Bacteria in stream bed
sediments may play a major role in contributing Fecal Bacteria to stream Fecal assessments.

10
BACKGROUND
The Goose Creek watershed was chosen primarily for one reason. The watershed has the
distinction of being home to one of the last few populations of the critically endangered Carolina
Heelsplitter (Lasmigona decorata). Appendix 1 shows the current and historical range of the
Carolina Heelsplitter. The Carolina Heelsplitter was placed on the list of Federally Endangered
Species by the United States Fish and Wildlife Service on June 30th, 1993(U.S.F.W.S. 1993).
With its placement on the list of endangered species, a federal recovery plan was created to help
the Carolina Heelsplitter survive and repopulate. Coupled with the federal program, the creation
of a TMDL was submitted and approved by the U.S. EPA, in July of 2005. Soon thereafter, the
North Carolina Department of Environment and Natural Resources required local municipalities
to create a Watershed Recovery Program(NCDENR 2006).
The MCWQP(Mecklenburg County Water Quality Program) took the lead on
implementing the Water Quality Recovery Program(WQRP) and the Goose Creek Site Specific
Watershed Management Plan(GCSSWMP). Both of these plans were different in their
requirements, but they ultimately had the same goals of pollutant reduction within the watershed.
The WQRP's aim was to improve pollutant removal through the implementation of the Goose
Creek watershed TMDL, and specific water quality pollutant targets. The State's GCSSWMP
requirements were to implement laws passed as preventative measures to keep the watershed
from being exposed to the pollutants through buffer implantations and development guidelines.
The different approach of these two plans is invaluable in restoring clean water to the watershed.
The WQRP was an intensive, boots on the ground approach to pollutant reduction and
water quality improvement in the watershed. The main goal is the sourcing and identification of
Fecal Bacteria and its elimination. The level of reduction specified in the WQRP is a goal not to
exceed a geometric mean of 200colonies/100 mL(membrane filter count method) based on five
consecutive samples examined during any 30 day period or 400 colonies/100 mL not to exceed
11
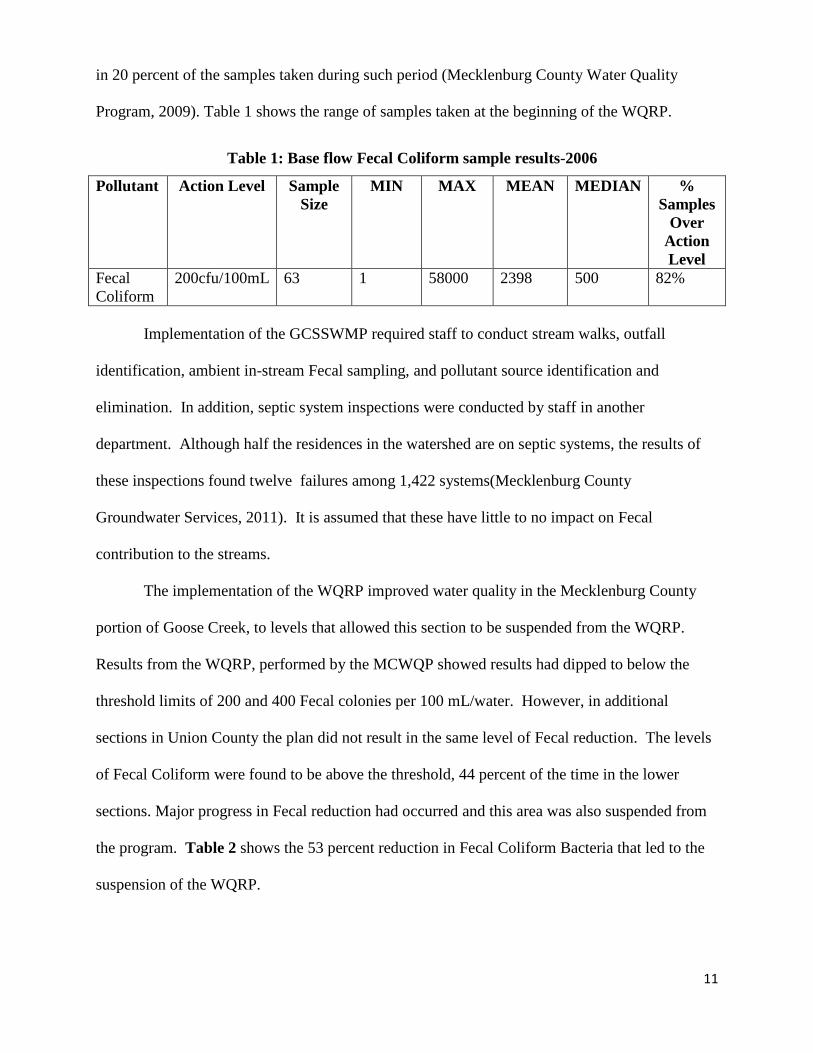
in 20 percent of the samples taken during such period (Mecklenburg County Water Quality
Program, 2009). Table 1 shows the range of samples taken at the beginning of the WQRP.
Pollutant Action Level Sample
Size
MIN MAX MEAN MEDIAN %
Samples
Over
Action
Level
Fecal
Coliform
200cfu/100mL 63 1 58000 2398 500 82%
Implementation of the GCSSWMP required staff to conduct stream walks, outfall
identification, ambient in-stream Fecal sampling, and pollutant source identification and
elimination. In addition, septic system inspections were conducted by staff in another
department. Although half the residences in the watershed are on septic systems, the results of
these inspections found twelve failures among 1,422 systems(Mecklenburg County
Groundwater Services, 2011). It is assumed that these have little to no impact on Fecal
contribution to the streams.
The implementation of the WQRP improved water quality in the Mecklenburg County
portion of Goose Creek, to levels that allowed this section to be suspended from the WQRP.
Results from the WQRP, performed by the MCWQP showed results had dipped to below the
threshold limits of 200 and 400 Fecal colonies per 100 mL/water. However, in additional
sections in Union County the plan did not result in the same level of Fecal reduction. The levels
of Fecal Coliform were found to be above the threshold, 44 percent of the time in the lower
sections. Major progress in Fecal reduction had occurred and this area was also suspended from
the program. Table 2 shows the 53 percent reduction in Fecal Coliform Bacteria that led to the
suspension of the WQRP.
Table 1: Base flow Fecal Coliform sample results-2006

12
Pollutant Action Level Sample
Size
MIN MAX MEAN MEDIAN %
Samples
Over
Action
Level
Fecal
Coliform
200cfu/100mL 36 120 900 526 485 44%
In late 2011 the Fecal numbers for this suspended section of Goose Creek had started to
rise again. The mean samples collected had started to creep steadily up, consistently being over
the thresholds that were established. Installation of post construction BMP's, enhanced erosion
control measures and strict buffer guidelines were passed for implemented on all future
development in 2009, but no new projects had occurred. These buffer rules created 200 foot
undisturbed buffers on all FEMA regulated streams, and 100 foot buffers on all other perennial
and intermittent streams. However, the results of the Fecal sampling from 2010-2011 have
shown a sharp upward trend in Fecal loads in the stream. Furthermore, the correlation that one
would expect of increased bacteria with increased flow is not apparent in the Mecklenburg reach
of Goose Creek. Many of the higher concentrations sampled occurred when base flow
conditions were not storm water impacted. The extensive nature of the WQRP was successful
in removing land based pollutant sources. However, data indicates that the Fecal levels in the
Goose Creek watershed tended to remain constant, and the land based sources do not contribute
as much Fecal Bacteria to the streams as originally hypothesized. In-stream concentrations of
Fecal Coliform tend to be lowest during periods of higher base flow. The increase may be due to
existing sources of Fecal Bacteria being diluted by higher base flow(MCWQP, 2009).
Table 2: Base flow Fecal Coliform sample results-2010

13
STREAM CHARACTERISTICS
With land based sources of Fecal Coliform Bacteria revealed, additional study on the in-
stream properties of Goose Creek are necessary. The levels of the Fecal Bacteria are highest at
base flow levels, therefore analysis of the question, "Are in-stream sediments allowing the Fecal
Bacteria to propagate, thereby causing the in-stream sediments to be the Fecal Bacteria non-point
source?". Fecal Bacteria associated with bottom sediments can be re-suspended and transported
with the sediments when the sediments are disturbed by rain events or a variety of other water
related activities(Jolley et Al.). Simple water flow can agitate the bottom sediments and cause a
spike in the Fecal Bacteria attached to the sediments. Aside from attaching to the sediment,
sediments provide a hospitable incubation zone for the attached Fecal Bacteria. Fecal Bacteria
have been demonstrated to live longer than other bacteria in overlying water(Howell, 1996).
Even when the bacteria are not in the water column, Davies et al. showed that sediments provide
a more nutrient rich environment to support growth of bacteria.
Recently, the construction in the Goose Creek Watershed has increased and associated
levels of Fecal Bacteria have also risen. With the implementation success of the WQRP and its
recent suspension, the source of the increased Fecal Bacteria needs to be found. Departmental
attention was focused on finding land based non-point source Fecal pollutants. Repair of failing
septic systems, reduction and elimination of sewer overflows, in-stream livestock input has been
implemented. However, concentrations of Fecal Coliform are still high enough to warrant
additional studies.
Basis for this study is to determine if an increase in Fecal Bacteria can be attributed to
bacteria propagating within the in-stream sediment. Do the in-stream sediments act as a
reservoir for Fecal Bacteria? Sediments have several factors that attribute to longer survival and
growth rates for Fecal Bacteria while attached. Sediment size, composition, temperature,
nutrients and predatory protections offer ideal conditions for bacteria to grow(Sherer et al, 1992),
14
allowing the sediment to be considered as a non-point source for the Fecal Bacteria. Part of this
Goose Creek assessment will involve analyzing the stream catchments in Mecklenburg County,
to determine composition of the stream channel substrate. Different types of underlying
channels would provide different sediment types for the bacteria. The goal of this study will be
to evaluate the concentration of Fecal Coliform Bacteria, and to determine if the stream channel
substrate and quantity of sediments are contributing to the increase in elevated Fecal numbers in
the stream. In addition, the study hopes to identify if the type of sediments impact the
propagation of the Fecal Coliform Bacteria, therefore causing the numbers to increase without an
actual introduction of Fecal Coliform Bacteria itself.
METHODS OF STUDY
STUDY AREA
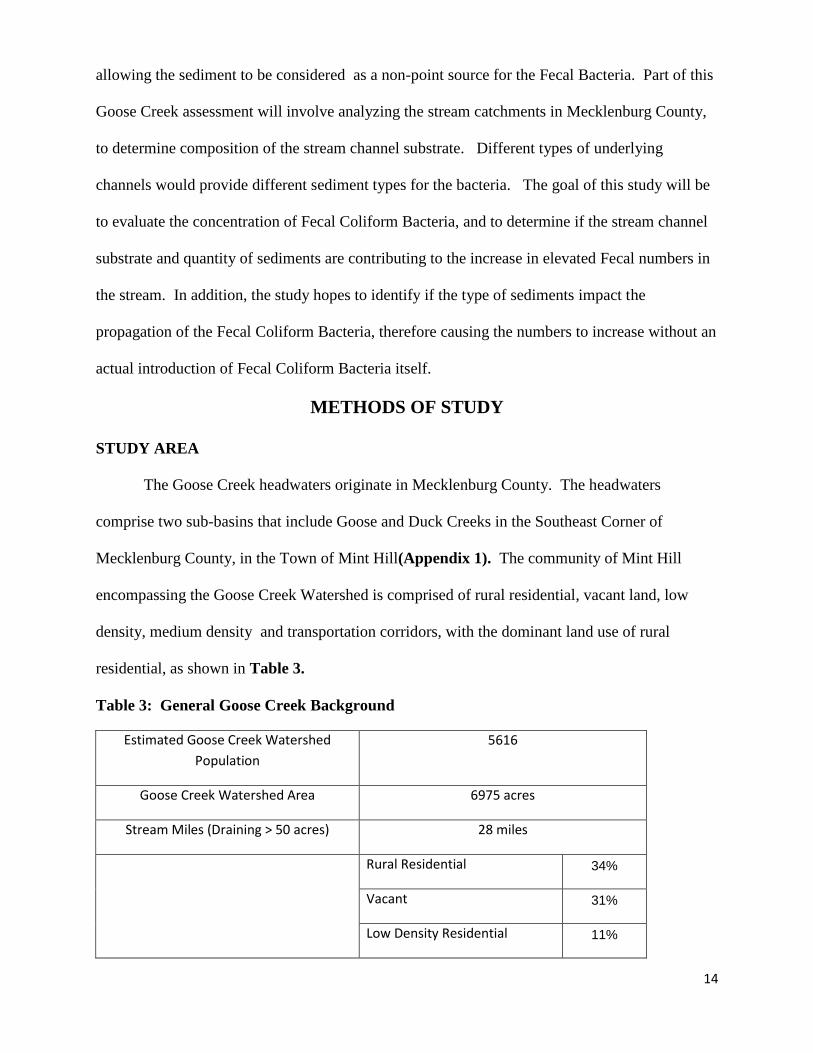
The Goose Creek headwaters originate in Mecklenburg County. The headwaters
comprise two sub-basins that include Goose and Duck Creeks in the Southeast Corner of
Mecklenburg County, in the Town of Mint Hill(Appendix 1). The community of Mint Hill
encompassing the Goose Creek Watershed is comprised of rural residential, vacant land, low
density, medium density and transportation corridors, with the dominant land use of rural
residential, as shown in Table 3.
Table 3: General Goose Creek Background
Estimated Goose Creek Watershed
Population
5616
Goose Creek Watershed Area 6975 acres
Stream Miles (Draining > 50 acres) 28 miles
Rural Residential 34%
Vacant 31%
Low Density Residential 11%

15
Dominant Land Uses Medium/Low Density
Residential 9%
Transportation 8%
Major Political Jurisdictions Town of Mint Hill
Major Streams in the Goose Creek
Watershed
Goose Creek
Duck Creek
Stevens Creek
*Table provided by MCWQP, 2009
This study will focus on a catchment of the Goose Creek Basin with mixed land uses that
contain sediment laden water, non-impacted, riparian buffered water and residential runoff.
Analyzing these water types will assist in the assessment of what role the sediments play in
acting as a non-point source pollutant source for Fecal Bacteria.
The North Carolina Department of Environment and Natural Resources classify soils in
this region as what shallow, moderately draining, clayey red to orange sub-soils, with an
erodability K factor of .16 to .28(NCDENR, 2000). Although this soil type is the primary soil
type in this region, pockets of sandy soils are found in the basin and underlying many of these
area are outcroppings of slate. In some areas, the slate outcroppings break the surface and are
barely covered.
STUDY DESIGN-STEP ONE
In order to narrow down the catchments to study, a baseline Fecal Bacteria assessment of
the entire Mecklenburg County watershed of Goose Creek was performed. Non-impacted
baseline flows provide Fecal Bacteria numbers that are present in the stream, without the
possible impact of Fecal laden storm water. The survival of Fecal Bacteria once released in the
aquatic environment, is determined by numerous environmental factors including temperature
variation, salinity, oxygen levels, nutrient deficiencies, predation, and Ultraviolet

16
Irradiation(McFeters and Singh, 1991). The baseline watershed sample points can be found on
Appendix 2. Across the entire Mecklenburg County Goose Creek watershed, Fecal Coliform
ambient sampling ranged from a low of 56 to a high of 4200 colonies per 100/mL of water. The
mean for all the samples collected was a 1042, well above the state establish threshold of 400.
Fecal Bacteria sampling protocols will be followed using field grab sampling methods as
provided by the Mecklenburg County QAPP manual, which are based on the USEPA guidelines.
Each sample will consist of a chain of custody(Appendix 5), one, 100 mL (sterile, Na2S2O3
preservative) Fecal Coliform sample bottle, one waterproof pre-designed sample bottle label. .
Samples of Fecal Coliform Bacteria will be collected at each location. Quality Assurance
procedures will be followed to include field blanks.
Field blank collection will be used as the following Mecklenburg County procedure. A
QC blank will be filled at the first site with a bottle of lab sterilized buffer blank solution
(for bacteriological parameters) for each blank sample set sent to the lab that day. The buffer
blank solution will be poured into a Fecal bottle as mentioned earlier and stored for a holding
time of no more than 6 hours on a sterile iced environment(Mecklenburg County QAPP, 2007).
Once the blank has been collected at the first site the collection of the bacteriological
samples may begin. The following procedure will be used. Carefully open the sterile sample
collection bottle cap using your thumb and forefinger to grip the cap tab. Hands should be
covered in Nitrile gloves to protect both you and the integrity of the sample from cross
contamination. Be sure not to contact any inside surface of the bottle cap or the bottle during the
opening procedure. Holding the bottle so that no contact is made with any inside surface of the
bottle or cap, tilt the base of the bottle down at approximately 45° angle. Dip the bottle mouth,
submerged, upstream from where you are standing. Submerge until the bottle is full to the
indicated 100mL volume. Hold the filled bottle upright and replace the cap. Using the hand-held
temperature probe, measure the water temperature directly from the surface water source, not

17
from the sample collection bottle. Record the water temperature on the appropriate lab COC
form. Place all sample collection bottles (and blanks) upright in the cooler. Do not submerge
sample bottles in ice-melt water. Complete the COC. Deliver all sample bottles in the cooler on
ice to the CMU Lab for analysis. Submit a copy of the completed COC form(Mecklenburg
County QAPP, 2007).
Once the samples are at the lab, strict Fecal Bacteria sample guidelines will be employed.
The USEPA has strict protocols for Fecal Bacteria sampling. The Charlotte Mecklenburg
Utilities(CMU) lab employs theses USEPA Standards. The CMU method to test for the Fecal
Bacteria will be the Membrane Filtration Method. As this method is lab based, this procedure
method can be found in Attachment 1, Membrane Filtration Using membrane-Enterococcus-
Esculin Iron Agar(USEPA, 2002).
To go along with the non-impacted baseline Fecal sampling, a thorough walking
geomorphogical assessment was performed. This assessment provided locations of physical
change in the streambed, bank characteristics, in stream sediment types and vegetation coverage
in the Mecklenburg County Watershed portion of Goose Creek. The purpose of this assessment
was to locate where the underlying rock metamorphosis occurs from traditional slate belt
characteristics, to typical piedmont based stream channel. Identifying these characteristics, will
allow us to see if Fecal Bacteria may be introduced through the short circuiting of septic system
drain fields. Drain field identification close to the stream will be observed to check for any
possible influx into the stream itself.
Each catchment of stream that falls in the Goose Creek watershed within Mecklenburg
County was assessed. Identification of changes in streambed types are documented on a GPS
and pictures are taken recording the type of change and variation identified. Specific soil types
were not recorded, only changes in streambed geomorphology. The majority of the soils in the
Goose Creek watershed are a Sandy Clay Loam surface, with a subsoil of Clay and Clay
18
Loam(NCDENR, 2000). Major changes in underlying substrate are identified in Appendix 6. A
major change from a soils based stream channel, to one of underlying slate rock formations that
jettison to the surface and make up the stream bed channel occur in some areas.
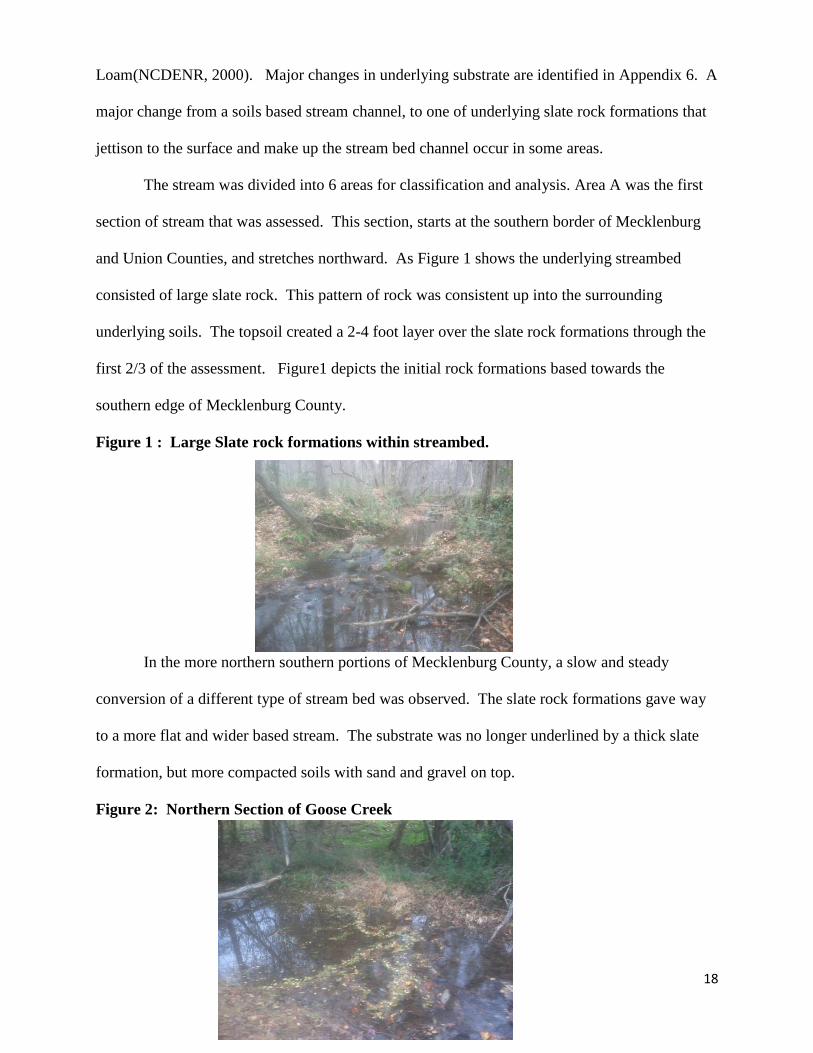
The stream was divided into 6 areas for classification and analysis. Area A was the first
section of stream that was assessed. This section, starts at the southern border of Mecklenburg
and Union Counties, and stretches northward. As Figure 1 shows the underlying streambed
consisted of large slate rock. This pattern of rock was consistent up into the surrounding
underlying soils. The topsoil created a 2-4 foot layer over the slate rock formations through the
first 2/3 of the assessment. Figure1 depicts the initial rock formations based towards the
southern edge of Mecklenburg County.
Figure 1 : Large Slate rock formations within streambed.
In the more northern southern portions of Mecklenburg County, a slow and steady
conversion of a different type of stream bed was observed. The slate rock formations gave way
to a more flat and wider based stream. The substrate was no longer underlined by a thick slate
formation, but more compacted soils with sand and gravel on top.
Figure 2: Northern Section of Goose Creek
19
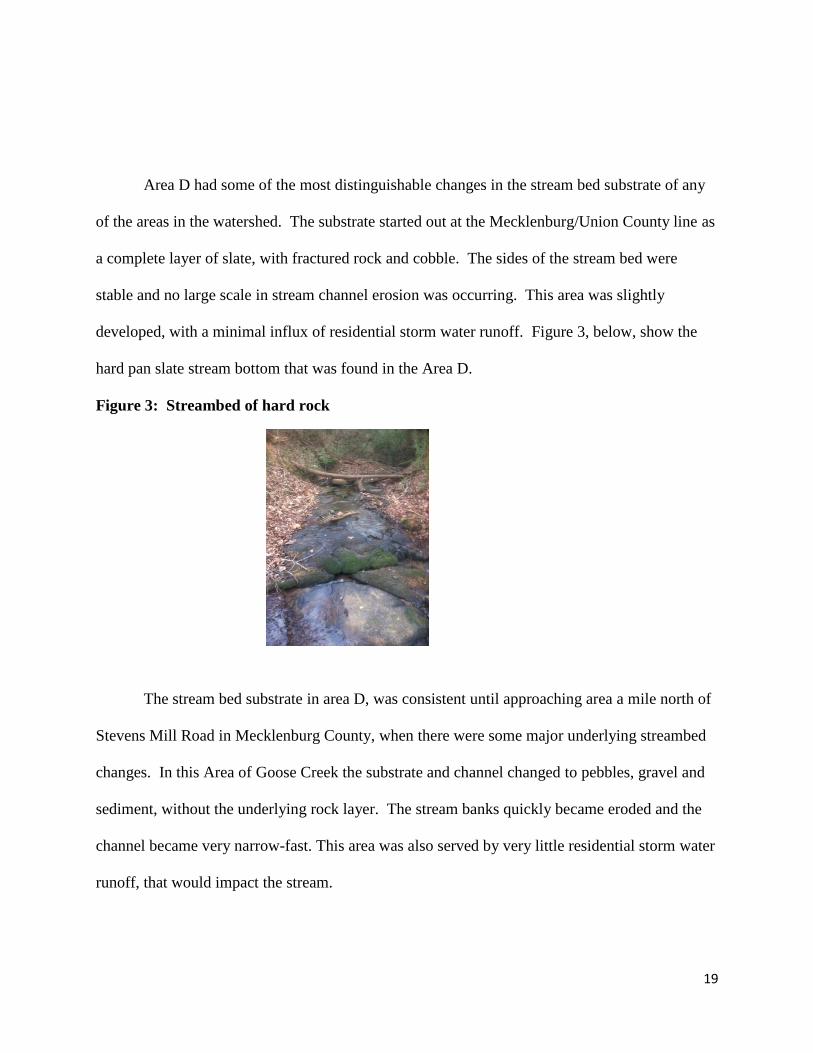
Area D had some of the most distinguishable changes in the stream bed substrate of any
of the areas in the watershed. The substrate started out at the Mecklenburg/Union County line as
a complete layer of slate, with fractured rock and cobble. The sides of the stream bed were
stable and no large scale in stream channel erosion was occurring. This area was slightly
developed, with a minimal influx of residential storm water runoff. Figure 3, below, show the
hard pan slate stream bottom that was found in the Area D.
Figure 3: Streambed of hard rock
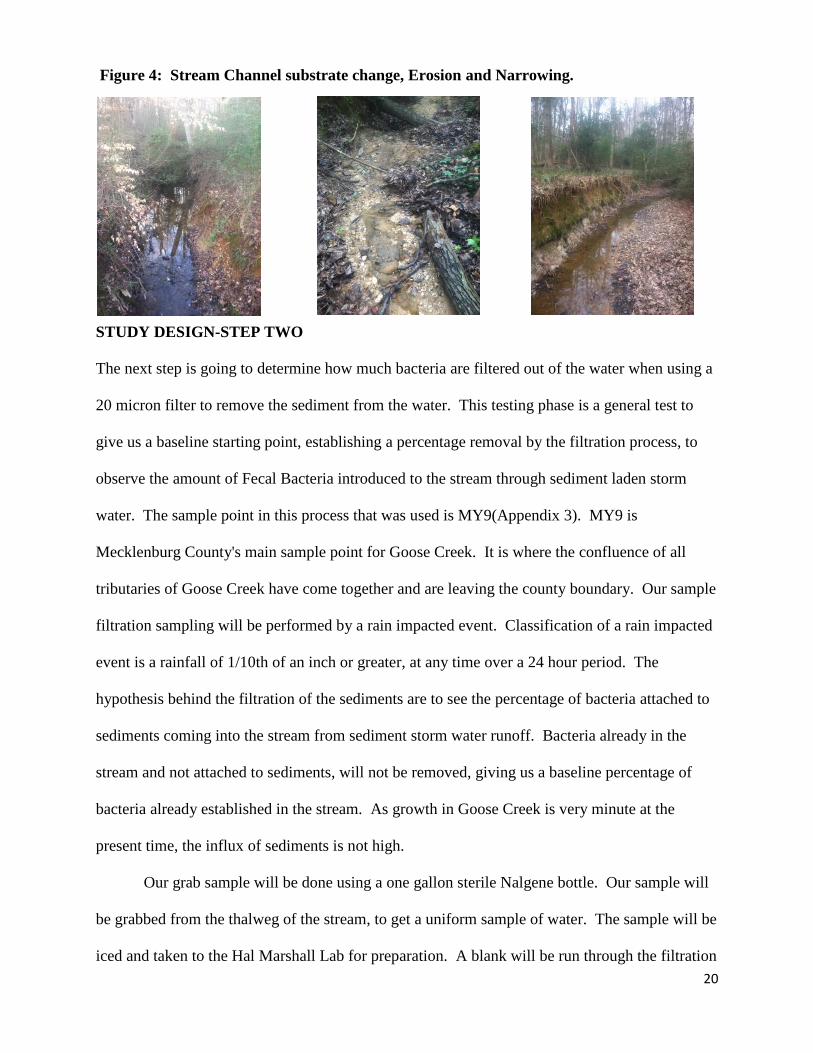
The stream bed substrate in area D, was consistent until approaching area a mile north of
Stevens Mill Road in Mecklenburg County, when there were some major underlying streambed
changes. In this Area of Goose Creek the substrate and channel changed to pebbles, gravel and
sediment, without the underlying rock layer. The stream banks quickly became eroded and the
channel became very narrow-fast. This area was also served by very little residential storm water
runoff, that would impact the stream.
20
Figure 4: Stream Channel substrate change, Erosion and Narrowing.
STUDY DESIGN-STEP TWO
The next step is going to determine how much bacteria are filtered out of the water when using a
20 micron filter to remove the sediment from the water. This testing phase is a general test to
give us a baseline starting point, establishing a percentage removal by the filtration process, to
observe the amount of Fecal Bacteria introduced to the stream through sediment laden storm
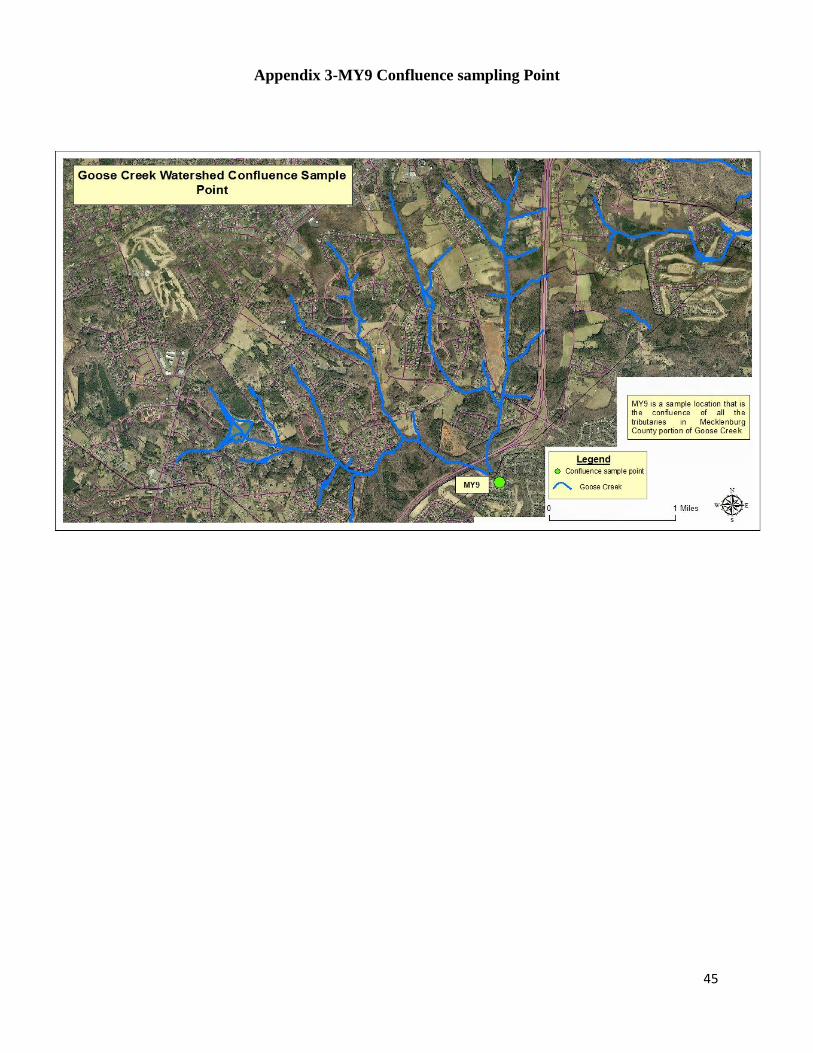
water. The sample point in this process that was used is MY9(Appendix 3). MY9 is
Mecklenburg County's main sample point for Goose Creek. It is where the confluence of all
tributaries of Goose Creek have come together and are leaving the county boundary. Our sample
filtration sampling will be performed by a rain impacted event. Classification of a rain impacted
event is a rainfall of 1/10th of an inch or greater, at any time over a 24 hour period. The
hypothesis behind the filtration of the sediments are to see the percentage of bacteria attached to
sediments coming into the stream from sediment storm water runoff. Bacteria already in the
stream and not attached to sediments, will not be removed, giving us a baseline percentage of
bacteria already established in the stream. As growth in Goose Creek is very minute at the
present time, the influx of sediments is not high.
Our grab sample will be done using a one gallon sterile Nalgene bottle. Our sample will
be grabbed from the thalweg of the stream, to get a uniform sample of water. The sample will be
iced and taken to the Hal Marshall Lab for preparation. A blank will be run through the filtration

21
process and used in the non filtration sample, following the procedures mentioned above. The
one gallon Nalgene bottle will be agitated to ensure even distribution of bacteria and sediment.
Once the grab sample has been agitated, 8 filtered and 8 unfiltered samples will be distributed
from the grab. One hundred milliliters will be poured into the top of a Nalgene Easy Flow
sample bottle, with a 20 micron filter, 100 mL collection bottle(Figure 5) .
A Nalgene PVC hand vacuum pump(Figure 5) will be attached and used to pull the
water through. The sample will be sealed and put on ice. A non-filtration sample will also be
collected and put on ice. The samples will be iced and taken to the CMU lab for Membrane
Filtration Method to determine the number of Fecal Bacteria colonies per 100/mL of water.
Figure 6: Nalgene Easy Flow Sample Bottle and Hand Vacuum Pump
STUDY DESIGN-STEP THREE
Goose Creek presents itself as an interesting
case study since part of the watershed is developed, other parts are not developed and heavily
wooded, and other parts are in a transition, undergoing small amounts of active development.
The objective is to close in with a more detailed sampling to isolate a small area of Goose Creek
that has all of the above mentioned characteristics. To achieve this, 17 points(Appendix 2) were
selected in the watershed that were fed by several tributaries of varying land uses. We will be
looking for catchments of Goose Creek which have elevated counts of Fecal Bacteria and focus
intensive filtration studies on that catchment, These 17 points were collected during storm water
impacted events throughout the watershed.

22
The samples were collected using the standard grab method mentioned above. Each
sample was collected in a 100 mL sterile Nalgene nylon bottle, preserved with Na2S2O3. The
samples were then cooled on ice and taken to the CMU lab within a period of six hours, where
Membrane Filtration was used to determine the number of Fecal Bacteria colonies per 100/mL of
water. This storm water impacted event testing was performed 3 times to determine the
catchment that had the unique characteristics to study.
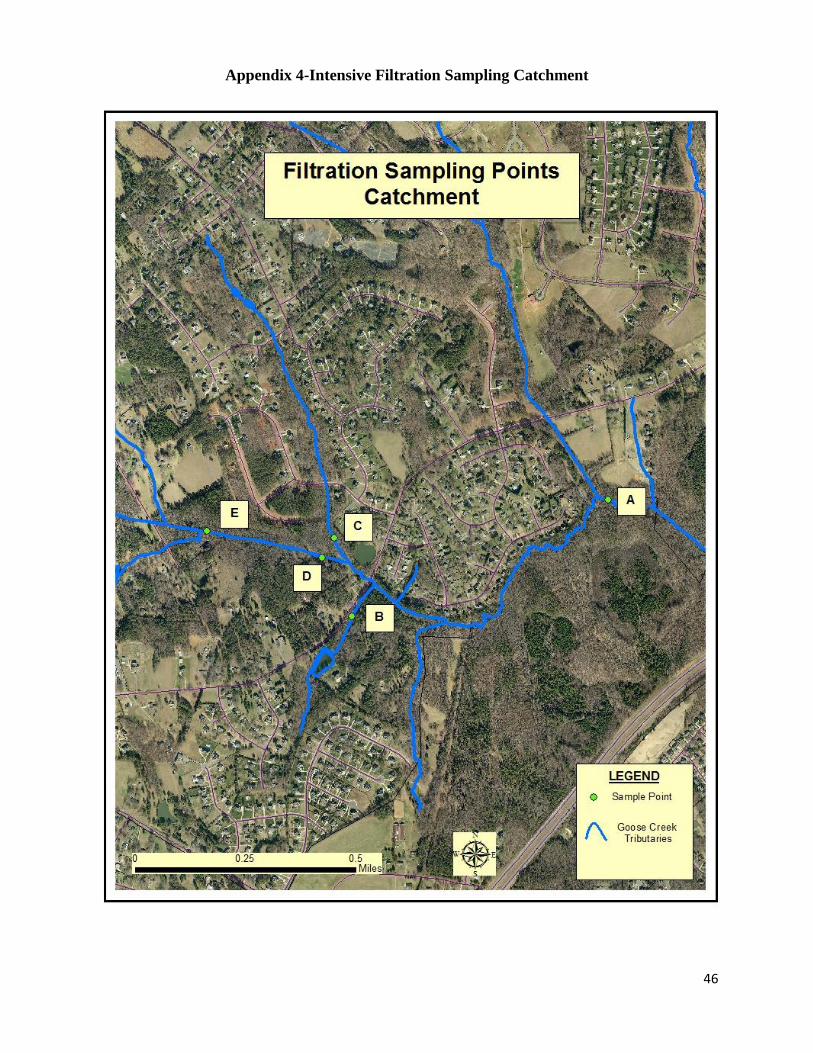
STUDY DESIGN-STEP FOUR
The Catchment that was selected is unique in that it provided all of the characteristics that Goose
Creek possesses-heavily buffered, residential, pasture, livestock pasture and active construction.
(Appendix 4). The sampling was performed between February 2013 until August 2013. Daily
air temperatures ranged from 41 degrees to 88 degrees Fahrenheit.
The first step in the process is to get a baseline set of Fecal Bacteria counts within this
catchment. This baseline set of samples will be non-impacted by storm water events. These will
be used in a comparison to the storm water collected samples. At each of the five sample points
in the catchment(A,B,C,D,E), samples will be non-storm water impacted samples. The sample
points can be found in the Appendix 4 map. There is no prescribed EPA protocol, nor does
MCWQP have a protocol set up for this type of sampling. A mix of MCWQP grab sampling
protocol, including blanks and the use of EPA Fecal Bacteria Membrane Filtration will be used
to determine results. At each sample point, two, sterile, 200 mL unpreserved bottles will be used
for grab samples. The samples will then be placed on ice and brought back to the Hal Marshall
MCWQP Lab. A total of 10 samples will be collected from the 5 sample points. At the lab, 6
Nalgene Easy Flow filtration bottles were set up. A blank will be run through the filtration
process and used in the non filtration sample. The non-filtration sample will be poured directly
into the sterile 100 mL, Na2S2O3 preserved bottle. Each of the 5 grab samples were agitated and
then 100 mL will be poured into the top of a Nalgene Easy Flow sample bottle, with a 20 micron
23
filter, and 100 mL collection bottle(Figure 5) . A Nalgene PVC hand vacuum pump will be
attached and used to pull the water through. The sample will be sealed and put on ice. A non-
filtration sample will poured from the remaining water into a preserved 100mL Fecal sample
bottle and put on ice. Each sample site will be labeled as Filtered A or Unfiltered A,
corresponding to the sample site. The samples will be iced and taken to the CMU lab for
Membrane Filtration. A method used to determine Fecal Bacteria colonies per 100/ mL of water.
A repeat process will be done for the same sample points in the catchment except they
will be storm water impacted samples. On the Appendix 4 map, each sample point will have two
samples collected at the same spot. One will be a filtered and one will be unfiltered. A mix of
MCWQP grab sampling protocol and EPA Fecal Bacteria Membrane Filtration will be used to
determine results. At each sample point, one, sterile, 200 mL unpreserved bottle will be used for
grab samples. The samples will then be placed on ice and brought back to the Hal Marshall
MCWQP lab. A total of 10 samples will be collected.
At the lab, 6 Nalgene Easy Flow filtration bottles were set up. A blank will be run
through the filtration process and used in the non filtration sample. The non-filtration blank will
be poured directly into the sterile 100 mL, Na2S2O3 preserved bottle. Each of the 5 grab samples
were agitated and then 100 mL will be poured in to the top of a Nalgene Easy Flow sample
bottle, with a 10 micron filter, 100 mL collection bottle(Picture 6) . A Nalgene PVC hand
vacuum pump will be attached and used to pull the water through. The sample will be sealed
and put on ice. A non-filtration sample will also be collected and put on ice. The non-filtration
sample will be poured directly into Fecal bottle and placed on ice. The samples will be iced and
taken to the CMU lab where they will undergo the Membrane Filtration, a method to determine
Fecal Bacteria colonies.

24
DATA COLLECTION
The overall application of this study applies to the entire Mecklenburg County portion of
the Goose Creek Watershed. However, with the focus on a very specific catchment, this
microcosm can be used as a model of what is happening throughout the watershed. As Fish and
Pettibone state, "Micorcosms are a very useful tool to understand the complex influence of biotic
and abiotic factors on Fecal Indicator Bacteria persistence". Application of the findings to the
catchment under scrutiny will be applied to the entire watershed as the land use patterns for the
Goose Creek are very similar. Data, once collected, will be displayed in an ARCMAP GIS
geodatabase layer. Each sample point has the results tied to it so it may be accessed by the
MCWQP staff. For every sample that was collected, date, time, conditions, temperature and
results were recorded for that specific point. CMU labs have a data repository where all Fecal
samples collected in this study will be stored. Once the results have been determined in the lab,
the data is uploaded to the repository and the results are sent to a specified party. Data from this
study and prior studies is accessible through the Charlotte-Mecklenburg Utilities Data
Repository.
RESULTS
STREAM ASSESSMENT FINDINGS
The results of the Goose Creek assessment can be broken down into categories. First
being, the streambed composition and the land assessment of the watershed. The goal in doing a
visual assessment is to establish any direct Fecal links in the land and streambed types to a direct
source for Fecal Bacteria. Two areas of the watershed that encompass roughly 2% of the stream
length in Mecklenburg County had a livestock agricultural use. The first area can be seen in
Figure 6.

25
Figure 6-Agricultural Livestock Areas
Within this section of livestock agricultural use, the predominant animal is cows.
Roughly 40 head of cattle are found in the red colored area. Other animals in this are 3-4 horses
and 12 goats. The horses and goats do not have access to the stream, and are over 200 feet away.
However, the cattle, up until 2012 had access to the stream and used it as a watering hole and
wallow in the summer. Fecal Bacteria counts have been consistently high in this area up until
last year. As part of a cost share program to help comply with the State Mandated TMDL, a
fence was constructed 200 feet from the stream to provide an adequate buffer. The cows are now
at a minimum of 200 feet from the stream and may not have access to the stream to use as a
wallow anymore. Sampling in this area was done during the walking stream assessment, below
the entire livestock impacted section. The result average was a Fecal count of 320 colonies per
100/mL. Samples before the installation of the fencing resulted in a range from a high of 13000
to a low of 340 colonies per 100/mL. The average during the course of study when the livestock
had access to the stream was 3337 Fecal colonies per 100/mL.
26
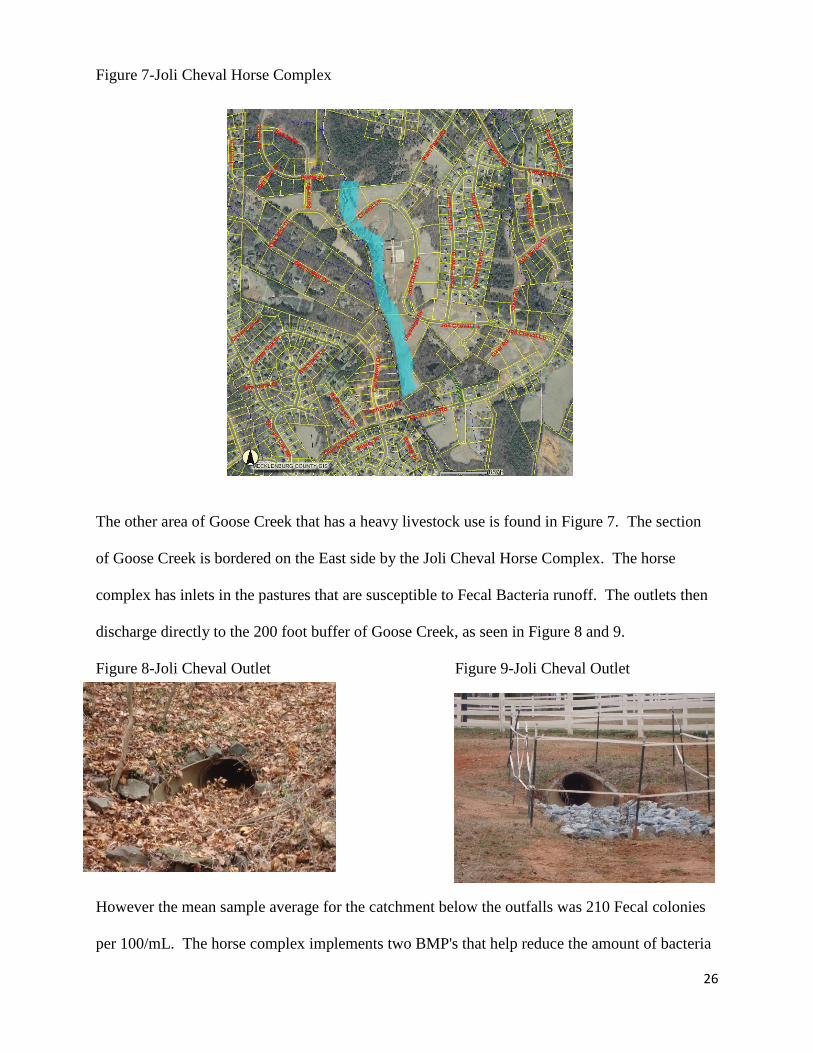
Figure 7-Joli Cheval Horse Complex
The other area of Goose Creek that has a heavy livestock use is found in Figure 7. The section
of Goose Creek is bordered on the East side by the Joli Cheval Horse Complex. The horse
complex has inlets in the pastures that are susceptible to Fecal Bacteria runoff. The outlets then
discharge directly to the 200 foot buffer of Goose Creek, as seen in Figure 8 and 9.
Figure 8-Joli Cheval Outlet Figure 9-Joli Cheval Outlet
However the mean sample average for the catchment below the outfalls was 210 Fecal colonies
per 100/mL. The horse complex implements two BMP's that help reduce the amount of bacteria
27
entering the stream. First they use the buffers as a natural barriers to keep the bacteria and
fences to keep the horses out of the stream. Natural buffers have never been fully tested to
effectively see their removal efficiency characteristics. However, their effectiveness lies in the
ability of the buffer to have zero discharge of surface runoff to the stream. The effectiveness is
greatly dependent on the amount of infiltration of sheet flow(Shuler, 2000). Essentially the
longer the buffer, the more time for infiltration. Secondly, they implement a waste reduction
program within the pastures. Daily the pastures are vacuumed to remove the horse waste. It is
then composted at a location well away from potential stream impacts.
One other area of concern within the watershed is the installation and maintenance of
septic systems. The watershed lies in the Yadkin River Basin, and Charlotte-Mecklenburg
Utilities gets its water from the Catawba River Basin. Antiquated laws in North Carolina prevent
the transfer of water from one watershed to the other, unless legislative action is taken. In the
case of the Goose Creek watershed, a court ordered moratorium was put in place in 2009, that
prevented intrabasin water transfer to the Yadkin River watershed, where Goose Creek is a
tributary. Tradtionally, Mint Hill has been one of the more rural communities within
Mecklenburg County, and as such, the primary mode of waste water disposal has been septic
systems. With the implementation of this moratorium, the proliferation of septic systems will
continue to be the dominate wastewater treatment system.
Septic system failure could provide a direct link to increased Fecal Bacteria in the Goose
Creek Watershed. Research and septic system evaluation throughout the entire watershed was
performed by a different agency. Mecklenburg County Ground Water services performed over
1,422 septic system inspections and found only 12 failures. Of the 12 failures, only three were
considered possible high risk for Fecal Bacteria contamination to Goose Creek tributaries. High
risk means that the failure was found within 400 feet of the tributary(Mecklenburg County
Ground Water Services, 2011). A direct correlation to septic system failure and Fecal Bacteria
28
increases cannot be correlated with such a small number of Septic System failures within the
watershed(Mecklenburg County Ground Water Services, 2011).
Direct source control of Fecal Bacteria is one of the easiest to identify. However,
actually reducing the impact once it has been found can be a matter of lifestyle changes,
economic conditions and education of the public. Schueler states that, "effective source control
seeks to reduce or eliminate sources of bacteria before they come into contact with storm water.
Common sources include septic systems and pet waste. The effectiveness on bacteria removal is
contingent on how often to the sources happen, how effective is enforcement, what methods have
reduced the source of the pollutant and what are realistic expectations of Fecal Bacteria
reduction." In the Goose Creek Watershed Schuelers comment that, "if untreated wastewater is a
documented source of bacteria, basic repairs can produce impressive results in bacteria
reduction".
The walking stream channel assessment performed in the Goose Creek watershed, did not
find any direct source Fecal Bacteria sources. Inspection efforts were detailed , looking for any
type of failing septic system that may contribute to the increased Fecal Bacteria within the
watershed. As mentioned earlier, the underlying soil types change dramatically as you move to
the Southeast end of Mecklenburg County. Moving into the southern area with more of a rock
based sub-layer, inspections were looking for fractures or short circuits of septic systems. None
were found. One area that had the potential was isolated and investigated, but this area was
determined to be a spring, due to the low Fecal numbers and the presence of iron bacteria-a
ground water indicator.
FECAL BACTERIA FINDINGS
Multiple studies have proven that Fecal Bacteria do adhere to sediment particles in storm
water conditions. One estimate by Schillinger and Gannon, is that 15-30 percent of all Fecal
Bacteria in storm water are adsorbed to suspended particles greater than 30 microns in diameter.

29
0
5000
10000
15000
20000
25000
30000
1 2 3 4 5 6 7 8
Filtered
Unfiltered
0.00
50.00
100.00
1 2 3 4 5 6 7 8
MY 9 % removed
% removed
Bacteria that are not attached are much harder to settle out. Settling periods for these bacteria
can take days or weeks(Schueler, 2000).
Our study catchment involved five sample Points-A through E. Within this study section
several types of stream conditions are represented. Catchment A is mix of a buffered stream
area with a small amount of residential runoff from houses that are within a 200 foot buffer.
Catchment B is all wooded with no development. Catchment C is actively undergoing
construction and has heavy sediment laden storm water runoff. Catchment D is wooded with
low density housing. Catchment E is the headwaters with agriculture, pastures for livestock and
low density homes.
BASELINE FILTRATION RESULTS
The initial filtration testing performed at MY9 showed that roughly 67 percent of the in
stream bacteria where attached to sediments during rain impacted events. When the storm water
was filtered, a large percentage of the bacteria were removed from the water. Results of the
samples are found in Figure 10.
Figure 10-MY9 Filtration Results
Samples
30
43 36 32 33 11 17 28 0500
100015002000250030003500
Site A Filtered
Site AUnfiltered
% reduction
CATCHMENT A
Catchment A presents a study area that most typically represents the development in the
Goose Creek Watershed. The catchment is 3516 feet in length and receives both point and non-
point source storm water impacts from neighborhood outlets and sheet flow. The residential
areas provide the bulk of the outfalls with direct storm water discharge. There are horse pastures
that drain to this catchment as well, but the farm practices good BMP's, as mentioned earlier so
the impacts should be negligible. There are no areas under active construction where sediments
could be discharged into the corridor. This is the most densely populated catchment of the study
area.
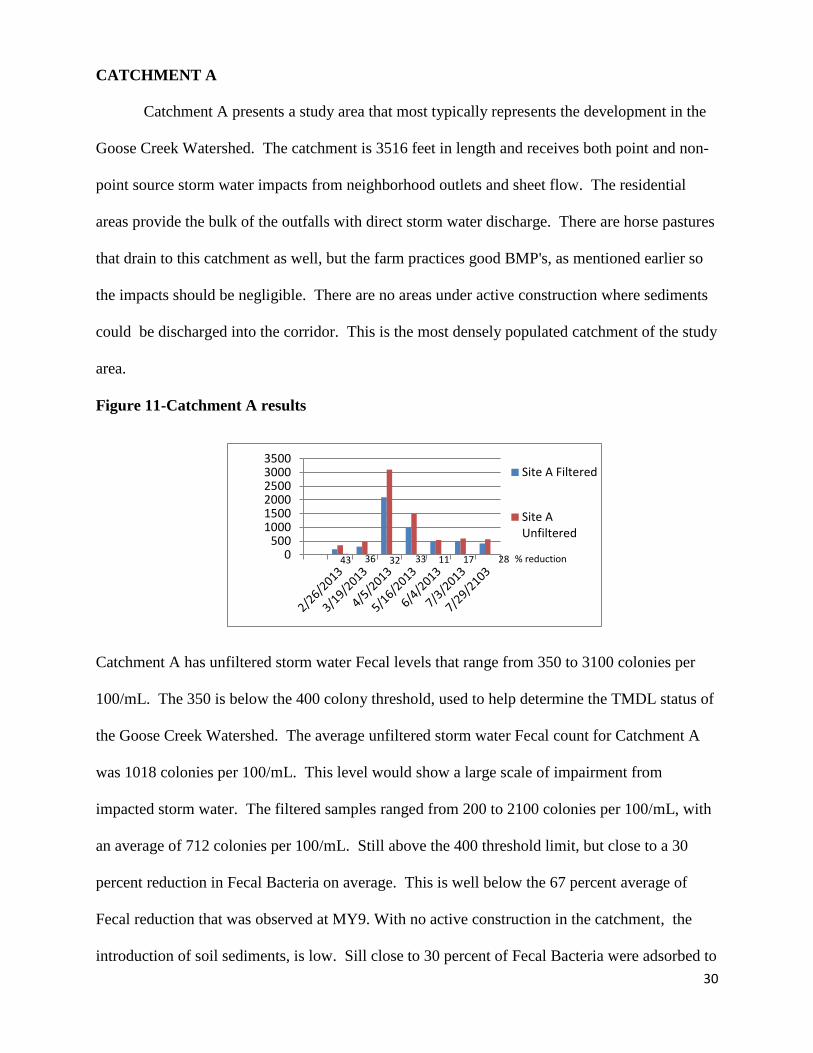
Figure 11-Catchment A results
Catchment A has unfiltered storm water Fecal levels that range from 350 to 3100 colonies per
100/mL. The 350 is below the 400 colony threshold, used to help determine the TMDL status of
the Goose Creek Watershed. The average unfiltered storm water Fecal count for Catchment A
was 1018 colonies per 100/mL. This level would show a large scale of impairment from
impacted storm water. The filtered samples ranged from 200 to 2100 colonies per 100/mL, with
an average of 712 colonies per 100/mL. Still above the 400 threshold limit, but close to a 30
percent reduction in Fecal Bacteria on average. This is well below the 67 percent average of
Fecal reduction that was observed at MY9. With no active construction in the catchment, the
introduction of soil sediments, is low. Sill close to 30 percent of Fecal Bacteria were adsorbed to
31
22 10 10 32 6 3 45
0
200
400
600
800
1000
1200
Catchment BFiltered
Catchment BUnfiltered
Catchment B %removed
suspended sediment particles. Twenty percent lower than Schiller and Gannon stated that should
be adsorbed to suspended sediments.
CATCHMENT B
This catchment does not have any type of influence on its receiving waters other than
what is naturally occurring. This is a tributary that is heavily wooded and buffered on each side.
Fecal influences would be from sheet flow runoff interactions with wild animal scat or in stream
Fecal sources that are already present. This catchment is the shortest at just 1000 feet, but due to
the nature of the stream it provides a microcosm of an undisturbed section of the Goose Creek
Watershed.
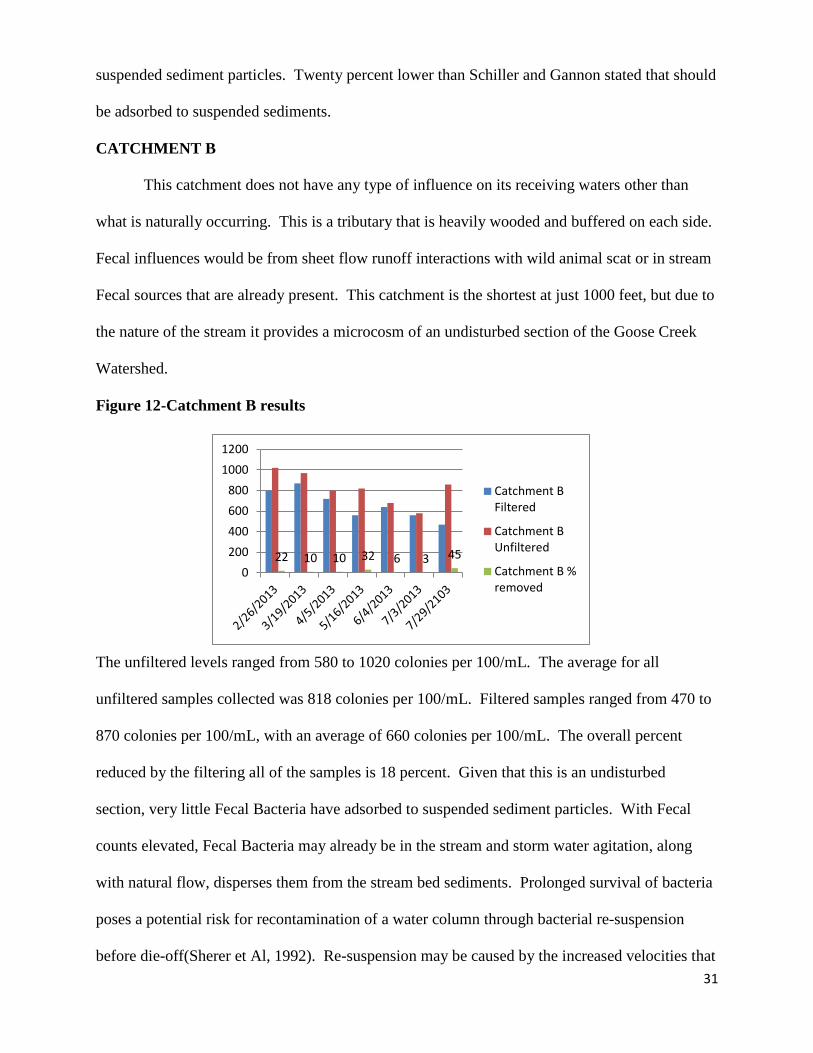
Figure 12-Catchment B results
The unfiltered levels ranged from 580 to 1020 colonies per 100/mL. The average for all
unfiltered samples collected was 818 colonies per 100/mL. Filtered samples ranged from 470 to
870 colonies per 100/mL, with an average of 660 colonies per 100/mL. The overall percent
reduced by the filtering all of the samples is 18 percent. Given that this is an undisturbed
section, very little Fecal Bacteria have adsorbed to suspended sediment particles. With Fecal
counts elevated, Fecal Bacteria may already be in the stream and storm water agitation, along
with natural flow, disperses them from the stream bed sediments. Prolonged survival of bacteria
poses a potential risk for recontamination of a water column through bacterial re-suspension
before die-off(Sherer et Al, 1992). Re-suspension may be caused by the increased velocities that
32
45 81 45 71 16 50 20 0
500
1000
1500
2000
2500
3000
3500
4000
Site C Filtered
Site C Unfiltered
Site C % removed
storm water causes in the stream channel. The introduction of Fecal Bacteria from the drainage
area through adsorption to sediment particles seems to be negligible due to the lack of exposed
incoming sediments, available for Fecal Bacteria absorption.
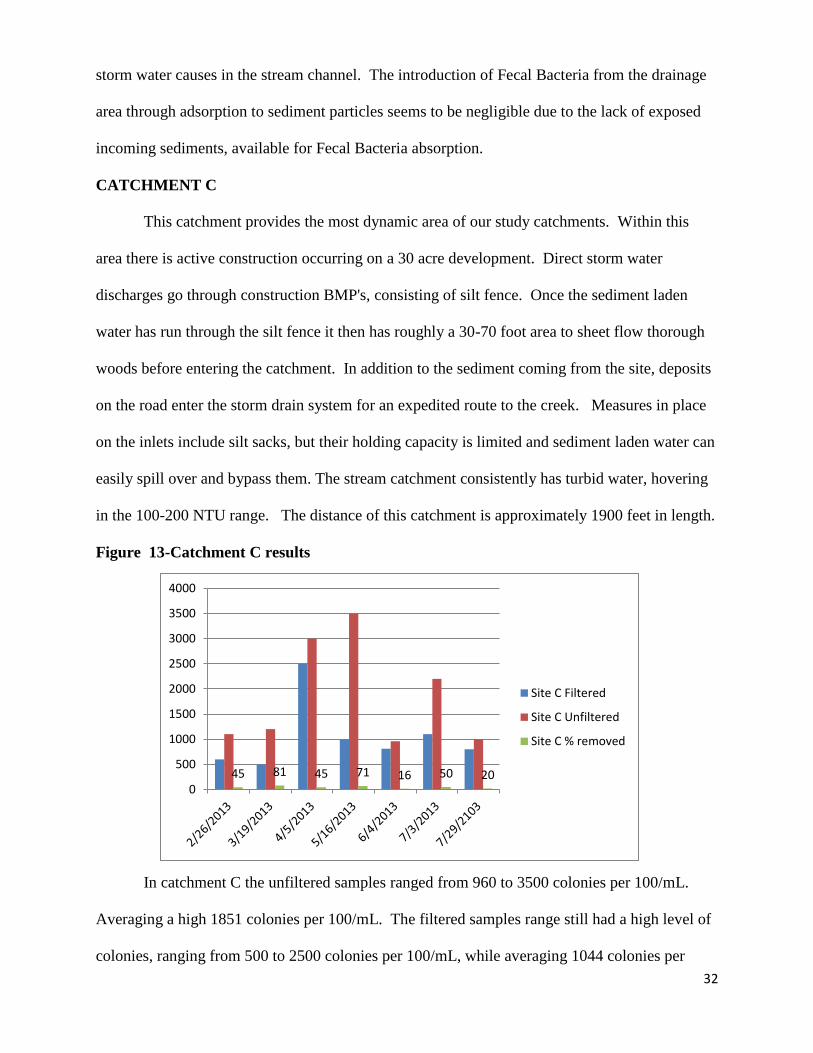
CATCHMENT C
This catchment provides the most dynamic area of our study catchments. Within this
area there is active construction occurring on a 30 acre development. Direct storm water
discharges go through construction BMP's, consisting of silt fence. Once the sediment laden
water has run through the silt fence it then has roughly a 30-70 foot area to sheet flow thorough
woods before entering the catchment. In addition to the sediment coming from the site, deposits
on the road enter the storm drain system for an expedited route to the creek. Measures in place
on the inlets include silt sacks, but their holding capacity is limited and sediment laden water can
easily spill over and bypass them. The stream catchment consistently has turbid water, hovering
in the 100-200 NTU range. The distance of this catchment is approximately 1900 feet in length.
Figure 13-Catchment C results
In catchment C the unfiltered samples ranged from 960 to 3500 colonies per 100/mL.
Averaging a high 1851 colonies per 100/mL. The filtered samples range still had a high level of
colonies, ranging from 500 to 2500 colonies per 100/mL, while averaging 1044 colonies per
33
100/mL. On average, the filtering removed 47 percent of the bacteria. It is clear the flow of
sediment laden water through a watershed allows for adsorption of Fecal Bacteria to the
sediments. These sediment are also deposited within this catchment as well. As the sediment are
deposited with the Fecal Bacteria attached, it provides an already hospitable breeding ground.
Sherer et Al, states, "Bacteria that have settled to bottom sediment may experience a more
favorable chemical and biological microenvironment, which can prolong bacterial survival".
As these Fecal Bacteria absorb to sediments and suspended particles, they may then undergo
sedimentation, from the water column and leads to accumulation in sediment(Bloesch, 1995).
This sedimentation can allow for re-suspension and prolonged life for Fecal Bacteria, causing
extended high Fecal counts, even in ambient conditions.
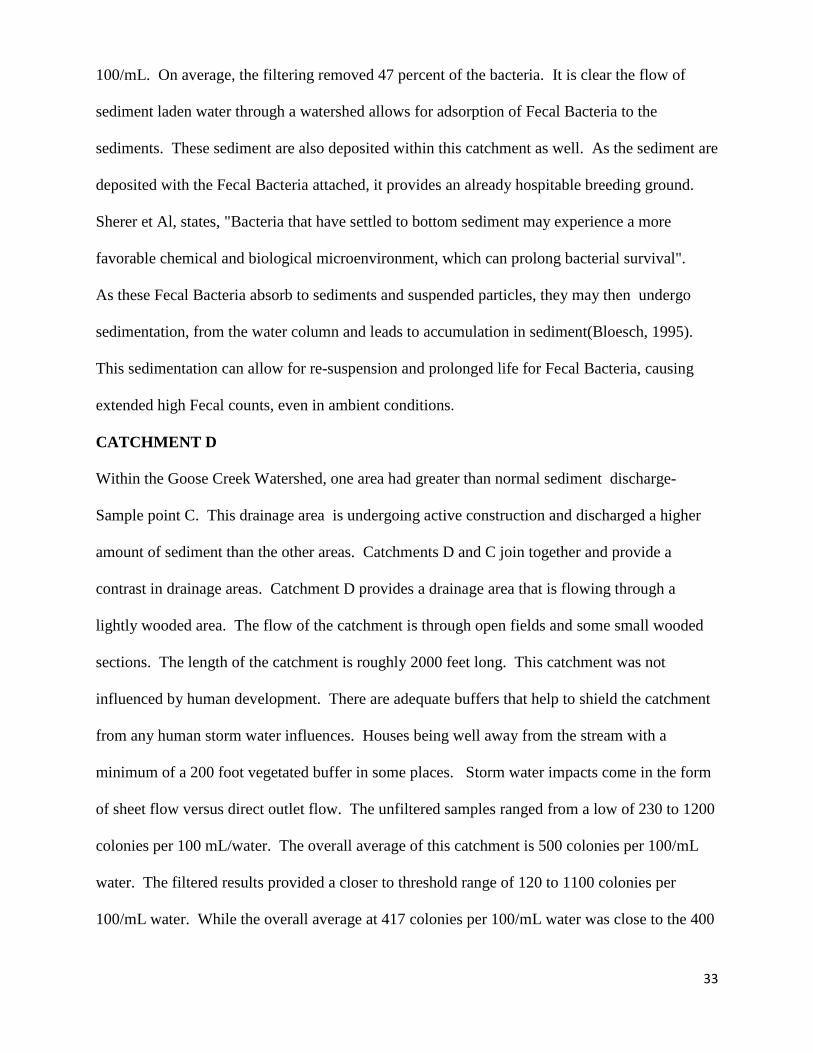
CATCHMENT D
Within the Goose Creek Watershed, one area had greater than normal sediment discharge-
Sample point C. This drainage area is undergoing active construction and discharged a higher
amount of sediment than the other areas. Catchments D and C join together and provide a
contrast in drainage areas. Catchment D provides a drainage area that is flowing through a
lightly wooded area. The flow of the catchment is through open fields and some small wooded
sections. The length of the catchment is roughly 2000 feet long. This catchment was not
influenced by human development. There are adequate buffers that help to shield the catchment
from any human storm water influences. Houses being well away from the stream with a
minimum of a 200 foot vegetated buffer in some places. Storm water impacts come in the form
of sheet flow versus direct outlet flow. The unfiltered samples ranged from a low of 230 to 1200
colonies per 100 mL/water. The overall average of this catchment is 500 colonies per 100/mL
water. The filtered results provided a closer to threshold range of 120 to 1100 colonies per
100/mL water. While the overall average at 417 colonies per 100/mL water was close to the 400
34
23 9 8 26 30 48 -9
-200
0
200
400
600
800
1000
1200
1400
Site D Filtered
Site D Unfiltered
Site D % removed
colonies per 100/mL of water mean average the state requires not to be impaired by Fecal
Coliform Bacteria.
Figure 14-Catchment D results
The results were as expected with the exception of the last sample which resulted in higher Fecal
concentrations from the filtered sample versus the unfiltered sample. However due to such slight
variances with bacterial logical samples, the results are considered negligible.
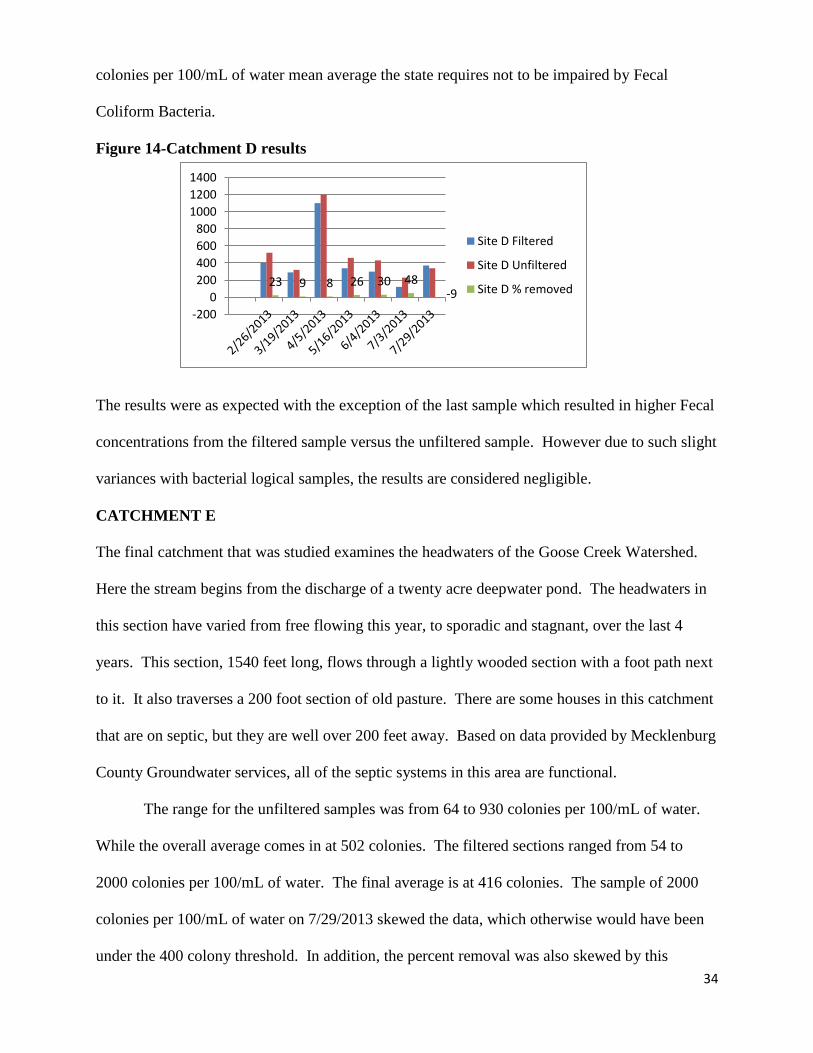
CATCHMENT E
The final catchment that was studied examines the headwaters of the Goose Creek Watershed.
Here the stream begins from the discharge of a twenty acre deepwater pond. The headwaters in
this section have varied from free flowing this year, to sporadic and stagnant, over the last 4
years. This section, 1540 feet long, flows through a lightly wooded section with a foot path next
to it. It also traverses a 200 foot section of old pasture. There are some houses in this catchment
that are on septic, but they are well over 200 feet away. Based on data provided by Mecklenburg
County Groundwater services, all of the septic systems in this area are functional.
The range for the unfiltered samples was from 64 to 930 colonies per 100/mL of water.
While the overall average comes in at 502 colonies. The filtered sections ranged from 54 to
2000 colonies per 100/mL of water. The final average is at 416 colonies. The sample of 2000
colonies per 100/mL of water on 7/29/2013 skewed the data, which otherwise would have been
under the 400 colony threshold. In addition, the percent removal was also skewed by this
35
53 6 17 29 13 16
-115
-200
0
200
400
600
800
1000
Site E Filtered
Site E Unfiltered
Site E % removed
sample. The sampling in this catchment did not vary much from the filtered to the unfiltered
sample, with the exception of the final sample.
Figure 15-Catchment E results
NON-STORM IMPACTED RESULTS
The storm water impacted events were the bulk of the study data. Comparable storm water
studies would indicate that storm water levels would be much higher in Fecal Bacteria
concentration. In our efforts to establish a baseline for filtration removal we found that the
confluence of all the Goose Creek streams in Mecklenburg County had on average 12625
colonies per 100/mL of water. This was from the entire county portion of the watershed, which
included many other catchments that were not studied. In addition, the filtered sample had on
average 3825 colonies per 100/mL of water. This presents, a close to 67 percent removal rate of
bacteria that have adsorbed to particles of sediment.
Non impacted analysis in the study catchment is used strictly for comparison to our
results. The goal with non-impacted samples was to get an average Fecal count, but not for in
depth analysis. Catchment E consistently came in with the lowest totals at 110 colonies per
100/mL of water for both filtered and unfiltered. While as expected, Catchment C, was the
highest with a 3600 for filtered and 3500 colonies per 100/mL for unfiltered. The 100 colony
difference is considered a non-factor due to the amount of colonies. This was higher than the
storm water impacted results.Figure 16 outlines the results.

36
0
500
1000
1500
2000
2500
3000
3500
4000
Non-Impacted Average Fecal Counts
Figure 16-Non Impacted Sampling Averages
RESULTS COMPARISON
Based on the findings of MY9, the confluence of all of Goose Creek waters in Mecklenburg
County, the expected results would be that storm water impacted samples would be higher.
However, that does not appear to be the case. Figure 17 illustrates the opposite findings from
the samples.
Figure 17-Overall Fecal Sampling Comparison
0
500
1000
1500
2000
2500
3000
3500
4000
Non Impacted
Stormwater Impacted

37
Higher up in the watershed, stormwater impacts are less apparent than they are at the confluence
of many tributaries. As you move farther down in the watershed the development has increased,
thus making impacts from pollutants, such as Fecal Bacteria, more abundant. As the USEPA
states, "The impacts on receiving streams due to high storm water flow rates or volumes can be
significant". The USEPA, goes onto say that, "The quantity of these pollutants per unit area
delivered to receiving waters tends to increase with the degree of development in urban areas".
The resulting EPA conclusions can be applied to the confluence leaving the County, but it does
not explain the results for the study catchments, specifically catchment C.
The sampling events found variations and statistical differences in the different land uses.
A non-parametric statistical whisker plot analysis was used to determine if there was any
statistical significance in the filtered versus unfiltered samples in the Catchments. Figure 18
outlines the findings of the filtered samples. Based on the P value of the statistics at .0001, the
confidence of the data is close to 99%. The statistical comparison between the filtered samples
show that there is significance in the findings when comparing the different land uses. Based on
the statistical results when all filtered samples are compared against each other, 50% of the
results show statistical significance. A P value of less than .02 indicates statistical significance
in the findings.

38
Figure 18-Statistical Significance Analysis
Based on the comparisons it can be concluded that the main difference in the filtered samples
comes from the different land use types of the sample catchments. Catchment C has the most
statistical variations when compared to the other Catchments. Catchment C also had the largest
influx of sediment into the watershed. Active land uses and contribution of sediments to the
watershed, not only increase the amount of Fecal Bacteria in the water, but contributes to an
elevated Fecal count of bacteria, after storm water events. When you compare impacted and
0
500
1000
1500
2000
2500
3000
3500
4000
A B C D E
Fil
tere
d
Filtered
95% CI NotchedOutlier Boxplot
Outliers > 1.5 and < 3IQR
Bonferroni
Contrast Difference p
A v B 10.4286 0.0240
A v C 0.0000 1.0000
A v D 14.3571 0.0008
A v E 22.0000 <0.0001
B v C -10.4286 0.0240
B v D 3.9286 1.0000
B v E 11.5714 0.0092
C v D 14.3571 0.0008
C v E 22.0000 <0.0001
D v E 7.6429 0.2130
39
non-impacted events for Catchment C, versus the other Catchments, the influx of sediment keeps
the Fecal Bacteria counts elevated by providing hospitable conditions to reproduce after they
have settled.
SUMMARY AND CONCLUSION
Fieldwork assessment and catchment sampling took place from November 2012 through
August 8, 2013 within the Goose Creek Watershed in Mint Hill, North Carolina. Sampling
occurred in five catchments for storm water impacted, sediment laden water. The sampling was
to determine the number of colonies per 100/mL of water of Fecal Coliform Bacteria. Samples
were unfiltered and filtered with a 30 micron filter to remove bacteria attached to sediments. The
Goose Creek Watershed has presented interesting past results of continual higher than state
threshold counts of Fecal Bacteria in non-storm water impacted events. Thirteen of thirty five
samples of the filtered storm water were below the state threshold. Two were from Catchment
A, six from Catchment D and five from Catchment E. Catchment B and Catchment C had no
filtered results below 400 colonies per 100/mL of water. Catchment B came from a highly
wooded area with no exposed soils, so incoming sediment from sources were unattached for the
most part. Catchment B also was not exposed to much light and had a very thick vegetative
buffer to keep sunlight off the creek. This in turn can play a role in allowing the bacteria to
propagate, since UV lights can help to reduce Fecal Bacteria. Exposure to sunlight is one of the
most important factors causing bacteria die off(Scheuler, 1992). Lack of UV light, organic
matter and lower flashy flow allow the Fecal Bacteria to remain suspended for long periods of
time, including periods well after rain events have occurred.
Catchment C had significant impacts by sediment. The channel already had a well
established substrate of deposited sediments from ongoing construction upstream. All of the
filtered samples of Catchment C were 960 colonies or above. However, the percent removal of
40
the sediments was 47 percent. Significantly higher than Catchment A, at 28 percent. Looking
closer at Catchment C, a 30 micron filter was able to remove on average 47 percent of the Fecal
Bacteria present in the water. Based on estimates in other studies, most Fecal Bacteria like to
adhere to sediments 30 microns and larger. Thus, most of the attached sediment should have
been filtered out, giving an accurate estimate of the non-absorbed Fecal Bacteria levels. With 47
percent, a combined average, of the bacteria being removed through filtration, 53 percent can be
said to have not been absorbed to suspended particles. In our study, these high Fecal removal
rates establish a source for incoming bacteria as having attached to the incoming sediment. In
addition to the incoming sediments, there appears to be a well established in stream population as
well. This in stream population is provided optimum growth conditions on the sediment in the
stream bed. Suspended sediments also help to culture the in stream bacteria. Without clear
water, coupled with turbidity from sediment, sand, and organic matter, maximum die off cannot
occur, because of the interference of the natural sunlight(Bank et al, 1990).
Catchment C also provided the majority of supporting data during the non impacted
sample periods as well. The average unfiltered Fecal colonies per 100/mL was at 1845 colonies,
while filtering the count was at 1716 colonies. Without an active influx of sediments bacteria
were still present in an unattached form. But as mentioned earlier, with slightly turbid water, and
a well established stream bottom sediment layer the Fecal Bacteria have prime conditions to
reproduce and thrive.
The other Catchments did not provide as much as a definitive data to helping prove if the
in stream conditions would allow for sediments to be classified as a non point source for Fecal
Bacteria, with the exception of Catchment A. All of the other catchments were very similar in
the Fecal colony numbers that were sampled when comparing storm water impacted to non-
impacted. Catchment A, however acted a little different in the data the was collected. The non
impacted results average of 3600 filtered and 3700 unfiltered, were a stark increase from the
41
storm water impacted numbers average of 712 colonies and 1018 colonies, respectively. In the
case of these results, storm water acted almost as a dilutant to the Fecal Bacteria counts.
Catchment A is the largest flow catchment. With little Fecal impacts from direct urban
discharges into the storm water, it can be concluded that the Fecal Bacteria present during non
storm water events are already present in the streambed substrate.
With the exception of Catchments A and C, storm water impacted events versus non
storm water impacted events were relatively close in Fecal counts. Catchment A and C had the
larger influx of impacted storm water, yet, storm water Fecal levels were lower. Active
discharges of sediment do increase the Fecal counts of bacteria in the stream. As well, incoming
sediments provide a hospitable streambed substrate to reproduce in once they settle out.
Exhaustive efforts have been put in place in the Goose Creek watershed. Onsite septic
systems have been inspected, livestock have been removed from streams, enhanced stream
buffers have been enacted and still Fecal counts remain high in the streams. There is no
significant proof that any of the above items contribute Fecal Bacteria to the Goose Creek
Watershed after an exhaustive Fecal Bacteria assessment. The majority of the high Fecal counts
result from sediment influx, and sections of stream impacted by sediment deposition. The land
variations in the watershed are an important variable in contributing Fecal Bacteria to Goose
Creek. In areas with significant active construction, efforts need to be made to control as much
sediment as possible from entering the stream. The other areas where construction activity is
limited would benefit from stabilizing the watershed itself, through stream restoration and bank
stabilization. Any pattern of stream hydraulics that contribute or cause sediments to be stirred up
or added to the stream will cause elevated Fecal counts.
The next step in the process would be to sample and measure the Fecal counts of the
incoming suspended sediments and the streambed sediment substrate itself. Further in depth
septic system studies could be performed by sampling water discharge and sediments at the

42
outlet of their drain fields. Studying the sediments and Fecal counts of the groundwater recharge
to the Goose Creek Watershed could provide details to the effectiveness of septic systems in the
soil types of the watershed. As the Goose Creek Watershed continues to be developed enhanced
erosion control measures should be implemented to help remove Fecal Bacteria. The use of
enhanced erosion control measures, including the use of floculants, will help to retain the
sediment on site, instead of allowing permissable amounts to pass into the stream. The data has
clearly shown that these areas impacted by past, current and future sediments provide a very
hospitable area for the bacteria to reproduce within the stream. It can be concluded that these
incoming sediments act as a Fecal Bacteria source once they are part of the streambed substrate.

43
Appendix 1-Goose Creek and the Carolina Heelsplitter Current Range

44
Appendix 2-Baseline Fecal sampling locations.
45
Appendix 3-MY9 Confluence sampling Point
46
Appendix 4-Intensive Filtration Sampling Catchment

47
Appendix 6-Lab Chain of Custody

48
REFERENCES CITED
Alm, E.W., Burke, J. and Spain, A. Fecal Indicator Bacteria are abundant in wet sand at
freshwater beaches. Water Research, 2003. 37, 3978-3982.
Bank, H. and Schmehl, M. Bactericidal Effectiveness of Modulated UV Light. Applications of
Environmental Microbiology, 1990. 56(12):3888-3889.
Davies, C.M., Long, J.A., Donald, M, Ashbolt, N.J. Survival of Fecal Micoroorganisms in
Marine and Freshwater Sediments. Journal of Applies and Environmental Microbiology, 1995.
61, 1888-1896.
Fish, J.T. & Pettibone, G.W. Influence of freshwater Sediment on the Survival of E. Coli and
Salmonella as measured by three methods of enumeration. Letters in Applied Microbiology, 20,
277-281.
Haller, L., Amedegento, E., Pote, J., Wildi, W. Influence of Freshwater Sediment Characteristics
on Persistence of Fecal Indicator Bacteria. Water and Soil Pollution, 203, 217-227.
Howell, J.M., Coyne, M.S., Cornelius, P.L. Effects of Sediment Size and temperature on Fecal
Bacteria Mortality rates and the Fecal Coliforms Ratio, 1996. Journal of Environmental Quality,
25, 1216-1220.
Jolley, L.W., Pike, J.W., English, W.R., Hayes, J.C. Relationships Between land uses and
Indicator bacteria in a Reverie Environment. Proceedings of the 2008 South Carolina Water
Resources Conference. October 14-15th.
Buetow, D. & Price, J. Charlotte-Mecklenburg Storm Water Services
Quality Assurance Project Plan (QAPP). Mecklenburg County Water Quality Program Standard
Operating Procedure, 2007.
Kroening, D., Mecklenburg County Stormwater Services Staff. Goose Creek Watershed
Management Plan. October 2009.
Sediment McFeters, G.A. & Singh, A. Effects of aquatic environmental Stress on Enteric Bacteria, 1991.
The Journal of Applied bacteriology. 66, 559-569.
North Carolina Department of Environment and Natural Resources, 2000. Laws and Rules for
Sewage Treatment and Disposal Systems. Division of Environmental Health On-site wastewater
Section.
Oshiro, R.K. Method 1106.1: Enterococci in Water by Membrane Filtration Using membrane-
Enterococcus-Esculin Iron Agar (mE-EIA). U.S. Environmental Protection Agency Office of
Water. September 2002.
49
Schueler, T. Microbes and Urban Watersheds: Ways to Kill 'Em: The Practice of
Watershed Protection, 2000. Center for Watershed Protection. Ellicott City, MD. Pages 392-
400.
Sherer, B.M., Miner, J.R., Moore, J.A., Buckhouse, J.C. Indicator bacterial survival in stream
Sediments, 1992. Journal of Environmental Quality. 21, 591-595.
U.S. Fish and Wildlife Service. 1993. Endangered and Threatened Wildlife and Plants;
“Lasmigona decorata” (Carolina heelsplitter) determined to be an endangered species. Federal
Register 58(124): 34926-34932