Klamath-Trinity Joint Unified Secondary 2016-2017...
83
Klamath-Trinity Joint Unified Secondary 2016-2017 Main Report
-
Upload
vuongkhanh -
Category
Documents
-
view
216 -
download
0
Transcript of Klamath-Trinity Joint Unified Secondary 2016-2017...
Klamath-Trinity Joint Unified
Secondary
2016-2017
Main Report
This report was prepared by WestEd, a research, development, and service agency, in collaboration with Duerr Evaluation Resources, under contract from the California Department of Education Coordinated School Health and Safety Office. For contract information, contact:
Hilva Chan California Department of Education Coordinated School Health and Safety Office 1430 N Street Sacramento, CA 95814 [email protected]
Recommended citation: Klamath-Trinity Joint Unified School District. California Healthy Kids Survey, 2016-17: Main Report. San Francisco: WestEd Health & Human Development Program for the California Department of Education.
Date prepared: 9 Jun 2017 CDS code: 12629010000000
Contents
Page
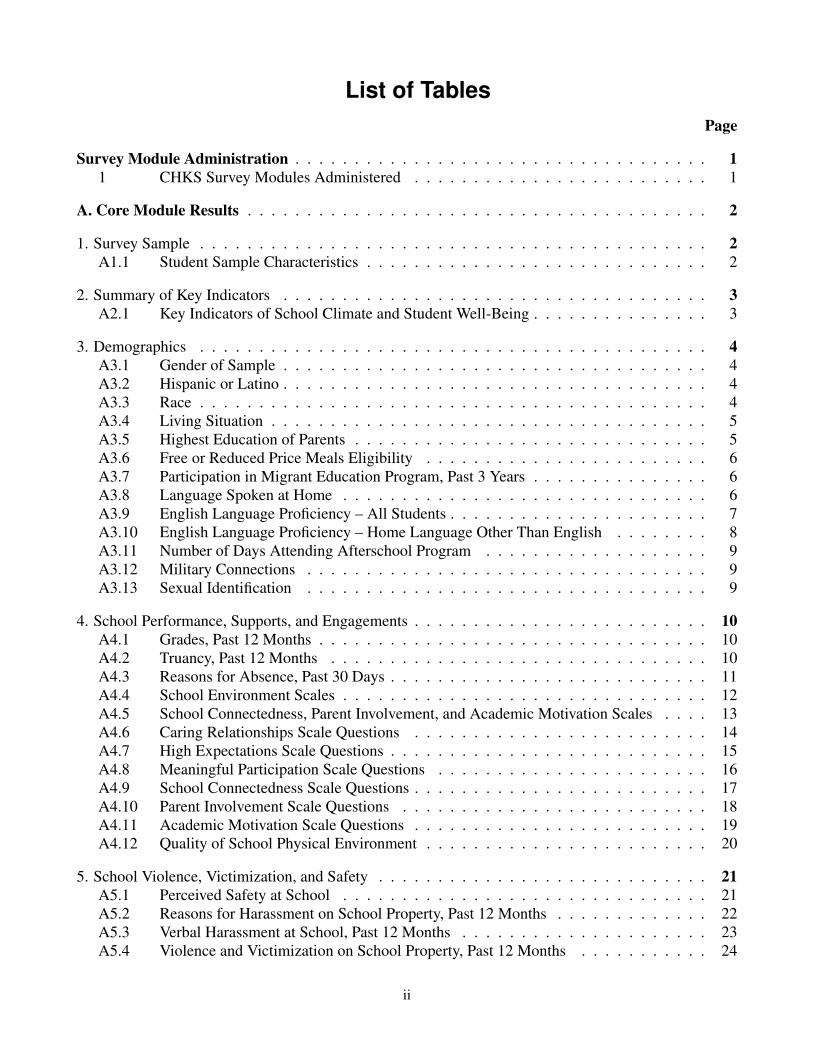
List of Tables . . . . . . . . . . . . . . . . . . . . . . . . . . . . . . . . . . . . . . . . . . . . . ii
PREFACE . . . . . . . . . . . . . . . . . . . . . . . . . . . . . . . . . . . . . . . . . . . . . . v
Survey Module Administration . . . . . . . . . . . . . . . . . . . . . . . . . . . . . . . . . . . 1
A. Core Module Results . . . . . . . . . . . . . . . . . . . . . . . . . . . . . . . . . . . . . . . 2 1. Survey Sample . . . . . . . . . . . . . . . . . . . . . . . . . . . . . . . . . . . . . . . . . 2 2. Summary of Key Indicators . . . . . . . . . . . . . . . . . . . . . . . . . . . . . . . . . . 3 3. Demographics . . . . . . . . . . . . . . . . . . . . . . . . . . . . . . . . . . . . . . . . . 4 4. School Performance, Supports, and Engagements . . . . . . . . . . . . . . . . . . . . . . . 10 5. School Violence, Victimization, and Safety . . . . . . . . . . . . . . . . . . . . . . . . . . 21 6. Alcohol and Other Drug Use . . . . . . . . . . . . . . . . . . . . . . . . . . . . . . . . . . 26 7. Tobacco Use . . . . . . . . . . . . . . . . . . . . . . . . . . . . . . . . . . . . . . . . . . 33 8. Other Physical and Mental Health Risks . . . . . . . . . . . . . . . . . . . . . . . . . . . . 38 9. Race/Ethnic Breakdowns . . . . . . . . . . . . . . . . . . . . . . . . . . . . . . . . . . . . 40 10. Gender Breakdowns . . . . . . . . . . . . . . . . . . . . . . . . . . . . . . . . . . . . . . 46
G. Drug Free Communities (DFC) Module . . . . . . . . . . . . . . . . . . . . . . . . . . . . 48 1. Module Sample . . . . . . . . . . . . . . . . . . . . . . . . . . . . . . . . . . . . . . . . . 48 2. Summary of Key Indicators . . . . . . . . . . . . . . . . . . . . . . . . . . . . . . . . . . 49 3. Alcohol, Tobacco, and Marijuana Consumption Patterns . . . . . . . . . . . . . . . . . . . 50 4. Supports to Reduce AOD Use . . . . . . . . . . . . . . . . . . . . . . . . . . . . . . . . . 53 5. Availability . . . . . . . . . . . . . . . . . . . . . . . . . . . . . . . . . . . . . . . . . . . 54 6. Influences on ATOD Use . . . . . . . . . . . . . . . . . . . . . . . . . . . . . . . . . . . . 55
Z. Klamath-Trinity Joint Unified Custom Questions . . . . . . . . . . . . . . . . . . . . . . . 59 1. Module Sample . . . . . . . . . . . . . . . . . . . . . . . . . . . . . . . . . . . . . . . . . 59 2. Custom Questions . . . . . . . . . . . . . . . . . . . . . . . . . . . . . . . . . . . . . . . 60
Appendix . . . . . . . . . . . . . . . . . . . . . . . . . . . . . . . . . . . . . . . . . . . . . . . 71
i
List of Tables Page
Survey Module Administration . . . . . . . . . . . . . . . . . . . . . . . . . . . . . . . . . . . 1 1 CHKS Survey Modules Administered . . . . . . . . . . . . . . . . . . . . . . . . . 1
A. Core Module Results . . . . . . . . . . . . . . . . . . . . . . . . . . . . . . . . . . . . . . . 2
1. Survey Sample . . . . . . . . . . . . . . . . . . . . . . . . . . . . . . . . . . . . . . . . . . . 2 A1.1 Student Sample Characteristics . . . . . . . . . . . . . . . . . . . . . . . . . . . . . 2
2. Summary of Key Indicators . . . . . . . . . . . . . . . . . . . . . . . . . . . . . . . . . . . . 3 A2.1 Key Indicators of School Climate and Student Well-Being . . . . . . . . . . . . . . . 3
3. Demographics . . . . . . . . . . . . . . . . . . . . . . . . . . . . . . . . . . . . . . . . . . . 4 A3.1 Gender of Sample . . . . . . . . . . . . . . . . . . . . . . . . . . . . . . . . . . . . 4 A3.2 Hispanic or Latino . . . . . . . . . . . . . . . . . . . . . . . . . . . . . . . . . . . . 4 A3.3 Race . . . . . . . . . . . . . . . . . . . . . . . . . . . . . . . . . . . . . . . . . . . 4 A3.4 Living Situation . . . . . . . . . . . . . . . . . . . . . . . . . . . . . . . . . . . . . 5 A3.5 Highest Education of Parents . . . . . . . . . . . . . . . . . . . . . . . . . . . . . . 5 A3.6 Free or Reduced Price Meals Eligibility . . . . . . . . . . . . . . . . . . . . . . . . 6 A3.7 Participation in Migrant Education Program, Past 3 Years . . . . . . . . . . . . . . . 6 A3.8 Language Spoken at Home . . . . . . . . . . . . . . . . . . . . . . . . . . . . . . . 6 A3.9 English Language Proficiency – All Students . . . . . . . . . . . . . . . . . . . . . . 7 A3.10 English Language Proficiency – Home Language Other Than English . . . . . . . . 8 A3.11 Number of Days Attending Afterschool Program . . . . . . . . . . . . . . . . . . . 9 A3.12 Military Connections . . . . . . . . . . . . . . . . . . . . . . . . . . . . . . . . . . 9 A3.13 Sexual Identification . . . . . . . . . . . . . . . . . . . . . . . . . . . . . . . . . . 9
4. School Performance, Supports, and Engagements . . . . . . . . . . . . . . . . . . . . . . . . . 10 A4.1 Grades, Past 12 Months . . . . . . . . . . . . . . . . . . . . . . . . . . . . . . . . . 10 A4.2 Truancy, Past 12 Months . . . . . . . . . . . . . . . . . . . . . . . . . . . . . . . . 10 A4.3 Reasons for Absence, Past 30 Days . . . . . . . . . . . . . . . . . . . . . . . . . . . 11 A4.4 School Environment Scales . . . . . . . . . . . . . . . . . . . . . . . . . . . . . . . 12 A4.5 School Connectedness, Parent Involvement, and Academic Motivation Scales . . . . 13 A4.6 Caring Relationships Scale Questions . . . . . . . . . . . . . . . . . . . . . . . . . 14 A4.7 High Expectations Scale Questions . . . . . . . . . . . . . . . . . . . . . . . . . . . 15 A4.8 Meaningful Participation Scale Questions . . . . . . . . . . . . . . . . . . . . . . . 16 A4.9 School Connectedness Scale Questions . . . . . . . . . . . . . . . . . . . . . . . . . 17 A4.10 Parent Involvement Scale Questions . . . . . . . . . . . . . . . . . . . . . . . . . . 18 A4.11 Academic Motivation Scale Questions . . . . . . . . . . . . . . . . . . . . . . . . . 19 A4.12 Quality of School Physical Environment . . . . . . . . . . . . . . . . . . . . . . . . 20
5. School Violence, Victimization, and Safety . . . . . . . . . . . . . . . . . . . . . . . . . . . . 21 A5.1 Perceived Safety at School . . . . . . . . . . . . . . . . . . . . . . . . . . . . . . . 21 A5.2 Reasons for Harassment on School Property, Past 12 Months . . . . . . . . . . . . . 22 A5.3 Verbal Harassment at School, Past 12 Months . . . . . . . . . . . . . . . . . . . . . 23 A5.4 Violence and Victimization on School Property, Past 12 Months . . . . . . . . . . . 24
ii
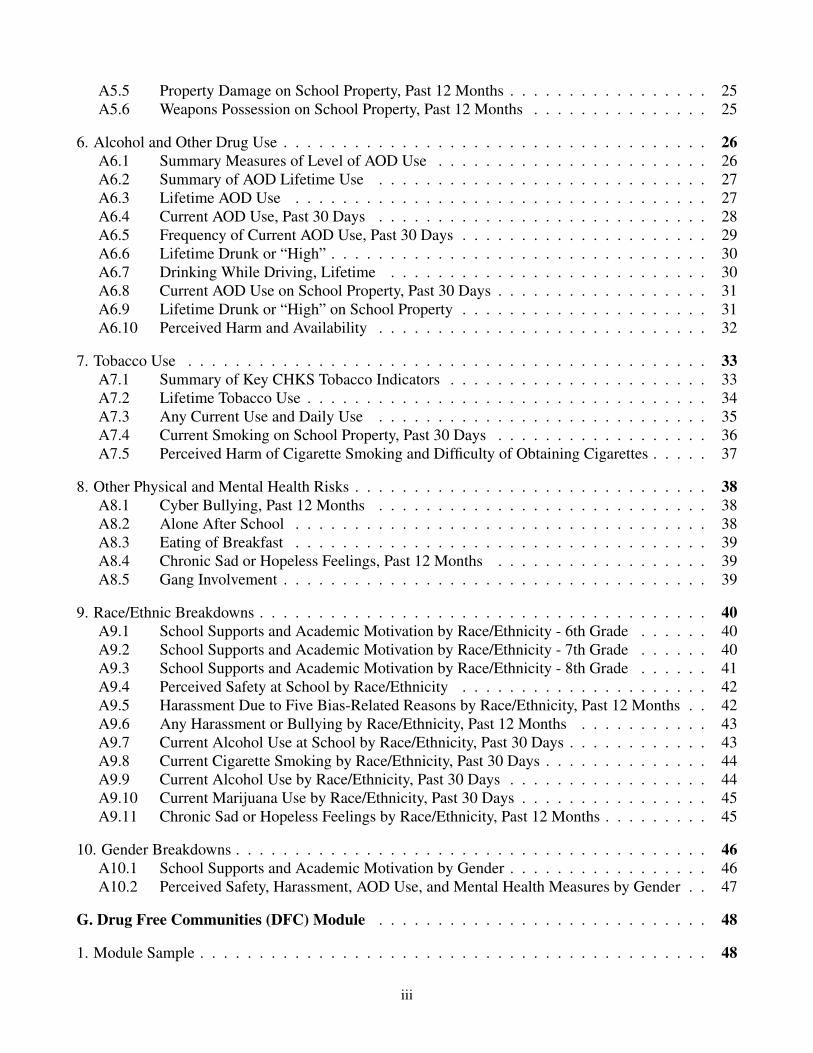
A5.5 Property Damage on School Property, Past 12 Months . . . . . . . . . . . . . . . . . 25 A5.6 Weapons Possession on School Property, Past 12 Months . . . . . . . . . . . . . . . 25
6. Alcohol and Other Drug Use . . . . . . . . . . . . . . . . . . . . . . . . . . . . . . . . . . . . 26 A6.1 Summary Measures of Level of AOD Use . . . . . . . . . . . . . . . . . . . . . . . 26 A6.2 Summary of AOD Lifetime Use . . . . . . . . . . . . . . . . . . . . . . . . . . . . 27 A6.3 Lifetime AOD Use . . . . . . . . . . . . . . . . . . . . . . . . . . . . . . . . . . . 27 A6.4 Current AOD Use, Past 30 Days . . . . . . . . . . . . . . . . . . . . . . . . . . . . 28 A6.5 Frequency of Current AOD Use, Past 30 Days . . . . . . . . . . . . . . . . . . . . . 29 A6.6 Lifetime Drunk or “High” . . . . . . . . . . . . . . . . . . . . . . . . . . . . . . . . 30 A6.7 Drinking While Driving, Lifetime . . . . . . . . . . . . . . . . . . . . . . . . . . . 30 A6.8 Current AOD Use on School Property, Past 30 Days . . . . . . . . . . . . . . . . . . 31 A6.9 Lifetime Drunk or “High” on School Property . . . . . . . . . . . . . . . . . . . . . 31 A6.10 Perceived Harm and Availability . . . . . . . . . . . . . . . . . . . . . . . . . . . . 32
7. Tobacco Use . . . . . . . . . . . . . . . . . . . . . . . . . . . . . . . . . . . . . . . . . . . . 33 A7.1 Summary of Key CHKS Tobacco Indicators . . . . . . . . . . . . . . . . . . . . . . 33 A7.2 Lifetime Tobacco Use . . . . . . . . . . . . . . . . . . . . . . . . . . . . . . . . . . 34 A7.3 Any Current Use and Daily Use . . . . . . . . . . . . . . . . . . . . . . . . . . . . 35 A7.4 Current Smoking on School Property, Past 30 Days . . . . . . . . . . . . . . . . . . 36 A7.5 Perceived Harm of Cigarette Smoking and Difficulty of Obtaining Cigarettes . . . . . 37
8. Other Physical and Mental Health Risks . . . . . . . . . . . . . . . . . . . . . . . . . . . . . . 38 A8.1 Cyber Bullying, Past 12 Months . . . . . . . . . . . . . . . . . . . . . . . . . . . . 38 A8.2 Alone After School . . . . . . . . . . . . . . . . . . . . . . . . . . . . . . . . . . . 38 A8.3 Eating of Breakfast . . . . . . . . . . . . . . . . . . . . . . . . . . . . . . . . . . . 39 A8.4 Chronic Sad or Hopeless Feelings, Past 12 Months . . . . . . . . . . . . . . . . . . 39 A8.5 Gang Involvement . . . . . . . . . . . . . . . . . . . . . . . . . . . . . . . . . . . . 39
9. Race/Ethnic Breakdowns . . . . . . . . . . . . . . . . . . . . . . . . . . . . . . . . . . . . . . 40 A9.1 School Supports and Academic Motivation by Race/Ethnicity - 6th Grade . . . . . . 40 A9.2 School Supports and Academic Motivation by Race/Ethnicity - 7th Grade . . . . . . 40 A9.3 School Supports and Academic Motivation by Race/Ethnicity - 8th Grade . . . . . . 41 A9.4 Perceived Safety at School by Race/Ethnicity . . . . . . . . . . . . . . . . . . . . . 42 A9.5 Harassment Due to Five Bias-Related Reasons by Race/Ethnicity, Past 12 Months . . 42 A9.6 Any Harassment or Bullying by Race/Ethnicity, Past 12 Months . . . . . . . . . . . 43 A9.7 Current Alcohol Use at School by Race/Ethnicity, Past 30 Days . . . . . . . . . . . . 43 A9.8 Current Cigarette Smoking by Race/Ethnicity, Past 30 Days . . . . . . . . . . . . . . 44 A9.9 Current Alcohol Use by Race/Ethnicity, Past 30 Days . . . . . . . . . . . . . . . . . 44 A9.10 Current Marijuana Use by Race/Ethnicity, Past 30 Days . . . . . . . . . . . . . . . . 45 A9.11 Chronic Sad or Hopeless Feelings by Race/Ethnicity, Past 12 Months . . . . . . . . . 45
10. Gender Breakdowns . . . . . . . . . . . . . . . . . . . . . . . . . . . . . . . . . . . . . . . . 46 A10.1 School Supports and Academic Motivation by Gender . . . . . . . . . . . . . . . . . 46 A10.2 Perceived Safety, Harassment, AOD Use, and Mental Health Measures by Gender . . 47
G. Drug Free Communities (DFC) Module . . . . . . . . . . . . . . . . . . . . . . . . . . . . 48
1. Module Sample . . . . . . . . . . . . . . . . . . . . . . . . . . . . . . . . . . . . . . . . . . . 48
iii

G1.1 Student Sample for DFC Module . . . . . . . . . . . . . . . . . . . . . . . . . . . . 48
2. Summary of Key Indicators . . . . . . . . . . . . . . . . . . . . . . . . . . . . . . . . . . . . 49 G2.1 Key Indicators of Alcohol and Other Drug Use . . . . . . . . . . . . . . . . . . . . . 49
3. Alcohol, Tobacco, and Marijuana Consumption Patterns . . . . . . . . . . . . . . . . . . . . . 50 G3.1 Age of Onset – AOD Use . . . . . . . . . . . . . . . . . . . . . . . . . . . . . . . . 50 G3.2 Age of Onset – Tobacco Use . . . . . . . . . . . . . . . . . . . . . . . . . . . . . . 51 G3.3 Prescription Drug Use, Past 30 Days . . . . . . . . . . . . . . . . . . . . . . . . . . 51 G3.4 Usual Alcohol Consumption Level . . . . . . . . . . . . . . . . . . . . . . . . . . . 52
4. Supports to Reduce AOD Use . . . . . . . . . . . . . . . . . . . . . . . . . . . . . . . . . . . 53 G4.1 Talked with Parent About ATOD Use . . . . . . . . . . . . . . . . . . . . . . . . . . 53
5. Availability . . . . . . . . . . . . . . . . . . . . . . . . . . . . . . . . . . . . . . . . . . . . . 54 G5.1 Sources for Obtaining Alcohol . . . . . . . . . . . . . . . . . . . . . . . . . . . . . 54
6. Influences on ATOD Use . . . . . . . . . . . . . . . . . . . . . . . . . . . . . . . . . . . . . . 55 G6.1 Personal Disapproval of AOD Use . . . . . . . . . . . . . . . . . . . . . . . . . . . 55 G6.2 Perceived Risks Associated with Prescription Drug Use . . . . . . . . . . . . . . . . 55 G6.3 Parent Disapproval of ATOD Use . . . . . . . . . . . . . . . . . . . . . . . . . . . . 56 G6.4 Peer Disapproval of ATOD Use . . . . . . . . . . . . . . . . . . . . . . . . . . . . . 57 G6.4 Peer Disapproval of ATOD Use - Continued . . . . . . . . . . . . . . . . . . . . . . 58 G6.5 Heard, Read, or Watched Any Anti-ATOD Messages, Past 12 Months . . . . . . . . 58
Z. Klamath-Trinity Joint Unified Custom Questions . . . . . . . . . . . . . . . . . . . . . . . 59
1. Module Sample . . . . . . . . . . . . . . . . . . . . . . . . . . . . . . . . . . . . . . . . . . . 59 Z1.1 Student Sample for Custom Questions . . . . . . . . . . . . . . . . . . . . . . . . . 59
2. Custom Questions . . . . . . . . . . . . . . . . . . . . . . . . . . . . . . . . . . . . . . . . . 60
Appendix . . . . . . . . . . . . . . . . . . . . . . . . . . . . . . . . . . . . . . . . . . . . . . . 71
iv

PREFACE
HYPERLINK FEATURE The digital version of this report has been hyperlinked. Click on the title of a section or a table in the List of Tables and you will be automatically directed to the actual content section or table in the report.
This report provides the detailed results for each question from this school/district’s 2016–17 California Healthy Kids Survey (CHKS), presented in tables organized by topic.
The CHKS, along with its two companion surveys–California School Staff Survey (CSSS) for staff and the California School Parent Survey (CSPS)–is a service of the California Department of Education (CDE). These three surveys form the California School Climate, Health, and Learning Surveys (Cal-SCHLS) System, the largest, most comprehensive effort in the nation to regularly assess students, staff, and parents at the local level to provide key data on school climate and safety, learning supports and barriers, and stakeholder engagement, as well as youth development, health, and well-being. Exhibit 1, at the end of the Preface, presents the major school-related domains and constructs assessed by Cal-SCHLS.
These surveys grew out of CDE’s commitment to helping schools promote the successful cognitive, social, emotional, and physical development of all students; create more positive, engaging school environments for students, staff, and parents; and ensure college and career readiness. They provide a wealth of information to guide school improvement and Local Control and Accountability Plan (LCAP) efforts, particularly in regard to the state priorities of enhancing school climate, pupil engagement, and parent involvement.
Factsheets, guidebooks, and other resources to help in understanding and using CHKS results are available for downloading from the survey website–chks.wested.org–including Helpful Resources for Local Control and Accountability Plans (chks.wested.org/resources/LCAP Cal SCHLS.pdf). The California Safe and Supportive Schools website also provides information and tools helpful in implementing effective strategies to address the needs identified by the survey.
The Cal-SCHLS Technical Assistance Center offers workshops to help identify local needs and develop action plans to meet those needs, including a Listening to Students Workshop for involving student voice in the process (see below).
THE SURVEY
The California Department of Education (CDE) has funded the CHKS since 1997 to provide data that would assist schools in: (1) fostering safe and supportive school climates, social-emotional competencies, and engagement in learning; (2) preventing youth health-risk behaviors and other barriers to academic achievement; and (3) promoting positive youth development, resilience, and well-being. A thorough understanding of the scope and nature of youth behaviors, attitudes, and learning conditions is essential to guide school improvement efforts, improve academic performance, and develop effective prevention, health, and youth development programs.
v

The CHKS is not just a standalone instrument but a data collection system that districts can customize to meet local needs and interests. The secondary-school CHKS consists of a required general Core Module and a series of optional, supplementary topic-focused modules that districts can elect to administer. Districts may also add their own questions of local interest in a custom module. Table 1 indicates the modules administered by the district/school.
Core Module
As outlined in Exhibit 1, the Core Module consists of key questions, identified by an expert advisory committee, that are considered most important for schools to guide improvement of academic, health, and prevention programs and promote student achievement, college and career readiness, positive development, and well-being. The great majority of the questions are school-specific, including the following indicators:
• Student grades, truancy, reasons for missing school, academic motivation, and school connectedness, as indicators of engagement;
• The levels of students’ three fundamental developmental supports (protective factors) that promote positive academic, social, and emotional outcomes: experiences of caring adult relationships, high expectations, and opportunities for meaningful participation at school;
• Perceived safety and the frequency and type of harassment and bullying at school; and
• Levels of violence, substance use, and crime-related behavior (e.g., weapons possession) at school.
Supplementary School Climate Module
To further support school improvement efforts and the LCAP process, a supplementary School Climate Module is available. It provides additional data on student academic mindset, school academic supports, discipline/order, supports for social-emotional learning, bullying prevention and positive peer relationships, respect for diversity, and the quality of the physical environment (download from chks.wested.org/ administer/download/supplemental/#clim). A companion Learning Conditions module can be added to the staff survey to compare their perceptions on the same constructs.
Supplementary Social Emotional Health Module (SEHM)
The SEHM greatly enhances the value of the CHKS as a strength-based assessment of positive emotions, engagement, ability to build and maintain relationships, and other social-emotional capacities linked to student mental health and well-being, academic success, and college and career readiness. It includes 46 items that capture the totality of core adolescent psychological assets.
SURVEY ADMINISTRATION AND SAMPLING
School staff administered the survey, following detailed instructions provided by CDE that were designed to assure the protection of all student and parental rights to privacy and to maintain confidentiality. Students were surveyed only with the consent of parents or guardians. Each student’s participation was voluntary, anonymous, and confidential. Table A1.1 gives the target sample of students and the final number and percent of students who completed the survey (the participation response rate).
vi
THE REPORT
The tables in the Main Report, organized by topic, provide the percentages responding to each question response option by grade level. Because it is just as important to identify the positive behaviors of youth as it is to identify the risks they face, the tables reporting risk-behavior data include the percentages of youth who responded negatively (did not engage in the behavior).
Racial/Ethnic and Gender Results
The demographic questions on the CHKS help districts meet the LCAP requirement to identify and address variations in state priorities among significant student subgroups, including differences by race/ethnicity, gender, socioeconomic status; homeless, migrant, and foster youth; and English language learners. In this report, summary tables provide key findings (e.g., safety, harassment, developmental supports, school connectedness) disaggregated by race/ethnic categories and gender. Schools can request supplementary reports disaggregating all their CHKS results by the race/ethnicity or gender of students or by other demographic categories.
UNDERSTANDING THE DATA
Care must be taken to understand the factors that can impact the quality, validity, and generalizability of the results, such as changes that occur in survey content, administration, and/or sample characteristics between administrations. The following are a few of the key issues that should be kept in mind. A more detailed discussion of these topics can be found in the CHKS Guidebook to Data Use and Dissemination (download chks.wested.org/resources/chks guidebook 3 datause.pdf).
Sample Characteristics
Among the most important factors affecting the quality of survey results is the level and type of student participation. The validity and representativeness of the results will be adversely affected if the student response rate is lower than 70%. One indication of the survey’s representativeness is how accurately the sample reflects the gender and ethnic composition of the student enrollment. Even if the response rate is low, the results provide an indication of what those students who did respond felt about the school and their experiences and behavior.
Changes Between Survey Administrations
Many factors besides real changes in behavior, attitudes, or experiences among students may account for changes in results from administration to administration. Changes may be due to differences over time in the characteristics or size of the sample of students who completed the survey, changes in the questions themselves, or differences between time periods in which the survey was administered (e.g., some risk behaviors tend to increase as students age, or may increase during holidays or social events).
RESOURCES
The CHKS and Cal-SCHLS websites contain guidebooks and other tools for using and understanding survey results, including factsheets that show how data variables are related and offer suggestions for how data can be analyzed at the local level.
vii
CDE’s California Safe and Supportive Schools website (CaliforniaS3.wested.org) contains a wealth of information and tools related to school climate improvement and social-emotional learning. It includes factsheets analyzing Cal-SCHLS data and What Works Briefs that provide guidance on strategies to implement.
The School Climate Connection Newsletter provides monthly announcements of resources, tools, webinars and workshops, and research. Sign up on the CHKS or CaliforniaS3 websites.
Among the tools available to help in understanding and using the survey results, especially for LCAP implementation and monitoring, Making Sense of School Climate provides a discussion of all the Cal-SCHLS survey items that relate to school climate (download californias3.wested.org/resources/S3 school climateguidebook final.pdf)
Helpful Resources for Local Control and Accountability Plans (chks.wested.org/resources/LCAP Cal SCHLS.pdf) describes how survey items align with LCAP priorities and indicators. Also available is an LCAP-related PowerPoint presentation (chks.wested.org/training-support/workshops-presentations).
NEXT STEPS
Receiving this report is just a beginning step in a data-driven decision-making process. The results of this student survey should be compared to those obtained from the Cal-SCHLS surveys of school staff and parents. It is important to determine how consistent are student, staff, and parent perceptions and experiences.
CHKS results will also be enriched if analyzed in the context of other data typically collected by schools that relate to the variables assessed, such as discipline referrals, school demographic information, school vandalism costs, and behavioral observations in classrooms.
The following custom services (additional fees apply) are available through the Cal-SCHLS TA Center to help in fostering effective use of the results to support school and program improvement efforts and the LCAP process.
Request School Reports
If the schools in the district vary significantly in demographics, programs, or other characteristics, consider requesting individual reports for each school (a fee applies). Two types of reports are available:
• A full report with all the survey results.
• A short, user-friendly, graphic School Climate Report Card that provides results across eight domains of school climate and provides an overall School Climate Index score based on those domains. (View a sample report: visit californias3.wested.org/resources/California State SCRC 1314.pdf).
Request District School Climate Report Card
For districts that survey all their schools, a district-level School Climate Report Card can be requested. This is a powerful, useful tool for guiding efforts to meet the school climate and pupil engagement priorities for the Local Control and Accountability Plan.
viii
Request Disaggregated Reports
The staff of the Regional TA Centers can produce full reports that look at how results vary by demographic subgroups (e.g., race/ethnicity as discussed above, or by youth who are low in academic motivation compared those who are high). This is particularly important given the LCAP requirement that districts identify and address the needs of underserved subgroups.
Conduct Additional Analyses of Dataset
The complete dataset is available electronically for additional analysis (there is a small fee for preparation). The dataset enables analyses of patterns in the results, how they are interrelated, and how they vary by different subgroups of student and across schools within a district. You can also request an analysis by subgroups as a custom service.
Add Questions to Your Next Surveys
Determine what additional information is needed from students to guide school improvement efforts and add questions to your next CHKS or CSSS. Both surveys were designed so that schools can add additional questions to help them conduct a more individualized and comprehensive assessment.
Engage Students, Staff, and Parents in an Action Planning Process
Engage students, staff, and parents in reviewing and exploring the meaning of the results and obtain their input into how the school might better meet the identified needs and into the development of a detailed action plan. This communicates to stakeholders that you value their input into how to improve the school and gives them an opportunity for meaningful participation. This helps enhance pupil engagement and parent involvement, two LCAP priorities. It will also promote higher rates of participation the next time the survey is administered, as stakeholders will see how the data has been used for positive purposes.
On request, Cal-SCHLS staff can conduct a structured Listening to Students Workshop designed to explore with students, as staff observe, the meaning of survey results and obtain their input on how to address the needs identified by the survey. Cal-SCHLS staff also can conduct a Data Use Action Planning Workshop designed to identify local needs based on the survey results and engage adult stakeholders in developing a detailed plan and timetable for meeting those needs using evidence-based strategies. For more information, contact your Cal-SCHLS Technical Assistance Center (call 888.841.7536 or email [email protected]). See also: californias3.wested.org/training-support/workshops.
ix
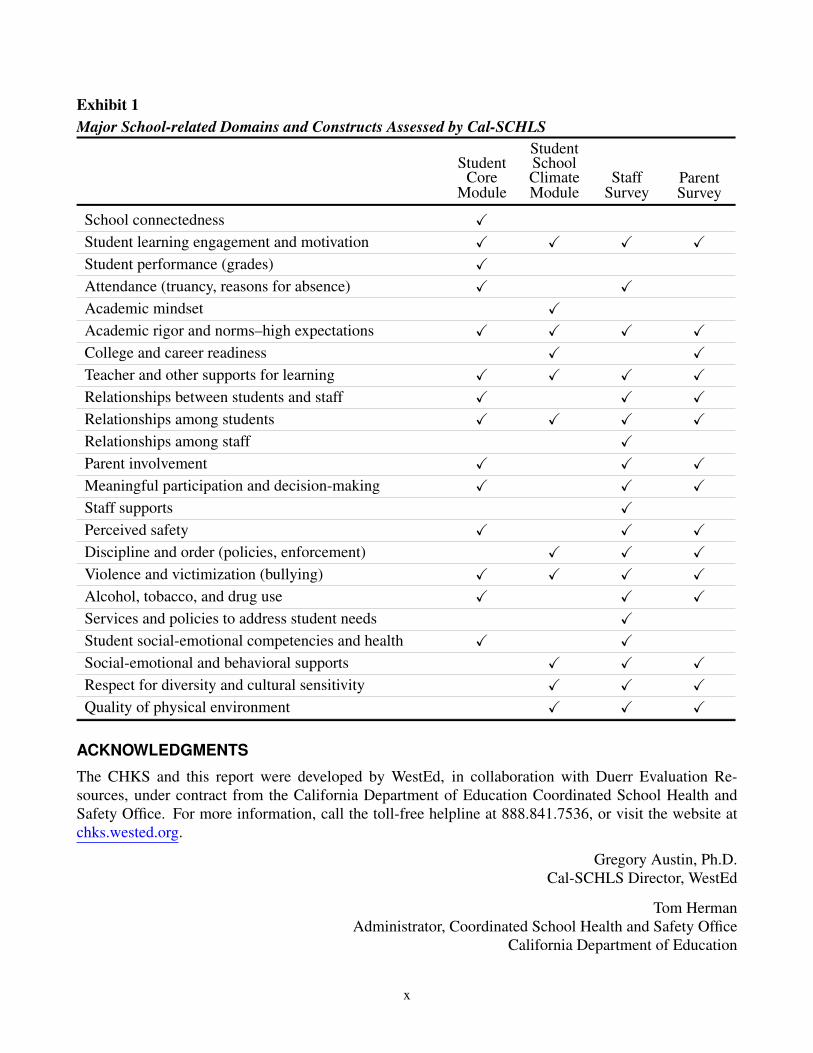
Exhibit 1 Major School-related Domains and Constructs Assessed by Cal-SCHLS
Student Student School
Core Climate Staff Parent Module Module Survey Survey
School connectedness , Student learning engagement and motivation , , , , Student performance (grades) , Attendance (truancy, reasons for absence) , , Academic mindset , Academic rigor and norms–high expectations , , , , College and career readiness , , Teacher and other supports for learning , , , , Relationships between students and staff , , , Relationships among students , , , , Relationships among staff , Parent involvement , , , Meaningful participation and decision-making , , , Staff supports , Perceived safety , , , Discipline and order (policies, enforcement) , , , Violence and victimization (bullying) , , , , Alcohol, tobacco, and drug use , , , Services and policies to address student needs , Student social-emotional competencies and health , , Social-emotional and behavioral supports , , , Respect for diversity and cultural sensitivity , , , Quality of physical environment , , ,
ACKNOWLEDGMENTS
The CHKS and this report were developed by WestEd, in collaboration with Duerr Evaluation Resources, under contract from the California Department of Education Coordinated School Health and Safety Office. For more information, call the toll-free helpline at 888.841.7536, or visit the website at chks.wested.org.
Gregory Austin, Ph.D. Cal-SCHLS Director, WestEd
Tom Herman Administrator, Coordinated School Health and Safety Office
California Department of Education
x

Survey Module Administration
Table 1 CHKS Survey Modules Administered Survey Module Administered
A. Core (Required) X
B. Alcohol and Other Drugs (AOD) Module
C. Building Healthy Communities (BHC) Module
D. Cal-Well Module
E. Closing the Achievement Gap (CTAG) Module
F. District Afterschool Module (DASM)
G. Drug Free Communities (DFC) Module X
H. Gang Risk Awareness Module
I. Gender & Sex-Based Harassment Module
J. Military Connected School Module
K. Physical Health & Nutrition Module
L. Resilience & Youth Development Module
M. Safety & Violence Module
N. School Climate Module
O. Sexual Behavior Module
P. Social Emotional Health Module
Q. Tobacco Module
Z. Custom Questions X
Klamath-Trinity Joint Unified Page 1 2016-17 Main Report - Module A: Core
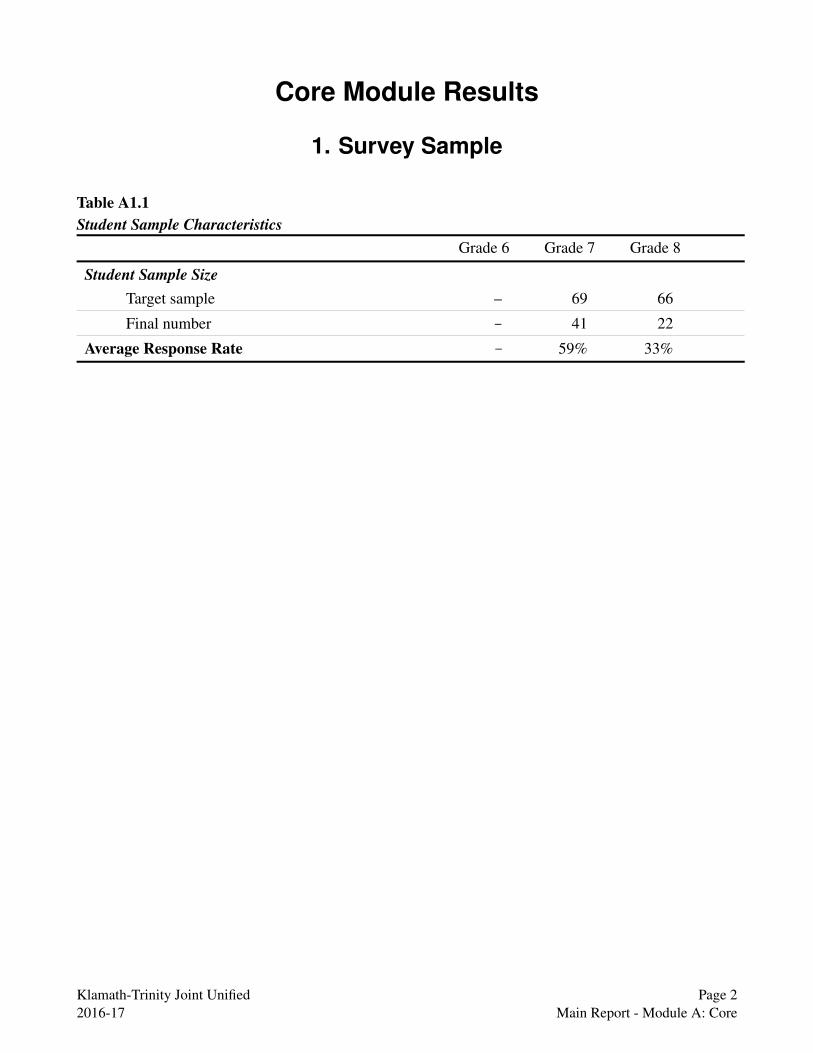
Core Module Results
1. Survey Sample
Table A1.1 Student Sample Characteristics
Student Sample Size Target sample
Final number
Average Response Rate
Grade 6
–
–
–
Grade 7
69
41
59%
Grade 8
66
22
33%
Klamath-Trinity Joint Unified Page 2 2016-17 Main Report - Module A: Core

2. Summary of Key Indicators
Table A2.1 Key Indicators of School Climate and Student Well-Being
Grade 6 %
Grade 7 %
Grade 8 %
Table
School Engagement and Supports School connectedness (high) – 33 20 A4.5
Academic motivation (high) – 23 10 A4.5
Truant more than a few times† – 20 5 A4.2
Caring adult relationships (high) – 23 20 A4.4
High expectations (high) – 36 20 A4.4
Meaningful participation (high) – 10 10 A4.4
School Safety and Substance Use School perceived as very safe or safe – 43 37 A5.1
Experienced any harassment or bullying† – 46 45 A5.2
Had mean rumors or lies spread about you† – 50 55 A5.3
Been afraid of being beaten up† – 23 20 A5.4
Been in a physical fight† – 41 21 A5.4
Seen a weapon on campus† – 33 20 A5.6
Been drunk or “high” on drugs at school, ever – 13 20 A6.9
Mental and Physical Health Current alcohol or drug use‡ – 18 25 A6.4
Current binge drinking‡ – 5 11 A6.4
Very drunk or “high” 7 or more times – 8 25 A6.6
Current cigarette smoking‡ – 5 10 A7.3
Current electronic cigarette use‡ – 8 15 A7.3
Experienced chronic sadness/hopelessness† – 32 26 A8.4
Notes: Cells are empty if there are less than 10 respondents. †Past 12 months; ‡Past 30 days.
Klamath-Trinity Joint Unified Page 3 2016-17 Main Report - Module A: Core
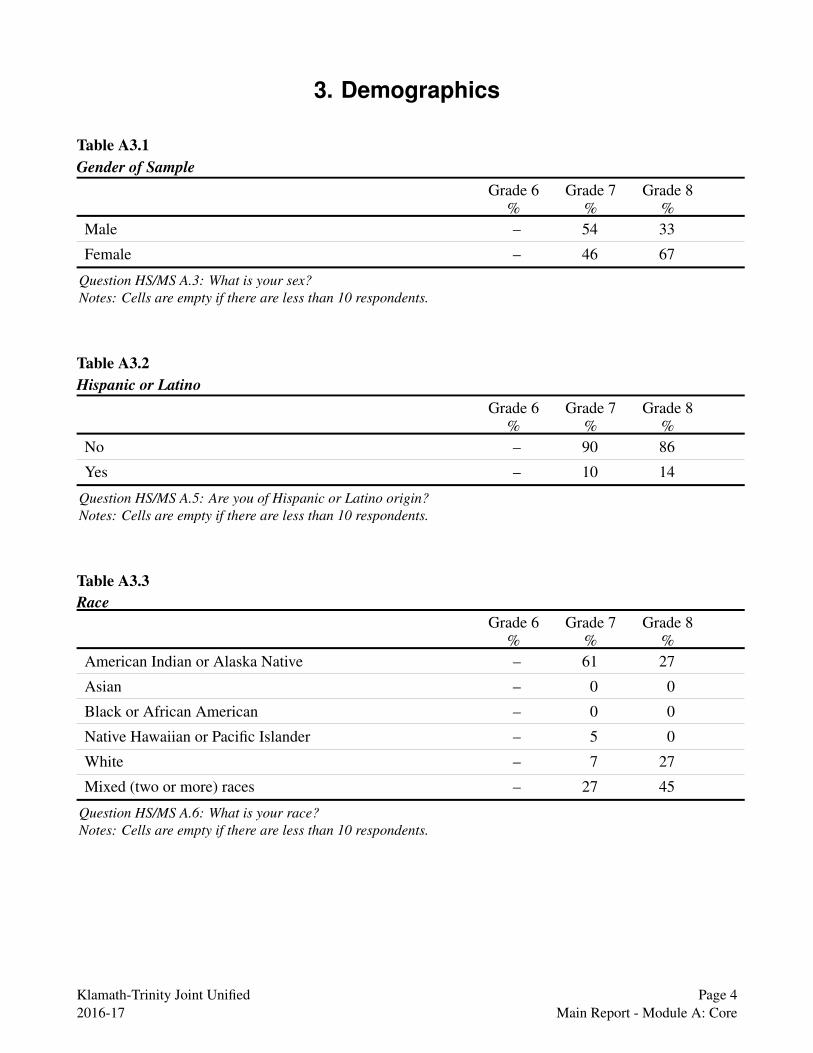
3. Demographics
Table A3.1 Gender of Sample
Grade 6 Grade 7 Grade 8 % % %
Male – 54 33
Female – 46 67
Question HS/MS A.3: What is your sex? Notes: Cells are empty if there are less than 10 respondents.
Table A3.2 Hispanic or Latino
Grade 6 Grade 7 Grade 8 % % %
No – 90 86
Yes – 10 14
Question HS/MS A.5: Are you of Hispanic or Latino origin? Notes: Cells are empty if there are less than 10 respondents.
Table A3.3 Race
Grade 6 Grade 7 Grade 8 % % %
American Indian or Alaska Native – 61 27
Asian – 0 0
Black or African American – 0 0
Native Hawaiian or Pacific Islander – 5 0
White – 7 27
Mixed (two or more) races – 27 45
Question HS/MS A.6: What is your race? Notes: Cells are empty if there are less than 10 respondents.
Klamath-Trinity Joint Unified Page 4 2016-17 Main Report - Module A: Core

Table A3.4 Living Situation
Grade 6 Grade 7 Grade 8 % % %
A home with one or more parents or guardian – 83 67
Other relative’s home – 10 10
A home with more than one family – 2 10
Friend’s home – 0 0
Foster home, group care, or waiting placement – 2 10
Hotel or motel – 2 0
Shelter, car, campground, or other transitional or temporary housing – 0 0
Other living arrangement – 0 5
Question HS/MS A.8: What best describes where you live? A home includes a house, apartment, trailer, or mobile home. Notes: Cells are empty if there are less than 10 respondents.
Table A3.5 Highest Education of Parents
Grade 6 Grade 7 Grade 8 % % %
Did not finish high school – 5 0
Graduated from high school – 15 14
Attended college but did not complete four-year degree – 10 29
Graduated from college – 37 29
Don’t know – 34 29
Question HS/MS A.9: What is the highest level of education your parents or guardians completed? (Mark the educational level of the parent or guardian who went the furthest in school.) Notes: Cells are empty if there are less than 10 respondents.
Klamath-Trinity Joint Unified Page 5 2016-17 Main Report - Module A: Core

Table A3.6 Free or Reduced Price Meals Eligibility
Grade 6 Grade 7 Grade 8 % % %
No – 13 5
Yes – 60 95
Don’t know – 28 0
Question HS/MS A.10: Do you receive free or reduced-price lunches at school? (Receiving free or reduced-price lunches means that lunch at school is provided to you for free or you pay less for it.) Note: Cells are empty if there are less than 10 respondents.
Table A3.7 Participation in Migrant Education Program, Past 3 Years
Grade 6 Grade 7 Grade 8 % % %
No – 48 75
Yes – 8 0
Don’t know – 45 25
Question HS/MS A.11: In the past three years, were you part of the Migrant Education Program or did your family move to find seasonal or temporary work in agriculture or fishing? Note: Cells are empty if there are less than 10 respondents.
Table A3.8 Language Spoken at Home
Grade 6 Grade 7 Grade 8 % % %
English – 95 95
Spanish – 0 0
Mandarin – 0 0
Cantonese – 0 0
Taiwanese – 0 0
Tagalog – 0 0
Vietnamese – 0 0
Korean – 3 0
Other – 3 5
Question HS/MS A.12: What language is spoken most of the time in your home? Note: Cells are empty if there are less than 10 respondents.
Klamath-Trinity Joint Unified Page 6 2016-17 Main Report - Module A: Core

Table A3.9 English Language Proficiency – All Students
Grade 6 Grade 7 Grade 8 mean/% mean/% mean/%
English Language Proficiency Average Scale Score – 3.76 3.85
How well do you... understand English?
Very well – 87 90
Well – 11 10
Not well – 0 0
Not at all – 3 0
speak English? Very well – 87 85
Well – 8 15
Not well – 3 0
Not at all – 3 0
read English? Very well – 84 80
Well – 11 20
Not well – 3 0
Not at all – 3 0
write English? Very well – 77 85
Well – 18 15
Not well – 3 0
Not at all – 3 0
English Language Proficiency Status Proficient – 79 85
Not proficient – 21 15
Question HS/MS A.13-16: How well do you understand, speak, read, and write English?... Understand English... Speak English... Read English... Write English. Notes: Cells are empty if there are less than 10 respondents.
Klamath-Trinity Joint Unified Page 7 2016-17 Main Report - Module A: Core

Table A3.10 English Language Proficiency – Students Speaking a Language Other Than English at Home
Grade 6 Grade 7 Grade 8 mean/% mean/% mean/%
English Language Proficiency Average Scale Score –
How well do you... understand English?
Very well –
Well –
Not well –
Not at all –
speak English? Very well –
Well –
Not well –
Not at all –
read English? Very well –
Well –
Not well –
Not at all –
write English? Very well –
Well –
Not well –
Not at all –
English Language Proficiency Status Proficient –
Not proficient –
Question HS/MS A.12-16: What language is spoken most of the time in your home?... How well do you understand, speak, read, and write English?... Understand English... Speak English... Read English... Write English. Notes: Cells are empty if there are less than 10 respondents.
Klamath-Trinity Joint Unified Page 8 2016-17 Main Report - Module A: Core
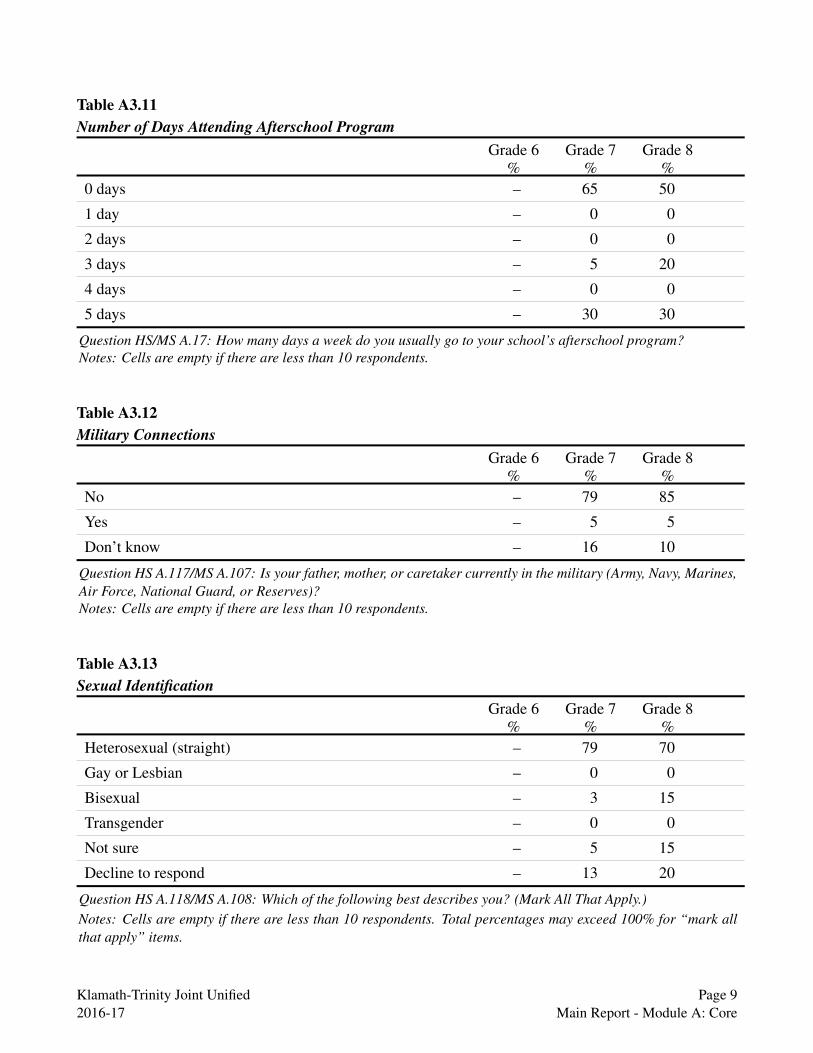
Table A3.11 Number of Days Attending Afterschool Program
Grade 6 Grade 7 Grade 8 % % %
0 days – 65 50
1 day – 0 0
2 days – 0 0
3 days – 5 20
4 days – 0 0
5 days – 30 30
Question HS/MS A.17: How many days a week do you usually go to your school’s afterschool program? Notes: Cells are empty if there are less than 10 respondents.
Table A3.12 Military Connections
Grade 6 Grade 7 Grade 8 % % %
No – 79 85
Yes – 5 5
Don’t know – 16 10
Question HS A.117/MS A.107: Is your father, mother, or caretaker currently in the military (Army, Navy, Marines, Air Force, National Guard, or Reserves)? Notes: Cells are empty if there are less than 10 respondents.
Table A3.13 Sexual Identification
Grade 6 Grade 7 Grade 8 % % %
Heterosexual (straight) – 79 70
Gay or Lesbian – 0 0
Bisexual – 3 15
Transgender – 0 0
Not sure – 5 15
Decline to respond – 13 20
Question HS A.118/MS A.108: Which of the following best describes you? (Mark All That Apply.) Notes: Cells are empty if there are less than 10 respondents. Total percentages may exceed 100% for “mark all that apply” items.
Klamath-Trinity Joint Unified Page 9 2016-17 Main Report - Module A: Core

4. School Performance, Supports, and Engagements
Table A4.1 Grades, Past 12 Months
Grade 6 Grade 7 Grade 8 % % %
Mostly A’s – 21 15
A’s and B’s – 36 40
Mostly B’s – 5 5
B’s and C’s – 21 30
Mostly C’s – 5 0
C’s and D’s – 10 5
Mostly D’s – 0 0
Mostly F’s – 3 5
Question HS/MS A.18: During the past 12 months, how would you describe the grades you mostly received in school? Notes: Cells are empty if there are less than 10 respondents.
Table A4.2 Truancy, Past 12 Months
Grade 6 Grade 7 Grade 8 % % %
0 times – 45 65
1-2 times – 20 10
A few times – 15 20
Once a month – 3 0
Once a week – 3 0
More than once a week – 15 5
Question HS/MS A.19: During the past 12 months, about how many times did you skip school or cut classes? Notes: Cells are empty if there are less than 10 respondents.
Klamath-Trinity Joint Unified Page 10 2016-17 Main Report - Module A: Core

Table A4.3 Reasons for Absence, Past 30 Days
Grade 6 Grade 7 Grade 8 % % %
Does not apply, I didn’t miss any school – 33 20
Illness (feeling physically sick), including problems with breathing or your teeth – 28 50
Felt very sad, hopeless, anxious, stressed, or angry – 10 15
Didn’t get enough sleep – 15 25
Didn’t feel safe at school – 13 0
Had to work – 5 10
Had to take care of or help a family member or friend – 5 15
Wanted to spend time with friends who don’t go to your school – 0 10
Wanted to use alcohol or drugs – 0 0
Were behind in schoolwork or weren’t prepared for a test or class assignment – 3 5
Were bored with or uninterested in school – 8 0
Were suspended – 20 15
Other reason – 28 20
Question HS/MS A.20: In the past 30 days, did you miss school for any of the following reasons? (Mark All That Apply.) Notes: Cells are empty if there are less than 10 respondents. Total percentages may exceed 100% for “mark all that apply” items.
Klamath-Trinity Joint Unified Page 11 2016-17 Main Report - Module A: Core
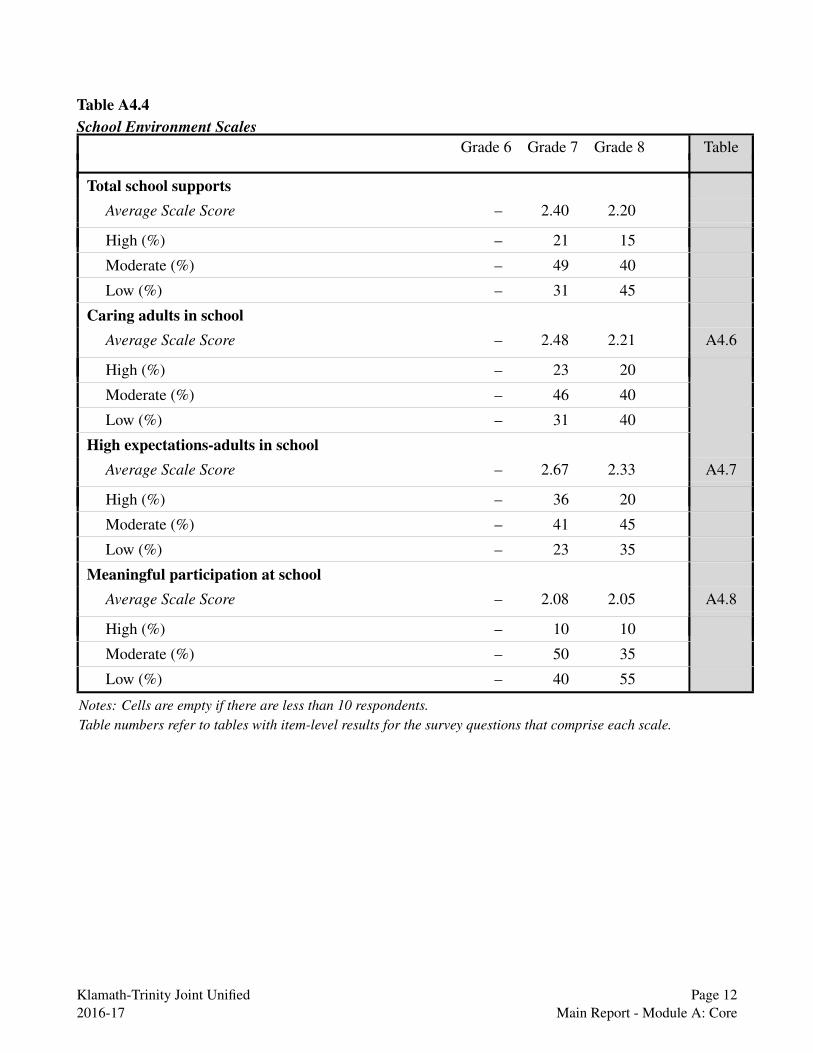
Table A4.4 School Environment Scales
Grade 6 Grade 7 Grade 8 Table
Total school supports Average Scale Score – 2.40 2.20
High (%) – 21 15
Moderate (%) – 49 40
Low (%) – 31 45
Caring adults in school Average Scale Score – 2.48 2.21 A4.6
High (%) – 23 20
Moderate (%) – 46 40
Low (%) – 31 40
High expectations-adults in school Average Scale Score – 2.67 2.33 A4.7
High (%) – 36 20
Moderate (%) – 41 45
Low (%) – 23 35
Meaningful participation at school Average Scale Score – 2.08 2.05 A4.8
High (%) – 10 10
Moderate (%) – 50 35
Low (%) – 40 55
Notes: Cells are empty if there are less than 10 respondents. Table numbers refer to tables with item-level results for the survey questions that comprise each scale.
Klamath-Trinity Joint Unified Page 12 2016-17 Main Report - Module A: Core

Table A4.5 School Connectedness, Parent Involvement, and Academic Motivation Scales
Grade 6 Grade 7 Grade 8 Table
School Connectedness Average Scale Score – 3.14 3.07 A4.9
High (%) – 33 20
Moderate (%) – 48 60
Low (%) – 20 20
Parent Involvement in School Average Scale Score – 3.16 2.90 A4.10
High (%) – 33 5
Moderate (%) – 35 55
Low (%) – 33 40
Academic Motivation Average Scale Score – 3.54 3.30 A4.11
High (%) – 23 10
Moderate (%) – 45 45
Low (%) – 33 45
Notes: Cells are empty if there are less than 10 respondents. Table numbers refer to tables with item-level results for the survey questions that comprise each scale.
Klamath-Trinity Joint Unified Page 13 2016-17 Main Report - Module A: Core

Table A4.6 Caring Relationships Scale Questions
Grade 6 Grade 7 Grade 8 mean/% mean/% mean/%
Caring adults in school Average Scale Score – 2.48 2.21
At my school, there is a teacher or some other adult... who really cares about me.
Not at all true – 15 20
A little true – 41 45
Pretty much true – 18 20
Very much true – 26 15
who notices when I’m not there. Not at all true – 21 37
A little true – 31 32
Pretty much true – 15 11
Very much true – 33 21
who listens to me when I have something to say. Not at all true – 26 40
A little true – 38 25
Pretty much true – 18 20
Very much true – 18 15
Question HS/MS A.34, 36, 38: At my school, there is a teacher or some other adult... who really cares about me... who notices when I am not there... who listens to me when I have something to say. Notes: Cells are empty if there are less than 10 respondents.
Klamath-Trinity Joint Unified Page 14 2016-17 Main Report - Module A: Core
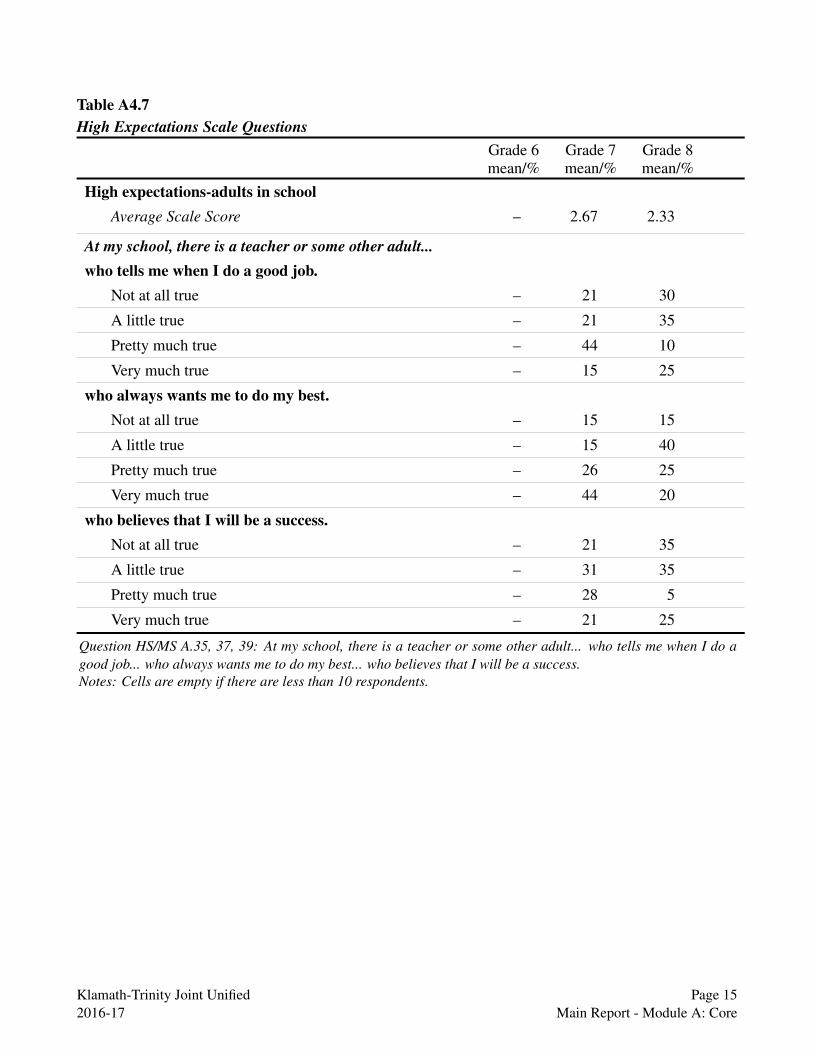
Table A4.7 High Expectations Scale Questions
Grade 6 Grade 7 Grade 8 mean/% mean/% mean/%
High expectations-adults in school Average Scale Score – 2.67 2.33
At my school, there is a teacher or some other adult... who tells me when I do a good job.
Not at all true – 21 30
A little true – 21 35
Pretty much true – 44 10
Very much true – 15 25
who always wants me to do my best. Not at all true – 15 15
A little true – 15 40
Pretty much true – 26 25
Very much true – 44 20
who believes that I will be a success. Not at all true – 21 35
A little true – 31 35
Pretty much true – 28 5
Very much true – 21 25
Question HS/MS A.35, 37, 39: At my school, there is a teacher or some other adult... who tells me when I do a good job... who always wants me to do my best... who believes that I will be a success. Notes: Cells are empty if there are less than 10 respondents.
Klamath-Trinity Joint Unified Page 15 2016-17 Main Report - Module A: Core

Table A4.8 Meaningful Participation Scale Questions
Grade 6 Grade 7 Grade 8 mean/% mean/% mean/%
Meaningful participation at school Average Scale Score – 2.08 2.05
At school... I do interesting activities.
Not at all true – 18 10
A little true – 33 40
Pretty much true – 25 25
Very much true – 25 25
I help decide things like class activities or rules. Not at all true – 50 65
A little true – 28 15
Pretty much true – 13 10
Very much true – 10 10
I do things that make a difference. Not at all true – 53 40
A little true – 25 45
Pretty much true – 10 5
Very much true – 13 10
Question HS/MS A.40-42: At school... I do interesting activities... I help decide things like class activities or rules... I do things that make a difference. Notes: Cells are empty if there are less than 10 respondents.
Klamath-Trinity Joint Unified Page 16 2016-17 Main Report - Module A: Core

Table A4.9 School Connectedness Scale Questions
Grade 6 Grade 7 Grade 8 mean/% mean/% mean/%
School Connectedness Average Scale Score – 3.14 3.07
I feel close to people at this school. Strongly disagree – 8 5 Disagree – 3 5 Neither disagree nor agree – 30 40 Agree – 38 30 Strongly agree – 23 20
I am happy to be at this school. Strongly disagree – 18 26 Disagree – 13 16 Neither disagree nor agree – 28 47 Agree – 30 5 Strongly agree – 13 5
I feel like I am part of this school. Strongly disagree – 13 21 Disagree – 16 11 Neither disagree nor agree – 18 47 Agree – 47 11 Strongly agree – 5 11
The teachers at this school treat students fairly. Strongly disagree – 18 26 Disagree – 20 5 Neither disagree nor agree – 33 26 Agree – 18 26 Strongly agree – 13 16
I feel safe in my school. Strongly disagree – 18 11 Disagree – 8 0 Neither disagree nor agree – 44 37 Agree – 23 37 Strongly agree – 8 16
Question HS/MS A.21-25: How strongly do you agree or disagree with the following statements?... I feel close to people at this school... I am happy to be at this school... I feel like I am part of this school... The teachers at this school treat students fairly... I feel safe in my school. Note: Cells are empty if there are less than 10 respondents.
Klamath-Trinity Joint Unified Page 17 2016-17 Main Report - Module A: Core
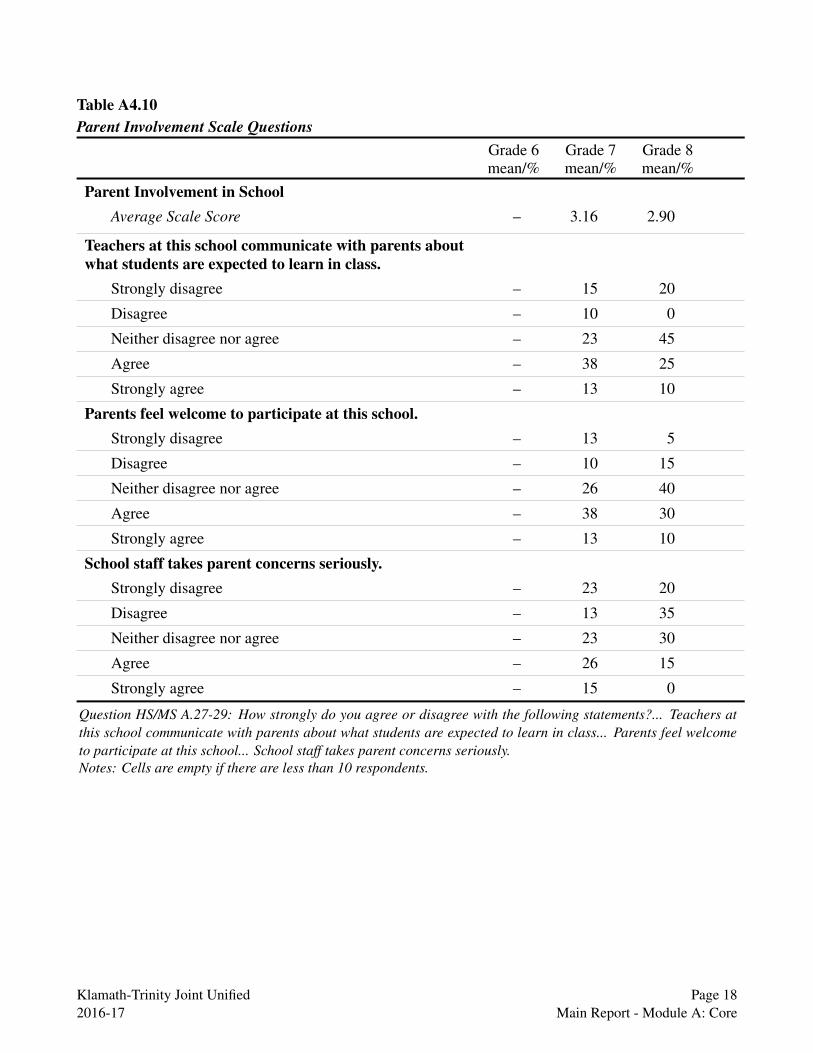
Table A4.10 Parent Involvement Scale Questions
Grade 6 Grade 7 Grade 8 mean/% mean/% mean/%
Parent Involvement in School Average Scale Score – 3.16 2.90
Teachers at this school communicate with parents about what students are expected to learn in class.
Strongly disagree – 15 20
Disagree – 10 0
Neither disagree nor agree – 23 45
Agree – 38 25
Strongly agree – 13 10
Parents feel welcome to participate at this school. Strongly disagree – 13 5
Disagree – 10 15
Neither disagree nor agree – 26 40
Agree – 38 30
Strongly agree – 13 10
School staff takes parent concerns seriously. Strongly disagree – 23 20
Disagree – 13 35
Neither disagree nor agree – 23 30
Agree – 26 15
Strongly agree – 15 0
Question HS/MS A.27-29: How strongly do you agree or disagree with the following statements?... Teachers at this school communicate with parents about what students are expected to learn in class... Parents feel welcome to participate at this school... School staff takes parent concerns seriously. Notes: Cells are empty if there are less than 10 respondents.
Klamath-Trinity Joint Unified Page 18 2016-17 Main Report - Module A: Core

Table A4.11 Academic Motivation Scale Questions
Grade 6 Grade 7 Grade 8 mean/% mean/% mean/%
Academic Motivation Average Scale Score – 3.54 3.30
I try hard to make sure that I am good at my schoolwork.
Strongly disagree – 8 5
Disagree – 8 0
Neither disagree nor agree – 20 25
Agree – 40 60
Strongly agree – 25 10
I try hard at school because I am interested in my work. Strongly disagree – 18 20
Disagree – 15 10
Neither disagree nor agree – 23 30
Agree – 25 35
Strongly agree – 20 5
I work hard to try to understand new things at school. Strongly disagree – 10 20
Disagree – 5 0
Neither disagree nor agree – 20 30
Agree – 38 35
Strongly agree – 28 15
I am always trying to do better in my schoolwork. Strongly disagree – 10 10
Disagree – 5 10
Neither disagree nor agree – 18 35
Agree – 43 30
Strongly agree – 25 15
Question HS/MS A.30-33: How strongly do you agree or disagree with the following statements?... I try hard to make sure that I am good at my schoolwork... I try hard at school because I am interested in my work... I work hard to try to understand new things at school... I am always trying to do better in my schoolwork. Notes: Cells are empty if there are less than 10 respondents.
Klamath-Trinity Joint Unified Page 19 2016-17 Main Report - Module A: Core
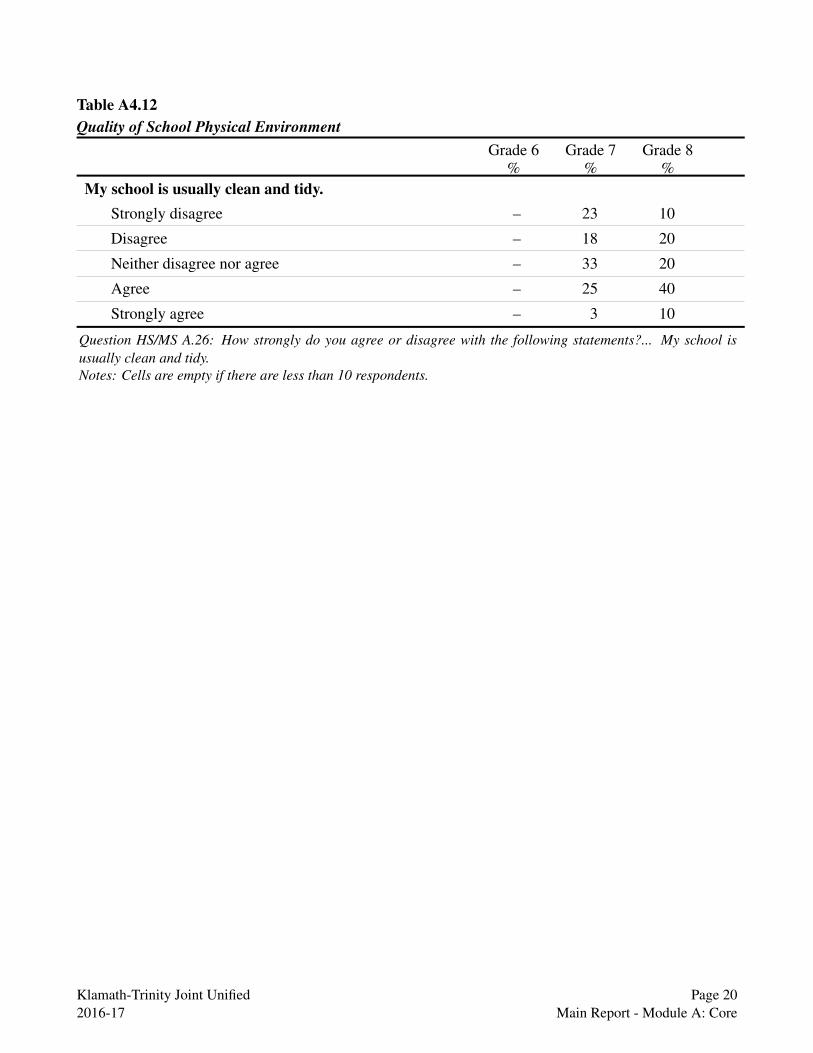
Table A4.12 Quality of School Physical Environment
Grade 6 Grade 7 Grade 8 % % %
My school is usually clean and tidy. Strongly disagree – 23 10
Disagree – 18 20
Neither disagree nor agree – 33 20
Agree – 25 40
Strongly agree – 3 10
Question HS/MS A.26: How strongly do you agree or disagree with the following statements?... My school is usually clean and tidy. Notes: Cells are empty if there are less than 10 respondents.
Klamath-Trinity Joint Unified Page 20 2016-17 Main Report - Module A: Core

5. School Violence, Victimization, and Safety
Table A5.1 Perceived Safety at School
Grade 6 Grade 7 Grade 8 % % %
Very safe – 20 21
Safe – 23 16
Neither safe nor unsafe – 28 47
Unsafe – 13 16
Very unsafe – 18 0
Question HS A.89/MS A.79: How safe do you feel when you are at school? Notes: Cells are empty if there are less than 10 respondents.
Klamath-Trinity Joint Unified Page 21 2016-17 Main Report - Module A: Core
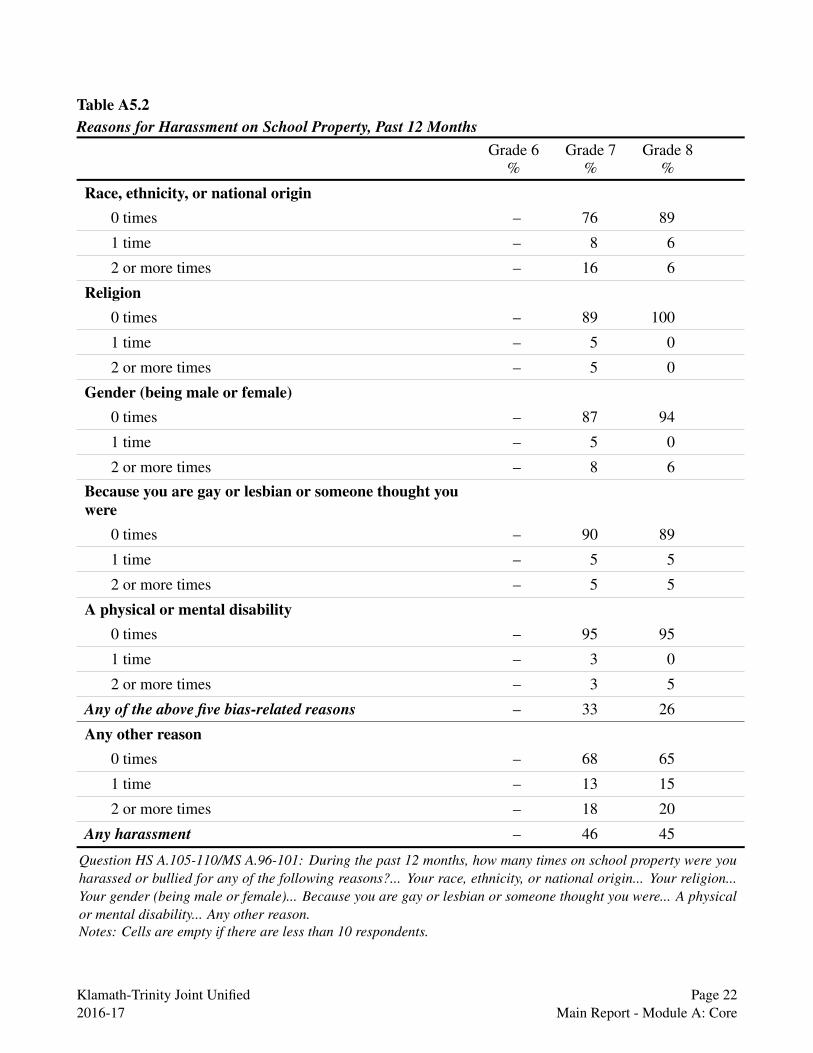
Table A5.2 Reasons for Harassment on School Property, Past 12 Months
Grade 6 Grade 7 Grade 8 % % %
Race, ethnicity, or national origin 0 times – 76 89
1 time – 8 6
2 or more times – 16 6
Religion 0 times – 89 100
1 time – 5 0
2 or more times – 5 0
Gender (being male or female) 0 times – 87 94
1 time – 5 0
2 or more times – 8 6
Because you are gay or lesbian or someone thought you were
0 times – 90 89
1 time – 5 5
2 or more times – 5 5
A physical or mental disability 0 times – 95 95
1 time – 3 0
2 or more times – 3 5
Any of the above five bias-related reasons – 33 26
Any other reason 0 times – 68 65
1 time – 13 15
2 or more times – 18 20
Any harassment – 46 45
Question HS A.105-110/MS A.96-101: During the past 12 months, how many times on school property were you harassed or bullied for any of the following reasons?... Your race, ethnicity, or national origin... Your religion... Your gender (being male or female)... Because you are gay or lesbian or someone thought you were... A physical or mental disability... Any other reason. Notes: Cells are empty if there are less than 10 respondents.
Klamath-Trinity Joint Unified Page 22 2016-17 Main Report - Module A: Core

Table A5.3 Verbal Harassment at School, Past 12 Months
Grade 6 Grade 7 Grade 8 % % %
During the past 12 months, how many times on school property have you... had mean rumors or lies spread about you?
0 times – 50 45
1 time – 13 5
2 to 3 times – 10 0
4 or more times – 28 50
had sexual jokes, comments, or gestures made to you? 0 times – 58 60
1 time – 13 5
2 to 3 times – 5 5
4 or more times – 25 30
been made fun of because of your looks or the way you talk?
0 times – 60 65
1 time – 10 10
2 to 3 times – 10 15
4 or more times – 20 10
been made fun of, insulted, or called names? 0 times – 48 60
1 time – 18 5
2 to 3 times – 8 0
4 or more times – 28 35
Question HS A.93-95, 104/MS A.84-86, 95: During the past 12 months, how many times on school property have you... had mean rumors or lies spread about you... had sexual jokes, comments, or gestures made to you... been made fun of because of your looks or the way you talk... been made fun of, insulted, or called names? Notes: Cells are empty if there are less than 10 respondents.
Klamath-Trinity Joint Unified Page 23 2016-17 Main Report - Module A: Core

Table A5.4 Violence and Victimization on School Property, Past 12 Months
Grade 6 Grade 7 Grade 8 % % %
During the past 12 months, how many times on school property have you... been pushed, shoved, slapped, hit, or kicked by someone who wasn’t just kidding around?
0 times – 45 75 1 time – 20 5 2 to 3 times – 15 10 4 or more times – 20 10
been afraid of being beaten up? 0 times – 78 80 1 time – 13 15 2 to 3 times – 3 5 4 or more times – 8 0
been in a physical fight? 0 times – 59 79 1 time – 28 11 2 to 3 times – 5 5 4 or more times – 8 5
been threatened with harm or injury? 0 times – 75 80 1 time – 10 0 2 to 3 times – 5 10 4 or more times – 10 10
been threatened or injured with a weapon (gun, knife, club, etc.)?
0 times – 88 100 1 time – 8 0 2 to 3 times – 3 0 4 or more times – 3 0
been offered, sold, or given an illegal drug? 0 times – 78 70 1 time – 13 5 2 to 3 times – 5 15 4 or more times – 5 10
Question HS A.90-92, 97, 101, 103/MS A.81-83, 88, 92, 94: During the past 12 months, how many times on school property have you... been pushed, shoved, slapped, hit, or kicked by someone who wasn’t just kidding around... been afraid of being beaten up... been in a physical fight... been offered, sold, or given an illegal drug... been threatened or injured with a weapon (gun, knife, club, etc.) ... been threatened with harm or injury? Note: Cells are empty if there are less than 10 respondents.
Klamath-Trinity Joint Unified Page 24 2016-17 Main Report - Module A: Core

Table A5.5 Property Damage on School Property, Past 12 Months
Grade 6 Grade 7 Grade 8 % % %
Had your property stolen or deliberately damaged 0 times – 73 85 1 time – 23 5 2 to 3 times – 0 5 4 or more times – 5 5
Damaged school property on purpose 0 times – 80 80 1 time – 13 10 2 to 3 times – 3 10 4 or more times – 5 0
Question HS A.96, 98/MS A.87, 89: During the past 12 months, how many times on school property have you... had your property stolen or deliberately damaged, such as your car, clothing, or books... damaged school property on purpose? Note: Cells are empty if there are less than 10 respondents.
Table A5.6 Weapons Possession on School Property, Past 12 Months
Grade 6 Grade 7 Grade 8 % % %
Carried a gun 0 times – 90 100 1 time – 5 0 2 to 3 times – 3 0 4 or more times – 3 0
Carried any other weapon (such as a knife or club) 0 times – 78 80 1 time – 18 15 2 to 3 times – 0 0 4 or more times – 5 5
Seen someone carrying a gun, knife, or other weapon 0 times – 68 80 1 time – 10 0 2 to 3 times – 15 15 4 or more times – 8 5
Question HS A.99, 100, 102/MS A.90, 91, 93: During the past 12 months, how many times on school property have you... carried a gun... carried any other weapon (such as a knife or club)... seen someone carrying a gun, knife, or other weapon? Note: Cells are empty if there are less than 10 respondents.
Klamath-Trinity Joint Unified Page 25 2016-17 Main Report - Module A: Core
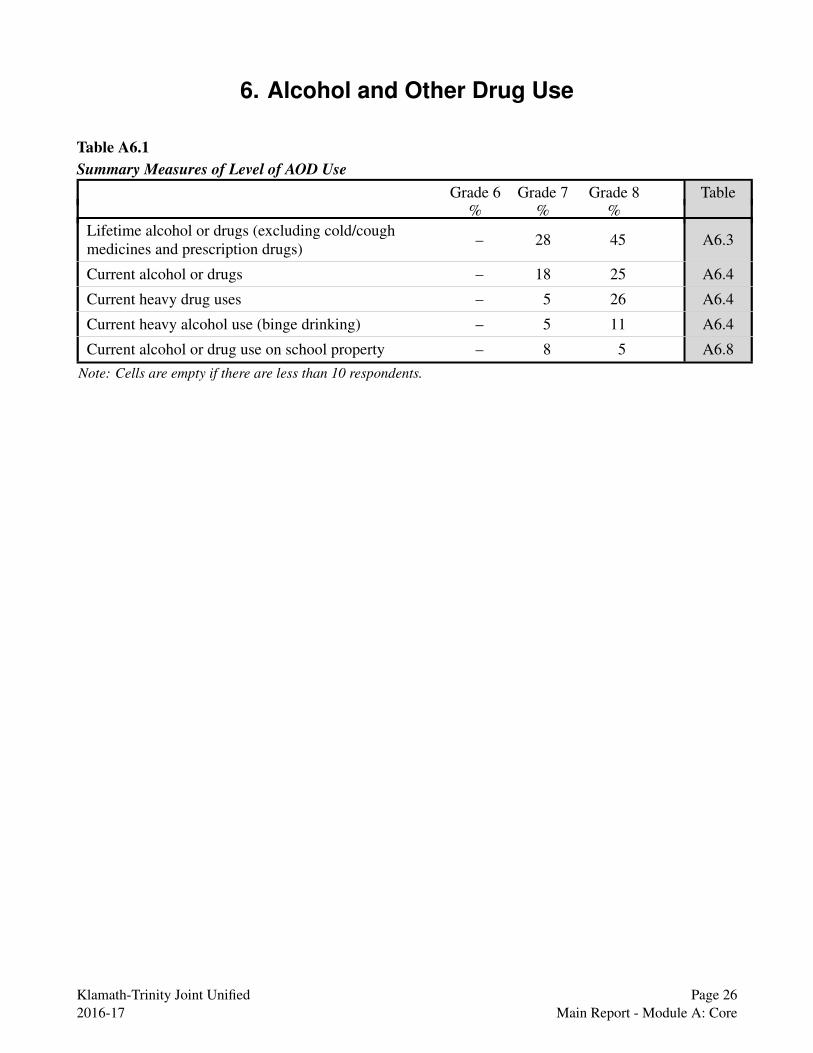
6. Alcohol and Other Drug Use
Table A6.1 Summary Measures of Level of AOD Use
Grade 6 %
Grade 7 %
Grade 8 %
Table
Lifetime alcohol or drugs (excluding cold/cough medicines and prescription drugs) – 28 45 A6.3
Current alcohol or drugs – 18 25 A6.4
Current heavy drug uses – 5 26 A6.4
Current heavy alcohol use (binge drinking) – 5 11 A6.4
Current alcohol or drug use on school property – 8 5 A6.8 Note: Cells are empty if there are less than 10 respondents.
Klamath-Trinity Joint Unified Page 26 2016-17 Main Report - Module A: Core

Table A6.2 Summary of AOD Lifetime Use
Grade 6 Grade 7 Grade 8 % % %
Alcohol – 18 40
Marijuana – 20 40
Inhalants – 3 10
Notes: Cells are empty if there are less than 10 respondents.
Table A6.3 Lifetime AOD Use
Grade 6 Grade 7 Grade 8 % % %
Alcohol (one full drink) 0 times – 83 60 1 time – 8 5 2 to 3 times – 8 10 4 or more times – 3 25
Marijuana 0 times – 80 60 1 time – 8 5 2 to 3 times – 3 10 4 or more times – 10 25
Inhalants (to get “high”) 0 times – 98 90 1 time – 0 5 2 to 3 times – 0 0 4 or more times – 3 5
Any other drug, or pill, or medicine to get “high” or for other than medical reasons
0 times – 93 90 1 time – 3 0 2 to 3 times – 3 5 4 or more times – 3 5
Any of the above AOD use – 28 45 Question HS A.46-48, 56/MS A.47-49, 51: During your life, how many times have you used the following substances? One full drink of alcohol (such as a can of beer, glass of wine, wine cooler, or shot of liquor)... Marijuana (pot, weed, grass, hash, bud)... Inhalants (things you sniff, huff, or breathe to get “high” such as glue, paint, aerosol sprays, gasoline, poppers, gases)... Any other drug, or pill, or medicine to get “high” or for other than medical reasons. Notes: Cells are empty if there are less than 10 respondents.
Klamath-Trinity Joint Unified Page 27 2016-17 Main Report - Module A: Core

Table A6.4 Current AOD Use, Past 30 Days
Grade 6 Grade 7 Grade 8 % % %
Alcohol (at least one drink) – 8 25
Binge drinking (5 or more drinks in a row) – 5 11
Marijuana – 10 25
Inhalants – 5 5
Other drug, pill, or medicine to get “high” or for other than medical reasons – 5 5
Any drug use – 13 25
Heavy drug use – 5 26
Any AOD Use – 18 25
Question HS A.63-66/MS A.58-62: During the past 30 days, on how many days did you use... at least one drink of alcohol... five or more drinks of alcohol in a row, that is, within a couple of hours... marijuana (pot, weed, grass, hash, bud)... inhalants (things you sniff, huff, or breathe to get “high”)... any other drug, pill, or medicine to get “high” or for other than medical reasons? Notes: Cells are empty if there are less than 10 respondents. Heavy drug use was calculated based on pattern of combined current drug use on three or more days (marijuana, inhalants, prescription pain medicine to get “high” (high school only) and any other illegal drug/pill to get “high”).
Klamath-Trinity Joint Unified Page 28 2016-17 Main Report - Module A: Core
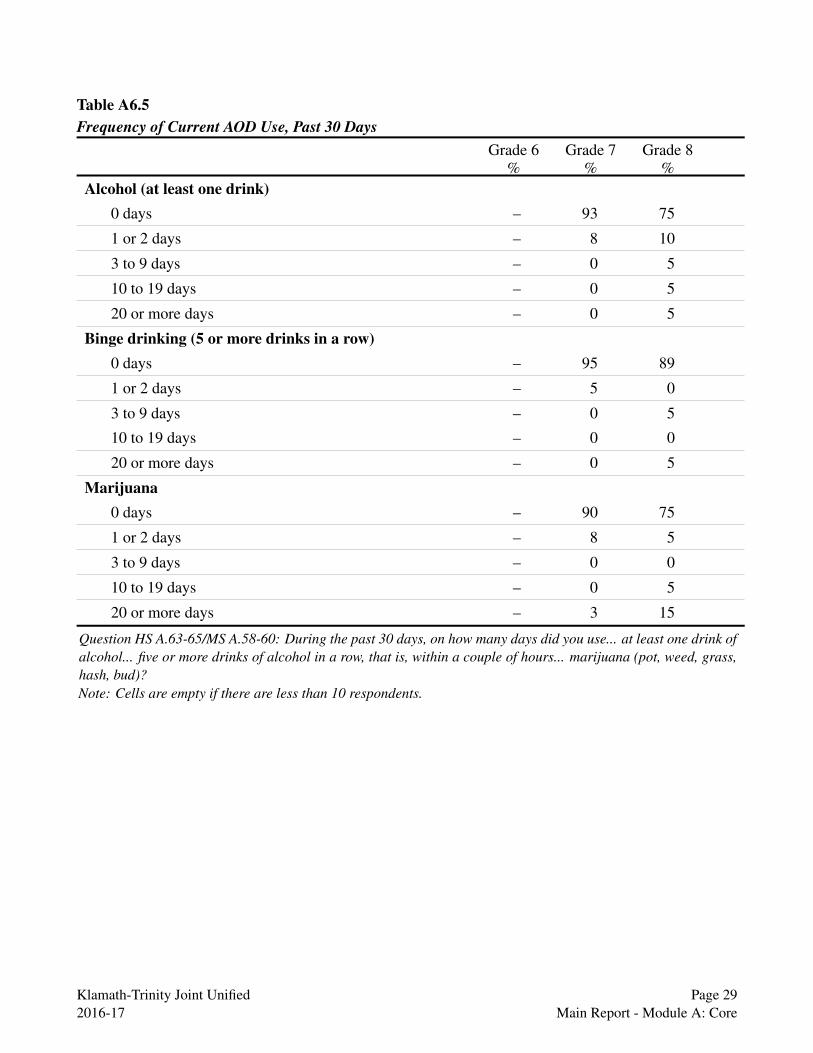
Table A6.5 Frequency of Current AOD Use, Past 30 Days
Grade 6 Grade 7 Grade 8 % % %
Alcohol (at least one drink) 0 days – 93 75
1 or 2 days – 8 10
3 to 9 days – 0 5
10 to 19 days – 0 5
20 or more days – 0 5
Binge drinking (5 or more drinks in a row) 0 days – 95 89
1 or 2 days – 5 0
3 to 9 days – 0 5
10 to 19 days – 0 0
20 or more days – 0 5
Marijuana 0 days – 90 75
1 or 2 days – 8 5
3 to 9 days – 0 0
10 to 19 days – 0 5
20 or more days – 3 15
Question HS A.63-65/MS A.58-60: During the past 30 days, on how many days did you use... at least one drink of alcohol... five or more drinks of alcohol in a row, that is, within a couple of hours... marijuana (pot, weed, grass, hash, bud)? Note: Cells are empty if there are less than 10 respondents.
Klamath-Trinity Joint Unified Page 29 2016-17 Main Report - Module A: Core

Table A6.6 Lifetime Drunk or “High”
Grade 6 Grade 7 Grade 8 % % %
Very drunk or sick after drinking alcohol 0 times – 88 80 1 to 2 times – 10 15 3 to 6 times – 3 0 7 or more times – 0 5
“High” (loaded, stoned, or wasted) from using drugs 0 times – 88 65 1 to 2 times – 5 10 3 to 6 times – 0 0 7 or more times – 8 25
Very drunk or “high” 7 or more times – 8 25
Question HS A.57, 58/MS A.52, 53: During your life, how many times have you been... very drunk or sick after drinking alcohol... “high” (loaded, stoned, or wasted) from using drugs? Note: Cells are empty if there are less than 10 respondents.
Table A6.7 Drinking While Driving, Lifetime
Grade 6 Grade 7 Grade 8 % % %
Have ridden in a car driven by someone who had been drinking
Never – 62 50
1 time – 15 0
2 times – 5 15
3 to 6 times – 5 10
7 or more times – 13 25
Question HS A.88/MS A.78: During your life, how many times have you ever driven a car when you had been drinking alcohol, or been in a car driven by a friend when he or she had been drinking?... In your life, how many times have you ridden in a car driven by someone who had been drinking alcohol? Notes: Cells are empty if there are less than 10 respondents.
Klamath-Trinity Joint Unified Page 30 2016-17 Main Report - Module A: Core

Table A6.8 Current AOD Use on School Property, Past 30 Days
Grade 6 Grade 7 Grade 8 % % %
Alcohol 0 days – 95 95
1 to 2 days – 3 0
3 or more days – 3 5
Marijuana 0 days – 95 95
1 to 2 days – 3 0
3 or more days – 3 5
Any other drug, pill, or medicine to get “high” or for other than medical reasons?
0 days – 98 100
1 to 2 days – 0 0
3 or more days – 3 0
Any of the above – 8 5
Question HS A.73-75/MS A.66-68: During the past 30 days, on how many days on school property did you... have at least one drink of alcohol... smoke marijuana... use any other drug, pill, or medicine to get “high” or for other than medical reasons? Notes: Cells are empty if there are less than 10 respondents.
Table A6.9 Lifetime Drunk or “High” on School Property
Grade 6 Grade 7 Grade 8 % % %
0 times – 88 80
1 to 2 times – 8 15
3 to 6 times – 0 0
7 or more times – 5 5
Question HS A.59/MS A.54: During your life, how many times have you been... drunk on alcohol or “high” on drugs on school property? Notes: Cells are empty if there are less than 10 respondents.
Klamath-Trinity Joint Unified Page 31 2016-17 Main Report - Module A: Core

Table A6.10 Perceived Harm and Availability
Grade 6 Grade 7 Grade 8 % % %
Perceived Harm of Use... Alcohol - drink occasionally
Great – 36 25 Moderate – 18 30 Slight – 10 25 None – 36 20
Alcohol - 5 or more drinks once or twice a week Great – 45 21 Moderate – 13 37 Slight – 8 16 None – 35 26
Marijuana - smoke occasionally Great – 33 10 Moderate – 18 15 Slight – 8 20 None – 41 55
Marijuana - smoke once or twice a week Great – 38 15 Moderate – 10 15 Slight – 13 15 None – 38 55
Perceived Difficulty of Obtaining... Alcohol
Very difficult – 11 15 Fairly difficult – 11 5 Fairly easy – 18 35 Very easy – 21 25 Don’t know – 39 20
Marijuana Very difficult – 8 15 Fairly difficult – 8 5 Fairly easy – 18 30 Very easy – 29 35 Don’t know – 37 15
Question HS A.78-81, 83, 84/MS A.71-74, 76, 77: How much do people risk harming themselves physically and in other ways when they do the following?... Drink alcohol occasionally... Have five or more drinks of an alcoholic beverage once or twice a week... Smoke marijuana occasionally... Smoke marijuana once or twice a week... How difficult is it for students in your grade to get any of the following substances if they really want them?... Alcohol... Marijuana. Note: Cells are empty if there are less than 10 respondents.
Klamath-Trinity Joint Unified Page 32 2016-17 Main Report - Module A: Core

7. Tobacco Use
Table A7.1 Summary of Key CHKS Tobacco Indicators
Grade 6 %
Grade 7 %
Grade 8 %
Table
Use Prevalence and Patterns Ever smoked a whole cigarette – 13 16 A7.2
Current cigarette smoking‡ – 5 10 A7.3
Current cigarette smoking at school‡ – 5 0 A7.4
Ever tried smokeless tobacco – 15 32 A7.2
Current smokeless tobacco use‡ – 5 5 A7.3
Current smokeless tobacco use at school‡ – 5 0 A7.4
Ever used electronic cigarettes or other vaping device – 18 30 A7.2
Current use of electronic cigarettes or other vaping device‡ – 8 15 A7.3
Current use of electronic cigarettes or other vaping device at school‡ – 3 0 A7.4
Attitudes and Correlates Occasional smoking great harm – 35 25 A7.5
Smoking 1-2 packs per day great harm – 60 70 A7.5
Very easy to obtain cigarettes – 18 30 A7.5
Notes: Cells are empty if there are less than 10 respondents. ‡Past 30 days.
Klamath-Trinity Joint Unified Page 33 2016-17 Main Report - Module A: Core

Table A7.2 Lifetime Tobacco Use
Grade 6 Grade 7 Grade 8 % % %
A cigarette, even one or two puffs 0 times – 83 65
1 time – 3 10
2 to 3 times – 5 5
4 or more times – 10 20
A whole cigarette 0 times – 88 84
1 time – 5 0
2 to 3 times – 0 0
4 or more times – 8 16
Smokeless tobacco 0 times – 85 68
1 time – 10 16
2 to 3 times – 0 0
4 or more times – 5 16
An electronic cigarette or other vaping device 0 times – 83 70
1 time – 10 5
2 to 3 times – 3 5
4 or more times – 5 20
Question HS A.43-45/MS A.43-46: During your life, how many times have you used the following substances? A cigarette, even one or two puffs... A whole cigarette... Smokeless tobacco (dip, chew, or snuff)... Electronic cigarettes, e-cigarettes, or other vaping device such as e-hookah, hookah pens, or vape pens. Notes: Cells are empty if there are less than 10 respondents.
Klamath-Trinity Joint Unified Page 34 2016-17 Main Report - Module A: Core

Table A7.3 Any Current Use and Daily Use
Grade 6 Grade 7 Grade 8 % % %
Cigarettes Any – 5 10 Daily (20 or more days) – 3 5
Smokeless Tobacco Any – 5 5 Daily (20 or more days) – 3 5
Electronic cigarettes or other vaping device Any – 8 15 Daily (20 or more days) – 3 5
Question HS A.60-62/MS A.55-57: During the past 30 days, on how many days did you use... cigarettes... smokeless tobacco (dip, chew, or snuff )... electronic cigarettes, e-cigarettes, or other vaping device such as e-hookah, hookah pens, or vape pens? Note: Cells are empty if there are less than 10 respondents.
Klamath-Trinity Joint Unified Page 35 2016-17 Main Report - Module A: Core
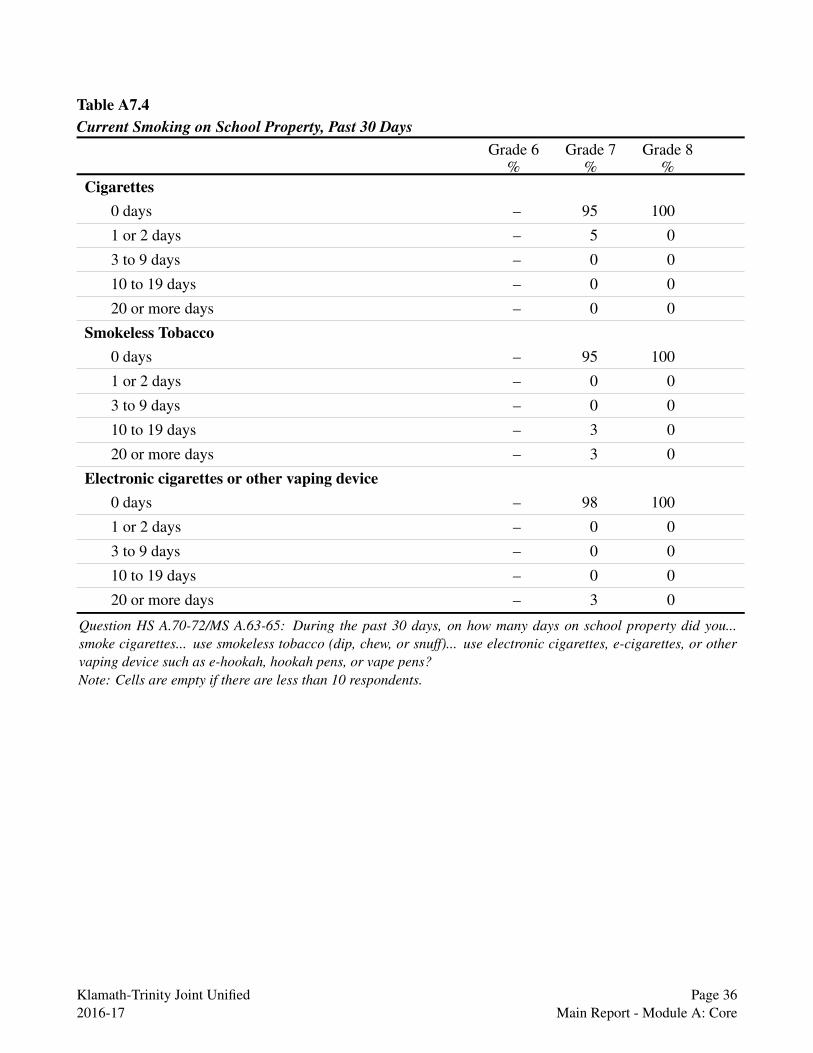
Table A7.4 Current Smoking on School Property, Past 30 Days
Grade 6 Grade 7 Grade 8 % % %
Cigarettes 0 days – 95 100
1 or 2 days – 5 0
3 to 9 days – 0 0
10 to 19 days – 0 0
20 or more days – 0 0
Smokeless Tobacco 0 days – 95 100
1 or 2 days – 0 0
3 to 9 days – 0 0
10 to 19 days – 3 0
20 or more days – 3 0
Electronic cigarettes or other vaping device 0 days – 98 100
1 or 2 days – 0 0
3 to 9 days – 0 0
10 to 19 days – 0 0
20 or more days – 3 0
Question HS A.70-72/MS A.63-65: During the past 30 days, on how many days on school property did you... smoke cigarettes... use smokeless tobacco (dip, chew, or snuff)... use electronic cigarettes, e-cigarettes, or other vaping device such as e-hookah, hookah pens, or vape pens? Note: Cells are empty if there are less than 10 respondents.
Klamath-Trinity Joint Unified Page 36 2016-17 Main Report - Module A: Core
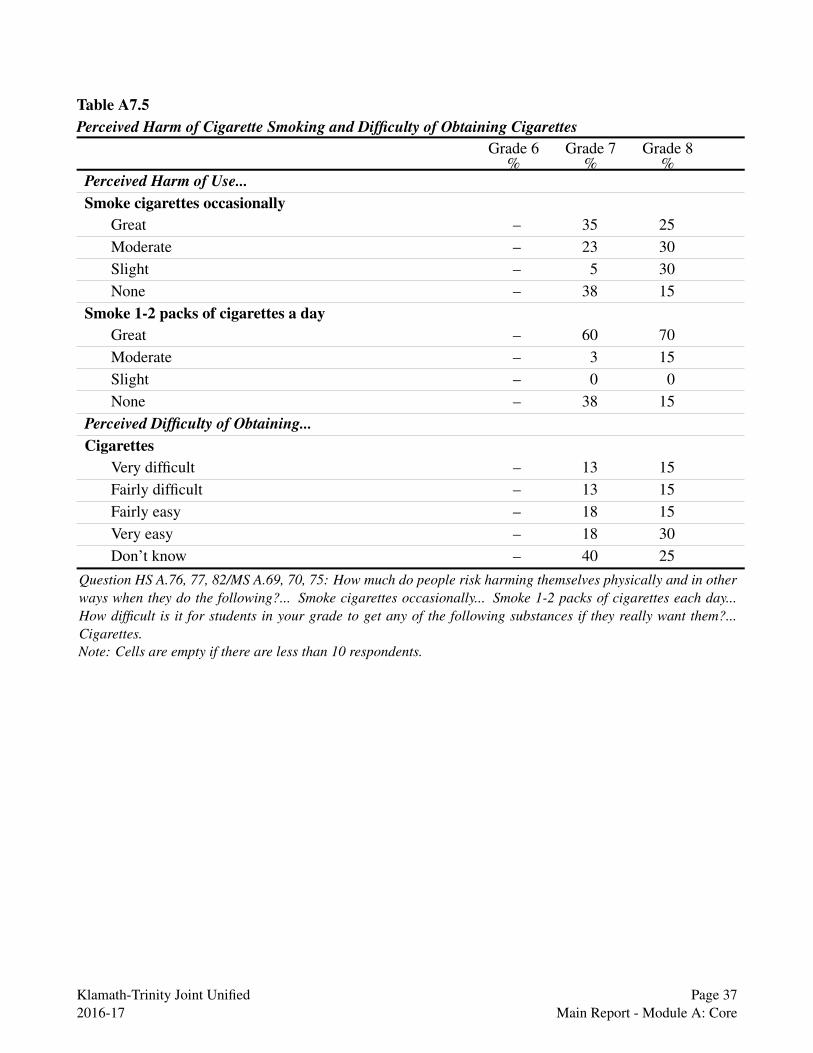
Table A7.5 Perceived Harm of Cigarette Smoking and Difficulty of Obtaining Cigarettes
Grade 6 Grade 7 Grade 8 % % %
Perceived Harm of Use... Smoke cigarettes occasionally
Great – 35 25 Moderate – 23 30 Slight – 5 30 None – 38 15
Smoke 1-2 packs of cigarettes a day Great – 60 70 Moderate – 3 15 Slight – 0 0 None – 38 15
Perceived Difficulty of Obtaining... Cigarettes
Very difficult – 13 15 Fairly difficult – 13 15 Fairly easy – 18 15 Very easy – 18 30 Don’t know – 40 25
Question HS A.76, 77, 82/MS A.69, 70, 75: How much do people risk harming themselves physically and in other ways when they do the following?... Smoke cigarettes occasionally... Smoke 1-2 packs of cigarettes each day... How difficult is it for students in your grade to get any of the following substances if they really want them?... Cigarettes. Note: Cells are empty if there are less than 10 respondents.
Klamath-Trinity Joint Unified Page 37 2016-17 Main Report - Module A: Core

8. Other Physical and Mental Health Risks
Table A8.1 Cyber Bullying, Past 12 Months
Grade 6 Grade 7 Grade 8 % % %
0 times (never) – 62 68
1 time – 10 5
2 to 3 times – 10 5
4 or more times – 18 21
Question HS A.111/MS A.102: During the past 12 months, how many times did other students spread mean rumors or lies about you on the internet (i.e., FacebookTM, InstagramTM, SnapchatTM, email, instant message)? Note: Cells are empty if there are less than 10 respondents.
Table A8.2 Alone After School
Never
Grade 6 % –
Grade 7 % 41
Grade 8 % 55
1 day
2 days
3 days
4 days
5 days
–
–
–
–
–
15
8
5
0
31
15
10
10
5
5
Question MS A.80: In a normal week, how many days are you home after school for at least one hour without an adult there? Notes: Cells are empty if there are less than 10 respondents.
Klamath-Trinity Joint Unified Page 38 2016-17 Main Report - Module A: Core
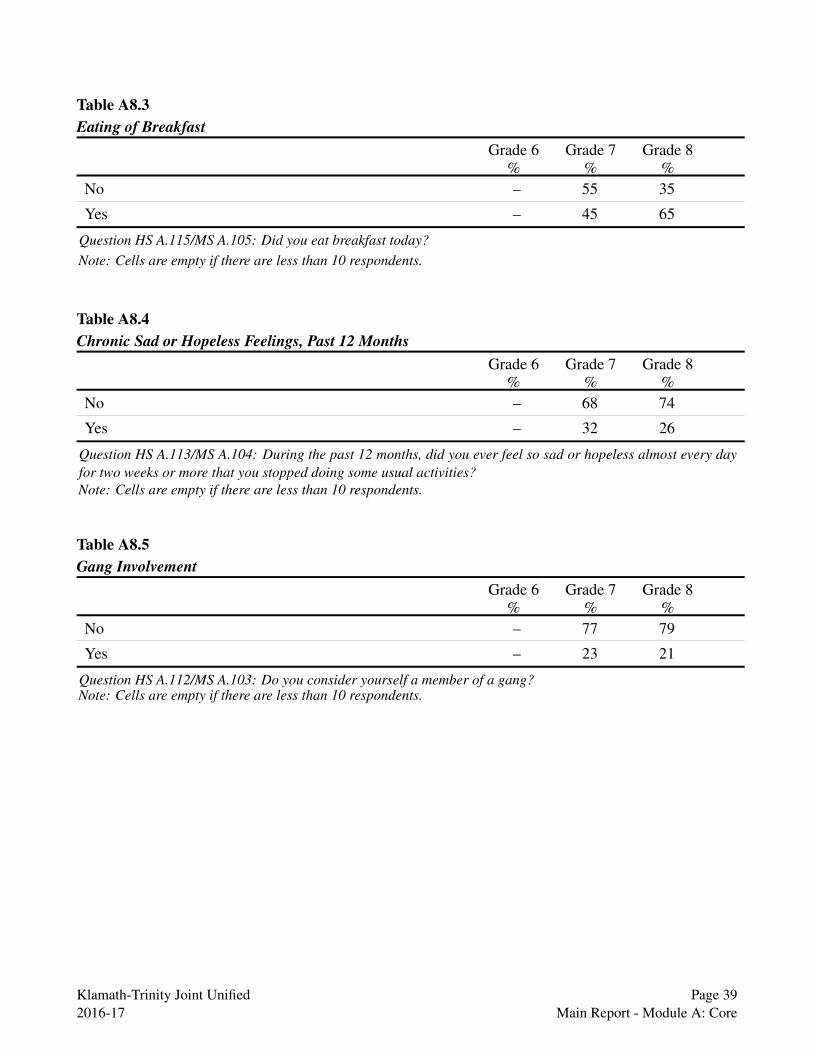
Table A8.3 Eating of Breakfast
Grade 6 Grade 7 Grade 8 % % %
No – 55 35
Yes – 45 65
Question HS A.115/MS A.105: Did you eat breakfast today? Note: Cells are empty if there are less than 10 respondents.
Table A8.4 Chronic Sad or Hopeless Feelings, Past 12 Months
Grade 6 Grade 7 Grade 8 % % %
No – 68 74
Yes – 32 26
Question HS A.113/MS A.104: During the past 12 months, did you ever feel so sad or hopeless almost every day for two weeks or more that you stopped doing some usual activities? Note: Cells are empty if there are less than 10 respondents.
Table A8.5 Gang Involvement
Grade 6 Grade 7 Grade 8 % % %
No – 77 79
Yes – 23 21
Question HS A.112/MS A.103: Do you consider yourself a member of a gang? Note: Cells are empty if there are less than 10 respondents.
Klamath-Trinity Joint Unified Page 39 2016-17 Main Report - Module A: Core
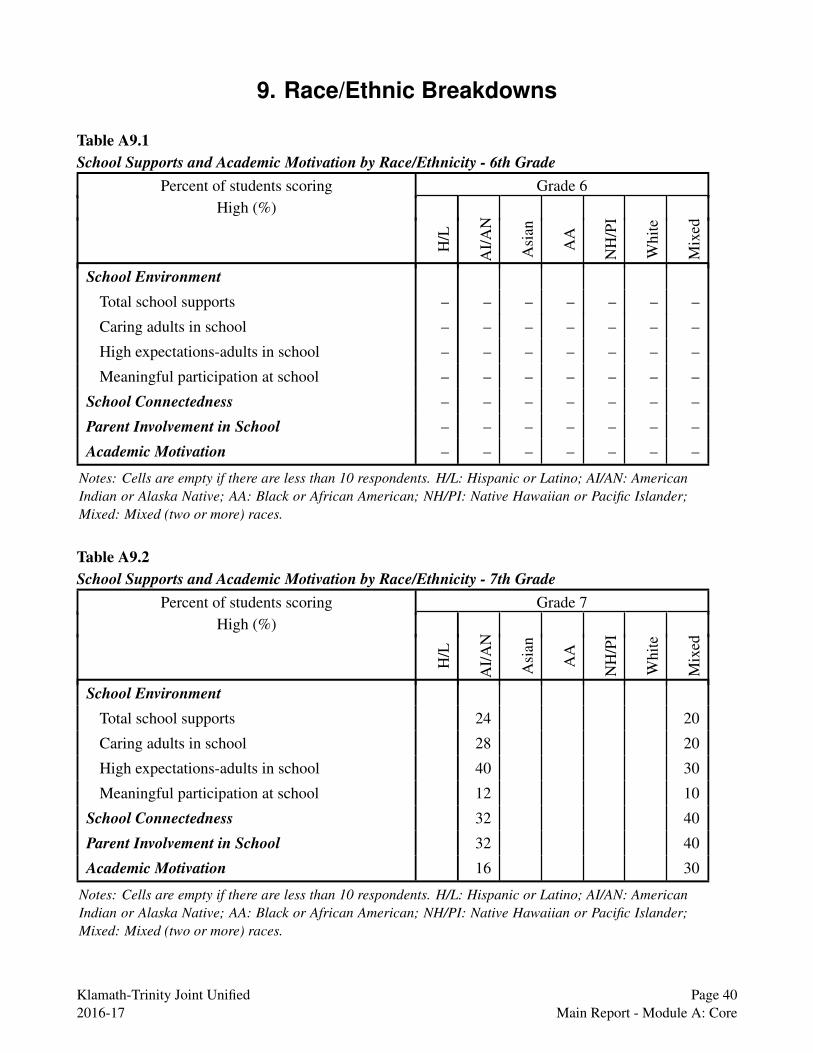
9. Race/Ethnic Breakdowns
Table A9.1 School Supports and Academic Motivation by Race/Ethnicity - 6th Grade
Percent of students scoring Grade 6 High (%)
H/L
AI/
AN
Asi
an
AA
NH
/PI
Whi
te
Mix
ed
School Environment Total school supports – – – – – – –
Caring adults in school – – – – – – –
High expectations-adults in school – – – – – – –
Meaningful participation at school – – – – – – –
School Connectedness – – – – – – –
Parent Involvement in School – – – – – – –
Academic Motivation – – – – – – –
Notes: Cells are empty if there are less than 10 respondents. H/L: Hispanic or Latino; AI/AN: American Indian or Alaska Native; AA: Black or African American; NH/PI: Native Hawaiian or Pacific Islander; Mixed: Mixed (two or more) races.
Table A9.2 School Supports and Academic Motivation by Race/Ethnicity - 7th Grade
Percent of students scoring Grade 7 High (%)
H/L
AI/
AN
Asi
an
AA
NH
/PI
Whi
te
Mix
ed
School Environment Total school supports
Caring adults in school
High expectations-adults in school
Meaningful participation at school
School Connectedness Parent Involvement in School Academic Motivation
24
28
40
12
32
32
16
20
20
30
10
40
40
30
Notes: Cells are empty if there are less than 10 respondents. H/L: Hispanic or Latino; AI/AN: American Indian or Alaska Native; AA: Black or African American; NH/PI: Native Hawaiian or Pacific Islander; Mixed: Mixed (two or more) races.
Klamath-Trinity Joint Unified Page 40 2016-17 Main Report - Module A: Core

Table A9.3 School Supports and Academic Motivation by Race/Ethnicity - 8th Grade
Percent of students scoring Grade 8 High (%)
H/L
AI/
AN
Asi
an
AA
NH
/PI
Whi
te
Mix
ed
School Environment Total school supports
Caring adults in school
High expectations-adults in school
Meaningful participation at school
School Connectedness Parent Involvement in School Academic Motivation
10
10
10
10
20
0
10
Notes: Cells are empty if there are less than 10 respondents. H/L: Hispanic or Latino; AI/AN: American Indian or Alaska Native; AA: Black or African American; NH/PI: Native Hawaiian or Pacific Islander; Mixed: Mixed (two or more) races.
Klamath-Trinity Joint Unified Page 41 2016-17 Main Report - Module A: Core

Table A9.4 Perceived Safety at School by Race/Ethnicity
Grade 6 Grade 7 Grade 8 % % %
Feel safe or very safe at school Hispanic or Latino –
American Indian or Alaska Native – 36
Asian –
Black or African American –
Native Hawaiian or Pacific Islander –
White –
Mixed (two or more) races – 70 20
Note: Cells are empty if there are less than 10 respondents.
Table A9.5 Harassment Due to Five Bias-Related Reasons by Race/Ethnicity, Past 12 Months
Grade 6 Grade 7 Grade 8 % % %
Harassment or bullying due to five bias-related reasonsA
Hispanic or Latino –
American Indian or Alaska Native – 24
Asian –
Black or African American –
Native Hawaiian or Pacific Islander –
White –
Mixed (two or more) races –
Notes: Cells are empty if there are less than 10 respondents. ABias-related reasons include race, ethnicity or national origin; religion; gender (being male or female); sexual orientation; and a physical or mental disability.
Klamath-Trinity Joint Unified Page 42 2016-17 Main Report - Module A: Core

Table A9.6 Any Harassment or Bullying by Race/Ethnicity, Past 12 Months
Grade 6 Grade 7 Grade 8 % % %
Were harassed or bullied at school Hispanic or Latino –
American Indian or Alaska Native – 40
Asian –
Black or African American –
Native Hawaiian or Pacific Islander –
White –
Mixed (two or more) races –
Note: Cells are empty if there are less than 10 respondents.
Table A9.7 Current Alcohol Use at School by Race/Ethnicity, Past 30 Days
Grade 6 Grade 7 Grade 8 % % %
Had at least one drink of alcohol at school Hispanic or Latino –
American Indian or Alaska Native – 4
Asian –
Black or African American –
Native Hawaiian or Pacific Islander –
White –
Mixed (two or more) races – 0 10
Notes: Cells are empty if there are less than 10 respondents.
Klamath-Trinity Joint Unified Page 43 2016-17 Main Report - Module A: Core
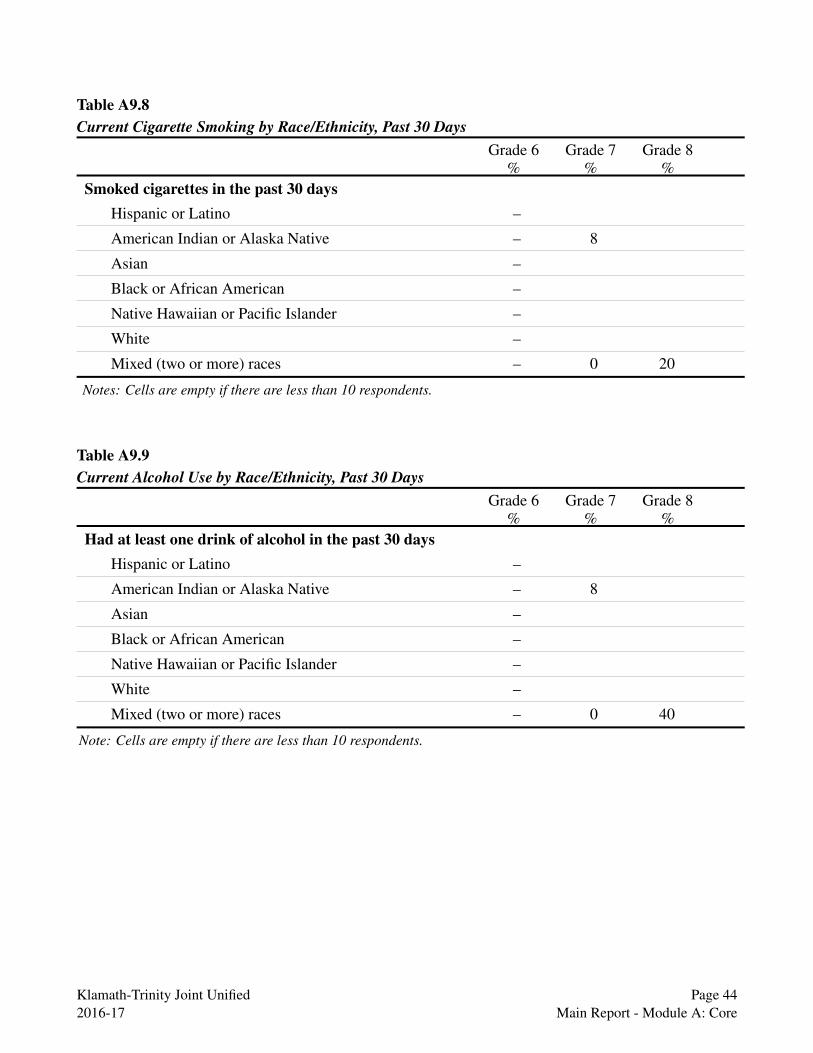
Table A9.8 Current Cigarette Smoking by Race/Ethnicity, Past 30 Days
Grade 6 Grade 7 Grade 8 % % %
Smoked cigarettes in the past 30 days Hispanic or Latino –
American Indian or Alaska Native – 8
Asian –
Black or African American –
Native Hawaiian or Pacific Islander –
White –
Mixed (two or more) races – 0 20
Notes: Cells are empty if there are less than 10 respondents.
Table A9.9 Current Alcohol Use by Race/Ethnicity, Past 30 Days
Grade 6 Grade 7 Grade 8 % % %
Had at least one drink of alcohol in the past 30 days Hispanic or Latino –
American Indian or Alaska Native – 8
Asian –
Black or African American –
Native Hawaiian or Pacific Islander –
White –
Mixed (two or more) races – 0 40
Note: Cells are empty if there are less than 10 respondents.
Klamath-Trinity Joint Unified Page 44 2016-17 Main Report - Module A: Core

Table A9.10 Current Marijuana Use by Race/Ethnicity, Past 30 Days
Grade 6 Grade 7 Grade 8 % % %
Used marijuana in the past 30 days Hispanic or Latino –
American Indian or Alaska Native – 12
Asian –
Black or African American –
Native Hawaiian or Pacific Islander –
White –
Mixed (two or more) races – 0 40
Notes: Cells are empty if there are less than 10 respondents.
Table A9.11 Chronic Sad or Hopeless Feelings by Race/Ethnicity, Past 12 Months
Grade 6 Grade 7 Grade 8 % % %
Felt so sad or hopeless almost everyday for two weeks or more
Hispanic or Latino –
American Indian or Alaska Native – 33
Asian –
Black or African American –
Native Hawaiian or Pacific Islander –
White –
Mixed (two or more) races –
Note: Cells are empty if there are less than 10 respondents.
Klamath-Trinity Joint Unified Page 45 2016-17 Main Report - Module A: Core
Klam
ath-Trinity Joint Unified
Page 46 2016-17
Main R
eport -Module A
: Core
10. Gender Breakdowns
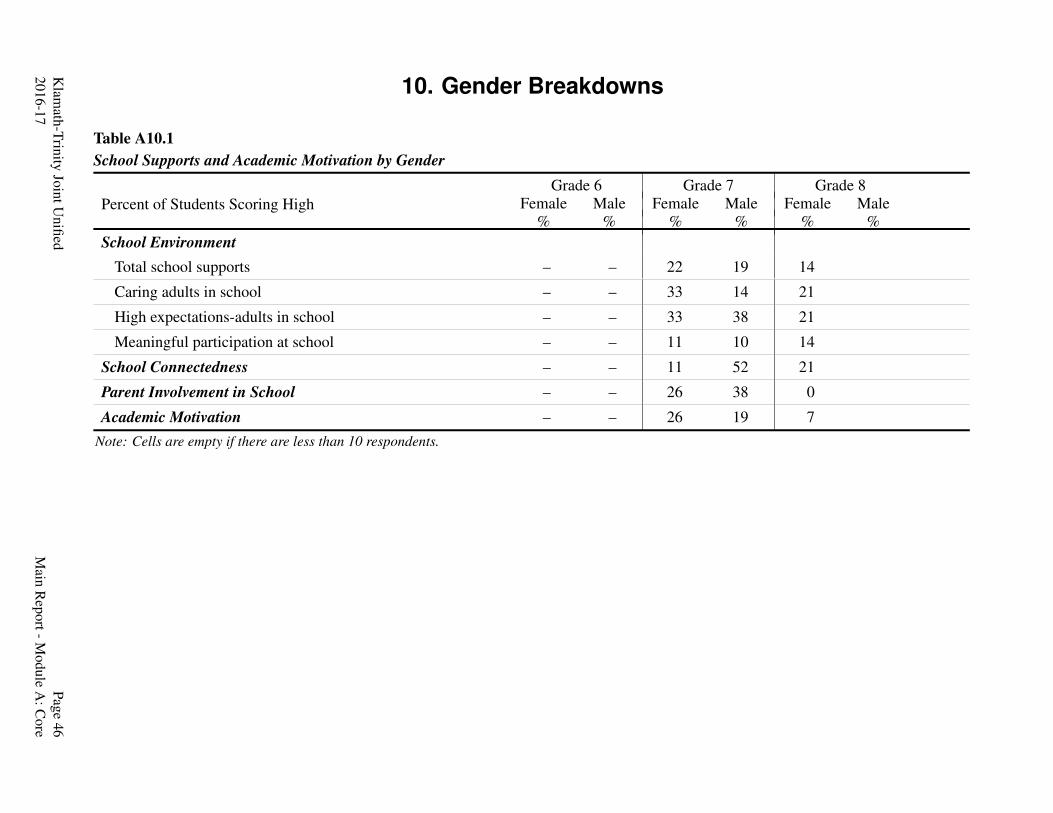
Table A10.1 School Supports and Academic Motivation by Gender
Percent of Students Scoring High Grade 6
Female Male % %
Grade 7 Female Male
% %
Grade 8 Female Male
% % School Environment
Total school supports – – 22 19 14
Caring adults in school – – 33 14 21
High expectations-adults in school – – 33 38 21
Meaningful participation at school – – 11 10 14
School Connectedness – – 11 52 21
Parent Involvement in School – – 26 38 0
Academic Motivation – – 26 19 7 Note: Cells are empty if there are less than 10 respondents.

Table A10.2 Select Perceived Safety, Harassment, Alcohol and Drug Use, and Mental Health Measures by Gender
Grade 6 Female Male
% %
Grade 7 Female Male
% %
Grade 8 Female Male
% % Perceived Safety at School Feel safe or very safe at school – – 21 62 31
Harassment/Bullying at School During the past 12 month at school, have you been...
harassed/bullied for any of the five bias-related reasons – – 37 30 31
harassed/bullied for any reasons – – 58 35 54
Current ATOD Use During the past 30 days, did you...
have at least one drink of alcohol at school – – 0 10 7
smoke cigarettes – – 5 5 14
have at least one drink of alcohol – – 11 5 29
use marijuana – – 5 14 29
Mental Health Chronic sad or hopeless feelings, past 12 months – – 42 21 38
Notes: Cells are empty if there are less than 10 respondents.
Klam
ath-Trinity Joint Unified
Page 47 2016-17
Main R
eport -Module A
: Core

Drug Free Communities (DFC) Module
1. Module Sample
Table G1.1 Student Sample for DFC Module
Grade 6 Grade 7 Grade 8
Student Sample Size Target sample – 69 66
Final number – 39 20
Average Response Rate – 57% 30%
Klamath-Trinity Joint Unified Page 48 2016-17 Main Report - Module G: Drug Free Communities (DFC) Module

2. Summary of Key Indicators
Table G2.1 Key Indicators of Alcohol and Other Drug Use
Grade 6 %
Grade 7 %
Grade 8 %
Table
Alcohol Consumption Patterns Usually drank until felt it a lot – 3 0 G3.4
Strong Personal Disapproval of AOD Use Having one or two drinks of any alcoholic beverage nearly every day – 51 10 G6.1
Trying marijuana or hashish once or twice – 41 10 G6.1
Using marijuana once a month or more – 41 10 G6.1
Notes: Cells are empty if there are less than 10 respondents.
Klamath-Trinity Joint Unified Page 49 2016-17 Main Report - Module G: Drug Free Communities (DFC) Module
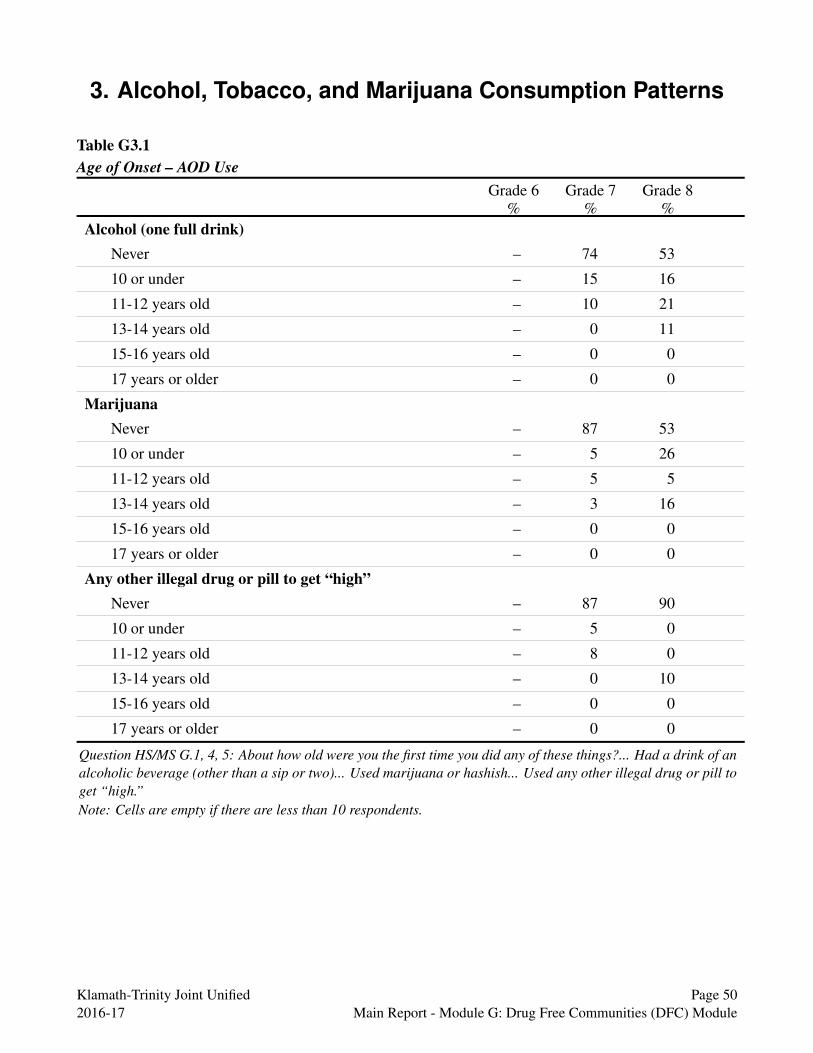
3. Alcohol, Tobacco, and Marijuana Consumption Patterns
Table G3.1 Age of Onset – AOD Use
Grade 6 Grade 7 Grade 8 % % %
Alcohol (one full drink) Never – 74 53
10 or under – 15 16
11-12 years old – 10 21
13-14 years old – 0 11
15-16 years old – 0 0
17 years or older – 0 0
Marijuana Never – 87 53
10 or under – 5 26
11-12 years old – 5 5
13-14 years old – 3 16
15-16 years old – 0 0
17 years or older – 0 0
Any other illegal drug or pill to get “high” Never – 87 90
10 or under – 5 0
11-12 years old – 8 0
13-14 years old – 0 10
15-16 years old – 0 0
17 years or older – 0 0
Question HS/MS G.1, 4, 5: About how old were you the first time you did any of these things?... Had a drink of an alcoholic beverage (other than a sip or two)... Used marijuana or hashish... Used any other illegal drug or pill to get “high.” Note: Cells are empty if there are less than 10 respondents.
Klamath-Trinity Joint Unified Page 50 2016-17 Main Report - Module G: Drug Free Communities (DFC) Module

Table G3.2 Age of Onset – Tobacco Use
Grade 6 Grade 7 Grade 8 % % %
Smoked part or all of a cigarette Never – 82 65
10 or under – 13 15
11-12 years old – 5 10
13-14 years old – 0 10
15-16 years old – 0 0
17 years or older – 0 0
Smokeless tobacco Never – 90 74
10 or under – 5 5
11-12 years old – 5 11
13-14 years old – 0 11
15-16 years old – 0 0
17 years or older – 0 0
Question HS G.2, 3: About how old were you the first time you did any of these things?... Smoked part or all of a cigarette... Used smokeless tobacco or other tobacco products. Note: Cells are empty if there are less than 10 respondents.
Table G3.3 Prescription Drug Use, Past 30 Days
Grade 6 Grade 7 Grade 8 % % %
No – 94 95
Yes – 6 5
Question HS G.31/MS G.24: During the past 30 days, have you used prescription drugs not prescribed to you? Note: Cells are empty if there are less than 10 respondents.
Klamath-Trinity Joint Unified Page 51 2016-17 Main Report - Module G: Drug Free Communities (DFC) Module
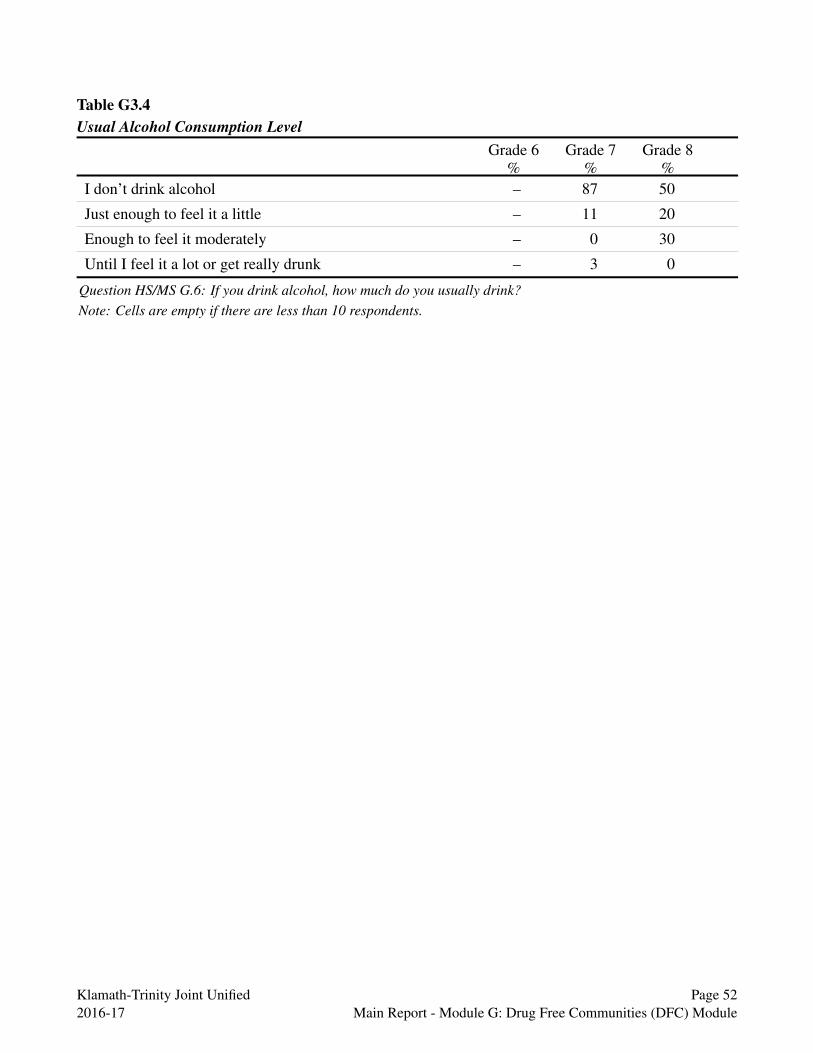
Table G3.4 Usual Alcohol Consumption Level
Grade 6 Grade 7 Grade 8 % % %
I don’t drink alcohol – 87 50
Just enough to feel it a little – 11 20
Enough to feel it moderately – 0 30
Until I feel it a lot or get really drunk – 3 0
Question HS/MS G.6: If you drink alcohol, how much do you usually drink? Note: Cells are empty if there are less than 10 respondents.
Klamath-Trinity Joint Unified Page 52 2016-17 Main Report - Module G: Drug Free Communities (DFC) Module

4. Supports to Reduce AOD Use
Table G4.1 Talked with Parent About ATOD Use
Grade 6 %
Grade 7 %
Grade 8 %
No – 56 40
Yes – 44 60
Question HS G.17/MS G.11: During the past 12 months, have you talked with at least one of your parents or guardians about the dangers of tobacco, alcohol, or drug use? Note: Cells are empty if there are less than 10 respondents.
Klamath-Trinity Joint Unified Page 53 2016-17 Main Report - Module G: Drug Free Communities (DFC) Module
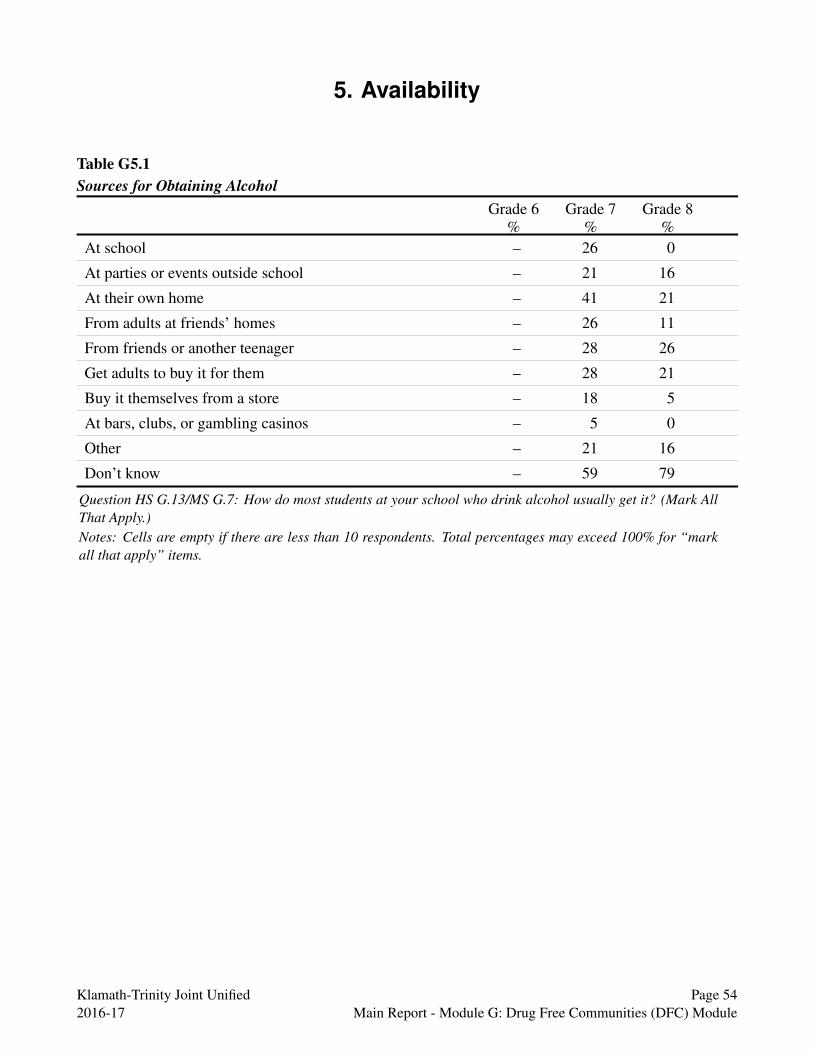
5. Availability
Table G5.1 Sources for Obtaining Alcohol
Grade 6 Grade 7 Grade 8 % % %
At school – 26 0
At parties or events outside school – 21 16
At their own home – 41 21
From adults at friends’ homes – 26 11
From friends or another teenager – 28 26
Get adults to buy it for them – 28 21
Buy it themselves from a store – 18 5
At bars, clubs, or gambling casinos – 5 0
Other – 21 16
Don’t know – 59 79
Question HS G.13/MS G.7: How do most students at your school who drink alcohol usually get it? (Mark All That Apply.) Notes: Cells are empty if there are less than 10 respondents. Total percentages may exceed 100% for “mark all that apply” items.
Klamath-Trinity Joint Unified Page 54 2016-17 Main Report - Module G: Drug Free Communities (DFC) Module

6. Influences on ATOD Use
Table G6.1 Personal Disapproval of AOD Use
Grade 6 Grade 7 Grade 8 % % %
Having one or two drinks of any alcoholic beverage nearly every day
Neither approve nor disapprove – 41 45
Somewhat disapprove – 8 45
Strongly disapprove – 51 10
Trying marijuana or hashish once or twice Neither approve nor disapprove – 46 65
Somewhat disapprove – 14 25
Strongly disapprove – 41 10
Using marijuana once a month or more Neither approve nor disapprove – 46 70
Somewhat disapprove – 14 20
Strongly disapprove – 41 10
Question HS G.14-16/MS G.8-10: How do you feel about someone your age doing the following?... Having one or two drinks of any alcoholic beverage nearly every day... Trying marijuana or hashish once or twice... Using marijuana once a month or more.
Note: Cells are empty if there are less than 10 respondents.
Table G6.2 Perceived Risks Associated with Prescription Drug Use
Grade 6 Grade 7 Grade 8 % % %
Use prescription drugs that are not prescribed to them Great risk – 43 40
Moderate risk – 14 25
Slight risk – 6 15
No risk – 9 0
I don’t know – 29 20
Question HS G.32/MS G.25: How much do you think people risk harming themselves physically or in other ways if they... use prescription drugs that are not prescribed to them... take one or two drinks of an alcoholic beverage nearly every day? Note: Cells are empty if there are less than 10 respondents.
Klamath-Trinity Joint Unified Page 55 2016-17 Main Report - Module G: Drug Free Communities (DFC) Module
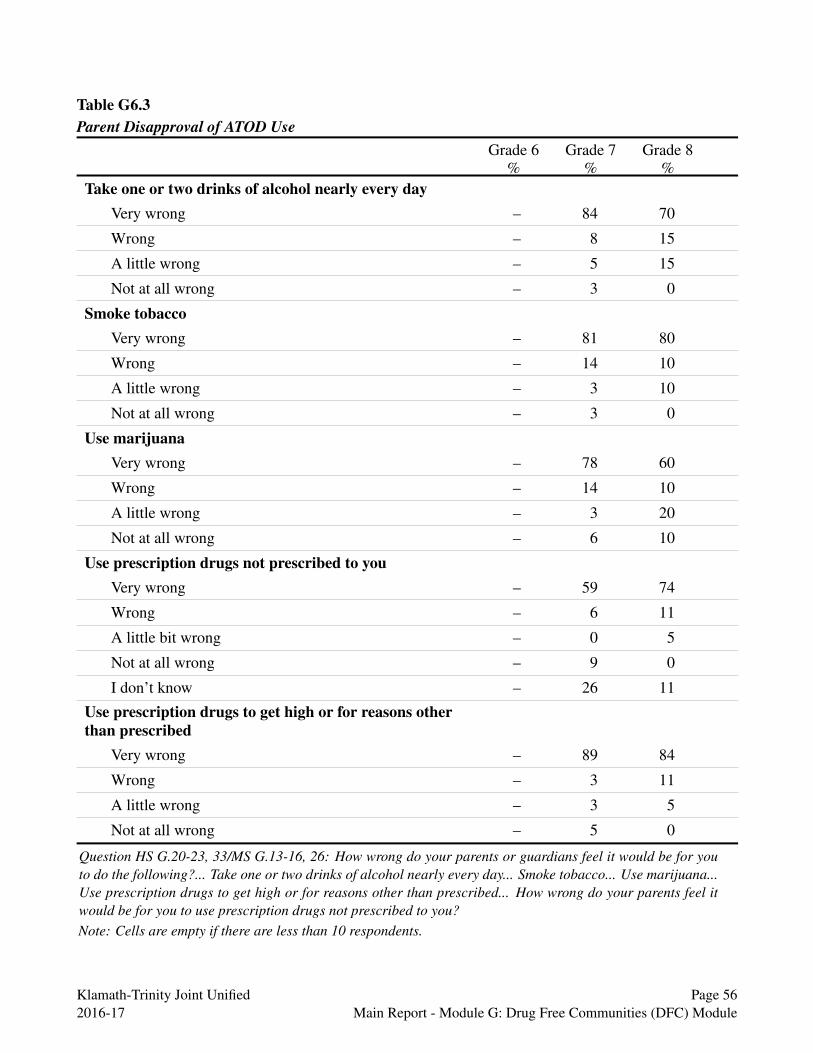
Table G6.3 Parent Disapproval of ATOD Use
Grade 6 Grade 7 Grade 8 % % %
Take one or two drinks of alcohol nearly every day Very wrong – 84 70
Wrong – 8 15
A little wrong – 5 15
Not at all wrong – 3 0
Smoke tobacco Very wrong – 81 80
Wrong – 14 10
A little wrong – 3 10
Not at all wrong – 3 0
Use marijuana Very wrong – 78 60
Wrong – 14 10
A little wrong – 3 20
Not at all wrong – 6 10
Use prescription drugs not prescribed to you Very wrong – 59 74
Wrong – 6 11
A little bit wrong – 0 5
Not at all wrong – 9 0
I don’t know – 26 11
Use prescription drugs to get high or for reasons other than prescribed
Very wrong – 89 84
Wrong – 3 11
A little wrong – 3 5
Not at all wrong – 5 0
Question HS G.20-23, 33/MS G.13-16, 26: How wrong do your parents or guardians feel it would be for you to do the following?... Take one or two drinks of alcohol nearly every day... Smoke tobacco... Use marijuana... Use prescription drugs to get high or for reasons other than prescribed... How wrong do your parents feel it would be for you to use prescription drugs not prescribed to you? Note: Cells are empty if there are less than 10 respondents.
Klamath-Trinity Joint Unified Page 56 2016-17 Main Report - Module G: Drug Free Communities (DFC) Module

Table G6.4 Peer Disapproval of ATOD Use
Grade 6 Grade 7 Grade 8 % % %
Take one or two drinks of alcohol nearly every day Very wrong – 64 40
Wrong – 17 5
A little wrong – 8 25
Not at all wrong – 11 30
Smoke tobacco Very wrong – 61 55
Wrong – 17 5
A little wrong – 11 15
Not at all wrong – 11 25
Use marijuana Very wrong – 61 37
Wrong – 14 11
A little wrong – 11 11
Not at all wrong – 14 42
Use prescription drugs not prescribed to you Very wrong – 46 50
Wrong – 9 20
A little bit wrong – 9 10
Not at all wrong – 6 15
I don’t know – 31 5
Use prescription drugs to get high or for reasons other than prescribed
Very wrong – 69 60
Wrong – 11 10
A little wrong – 8 15
Not at all wrong – 11 15
Question HS G.24-27, 34/MS G.17-20. 27: How wrong would your close friends feel it would be if you did the following?... Take one or two drinks of alcohol nearly every day... Smoke tobacco... Use marijuana... Use prescription drugs to get high or for reasons other than prescribed... How wrong do your friends feel it would be for you to use prescription drugs not prescribed to you? Note: Cells are empty if there are less than 10 respondents.
Klamath-Trinity Joint Unified Page 57 2016-17 Main Report - Module G: Drug Free Communities (DFC) Module
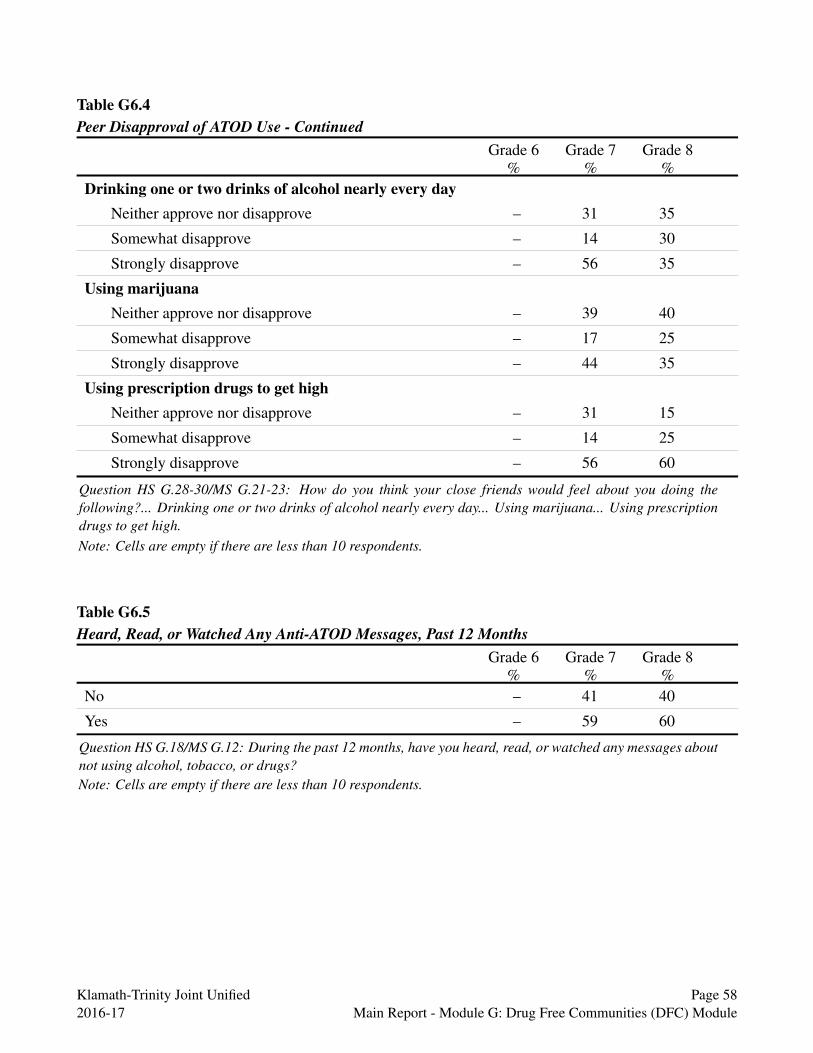
Table G6.4 Peer Disapproval of ATOD Use - Continued
Grade 6 Grade 7 Grade 8 % % %
Drinking one or two drinks of alcohol nearly every day Neither approve nor disapprove – 31 35
Somewhat disapprove – 14 30
Strongly disapprove – 56 35
Using marijuana Neither approve nor disapprove – 39 40
Somewhat disapprove – 17 25
Strongly disapprove – 44 35
Using prescription drugs to get high Neither approve nor disapprove – 31 15
Somewhat disapprove – 14 25
Strongly disapprove – 56 60
Question HS G.28-30/MS G.21-23: How do you think your close friends would feel about you doing the following?... Drinking one or two drinks of alcohol nearly every day... Using marijuana... Using prescription drugs to get high. Note: Cells are empty if there are less than 10 respondents.
Table G6.5 Heard, Read, or Watched Any Anti-ATOD Messages, Past 12 Months
Grade 6 Grade 7 Grade 8 % % %
No – 41 40
Yes – 59 60
Question HS G.18/MS G.12: During the past 12 months, have you heard, read, or watched any messages about not using alcohol, tobacco, or drugs? Note: Cells are empty if there are less than 10 respondents.
Klamath-Trinity Joint Unified Page 58 2016-17 Main Report - Module G: Drug Free Communities (DFC) Module

Z. Klamath-Trinity Joint Unified Custom Questions
1. Module Sample
Table Z1.1 Student Sample for Custom Questions
Grade 6 Grade 7 Grade 8
Student Sample Size Target sample – 69 66
Final number – 35 20
Average Response Rate – 51% 30%
Klamath-Trinity Joint Unified Page 59 2016-17 Main Report - Module Z: Klamath-Trinity Joint Unified Custom Questions

2. Custom Questions Table AZ.2.1 How do most students at your school who drink alcohol usually get it? (Mark all that apply)
Grade
7th 8th Total % % %
Friends at school 32 15 26 Friends outside of school 29 25 28 Parents with their knowledge 29 5 20 Parents without their knowledge 35 5 24 Friends family members with their knowledge 29 10 22 Friends family members without their knowledge 26 0 17 Strangers purchase it 21 10 17 Known adults purchase it 21 10 17 Buy it themselves 24 10 19 Steal it 32 10 24 Other 26 20 24 Don’t know 62 70 65
Question HS/MS Z.1. Notes: Columns are not displayed if there are less than 10 respondents. Total percentages may exceed 100% for “mark all that apply” items.
Table AZ.2.2 How do most students at your school who use marijuana usually get it? (Mark all that apply)
Grade
7th 8th Total % % %
Friends at school 41 32 38 Friends outside of school 35 26 32 Parents with their knowledge 21 21 21 Parents without their knowledge 21 26 23 Friends family members with their knowledge 29 16 25 Friends family members without their knowledge 21 21 21 From a medical marijuana dispensary 24 0 15 Buy it at school 29 21 26 Buy it outside school 44 16 34 Steal it 29 11 23 Other 24 26 25 Don’t know 53 58 55
Question HS/MS Z.2. Notes: Columns are not displayed if there are less than 10 respondents. Total percentages may exceed 100% for “mark all that apply” items.
Klamath-Trinity Joint Unified Page 60 2016-17 Main Report - Module Z: Klamath-Trinity Joint Unified Custom Questions

Table AZ.2.3 How do most students at your school who use prescription drugs (without a doctor or dentist’s order) usually get them? (Mark all that apply)
Grade
7th 8th Total % % %
Friends at school 24 16 21 Friends outside of school 21 5 15 Parents with their knowledge 21 0 13 Parents without their knowledge 18 11 15 Friends family members with their knowledge 18 11 15 Friends family members without their knowledge 18 11 15 Buy it online 9 0 6 Buy it at school 30 11 23 Buy it outside school 24 11 19 Steal it 21 16 19 Other 15 5 12 Don’t know 70 79 73
Question HS/MS Z.3. Notes: Columns are not displayed if there are less than 10 respondents. Total percentages may exceed 100% for “mark all that apply” items.
Table AZ.2.4 How do most students at your school who use other illegal drugs (ecstasy, methamphetamine, etc.) get them? (Mark all that apply)
Grade
7th 8th Total % % %
Friends at school 21 0 13 Friends outside of school 21 0 13 Parents with their knowledge 18 5 13 Parents without their knowledge 18 0 12 Friends family members with their knowledge 18 0 12 Friends family members without their knowledge 18 5 13 Buy it online 12 0 8 Buy it at school 24 5 17 Buy it outside school 24 5 17 Steal it 15 11 13 Other 18 0 12 Don’t know 73 89 79
Question HS/MS Z.4. Notes: Columns are not displayed if there are less than 10 respondents. Total percentages may exceed 100% for “mark all that apply” items.
Klamath-Trinity Joint Unified Page 61 2016-17 Main Report - Module Z: Klamath-Trinity Joint Unified Custom Questions
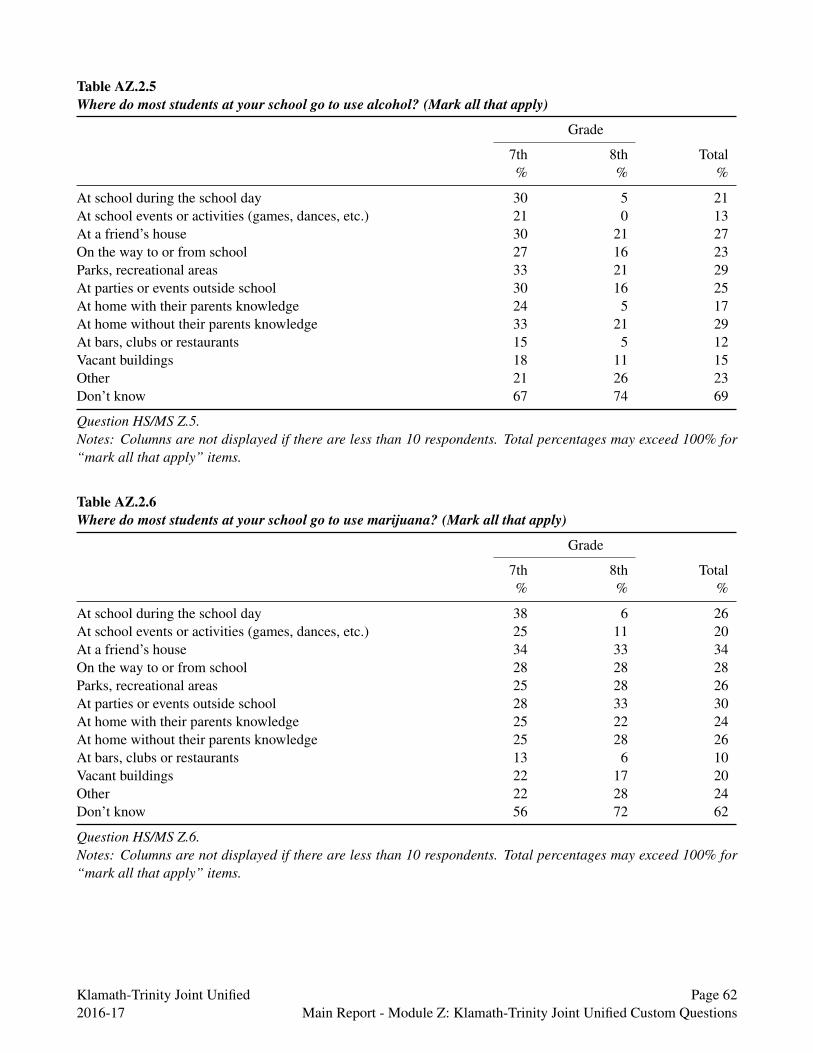
Table AZ.2.5 Where do most students at your school go to use alcohol? (Mark all that apply)
Grade
7th 8th Total % % %
At school during the school day 30 5 21 At school events or activities (games, dances, etc.) 21 0 13 At a friend’s house 30 21 27 On the way to or from school 27 16 23 Parks, recreational areas 33 21 29 At parties or events outside school 30 16 25 At home with their parents knowledge 24 5 17 At home without their parents knowledge 33 21 29 At bars, clubs or restaurants 15 5 12 Vacant buildings 18 11 15 Other 21 26 23 Don’t know 67 74 69
Question HS/MS Z.5. Notes: Columns are not displayed if there are less than 10 respondents. Total percentages may exceed 100% for “mark all that apply” items.
Table AZ.2.6 Where do most students at your school go to use marijuana? (Mark all that apply)
Grade
7th 8th Total % % %
At school during the school day 38 6 26 At school events or activities (games, dances, etc.) 25 11 20 At a friend’s house 34 33 34 On the way to or from school 28 28 28 Parks, recreational areas 25 28 26 At parties or events outside school 28 33 30 At home with their parents knowledge 25 22 24 At home without their parents knowledge 25 28 26 At bars, clubs or restaurants 13 6 10 Vacant buildings 22 17 20 Other 22 28 24 Don’t know 56 72 62
Question HS/MS Z.6. Notes: Columns are not displayed if there are less than 10 respondents. Total percentages may exceed 100% for “mark all that apply” items.
Klamath-Trinity Joint Unified Page 62 2016-17 Main Report - Module Z: Klamath-Trinity Joint Unified Custom Questions
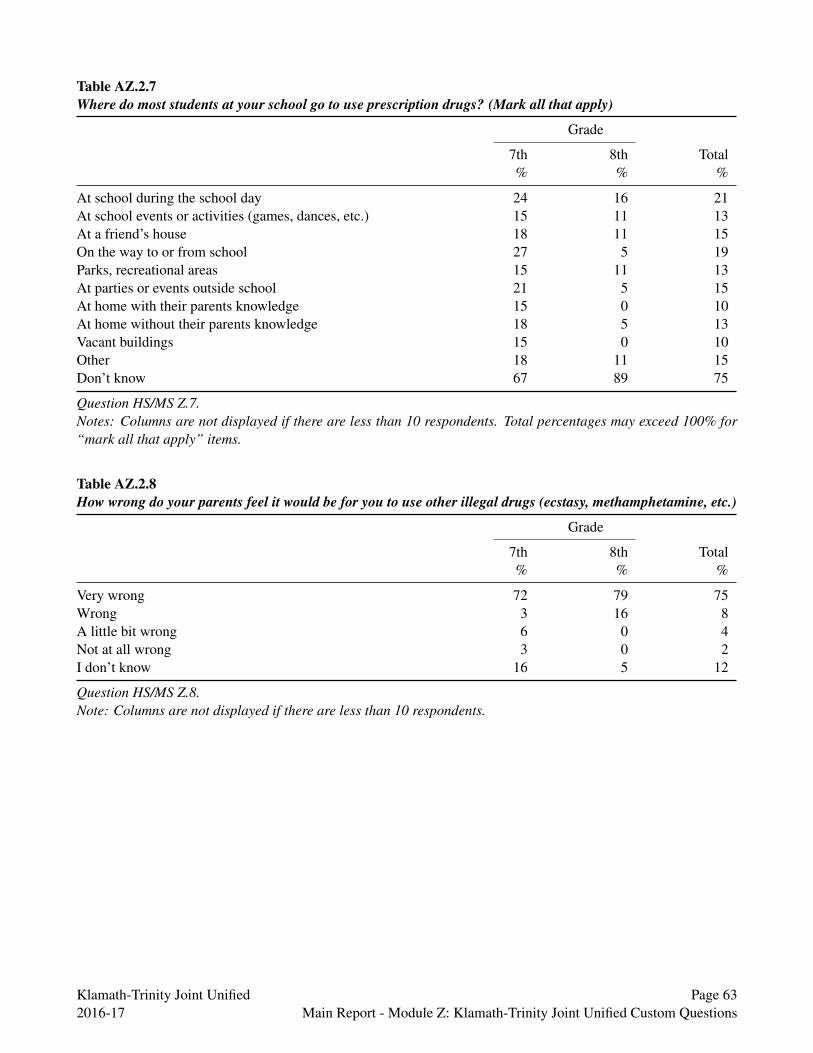
Table AZ.2.7 Where do most students at your school go to use prescription drugs? (Mark all that apply)
Grade
7th 8th Total % % %
At school during the school day 24 16 21 At school events or activities (games, dances, etc.) 15 11 13 At a friend’s house 18 11 15 On the way to or from school 27 5 19 Parks, recreational areas 15 11 13 At parties or events outside school 21 5 15 At home with their parents knowledge 15 0 10 At home without their parents knowledge 18 5 13 Vacant buildings 15 0 10 Other 18 11 15 Don’t know 67 89 75
Question HS/MS Z.7. Notes: Columns are not displayed if there are less than 10 respondents. Total percentages may exceed 100% for “mark all that apply” items.
Table AZ.2.8 How wrong do your parents feel it would be for you to use other illegal drugs (ecstasy, methamphetamine, etc.)
Grade
7th 8th Total % % %
Very wrong 72 79 75 Wrong 3 16 8 A little bit wrong 6 0 4 Not at all wrong 3 0 2 I don’t know 16 5 12
Question HS/MS Z.8. Note: Columns are not displayed if there are less than 10 respondents.
Klamath-Trinity Joint Unified Page 63 2016-17 Main Report - Module Z: Klamath-Trinity Joint Unified Custom Questions

Table AZ.2.9 Adults at school notice when kids come to school under the influence of alcohol or drugs.
Grade
7th 8th Total % % %
Very much agree Agree Disagree Very much disagree
25 22 28 25
26 21 26 26
25 22 27 25
Question HS/MS Z.9. Note: Columns are not displayed if there are less than 10 respondents.
Table AZ.2.10 When kids come to school under the influence of alcohol or drugs, the adults at school do something about it.
Grade
7th 8th Total % % %
Very much agree 31 26 29 Agree 25 32 27 Disagree 25 21 24 Very much disagree 19 21 20
Question HS/MS Z.10. Note: Columns are not displayed if there are less than 10 respondents.
Table AZ.2.11 During the past 12 months, did you ever seriously consider attempting suicide?
Grade
7th %
8th %
Total %
No Yes
74 26
80 20
76 24
Question HS/MS Z.11. Note: Columns are not displayed if there are less than 10 respondents.
Klamath-Trinity Joint Unified Page 64 2016-17 Main Report - Module Z: Klamath-Trinity Joint Unified Custom Questions
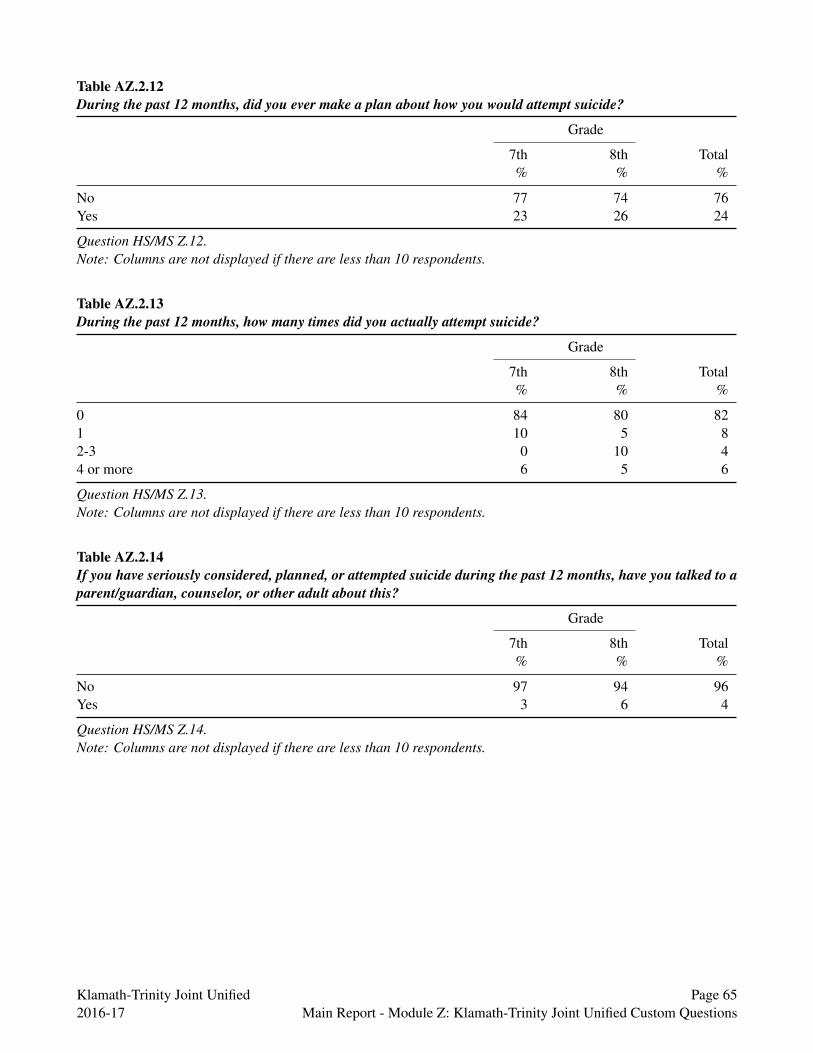
Table AZ.2.12 During the past 12 months, did you ever make a plan about how you would attempt suicide?
Grade
7th %
8th %
Total %
No Yes
77 23
74 26
76 24
Question HS/MS Z.12. Note: Columns are not displayed if there are less than 10 respondents.
Table AZ.2.13 During the past 12 months, how many times did you actually attempt suicide?
Grade
7th %
8th %
Total %
0 1 2-3 4 or more
84 10 0 6
80 5
10 5
82 8 4 6
Question HS/MS Z.13. Note: Columns are not displayed if there are less than 10 respondents.
Table AZ.2.14 If you have seriously considered, planned, or attempted suicide during the past 12 months, have you talked to a parent/guardian, counselor, or other adult about this?
Grade
7th %
8th %
Total %
No Yes
97 3
94 6
96 4
Question HS/MS Z.14. Note: Columns are not displayed if there are less than 10 respondents.
Klamath-Trinity Joint Unified Page 65 2016-17 Main Report - Module Z: Klamath-Trinity Joint Unified Custom Questions

Table AZ.2.15 In the past week, on how many days did you exercise or do physical activity for at least 60 minutes that made you sweat and breathe hard? (For example, basketball, soccer, running, swimming laps, fast bicycling, fast dancing or similar aerobic activities.)
Grade
7th 8th Total % % %
0 26 21 24 1 13 5 10 2 10 21 14 3 10 11 10 4 10 5 8 5 0 16 6 6 0 11 4 7 32 11 24
Question HS/MS Z.15. Note: Columns are not displayed if there are less than 10 respondents.
Table AZ.2.16 In an average week, on how many days do you have physical activity in your physical education class (P.E. or gym)?
Grade
7th 8th Total % % %
0 14 11 13 1 17 0 10 2 14 0 8 3 10 5 8 4 7 0 4 5 38 84 56
Question HS/MS Z.16. Note: Columns are not displayed if there are less than 10 respondents.
Klamath-Trinity Joint Unified Page 66 2016-17 Main Report - Module Z: Klamath-Trinity Joint Unified Custom Questions
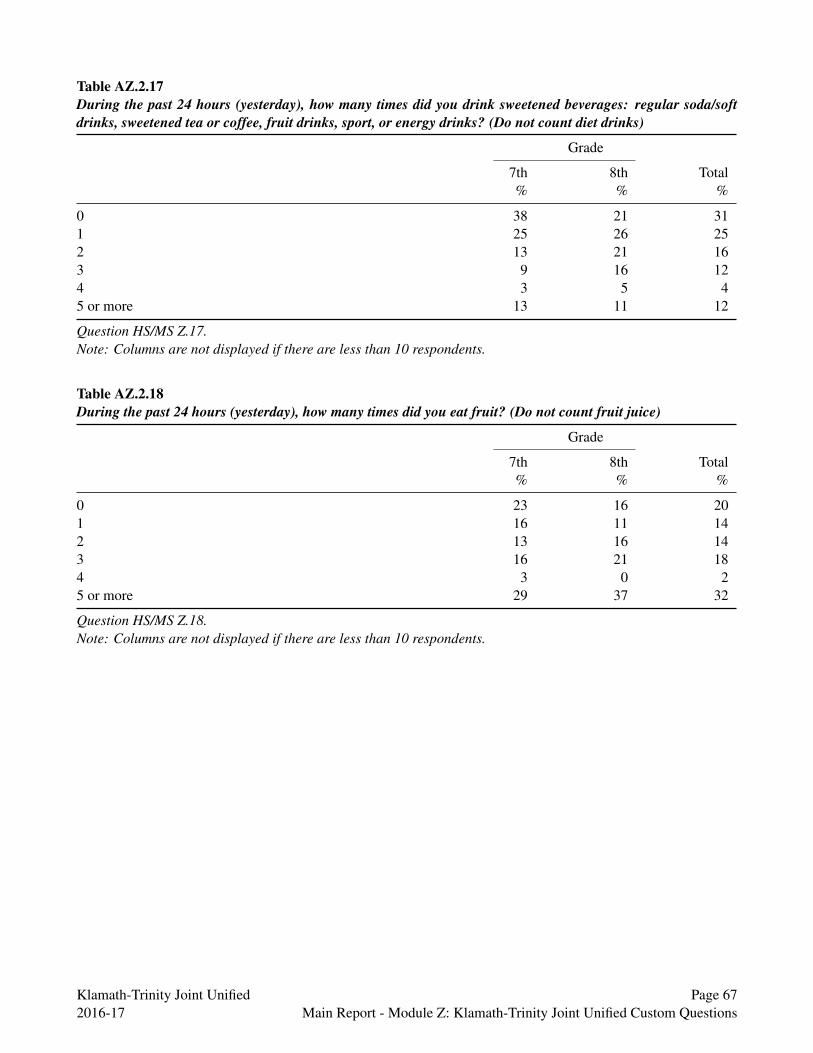
Table AZ.2.17 During the past 24 hours (yesterday), how many times did you drink sweetened beverages: regular soda/soft drinks, sweetened tea or coffee, fruit drinks, sport, or energy drinks? (Do not count diet drinks)
Grade
7th 8th Total % % %
0 38 21 31 1 25 26 25 2 13 21 16 3 9 16 12 4 3 5 4 5 or more 13 11 12
Question HS/MS Z.17. Note: Columns are not displayed if there are less than 10 respondents.
Table AZ.2.18 During the past 24 hours (yesterday), how many times did you eat fruit? (Do not count fruit juice)
Grade
7th 8th Total % % %
0 23 16 20 1 16 11 14 2 13 16 14 3 16 21 18 4 3 0 2 5 or more 29 37 32
Question HS/MS Z.18. Note: Columns are not displayed if there are less than 10 respondents.
Klamath-Trinity Joint Unified Page 67 2016-17 Main Report - Module Z: Klamath-Trinity Joint Unified Custom Questions
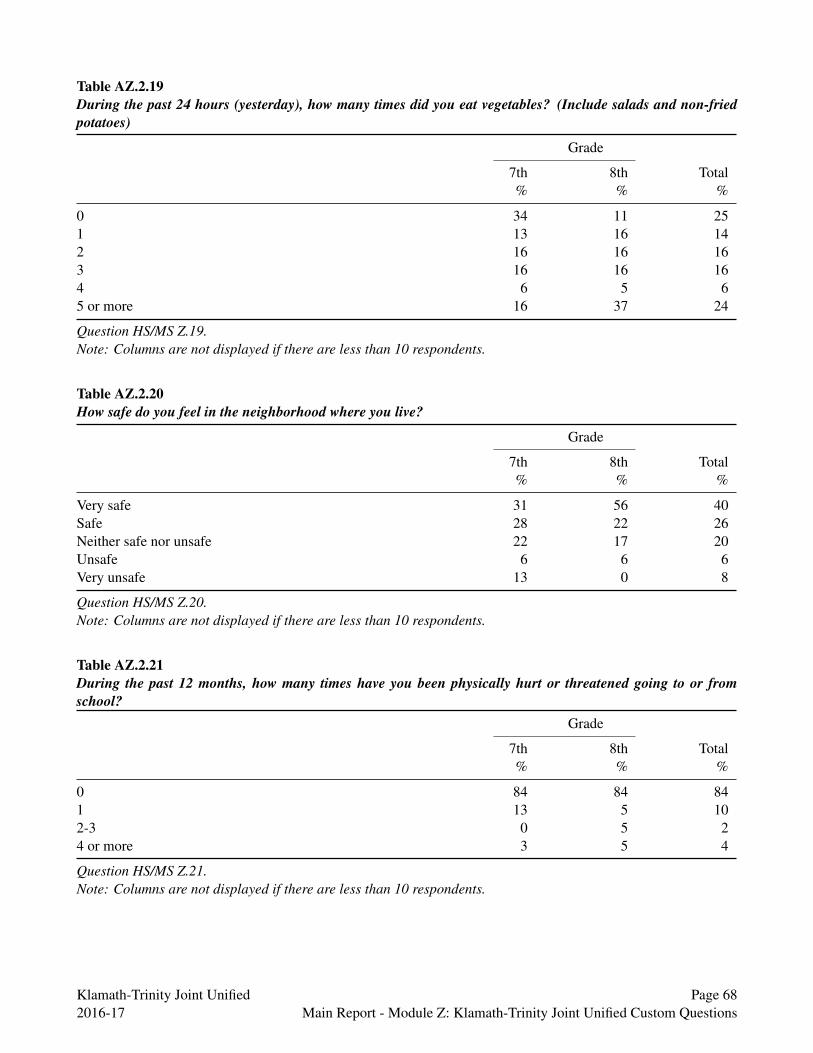
Table AZ.2.19 During the past 24 hours (yesterday), how many times did you eat vegetables? (Include salads and non-fried potatoes)
Grade
7th 8th Total % % %
0 34 11 25 1 13 16 14 2 16 16 16 3 16 16 16 4 6 5 6 5 or more 16 37 24
Question HS/MS Z.19. Note: Columns are not displayed if there are less than 10 respondents.
Table AZ.2.20 How safe do you feel in the neighborhood where you live?
Grade
7th 8th Total % % %
Very safe 31 56 40 Safe 28 22 26 Neither safe nor unsafe 22 17 20 Unsafe 6 6 6 Very unsafe 13 0 8
Question HS/MS Z.20. Note: Columns are not displayed if there are less than 10 respondents.
Table AZ.2.21 During the past 12 months, how many times have you been physically hurt or threatened going to or from school?
Grade
7th %
8th %
Total %
0 1 2-3 4 or more
84 13 0 3
84 5 5 5
84 10 2 4
Question HS/MS Z.21. Note: Columns are not displayed if there are less than 10 respondents.
Klamath-Trinity Joint Unified Page 68 2016-17 Main Report - Module Z: Klamath-Trinity Joint Unified Custom Questions
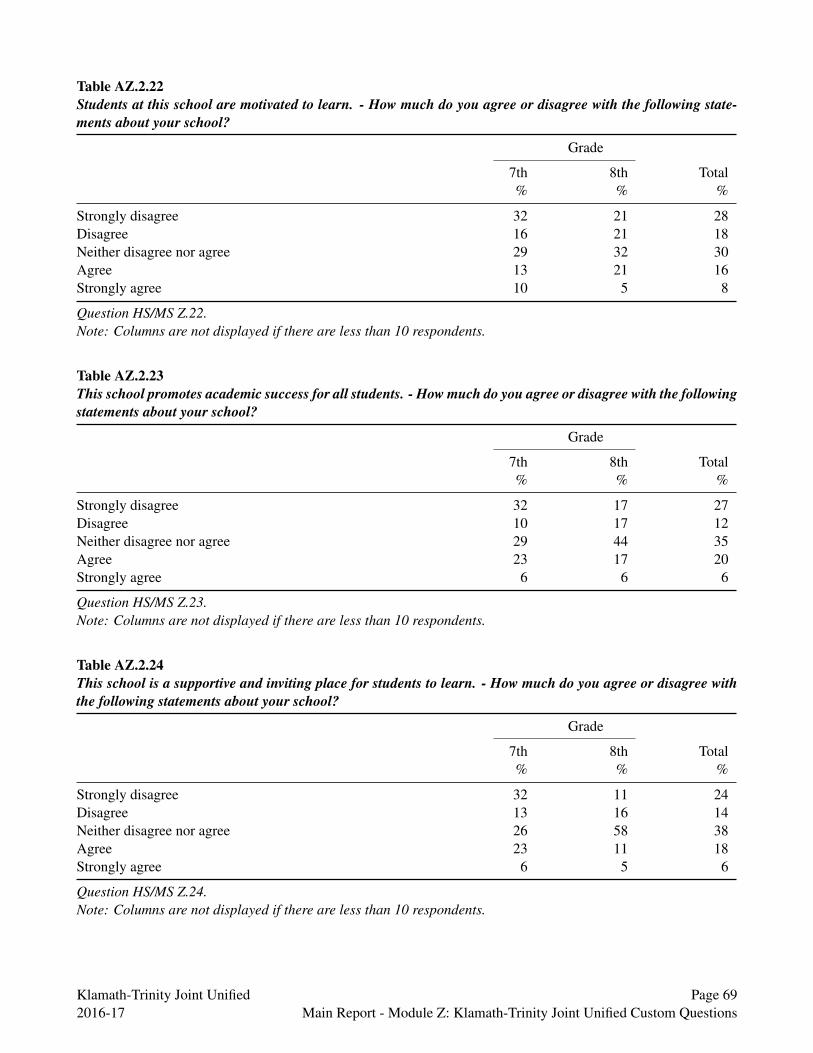
Table AZ.2.22 Students at this school are motivated to learn. - How much do you agree or disagree with the following statements about your school?
Grade
7th 8th Total % % %
Strongly disagree 32 21 28 Disagree 16 21 18 Neither disagree nor agree 29 32 30 Agree 13 21 16 Strongly agree 10 5 8
Question HS/MS Z.22. Note: Columns are not displayed if there are less than 10 respondents.
Table AZ.2.23 This school promotes academic success for all students. - How much do you agree or disagree with the following statements about your school?
Grade
7th 8th Total % % %
Strongly disagree 32 17 27 Disagree 10 17 12 Neither disagree nor agree 29 44 35 Agree 23 17 20 Strongly agree 6 6 6
Question HS/MS Z.23. Note: Columns are not displayed if there are less than 10 respondents.
Table AZ.2.24 This school is a supportive and inviting place for students to learn. - How much do you agree or disagree with the following statements about your school?
Grade
7th 8th Total % % %
Strongly disagree 32 11 24 Disagree 13 16 14 Neither disagree nor agree 26 58 38 Agree 23 11 18 Strongly agree 6 5 6
Question HS/MS Z.24. Note: Columns are not displayed if there are less than 10 respondents.
Klamath-Trinity Joint Unified Page 69 2016-17 Main Report - Module Z: Klamath-Trinity Joint Unified Custom Questions

Table AZ.2.25 Teachers go out of their way to help students. - How much do you agree or disagree with the following statements about your school?
Grade
7th 8th Total % % %
Strongly disagree 26 21 24 Disagree 3 5 4 Neither disagree nor agree 32 58 42 Agree 29 11 22 Strongly agree 10 5 8
Question HS/MS Z.25. Note: Columns are not displayed if there are less than 10 respondents.
Table AZ.2.26 Adults at this school treat all students with respect. - How much do you agree or disagree with the following statements about your school?
Grade
7th 8th Total % % %
Strongly disagree 35 26 32 Disagree 6 11 8 Neither disagree nor agree 29 53 38 Agree 26 5 18 Strongly agree 3 5 4
Question HS/MS Z.26. Note: Columns are not displayed if there are less than 10 respondents.
Table AZ.2.27 Students treat teachers with respect. - How much do you agree or disagree with the following statements about your school?
Grade
7th 8th Total % % %
Strongly disagree 26 21 24 Disagree 13 11 12 Neither disagree nor agree 42 47 44 Agree 16 11 14 Strongly agree 3 11 6
Question HS/MS Z.27. Note: Columns are not displayed if there are less than 10 respondents.
Klamath-Trinity Joint Unified Page 70 2016-17 Main Report - Module Z: Klamath-Trinity Joint Unified Custom Questions
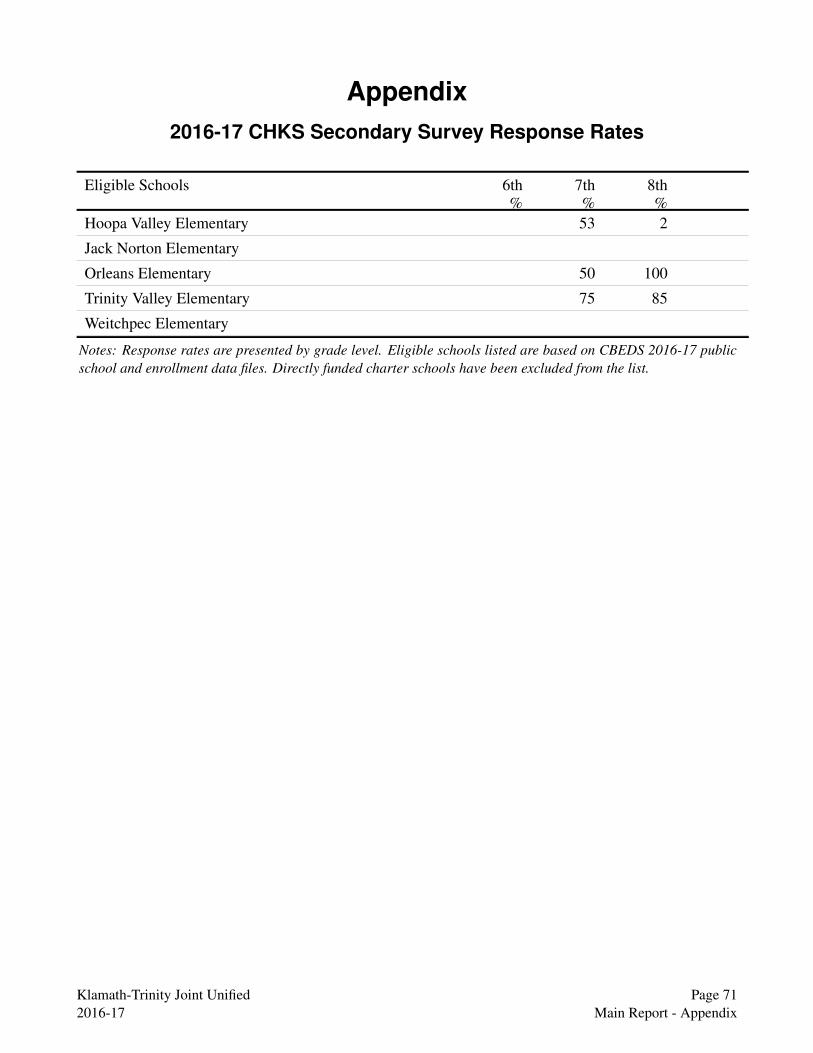
Appendix 2016-17 CHKS Secondary Survey Response Rates
Eligible Schools 6th 7th 8th % % %
Hoopa Valley Elementary 53 2
Jack Norton Elementary
Orleans Elementary 50 100
Trinity Valley Elementary 75 85
Weitchpec Elementary
Notes: Response rates are presented by grade level. Eligible schools listed are based on CBEDS 2016-17 public school and enrollment data files. Directly funded charter schools have been excluded from the list.
Klamath-Trinity Joint Unified Page 71 2016-17 Main Report - Appendix