kknn
15
Package ‘kknn’ December 16, 2013 Title Weighted k-Nearest Neighbors Version 1.2-3 Date 2013-12-16 Author Klaus Schliep & Klaus Hechenbichler Description Weighted k-Nearest Neighbors Classification, Regression and Clustering Maintainer Klaus Schliep <[email protected]> Depends R (>= 2.10) Imports igraph (>= 0.6), Matrix, stats License GPL (>= 2) NeedsCompilation yes Repository CRAN Date/Publication 2013-12-16 12:58:53 R topics documented: kknn-package ........................................ 2 contr.dummy ........................................ 2 glass ............................................. 3 ionosphere .......................................... 4 kknn ............................................. 5 miete ............................................ 7 simulation .......................................... 9 specClust .......................................... 10 train.kknn .......................................... 12 Index 15 1
-
Upload
leekiangyen -
Category
Documents
-
view
100 -
download
2
Transcript of kknn
Package ‘kknn’December 16, 2013
Title Weighted k-Nearest Neighbors
Version 1.2-3
Date 2013-12-16
Author Klaus Schliep & Klaus Hechenbichler
Description Weighted k-Nearest Neighbors Classification, Regression and Clustering
Maintainer Klaus Schliep <[email protected]>
Depends R (>= 2.10)
Imports igraph (>= 0.6), Matrix, stats
License GPL (>= 2)
NeedsCompilation yes
Repository CRAN
Date/Publication 2013-12-16 12:58:53
R topics documented:kknn-package . . . . . . . . . . . . . . . . . . . . . . . . . . . . . . . . . . . . . . . . 2contr.dummy . . . . . . . . . . . . . . . . . . . . . . . . . . . . . . . . . . . . . . . . 2glass . . . . . . . . . . . . . . . . . . . . . . . . . . . . . . . . . . . . . . . . . . . . . 3ionosphere . . . . . . . . . . . . . . . . . . . . . . . . . . . . . . . . . . . . . . . . . . 4kknn . . . . . . . . . . . . . . . . . . . . . . . . . . . . . . . . . . . . . . . . . . . . . 5miete . . . . . . . . . . . . . . . . . . . . . . . . . . . . . . . . . . . . . . . . . . . . 7simulation . . . . . . . . . . . . . . . . . . . . . . . . . . . . . . . . . . . . . . . . . . 9specClust . . . . . . . . . . . . . . . . . . . . . . . . . . . . . . . . . . . . . . . . . . 10train.kknn . . . . . . . . . . . . . . . . . . . . . . . . . . . . . . . . . . . . . . . . . . 12
Index 15
1

2 contr.dummy
kknn-package Weighted k-Nearest Neighbors Classification and Clustering
Description
Weighted k-Nearest Neighbors Classification, Regression and spectral Clustering
The complete list of functions can be displayed with library(help = kknn).
Author(s)
Klaus SchliepKlaus Hechenbichler
Maintainer: Klaus Schliep <[email protected]>
References
Hechenbichler K. and Schliep K.P. (2004) Weighted k-Nearest-Neighbor Techniques and OrdinalClassification, Discussion Paper 399, SFB 386, Ludwig-Maximilians University Munich (http://www.stat.uni-muenchen.de/sfb386/papers/dsp/paper399.ps)
Hechenbichler K. (2005) Ensemble-Techniken und ordinale Klassifikation, PhD-thesis
contr.dummy Contrast Matrices
Description
Returns a matrix of contrasts.
Usage
contr.dummy(n, contrasts = TRUE)contr.ordinal(n, contrasts = TRUE)contr.metric(n, contrasts = TRUE)
Arguments
n A vector containing levels of a factor, or the number of levels.
contrasts A logical value indicating whether contrasts should be computed.
Details
contr.dummy is standard dummy-coding, contr.metric has the same effect like as.numeric(makes sense of course only for ordered variables). contr.ordinal computes contrasts for ordinalvariables.

glass 3
Value
A matrix with n rows and n-1 columns for contr.ordinal, a matrix with n rows and n columns forcontr.dummy and a vector of length n for contr.metric.
Author(s)
Klaus P. Schliep <[email protected]>
References
Hechenbichler K. and Schliep K.P. (2004) Weighted k-Nearest-Neighbor Techniques and OrdinalClassification, Discussion Paper 399, SFB 386, Ludwig-Maximilians University Munich (http://www.stat.uni-muenchen.de/sfb386/papers/dsp/paper399.ps)
See Also
contrasts, contr.poly and contr.sdif
Examples
contr.metric(5)contr.ordinal(5)contr.dummy(5)
glass Glass Identification Database
Description
A data frame with 214 observations, where the problem is to predict the type of glass in terms oftheir oxide content (i.e. Na, Fe, K, etc). The study of classification of types of glass was motivatedby criminological investigation. At the scene of the crime, the glass left can be used as evidence...if it is correctly identified!
Usage
data(glass)
Format
A data frame with 214 observations on the following 11 variables.
Id Id number.
RI Refractive index.
Na Sodium (unit measurement: weight percent in corresponding oxide, as are attributes 4-10).
Mg Magnesium.
Al Aluminum.
4 ionosphere
Si Silicon.
K Potassium.
Ca Calcium.
Ba Barium.
Fe Iron.
Type Type of glass: (class attribute)1 building windows float processed2 building windows non float processed3 vehicle windows float processed4 vehicle windows non float processed (none in this database)5 containers6 tableware7 headlamps
Source
• Creator: B. German, Central Research Establishment, Home Office Forensic Science Service,Aldermaston, Reading, Berkshire RG7 4PN
• Donor: Vina Spiehler, Ph.D., DABFT, Diagnostic Products Corporation
The data have been taken from the UCI Machine Learning Database Repositoryhttp://www.ics.uci.edu/~mlearn/MLRepository.htmland were converted to R format by <[email protected]>.
Examples
data(glass)str(glass)
ionosphere Johns Hopkins University Ionosphere Database
Description
This radar data was collected by a system in Goose Bay, Labrador. This system consists of a phasedarray of 16 high-frequency antennas with a total transmitted power on the order of 6.4 kilowatts.See the paper for more details. The targets were free electrons in the ionosphere. "Good" radarreturns are those showing evidence of some type of structure in the ionosphere. "Bad" returns arethose that do not; their signals pass through the ionosphere.
Received signals were processed using an autocorrelation function whose arguments are the time ofa pulse and the pulse number. There were 17 pulse numbers for the Goose Bay system. Instances inthis database are described by 2 attributes per pulse number, corresponding to the complex valuesreturned by the function resulting from the complex electromagnetic signal.
Usage
data(ionosphere)

kknn 5
Format
A data frame with 351 observations on the following 35 variables. The first 34 continuous covari-ables are used for the prediction. The 35th attribute is either g ("good") or b ("bad") according tothe definition summarized above. This is a binary classification task.
Source
Vince Sigillito ([email protected]), Space Physics Group, Applied Physics Laboratory, JohnsHopkins University, Johns Hopkins Road, Laurel, MD 20723The data have been taken from the UCI Machine Learning Database Repositoryhttp://www.ics.uci.edu/~mlearn/MLRepository.htmland were converted to R format by <[email protected] >.
Examples
data(ionosphere)
kknn Weighted k-Nearest Neighbor Classifier
Description
Performs k-nearest neighbor classification of a test set using a training set. For each row of thetest set, the k nearest training set vectors (according to Minkowski distance) are found, and theclassification is done via the maximum of summed kernel densities. In addition even ordinal andcontinuous variables can be predicted.
Usage
kknn(formula = formula(train), train, test, na.action = na.omit(),k = 7, distance = 2, kernel = "optimal", ykernel = NULL, scale=TRUE,contrasts = c('unordered' = "contr.dummy", ordered = "contr.ordinal"))
Arguments
formula A formula object.train Matrix or data frame of training set cases.test Matrix or data frame of test set cases.na.action A function which indicates what should happen when the data contain ’NA’s.k Number of neighbors considered.distance Parameter of Minkowski distance.kernel Kernel to use. Possible choices are "rectangular" (which is standard unweighted
knn), "triangular", "epanechnikov" (or beta(2,2)), "biweight" (or beta(3,3)), "tri-weight" (or beta(4,4)), "cos", "inv", "gaussian", "rank" and "optimal".
ykernel Window width of an y-kernel, especially for prediction of ordinal classes.scale logical, scale variable to have equal sd.contrasts A vector containing the ’unordered’ and ’ordered’ contrasts to use.
6 kknn
Details
This nearest neighbor method expands knn in several directions. First it can be used not only forclassification, but also for regression and ordinal classification. Second it uses kernel functionsto weight the neighbors according to their distances. In fact, not only kernel functions but everymonotonic decreasing function f(x)∀x > 0 will work fine.
The number of neighbours used for the "optimal" kernel should be [(2(d + 4)/(d + 2))(d/(d +4))k], where k is the number that would be used for unweighted knn classification, i.e. ker-nel="rectangular". This factor (2(d+ 4)/(d+ 2))(d/(d+ 4)) is between 1.2 and 2 (see Samworth(2012) for more details).
Value
kknn returns a list-object of class kknn including the components
fitted.values Vector of predictions.
CL Matrix of classes of the k nearest neighbors.
W Matrix of weights of the k nearest neighbors.
D Matrix of distances of the k nearest neighbors.
prob Matrix of predicted class probabilities.
response Type of response variable, one of continuous, nominal or ordinal.
distance Parameter of Minkowski distance.
call The matched call.
terms The ’terms’ object used.
Author(s)
Klaus P. Schliep <[email protected]>Klaus Hechenbichler
References
Hechenbichler K. and Schliep K.P. (2004) Weighted k-Nearest-Neighbor Techniques and OrdinalClassification, Discussion Paper 399, SFB 386, Ludwig-Maximilians University Munich (http://www.stat.uni-muenchen.de/sfb386/papers/dsp/paper399.ps)
Hechenbichler K. (2005) Ensemble-Techniken und ordinale Klassifikation, PhD-thesis
Samworth, R.J. (2012) Optimal weighted nearest neighbour classifiers. Annals of Statistics, 40,2733-2763. (avaialble from http://www.statslab.cam.ac.uk/~rjs57/Research.html)
See Also
train.kknn, simulation, knn and knn1
miete 7
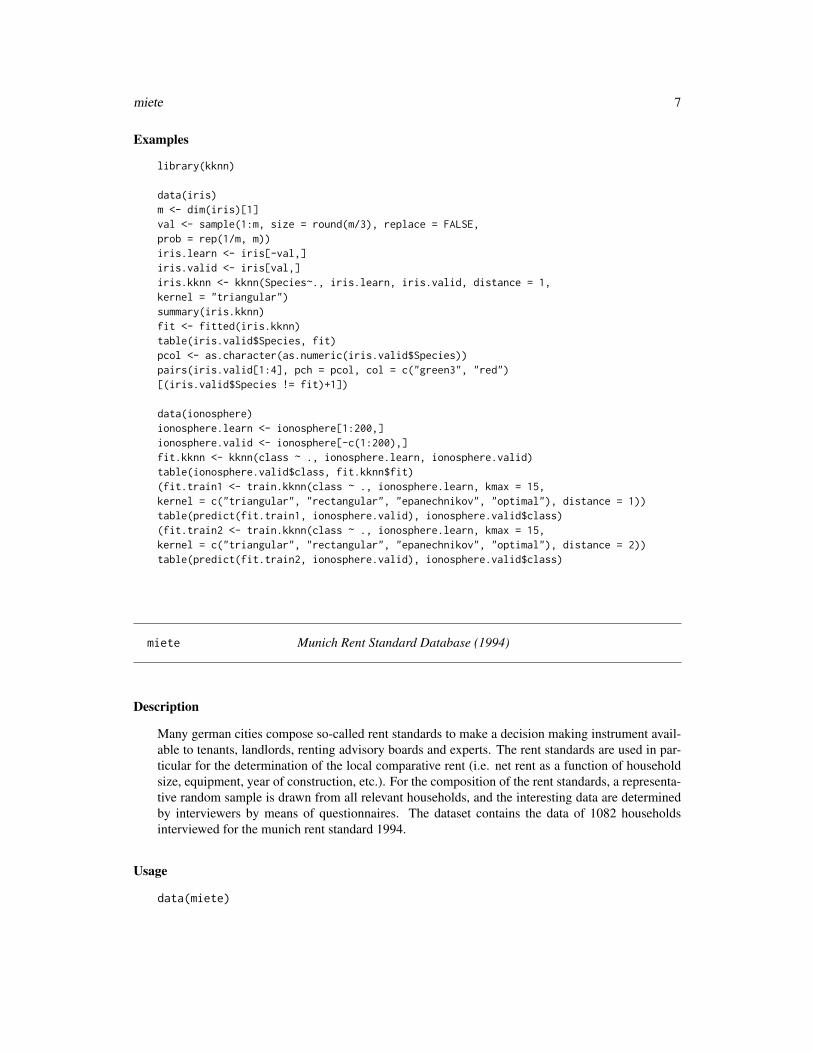
Examples
library(kknn)
data(iris)m <- dim(iris)[1]val <- sample(1:m, size = round(m/3), replace = FALSE,prob = rep(1/m, m))iris.learn <- iris[-val,]iris.valid <- iris[val,]iris.kknn <- kknn(Species~., iris.learn, iris.valid, distance = 1,kernel = "triangular")summary(iris.kknn)fit <- fitted(iris.kknn)table(iris.valid$Species, fit)pcol <- as.character(as.numeric(iris.valid$Species))pairs(iris.valid[1:4], pch = pcol, col = c("green3", "red")[(iris.valid$Species != fit)+1])
data(ionosphere)ionosphere.learn <- ionosphere[1:200,]ionosphere.valid <- ionosphere[-c(1:200),]fit.kknn <- kknn(class ~ ., ionosphere.learn, ionosphere.valid)table(ionosphere.valid$class, fit.kknn$fit)(fit.train1 <- train.kknn(class ~ ., ionosphere.learn, kmax = 15,kernel = c("triangular", "rectangular", "epanechnikov", "optimal"), distance = 1))table(predict(fit.train1, ionosphere.valid), ionosphere.valid$class)(fit.train2 <- train.kknn(class ~ ., ionosphere.learn, kmax = 15,kernel = c("triangular", "rectangular", "epanechnikov", "optimal"), distance = 2))table(predict(fit.train2, ionosphere.valid), ionosphere.valid$class)
miete Munich Rent Standard Database (1994)
Description
Many german cities compose so-called rent standards to make a decision making instrument avail-able to tenants, landlords, renting advisory boards and experts. The rent standards are used in par-ticular for the determination of the local comparative rent (i.e. net rent as a function of householdsize, equipment, year of construction, etc.). For the composition of the rent standards, a representa-tive random sample is drawn from all relevant households, and the interesting data are determinedby interviewers by means of questionnaires. The dataset contains the data of 1082 householdsinterviewed for the munich rent standard 1994.
Usage
data(miete)

8 miete
Format
A data frame with 1082 observations on the following 18 variables.
nm Net rent in DM.
wfl Floor space in sqm.
bj Year of construction.
bad0 Bathroom in apartment?1 : no0 : yes
zh Central heating?1 : yes0 : no
ww0 Hot water supply?1 : no0 : yes
badkach Tiled bathroom?1 : yes0 : no
fenster Window type:1 : plain windows0 : state-of-the-art windows
kueche Kitchen type1 : well equipped kitchen0 : plain kitchen
mvdauer Lease duration in years.
bjkat Age category of the building (bj categorized)1 : built before 19192 : built between 1919 and 19483 : built between 1949 and 19654 : built between 1966 and 19775 : built between 1978 and 19836 : built after 1983
wflkat Floor space category (wfl categorized):1 : less than 50 sqm2 : between 51 sqm and 80 sqm3 : at least 81 sqm
nmqm Net rent per sqm.
rooms Number of rooms in household.
nmkat Net rent category (nm categorized):1 : less than 500 DM2 : between 500 DM and 675 DM3 : between 675 DM and 850 DM4 : between 850 DM and 1150 DM5 : at least 1150 DM

simulation 9
adr Address type:1 : bad2 : average3 : good
wohn Residential type:1 : bad2 : average3 : good
Source
Fahrmeir, L., Kuenstler, R., Pigeot, I. und Tutz, G. (1997): Statistik: der Weg zur Datenanalyse,Springer, Berlin. http://www.stat.uni-muenchen.de/service/datenarchiv
The data were converted to R format by <[email protected]>.
Examples
data(miete)str(miete)
simulation Crossvalidation procedure to test prediction accuracy
Description
simulation tests prediction accuracy of regression and/or classification techniques via simulationof different test sets.
Usage
simulation(formula, data, runs = 10, train = TRUE, k = 11, ...)
Arguments
formula A formula object.
data Matrix or data frame.
runs Number of crossvalidation runs.
train A logical value. If TRUE the training procedure for selecting optimal values ofk and kernel is performed.
k Number or maximal number of neighbors considered, dependent of choice fortrain.
... Further arguments passed to or from other methods.
Value
A matrix, containing the mean and variance of the misclassification error, the absolute and thesquared distances.

10 specClust
Author(s)
Klaus P. Schliep <[email protected]>
References
Hechenbichler K. and Schliep K.P. (2004) Weighted k-Nearest-Neighbor Techniques and OrdinalClassification, Discussion Paper 399, SFB 386, Ludwig-Maximilians University Munich (http://www.stat.uni-muenchen.de/sfb386/papers/dsp/paper399.ps)
See Also
kknn and train.kknn
Examples
library(kknn)data(miete)simulation(nmqm ~ wfl + bjkat + zh, data = miete, runs = 5, kernel = "triangular", k = 15)simulation(wflkat ~ nm + bjkat + zh, data = miete, runs = 5)simulation(zh ~ wfl + bjkat + nmqm, data = miete, runs = 5)
specClust Spectral Clustering
Description
Spectral clustering based on k-nearest neighbor graph.
Usage
specClust(data, centers=NULL, nn = 7, method = "symmetric", gmax=NULL, ...)## S3 method for class 'specClust'plot(x, ...)
Arguments
data Matrix or data frame.
centers number of clusters to estimate, if NULL the number is chosen automatical.
nn Number of neighbors considered.
method Normalisation of the Laplacian ("none", "symmetric" or "random-walk").
gmax maximal number of connected components.
x an object of class specClust
... Further arguments passed to or from other methods.

specClust 11
Details
specClust alllows to estimate several popular spectral clustering algorithms, for an overview seevon Luxburg (2007).
The Laplacian is constructed from a from nearest neighbors and there are several kernels available.The eigenvalues and eigenvectors are computed using the binding in igraph to arpack. This shouldensure that this algorithm is also feasable for larger datasets as the the the distances used havedimension n*m, where n is the number of observations and m the number of nearest neighbors. TheLaplacian is sparse and has roughly n*m elements and only k eigenvectors are computed, where kis the number of centers.
Value
specClust returns a kmeans object or in case of k being a vector a list of kmeans objects.
Author(s)
Klaus P. Schliep <[email protected]>
References
U. von Luxburg (2007) A tutorial on spectral clustering, Stat Comput, 17, 395–416
Ng, A., Jordan, M., Weiss, Y. (2002) On spectral clustering: analysis and an algorithm. In: Diet-terich, T., Becker, S., Ghahramani, Z. (eds.) Advances in Neural Information Processing Systems,14, 849–856. MIT Press, Cambridge
Lihi Zelnik-Manor and P. Perona (2004) Self-Tuning Spectral Clustering, Eighteenth Annual Con-ference on Neural Information Processing Systems, (NIPS)
Shi, J. and Malik, J. (2000). Normalized cuts and image segmentation. IEEE Transactions onPattern Analysis and Machine Intelligence, 22 (8), 888–905
See Also
kknn, arpack, kmeans
Examples
data(iris)cl <- specClust(iris[,1:4], 3, nn=5)pcol <- as.character(as.numeric(iris$Species))pairs(iris[1:4], pch = pcol, col = c("green", "red", "blue")[cl$cluster])table(iris[,5], cl$cluster)

12 train.kknn
train.kknn Training kknn
Description
Training of kknn method via leave-one-out crossvalidation.
Usage
train.kknn(formula, data, kmax = 11, distance = 2, kernel = "optimal",ykernel = NULL, scale = TRUE, contrasts = c('unordered' = "contr.dummy",ordered = "contr.ordinal"), ...)cv.kknn(formula, data, kcv = 10, ...)
Arguments
formula A formula object.
data Matrix or data frame.
kmax Maximum number of k.
distance Parameter of Minkowski distance.
kernel Kernel to use. Possible choices are "rectangular" (which is standard unweightedknn), "triangular", "epanechnikov" (or beta(2,2)), "biweight" (or beta(3,3)), "tri-weight" (or beta(4,4)), "cos", "inv", "gaussian" and "optimal".
ykernel Window width of an y-kernel, especially for prediction of ordinal classes.
scale logical, scale variable to have equal sd.
contrasts A vector containing the ’unordered’ and ’ordered’ contrasts to use.
... Further arguments passed to or from other methods.
kcv Number of partitions for k-fold cross validation.
Details
train.kknn performs leave-one-out crossvalidation and is computatioanlly very efficient. cv.kknnperforms k-fold crossvalidation and is generally slower and does not yet contain the test of differentmodels yet.
Value
train.kknn returns a list-object of class train.kknn including the components.
MISCLASS Matrix of misclassification errors.
MEAN.ABS Matrix of mean absolute errors.
MEAN.SQU Matrix of mean squared errors.
fitted.values List of predictions for all combinations of kernel and k.

train.kknn 13
best.parameters
List containing the best parameter value for kernel and k.
response Type of response variable, one of continuous, nominal or ordinal.
distance Parameter of Minkowski distance.
call The matched call.
terms The ’terms’ object used.
Author(s)
Klaus P. Schliep <[email protected]>
References
Hechenbichler K. and Schliep K.P. (2004) Weighted k-Nearest-Neighbor Techniques and OrdinalClassification, Discussion Paper 399, SFB 386, Ludwig-Maximilians University Munich (http://www.stat.uni-muenchen.de/sfb386/papers/dsp/paper399.ps)
Hechenbichler K. (2005) Ensemble-Techniken und ordinale Klassifikation, PhD-thesis
Samworth, R.J. (2012) Optimal weighted nearest neighbour classifiers. Annals of Statistics, 40,2733-2763. (avaialble from http://www.statslab.cam.ac.uk/~rjs57/Research.html)
See Also
kknn and simulation
Examples
library(kknn)## Not run:data(miete)(train.con <- train.kknn(nmqm ~ wfl + bjkat + zh, data = miete,kmax = 25, kernel = c("rectangular", "triangular", "epanechnikov","gaussian", "rank", "optimal")))plot(train.con)(train.ord <- train.kknn(wflkat ~ nm + bjkat + zh, miete, kmax = 25,
kernel = c("rectangular", "triangular", "epanechnikov", "gaussian","rank", "optimal")))
plot(train.ord)(train.nom <- train.kknn(zh ~ wfl + bjkat + nmqm, miete, kmax = 25,kernel = c("rectangular", "triangular", "epanechnikov", "gaussian","rank", "optimal")))plot(train.nom)
## End(Not run)data(glass)glass <- glass[,-1](fit.glass1 <- train.kknn(Type ~ ., glass, kmax = 15, kernel =c("triangular", "rectangular", "epanechnikov", "optimal"), distance = 1))(fit.glass2 <- train.kknn(Type ~ ., glass, kmax = 15, kernel =c("triangular", "rectangular", "epanechnikov", "optimal"), distance = 2))plot(fit.glass1)

14 train.kknn
plot(fit.glass2)

Index
∗Topic classifcontr.dummy, 2kknn, 5simulation, 9train.kknn, 12
∗Topic clusterspecClust, 10
∗Topic datasetsglass, 3ionosphere, 4miete, 7
∗Topic designcontr.dummy, 2
∗Topic packagekknn-package, 2
arpack, 11
contr.dummy, 2contr.metric (contr.dummy), 2contr.ordinal (contr.dummy), 2contr.poly, 3contr.sdif, 3contrasts, 3cv.kknn (train.kknn), 12
glass, 3
ionosphere, 4
kknn, 5, 10, 11, 13kknn-package, 2kmeans, 11knn, 6knn1, 6
miete, 7
plot.specClust (specClust), 10plot.train.kknn (train.kknn), 12predict.kknn (kknn), 5
predict.train.kknn (train.kknn), 12print.kknn (kknn), 5print.train.kknn (train.kknn), 12
simulation, 6, 9, 13specClust, 10summary.kknn (kknn), 5summary.train.kknn (train.kknn), 12
train.kknn, 6, 10, 12
15