KIRLOSKAR OIL ENGINES LIMITED - Business...
80
KIRLOSKAR OIL ENGINES LIMITED THE ENGINE FOR SUSTAINABLE GROWTH CORPORATE SUSTAINABILITY REPORT 2011-12
Transcript of KIRLOSKAR OIL ENGINES LIMITED - Business...
KIRLOSKAR OIL ENGINES LIMITED
THE ENGINE FOR SUSTAINABLE GROWTH
CORPORATE SUSTAINABILITY REPORT 2011-12

Statement
GRI hereby states that has presented its report “The Engine for
K I R L O S K A R O I L E N G I N E S L T D . h a s
2013 2013 2013 2013 2013 2013 2013 2013 2013 2013 2013 2013 2013 2013 2013 2013 2013 2013 2013 2013 2013 2013 2013 2013 2013 2013 2013 2013 2013 2013 2013 2013
THE ENGINE FOR SUSTAINABLE GROWTH
Contents
Statement From The Executive Director
About The Report
About KOEL
Stakeholder Engagement And Materiality
Sustainability Roadmap And Progress Against Objectives
Awards And Accolades In Fy 2011-12
Memberships And Associations
Our Business
Corporate Governance
Economic Performance
Environmental Performance
Social Performance
Corporate Social Responsibility
Independent Assurance Statement
GRI G3.1 A+ Level Content Index
01
03
04
06
08
09
11
13
26
30
33
44
54
58
60
Kirloskar Oil Engines Ltd has embarked on its sustainability journey by adopting a mul-ti-pronged approach involving every part of the organisation from employees to opera-tions to research. Working together as one unified ma- chine, we are driving forward the change that we want to see in society.
Engine for Sustainable Growth - the theme for our sustainability report, is the visualiza-tion of this very thought. Our management is the spark, the plants channel the fire (the cylinder heads), our people are the driving shafts, with different divisions functioning as the gate- way of new ideas and designs that create more fire for growth (valves) – all of which stream-lined (lubricant) by the human resources.
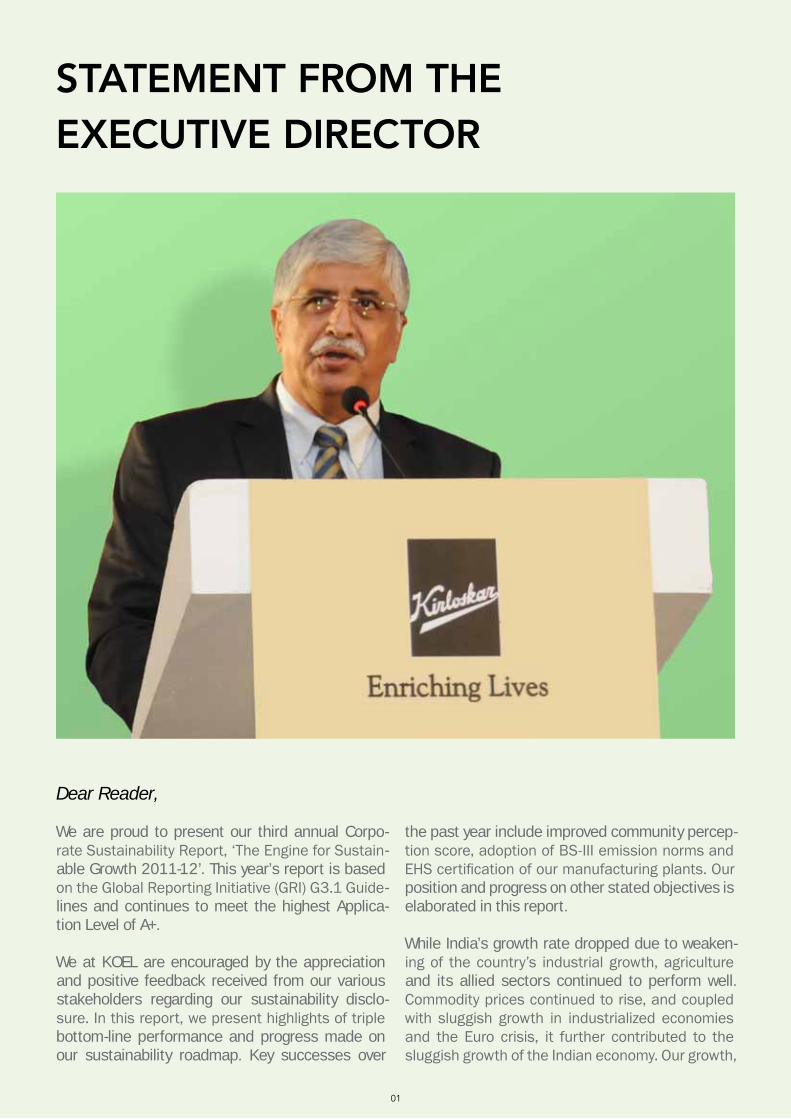
Dear Reader,
We are proud to present our third annual Corpo-rate Sustainability Report, ‘The Engine for Sustain-able Growth 2011-12’. This year’s report is based on the Global Reporting Initiative (GRI) G3.1 Guide-lines and continues to meet the highest Applica-tion Level of A+.
We at KOEL are encouraged by the appreciation and positive feedback received from our various stakeholders regarding our sustainability disclo-sure. In this report, we present highlights of triple bottom-line performance and progress made on our sustainability roadmap. Key successes over
the past year include improved community percep-tion score, adoption of BS-III emission norms and EHS certification of our manufacturing plants. Our position and progress on other stated objectives is elaborated in this report.
While India’s growth rate dropped due to weaken-ing of the country’s industrial growth, agriculture and its allied sectors continued to perform well. Commodity prices continued to rise, and coupled with sluggish growth in industrialized economies and the Euro crisis, it further contributed to the sluggish growth of the Indian economy. Our growth,
STATEMENT FROM THE EXECUTIVE DIRECTOR
01
in turn, was also impacted by sluggish industrial growth in key industrial sectors. The company saw a 3.8% drop in sales in the reporting period.
Continuing with our focus on product innovation, the development of a Portable Diesel Genset has been completed in the reporting period and we are currently launching it in the market. With the launch of this product, the company will enter a new market segment in India. We have also contin-ued with the K1080 programme and substituted 4 cylinder engines with 6 cylinder engines in the 100-125 kVA power range. In addition to these key de-velopments, our entire product portfolio for indus-trial market continues to comply with the Bharat Stage III emission standards of India.
We continue to frequently engage with our suppli-er base and train our vendors in key areas such as quality systems and Six Sigma Tools. A key de-velopment over the reporting period was the com-pletion of vendor online payment facility which in-creases efficiency in our supply chain. Selective supplier funding was also carried out in the past year, improving delivery performance.
Our focus on reducing material costs and institut-ing effective cost control measures across the sup-ply chain has enabled us to optimize material costs. We explored the possibility of alternate raw materi-als and process improvements over the past year.
We are committed to achieving optimum use of our energy resources and continuously strive to achieve improvements in process and product ef-ficiency through the use of energy efficient tech-
nologies and renewable energy. Several energy conservation initiatives were carried out over the reporting period, driven by our ENCON cell. We have received recognition within the industry for our commitment to energy conservation. Our man-ufacturing plants in Pune and Kagal received the prestigious 12th National Award for Excellence in Energy Management 2011 from the Confederation of Indian Industries (CII). This is the second con-secutive year that our Pune facility has received this prestigious accolade. In addition to this, the Pune and Nashik plants received the State Level ENCON Awards from Maharashtra Energy Devel-opment Agency (MEDA). Also, Pune plant received ‘Best Performer Award’ and Rajkot Plant received ‘First Runner Up Award” in the Kirloskar Group EN-CON Competition for year 2010-11.
Social responsibility is integral to our business phi-losophy. It is our firm belief that wealth generation should lead to social development. Over the report-ing period we continued our commitment to socie-ty through several ongoing initiatives focusing on education, health, sustainable livelihoods and en-vironment. We continued our life skills training pro-gramme for adolescents, called Saakav. We also increased community awareness on environmen-tal issues through initiatives such as the Vasund-hara film festival. Our commitment to the growth of communities around us and our responsiveness to their needs are evidenced by the increased score in our company’s social perception index.
As we continue to drive sustainable growth for the company and all our stakeholders, we welcome your valued feedback.
R. R. Deshpande Executive Director, Kirloskar Oil Engines Ltd.
02
ABOUT THE REPORT
‘The Engine for Sustainable Growth 2011-12’ is Kirloskar Oil Engine Ltd.’s (KOEL) third annual sus-tainability report. Through this report, we have at-tempted to present highlights of our triple bottom line performance for the period of 1st April 2011 to 31st March 2012. We continue to focus on is-sues that are material to our stakeholders, pre-senting the highlights from the year as well as the progress on our sustainability commitments.
This report meets the highest level of disclosure (Application Level A+) as per the Global Reporting Initiative’s (GRI) G3.1 reporting guidelines. In addi-tion to providing disclosure on all core indicators, we also report on a few additional indicators, such as those pertaining to energy and product respon-sibility, that are of relevance to us. Wherever nec-essary, we have explained the assumptions and/or exceptions while reporting on the GRI indicator protocols.
The report’s intended audiences are our employ-ees, investors, customers, suppliers, regulatory authorities as well as individuals and organiza-tions interested in KOEL’s performance on environ-mental, social and economic aspects. We intend to continue to report annually.
On September 30, 2011, we divested our Bear-ings business division to KSPG Automotive India Private Limited. The scope of this report thus cov-ers our major operating divisions on Engines - our plants at Pune, Kagal, Nashik and Rajkot. To cater to the export markets, we have sales teams sta-tioned at Dubai, South Africa, Nigeria, Kenya and Indonesia. In some of these countries, we share office space with the Kirloskar Group companies. Our sales and support teams abroad, joint ven-tures, associates and subsidiaries are outside of the reporting purview.
Ernst & Young (India) Pvt. Ltd, an independent and professional services firm, has provided external assurance to this report.
Readers are welcome to address their queries or feedback to [email protected].
Disclaimer
The terms ‘KOEL’, ‘the Company’, ‘we’, ‘us’ refer to Kirloskar Oil Engines Ltd. and is used purely for the sake of convenience. All financial values are expressed in terms of Indian rupees (‘INR’ or ‘Rs.’). Large number may be expressed in lakhs, crores or millions; these are units of numbers commonly used in the Indian sub-continent.
03
ABOUT KOEL
We are India’s largest manufacturer of diesel en-gines, incorporated in 1946 as a part of Kirloskar Group of Companies, a leading engineering con-glomerate, which was founded by late Mr. Laxman-rao Kirloskar. The group with a rich heritage has passed on its core purpose of ‘Enriching Lives’ to us at KOEL. In serving the core purpose, our busi-ness operations are guided by the principles of In-novation, Speed & Transparency.
We have pioneered a wide range of engines that are used across all the three sectors of Indian economy i.e. agriculture, industry and services which covers engines and pumpsets for agricultur-al, diesel generator sets for power generation, con-struction, earth moving, material handling, mining, transport, off shore oil & gas. KOEL is listed on the National Stock Exchange and the Bombay Stock Exchange. Our manufacturing facilities in India are benchmarked against world class manufacturing. We have presence in the international markets, with offices in Dubai, South Africa, Kenya, and rep-resentatives in Indonesia and Nigeria along with a strong distribution network in the Middle East and African countries.
KOEL has been at the forefront of providing world-class diesel engines. We are an acknowledged leader in the manufacture of diesel engines, and generating sets. Ever since our incorporation in 1946, we have been a prime mover in the nation designing products that fulfill the power needs of the nation. In our long journey, we have relentlessly pursued our own unique code of ethics in business and strived to achieve customer satisfaction.
Vision
To be amongst the top ten global players in off-highway engines business.
Mission
In our previous sustainability report, we had stated the goal of achieving the CII EXIM Business Excel-
lence award status by 2012 as well as the goal of becoming be a Rs. 5000 crore company with 15% profitability in 2014.
In three years of participation in the CII EXIM Busi-ness Excellence, we continued to be placed at the same band. In FY 2012, we took a deeper look at our performance parameters and realized that the key bottleneck was indeed our growth and profita-bility – which have both remained flat over the last few years. We have developed strategies to im-prove internal efficiencies and have taken stretch EBIDTA targets to address this concern. Further, we are now focusing on exports and increasing capacities of our power generating sets and have set sight on capturing greater market share in the higher kVA range. The first quarter in FY 13 has shown a 15% growth, and we remain positive that this trend will continue.
We believe that the results of these changes may not immediately reflect on the balance sheets. Therefore, we have decided to participate in the Business Excellence Awards after significant pro-gress has been achieved internally.
Values
04

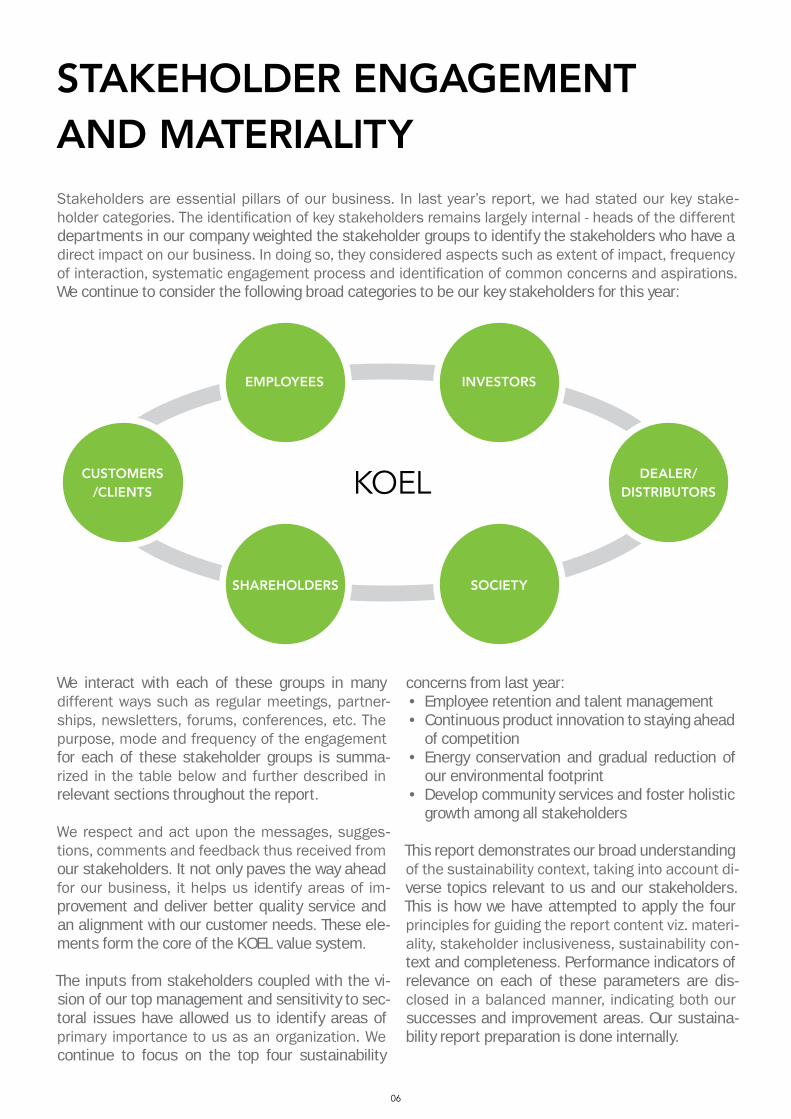
STAKEHOLDER ENGAGEMENT AND MATERIALITYStakeholders are essential pillars of our business. In last year’s report, we had stated our key stake-holder categories. The identification of key stakeholders remains largely internal - heads of the different departments in our company weighted the stakeholder groups to identify the stakeholders who have a direct impact on our business. In doing so, they considered aspects such as extent of impact, frequency of interaction, systematic engagement process and identification of common concerns and aspirations. We continue to consider the following broad categories to be our key stakeholders for this year:
kOEL
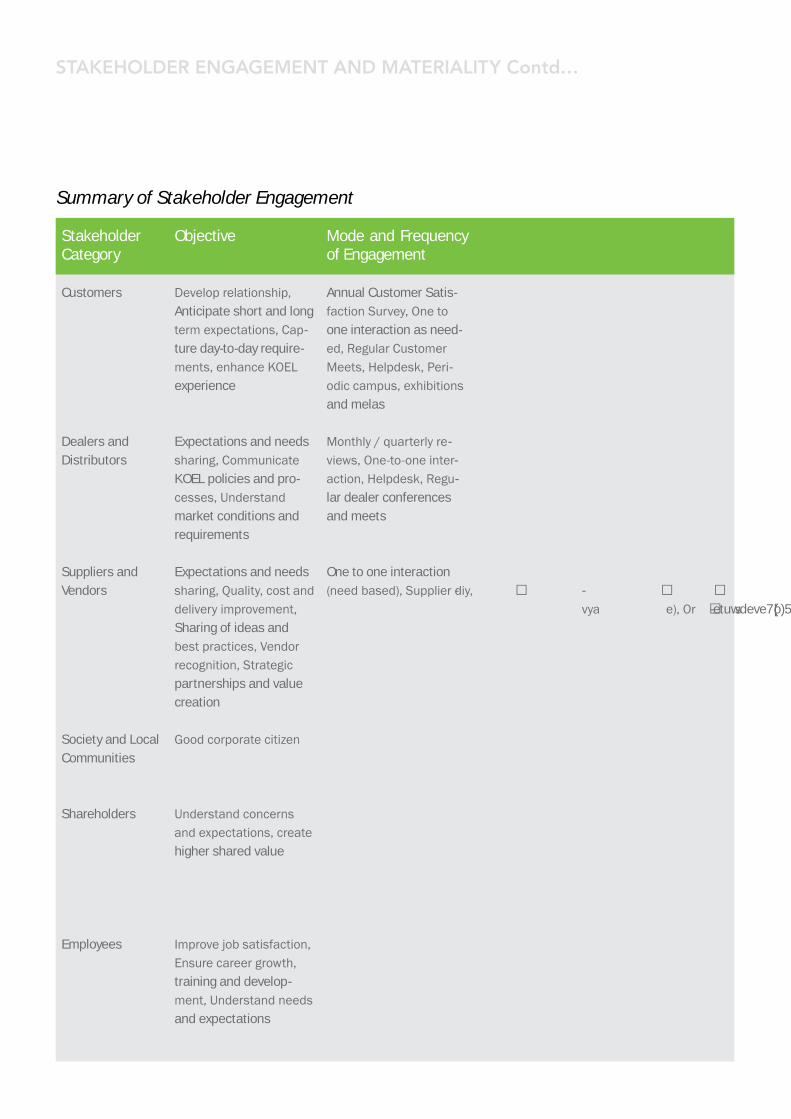
We interact with each of these groups in many different ways such as regular meetings, partner-ships, newsletters, forums, conferences, etc. The purpose, mode and frequency of the engagement for each of these stakeholder groups is summa-rized in the table below and further described in relevant sections throughout the report.
We respect and act upon the messages, sugges-tions, comments and feedback thus received from our stakeholders. It not only paves the way ahead for our business, it helps us identify areas of im-provement and deliver better quality service and an alignment with our customer needs. These ele-ments form the core of the KOEL value system.
The inputs from stakeholders coupled with the vi-sion of our top management and sensitivity to sec-toral issues have allowed us to identify areas of primary importance to us as an organization. We continue to focus on the top four sustainability
concerns from last year:• Employee retention and talent management• Continuous product innovation to staying ahead
of competition• Energy conservation and gradual reduction of
our environmental footprint• Develop community services and foster holistic
growth among all stakeholders
This report demonstrates our broad understanding of the sustainability context, taking into account di-verse topics relevant to us and our stakeholders. This is how we have attempted to apply the four principles for guiding the report content viz. materi-ality, stakeholder inclusiveness, sustainability con-text and completeness. Performance indicators of relevance on each of these parameters are dis-closed in a balanced manner, indicating both our successes and improvement areas. Our sustaina-bility report preparation is done internally.
CUSTOMERS/CLIENTS
DEALER/DISTRIBUTORS
SOCIETYSHAREHOLDERS
EMPLOYEES INVESTORS
06
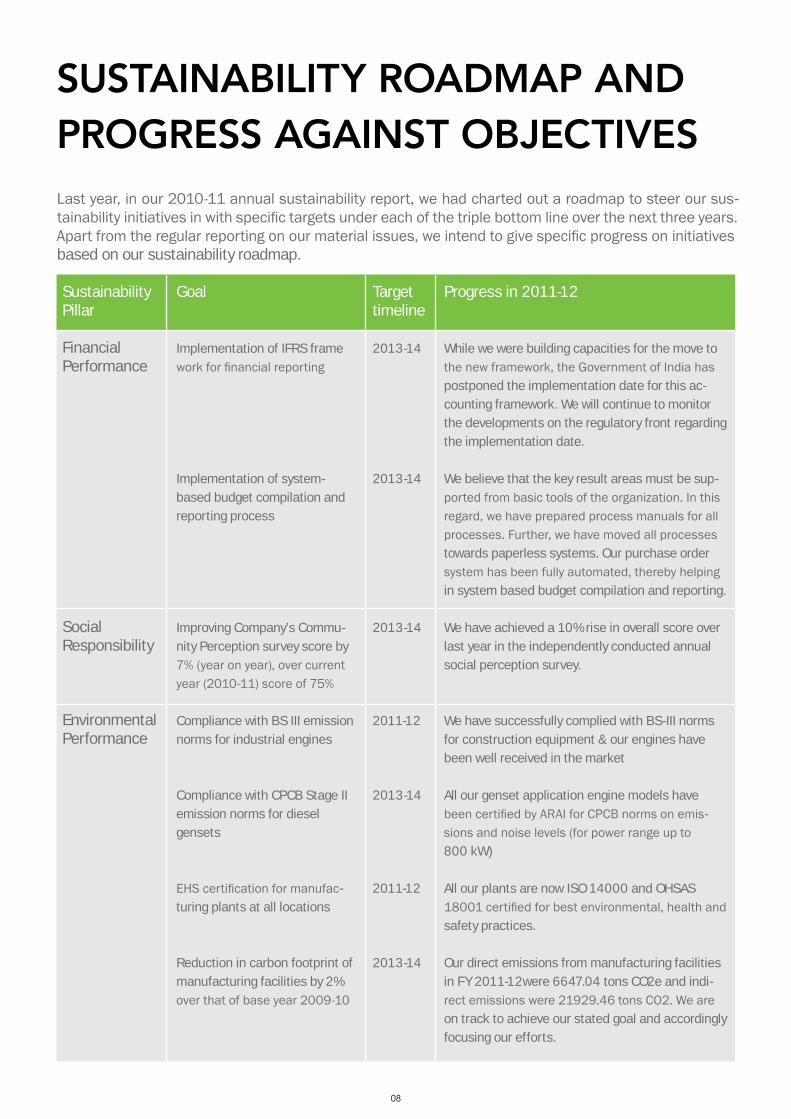
SUSTAINABILITY ROADMAP AND PROGRESS AGAINST OBJECTIVESLast year, in our 2010-11 annual sustainability report, we had charted out a roadmap to steer our sus-tainability initiatives in with specific targets under each of the triple bottom line over the next three years. Apart from the regular reporting on our material issues, we intend to give specific progress on initiatives based on our sustainability roadmap.
Sustainability Pillar
Financial Performance
Social Responsibility
Environmental Performance
Goal
Implementation of IFRS frame work for financial reporting
Implementation of system-based budget compilation and reporting process
Improving Company’s Commu-nity Perception survey score by 7% (year on year), over current year (2010-11) score of 75%
Compliance with BS III emission norms for industrial engines
Compliance with CPCB Stage II emission norms for diesel gensets
EHS certification for manufac-turing plants at all locations
Reduction in carbon footprint of manufacturing facilities by 2% over that of base year 2009-10
Target timeline
2013-14
2013-14
2013-14
2011-12
2013-14
2011-12
2013-14
Progress in 2011-12
While we were building capacities for the move to the new framework, the Government of India has postponed the implementation date for this ac-counting framework. We will continue to monitor the developments on the regulatory front regarding the implementation date.
We believe that the key result areas must be sup-ported from basic tools of the organization. In this regard, we have prepared process manuals for all processes. Further, we have moved all processes towards paperless systems. Our purchase order system has been fully automated, thereby helping in system based budget compilation and reporting.
We have achieved a 10% rise in overall score over last year in the independently conducted annual social perception survey.
We have successfully complied with BS-III norms for construction equipment & our engines have been well received in the market
All our genset application engine models have been certified by ARAI for CPCB norms on emis-sions and noise levels (for power range up to 800 kW)
All our plants are now ISO 14000 and OHSAS 18001 certified for best environmental, health and safety practices.
Our direct emissions from manufacturing facilities in FY 2011-12were 6647.04 tons CO2e and indi-rect emissions were 21929.46 tons CO2. We are on track to achieve our stated goal and accordingly focusing our efforts.
08
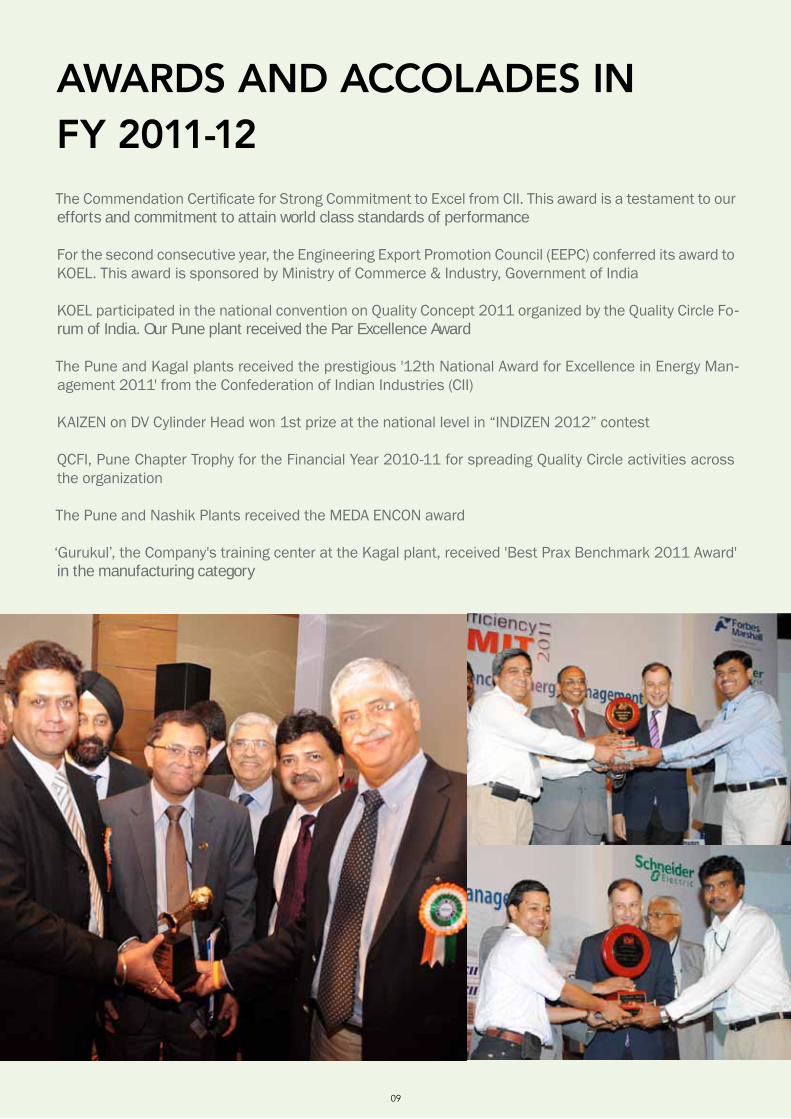
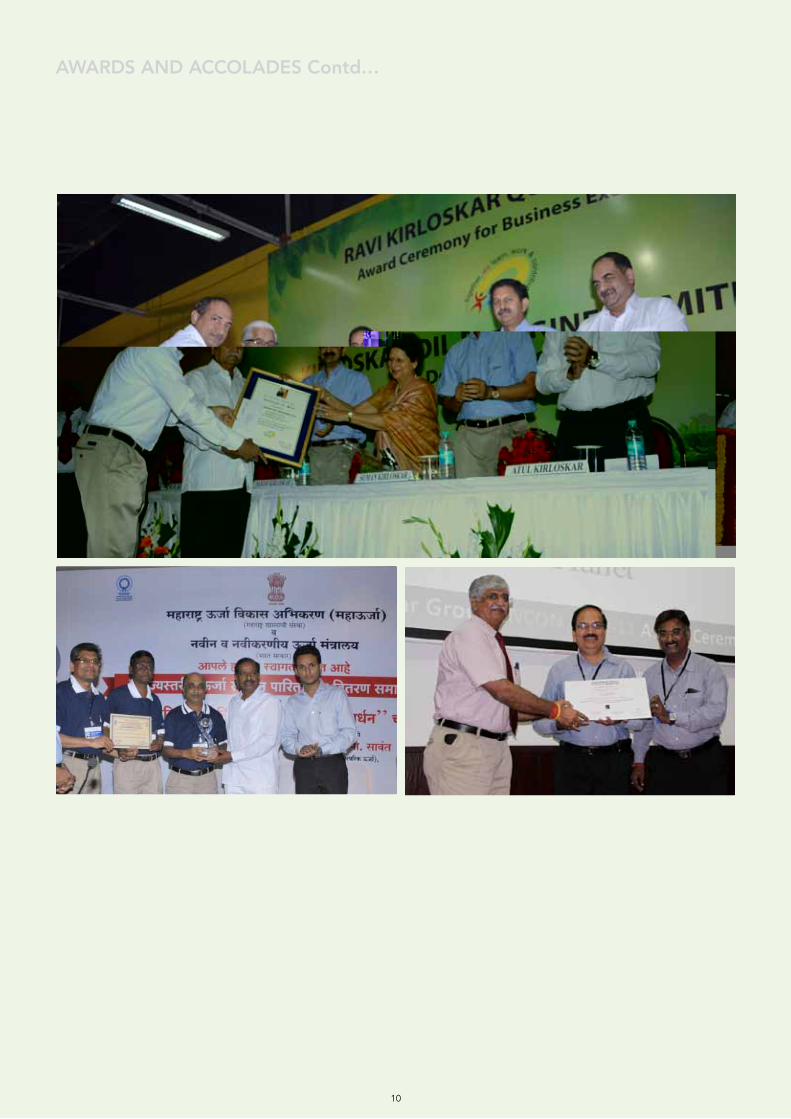
AWARDS AND ACCOLADES IN FY 2011-12The Commendation Certificate for Strong Commitment to Excel from CII. This award is a testament to our efforts and commitment to attain world class standards of performance
For the second consecutive year, the Engineering Export Promotion Council (EEPC) conferred its award to KOEL. This award is sponsored by Ministry of Commerce & Industry, Government of India
KOEL participated in the national convention on Quality Concept 2011 organized by the Quality Circle Fo-rum of India. Our Pune plant received the Par Excellence Award
The Pune and Kagal plants received the prestigious '12th National Award for Excellence in Energy Man-agement 2011' from the Confederation of Indian Industries (CII)
KAIZEN on DV Cylinder Head won 1st prize at the national level in “INDIZEN 2012” contest
QCFI, Pune Chapter Trophy for the Financial Year 2010-11 for spreading Quality Circle activities across the organization
The Pune and Nashik Plants received the MEDA ENCON award
‘Gurukul’, the Company's training center at the Kagal plant, received 'Best Prax Benchmark 2011 Award' in the manufacturing category
09
AWARDS AND ACCOLADES Contd…
10
MEMBERSHIPS AND ASSOCIATIONSKOEL is an active member of the Confederation of Indian Industries (CII), and a signatory of the CII Code for Affirmative Action. Our commitment to achieving a world class standard of performance has been recognized by CII.
Listed below are the key national and international industry bodies of which KOEL was an active member during the reporting period.
» Bombay Chamber of Commerce and Industry
» Confederation of Indian Industry (Western region)
» Engineering Export Promotion Council
» Federation of Indian Chamber of Commerce & Industry
» Federation of Indian Export Organisation
» Indian Diesel Engine Manufactures Association
» Indian Earthmoving & Construction Industry Association Ltd
» Indo American Chamber of Commerce
» Indo German Chamber of Commerce
» Indo-African Chamber of Commerce & Industries
» Maharashtra Economic Development Council
» Mahratta Chamber of Commerce Industries and Agriculture
» The Automotive Research Association of India
11

12
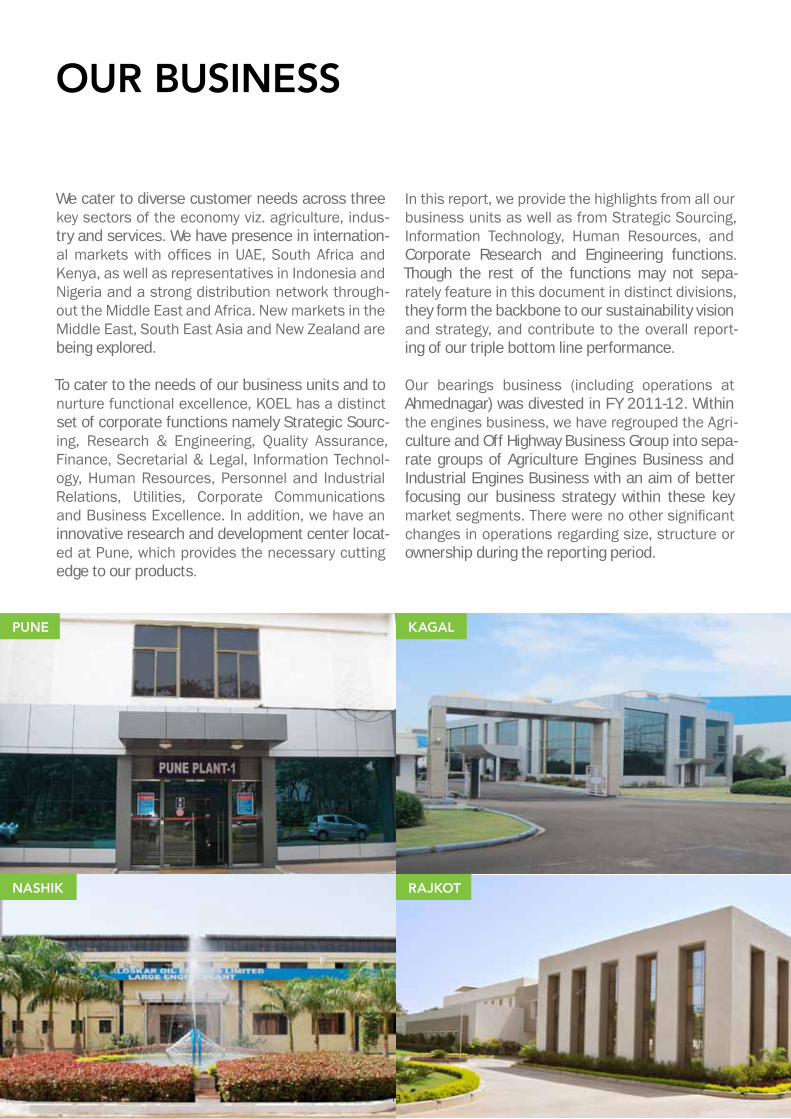
OUR BUSINESS
We cater to diverse customer needs across three key sectors of the economy viz. agriculture, indus-try and services. We have presence in internation-al markets with offices in UAE, South Africa and Kenya, as well as representatives in Indonesia and Nigeria and a strong distribution network through-out the Middle East and Africa. New markets in the Middle East, South East Asia and New Zealand are being explored.
To cater to the needs of our business units and to nurture functional excellence, KOEL has a distinct set of corporate functions namely Strategic Sourc-ing, Research & Engineering, Quality Assurance, Finance, Secretarial & Legal, Information Technol-ogy, Human Resources, Personnel and Industrial Relations, Utilities, Corporate Communications and Business Excellence. In addition, we have an innovative research and development center locat-ed at Pune, which provides the necessary cutting edge to our products.
In this report, we provide the highlights from all our business units as well as from Strategic Sourcing, Information Technology, Human Resources, and Corporate Research and Engineering functions. Though the rest of the functions may not sepa-rately feature in this document in distinct divisions, they form the backbone to our sustainability vision and strategy, and contribute to the overall report-ing of our triple bottom line performance.
Our bearings business (including operations at Ahmednagar) was divested in FY 2011-12. Within the engines business, we have regrouped the Agri-culture and Off Highway Business Group into sepa-rate groups of Agriculture Engines Business and Industrial Engines Business with an aim of better focusing our business strategy within these key market segments. There were no other significant changes in operations regarding size, structure or ownership during the reporting period.
PUNE
NASHIK
KAGAL
RAJKOT
13
KOELORGANIZATION STRUCTURE
OUR BUSINESS Contd…
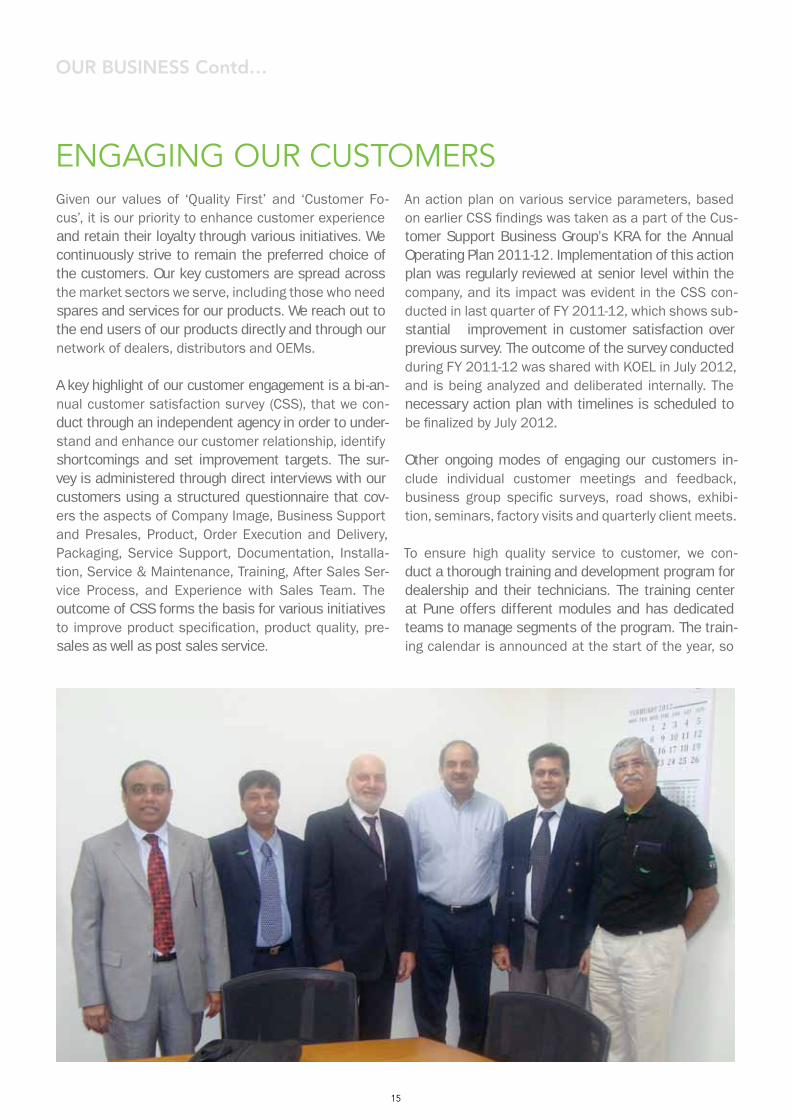
Given our values of ‘Quality First’ and ‘Customer Fo-cus’, it is our priority to enhance customer experience and retain their loyalty through various initiatives. We continuously strive to remain the preferred choice of the customers. Our key customers are spread across the market sectors we serve, including those who need spares and services for our products. We reach out to the end users of our products directly and through our network of dealers, distributors and OEMs. A key highlight of our customer engagement is a bi-an-nual customer satisfaction survey (CSS), that we con-duct through an independent agency in order to under-stand and enhance our customer relationship, identify shortcomings and set improvement targets. The sur-vey is administered through direct interviews with our customers using a structured questionnaire that cov-ers the aspects of Company Image, Business Support and Presales, Product, Order Execution and Delivery, Packaging, Service Support, Documentation, Installa-tion, Service & Maintenance, Training, After Sales Ser-vice Process, and Experience with Sales Team. The outcome of CSS forms the basis for various initiatives to improve product specification, product quality, pre-sales as well as post sales service.
An action plan on various service parameters, based on earlier CSS findings was taken as a part of the Cus-tomer Support Business Group’s KRA for the Annual Operating Plan 2011-12. Implementation of this action plan was regularly reviewed at senior level within the company, and its impact was evident in the CSS con-ducted in last quarter of FY 2011-12, which shows sub-stantial improvement in customer satisfaction over previous survey. The outcome of the survey conducted during FY 2011-12 was shared with KOEL in July 2012, and is being analyzed and deliberated internally. The necessary action plan with timelines is scheduled to be finalized by July 2012.
Other ongoing modes of engaging our customers in-clude individual customer meetings and feedback, business group specific surveys, road shows, exhibi-tion, seminars, factory visits and quarterly client meets.
To ensure high quality service to customer, we con-duct a thorough training and development program for dealership and their technicians. The training center at Pune offers different modules and has dedicated teams to manage segments of the program. The train-ing calendar is announced at the start of the year, so
ENGAGING OUR CUSTOMERS
15
OUR BUSINESS Contd…
that the dealers can schedule and fulfill their learning needs. On occasion, we also take dealers to overseas sites for training & best practices learning. ‘Best Per-former’ Awards are handed out annually based on the scorecard performance of dealership. In the reporting year, a total of 335 service training programs were or-ganized, encompassing 4882 participants.
Repeat orders on current products and addition of or-ders for new applications/ products testify the fact that we have never lost a single OEM customer. Further-more, there were no substantiated complaints regard-ing customer privacy and loss of customer data. The targets for various parameters are derived from poli-cies and benchmarking with competition/best in class. Wherever we are best in class, we aim to maintain a gap with nearest competition.
Our after sales network continues to expand every year fulfilling our twin objectives of being closer to our customers and providing proactive service. The pres-ence of an extensive network, comprising 103 trained service dealers and 342 well equipped service out-lets across India, illustrates our strong commitment to customer support. It enables us to provide timely
after-sales services to its customers, including those during emergency situations. Customer requests are responded to within 4 to 8 hours of time depending on the distance. We ensure high service standards at all times through regular audits of our service dealers.
To further strengthen our customer relationship and to satisfactorily meet customer needs, we have proac-tively introduced centralized Annual Maintenance Con-tracts (AMC) as well as a customer help desk to handle all complaints.
The Customer Support Business Group (CSBG) achieved sales as per annual operating Plan FY 2011-12 with a growth of 11 % over the previous year.
16
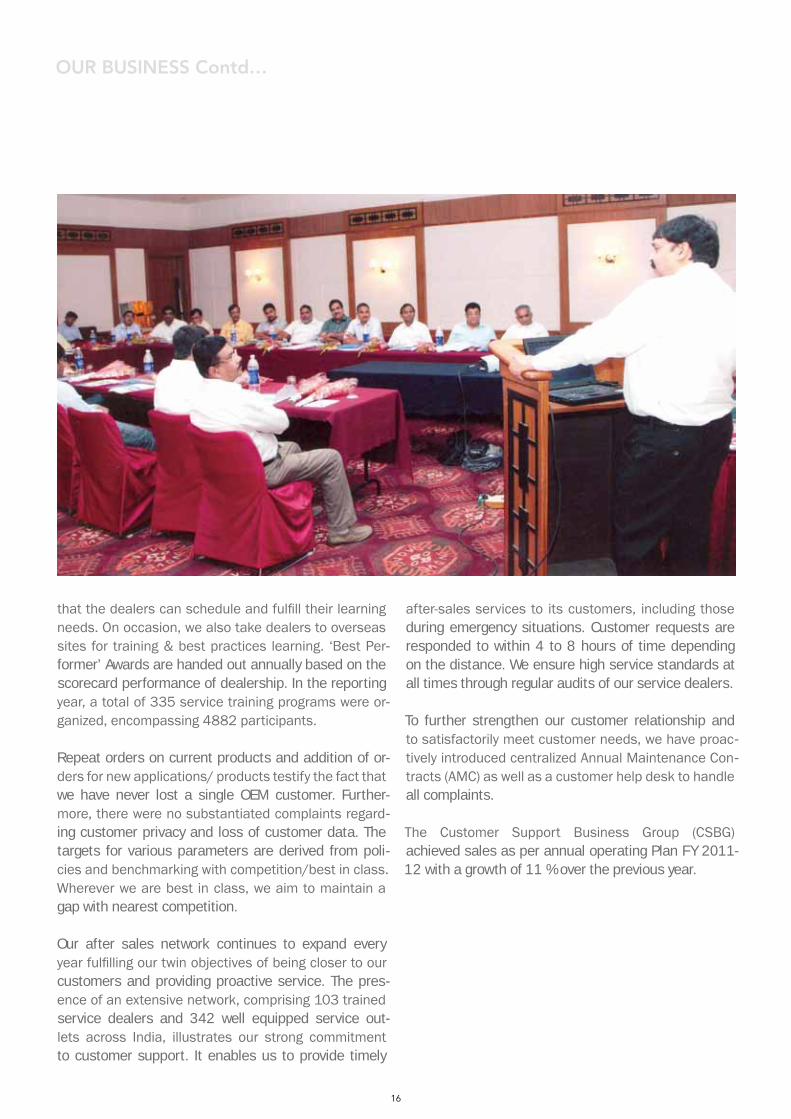
The agriculture sector witnessed a growth of 2.8 % in 2011. The Indian agriculture market for engines be-low 20 hp witnessed 21% growth which was due to un-timely monsoon and grid power deficit in many regions of rural India. Government subsidy schemes for pump sets also played a vital role in market growth. This was true, especially for portable engines for pump set ap-plication below 5 hp.
However, our Agriculture Engines Business registered a negative growth of 6% on account of the high price gap with respect to competitors (mainly Indian unor-ganized sector) and Chinese imports. We are currently in the process of formulating a strategy for growth to respond to these challenges and are committed to im-proving our market presence.
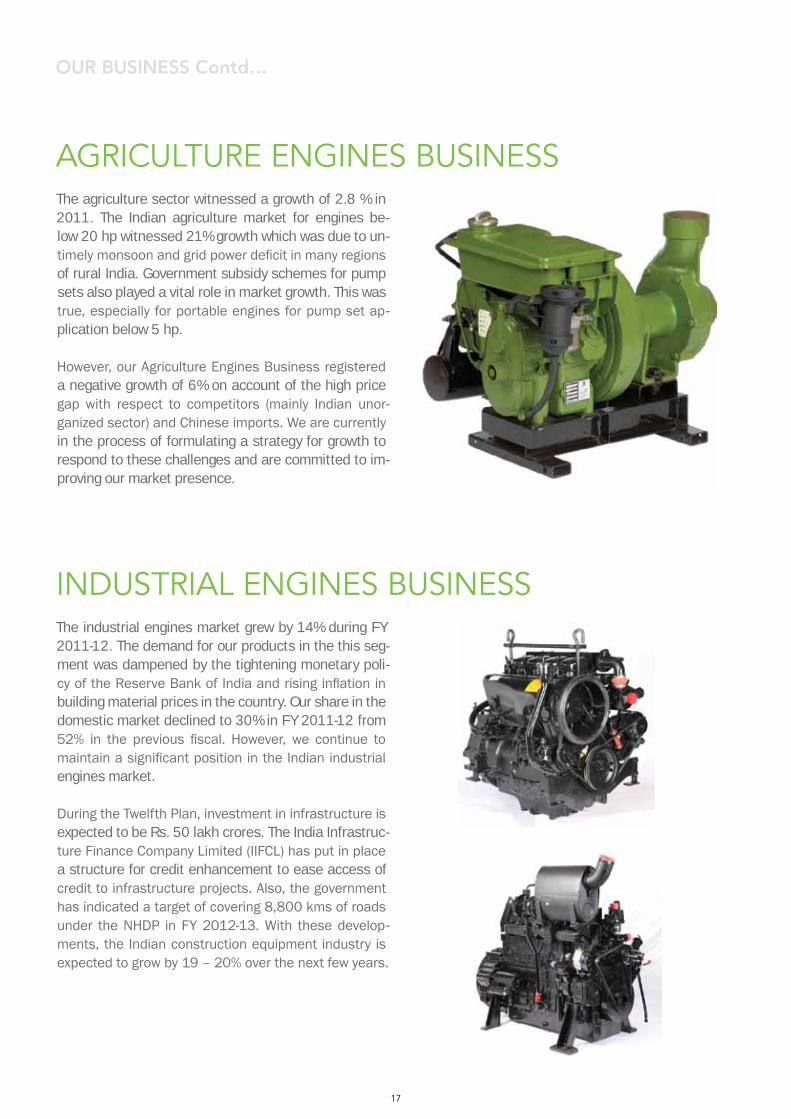
The industrial engines market grew by 14% during FY 2011-12. The demand for our products in the this seg-ment was dampened by the tightening monetary poli-cy of the Reserve Bank of India and rising inflation in building material prices in the country. Our share in the domestic market declined to 30% in FY 2011-12 from 52% in the previous fiscal. However, we continue to maintain a significant position in the Indian industrial engines market.
During the Twelfth Plan, investment in infrastructure is expected to be Rs. 50 lakh crores. The India Infrastruc-ture Finance Company Limited (IIFCL) has put in place a structure for credit enhancement to ease access of credit to infrastructure projects. Also, the government has indicated a target of covering 8,800 kms of roads under the NHDP in FY 2012-13. With these develop-ments, the Indian construction equipment industry is expected to grow by 19 – 20% over the next few years.
AGRICULTURE ENGINES BUSINESS
INDUSTRIAL ENGINES BUSINESS16
The AOBG primarily addresses the needs of customers from the agriculture, off highway and marine segments, on a global basis. We cater to the agriculture market with our engines ranging from power ratings 3.5 hp to 20 hp. The market use for these engines are generally as agri-cultural pumpsets and for agro-industrial applications such as in threshers, flour mills etc. These engines also find application in industries which use compact machin-ery like handheld compacters, concrete mixers, tower hoists and the like.
We currently enjoy a market share of 21% in the domes-tic agriculture market, growing from 8% when we started functioning as a separate business unit three years ago. This is in spite of the market itself shrinking by 15% in numbers during the year under review. The launch of the Varsha pumpset in the portable pumpset category was vastly successful in 2009-10. While we had hoped to achieve sales growth of atleast three times that of last year, we had to hike the price per unit as we were hit by the rise in metal prices in India. In ad-dition, our competitors reduced the price of their offer-ing, challenging our sales targets further in a market that was experiencing a drop in the total volume. Despite this, year 2010-11 saw 30,000 Varsha pumpsets deployed in the field. As remedial measures, we have embarked on a
heavy cost reduction program in order to find sustainable cost solutions and are considering moving the product manufacturing location from a relatively expensive pro-duction unit. On the brighter side, Varsha units deployed in field have increased from 12,000 to 30,000 this year.
The year 2010-11 also saw the launch of two other lines of products – the pumpsets (AV1 XL - N1 to N5 series) and high head VA & FA pumpsets. 15,000 units of the former are already deployed and we target sales of 45,000 units for the coming year. Besides pumpsets, the FA series will largely cater to the needs of the compact equipment used in industrial and marine main propulsion segments (for OBM and IBM). In off highway segment, we offer engines for over 85 dif-ferent applications in the power range from 20 hp to 800 hp – all are ‘green’ products. Research work is underway to further extend this range up till 1200 hp. These engines currently find applications in excavators, loaders, back-hoes, forklift trucks, compactors, transit mixers, concrete pumps and so on. We are planning a structured move and expansion into the marine market segment where our en-gines are mostly used in propulsion motors. Our market share improved to 55% from 54% last year. At demand / order board level, we successfully de-risked
AGRICULTURE & OFF HIGHWAY ENGINES BUSINESS GROUP (AOBG)
OUR BUSINESS Contd…
16
The AOBG primarily addresses the needs of customers from the agriculture, off highway and marine segments, on a global basis. We cater to the agriculture market with our engines ranging from power ratings 3.5 hp to 20 hp. The market use for these engines are generally as agri-cultural pumpsets and for agro-industrial applications such as in threshers, flour mills etc. These engines also find application in industries which use compact machin-ery like handheld compacters, concrete mixers, tower hoists and the like.
We currently enjoy a market share of 21% in the domes-tic agriculture market, growing from 8% when we started functioning as a separate business unit three years ago. This is in spite of the market itself shrinking by 15% in numbers during the year under review. The launch of the Varsha pumpset in the portable pumpset category was vastly successful in 2009-10. While we had hoped to achieve sales growth of atleast three times that of last year, we had to hike the price per unit as we were hit by the rise in metal prices in India. In ad-dition, our competitors reduced the price of their offer-ing, challenging our sales targets further in a market that was experiencing a drop in the total volume. Despite this, year 2010-11 saw 30,000 Varsha pumpsets deployed in the field. As remedial measures, we have embarked on a
heavy cost reduction program in order to find sustainable cost solutions and are considering moving the product manufacturing location from a relatively expensive pro-duction unit. On the brighter side, Varsha units deployed in field have increased from 12,000 to 30,000 this year.
The year 2010-11 also saw the launch of two other lines of products – the pumpsets (AV1 XL - N1 to N5 series) and high head VA & FA pumpsets. 15,000 units of the former are already deployed and we target sales of 45,000 units for the coming year. Besides pumpsets, the FA series will largely cater to the needs of the compact equipment used in industrial and marine main propulsion segments (for OBM and IBM). In off highway segment, we offer engines for over 85 dif-ferent applications in the power range from 20 hp to 800 hp – all are ‘green’ products. Research work is underway to further extend this range up till 1200 hp. These engines currently find applications in excavators, loaders, back-hoes, forklift trucks, compactors, transit mixers, concrete pumps and so on. We are planning a structured move and expansion into the marine market segment where our en-gines are mostly used in propulsion motors. Our market share improved to 55% from 54% last year. At demand / order board level, we successfully de-risked
AGRICULTURE & OFF HIGHWAY ENGINES BUSINESS GROUP (AOBG)
OUR BUSINESS Contd…
OUR BUSINESS Contd…
17
OUR BUSINESS Contd…
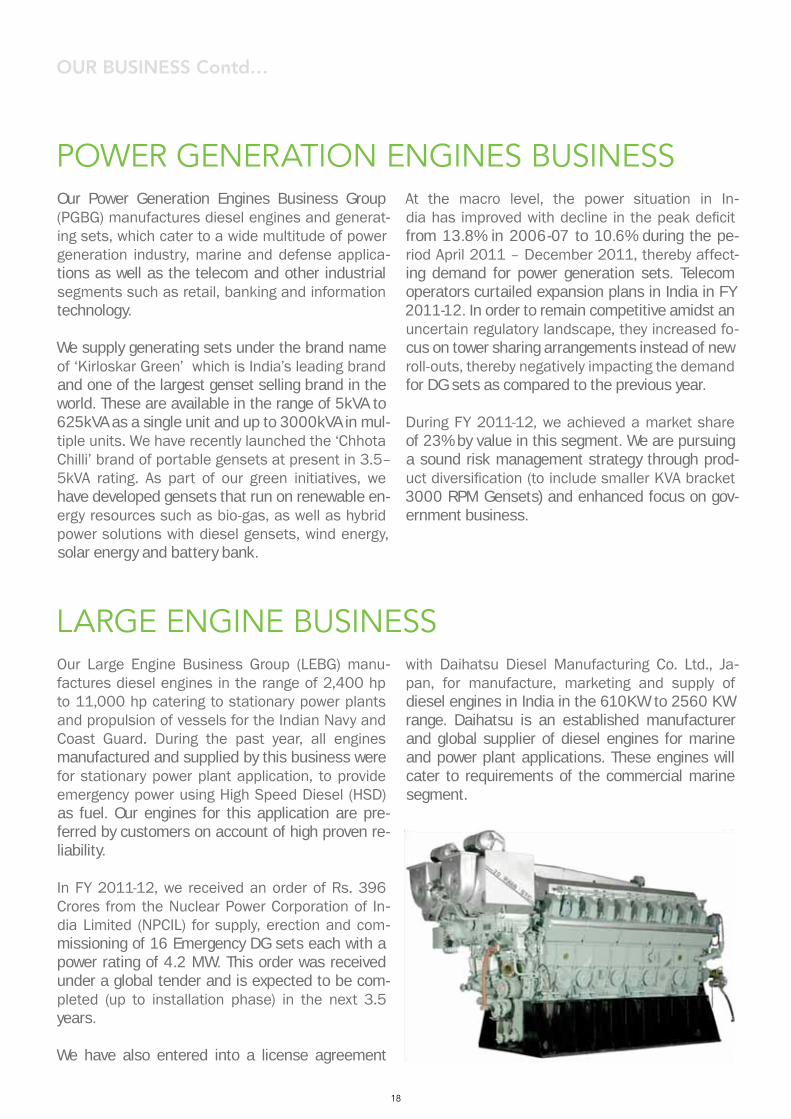
Our Large Engine Business Group (LEBG) manu-factures diesel engines in the range of 2,400 hp to 11,000 hp catering to stationary power plants and propulsion of vessels for the Indian Navy and Coast Guard. During the past year, all engines manufactured and supplied by this business were for stationary power plant application, to provide emergency power using High Speed Diesel (HSD) as fuel. Our engines for this application are pre-ferred by customers on account of high proven re-liability.
In FY 2011-12, we received an order of Rs. 396 Crores from the Nuclear Power Corporation of In-dia Limited (NPCIL) for supply, erection and com-missioning of 16 Emergency DG sets each with a power rating of 4.2 MW. This order was received under a global tender and is expected to be com-pleted (up to installation phase) in the next 3.5 years.
We have also entered into a license agreement
with Daihatsu Diesel Manufacturing Co. Ltd., Ja-pan, for manufacture, marketing and supply of diesel engines in India in the 610KW to 2560 KW range. Daihatsu is an established manufacturer and global supplier of diesel engines for marine and power plant applications. These engines will cater to requirements of the commercial marine segment.
LARGE ENGINE BUSINESS
Our Power Generation Engines Business Group (PGBG) manufactures diesel engines and generat-ing sets, which cater to a wide multitude of power generation industry, marine and defense applica-tions as well as the telecom and other industrial segments such as retail, banking and information technology.
We supply generating sets under the brand name of ‘Kirloskar Green’ which is India’s leading brand and one of the largest genset selling brand in the world. These are available in the range of 5kVA to 625kVA as a single unit and up to 3000kVA in mul-tiple units. We have recently launched the ‘Chhota Chilli’ brand of portable gensets at present in 3.5–5kVA rating. As part of our green initiatives, we have developed gensets that run on renewable en-ergy resources such as bio-gas, as well as hybrid power solutions with diesel gensets, wind energy, solar energy and battery bank.
POWER GENERATION ENGINES BUSINESSAt the macro level, the power situation in In-dia has improved with decline in the peak deficit from 13.8% in 2006-07 to 10.6% during the pe-riod April 2011 – December 2011, thereby affect-ing demand for power generation sets. Telecom operators curtailed expansion plans in India in FY 2011-12. In order to remain competitive amidst an uncertain regulatory landscape, they increased fo-cus on tower sharing arrangements instead of new roll-outs, thereby negatively impacting the demand for DG sets as compared to the previous year.
During FY 2011-12, we achieved a market share of 23% by value in this segment. We are pursuing a sound risk management strategy through prod-uct diversification (to include smaller KVA bracket 3000 RPM Gensets) and enhanced focus on gov-ernment business.
18
IT strategy is developed based on a) KOEL Vision, Mission and Values b) Organizational Strategy and initiatives. IT Roadmap and investment plan for 3 years is aligned with long term corporate strate-gies and current technology trends. IT Policy and strategy is reviewed and upgraded periodically and communicated to all KOEL employees.
During the year, various Business Intelligence por-tals are developed for the business leaders to have in-depth analysis which enable them to take deci-sions based on information. These are made avail-able on intranet portal known as myKOEL with ac-cess control to relevant information.
INFORMATION TEChNOLOGY
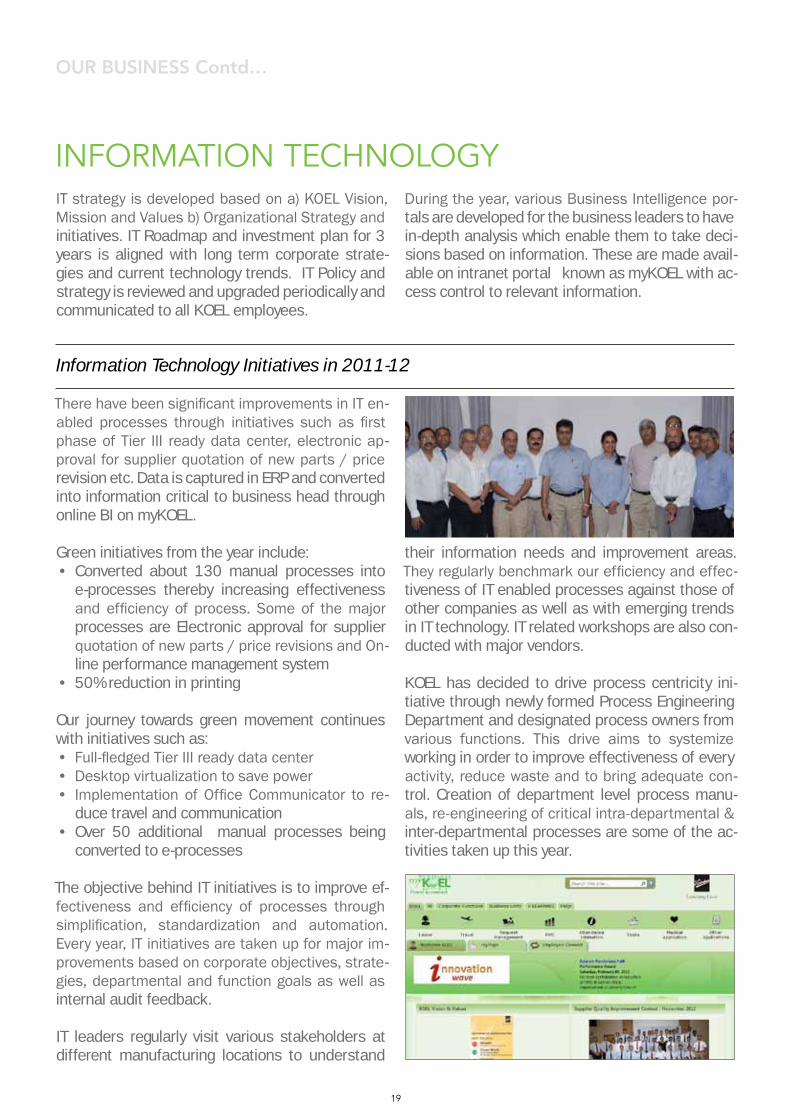
There have been significant improvements in IT en-abled processes through initiatives such as first phase of Tier III ready data center, electronic ap-proval for supplier quotation of new parts / price revision etc. Data is captured in ERP and converted into information critical to business head through online BI on myKOEL.
Green initiatives from the year include:• Converted about 130 manual processes into
e-processes thereby increasing effectiveness and efficiency of process. Some of the major processes are Electronic approval for supplier quotation of new parts / price revisions and On-line performance management system
• 50% reduction in printing
Our journey towards green movement continues with initiatives such as: • Full-fledged Tier III ready data center • Desktop virtualization to save power• Implementation of Office Communicator to re-
duce travel and communication• Over 50 additional manual processes being
converted to e-processes
The objective behind IT initiatives is to improve ef-fectiveness and efficiency of processes through simplification, standardization and automation. Every year, IT initiatives are taken up for major im-provements based on corporate objectives, strate-gies, departmental and function goals as well as internal audit feedback.
IT leaders regularly visit various stakeholders at different manufacturing locations to understand
their information needs and improvement areas. They regularly benchmark our efficiency and effec-tiveness of IT enabled processes against those of other companies as well as with emerging trends in IT technology. IT related workshops are also con-ducted with major vendors.
KOEL has decided to drive process centricity ini-tiative through newly formed Process Engineering Department and designated process owners from various functions. This drive aims to systemize working in order to improve effectiveness of every activity, reduce waste and to bring adequate con-trol. Creation of department level process manu-als, re-engineering of critical intra-departmental & inter-departmental processes are some of the ac-tivities taken up this year.
Information Technology Initiatives in 2011-12
OUR BUSINESS Contd…
19
OUR BUSINESS Contd…
We have demonstrated a strong supplier engage-ment in the past few years and have actively par-ticipated in the overall development of our supply base. It is not only in terms of capacity improve-ment, but developing an overall self-sustained sup-ply base with active participation and team build-ing in various events and processes.
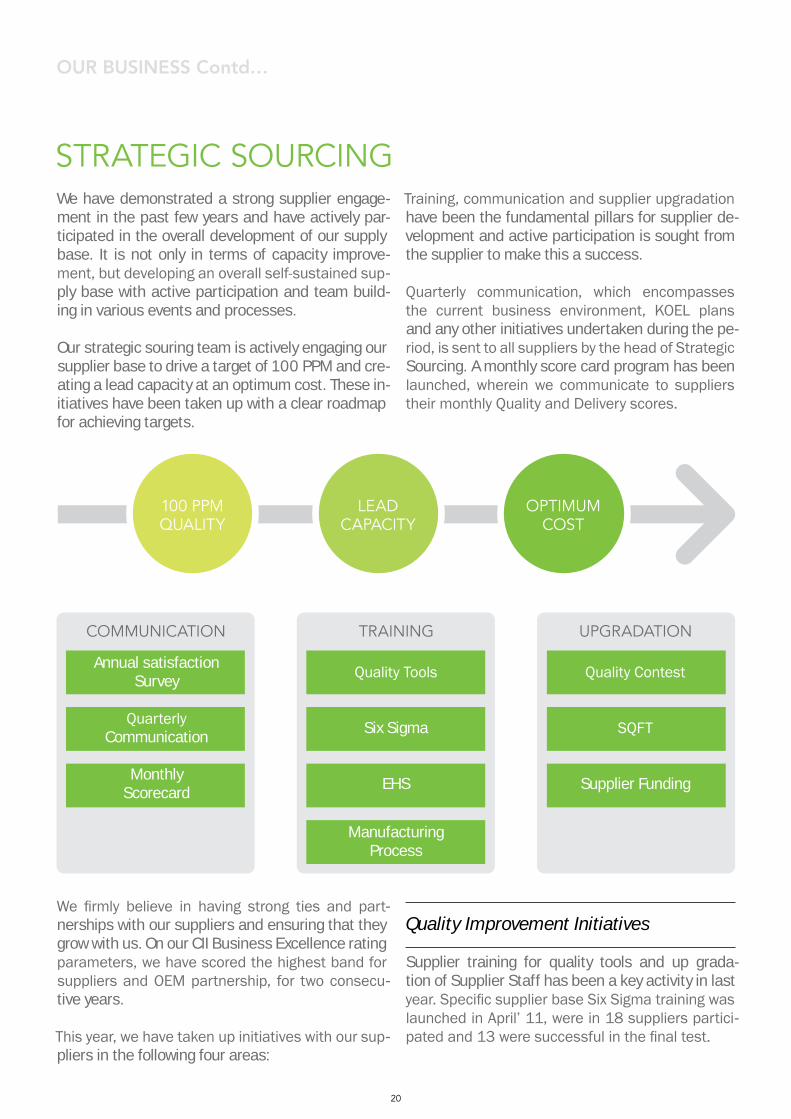
Our strategic souring team is actively engaging our supplier base to drive a target of 100 PPM and cre-ating a lead capacity at an optimum cost. These in-itiatives have been taken up with a clear roadmap for achieving targets.
STRATEGIC SOURCINGTraining, communication and supplier upgradation have been the fundamental pillars for supplier de-velopment and active participation is sought from the supplier to make this a success.
Quarterly communication, which encompasses the current business environment, KOEL plans and any other initiatives undertaken during the pe-riod, is sent to all suppliers by the head of Strategic Sourcing. A monthly score card program has been launched, wherein we communicate to suppliers their monthly Quality and Delivery scores.
We firmly believe in having strong ties and part-nerships with our suppliers and ensuring that they grow with us. On our CII Business Excellence rating parameters, we have scored the highest band for suppliers and OEM partnership, for two consecu-tive years.
This year, we have taken up initiatives with our sup-pliers in the following four areas:
Quality Improvement Initiatives
Supplier training for quality tools and up grada-tion of Supplier Staff has been a key activity in last year. Specific supplier base Six Sigma training was launched in April’ 11, were in 18 suppliers partici-pated and 13 were successful in the final test.
100 PPM QUALITY
LEAD CAPACITY
OPTIMUM COST
COMMUNICATION TRAINING UPGRADATION
Annual satisfactionSurvey
QuarterlyCommunication
MonthlyScorecard
Quality Tools
Six Sigma
EHS
Quality Contest
SQFT
Supplier Funding
Manufacturing Process
20
As a part of our Quality Month, this year too Sup-plier Quality Contest was conducted in November for two days, which saw a very good response from the supplier base. Overall 73 entries were contrib-uted by our supplier partners. The theme of the SQIC was ‘Share, Learn and Apply’:Share- Share the Quality improvement case stud-ies to all. Learn- Learn from the other suppliers during ‘SQIC’ Apply- Apply the learning’s from SQIC and accrued benefits to the organization.
Out of all the submitted entries, 44 were selected by scrutiny team. Best suppliers in both groups are recognized on each day.
Cost Reduction Initiatives
Our sourcing team closely works with the preferred partner suppliers through initiatives like VA/VE projects. The focus area of these projects is con-servation of energy and reduction in waste genera-tion. We have completed as many as 180 cost re-duction projects, which have resulted in sustained savings such as through use of alternate materials.
Technology Up-gradation initiatives
In addition to moving as many as 52 codes to BS III industrial emission norms, we have developed 2600 new or modified parts for our engines includ-ing sputtered bearings for 4R, 6R engine models and ‘gallery cooled pistons’ for 4R 1080 series en-gines. We have also developed integrated micro-processor controller for 40 kVA to 125 kVA gen-sets.
Other initiatives
Supplier Survey In line with previous years, a supplier survey was conducted; the results are encouraging with a steady improvement in score on YOY basis in all aspects covered by the survey.
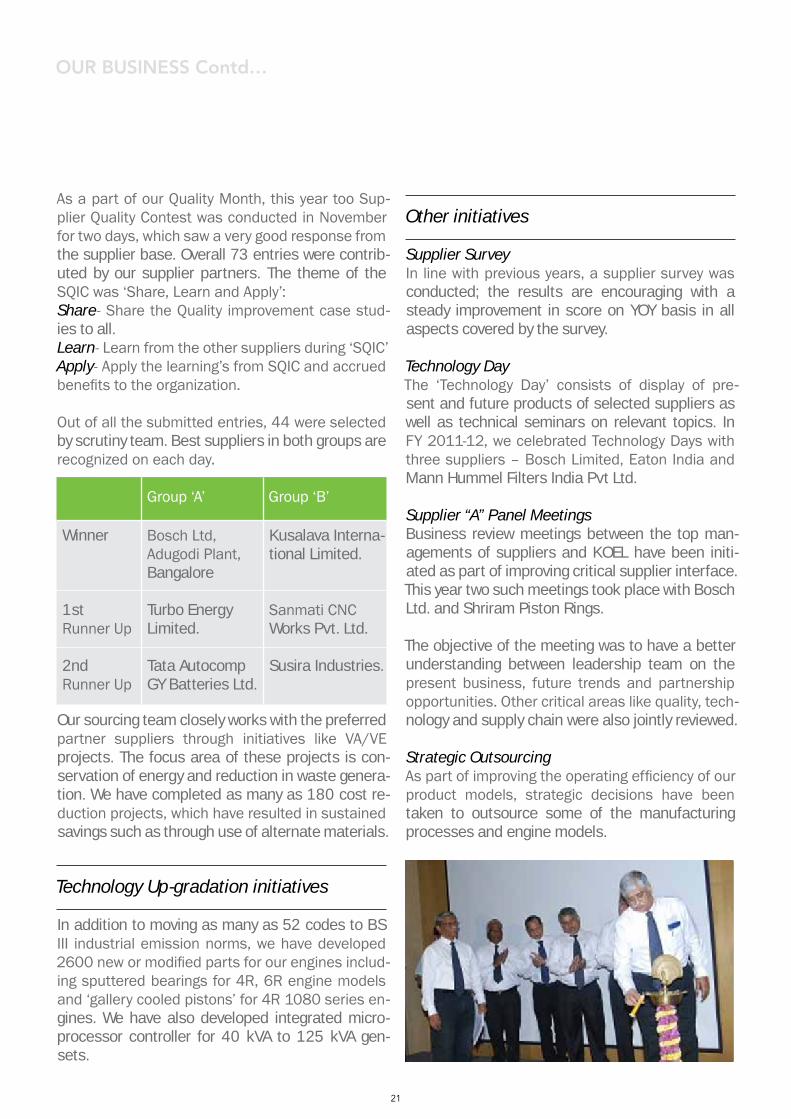
Technology Day The ‘Technology Day’ consists of display of pre-sent and future products of selected suppliers as well as technical seminars on relevant topics. In FY 2011-12, we celebrated Technology Days with three suppliers – Bosch Limited, Eaton India and Mann Hummel Filters India Pvt Ltd.
Supplier “A” Panel Meetings Business review meetings between the top man-agements of suppliers and KOEL have been initi-ated as part of improving critical supplier interface. This year two such meetings took place with Bosch Ltd. and Shriram Piston Rings.
The objective of the meeting was to have a better understanding between leadership team on the present business, future trends and partnership opportunities. Other critical areas like quality, tech-nology and supply chain were also jointly reviewed.
Strategic Outsourcing As part of improving the operating efficiency of our product models, strategic decisions have been taken to outsource some of the manufacturing processes and engine models.
Group ‘A’ Group ‘B’
Winner
1st Runner Up
2nd Runner Up
Bosch Ltd, Adugodi Plant, Bangalore
Turbo Energy Limited.
Tata Autocomp GY Batteries Ltd.
Kusalava Interna-tional Limited.
Sanmati CNC Works Pvt. Ltd.
Susira Industries.
OUR BUSINESS Contd…
21
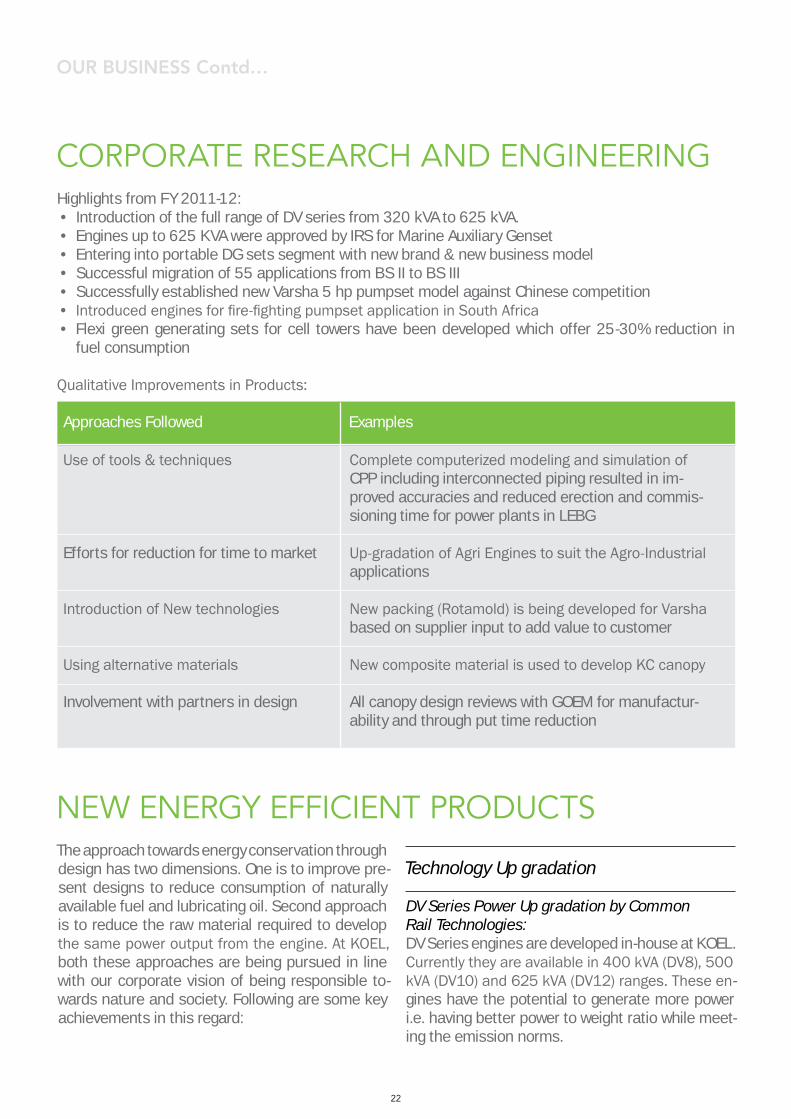
Highlights from FY 2011-12: • Introduction of the full range of DV series from 320 kVA to 625 kVA. • Engines up to 625 KVA were approved by IRS for Marine Auxiliary Genset • Entering into portable DG sets segment with new brand & new business model • Successful migration of 55 applications from BS II to BS III• Successfully established new Varsha 5 hp pumpset model against Chinese competition • Introduced engines for fire-fighting pumpset application in South Africa • Flexi green generating sets for cell towers have been developed which offer 25-30% reduction in
fuel consumption
Qualitative Improvements in Products:
The approach towards energy conservation through design has two dimensions. One is to improve pre-sent designs to reduce consumption of naturally available fuel and lubricating oil. Second approach is to reduce the raw material required to develop the same power output from the engine. At KOEL, both these approaches are being pursued in line with our corporate vision of being responsible to-wards nature and society. Following are some key achievements in this regard:
CORPORATE RESEARCh AND ENGINEERING
NEW ENERGY EFFICIENT PRODUCTS
OUR BUSINESS Contd…
Approaches Followed Examples
Use of tools & techniques
Efforts for reduction for time to market
Introduction of New technologies
Using alternative materials
Involvement with partners in design
Complete computerized modeling and simulation of CPP including interconnected piping resulted in im-proved accuracies and reduced erection and commis-sioning time for power plants in LEBG
Up-gradation of Agri Engines to suit the Agro-Industrial applications
New packing (Rotamold) is being developed for Varsha based on supplier input to add value to customer
New composite material is used to develop KC canopy
All canopy design reviews with GOEM for manufactur-ability and through put time reduction
Technology Up gradation
DV Series Power Up gradation by Common Rail Technologies:DV Series engines are developed in-house at KOEL. Currently they are available in 400 kVA (DV8), 500 kVA (DV10) and 625 kVA (DV12) ranges. These en-gines have the potential to generate more power i.e. having better power to weight ratio while meet-ing the emission norms.
22
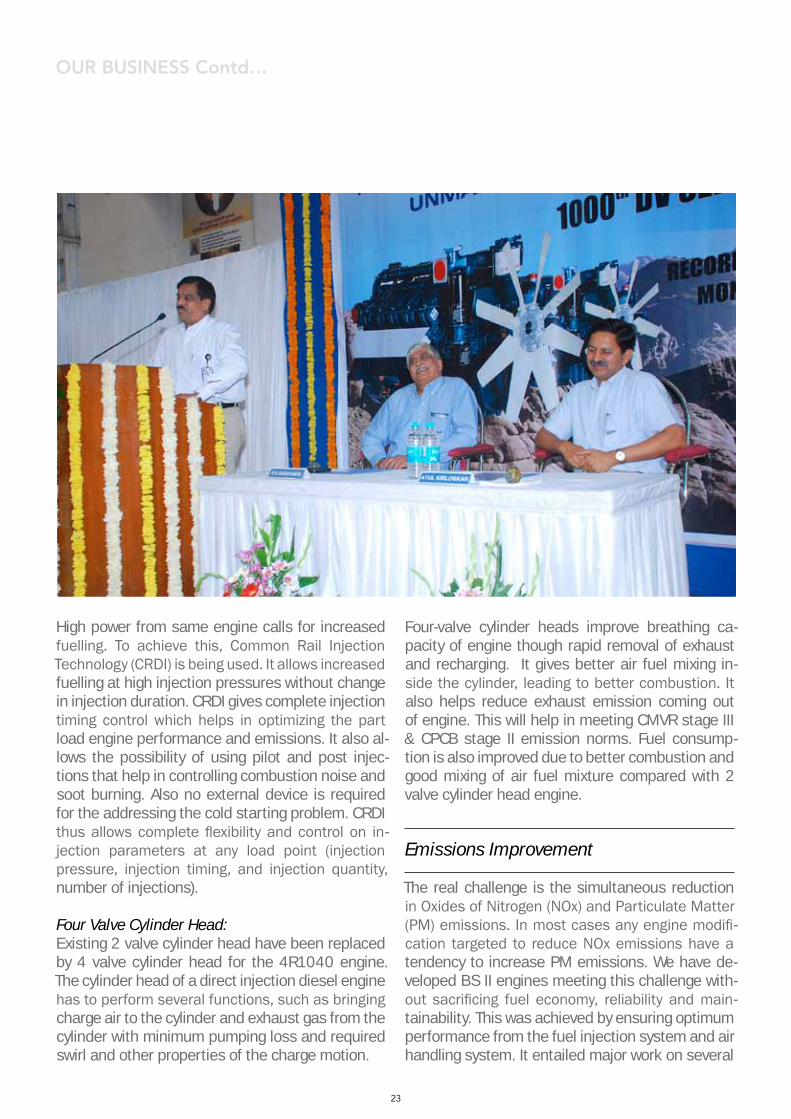
High power from same engine calls for increased fuelling. To achieve this, Common Rail Injection Technology (CRDI) is being used. It allows increased fuelling at high injection pressures without change in injection duration. CRDI gives complete injection timing control which helps in optimizing the part load engine performance and emissions. It also al-lows the possibility of using pilot and post injec-tions that help in controlling combustion noise and soot burning. Also no external device is required for the addressing the cold starting problem. CRDI thus allows complete flexibility and control on in-jection parameters at any load point (injection pressure, injection timing, and injection quantity, number of injections).
Four Valve Cylinder Head:Existing 2 valve cylinder head have been replaced by 4 valve cylinder head for the 4R1040 engine. The cylinder head of a direct injection diesel engine has to perform several functions, such as bringing charge air to the cylinder and exhaust gas from the cylinder with minimum pumping loss and required swirl and other properties of the charge motion.
Four-valve cylinder heads improve breathing ca-pacity of engine though rapid removal of exhaust and recharging. It gives better air fuel mixing in-side the cylinder, leading to better combustion. It also helps reduce exhaust emission coming out of engine. This will help in meeting CMVR stage III & CPCB stage II emission norms. Fuel consump-tion is also improved due to better combustion and good mixing of air fuel mixture compared with 2 valve cylinder head engine.
Emissions Improvement
The real challenge is the simultaneous reduction in Oxides of Nitrogen (NOx) and Particulate Matter (PM) emissions. In most cases any engine modifi-cation targeted to reduce NOx emissions have a tendency to increase PM emissions. We have de-veloped BS II engines meeting this challenge with-out sacrificing fuel economy, reliability and main-tainability. This was achieved by ensuring optimum performance from the fuel injection system and air handling system. It entailed major work on several
OUR BUSINESS Contd…
23
OUR BUSINESS Contd…
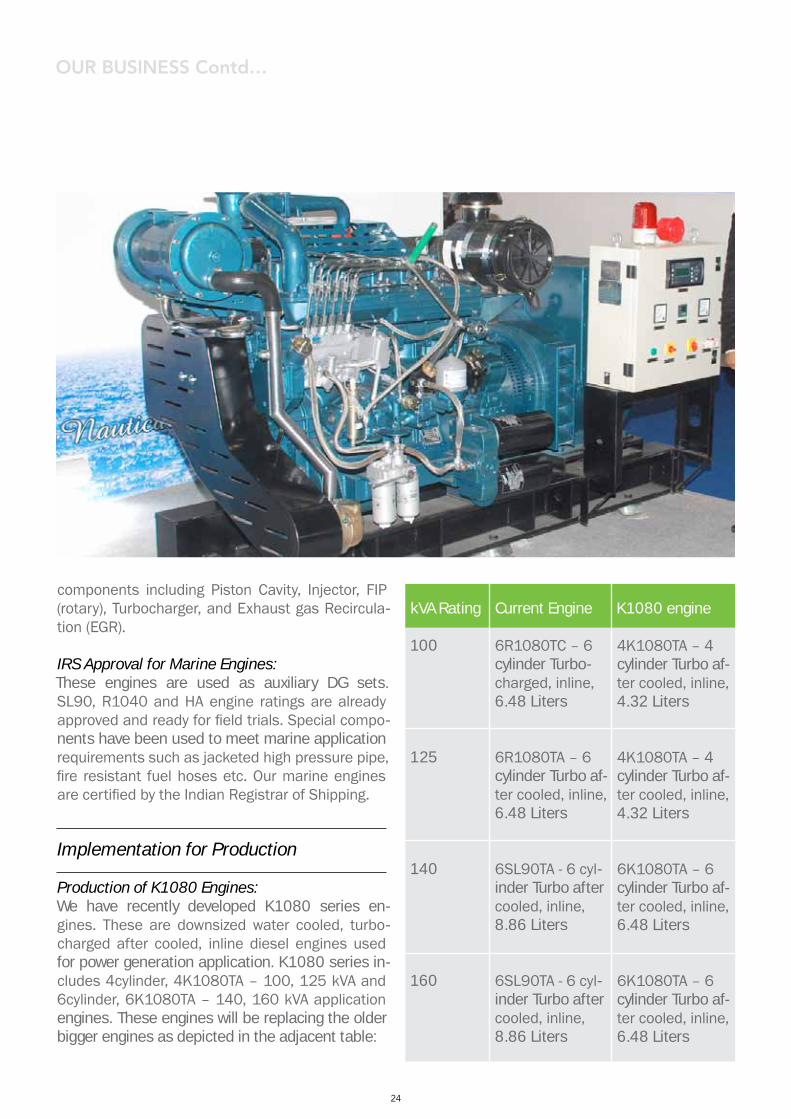
Current EnginekVA Rating K1080 engine
100
125
140
160
6R1080TC – 6 cylinder Turbo-charged, inline, 6.48 Liters
6R1080TA – 6 cylinder Turbo af-ter cooled, inline, 6.48 Liters
6SL90TA - 6 cyl-inder Turbo after cooled, inline, 8.86 Liters
6SL90TA - 6 cyl-inder Turbo after cooled, inline, 8.86 Liters
4K1080TA – 4 cylinder Turbo af-ter cooled, inline, 4.32 Liters
4K1080TA – 4 cylinder Turbo af-ter cooled, inline, 4.32 Liters
6K1080TA – 6 cylinder Turbo af-ter cooled, inline, 6.48 Liters
6K1080TA – 6 cylinder Turbo af-ter cooled, inline, 6.48 Liters
components including Piston Cavity, Injector, FIP (rotary), Turbocharger, and Exhaust gas Recircula-tion (EGR).
IRS Approval for Marine Engines:These engines are used as auxiliary DG sets. SL90, R1040 and HA engine ratings are already approved and ready for field trials. Special compo-nents have been used to meet marine application requirements such as jacketed high pressure pipe, fire resistant fuel hoses etc. Our marine engines are certified by the Indian Registrar of Shipping.
Implementation for Production
Production of K1080 Engines:We have recently developed K1080 series en-gines. These are downsized water cooled, turbo-charged after cooled, inline diesel engines used for power generation application. K1080 series in-cludes 4cylinder, 4K1080TA – 100, 125 kVA and 6cylinder, 6K1080TA – 140, 160 kVA application engines. These engines will be replacing the older bigger engines as depicted in the adjacent table:
24

25
CORPORATE GOVERNANCE
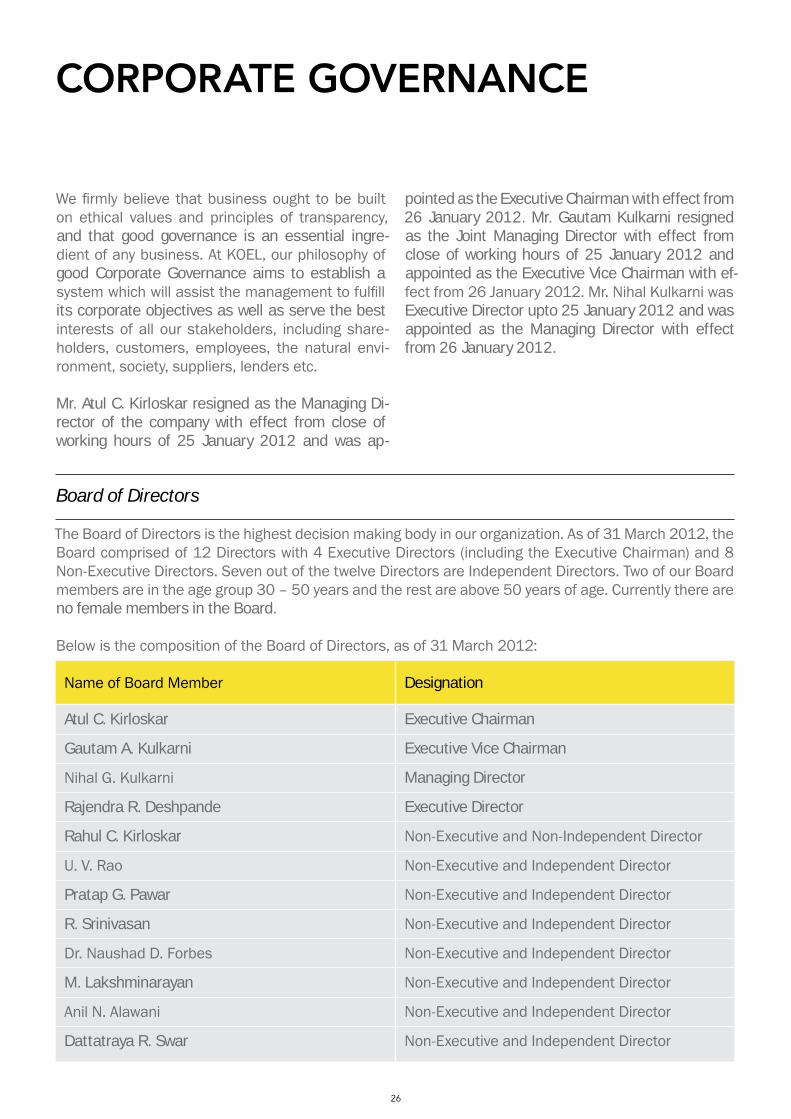
We firmly believe that business ought to be built on ethical values and principles of transparency, and that good governance is an essential ingre-dient of any business. At KOEL, our philosophy of good Corporate Governance aims to establish a system which will assist the management to fulfill its corporate objectives as well as serve the best interests of all our stakeholders, including share-holders, customers, employees, the natural envi-ronment, society, suppliers, lenders etc.
Mr. Atul C. Kirloskar resigned as the Managing Di-rector of the company with effect from close of working hours of 25 January 2012 and was ap-
pointed as the Executive Chairman with effect from 26 January 2012. Mr. Gautam Kulkarni resigned as the Joint Managing Director with effect from close of working hours of 25 January 2012 and appointed as the Executive Vice Chairman with ef-fect from 26 January 2012. Mr. Nihal Kulkarni was Executive Director upto 25 January 2012 and was appointed as the Managing Director with effect from 26 January 2012.
Board of Directors
The Board of Directors is the highest decision making body in our organization. As of 31 March 2012, the Board comprised of 12 Directors with 4 Executive Directors (including the Executive Chairman) and 8 Non-Executive Directors. Seven out of the twelve Directors are Independent Directors. Two of our Board members are in the age group 30 – 50 years and the rest are above 50 years of age. Currently there are no female members in the Board.
Below is the composition of the Board of Directors, as of 31 March 2012:
Name of Board Member Designation
Atul C. Kirloskar
Gautam A. Kulkarni
Nihal G. Kulkarni
Rajendra R. Deshpande
Rahul C. Kirloskar
U. V. Rao
Pratap G. Pawar
R. Srinivasan
Dr. Naushad D. Forbes
M. Lakshminarayan
Anil N. Alawani
Dattatraya R. Swar
Executive Chairman
Executive Vice Chairman
Managing Director
Executive Director
Non-Executive and Non-Independent Director
Non-Executive and Independent Director
Non-Executive and Independent Director
Non-Executive and Independent Director
Non-Executive and Independent Director
Non-Executive and Independent Director
Non-Executive and Independent Director
Non-Executive and Independent Director
26
CORPORATE GOVERNANCE Contd…
Some of the key information provided to the Board on a regular basis includes the following:• Review of Annual operating plans of business,
capital budgets, updates;• Quarterly results of the Company and its operat-
ing divisions or business segments;• Materially important show cause, demand,
prosecution and penalty notices;• Fatal or serious accidents, dangerous occur-
rences, any material effluent or pollution prob-lems;
• Any material relevant default in financial obli-gations to and by the Company, or substantial non-payment for goods sold by the Company;
• Any issue, which involves possible public or product liability claims of substantial nature;
• Details of any joint venture or collaboration agreement;
• Significant labor problems and their proposed solutions;
• Significant development in human resources and industrial relation fronts;
• Non-compliance of any regulatory, statuto-ry provision or listing requirements as well as shareholders service such as non-payment of dividend and delay in share transfer;
• Information on recruitment and remuneration of senior officers just below the Board level, in-cluding appointment or removal of Chief Finan-cial Officer or Company Secretary.
Board Committees
Currently, the Board has two committees viz. Audit Committee and Share Transfer cum Shareholders’ /Investors’ Grievance Committee.
The Audit Committee comprises of 4 Non-Execu-tive Directors, majority of who are Independent. The Assistant Company Secretary acts as the Sec-retary to the Committee. The Executive Directors and the Chief Financial Officer attend the Audit Committee meetings. The representatives of the Internal Auditors, Statutory Auditors, Cost Auditors and Business Unit/Operations Heads are invited to the meetings. During FY 2011-12, the Audit
Committee met for 5 meetings.
The terms of reference of the Audit Committee in-clude the matters specified under Clause 49 II of the Listing Agreement entered into with the stock exchanges as well as those in Section 292A of the Companies Act, 1956.
The Share Transfer cum Shareholders’/Investors’ Grievance Committee looks into the shareholders’/investors’ complaints such as transfer of shares, non-receipt of balance sheet, non-receipt of de-clared dividends etc, and the redressal of such complaints. This committee is headed by a Non-Executive Independent Director, and the Assistant Company Secretary is the Compliance Officer. Dur-ing FY 2011-12, four complaints were received and were subsequently resolved.
The Company has not set up a Remuneration Com-mittee. The Board of Directors decides the remu-neration of the Executive Directors in accordance with the provisions of the Companies Act, 1956, subject to the approval of the shareholders. The re-muneration to the Non Executive directors is also decided by the Board of directors, and is depend-ent upon the profits of the company in the finan-cial year as well as their participation in the board meetings. This is in compliance to the sections 349 and 350 of the Companies Act, 1956.
Corruption
At KOEL, we always strive to promote a non-corrupt work environment, and consider it as an important aspect in framing our rules and policies.
27
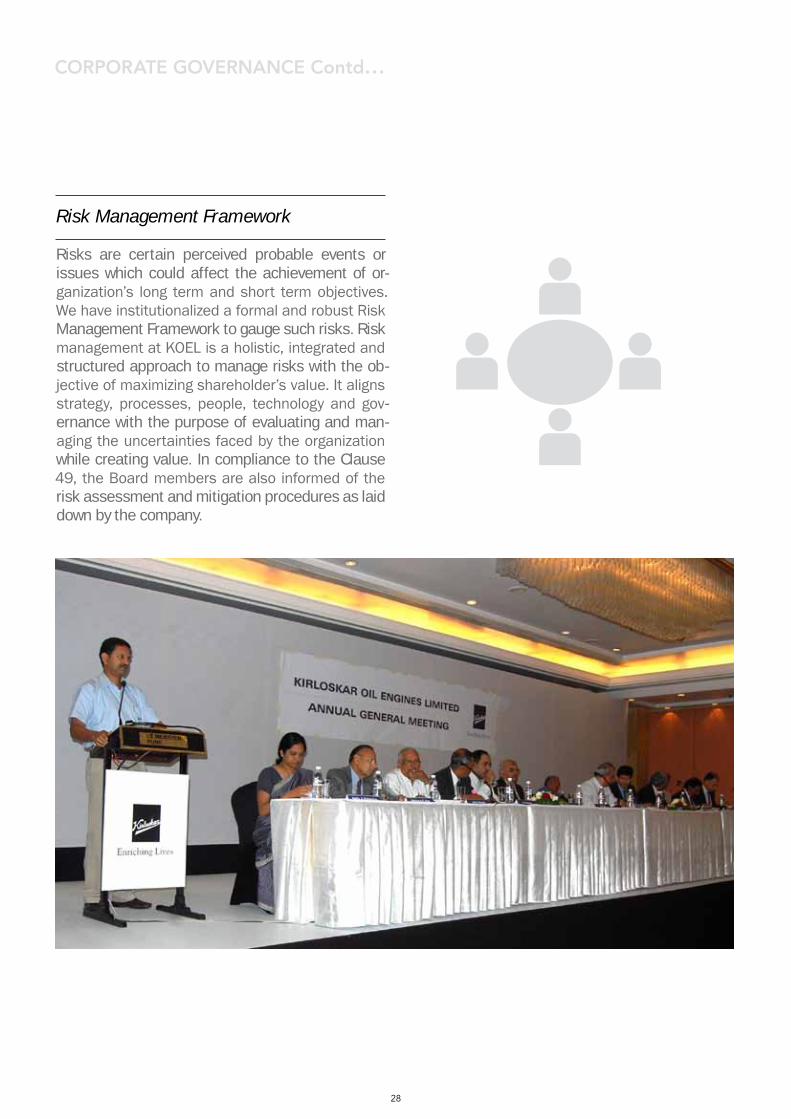
Risk Management Framework
Risks are certain perceived probable events or issues which could affect the achievement of or-ganization’s long term and short term objectives. We have institutionalized a formal and robust Risk Management Framework to gauge such risks. Risk management at KOEL is a holistic, integrated and structured approach to manage risks with the ob-jective of maximizing shareholder’s value. It aligns strategy, processes, people, technology and gov-ernance with the purpose of evaluating and man-aging the uncertainties faced by the organization while creating value. In compliance to the Clause 49, the Board members are also informed of the risk assessment and mitigation procedures as laid down by the company.
CORPORATE GOVERNANCE Contd…
28

29
ECONOMIC PERFORMANCE
In FY 2011-12, we achieved sales of Rs. 2,276 crores (including sales of bearings business of Rs. 62 crores) as against Rs. 2,364 crores in the previ-ous years (including sales of bearings business of Rs. 123 crores). This represents a marginal decline of 3.8%. The profit before tax is Rs. 281 crores (in-cluding profit on sale of bearings business Rs. 48 crores) in 2011-12 against Rs. 244 crores in the previous year.
Our performance was impacted by the industrial growth in key business sectors. India’s off highway engines market slowed down to 14% in FY 2011-12, with the market demand being adversely af-fected by poor availability funds, delayed closure of highway projects and other factors. The off-high-way market continues to be bearish and is likely to regain its buoyancy towards the beginning of the third quarter of the current fiscal. We are gearing up to effectively address the cost pressures and enhance our operational efficiency. Our engines and pump sets for the agriculture segment have shown a better performance and low total cost of ownership, and our products are priced at an aver-age premium of 35%-40%.
We face stiff competition from low cost Chinese imports as well as from the unorganized Indian players. Availability of government subsidies for diesel pump sets in most of the agriculture market is a critical factor in generating a demand for our agriculture pump sets.
Our business plans in the telecom business were not realized due to low level of buying by telecom operators. The stationary power plant segment of the large engine business group was adversely af-fected by high furnace oil prices in FY 2011-12.
We have a cautious outlook on the economy for the current fiscal, considering the anticipated rise in crude oil prices and inflationary pressures in the economy. The government continues to put great emphasis on infrastructure, particularly urban in-frastructure and national highways. In the power generation segment, the estimated demand-sup-ply gap of around 8% together with improving life-
styles will sustain our business growth. We have taken a lead in the area of nuclear power by win-ning orders worth Rs. 396 crores to supply gensets to the Nuclear Power Corporation of India over the next 3 years.
30
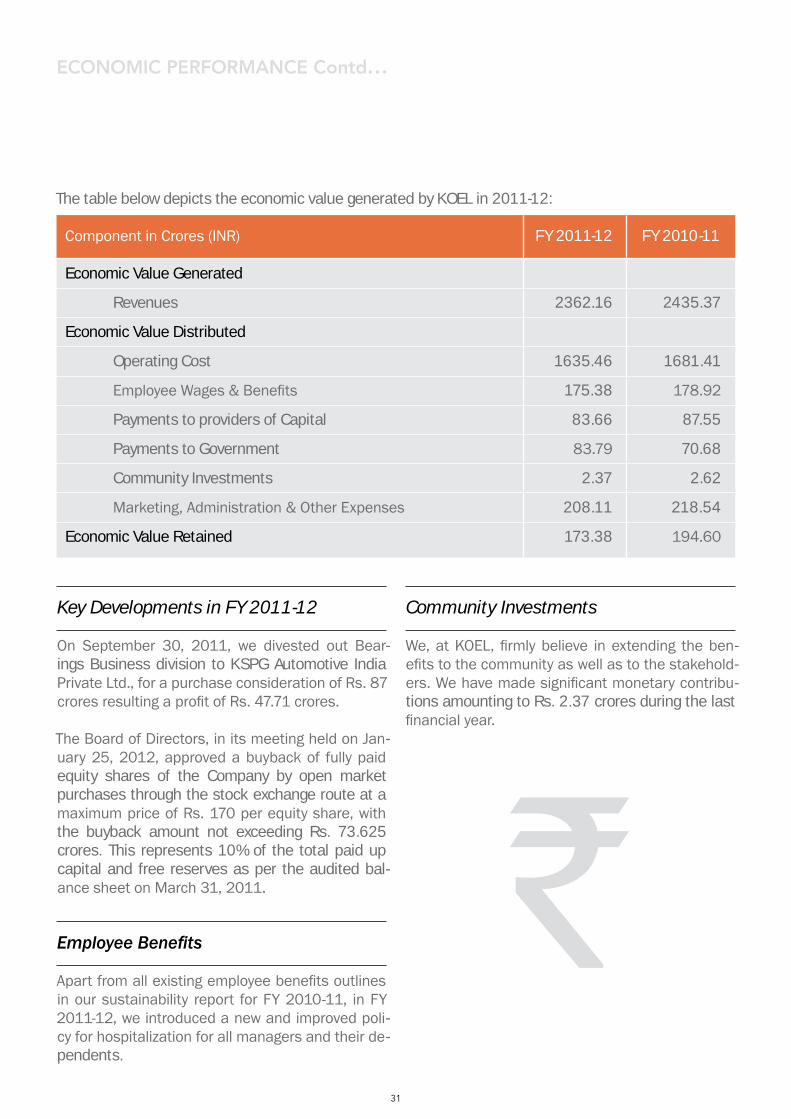
Component in Crores (INR) FY 2011-12 FY 2010-11
Economic Value Generated
Revenues
Economic Value Distributed
Operating Cost
Employee Wages & Benefits
Payments to providers of Capital
Payments to Government
Community Investments
Marketing, Administration & Other Expenses
Economic Value Retained
2362.16
1635.46
175.38
83.66
83.79
2.37
208.11
173.38
2435.37
1681.41
178.92
87.55
70.68
2.62
218.54
194.60
The table below depicts the economic value generated by KOEL in 2011-12:
Key Developments in FY 2011-12
On September 30, 2011, we divested out Bear-ings Business division to KSPG Automotive India Private Ltd., for a purchase consideration of Rs. 87 crores resulting a profit of Rs. 47.71 crores.
The Board of Directors, in its meeting held on Jan-uary 25, 2012, approved a buyback of fully paid equity shares of the Company by open market purchases through the stock exchange route at a maximum price of Rs. 170 per equity share, with the buyback amount not exceeding Rs. 73.625 crores. This represents 10% of the total paid up capital and free reserves as per the audited bal-ance sheet on March 31, 2011.
Employee Benefits
Apart from all existing employee benefits outlines in our sustainability report for FY 2010-11, in FY 2011-12, we introduced a new and improved poli-cy for hospitalization for all managers and their de-pendents.
Community Investments
We, at KOEL, firmly believe in extending the ben-efits to the community as well as to the stakehold-ers. We have made significant monetary contribu-tions amounting to Rs. 2.37 crores during the last financial year.
ECONOMIC PERFORMANCE Contd…
31

32
ENVIRONMENTAL PERFORMANCE
At KOEL, we give utmost importance to our environmental responsibility. All our facilities comply with the local environmental legislative requirements – such as those enforced by the Central Pollution Control Board, State Pollution Control Boards, in addition to compliance with Factories Act and Rules. Our envi-ronmental strategy is shaped by our Energy and Environmental, Health & Safety Policies, as well as the Confederation of Indian Industries (CII) Code for Ecologically Sustainable Growth, of which we are a sig-natory since 2007. In December 2011, we reviewed our Energy Policy.
KIRLOSKAR OIL ENGINES LIMITED
ENERGY POLICY
We, the KOEL, leading manufacturer of Diesel Engines, Gensets, and Pumpsets in the country are committed towards Nation's Mission for Enhanced Energy Efficiency by making continuous efforts to optimize use of energy and to bring about improvement in the energy efficiency in all our manu-facturing processes and products.
We shall strive to achieve the above by:• Bench-marking all our products for energy consumption by comparison with the regional and
national best.• Procuring and using highly energy efficient products and technologies in our operations to re-
duce carbon footprint.• Eliminating wastage of energy and promoting reuse and recycling of resources, and be environ-
mental friendly in our operations.• Promoting and increasing use of renewable energy resources, within and outside KOEL.• Adopting national energy conversation norms and codes in new building constructions as well
as in existing buildings.• Conducting periodic energy efficiency improvement studies and implementing all improvement
measures and continuously monitoring gains obtained through Energy Management System.• Involving all stakeholders including employees in the energy conservation efforts through train-
ing & awareness programs. Recognizing employee's efforts through competitions and schemes.• Sharing and enriching our experiences on energy conservation with our group of companies and
other organizations• Complying with National Energy legislations and other related legislations.
KOEL, as a part of our energy efficiency improvement strategy, will make every effort to reduce our specific energy consumption by 2-5% per year by promoting culture of innovation, creativity and aligning commitments at all levels.
Issue No: 3Issue Date: 01.08.2003.Review Date: 14.12.2011.
Atul KirloskarChairman & Managing Director
33
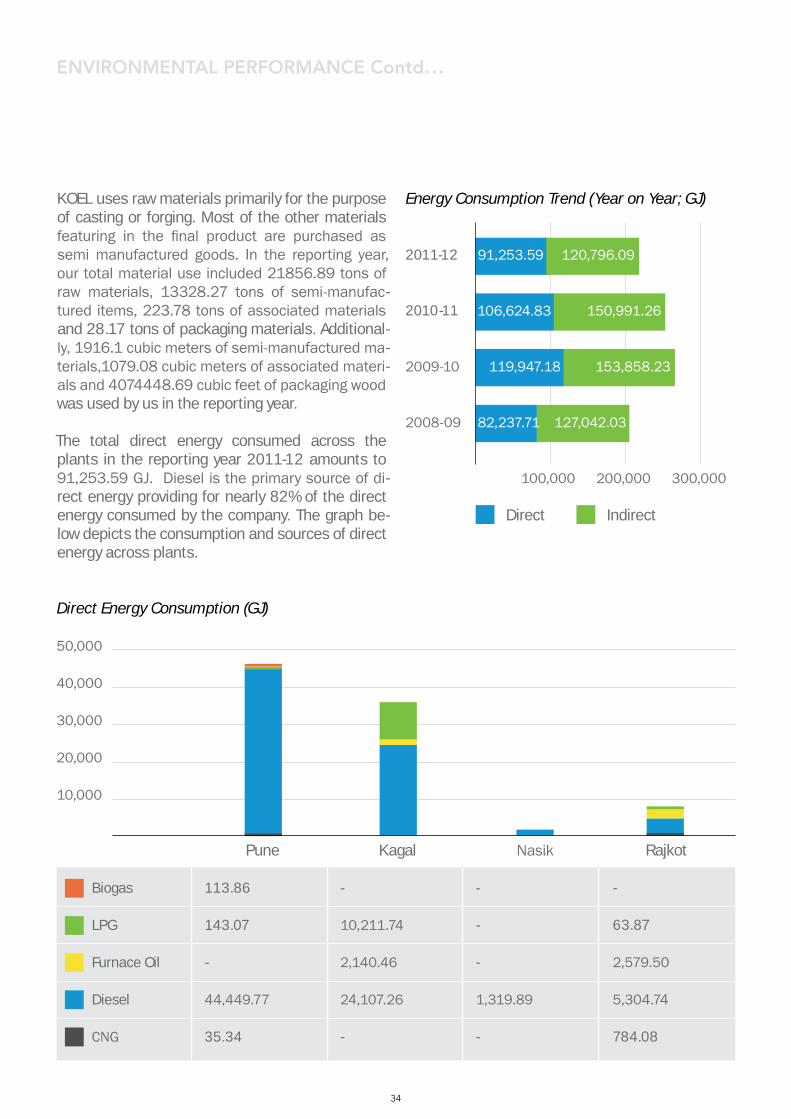
KOEL uses raw materials primarily for the purpose of casting or forging. Most of the other materials featuring in the final product are purchased as semi manufactured goods. In the reporting year, our total material use included 21856.89 tons of raw materials, 13328.27 tons of semi-manufac-tured items, 223.78 tons of associated materials and 28.17 tons of packaging materials. Additional-ly, 1916.1 cubic meters of semi-manufactured ma-terials,1079.08 cubic meters of associated materi-als and 4074448.69 cubic feet of packaging wood was used by us in the reporting year.
The total direct energy consumed across the plants in the reporting year 2011-12 amounts to 91,253.59 GJ. Diesel is the primary source of di-rect energy providing for nearly 82% of the direct energy consumed by the company. The graph be-low depicts the consumption and sources of direct energy across plants.
ENVIRONMENTAL PERFORMANCE Contd…
2011-12
Pune
300,000200,000100,000
30,000
40,000
50,000
Energy Consumption Trend (Year on Year; GJ)
Direct Energy Consumption (GJ)
20,000
10,000
Direct Indirect
Biogas
LPG
Furnace Oil
Diesel
CNG
113.86
143.07
-
44,449.77
35.34
-
10,211.74
2,140.46
24,107.26
-
-
-
-
1,319.89
-
-
63.87
2,579.50
5,304.74
784.08
2010-11
Kagal
2009-10
Nasik
2008-09
Rajkot
120,796.09
127,042.03
150,991.26
153,858.23
91,253.59
82,237.71
106,624.83
119,947.18
34
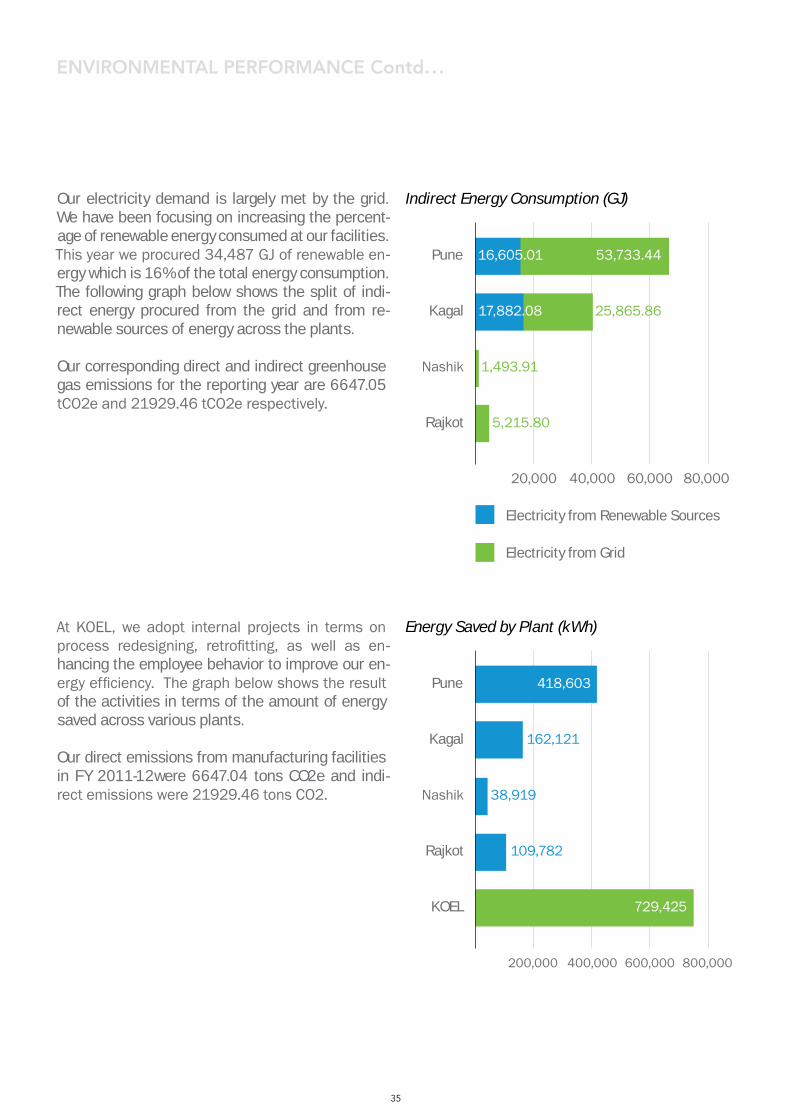
Our electricity demand is largely met by the grid. We have been focusing on increasing the percent-age of renewable energy consumed at our facilities. This year we procured 34,487 GJ of renewable en-ergy which is 16% of the total energy consumption. The following graph below shows the split of indi-rect energy procured from the grid and from re-newable sources of energy across the plants.
Our corresponding direct and indirect greenhouse gas emissions for the reporting year are 6647.05 tCO2e and 21929.46 tCO2e respectively.
At KOEL, we adopt internal projects in terms on process redesigning, retrofitting, as well as en-hancing the employee behavior to improve our en-ergy efficiency. The graph below shows the result of the activities in terms of the amount of energy saved across various plants.
Our direct emissions from manufacturing facilities in FY 2011-12were 6647.04 tons CO2e and indi-rect emissions were 21929.46 tons CO2.
Pune
Pune
162,121
38,919
109,782
418,603
729,425
80,000
800,000
60,000
600,000
40,000
400,000
20,000
200,000
Indirect Energy Consumption (GJ)
Energy Saved by Plant (kWh)
Electricity from Renewable Sources
Electricity from Grid
Kagal
Kagal
Nashik
Nashik
Rajkot
Rajkot
KOEL
53,733.44
25,865.86
16,605.01
5,215.80
17,882.08
1,493.91
ENVIRONMENTAL PERFORMANCE Contd…
35
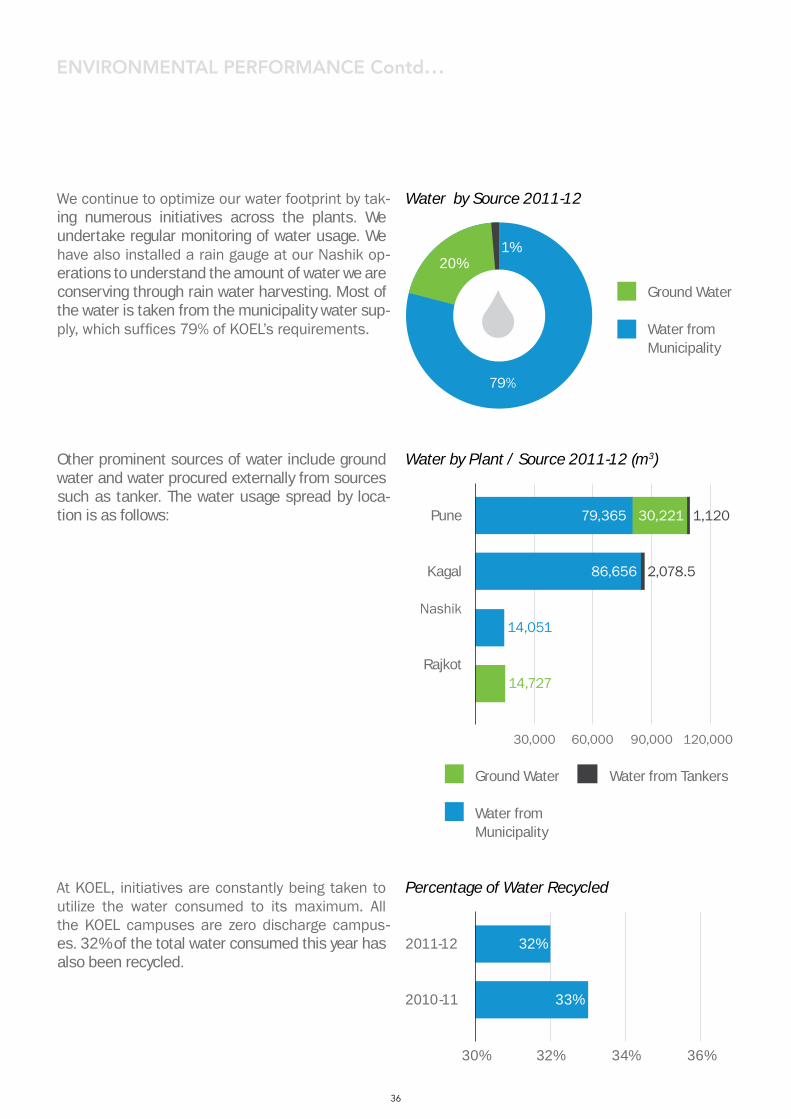
We continue to optimize our water footprint by tak-ing numerous initiatives across the plants. We undertake regular monitoring of water usage. We have also installed a rain gauge at our Nashik op-erations to understand the amount of water we are conserving through rain water harvesting. Most of the water is taken from the municipality water sup-ply, which suffices 79% of KOEL’s requirements.
Other prominent sources of water include ground water and water procured externally from sources such as tanker. The water usage spread by loca-tion is as follows:
At KOEL, initiatives are constantly being taken to utilize the water consumed to its maximum. All the KOEL campuses are zero discharge campus-es. 32% of the total water consumed this year has also been recycled.
2011-12
120,000
36%
90,00060,00030,000
34%32%30%
Water by Source 2011-12
Water by Plant / Source 2011-12 (m3)
Percentage of Water Recycled
2010-11
Pune
Kagal
Nashik
Rajkot
ENVIRONMENTAL PERFORMANCE Contd…
Ground Water
Water from Municipality
Ground Water
Water from Municipality
Water from Tankers
79%
32%
33%
1%20%
30,221 1,120
2,078.5
14,051
14,727
79,365
86,656
36
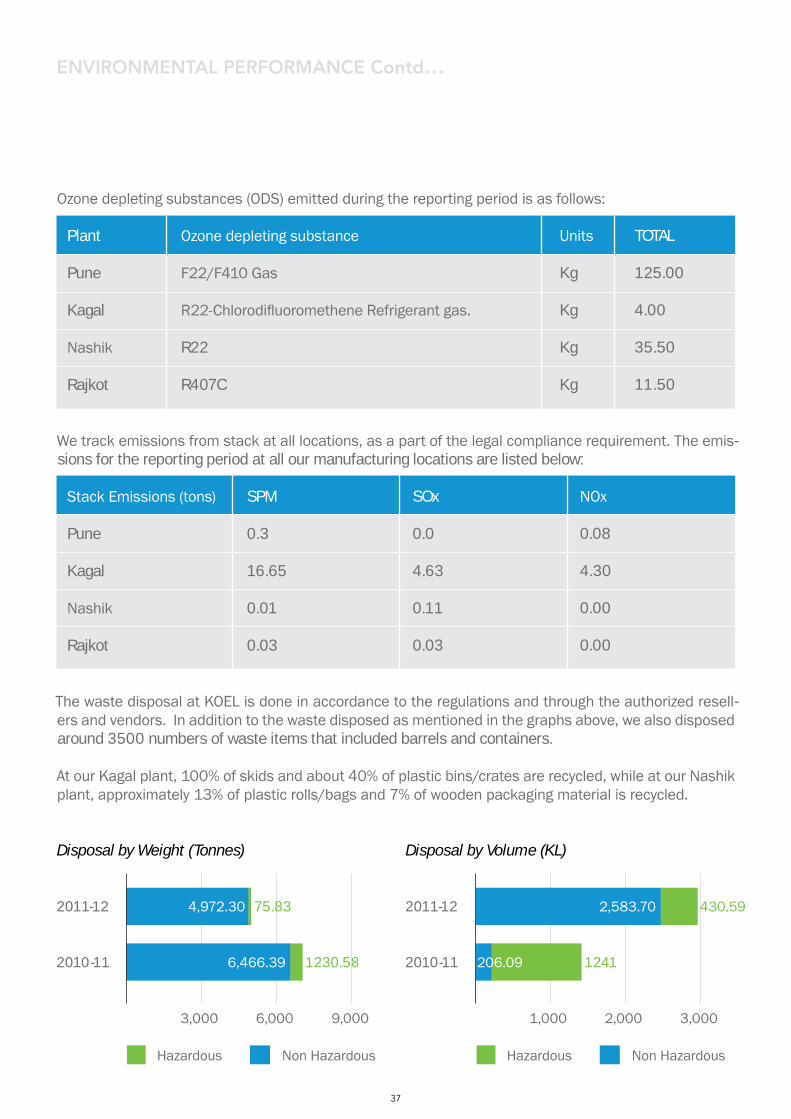
Ozone depleting substances (ODS) emitted during the reporting period is as follows:
2011-122011-12
3,0009,000 2,0006,000 1,0003,000
Disposal by Volume (KL)Disposal by Weight (Tonnes)
2010-112010-11
Hazardous HazardousNon Hazardous Non Hazardous
We track emissions from stack at all locations, as a part of the legal compliance requirement. The emis-sions for the reporting period at all our manufacturing locations are listed below:
The waste disposal at KOEL is done in accordance to the regulations and through the authorized resell-ers and vendors. In addition to the waste disposed as mentioned in the graphs above, we also disposed around 3500 numbers of waste items that included barrels and containers.
At our Kagal plant, 100% of skids and about 40% of plastic bins/crates are recycled, while at our Nashik plant, approximately 13% of plastic rolls/bags and 7% of wooden packaging material is recycled.
Stack Emissions (tons)
Pune
Kagal
Nashik
Rajkot
Plant
Pune
Kagal
Nashik
Rajkot
SPM
0.3
16.65
0.01
0.03
Ozone depleting substance
F22/F410 Gas
R22-Chlorodifluoromethene Refrigerant gas.
R22
R407C
SOx
0.0
4.63
0.11
0.03
Units
Kg
Kg
Kg
Kg
NOx
0.08
4.30
0.00
0.00
TOTAL
125.00
4.00
35.50
11.50
75.83
1230.58
4,972.30
6,466.39
2,583.70
206.09 1241
430.59
ENVIRONMENTAL PERFORMANCE Contd…
37
Kagal
Rupe
es in
Lak
hs
80.00
70.00
60.00
50.00
40.00
30.00
20.00
10.00
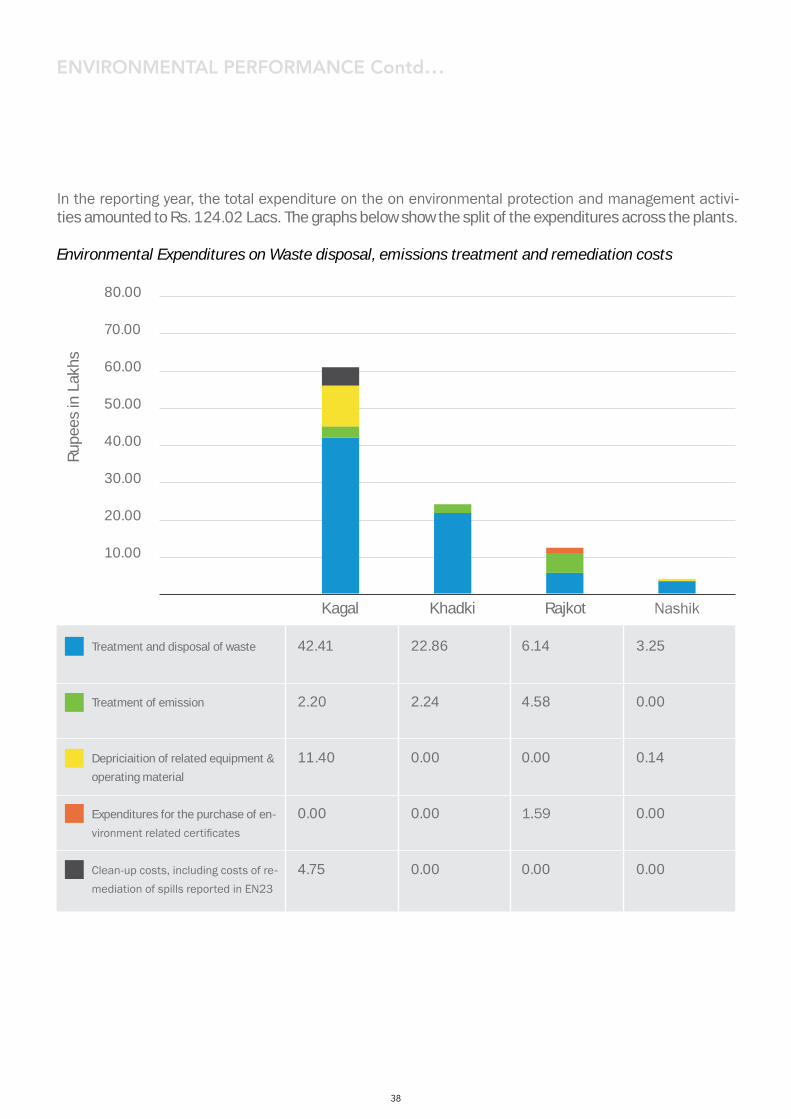
Environmental Expenditures on Waste disposal, emissions treatment and remediation costs
Treatment and disposal of waste
Treatment of emission
Depriciaition of related equipment & operating material
Expenditures for the purchase of en-vironment related certificates
Clean-up costs, including costs of re-mediation of spills reported in EN23
42.41
2.20
11.40
0.00
4.75
22.86
2.24
0.00
0.00
0.00
6.14
4.58
0.00
1.59
0.00
3.25
0.00
0.14
0.00
0.00
Khadki Rajkot Nashik
ENVIRONMENTAL PERFORMANCE Contd…
In the reporting year, the total expenditure on the on environmental protection and management activi-ties amounted to Rs. 124.02 Lacs. The graphs below show the split of the expenditures across the plants.
38
Rupe
es in
Lak
hs
Kagal
16.00
14.00
12.00
10.00
8.00
6.00
4.00
2.00
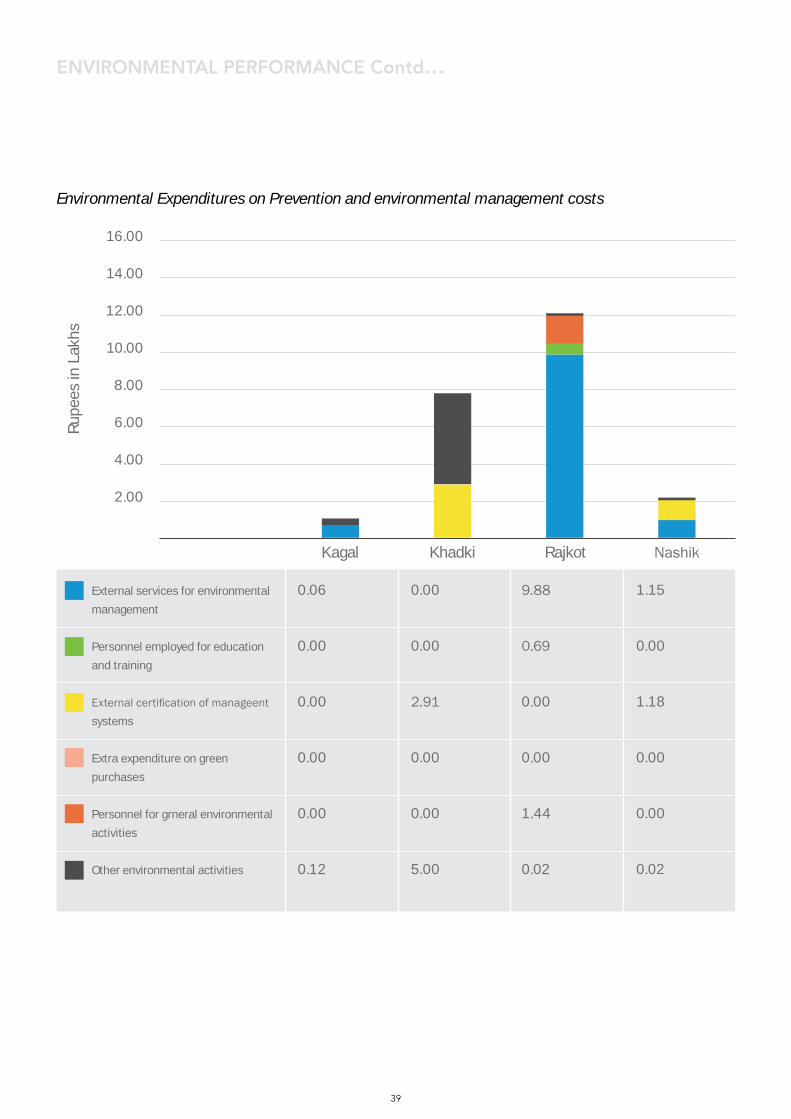
Environmental Expenditures on Prevention and environmental management costs
External services for environmental management
Personnel employed for education and training
External certification of manageent systems
Extra expenditure on green purchases
Personnel for grneral environmental activities
Other environmental activities
0.06
0.00
0.00
0.00
0.00
0.12
0.00
0.00
2.91
0.00
0.00
5.00
9.88
0.69
0.00
0.00
1.44
0.02
1.15
0.00
1.18
0.00
0.00
0.02
Khadki Rajkot Nashik
ENVIRONMENTAL PERFORMANCE Contd…
39
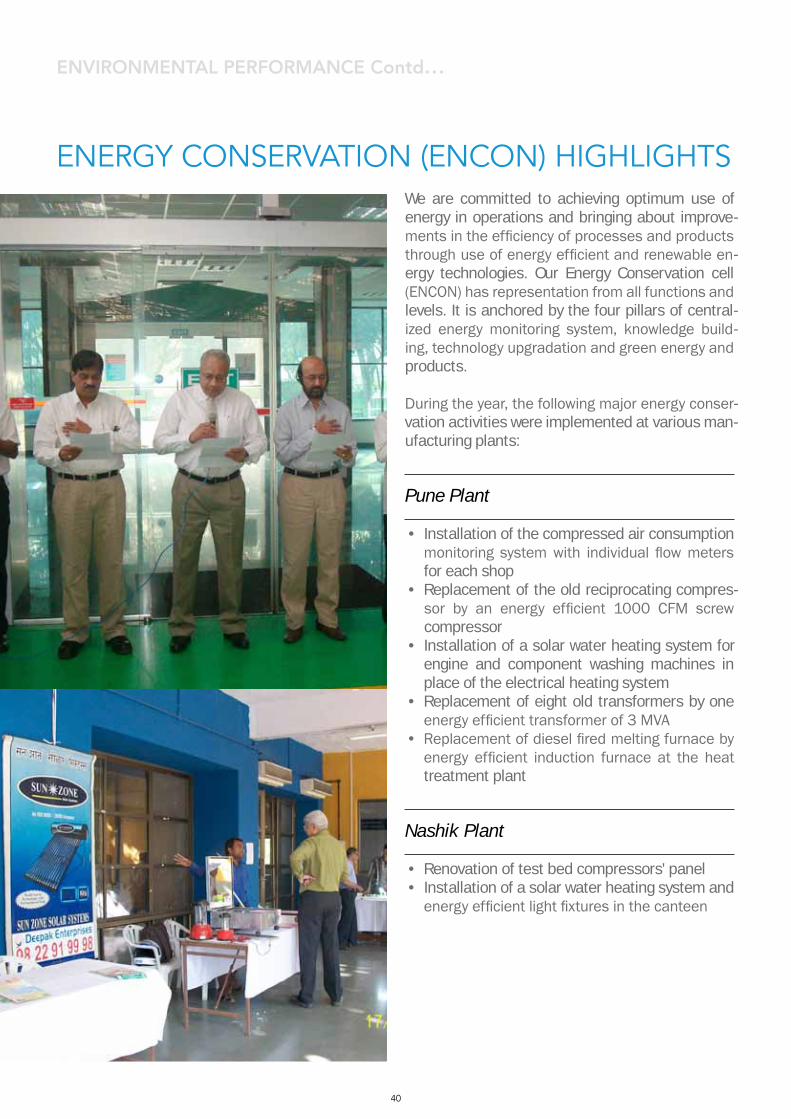
We are committed to achieving optimum use of energy in operations and bringing about improve-ments in the efficiency of processes and products through use of energy efficient and renewable en-ergy technologies. Our Energy Conservation cell (ENCON) has representation from all functions and levels. It is anchored by the four pillars of central-ized energy monitoring system, knowledge build-ing, technology upgradation and green energy and products.
During the year, the following major energy conser-vation activities were implemented at various man-ufacturing plants:
Pune Plant
• Installation of the compressed air consumption monitoring system with individual flow meters for each shop
• Replacement of the old reciprocating compres-sor by an energy efficient 1000 CFM screw compressor
• Installation of a solar water heating system for engine and component washing machines in place of the electrical heating system
• Replacement of eight old transformers by one energy efficient transformer of 3 MVA
• Replacement of diesel fired melting furnace by energy efficient induction furnace at the heat treatment plant
Nashik Plant
• Renovation of test bed compressors' panel• Installation of a solar water heating system and
energy efficient light fixtures in the canteen
ENERGY CONSERvATION (ENCON) hIGhLIGhTS
ENVIRONMENTAL PERFORMANCE Contd…
40
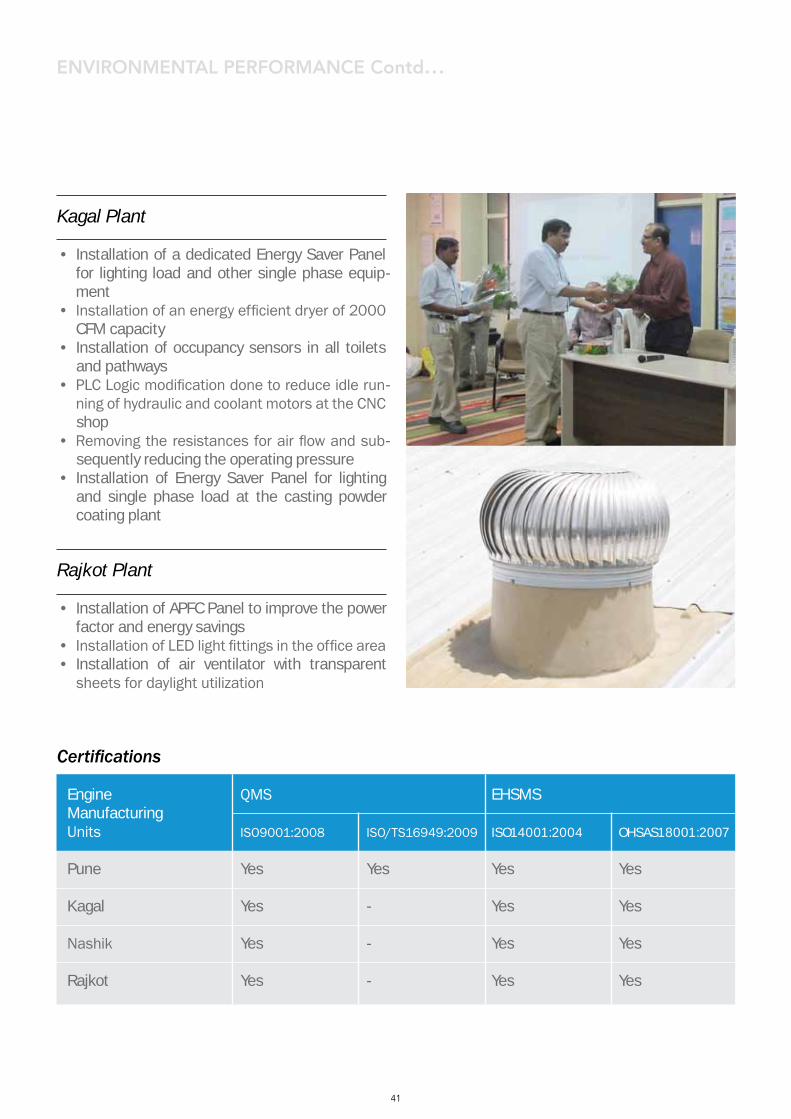
Kagal Plant
• Installation of a dedicated Energy Saver Panel for lighting load and other single phase equip-ment
• Installation of an energy efficient dryer of 2000 CFM capacity
• Installation of occupancy sensors in all toilets and pathways
• PLC Logic modification done to reduce idle run-ning of hydraulic and coolant motors at the CNC shop
• Removing the resistances for air flow and sub-sequently reducing the operating pressure
• Installation of Energy Saver Panel for lighting and single phase load at the casting powder coating plant
Rajkot Plant
• Installation of APFC Panel to improve the power factor and energy savings
• Installation of LED light fittings in the office area• Installation of air ventilator with transparent
sheets for daylight utilization
Certifications
Engine Manufacturing Units
Pune
Kagal
Nashik
Rajkot
QMS
ISO9001:2008
Yes
Yes
Yes
Yes
ISO/TS16949:2009
Yes
-
-
-
OHSAS18001:2007
Yes
Yes
Yes
Yes
EHSMS
ISO14001:2004
Yes
Yes
Yes
Yes
ENVIRONMENTAL PERFORMANCE Contd…
41
ENVIRONMENTAL PERFORMANCE Contd…
42

43
SOCIAL PERFORMANCE
Employees are our most valuable resource, and we continue to emphasize on employee engage-ment, fulfilling their learning and developmental needs and rewarding their efforts. We strictly en-force all applicable labor laws to prevent child la-bor and forced labor. We forbid workplace discrimi-nation of any form including that based on gender. There was no incident of discrimination recorded in this reporting period.
At KOEL, we give the utmost importance to uphold-ing the human rights of all our employees. Further, we deny entry to any individual seeking access to our campus on work if found to be underage.
Employee Training and Development
FY 2011-12 was highly eventful and constructive in terms of capability building for KOEL employees. Leadership Building interventions were carried out at three levels with a very focused and thoughtful approach:
To develop a pool of future leaders, the second batch of Leadership Development Program (LDP) was initiated for senior level employees. The pro-gram has been further extended leading to a Cer-tificate in Post Graduate Program in Management Studies by Welingkar Institute, Mumbai. The LDP participants were provided with internal as well as external mentors for developing and implementing live projects in KOEL.
The second batch of Middle Management Devel-opment Program (MMDP) for middle level was em-ployees launched in April 2011, and was complet-ed in February 2012. During the journey of MMDP, participants took up projects based on the OFIs (Opportunities for Improvement) identified during RKQP/CII Exim assessment for Business Excel-lence for the year 2010-11. These projects were evaluated by a panel of jury consisting of senior ex-ecutives of KOEL, who offered their valuable sup-port during the project assessments.
An Assessment Centre for identifying Fast Track-ers at Junior Level was initiated in January 2012. A year-long individual development program has been developed for all existing Fast Trackers.
In addition to these initiatives, a quarterly training calendar is floated in the beginning of every Quar-ter. This consists of a blend of behavioral, techni-cal and functional programs for managers, identi-fied through a training need analysis on the basis of annual appraisals and discussion with Business Unit/Functional Heads. A total of 88 internal train-ing programs were conducted last year and man-agers were nominated for a total of 67 specialized external programs.
Apart from this, for Team Members / Team Associ-ates, monthly Out-Bound Training programs (OBTs) were organized for team members / team associ-ates. These were designed to address specific is-sues or concerns in a work group or across work groups, at Pune and Kagal plants.
The results of previous year’s Employee Engage-ment Survey were shared with all managers. Work-group-level action planning sessions and follow-up sessions were planned and implemented. An em-ployee communication matrix was developed as a result of enterprise-level issues identified and speak-out sessions were organized to enhance top down as well as bottom up communication. En-gagement score for managers in 2011-12 was 69%.
We value employee engagement survey as a tool that helps understand the pulse of employees to plan and implement actions in line with employee expectations. In the reporting year, we have expand-ed the focus of the survey from manager-employee relationship to leadership commitment, managers and HR practices in order to measure employee en-gagement in a well-rounded manner. The measure-ment tool was designed to have an action-oriented output, in coordination with Aon Hewitt.
44
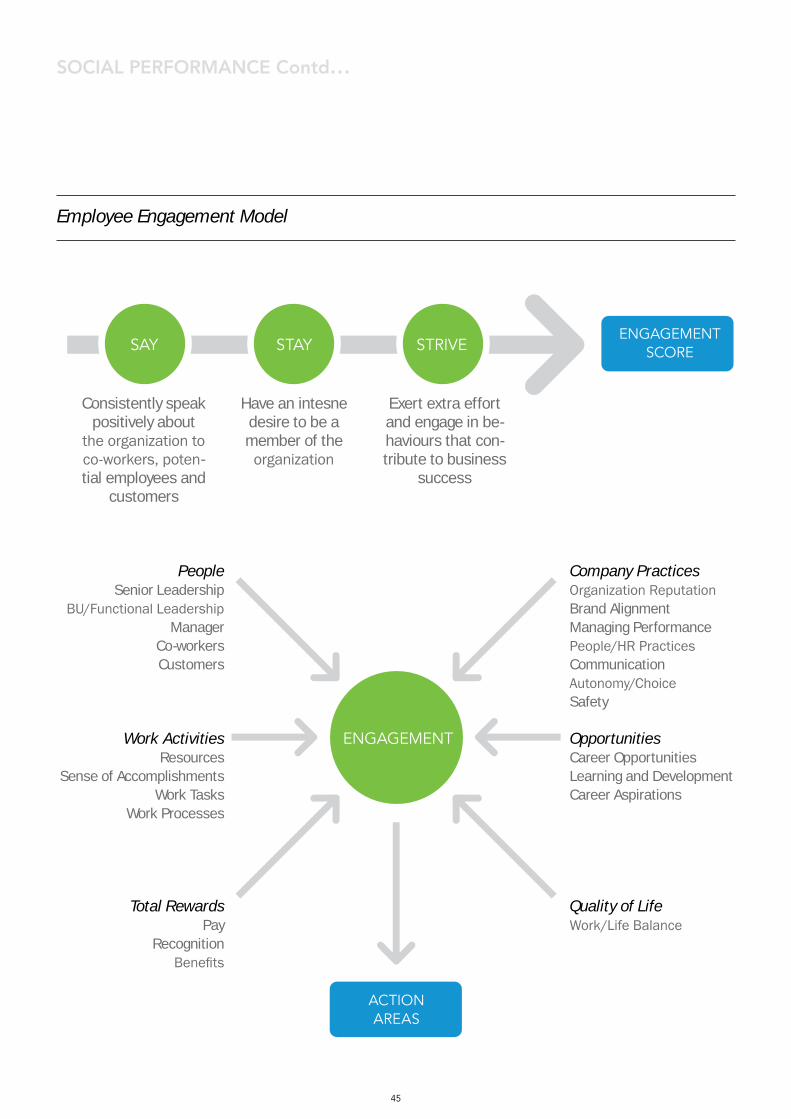
SOCIAL PERFORMANCE Contd…
Employee Engagement Model
SAY STAY STRIvE
ENGAGEMENT
ENGAGEMENT SCORE
ACTIONAREAS
Consistently speak positively about
the organization to co-workers, poten-tial employees and
customers
PeopleSenior Leadership
BU/Functional LeadershipManager
Co-workersCustomers
Work ActivitiesResources
Sense of AccomplishmentsWork Tasks
Work Processes
OpportunitiesCareer OpportunitiesLearning and DevelopmentCareer Aspirations
Quality of LifeWork/Life Balance
Total RewardsPay
RecognitionBenefits
Company PracticesOrganization ReputationBrand AlignmentManaging PerformancePeople/HR PracticesCommunicationAutonomy/ChoiceSafety
Have an intesne desire to be a member of the
organization
Exert extra effort and engage in be-haviours that con-tribute to business
success
45
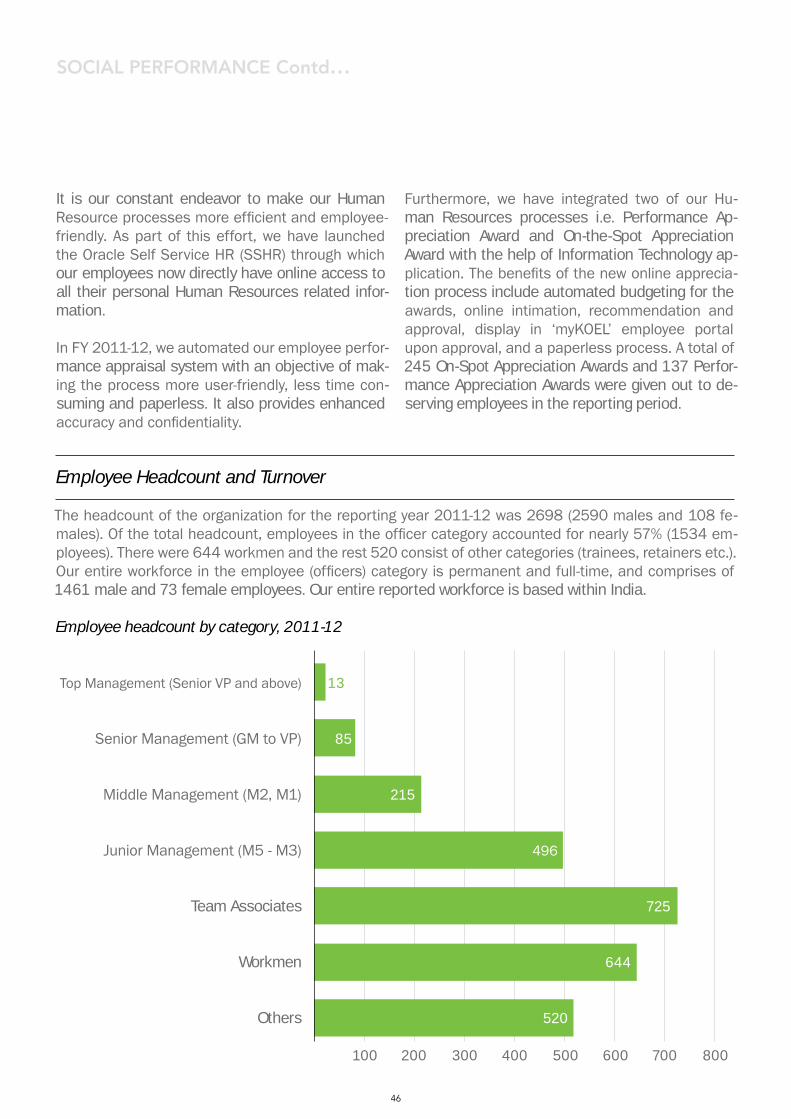
It is our constant endeavor to make our Human Resource processes more efficient and employee-friendly. As part of this effort, we have launched the Oracle Self Service HR (SSHR) through which our employees now directly have online access to all their personal Human Resources related infor-mation.
In FY 2011-12, we automated our employee perfor-mance appraisal system with an objective of mak-ing the process more user-friendly, less time con-suming and paperless. It also provides enhanced accuracy and confidentiality.
Furthermore, we have integrated two of our Hu-man Resources processes i.e. Performance Ap-preciation Award and On-the-Spot Appreciation Award with the help of Information Technology ap-plication. The benefits of the new online apprecia-tion process include automated budgeting for the awards, online intimation, recommendation and approval, display in ‘myKOEL’ employee portal upon approval, and a paperless process. A total of 245 On-Spot Appreciation Awards and 137 Perfor-mance Appreciation Awards were given out to de-serving employees in the reporting period.
Employee Headcount and Turnover
The headcount of the organization for the reporting year 2011-12 was 2698 (2590 males and 108 fe-males). Of the total headcount, employees in the officer category accounted for nearly 57% (1534 em-ployees). There were 644 workmen and the rest 520 consist of other categories (trainees, retainers etc.). Our entire workforce in the employee (officers) category is permanent and full-time, and comprises of 1461 male and 73 female employees. Our entire reported workforce is based within India.
Top Management (Senior VP and above)
Senior Management (GM to VP)
Middle Management (M2, M1)
Junior Management (M5 - M3)
Team Associates
Workmen
Others
800700600500400300200100
Employee headcount by category, 2011-12
85
13
215
496
725
644
520
SOCIAL PERFORMANCE Contd…
46
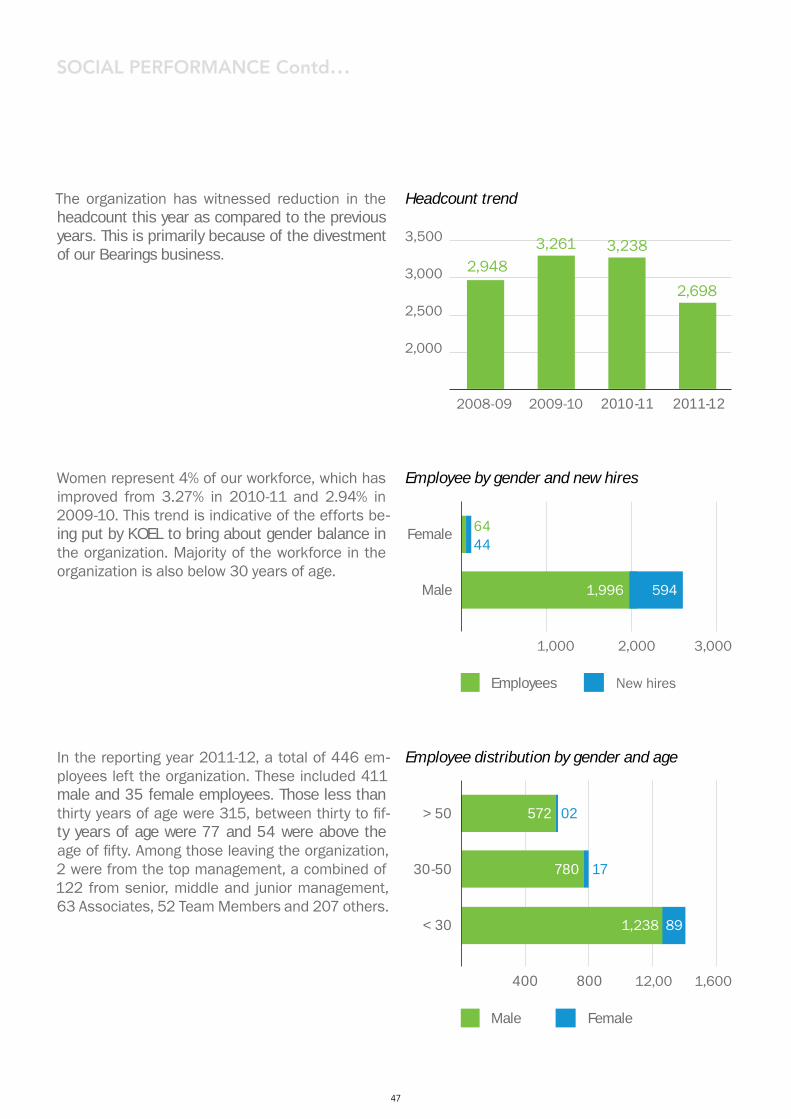
SOCIAL PERFORMANCE Contd…
The organization has witnessed reduction in the headcount this year as compared to the previous years. This is primarily because of the divestment of our Bearings business.
Women represent 4% of our workforce, which has improved from 3.27% in 2010-11 and 2.94% in 2009-10. This trend is indicative of the efforts be-ing put by KOEL to bring about gender balance in the organization. Majority of the workforce in the organization is also below 30 years of age.
In the reporting year 2011-12, a total of 446 em-ployees left the organization. These included 411 male and 35 female employees. Those less than thirty years of age were 315, between thirty to fif-ty years of age were 77 and 54 were above the age of fifty. Among those leaving the organization, 2 were from the top management, a combined of 122 from senior, middle and junior management, 63 Associates, 52 Team Members and 207 others.
2008-09 2009-10 2010-11 2011-12
3,000
3,500
2,500
2,000
Headcount trend
Employee by gender and new hires
Employee distribution by gender and age
Female
> 50
Male
30-50
< 30
3,000
1,600
2,000
12,00
1,000
800400
Employees
Male
New hires
Female
2,948
1,996
572
780
1,238
02
17
89
594
6444
3,261 3,238
2,698
47
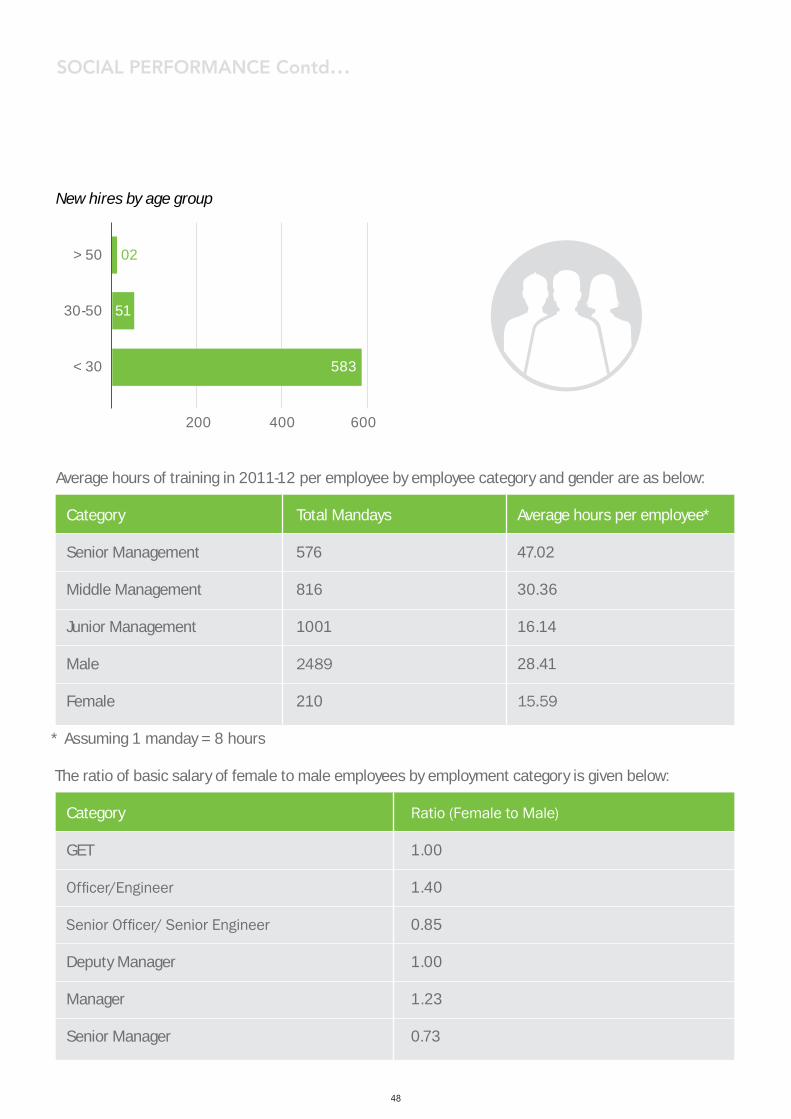
New hires by age group
> 50
30-50
< 30
600400200
Average hours of training in 2011-12 per employee by employee category and gender are as below:
* Assuming 1 manday = 8 hours
The ratio of basic salary of female to male employees by employment category is given below:
Category
Senior Management
Middle Management
Junior Management
Male
Female
Category
GET
Officer/Engineer
Senior Officer/ Senior Engineer
Deputy Manager
Manager
Senior Manager
Total Mandays
576
816
1001
2489
210
Average hours per employee*
47.02
30.36
16.14
28.41
15.59
Ratio (Female to Male)
1.00
1.40
0.85
1.00
1.23
0.73
02
51
583
SOCIAL PERFORMANCE Contd…
48
SOCIAL PERFORMANCE Contd…
Occupational Health & Safety
Health & Safety of our employees and communi-ties in our surroundings continue to be one of the most critical parameters of success of our busi-ness. Enhancing safety awareness amongst em-ployees continues to be an important under our safety training targets.
We adopted a new Environmental, Health and Safety (EHS) policy on 5th June 2012. In addition, a separate Occupational Health and Safety (OHS) Policy draft is currently prepared to align with the Factories Act require ments. The proposed OHS Policy will cover the scope, applicability, guiding principles, policy statement and mechanisms for implementing the policy effectively as well as roles,
responsibilities, authorities and accountabilities of all KOEL employees and external personnel such as suppliers, transporters, contractors and visitors on the KOEL factory premises.
Our internal EHS website underwent several upgra-dations in FY 2011-12. Some of the new features on this website are:• A web page on Sustainability - FAQs, GRI G3
guidelines, Sustainability Reports of KOEL 2009-10, 2010-11.
• Links for OHS government agencies e.g. DISH (Directorate of Industrial Safety & Health Maha-rashtra & Gujarat)
• Training Modules such as EHS Legislation Awareness Training, EHS Internal Auditor Train-ing Program etc.
KIRLOSKAR OIL ENGINES LIMITED
ENVIRONMENT, OCCUPATIONAL HEALTH & SAFETY (EHS) POLICY
We, at Kirloskar Oil Engines Limited (KOEL), are engaged in manufacturing of I.C. Engines, Gener-ating Sets and Pumpsets. We strongly believe that, it is duty of everyone working in KOEL to im-plement this policy in his area of activities.
We commit ourselves to:• Comply with all applicable EHS legislations and other requirements.• Prevent environmental pollution due to our activities, product and services.• Prevent injuries & ill health in our activities at workplace.• Continually improve our EHS management system performance.
We will Strive to:• Conserve resources such as power, water, fuels, oils, compressed air & wood.• Minimize use ad adverse impact of hazardous chemicals handled.• Minimize generation and adverse impact of hazardous waste.
We will communicate this policy to our employees & contractors and make it available to public & interested parties on request.
05 June 2012R R Deshpande
Executive Director & Occupier
49
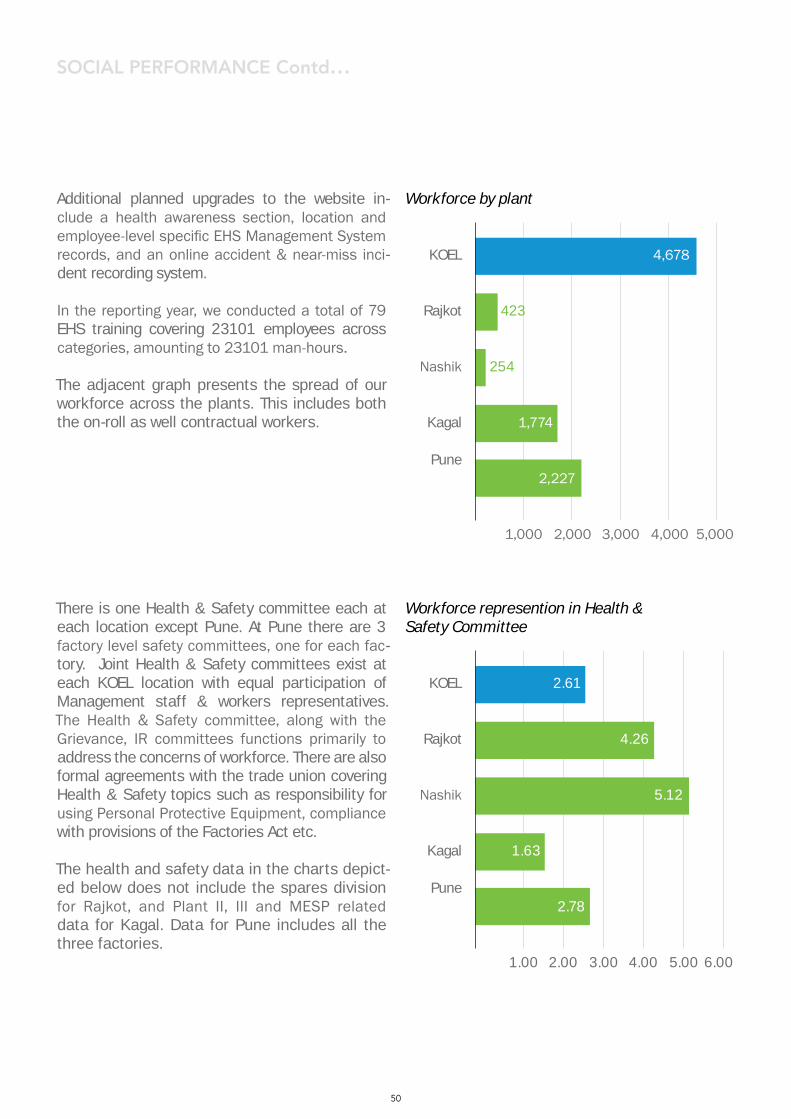
KOEL
Rajkot
Nashik
Kagal
Pune
KOEL
Rajkot
Nashik
Kagal
Pune
5,000
6.005.004.003.002.001.00
4,0003,0002,0001,000
Workforce by plant
Workforce represention in Health & Safety Committee
4,678
1,774
423
254
2,227
2.61
4.26
5.12
1.63
2.78
Additional planned upgrades to the website in-clude a health awareness section, location and employee-level specific EHS Management System records, and an online accident & near-miss inci-dent recording system.
In the reporting year, we conducted a total of 79 EHS training covering 23101 employees across categories, amounting to 23101 man-hours.
The adjacent graph presents the spread of our workforce across the plants. This includes both the on-roll as well contractual workers.
There is one Health & Safety committee each at each location except Pune. At Pune there are 3 factory level safety committees, one for each fac-tory. Joint Health & Safety committees exist at each KOEL location with equal participation of Management staff & workers representatives. The Health & Safety committee, along with the Grievance, IR committees functions primarily to address the concerns of workforce. There are also formal agreements with the trade union covering Health & Safety topics such as responsibility for using Personal Protective Equipment, compliance with provisions of the Factories Act etc.
The health and safety data in the charts depict-ed below does not include the spares division for Rajkot, and Plant II, III and MESP related data for Kagal. Data for Pune includes all the three factories.
SOCIAL PERFORMANCE Contd…
50
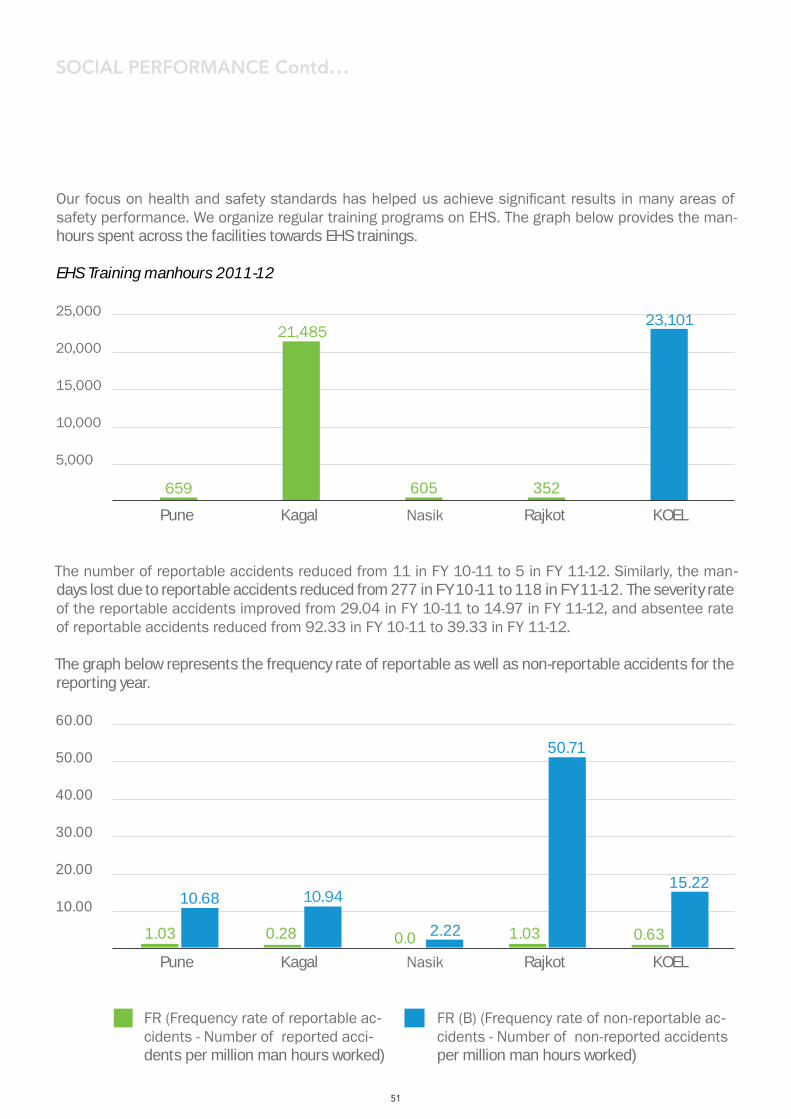
Our focus on health and safety standards has helped us achieve significant results in many areas of safety performance. We organize regular training programs on EHS. The graph below provides the man-hours spent across the facilities towards EHS trainings.
EHS Training manhours 2011-12
The number of reportable accidents reduced from 11 in FY 10-11 to 5 in FY 11-12. Similarly, the man-days lost due to reportable accidents reduced from 277 in FY 10-11 to 118 in FY 11-12. The severity rate of the reportable accidents improved from 29.04 in FY 10-11 to 14.97 in FY 11-12, and absentee rate of reportable accidents reduced from 92.33 in FY 10-11 to 39.33 in FY 11-12.
The graph below represents the frequency rate of reportable as well as non-reportable accidents for the reporting year.
SOCIAL PERFORMANCE Contd…
Pune
Pune
15,000
30.00
20,000
40.00
25,000
50.00
60.00
10,000
20.00
5,000
10.00
Kagal
Kagal
Nasik
Nasik
Rajkot
Rajkot
KOEL
KOEL
FR (Frequency rate of reportable ac-cidents - Number of reported acci-dents per million man hours worked)
FR (B) (Frequency rate of non-reportable ac-cidents - Number of non-reported accidents per million man hours worked)
659
1.03
10.68 10.9415.22
2.22
50.71
0.28 0.0 1.03 0.63
605 352
21,48523,101
51
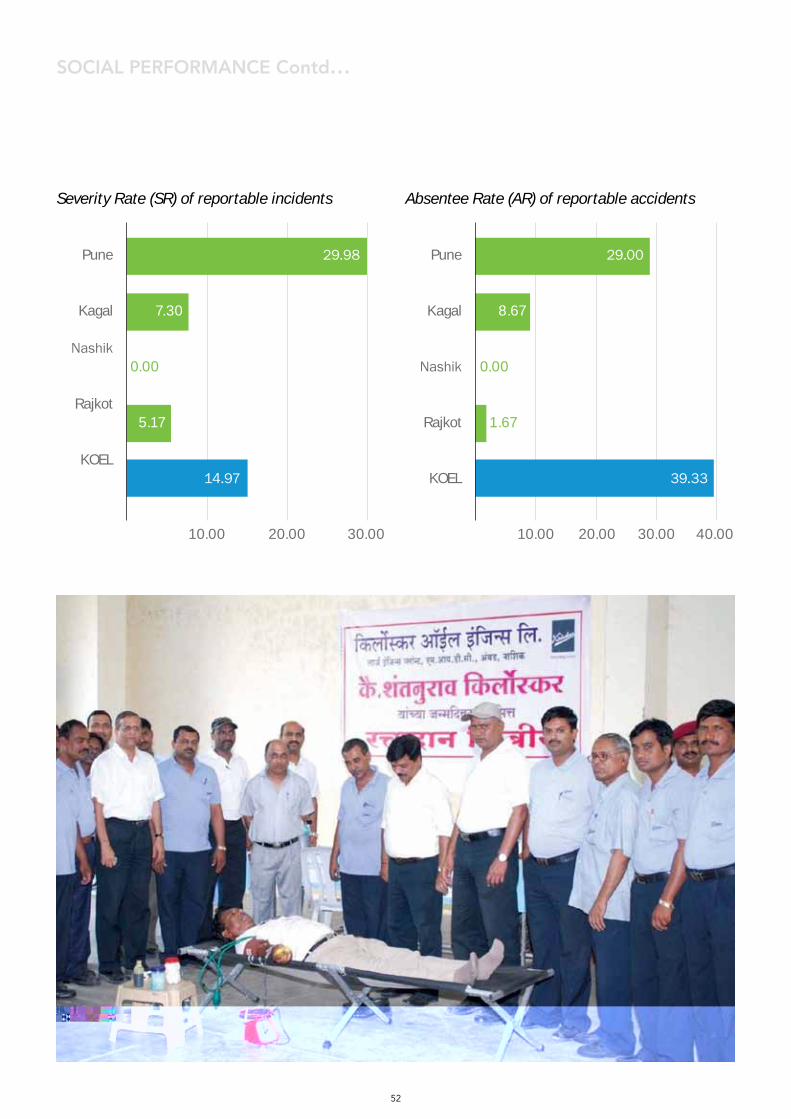
Pune
Kagal
Nashik
Rajkot
KOEL
Pune
Kagal
Nashik
Rajkot
KOEL
40.0030.00 30.0020.0020.00 10.0010.00
Absentee Rate (AR) of reportable accidentsSeverity Rate (SR) of reportable incidents
29.98 29.00
7.30 8.67
14.97 39.33
5.17
0.00 0.00
1.67
SOCIAL PERFORMANCE Contd…
52

53
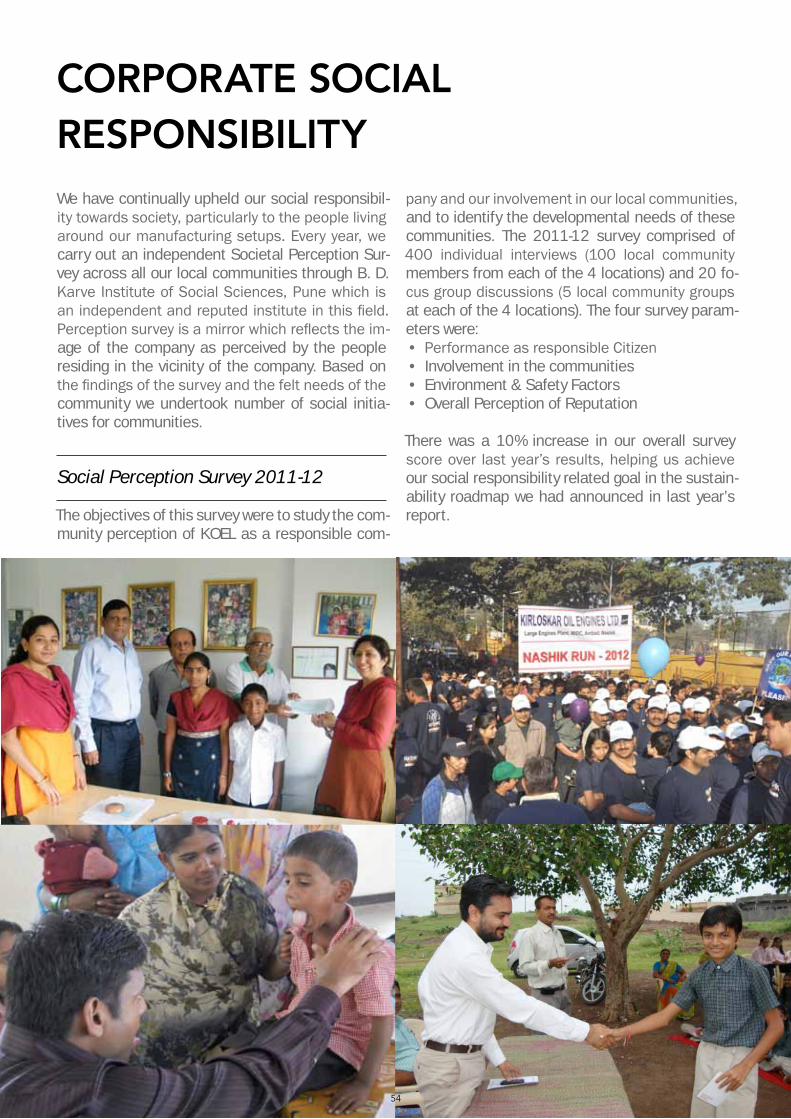
CORPORATE SOCIAL RESPONSIBILITYWe have continually upheld our social responsibil-ity towards society, particularly to the people living around our manufacturing setups. Every year, we carry out an independent Societal Perception Sur-vey across all our local communities through B. D. Karve Institute of Social Sciences, Pune which is an independent and reputed institute in this field. Perception survey is a mirror which reflects the im-age of the company as perceived by the people residing in the vicinity of the company. Based on the findings of the survey and the felt needs of the community we undertook number of social initia-tives for communities.
Social Perception Survey 2011-12
The objectives of this survey were to study the com-munity perception of KOEL as a responsible com-
pany and our involvement in our local communities, and to identify the developmental needs of these communities. The 2011-12 survey comprised of 400 individual interviews (100 local community members from each of the 4 locations) and 20 fo-cus group discussions (5 local community groups at each of the 4 locations). The four survey param-eters were:• Performance as responsible Citizen • Involvement in the communities • Environment & Safety Factors • Overall Perception of Reputation
There was a 10% increase in our overall survey score over last year’s results, helping us achieve our social responsibility related goal in the sustain-ability roadmap we had announced in last year’s report.
54
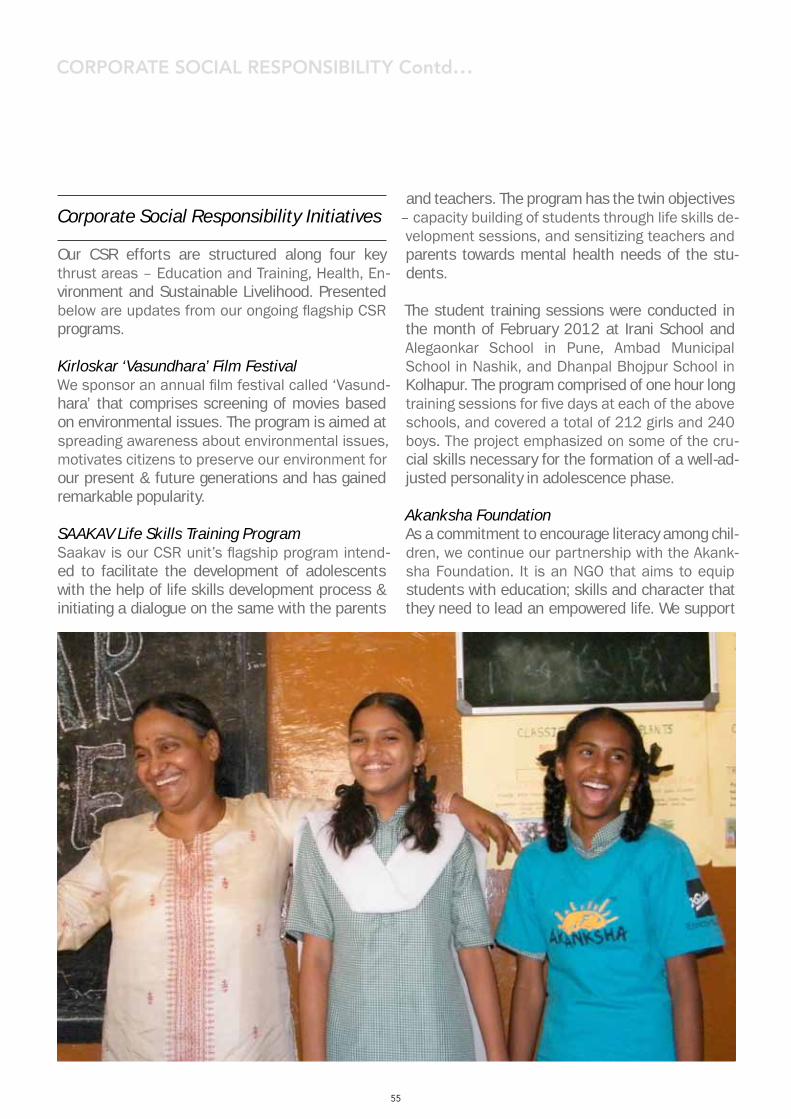
CORPORATE SOCIAL RESPONSIBILITY Contd…
Corporate Social Responsibility Initiatives
Our CSR efforts are structured along four key thrust areas – Education and Training, Health, En-vironment and Sustainable Livelihood. Presented below are updates from our ongoing flagship CSR programs.
Kirloskar ‘Vasundhara’ Film FestivalWe sponsor an annual film festival called ‘Vasund-hara’ that comprises screening of movies based on environmental issues. The program is aimed at spreading awareness about environmental issues, motivates citizens to preserve our environment for our present & future generations and has gained remarkable popularity.
SAAKAV Life Skills Training ProgramSaakav is our CSR unit’s flagship program intend-ed to facilitate the development of adolescents with the help of life skills development process & initiating a dialogue on the same with the parents
and teachers. The program has the twin objectives – capacity building of students through life skills de-velopment sessions, and sensitizing teachers and parents towards mental health needs of the stu-dents.
The student training sessions were conducted in the month of February 2012 at Irani School and Alegaonkar School in Pune, Ambad Municipal School in Nashik, and Dhanpal Bhojpur School in Kolhapur. The program comprised of one hour long training sessions for five days at each of the above schools, and covered a total of 212 girls and 240 boys. The project emphasized on some of the cru-cial skills necessary for the formation of a well-ad-justed personality in adolescence phase.
Akanksha FoundationAs a commitment to encourage literacy among chil-dren, we continue our partnership with the Akank-sha Foundation. It is an NGO that aims to equip students with education; skills and character that they need to lead an empowered life. We support
55
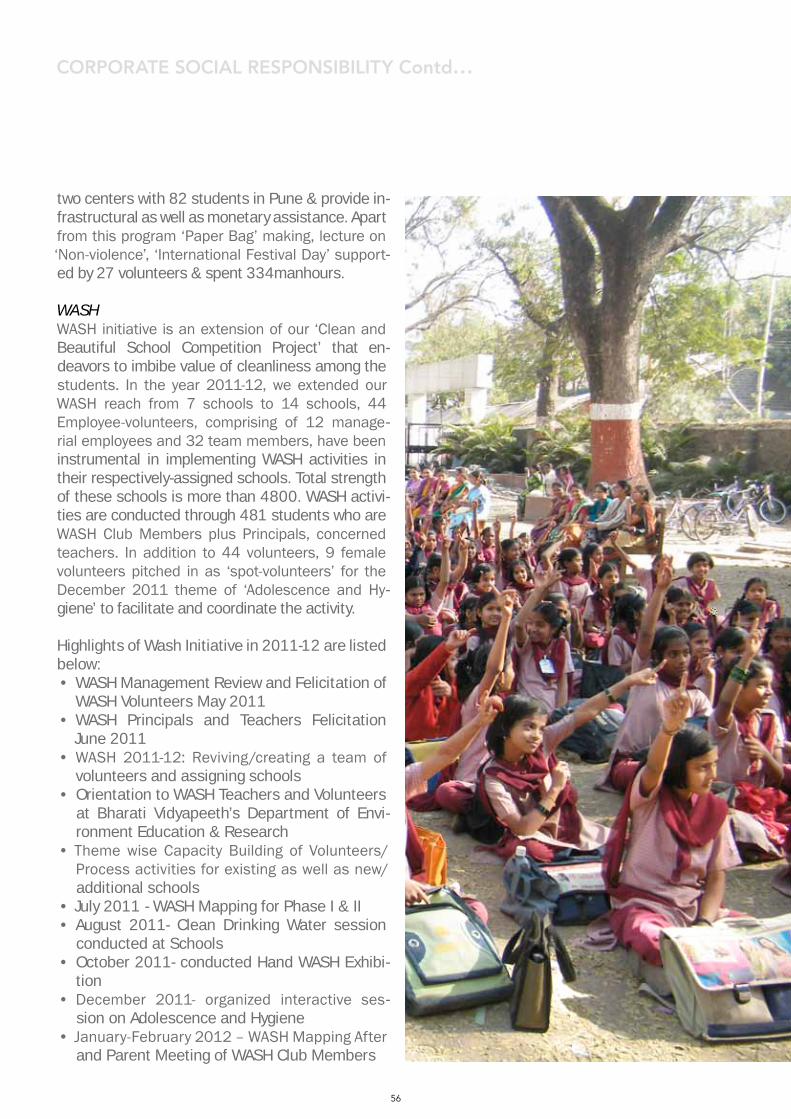
two centers with 82 students in Pune & provide in-frastructural as well as monetary assistance. Apart from this program ‘Paper Bag’ making, lecture on ‘Non-violence’, ‘International Festival Day’ support-ed by 27 volunteers & spent 334manhours.
WASHWASH initiative is an extension of our ‘Clean and Beautiful School Competition Project’ that en-deavors to imbibe value of cleanliness among the students. In the year 2011-12, we extended our WASH reach from 7 schools to 14 schools, 44 Employee-volunteers, comprising of 12 manage-rial employees and 32 team members, have been instrumental in implementing WASH activities in their respectively-assigned schools. Total strength of these schools is more than 4800. WASH activi-ties are conducted through 481 students who are WASH Club Members plus Principals, concerned teachers. In addition to 44 volunteers, 9 female volunteers pitched in as ‘spot-volunteers’ for the December 2011 theme of ‘Adolescence and Hy-giene’ to facilitate and coordinate the activity.
Highlights of Wash Initiative in 2011-12 are listed below: • WASH Management Review and Felicitation of
WASH Volunteers May 2011 • WASH Principals and Teachers Felicitation
June 2011 • WASH 2011-12: Reviving/creating a team of
volunteers and assigning schools • Orientation to WASH Teachers and Volunteers
at Bharati Vidyapeeth’s Department of Envi-ronment Education & Research
• Theme wise Capacity Building of Volunteers/ Process activities for existing as well as new/additional schools
• July 2011 - WASH Mapping for Phase I & II • August 2011- Clean Drinking Water session
conducted at Schools • October 2011- conducted Hand WASH Exhibi-
tion • December 2011- organized interactive ses-
sion on Adolescence and Hygiene • January-February 2012 – WASH Mapping After
and Parent Meeting of WASH Club Members
CORPORATE SOCIAL RESPONSIBILITY Contd…
56
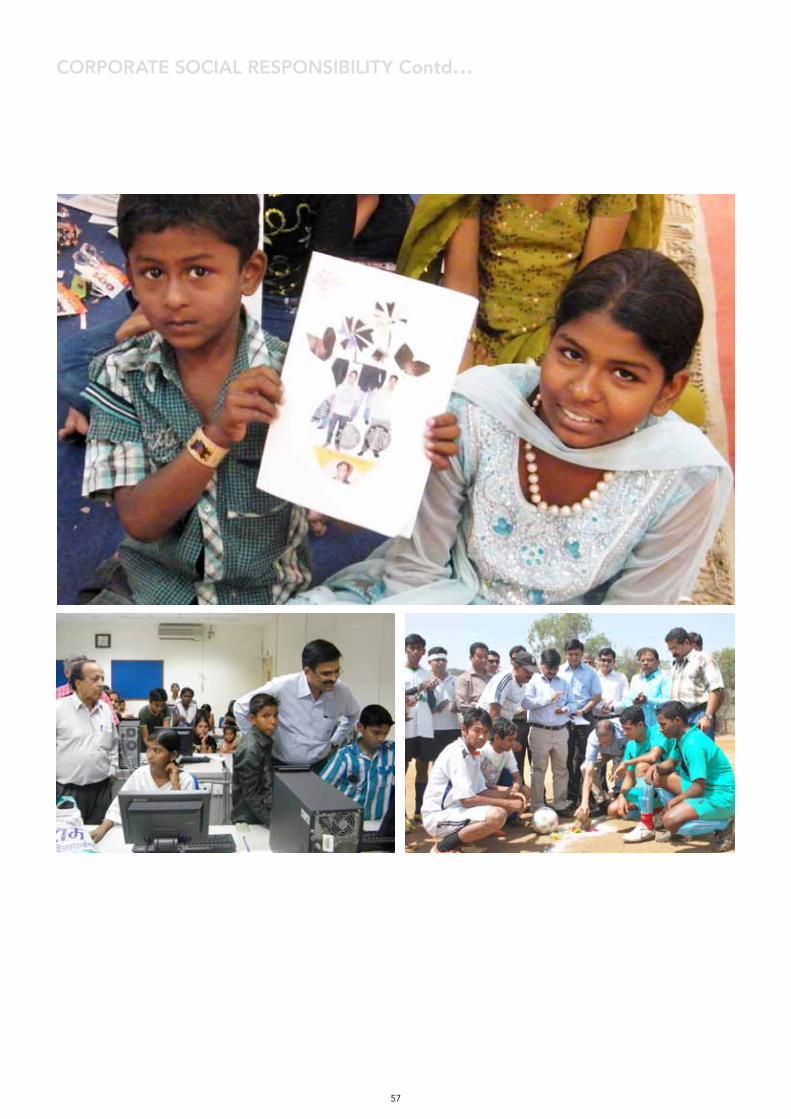
CORPORATE SOCIAL RESPONSIBILITY Contd…
57
INDEPENDENT ASSURANCE STATEMENT
The Management and Board of DirectorsKirloskar Oil Engines Ltd.Pune, India.
Our engagementErnst & Young Pvt. Ltd. (“EY”) was retained by Kirloskar Oil Engines Limited (“Company”) to provide an independent assurance to its third Corporate Sustainability Report themed ‘The Engine for Sustainable Growth’ for the financial year 2011-12 (the “Report”).
The Company’s management is responsible for the contents of the Report, identification of key issues, engagement with stakeholders and its presentation. EY’s responsibility is to provide independent assur-ance on the report content as described in the scope of assurance.
Our responsibility in performing our assurance activities is to the management of the Company only, and in accordance with the terms of reference agreed with the Company. We do not therefore accept or as-sume any responsibility for any other purpose or to any other person or organization. Any dependence that any such third party may place on the Report is entirely at its own risk. The assurance report should not be taken as a basis for interpreting the Company’s overall performance, except for the aspects men-tioned in the scope below.
Scope of assurance The scope of assurance covers the following aspects of the Report:• Data and information related to the Company’s sustainability performance for the period 1 April 2011
to 31 March 2012;• Review of information on sample GRI G3.1 (2011) core indicators covering the Company’s Corporate
Office at Pune and the following three sites of operations: » Khadki, Pune, Maharashtra (engines manufacturing) » Nashik, Maharashtra (large engines) » Kagal, Kolhapur, Maharashtra (engines manufacturing)
• The Company’s internal policies, protocols and processes related to collection and collation of sus-tainability performance data.
ExclusionsThe assurance scope excludes:• Operations of the Company other than those mentioned in the Scope;• Aspects of the Report other than those mentioned above;• Data and information outside the defined reporting period (1 April 2011 to 31 March 2012);• The Company’s statements that describe expression of opinion, belief, aspiration, expectation, aim or
future intention;• ‘Economic performance indicators’ included in the Report
Level of assurance and criteria usedThe assurance engagement was planned and performed in accordance with International Federation of Accountants’ International Standard for Assurance Engagements Other than Audits or Reviews of His-torical Financial Information (ISAE 3000). Our evidence-gathering procedures were designed to obtain
Ernst & Young Private Limited22, Camac Street
3rd Floor, Block ‘C’Kolkata - 700016
West Bengal, IndiaTel: +91 33 66153400
58
a ‘limited’ level of assurance (as set out in ISAE 3000) on reporting principles, as well as sustainability performance indicators as per GRI G3.1 (2011) guidelines.
Key stepsThe performance of our engagement involved the following key steps:• Interviews at the Company’s plants with Site Heads, Function Heads and key personnel to under-
stand the sustainability vision, mechanism for management of key sustainability issues and engage-ment with key stakeholders;
• Visits to three manufacturing plants as mentioned in the ‘Scope of assurance’ above;• Review of relevant documents and systems for gathering, analyzing and aggregating sustainability
performance data in the reporting period;• Gathering selected evidences supporting claims made in the Report regarding the Company’s sus-
tainability performance; • Review of selected qualitative statements and sample case studies in various sections of the Report.
Observations and opportunities for improvementOur key observations are as follows:• The Company has demonstrated its continued commitment to sustainability by presenting balanced
updates on each of the goals and targets undertaken on the Sustainability Roadmap;• The Company has mapped those issues that have been perceived as priority by the Management; un-
dertaking of a structured and comprehensive external stakeholder engagement for materiality analy-sis was not evidenced;
• The Company may consider undertaking periodic internal reviews of GRI Key Performance Indicators (KPIs) across its sites in order to maintain data control and reporting accuracy;
• The Occupational Health & Safety statistics at all sites were found to be well maintained. It was evi-denced that the near miss incidents have also been reported;
• The Company continues to demonstrate its social commitment by engaging its local communities via community needs assessments, community perception surveys and need-based interventions;
Our conclusionOn the basis of our review scope and methodology, nothing has come to our attention that would cause us not to believe that the Report presents the Company’s triple-bottom-line performance, in material re-spect, in line with the GRI G3.1 reporting principles and criteria.
Our assurance teamOur assurance team, comprising of multidisciplinary professionals, has been drawn from our Climate Change and Sustainability Services, and undertakes similar engagements with various Indian and inter-national companies. As an assurance provider, EY is required to comply with the independence require-ments set out in International Federation of Accountants (IFAC) Code of Ethics for Professional Account-ants. EY’s independence policies and procedures ensure compliance with the Code.
For Ernst & Young Private Limited
Sudipta Das Partner
17 December 2012Kolkata
59
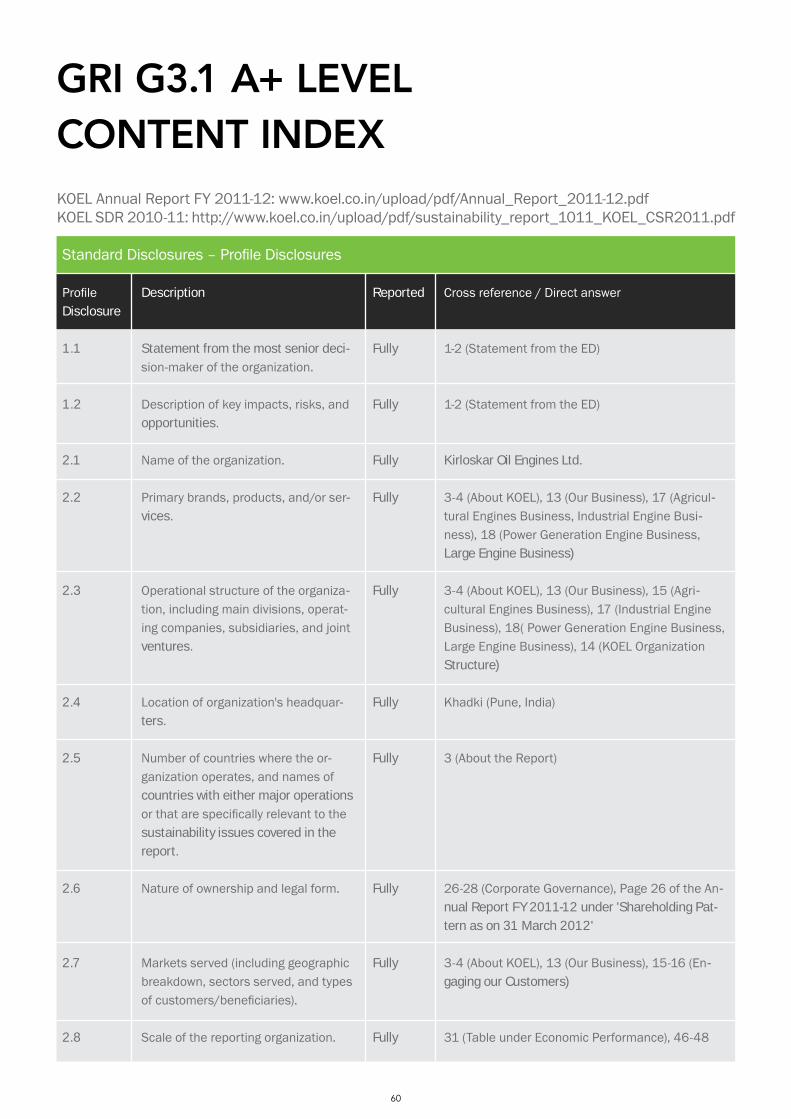
GRI G3.1 A+ LEVEL CONTENT INDEXKOEL Annual Report FY 2011-12: www.koel.co.in/upload/pdf/Annual_Report_2011-12.pdfKOEL SDR 2010-11: http://www.koel.co.in/upload/pdf/sustainability_report_1011_KOEL_CSR2011.pdf
Profile Disclosure
1.1
1.2
2.1
2.2
2.3
2.4
2.5
2.6
2.7
2.8
Description
Statement from the most senior deci-sion-maker of the organization. Description of key impacts, risks, and opportunities.
Name of the organization.
Primary brands, products, and/or ser-vices.
Operational structure of the organiza-tion, including main divisions, operat-ing companies, subsidiaries, and joint ventures.
Location of organization's headquar-ters.
Number of countries where the or-ganization operates, and names of countries with either major operations or that are specifically relevant to the sustainability issues covered in the report.
Nature of ownership and legal form.
Markets served (including geographic breakdown, sectors served, and types of customers/beneficiaries).
Scale of the reporting organization.
Reported
Fully
Fully
Fully
Fully
Fully
Fully
Fully
Fully
Fully
Fully
Cross reference / Direct answer
1-2 (Statement from the ED)
1-2 (Statement from the ED)
Kirloskar Oil Engines Ltd.
3-4 (About KOEL), 13 (Our Business), 17 (Agricul-tural Engines Business, Industrial Engine Busi-ness), 18 (Power Generation Engine Business, Large Engine Business)
3-4 (About KOEL), 13 (Our Business), 15 (Agri-cultural Engines Business), 17 (Industrial Engine Business), 18( Power Generation Engine Business, Large Engine Business), 14 (KOEL Organization Structure)
Khadki (Pune, India)
3 (About the Report)
26-28 (Corporate Governance), Page 26 of the An-nual Report FY 2011-12 under 'Shareholding Pat-tern as on 31 March 2012'
3-4 (About KOEL), 13 (Our Business), 15-16 (En-gaging our Customers)
31 (Table under Economic Performance), 46-48
Standard Disclosures – Profile Disclosures
60
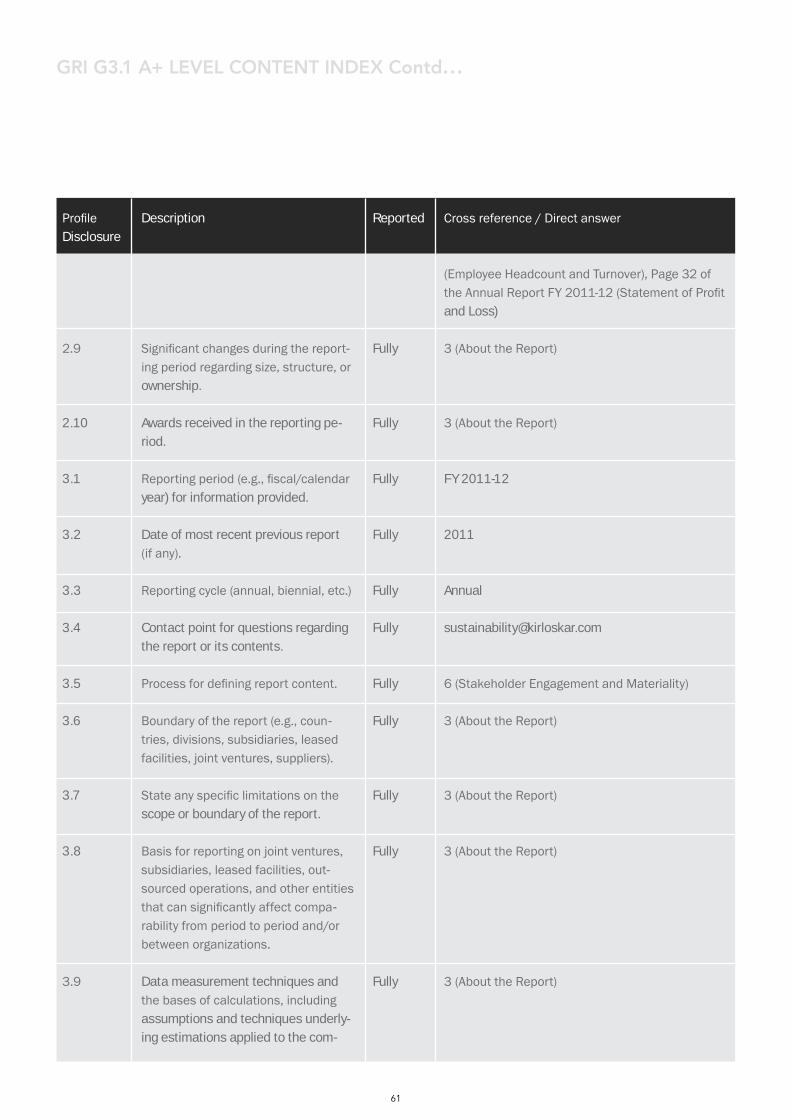
2.9
2.10
3.1
3.2
3.3
3.4
3.5
3.6
3.7
3.8
3.9
Significant changes during the report-ing period regarding size, structure, or ownership.
Awards received in the reporting pe-riod.
Reporting period (e.g., fiscal/calendar year) for information provided.
Date of most recent previous report (if any).
Reporting cycle (annual, biennial, etc.)
Contact point for questions regarding the report or its contents.
Process for defining report content.
Boundary of the report (e.g., coun-tries, divisions, subsidiaries, leased facilities, joint ventures, suppliers).
State any specific limitations on the scope or boundary of the report.
Basis for reporting on joint ventures, subsidiaries, leased facilities, out-sourced operations, and other entities that can significantly affect compa-rability from period to period and/or between organizations.
Data measurement techniques and the bases of calculations, including assumptions and techniques underly-ing estimations applied to the com-
Fully
Fully
Fully
Fully
Fully
Fully
Fully
Fully
Fully
Fully
Fully
(Employee Headcount and Turnover), Page 32 of the Annual Report FY 2011-12 (Statement of Profit and Loss)
3 (About the Report)
3 (About the Report)
FY 2011-12
2011
Annual
6 (Stakeholder Engagement and Materiality)
3 (About the Report)
3 (About the Report)
3 (About the Report)
3 (About the Report)
GRI G3.1 A+ LEVEL CONTENT INDEX Contd…
Profile Disclosure
Description Reported Cross reference / Direct answer
61
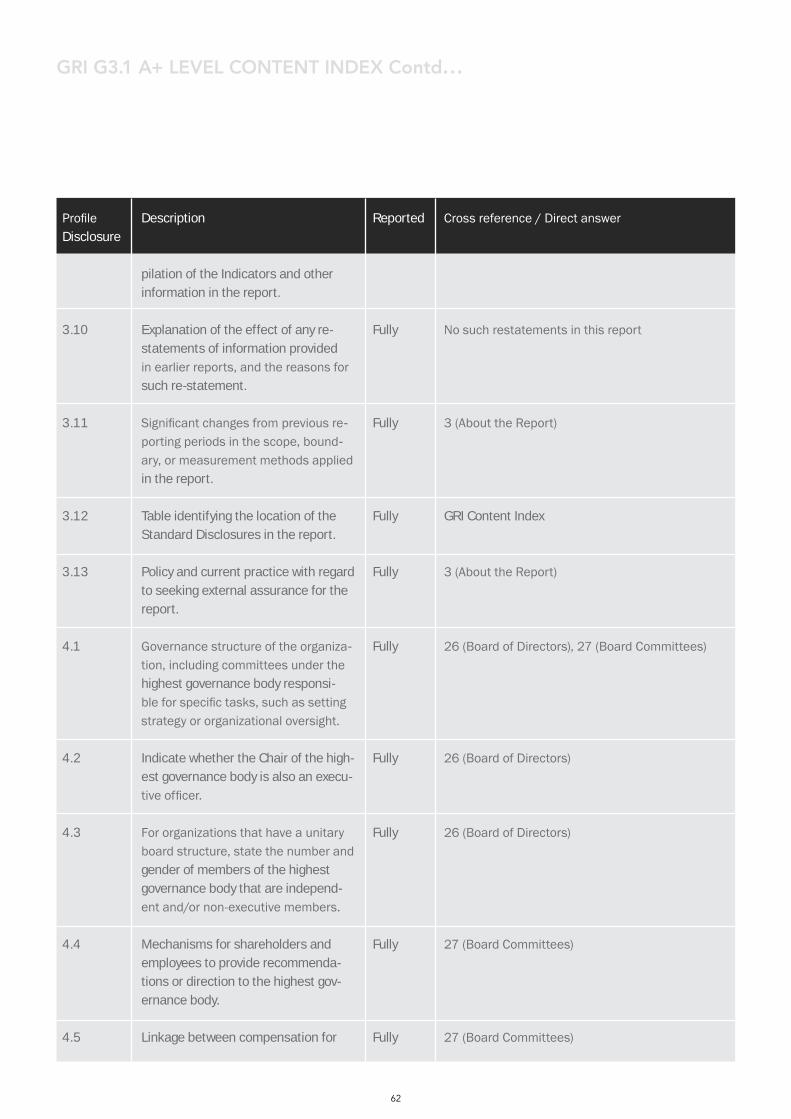
3.10
3.11
3.12
3.13
4.1
4.2
4.3
4.4
4.5
pilation of the Indicators and other information in the report.
Explanation of the effect of any re-statements of information provided in earlier reports, and the reasons for such re-statement.
Significant changes from previous re-porting periods in the scope, bound-ary, or measurement methods applied in the report.
Table identifying the location of the Standard Disclosures in the report.
Policy and current practice with regard to seeking external assurance for the report.
Governance structure of the organiza-tion, including committees under the highest governance body responsi-ble for specific tasks, such as setting strategy or organizational oversight.
Indicate whether the Chair of the high-est governance body is also an execu-tive officer.
For organizations that have a unitary board structure, state the number and gender of members of the highest governance body that are independ-ent and/or non-executive members.
Mechanisms for shareholders and employees to provide recommenda-tions or direction to the highest gov-ernance body.
Linkage between compensation for
Fully
Fully
Fully
Fully
Fully
Fully
Fully
Fully
Fully
No such restatements in this report
3 (About the Report)
GRI Content Index
3 (About the Report)
26 (Board of Directors), 27 (Board Committees)
26 (Board of Directors)
26 (Board of Directors)
27 (Board Committees)
27 (Board Committees)
GRI G3.1 A+ LEVEL CONTENT INDEX Contd…
Profile Disclosure
Description Reported Cross reference / Direct answer
62
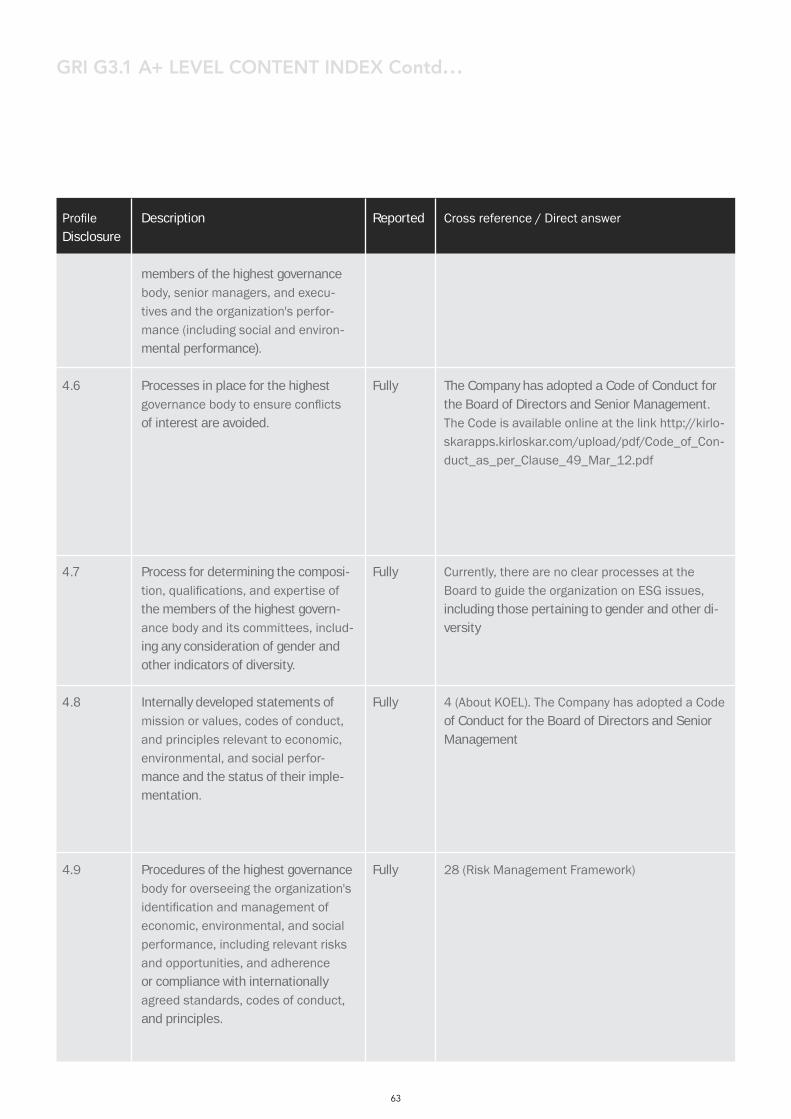
4.6
4.7
4.8
4.9
members of the highest governance body, senior managers, and execu-tives and the organization's perfor-mance (including social and environ-mental performance).
Processes in place for the highest governance body to ensure conflicts of interest are avoided.
Process for determining the composi-tion, qualifications, and expertise of the members of the highest govern-ance body and its committees, includ-ing any consideration of gender and other indicators of diversity.
Internally developed statements of mission or values, codes of conduct, and principles relevant to economic, environmental, and social perfor-mance and the status of their imple-mentation.
Procedures of the highest governance body for overseeing the organization's identification and management of economic, environmental, and social performance, including relevant risks and opportunities, and adherence or compliance with internationally agreed standards, codes of conduct, and principles.
Fully
Fully
Fully
Fully
The Company has adopted a Code of Conduct for the Board of Directors and Senior Management. The Code is available online at the link http://kirlo-skarapps.kirloskar.com/upload/pdf/Code_of_Con-duct_as_per_Clause_49_Mar_12.pdf
Currently, there are no clear processes at the Board to guide the organization on ESG issues, including those pertaining to gender and other di-versity
4 (About KOEL). The Company has adopted a Code of Conduct for the Board of Directors and Senior Management
28 (Risk Management Framework)
GRI G3.1 A+ LEVEL CONTENT INDEX Contd…
Profile Disclosure
Description Reported Cross reference / Direct answer
63
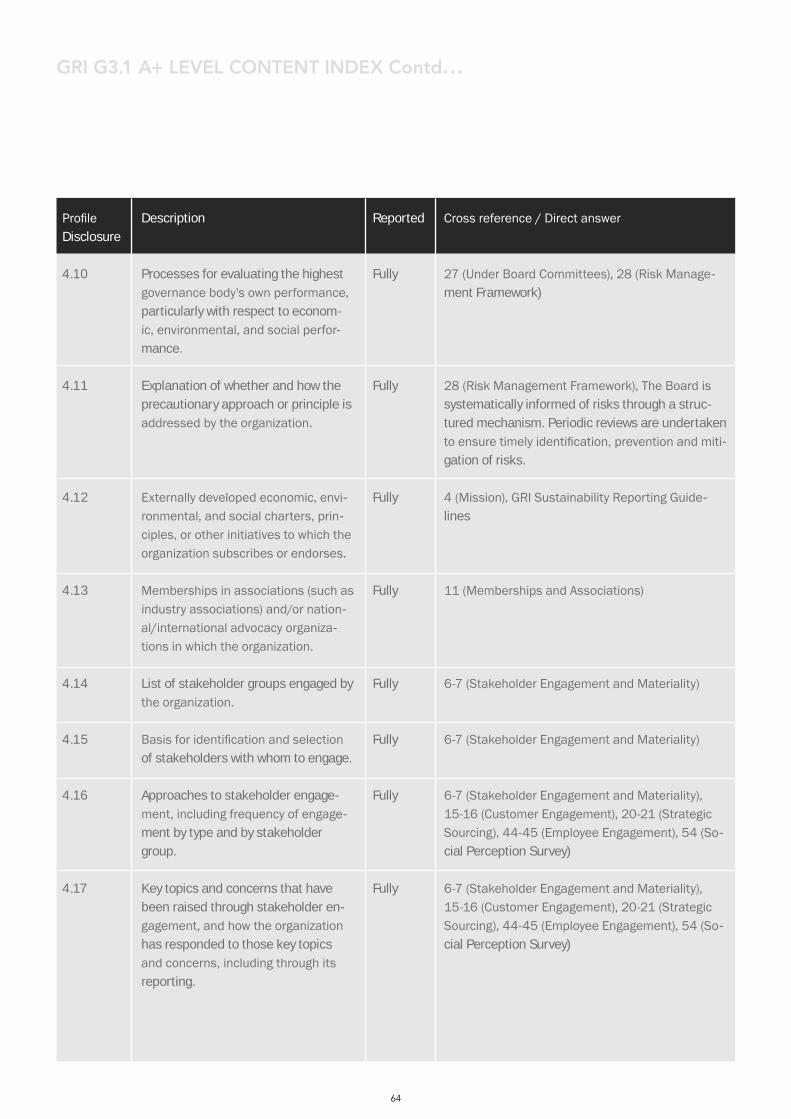
4.10
4.11
4.12
4.13
4.14
4.15
4.16
4.17
Processes for evaluating the highest governance body's own performance, particularly with respect to econom-ic, environmental, and social perfor-mance.
Explanation of whether and how the precautionary approach or principle is addressed by the organization.
Externally developed economic, envi-ronmental, and social charters, prin-ciples, or other initiatives to which the organization subscribes or endorses.
Memberships in associations (such as industry associations) and/or nation-al/international advocacy organiza-tions in which the organization.
List of stakeholder groups engaged by the organization.
Basis for identification and selection of stakeholders with whom to engage.
Approaches to stakeholder engage-ment, including frequency of engage-ment by type and by stakeholder group.
Key topics and concerns that have been raised through stakeholder en-gagement, and how the organization has responded to those key topics and concerns, including through its reporting.
Fully
Fully
Fully
Fully
Fully
Fully
Fully
Fully
27 (Under Board Committees), 28 (Risk Manage-ment Framework)
28 (Risk Management Framework), The Board is systematically informed of risks through a struc-tured mechanism. Periodic reviews are undertaken to ensure timely identification, prevention and miti-gation of risks.
4 (Mission), GRI Sustainability Reporting Guide-lines
11 (Memberships and Associations)
6-7 (Stakeholder Engagement and Materiality)
6-7 (Stakeholder Engagement and Materiality)
6-7 (Stakeholder Engagement and Materiality), 15-16 (Customer Engagement), 20-21 (Strategic Sourcing), 44-45 (Employee Engagement), 54 (So-cial Perception Survey)
6-7 (Stakeholder Engagement and Materiality), 15-16 (Customer Engagement), 20-21 (Strategic Sourcing), 44-45 (Employee Engagement), 54 (So-cial Perception Survey)
GRI G3.1 A+ LEVEL CONTENT INDEX Contd…
Profile Disclosure
Description Reported Cross reference / Direct answer
64
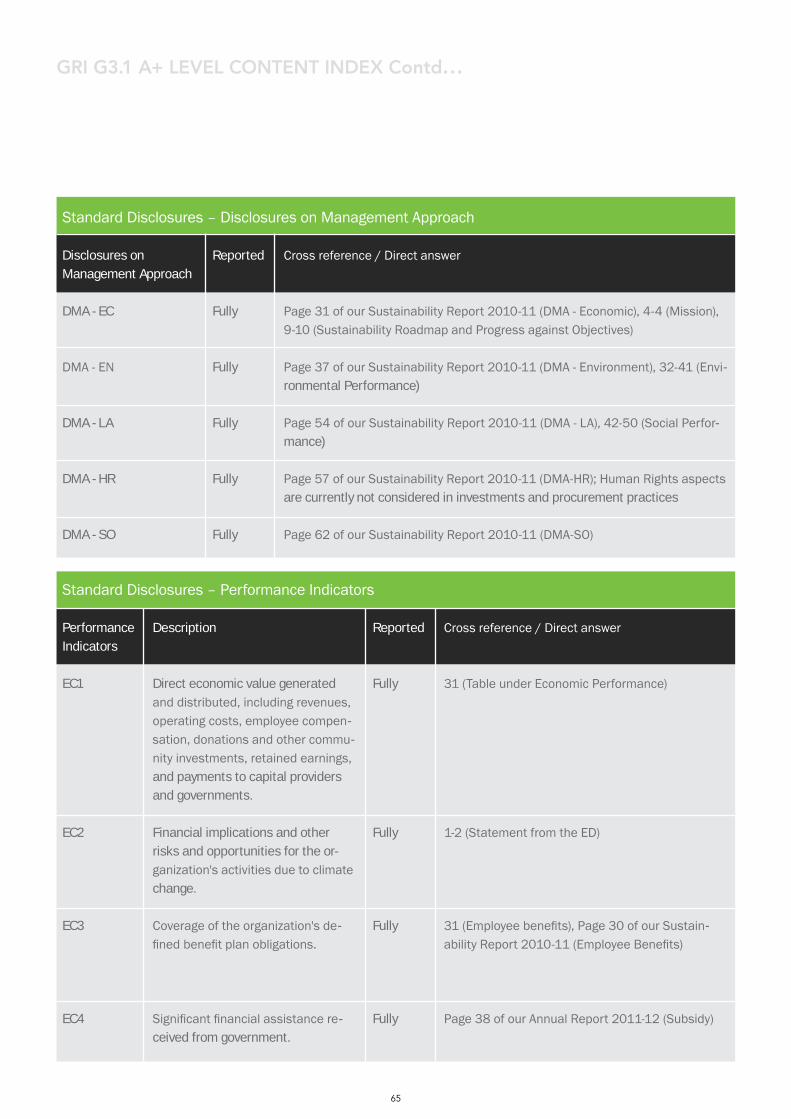
DMA - EC
DMA - EN
DMA - LA
DMA - HR
DMA - SO
Fully
Fully
Fully
Fully
Fully
Page 31 of our Sustainability Report 2010-11 (DMA - Economic), 4-4 (Mission), 9-10 (Sustainability Roadmap and Progress against Objectives)
Page 37 of our Sustainability Report 2010-11 (DMA - Environment), 32-41 (Envi-ronmental Performance)
Page 54 of our Sustainability Report 2010-11 (DMA - LA), 42-50 (Social Perfor-mance)
Page 57 of our Sustainability Report 2010-11 (DMA-HR); Human Rights aspects are currently not considered in investments and procurement practices
Page 62 of our Sustainability Report 2010-11 (DMA-SO)
GRI G3.1 A+ LEVEL CONTENT INDEX Contd…
Disclosures on Management Approach
Reported Cross reference / Direct answer
Standard Disclosures – Disclosures on Management Approach
Performance Indicators
EC1
EC2
EC3
EC4
Description
Direct economic value generated and distributed, including revenues, operating costs, employee compen-sation, donations and other commu-nity investments, retained earnings, and payments to capital providers and governments.
Financial implications and other risks and opportunities for the or-ganization's activities due to climate change.
Coverage of the organization's de-fined benefit plan obligations.
Significant financial assistance re-ceived from government.
Reported
Fully
Fully
Fully
Fully
Cross reference / Direct answer
31 (Table under Economic Performance)
1-2 (Statement from the ED)
31 (Employee benefits), Page 30 of our Sustain-ability Report 2010-11 (Employee Benefits)
Page 38 of our Annual Report 2011-12 (Subsidy)
Standard Disclosures – Performance Indicators
65
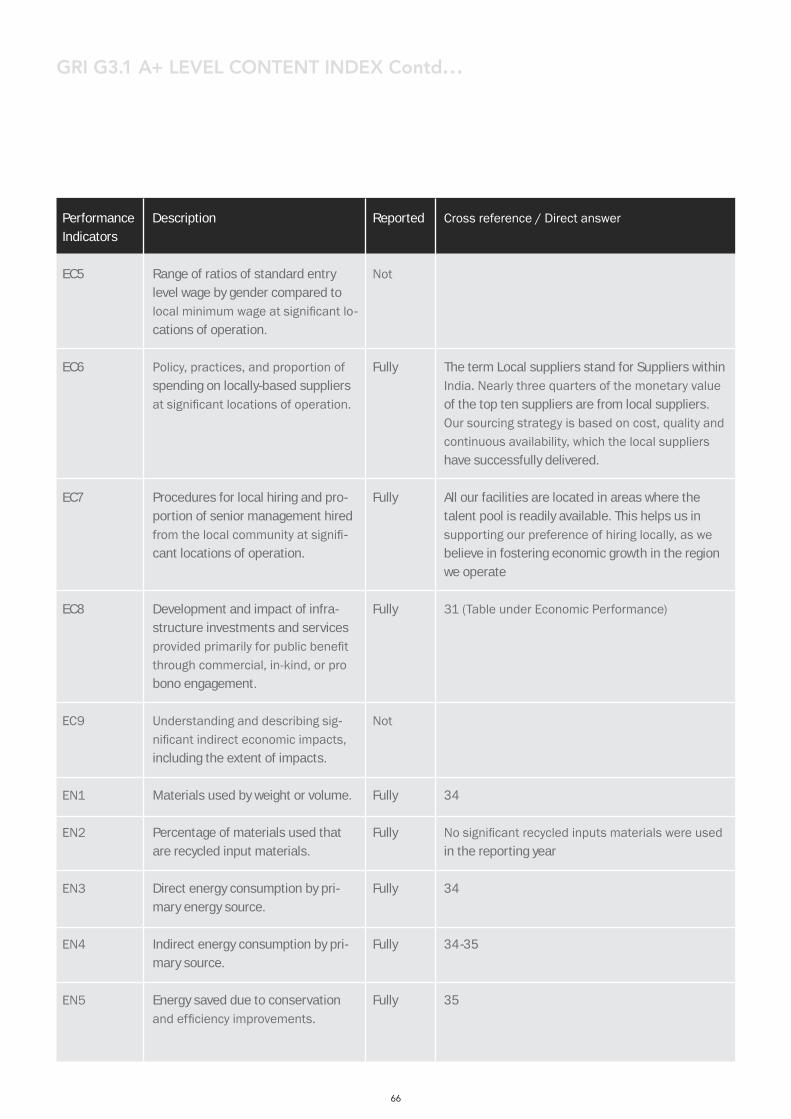
EC5
EC6
EC7
EC8
EC9
EN1
EN2
EN3
EN4
EN5
Range of ratios of standard entry level wage by gender compared to local minimum wage at significant lo-cations of operation.
Policy, practices, and proportion of spending on locally-based suppliers at significant locations of operation.
Procedures for local hiring and pro-portion of senior management hired from the local community at signifi-cant locations of operation.
Development and impact of infra-structure investments and services provided primarily for public benefit through commercial, in-kind, or pro bono engagement.
Understanding and describing sig-nificant indirect economic impacts, including the extent of impacts.
Materials used by weight or volume.
Percentage of materials used that are recycled input materials.
Direct energy consumption by pri-mary energy source.
Indirect energy consumption by pri-mary source.
Energy saved due to conservation and efficiency improvements.
Not
Fully
Fully
Fully
Not
Fully
Fully
Fully
Fully
Fully
The term Local suppliers stand for Suppliers within India. Nearly three quarters of the monetary value of the top ten suppliers are from local suppliers. Our sourcing strategy is based on cost, quality and continuous availability, which the local suppliers have successfully delivered.
All our facilities are located in areas where the talent pool is readily available. This helps us in supporting our preference of hiring locally, as we believe in fostering economic growth in the region we operate
31 (Table under Economic Performance)
34
No significant recycled inputs materials were used in the reporting year
34
34-35
35
GRI G3.1 A+ LEVEL CONTENT INDEX Contd…
Performance Indicators
Description Reported Cross reference / Direct answer
66
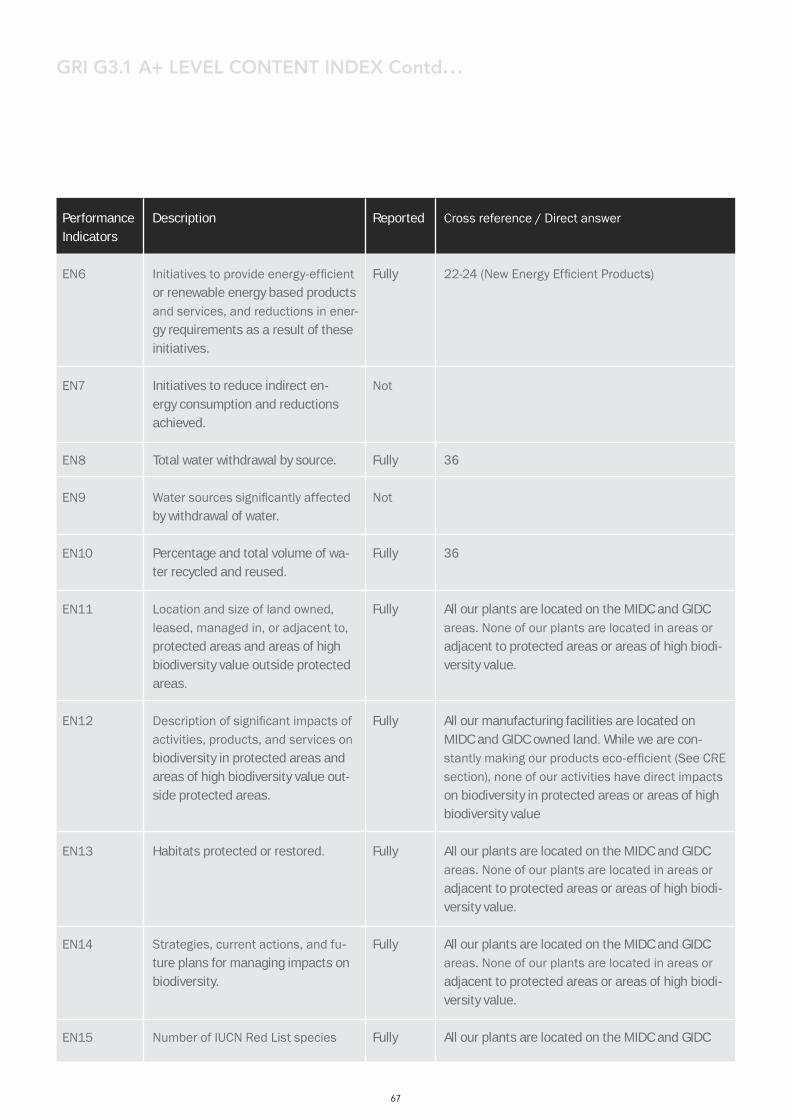
EN6
EN7
EN8
EN9
EN10
EN11
EN12
EN13
EN14
EN15
Initiatives to provide energy-efficient or renewable energy based products and services, and reductions in ener-gy requirements as a result of these initiatives.
Initiatives to reduce indirect en-ergy consumption and reductions achieved.
Total water withdrawal by source.
Water sources significantly affected by withdrawal of water.
Percentage and total volume of wa-ter recycled and reused.
Location and size of land owned, leased, managed in, or adjacent to, protected areas and areas of high biodiversity value outside protected areas.
Description of significant impacts of activities, products, and services on biodiversity in protected areas and areas of high biodiversity value out-side protected areas.
Habitats protected or restored.
Strategies, current actions, and fu-ture plans for managing impacts on biodiversity.
Number of IUCN Red List species
Fully
Not
Fully
Not
Fully
Fully
Fully
Fully
Fully
Fully
22-24 (New Energy Efficient Products)
36
36
All our plants are located on the MIDC and GIDC areas. None of our plants are located in areas or adjacent to protected areas or areas of high biodi-versity value.
All our manufacturing facilities are located on MIDC and GIDC owned land. While we are con-stantly making our products eco-efficient (See CRE section), none of our activities have direct impacts on biodiversity in protected areas or areas of high biodiversity value
All our plants are located on the MIDC and GIDC areas. None of our plants are located in areas or adjacent to protected areas or areas of high biodi-versity value.
All our plants are located on the MIDC and GIDC areas. None of our plants are located in areas or adjacent to protected areas or areas of high biodi-versity value.
All our plants are located on the MIDC and GIDC
GRI G3.1 A+ LEVEL CONTENT INDEX Contd…
Performance Indicators
Description Reported Cross reference / Direct answer
67
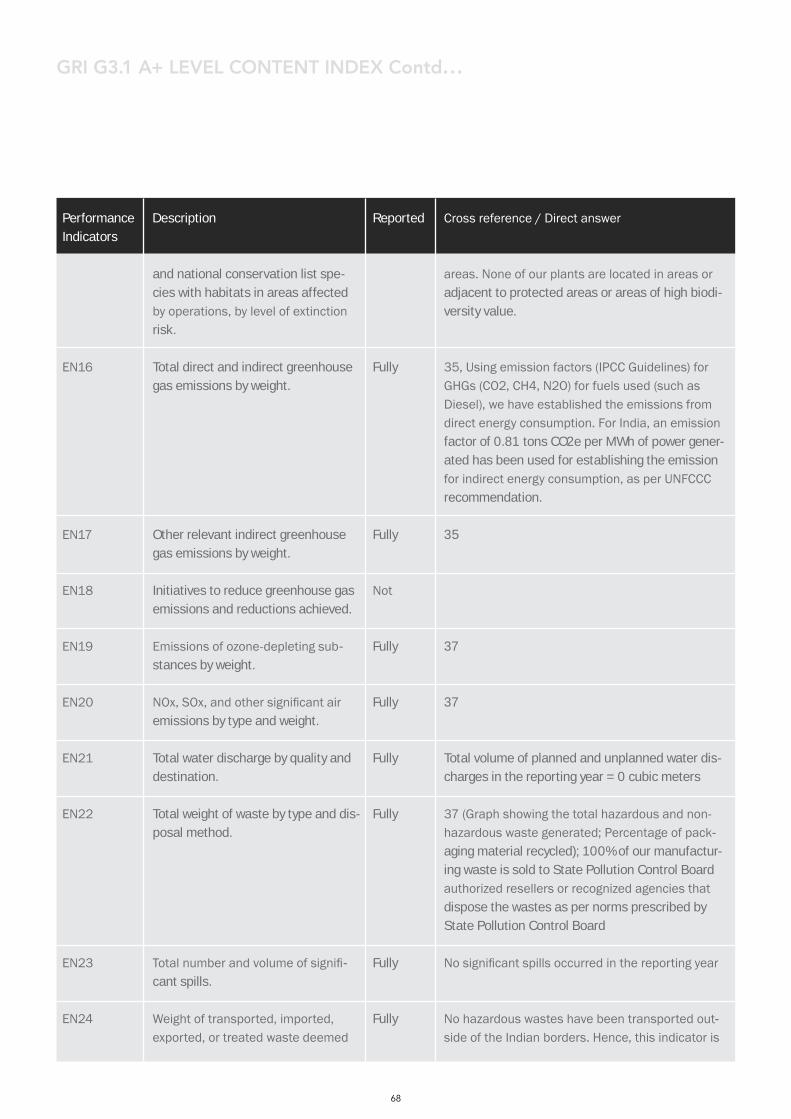
EN16
EN17
EN18
EN19
EN20
EN21
EN22
EN23
EN24
and national conservation list spe-cies with habitats in areas affected by operations, by level of extinction risk.
Total direct and indirect greenhouse gas emissions by weight.
Other relevant indirect greenhouse gas emissions by weight.
Initiatives to reduce greenhouse gas emissions and reductions achieved.
Emissions of ozone-depleting sub-stances by weight.
NOx, SOx, and other significant air emissions by type and weight.
Total water discharge by quality and destination.
Total weight of waste by type and dis-posal method.
Total number and volume of signifi-cant spills.
Weight of transported, imported, exported, or treated waste deemed
Fully
Fully
Not
Fully
Fully
Fully
Fully
Fully
Fully
areas. None of our plants are located in areas or adjacent to protected areas or areas of high biodi-versity value.
35, Using emission factors (IPCC Guidelines) for GHGs (CO2, CH4, N2O) for fuels used (such as Diesel), we have established the emissions from direct energy consumption. For India, an emission factor of 0.81 tons CO2e per MWh of power gener-ated has been used for establishing the emission for indirect energy consumption, as per UNFCCC recommendation.
35
37
37
Total volume of planned and unplanned water dis-charges in the reporting year = 0 cubic meters
37 (Graph showing the total hazardous and non-hazardous waste generated; Percentage of pack-aging material recycled); 100% of our manufactur-ing waste is sold to State Pollution Control Board authorized resellers or recognized agencies that dispose the wastes as per norms prescribed by State Pollution Control Board
No significant spills occurred in the reporting year
No hazardous wastes have been transported out-side of the Indian borders. Hence, this indicator is
GRI G3.1 A+ LEVEL CONTENT INDEX Contd…
Performance Indicators
Description Reported Cross reference / Direct answer
68
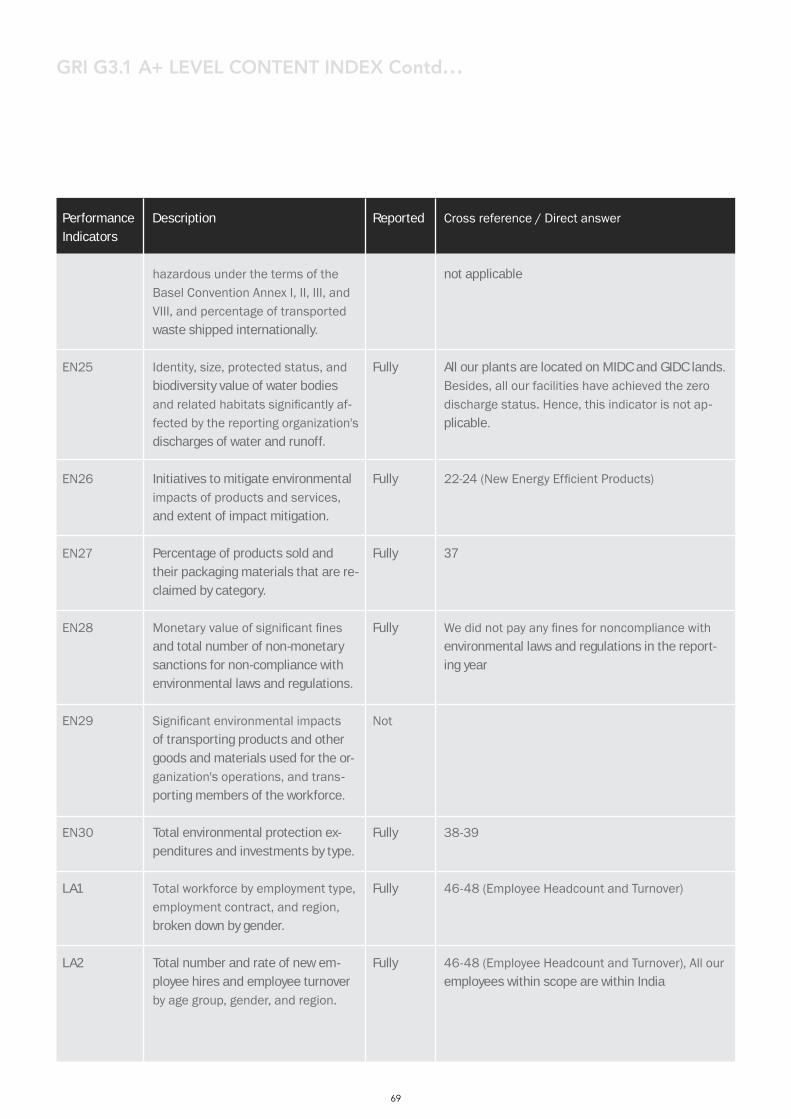
EN25
EN26
EN27
EN28
EN29
EN30
LA1
LA2
hazardous under the terms of the Basel Convention Annex I, II, III, and VIII, and percentage of transported waste shipped internationally.
Identity, size, protected status, and biodiversity value of water bodies and related habitats significantly af-fected by the reporting organization's discharges of water and runoff.
Initiatives to mitigate environmental impacts of products and services, and extent of impact mitigation.
Percentage of products sold and their packaging materials that are re-claimed by category.
Monetary value of significant fines and total number of non-monetary sanctions for non-compliance with environmental laws and regulations.
Significant environmental impacts of transporting products and other goods and materials used for the or-ganization's operations, and trans-porting members of the workforce.
Total environmental protection ex-penditures and investments by type.
Total workforce by employment type, employment contract, and region, broken down by gender.
Total number and rate of new em-ployee hires and employee turnover by age group, gender, and region.
Fully
Fully
Fully
Fully
Not
Fully
Fully
Fully
not applicable
All our plants are located on MIDC and GIDC lands. Besides, all our facilities have achieved the zero discharge status. Hence, this indicator is not ap-plicable.
22-24 (New Energy Efficient Products)
37
We did not pay any fines for noncompliance with environmental laws and regulations in the report-ing year
38-39
46-48 (Employee Headcount and Turnover)
46-48 (Employee Headcount and Turnover), All our employees within scope are within India
GRI G3.1 A+ LEVEL CONTENT INDEX Contd…
Performance Indicators
Description Reported Cross reference / Direct answer
69
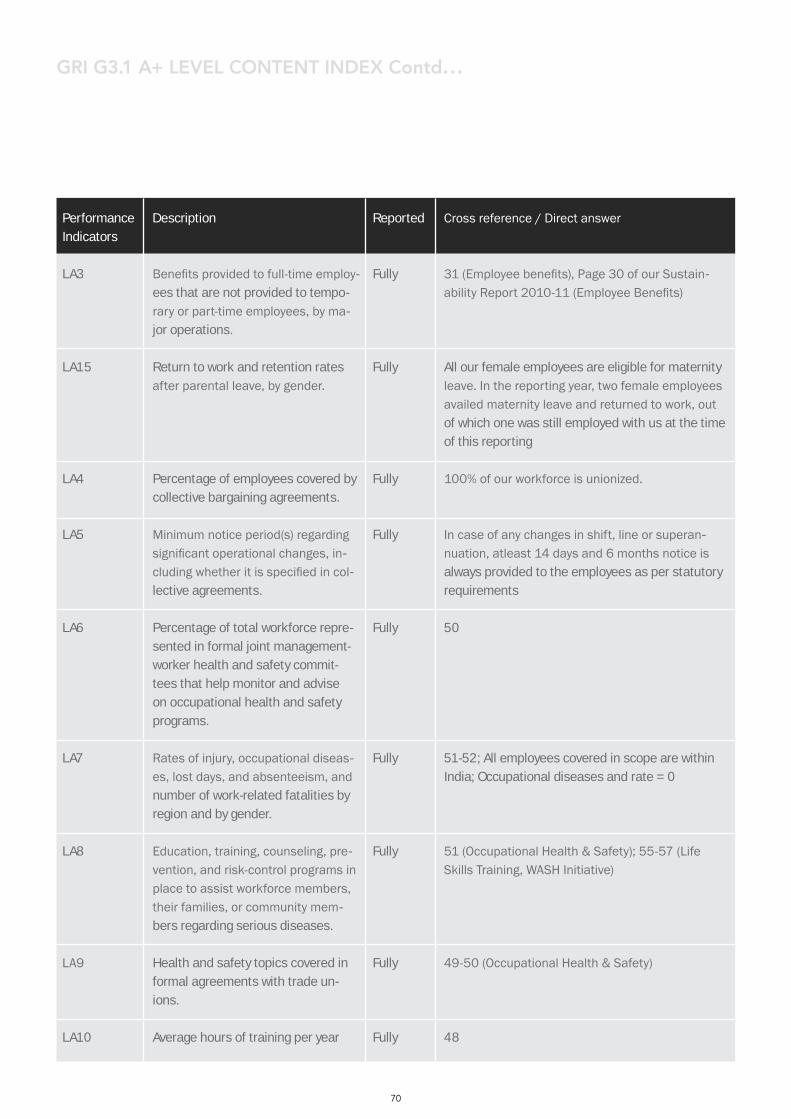
LA3
LA15
LA4
LA5
LA6
LA7
LA8
LA9
LA10
Benefits provided to full-time employ-ees that are not provided to tempo-rary or part-time employees, by ma-jor operations.
Return to work and retention rates after parental leave, by gender.
Percentage of employees covered by collective bargaining agreements.
Minimum notice period(s) regarding significant operational changes, in-cluding whether it is specified in col-lective agreements.
Percentage of total workforce repre-sented in formal joint management-worker health and safety commit-tees that help monitor and advise on occupational health and safety programs.
Rates of injury, occupational diseas-es, lost days, and absenteeism, and number of work-related fatalities by region and by gender.
Education, training, counseling, pre-vention, and risk-control programs in place to assist workforce members, their families, or community mem-bers regarding serious diseases.
Health and safety topics covered in formal agreements with trade un-ions.
Average hours of training per year
Fully
Fully
Fully
Fully
Fully
Fully
Fully
Fully
Fully
31 (Employee benefits), Page 30 of our Sustain-ability Report 2010-11 (Employee Benefits)
All our female employees are eligible for maternity leave. In the reporting year, two female employees availed maternity leave and returned to work, out of which one was still employed with us at the time of this reporting
100% of our workforce is unionized.
In case of any changes in shift, line or superan-nuation, atleast 14 days and 6 months notice is always provided to the employees as per statutory requirements
50
51-52; All employees covered in scope are within India; Occupational diseases and rate = 0
51 (Occupational Health & Safety); 55-57 (Life Skills Training, WASH Initiative)
49-50 (Occupational Health & Safety)
48
GRI G3.1 A+ LEVEL CONTENT INDEX Contd…
Performance Indicators
Description Reported Cross reference / Direct answer
70
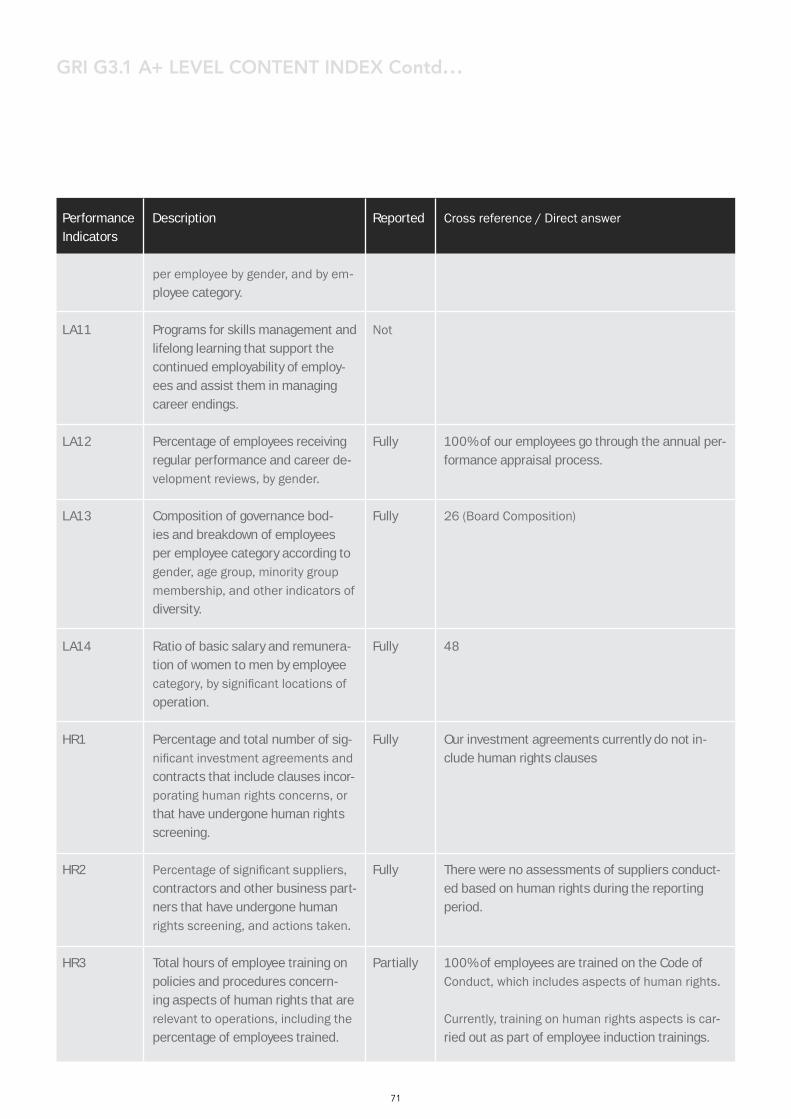
LA11
LA12
LA13
LA14
HR1
HR2
HR3
per employee by gender, and by em-ployee category.
Programs for skills management and lifelong learning that support the continued employability of employ-ees and assist them in managing career endings.
Percentage of employees receiving regular performance and career de-velopment reviews, by gender.
Composition of governance bod-ies and breakdown of employees per employee category according to gender, age group, minority group membership, and other indicators of diversity.
Ratio of basic salary and remunera-tion of women to men by employee category, by significant locations of operation.
Percentage and total number of sig-nificant investment agreements and contracts that include clauses incor-porating human rights concerns, or that have undergone human rights screening.
Percentage of significant suppliers, contractors and other business part-ners that have undergone human rights screening, and actions taken.
Total hours of employee training on policies and procedures concern-ing aspects of human rights that are relevant to operations, including the percentage of employees trained.
Not
Fully
Fully
Fully
Fully
Fully
Partially
100% of our employees go through the annual per-formance appraisal process.
26 (Board Composition)
48
Our investment agreements currently do not in-clude human rights clauses
There were no assessments of suppliers conduct-ed based on human rights during the reporting period.
100% of employees are trained on the Code of Conduct, which includes aspects of human rights.
Currently, training on human rights aspects is car-ried out as part of employee induction trainings.
GRI G3.1 A+ LEVEL CONTENT INDEX Contd…
Performance Indicators
Description Reported Cross reference / Direct answer
71
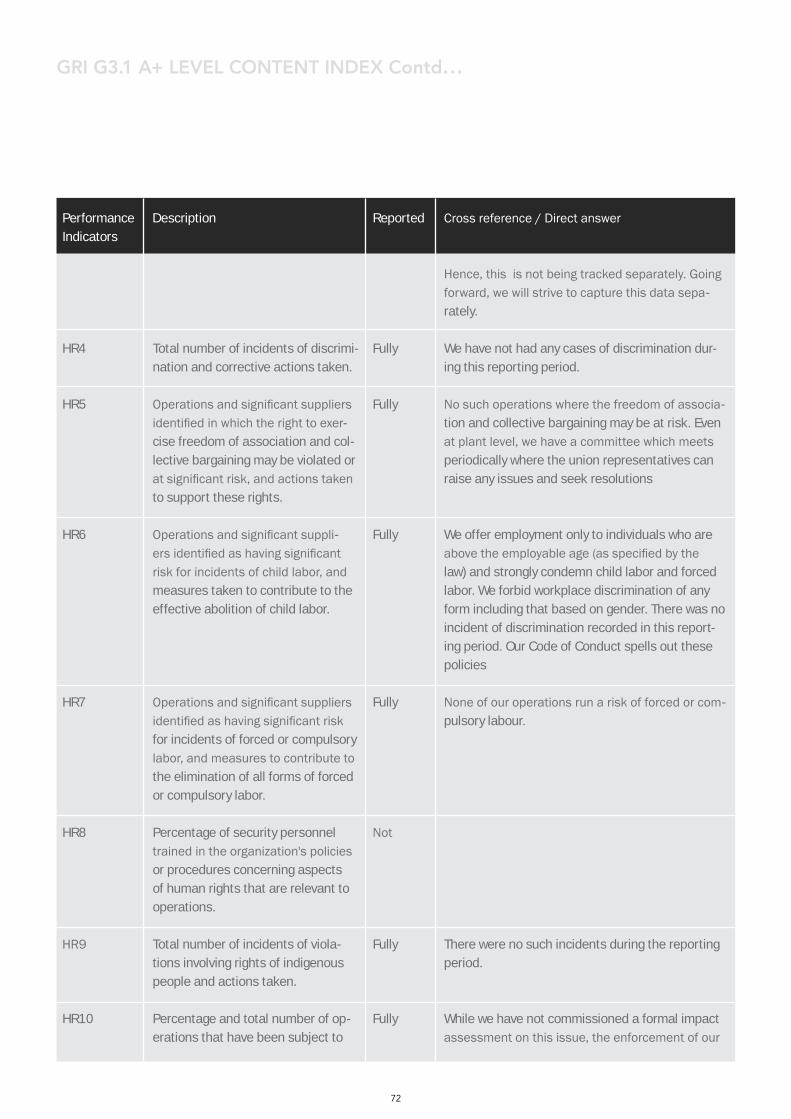
HR4
HR5
HR6
HR7
HR8
HR9
HR10
Total number of incidents of discrimi-nation and corrective actions taken.
Operations and significant suppliers identified in which the right to exer-cise freedom of association and col-lective bargaining may be violated or at significant risk, and actions taken to support these rights.
Operations and significant suppli-ers identified as having significant risk for incidents of child labor, and measures taken to contribute to the effective abolition of child labor.
Operations and significant suppliers identified as having significant risk for incidents of forced or compulsory labor, and measures to contribute to the elimination of all forms of forced or compulsory labor.
Percentage of security personnel trained in the organization's policies or procedures concerning aspects of human rights that are relevant to operations.
Total number of incidents of viola-tions involving rights of indigenous people and actions taken.
Percentage and total number of op-erations that have been subject to
Fully
Fully
Fully
Fully
Not
Fully
Fully
Hence, this is not being tracked separately. Going forward, we will strive to capture this data sepa-rately.
We have not had any cases of discrimination dur-ing this reporting period.
No such operations where the freedom of associa-tion and collective bargaining may be at risk. Even at plant level, we have a committee which meets periodically where the union representatives can raise any issues and seek resolutions
We offer employment only to individuals who are above the employable age (as specified by the law) and strongly condemn child labor and forced labor. We forbid workplace discrimination of any form including that based on gender. There was no incident of discrimination recorded in this report-ing period. Our Code of Conduct spells out these policies
None of our operations run a risk of forced or com-pulsory labour.
There were no such incidents during the reporting period.
While we have not commissioned a formal impact assessment on this issue, the enforcement of our
GRI G3.1 A+ LEVEL CONTENT INDEX Contd…
Performance Indicators
Description Reported Cross reference / Direct answer
72
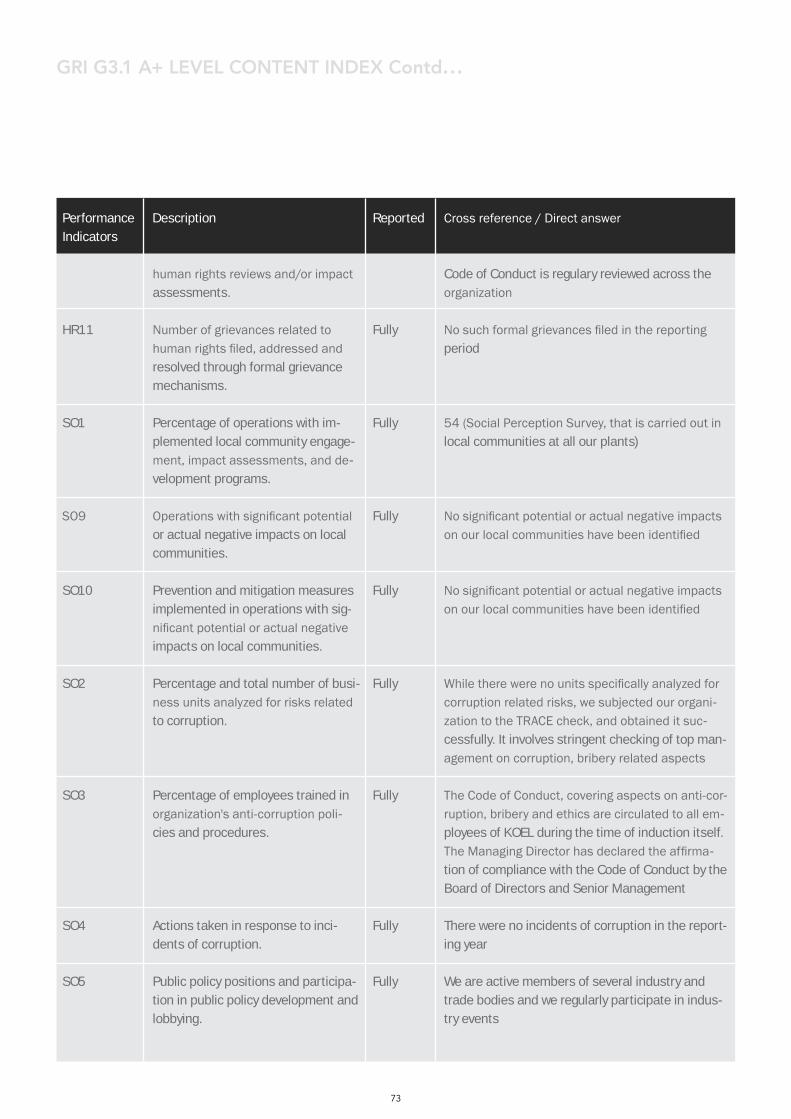
HR11
SO1
SO9
SO10
SO2
SO3
SO4
SO5
human rights reviews and/or impact assessments.
Number of grievances related to human rights filed, addressed and resolved through formal grievance mechanisms.
Percentage of operations with im-plemented local community engage-ment, impact assessments, and de-velopment programs.
Operations with significant potential or actual negative impacts on local communities.
Prevention and mitigation measures implemented in operations with sig-nificant potential or actual negative impacts on local communities.
Percentage and total number of busi-ness units analyzed for risks related to corruption.
Percentage of employees trained in organization's anti-corruption poli-cies and procedures.
Actions taken in response to inci-dents of corruption.
Public policy positions and participa-tion in public policy development and lobbying.
Fully
Fully
Fully
Fully
Fully
Fully
Fully
Fully
Code of Conduct is regulary reviewed across the organization
No such formal grievances filed in the reporting period
54 (Social Perception Survey, that is carried out in local communities at all our plants)
No significant potential or actual negative impacts on our local communities have been identified
No significant potential or actual negative impacts on our local communities have been identified
While there were no units specifically analyzed for corruption related risks, we subjected our organi-zation to the TRACE check, and obtained it suc-cessfully. It involves stringent checking of top man-agement on corruption, bribery related aspects
The Code of Conduct, covering aspects on anti-cor-ruption, bribery and ethics are circulated to all em-ployees of KOEL during the time of induction itself. The Managing Director has declared the affirma-tion of compliance with the Code of Conduct by the Board of Directors and Senior Management
There were no incidents of corruption in the report-ing year
We are active members of several industry and trade bodies and we regularly participate in indus-try events
GRI G3.1 A+ LEVEL CONTENT INDEX Contd…
Performance Indicators
Description Reported Cross reference / Direct answer
73
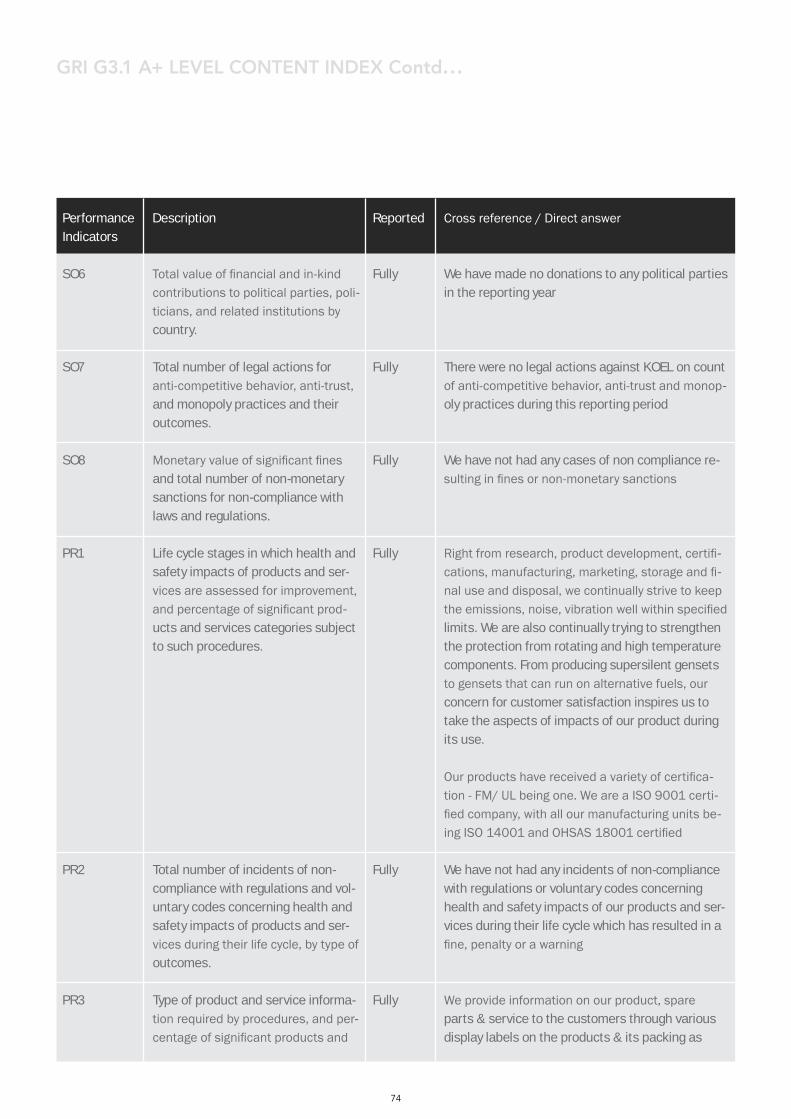
SO6
SO7
SO8
PR1
PR2
PR3
Total value of financial and in-kind contributions to political parties, poli-ticians, and related institutions by country.
Total number of legal actions for anti-competitive behavior, anti-trust, and monopoly practices and their outcomes.
Monetary value of significant fines and total number of non-monetary sanctions for non-compliance with laws and regulations.
Life cycle stages in which health and safety impacts of products and ser-vices are assessed for improvement, and percentage of significant prod-ucts and services categories subject to such procedures.
Total number of incidents of non-compliance with regulations and vol-untary codes concerning health and safety impacts of products and ser-vices during their life cycle, by type of outcomes.
Type of product and service informa-tion required by procedures, and per-centage of significant products and
Fully
Fully
Fully
Fully
Fully
Fully
We have made no donations to any political parties in the reporting year
There were no legal actions against KOEL on count of anti-competitive behavior, anti-trust and monop-oly practices during this reporting period
We have not had any cases of non compliance re-sulting in fines or non-monetary sanctions
Right from research, product development, certifi-cations, manufacturing, marketing, storage and fi-nal use and disposal, we continually strive to keep the emissions, noise, vibration well within specified limits. We are also continually trying to strengthen the protection from rotating and high temperature components. From producing supersilent gensets to gensets that can run on alternative fuels, our concern for customer satisfaction inspires us to take the aspects of impacts of our product during its use.
Our products have received a variety of certifica-tion - FM/ UL being one. We are a ISO 9001 certi-fied company, with all our manufacturing units be-ing ISO 14001 and OHSAS 18001 certified
We have not had any incidents of non-compliance with regulations or voluntary codes concerning health and safety impacts of our products and ser-vices during their life cycle which has resulted in a fine, penalty or a warning
We provide information on our product, spare parts & service to the customers through various display labels on the products & its packing as
GRI G3.1 A+ LEVEL CONTENT INDEX Contd…
Performance Indicators
Description Reported Cross reference / Direct answer
74
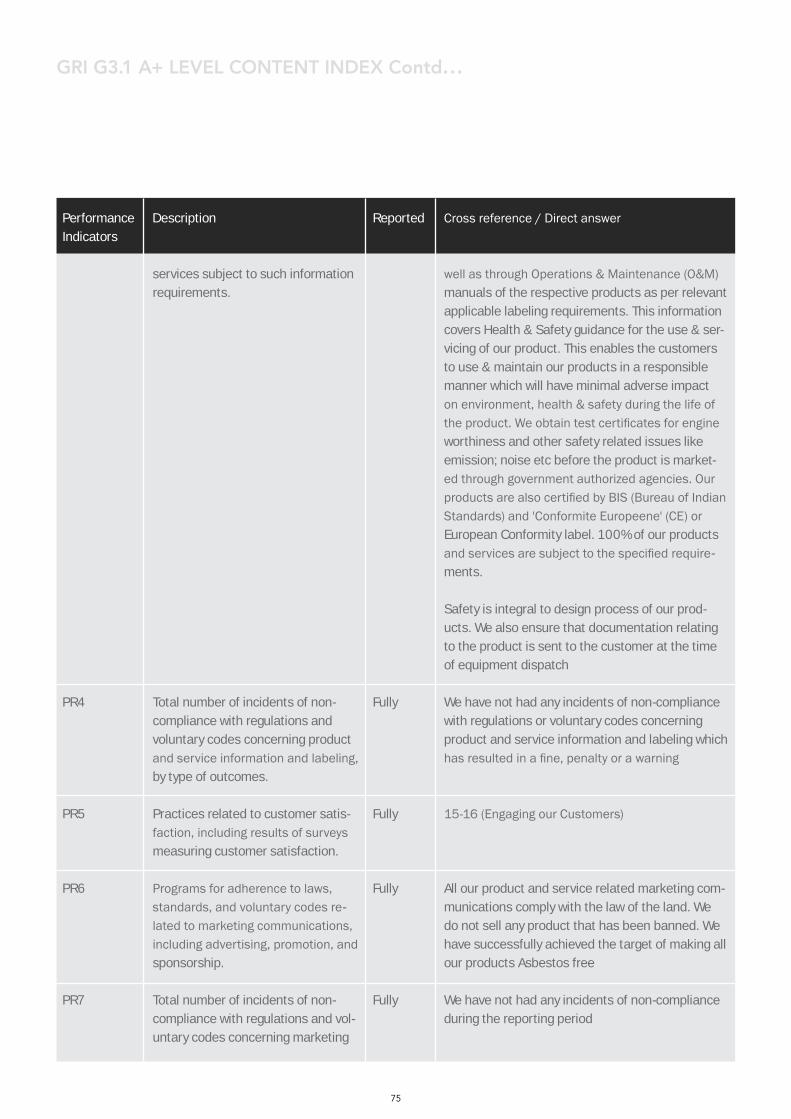
PR4
PR5
PR6
PR7
services subject to such information requirements.
Total number of incidents of non-compliance with regulations and voluntary codes concerning product and service information and labeling, by type of outcomes.
Practices related to customer satis-faction, including results of surveys measuring customer satisfaction.
Programs for adherence to laws, standards, and voluntary codes re-lated to marketing communications, including advertising, promotion, and sponsorship.
Total number of incidents of non-compliance with regulations and vol-untary codes concerning marketing
Fully
Fully
Fully
Fully
well as through Operations & Maintenance (O&M) manuals of the respective products as per relevant applicable labeling requirements. This information covers Health & Safety guidance for the use & ser-vicing of our product. This enables the customers to use & maintain our products in a responsible manner which will have minimal adverse impact on environment, health & safety during the life of the product. We obtain test certificates for engine worthiness and other safety related issues like emission; noise etc before the product is market-ed through government authorized agencies. Our products are also certified by BIS (Bureau of Indian Standards) and 'Conformite Europeene' (CE) or European Conformity label. 100% of our products and services are subject to the specified require-ments.
Safety is integral to design process of our prod-ucts. We also ensure that documentation relating to the product is sent to the customer at the time of equipment dispatch
We have not had any incidents of non-compliance with regulations or voluntary codes concerning product and service information and labeling which has resulted in a fine, penalty or a warning
15-16 (Engaging our Customers)
All our product and service related marketing com-munications comply with the law of the land. We do not sell any product that has been banned. We have successfully achieved the target of making all our products Asbestos free
We have not had any incidents of non-compliance during the reporting period
GRI G3.1 A+ LEVEL CONTENT INDEX Contd…
Performance Indicators
Description Reported Cross reference / Direct answer
75
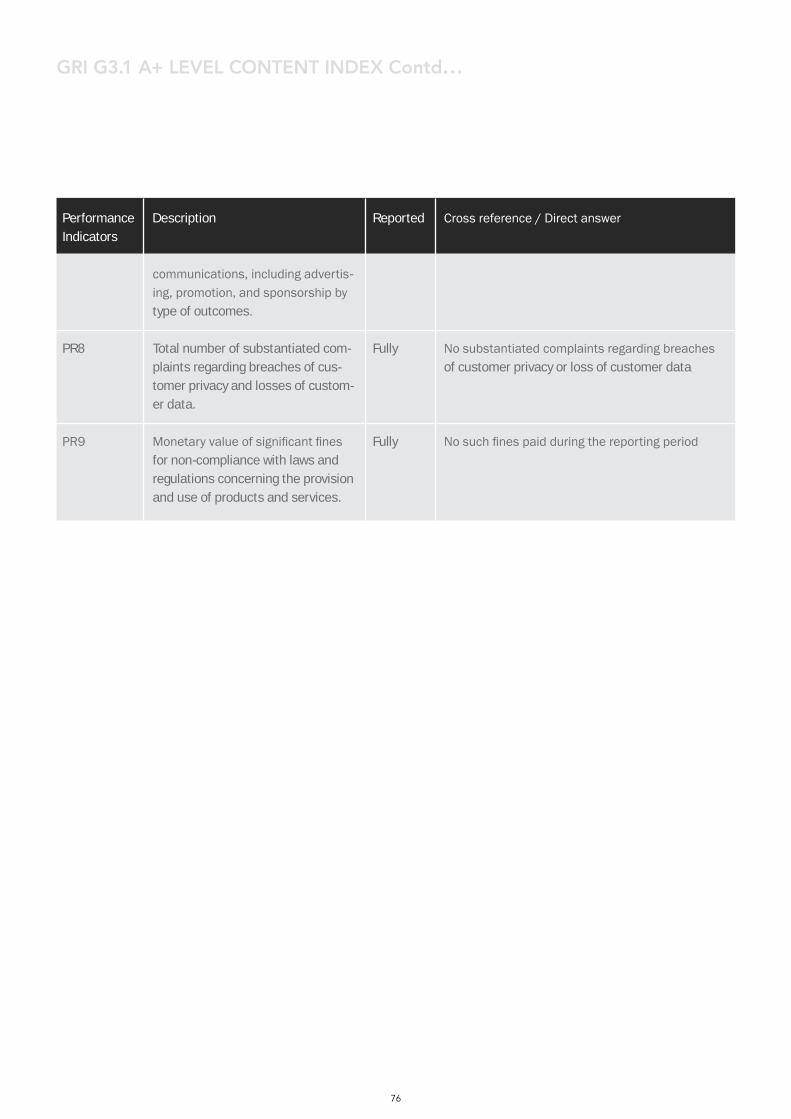
PR8
PR9
communications, including advertis-ing, promotion, and sponsorship by type of outcomes. Total number of substantiated com-plaints regarding breaches of cus-tomer privacy and losses of custom-er data.
Monetary value of significant fines for non-compliance with laws and regulations concerning the provision and use of products and services.
Fully
Fully
No substantiated complaints regarding breaches of customer privacy or loss of customer data
No such fines paid during the reporting period
GRI G3.1 A+ LEVEL CONTENT INDEX Contd…
Performance Indicators
Description Reported Cross reference / Direct answer
76

KIRLOSKAR OIL ENGINES LIMITED
Laxmanrao kirloskar Road, khadki, Pune – 411 003 (INDIA). Email: [email protected]
Website: www.koel.co.in Please mail your feedback and questions on the report to: [email protected]