KIRIN HOLDINGS COMPANY, LIMITED - zonebourse.com€¦- i - kirin holdings company, limited april 28,...
25
- i - KIRIN HOLDINGS COMPANY, LIMITED April 28, 2017 SUMMARY OF CONSOLIDATED FINANCIAL RESULTS FOR THE THREE MONTHS ENDED MARCH 31, 2017 (UNDER JAPANESE GAAP) (UNAUDITED) (English Translation) Fiscal year ending December 31, 2017 KIRIN HOLDINGS COMPANY, LIMITED NAKANO CENTRAL PARK SOUTH, 10-2, Nakano 4-chome, Nakano-ku, Tokyo, Japan (URL http://www.kirinholdings.co.jp/english/) Code No.: 2503 Shares Listed: Tokyo, Nagoya, Sapporo and Fukuoka Representative: Mr. Yoshinori Isozaki, President For further information, please contact: Mr. Tetsuya Fujiwara, Director of Group Corporate Communications Telephone: +81-3-6837-7015 from overseas Submission date of quarterly securities report scheduled: May 11, 2017 Commencement date of dividend distribution scheduled: - Preparation of supplementary documents to the quarterly financial results: Yes Holding of quarterly financial results presentation (for institutional investors and analysts): Yes 1. Consolidated business results and financial position for the first three months of the current fiscal year (January 1, 2017 – March 31, 2017) [Unit: Japanese yen (¥)] (1) Results of operations (cumulative): (Fractions less than ¥1 million have been omitted) (Percentage change compares current results with those of the same period of the previous year) Sales (¥ millions) Percentage change (%) Operating income (¥ millions) Percentage change (%) Ordinary income (¥ millions) Percentage change (%) Three months ended March 31, 2017 472,137 (2.4) 36,863 45.4 36,140 53.3 March 31, 2016 483,880 (6.1) 25,351 (3.5) 23,578 (8.0) Note: Comprehensive income March 31, 2017 ¥66,294 million [-%] March 31, 2016 ¥2,111 million [(86.1)%] Net income attributable to owners of the parent (¥ millions) Percentage change (%) Net income per share (Basic) (¥) Net income per share (Diluted) (¥) Three months ended March 31, 2017 18,197 74.7 19.94 19.94 March 31, 2016 10,414 (22.1) 11.41 11.41
Transcript of KIRIN HOLDINGS COMPANY, LIMITED - zonebourse.com€¦- i - kirin holdings company, limited april 28,...

- i -
KIRIN HOLDINGS COMPANY, LIMITED April 28, 2017
SUMMARY OF CONSOLIDATED FINANCIAL RESULTS FOR THE THREE MONTHS ENDED MARCH 31, 2017 (UNDER JAPANESE GAAP) (UNAUDITED)
(English Translation)
Fiscal year ending December 31, 2017
KIRIN HOLDINGS COMPANY, LIMITED
NAKANO CENTRAL PARK SOUTH, 10-2, Nakano 4-chome, Nakano-ku, Tokyo, Japan (URL http://www.kirinholdings.co.jp/english/)
Code No.: 2503
Shares Listed: Tokyo, Nagoya, Sapporo and Fukuoka
Representative: Mr. Yoshinori Isozaki, President
For further information, please contact: Mr. Tetsuya Fujiwara, Director of Group Corporate Communications
Telephone: +81-3-6837-7015 from overseas
Submission date of quarterly securities report scheduled: May 11, 2017
Commencement date of dividend distribution scheduled: -
Preparation of supplementary documents to the quarterly financial results: Yes
Holding of quarterly financial results presentation (for institutional investors and analysts): Yes
1. Consolidated business results and financial position for the first three months of the current fiscal year (January 1, 2017 – March 31, 2017)
[Unit: Japanese yen (¥)]
(1) Results of operations (cumulative): (Fractions less than ¥1 million have been omitted)
(Percentage change compares current results with those of the same period of the previous year)
Sales
(¥ millions)
Percentage
change
(%)
Operating
income
(¥ millions)
Percentage
change
(%)
Ordinary
income
(¥ millions)
Percentage
change
(%)
Three months ended
March 31, 2017 472,137 (2.4) 36,863 45.4 36,140 53.3
March 31, 2016 483,880 (6.1) 25,351 (3.5) 23,578 (8.0)
Note: Comprehensive income March 31, 2017 ¥66,294 million [-%]
March 31, 2016 ¥2,111 million [(86.1)%]
Net income
attributable
to owners
of the
parent
(¥ millions)
Percentage
change
(%)
Net income
per share
(Basic)
(¥)
Net income
per share
(Diluted)
(¥)
Three months ended
March 31, 2017 18,197 74.7 19.94 19.94
March 31, 2016 10,414 (22.1) 11.41 11.41

- ii -
(2) Financial position:
Total assets
(¥ millions)
Net assets
(¥ millions)
Ratio of equity
to total assets
(%)
As of
March 31, 2017 2,300,770 985,652 31.4
December 31, 2016 2,348,166 946,083 29.0
Reference: Equity March 31, 2017 ¥721,874 million
December 31, 2016 ¥680,662 million
2. Dividends
Annual dividends
First quarter
(¥)
Second quarter
(¥)
Third quarter
(¥)
Year-end
(¥)
Total
(¥)
Fiscal year ended December 31, 2016 – 19.00 – 20.00 39.00
Fiscal year ending December 31, 2017 –
Fiscal year ending December 31, 2017
(Forecast) 19.50 – 19.50 39.00
Note: Revision of the forecast from recently announced figures: None
3. Forecast consolidated business results for the current fiscal year (January 1, 2017 - December 31, 2017)
(Percentage change compares forecast results with actual results of the previous year)
Sales
(¥ millions)
Percentage
change
(%)
Operating
income
(¥ millions)
Percentage
change
(%)
Ordinary
income
(¥ millions)
Percentage
change
(%)
Six months ending June 30, 2017 1,010,000 0.2 55,000 (6.5) – –
Fiscal year ending December 31, 2017 2,100,000 1.2 143,000 0.8 144,000 2.4
Net income
attributable
to owners of
the parent
(¥ millions)
Percentage
change
(%)
Net income
per share
(¥)
Six months ending June 30, 2017 – – –
Fiscal year ending December 31, 2017 68,000 (42.4) 74.52
Note: Revision of the forecast from recently announced figures: None

- iii -
* Notes
(1) Changes in significant subsidiaries for the three months ended March 31, 2017 (Changes in specified subsidiaries accompanying
change in scope of consolidation.): None
Newly included: - Excluded: -
(2) Application of specific accounting for preparing the quarterly consolidated financial statements: Yes
Note: For details, please refer to “2. SUMMARY INFORMATION (NOTES), (2) APPLICATION OF SPECIFIC ACCOUNTING FOR
PREPARING THE QUARTERLY CONSOLIDATED FINANCIAL STATEMENTS” on page 6 of the Attached Materials.
(3) Changes in accounting policies, changes in accounting estimates, and restatements
i. Changes in accounting policies due to amendment of accounting standards: None
ii. Changes in accounting policies due to other reasons: None
iii. Changes in accounting estimates: None
iv. Restatements: None
(4) Number of shares outstanding (common stock)
i. Number of shares outstanding at the end of the period (including treasury stock)
As of March 31, 2017 914,000,000 shares
As of December 31, 2016 914,000,000 shares
ii. Number of treasury stock at the end of the period
As of March 31, 2017 1,488,737 shares
As of December 31, 2016 1,484,147 shares
iii. Average number of shares during the period (cumulative from the beginning of the fiscal year)
For the three months ended March 31, 2017 912,513,228 shares
For the three months ended March 31, 2016 912,527,694 shares
* The summary of quarterly consolidated financial results is not subject to quarterly reviews. * Information about proper usage of forecast business results, and other special instructions
(1) The statements concerning future performance that are presented in this document are based on judgments using information available to Kirin Holdings and the Kirin Group as of the release date of this material. Certain risks and uncertainties could cause the results of Kirin Holdings and the Kirin Group to differ materially from any projections presented herein. These risks and uncertainties include, but are not limited to, the economic circumstances surrounding the Company’s businesses, market trends, and exchange rates.
(2) The Company will post the Supplementary Documents to the Financial Results today, Friday, April 28, and will post the presentation materials from the financial results presentation (teleconference) to be held today and the main Q&A at the meeting as soon as possible on the Company's website. (URL of the Company's website) http://www.kirinholdings.co.jp/english/ir/event/explain/index.html

- 1 -
ATTACHED MATERIALS
INDEX
1. QUALITATIVE INFORMATION REGARDING CONSOLIDATED RESULTS FOR THE THREE MONTHS ....................................... 2
(1) STATEMENT OF BUSINESS ACTIVITIES AND RESULTS ........................................................................................................ 2
(2) FINANCIAL POSITION ............................................................................................................................................................... 6
(3) CONSOLIDATED FORECASTS ................................................................................................................................................. 6
2. SUMMARY INFORMATION (NOTES) .............................................................................................................................................. 7
(1) CHANGES IN SIGNIFICANT SUBSIDIARIES FOR THE THREE MONTHS ENDED MARCH 31, 2017...................................... 7
(2) APPLICATION OF SPECIFIC ACCOUNTING FOR PREPARING THE QUARTERLY CONSOLIDATED
FINANCIAL STATEMENTS ........................................................................................................................................................ 7
(3) CHANGES IN ACCOUNTING POLICIES, CHANGES IN ACCOUNTING ESTIMATES, AND RESTATEMENTS ........................ 7
3. CONSOLIDATED FINANCIAL STATEMENTS ................................................................................................................................. 8
(1) CONSOLIDATED BALANCE SHEETS ....................................................................................................................................... 8
(2) CONSOLIDATED STATEMENTS OF INCOME AND COMPREHENSIVE INCOME ................................................................. 10
CONSOLIDATED STATEMENTS OF INCOME ......................................................................................................................... 10
CONSOLIDATED STATEMENTS OF COMPREHENSIVE INCOME ......................................................................................... 11
(3) NOTES TO CONSOLIDATED FINANCIAL STATEMENTS ....................................................................................................... 12
(GOING CONCERN ASSUMPTION) ......................................................................................................................................... 12
(SIGNIFICANT CHANGES IN SHAREHOLDERS’ EQUITY)...................................................................................................... 12
(SEGMENT INFORMATION)..................................................................................................................................................... 12
(ADDITIONAL INFORMATION) ................................................................................................................................................. 13

- 2 -
1. QUALITATIVE INFORMATION REGARDING CONSOLIDATED RESULTS FOR THE THREE MONTHS
(1) STATEMENT OF BUSINESS ACTIVITIES AND RESULTS
During the first quarter (January 1–March 31, 2017), against a prevailing sense of uncertainty about the political
situation and the direction of economic policies in countries such as the United States and key European
countries, there were concerns regarding fluctuations in the global financial market. However, the real economy
recovered in these countries and the global economy experienced a modest recovery.
Meanwhile, although consumer spending recovery in Japan was still slow, due to the gradual increase in the
growth rate of the global economy and improved confidence in the capital market, there were signs of improved
corporate performance, and the Japanese economy as a whole maintained a modest recovery throughout the
period.
In the fiscal year 2016, the Kirin Group embarked on its Medium-Term Business Plan 2016–2018 (“2016 MTBP”),
which is the first three-year plan under its new Long-Term Business Plan, the New Kirin Group Vision 2021 (“New
KV2021”). Based on these long- and medium-term plans, the Kirin Group advanced its efforts to address the
three priority issues of the 2016 MTBP, and strove to restructure and revitalize the Kirin Group. Furthermore, in
order to achieve the New KV2021, the Kirin Group has released the Kirin Group’s CSV Commitment that sets out
policies for concrete initiatives, and positioned “Health and well-being”, “Community Engagement”, and “The
Environment”, which are intrinsically related to the Group’s businesses, as the Group’s long-term CSV*1
priority
issues.
As a result, consolidated sales decreased in the current consolidated first quarter due to such factors as a
decreased sales volume in Lion’s beer, spirits, and wine business, and Kirin Beverage Company, Limited’s
change of accounting process to deduct part of its selling expenses from sales, which were recorded as
expenses in the same quarter last year. Consolidated operating income recorded a significant year-on-year
increase owing to increased profits in the Japan Integrated Beverages Business and the Pharmaceuticals and
Bio-chemicals Businesses. Consolidated ordinary income and quarterly consolidated net income attributable to
owners of the parent also increased respectively on account of an increase in equity in earnings of affiliates.
*1 CSV: An acronym for Creating Shared Value; the aim is improvement in corporate values based on both “social values creation” and
“economic values creation” through addressing social issues.
Kirin Holdings Company, Limited 2017 first quarter results:
Consolidated sales ¥472.1 billion yen, down 2.4%
Consolidated operating income ¥36.8 billion yen, up 45.4%
Consolidated ordinary income ¥36.1 billion yen, up 53.3%
Consolidated first quarter net income*1 ¥18.1 billion yen, up 74.7%
(Reference)
Normalized EPS*2
¥29 yen, up 52.6 %
*1 Refers to quarterly net income attributable to owners of the parent.
*2 Normalization: The removal of special income and expenses and other non-recurring items to reflect actual earnings more
accurately.

- 3 -
Normalized EPS = Adjusted quarterly net income / Average number of shares outstanding during the period.
Adjusted quarterly net income = Quarterly net income + Amortization of goodwill etc. ± Special income or expenses after
income taxes and minority interests.
Note that normalized EPS has been rounded to the nearest one (1) yen.
Results by segment are as follows.
Japan Integrated Beverages Business
Kirin Brewery Company, Limited is designating the period of the 2016 MTBP as three years in which it will solidify
its V-shaped business recovery. It aims to be a company which cares about consumers most, and to generate
values unique to Kirin. As consumer consumption patterns change to reflect a leaning toward products that
satisfy individual preferences and tastes, further efforts were made to enhance the appeal of the beer products.
As to its flagship product Kirin Ichiban Shibori, the company offered a range of products including seasonal
limited products and special seasonal packaging. In the craft beer*1
category, it further developed the market
through a full-scale renewal of Grand Kirin and the launch of Brooklyn Lager, etc. As a result, sales volumes in
the beer category reached the same level as last year. In the low-malt beer (happo-shu) category, sales of Tanrei
Platinum Double, a product that focuses on functionality, were particularly favorable, and the sales volume
exceeded the overall market performance of this category. Meanwhile, sales volumes of the renewed Kirin
Nodogoshi Nama and other products in the new genre category remained high as a result of strengthened sales
activity at volume retailers. The overall sales volume for beer products therefore reached the same level as the
first quarter of last year. In the ready-to-drink (RTD) category*2
in which the consumer base has been expanding,
the sales volume of the renewed Kirin Honshibori Chuhai, as well as that of the core brand Kirin Hyoketsu,
increased from the previous year. Furthermore, the company launched a new product, Kirin Tabisuru Hyoketsu,
targeted at young consumers. In the whiskey, spirits, and liqueurs category, sales increased centering on
imported whiskey brands such as Johnnie Walker and White Horse.
Mercian Corporation executed marketing activities focused on the key brands for each category to realize
sustainable expansion of the overall wine market. The sales volume of Château Mercian, the company’s flagship
brand to drive value growth for Japanese wine, increased from last year. In the domestic wine category, the
company aimed to raise customer satisfaction levels with its regular products via the renewal of
Oishii-Sankaboshizai-Mutenka Wine and the launch of Bon Rouge Organic (Red) to meet consumers’ growing
quest for health and well-being. However, the sales volume was slightly below that of the previous year. In the
imported wine category, sales were solid, centering on the focus brand Casillero del Diablo, medium- to high-end
wine from Chile, as well as the new World Selection series that aims to expand the wine market consumer base.
Kirin Beverage Company, Limited advanced its measures to build robust brand framework for sustainable and
profitable growth. In particular, heated products of the company’s core brand Kirin Gogo-no-Kocha and regular
products of Kirin Nama-cha performed solidly, and the overall sales volume of soft drink products increased at a
rate higher than that of the market. In the coffee drink category, a large-scale sampling activity for Kirin FIRE
Extreme Blend involving the free distribution of 1 million cans was executed to boost the attractiveness of canned
coffee among a wide range of consumers. Furthermore, the company launched Kirin Supli Lemon that has Foods
with Function Claims registered at the Consumer Affairs Agency and Rizap Protein Bottle that was jointly

- 4 -
developed with Rizap K.K., proposing new value to consumers in the field of health and well-being, one of the
Kirin Group CSV priority issues. At the same time, the company continued its business restructuring efforts
through initiatives such as the target control focused on canned and small PET bottles as well as SCM cost
reductions in order to accelerate improvement in profitability.
As a result, although sales by Kirin Beverage Company, Limited decreased due to its change of accounting
process to deduct part of its selling expenses from sales, which were recorded as expenses in the same quarter
last year, consolidated sales of the Japan Integrated Beverages Business increased owing to factors such as
Kirin Brewery Company, Limited’s decrease in selling expenses, and Kirin Beverage Company, Limited’s
increase in sales volume and cost reductions, etc.
*1 Craft beer: Kirin uses the term to mean a beer that exhibits the personality of the brewer, as well as attention to detail, promoting enjoyment
based on the beer’s unique taste and individuality.
*2 RTD: An acronym for “ready-to-drink”; RTD liquors are packaged low-alcohol beverages sold in a prepared ready-to-drink form.
Japan Integrated Beverages Business 2017 first quarter results:
Consolidated sales ¥231.4 billion yen, down 1.9%
Consolidated operating income ¥7.8 billion yen, up 570.2%
Overseas Integrated Beverages Business
In Lion’s beer, spirits, and wine business, the beer sales volume decreased year-on-year due to the termination
of the license agreement with Anheuser-Busch InBev N.V. The company focused on strengthening its core
brands and growing categories in order to support profit growth in the medium- to long-term. In the growing craft
beer category, sales of flagship brands, James Squire and Little Creatures, were solid. In Lion’s Dairy & Drinks
business, ambient juice sales volumes decreased. However, overall sales in the business, including the focus on
the milk based beverages category and its core brand Dare, were solid. The company also continued to realize
savings through ongoing cost saving initiatives.
Brasil Kirin developed flexible sales strategies to address market changes, and conducted its business activities
accordingly. In the beer category, sales volumes of the premium brand Eisenbahn and the medium- or high-price
brand Devassa significantly increased year-on-year, which solidified strategies to build a strong brand portfolio.
In February 2017, a stock purchase agreement was entered into with Bavaria S.A. (Bavaria), a subsidiary of
Heineken International B.V., whereby all Brasil Kirin shares were to be transferred to Bavaria; the parties
accordingly applied to Conselho Administrativo de Defesa Economica (CADE), an antitrust agency in Brasil, for
approval of the share transfer.
Myanmar Brewery strengthened its sales activities based on the brand portfolio established in the previous year
in order to reinforce its current top position in the Myanmar market. As a result of intensive sales promotional
activities for the flagship product Myanmar Beer as well as strong sales of the low-price product Andaman for
which a large-volume can format was additionally launched aimed at the growing volume retailer channel, the
beer sales volume increased from the previous year. Furthermore, in order to procure a manufacturing and
shipment base in the growing Myanmar market, it was decided to acquire a controlling interest in Mandalay
Brewery located in the northern part of Myanmar.
As a result, both consolidated sales and consolidated operating income decreased in the Oceania Integrated

- 5 -
Beverages Business because of the decrease in sales volume in Lion’s beer, spirits, and wine business as well
as the impact of loss on inventory revaluation for Lion’s dairy and drinks business. Other Overseas Integrated
Beverages Business recorded an increase both in consolidated sales and consolidated operating income
because of Brasil Kirin’s further profit improvement and Myanmar Brewery’s sales volume increase.
Oceania Integrated Beverages Business 2017 first quarter results:
Consolidated sales ¥97.3 billion yen, down 14.1 %
Consolidated operating income ¥12.9 billion yen, down 24.4 %
Other Overseas Integrated Beverages business 2017 first quarter results:
Consolidated sales ¥48.9 billion yen, up 16.6 %
Consolidated operating loss ¥1.2 billion yen, -
Pharmaceuticals and Bio-Chemicals Business
In the pharmaceuticals business, Kyowa Hakko Kirin Company took measures toward achieving its strategic
targets in line with its aim of taking great strides to become a global specialty pharmaceutical company. In the
domestic market, sales of the long-acting G-CSF formula G-LASTA,*1
etc. in the new drug category were solid,
but domestic sales declined due to the penetration of generic drugs following government measures to reduce
medical costs as well as to the impact of domestic drug price revisions. The company also established a new
company to address changes in the social environment and diversifying needs related to medicine, and made
preparations for obtaining the domestic manufacture and sales approval for authorized version*2
of NESP. In the
overseas market, sales recorded a year-on-year increase due to growth in technology out-licensing revenue
because of upfront payments etc. from AstraZeneca as well as of core products such as Abstral and PecFent for
the treatment of cancer pain. In the research and development arena, development of global strategic products
such as KRN23*3
made steady progress. On the domestic development front, the phase III clinical study of
KHK7580*4
demonstrated favorable results.
In the Bio-Chemicals business, the company worked on further increasing the value of branding products,*5
bolstering relationships with customers in the mail-order business, and strengthening the active pharmaceutical
ingredients business, among others. Actions were also taken to promote appropriate cost management and cost
reductions.
As a result, despite a decline in domestic drug sales, the Pharmaceuticals and Bio-chemicals Business as a
whole recorded an increase in consolidated sales and consolidated operating income due to higher technology
revenue and lower research and development costs, among other reasons.
*1 G-LASTA: A drug to decrease the incidence of febrile neutropenia, one of the serious side effects of cancer chemotherapy.
*2 Authorized version : Kirin thinks “Authorized version” is an identical drug to the branded drug in terms
of active pharmaceutical ingredients, excipients and manufacturing method and which are manufactured and marketed by a company that
receives the rights to exploit the branded drug’s patent from the company that owns the patent.
*3 KRN 23: A drug under development for the treatment of X-linked hypophosphatemia (XLH), a rare disease that is a hereditary bone
growth/maintenance disorder.

- 6 -
*4 KHK7580: A small molecular compound acting on the calcium receptor for which a phase III clinical study has been in place in Japan
among secondary hyperparathyroidism patients receiving hemodialysis.
*5 Branding products: Products that are differentiated from the equivalent competitor products by giving a unique brand name to generic raw
materials/components (e.g. citicoline).
Pharmaceuticals and Bio-Chemicals Business 2017 first quarter results:
Consolidated sales ¥89.3 billion yen, up 2.8 %
Consolidated operating income ¥15.4 billion yen, up 66.5 %
Other Businesses
Koiwai Dairy Products Company focused on sales of its unique products, Koiwai yogurt made from 100% fresh
milk and Koiwai yogurt made from 100% fresh milk – fat free. However, sales decreased year-on-year, reflecting
the generally stagnant cultured milk product market. As a result, both consolidated sales and consolidated
operating income of the Other Businesses declined.
Yokohama Arena was deconsolidated from the first quarter in 2017, due to the transfer of 60,000 shares (50.4%
of outstanding shares) of the total 70,000 shares (58.8% of outstanding shares) in the company held by Kirin
Holdings Company, Limited to Seibu Railway Co., Ltd and Amuse Inc.
Other Businesses 2017 first quarter results:
Consolidated sales ¥5.0 billion yen, down 10.2 %
Consolidated operating income ¥0.6 billion yen, down 1.9 %
(2) FINANCIAL POSITION
Total assets at the end of the current consolidated first quarter decreased by 47.3 billion yen from the end of the
previous consolidated fiscal year, to 2.3007 trillion yen. This decrease is the result of a decrease in notes and
accounts receivable, etc., despite increases in cash and deposits and property, plant and equipment, as well as
investment securities, etc.
Liabilities decreased by 86.9 billion yen to 1.3151 trillion yen from the end of the previous consolidated fiscal year,
resulting from decreases in notes and accounts payable as well as liquor tax payable (Current liabilities “Other”),
etc., despite an increase in interest-bearing debts, etc.
Net assets increased by 39.5 billion yen from the end of the previous consolidated fiscal year to 985.6 billion yen,
due to an increase in foreign currency translation adjustments, etc.
(3) CONSOLIDATED FORECASTS
Kirin Group’s consolidated forecasts remain unchanged for the full year ending December 31, 2017, as
announced on February 13, 2017.

- 7 -
2. SUMMARY INFORMATION (NOTES)
(1) CHANGES IN SIGNIFICANT SUBSIDIARIES FOR THE THREE MONTHS ENDED MARCH 31, 2017
There are no matters to report under this item.
(2) APPLICATION OF SPECIFIC ACCOUNTING FOR PREPARING THE QUARTERLY CONSOLIDATED
FINANCIAL STATEMENTS
Calculation of income taxes
Income taxes for the period are calculated by multiplying net income before income taxes for the period by the
estimated annual effective rate which is calculated based on the estimated income before taxes for the full year
and estimated annual income after the application of tax effect accounting.
(3) CHANGES IN ACCOUNTING POLICIES, CHANGES IN ACCOUNTING ESTIMATES, AND
RESTATEMENTS
There are no matters to report under this item.

- 8 -
3. CONSOLIDATED FINANCIAL STATEMENTS
(1) CONSOLIDATED BALANCE SHEETS
(¥ millions)
As of December 31, 2016 As of March 31, 2017
ASSETS
Current assets
Cash and time deposits 58,990 70,957
Notes and accounts receivable, trade 393,500 324,876
Merchandise and finished goods 135,335 138,106
Work in process 25,229 21,263
Raw materials and supplies 47,045 47,551
Other 93,493 88,749
Allowance for doubtful accounts (5,445) (5,741)
Total current assets 748,148 685,764
Non-current assets
Property, plant and equipment (Net of accumulated depreciation and accumulated loss on impairment)
705,204 718,321
Intangible assets
Goodwill 228,983 233,199
Other 172,927 168,231
Total 401,910 401,431
Investments and other assets
Investment securities 396,057 408,439
Net defined benefit asset 9,432 9,777
Other 92,630 82,249
Allowance for doubtful accounts (5,216) (5,213)
Total 492,904 495,252
Total non-current assets 1,600,018 1,615,005
Total assets 2,348,166 2,300,770

- 9 -
(¥ millions)
As of December 31, 2016 As of March 31, 2017
LIABILITIES
Current liabilities
Notes and accounts payable, trade 135,801 114,204
Short-term loans payable and long-term debt with current maturities
89,934 109,710
Commercial paper 45,000 72,000
Bonds due within one year – 69,998
Income taxes payable 21,162 13,022
Reserves 10,073 18,120
Other 348,410 265,119
Total current liabilities 650,382 662,177
Non-current liabilities
Bonds 194,994 124,996
Long-term debt 318,712 297,395
Reserve for loss on litigation 20,299 18,835
Other reserves 7,121 7,538
Net defined benefit liability 67,390 64,442
Other 143,182 139,732
Total non-current liabilities 751,700 652,940
Total liabilities 1,402,082 1,315,118
NET ASSETS
Shareholders’ equity
Common stock 102,045 102,045
Capital surplus 2 4
Retained earnings 629,024 628,564
Treasury stock, at cost (2,126) (2,135)
Total shareholders’ equity 728,945 728,479
Accumulated other comprehensive income
Net unrealized gains on securities 60,170 59,089
Deferred gains or losses on hedges (1,170) (141)
Land revaluation difference (1,959) (1,959)
Foreign currency translation adjustments (86,607) (46,677)
Remeasurements of defined benefit plans (18,716) (16,915)
Total accumulated other comprehensive income (48,282) (6,604)
Subscription rights to shares 562 504
Non-controlling interests 264,859 263,273
Total net assets 946,083 985,652
Total liabilities and net assets 2,348,166 2,300,770

- 10 -
(2) CONSOLIDATED STATEMENTS OF INCOME AND COMPREHENSIVE INCOME
CONSOLIDATED STATEMENTS OF INCOME
(¥ millions)
Three months ended
March 31, 2016
Three months ended
March 31, 2017
Sales 483,880 472,137
Cost of sales 266,853 256,910
Gross profit 217,026 215,226
Selling, general and administrative expenses 191,675 178,363
Operating income 25,351 36,863
Non-operating income
Interest income 860 1,094
Dividend income 383 408
Equity in earnings of affiliates 1,888 3,250
Other 1,018 917
Total 4,151 5,669
Non-operating expenses
Interest expense 3,710 3,110
Foreign exchange losses 426 1,899
Other 1,787 1,384
Total 5,924 6,393
Ordinary income 23,578 36,140
Special income
Gain on sale of property, plant and equipment and intangible assets
5,266 778
Gain on sale of investment securities 341 192
Gain on sale of shares of subsidiaries and affiliates – 2,412
Other 1,537 395
Total 7,145 3,779
Special expenses
Loss on disposal of property, plant and equipment and intangible assets
618 86
Loss on sale of property, plant and equipment and intangible assets
251 64
Loss on impairment 1 –
Loss on sale of investment securities – 6
Loss on sale of shares of subsidiaries and affiliates – 120
Business restructuring expense 659 971
Other 602 1,065
Total 2,134 2,315
Income before income taxes 28,589 37,604
Income taxes 12,898 13,453
Net income 15,691 24,151
Net income attributable to non-controlling interests 5,277 5,954
Net income attributable to owners of the parent 10,414 18,197

- 11 -
CONSOLIDATED STATEMENTS OF COMPREHENSIVE INCOME
(¥ millions)
Three months ended
March 31, 2016
Three months ended
March 31, 2017
Net income 15,691 24,151
Other comprehensive income
Net unrealized gains on securities (12,035) (1,041)
Deferred gains or losses on hedges (2,899) 1,026
Land revaluation difference 61 –
Foreign currency translation adjustments 5,899 32,389
Remeasurements of defined benefit plans 605 1,581
Share of other comprehensive income of entities accounted for by the equity method
(5,210) 8,187
Total other comprehensive income (13,580) 42,143
Comprehensive income 2,111 66,294
Comprehensive income attributable to:
Owners of the parent 1,834 59,875
Non-controlling interests 276 6,419
- 12 -
(3) NOTES TO CONSOLIDATED FINANCIAL STATEMENTS
(GOING CONCERN ASSUMPTION)
There are no matters to report under this item.
(SIGNIFICANT CHANGES IN SHAREHOLDERS’ EQUITY)
There are no matters to report under this item.
(SEGMENT INFORMATION)
I. Three months ended March 31, 2016
1. Information about sales and income or loss by reportable segment
(¥ millions)
Three months ended March 31, 2016
Reportable Segment
Others
(Note 1)
Adjustment
(Note 2)
Amount
recorded in
the quarterly
consolidated
statement of
income
(Note 3)
Integrated Beverages Pharmaceuticals
and
Bio-chemicals Japan Oceania Overseas
-other
Sales
Unaffiliated customers 235,963 113,349 41,987 86,914 5,665 – 483,880
Inter-segment 504 34 63 1,555 191 (2,347) –
Total sales 236,467 113,383 42,050 88,469 5,857 (2,347) 483,880
Segment income (loss) 1,166 17,077 (1,711) 9,299 655 (1,136) 25,351
Notes
1. “Others” includes food business, such as dairy products, and others.
2. The negative ¥1,136 million adjustment in segment income (loss) includes ¥184 million in inter-segment eliminations and
negative ¥1,320 million in corporate expenses not attributable to any reportable segment. The corporate expenses are mainly
group administrative expenses incurred in the Company, a pure holding company.
3. Segment income (loss) is reconciled to operating income in the consolidated statement of income.
II. Three months ended March 31, 2017
1. Information about sales and income or loss by reportable segment
(¥ millions)
Three months ended March 31, 2017
Reportable Segment
Others
(Note 1)
Adjustment
(Note 2)
Amount
recorded in
the quarterly
consolidated
statement of
income
(Note 3)
Integrated Beverages Pharmaceuticals
and
Bio-chemicals Japan Oceania Overseas
-other
Sales
Unaffiliated customers 231,429 97,321 48,962 89,337 5,086 – 472,137
Inter-segment 661 17 2 1,598 175 (2,455) –
Total sales 232,090 97,339 48,964 90,935 5,262 (2,455) 472,137
Segment income (loss) 7,819 12,918 1,235 15,482 643 (1,236) 36,863
Notes
1. “Others” includes food business, such as dairy products, and others.
2. The negative ¥1,236 million adjustment in segment income (loss) includes ¥83 million in inter-segment eliminations and negative
¥1,319 million in corporate expenses not attributable to any reportable segment. The corporate expenses are mainly group
administrative expenses incurred in the Company, a pure holding company.
3. Segment income (loss) is reconciled to operating income in the consolidated statement of income.
- 13 -
2. Information regarding loss on impairment of non-current assets, goodwill and others by reportable segment
There is no significant recognition or change during the period.
(ADDITIONAL INFORMATION)
(Application of the Revised Implementation Guidance on Recoverability of Deferred Tax Assets)
The Company applied the “Revised Implementation Guidance on Recoverability of Deferred Tax Assets” (ASBJ Guidance No. 26, March 28, 2016) from the three months ended March 31, 2017.

1
Supplementary Documents to the Consolidated Financial Statements
for the Three Months Ended March 31, 2017
1. Summary of Consolidated Statements of Income, Indices, etc.
2. Sales Details
3. Profit Details
4. Summary of Consolidated Balance Sheets
5. Other Information
KIRIN HOLDINGS COMPANY, LIMITED
April 28, 2017

2
1. Summary of Consolidated Statements of Income, Indices, etc.
(1) Summary of Statements of Income, Indices, etc.
(¥ billions)
Three months ended
March 31, 2017,
Actual
Three months ended
March 31, 2016,
Actual
Increase (decrease)
Sales 472.1 483.8 (11.7) (2.4%)
Gross profit 215.2 217.0 (1.8) (0.8%)
Selling, general and administrative expenses 178.3 191.6 (13.3) (6.9%)
Operating income 36.8 25.3 11.5 45.4%
Non-operating income 5.6 4.1 1.5 36.6%
Non-operating expenses 6.3 5.9 0.4 7.9%
Ordinary income 36.1 23.5 12.5 53.3%
Special income 3.7 7.1 (3.3) (47.1%)
Special expenses 2.3 2.1 0.1 8.5%
Income before income taxes and minority interests 37.6 28.5 9.0 31.5%
Income taxes 13.4 12.8 0.5 4.3%
Minority interests 5.9 5.2 0.6 12.8%
Net income 18.1 10.4 7.7 74.7%
Normalized EPS ¥29 ¥19 ¥10 52.6%
Sales (Excluding liquor tax) 414.3 426.5 (12.2) (2.9%)
Operating income (Prior to amortization of goodwill
etc.) 43.8 32.6 11.1 34.2%
Operating income ratio (Excluding liquor tax, prior to
amortization of goodwill etc.) 10.6% 7.7%
Normalized EBITDA 61.3 49.6 11.7 23.6%
EPS(Prior to amortization of goodwill etc.) ¥30 ¥22 ¥8 36.4%
Normalized EPS = Adjusted net income / Average number of shares outstanding during period
Adjusted net income = Net income + Amortization of goodwill etc. ± Special income or expenses after income taxes and
minority interests
Normalized EBITDA = Operating income + Depreciation + Amortization of goodwill + Dividends received from entities accounted for by the
equity method
3
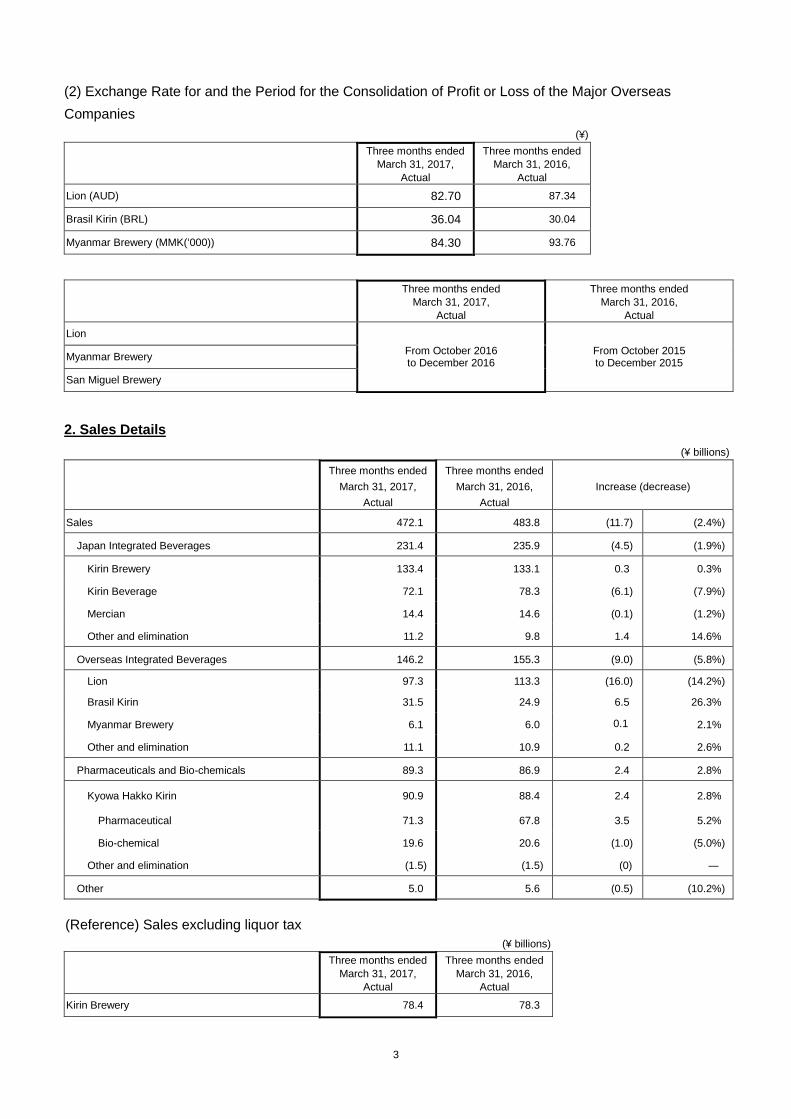
(2) Exchange Rate for and the Period for the Consolidation of Profit or Loss of the Major Overseas
Companies
(¥)
Three months ended
March 31, 2017,
Actual
Three months ended
March 31, 2016,
Actual
Lion (AUD) 82.70 87.34
Brasil Kirin (BRL) 36.04 30.04
Myanmar Brewery (MMK(‘000)) 84.30 93.76
Three months ended
March 31, 2017,
Actual
Three months ended
March 31, 2016,
Actual
Lion
From October 2016 to December 2016
From October 2015 to December 2015
Myanmar Brewery
San Miguel Brewery
2. Sales Details
(¥ billions)
Three months ended
March 31, 2017,
Actual
Three months ended
March 31, 2016,
Actual
Increase (decrease)
Sales 472.1 483.8 (11.7) (2.4%)
Japan Integrated Beverages 231.4 235.9 (4.5) (1.9%)
Kirin Brewery 133.4 133.1 0.3 0.3%
Kirin Beverage 72.1 78.3 (6.1) (7.9%)
Mercian 14.4 14.6 (0.1) (1.2%)
Other and elimination 11.2 9.8 1.4 14.6%
Overseas Integrated Beverages 146.2 155.3 (9.0) (5.8%)
Lion 97.3 113.3 (16.0) (14.2%)
Brasil Kirin 31.5 24.9 6.5 26.3%
Myanmar Brewery 6.1 6.0 0.1 2.1%
Other and elimination 11.1 10.9 0.2 2.6%
Pharmaceuticals and Bio-chemicals 89.3 86.9 2.4 2.8%
Kyowa Hakko Kirin 90.9 88.4 2.4 2.8%
Pharmaceutical 71.3 67.8 3.5 5.2%
Bio-chemical 19.6 20.6 (1.0) (5.0%)
Other and elimination (1.5) (1.5) (0) ―
Other 5.0 5.6 (0.5) (10.2%)
(Reference) Sales excluding liquor tax
(¥ billions)
Three months ended
March 31, 2017,
Actual
Three months ended
March 31, 2016,
Actual
Kirin Brewery 78.4 78.3
4
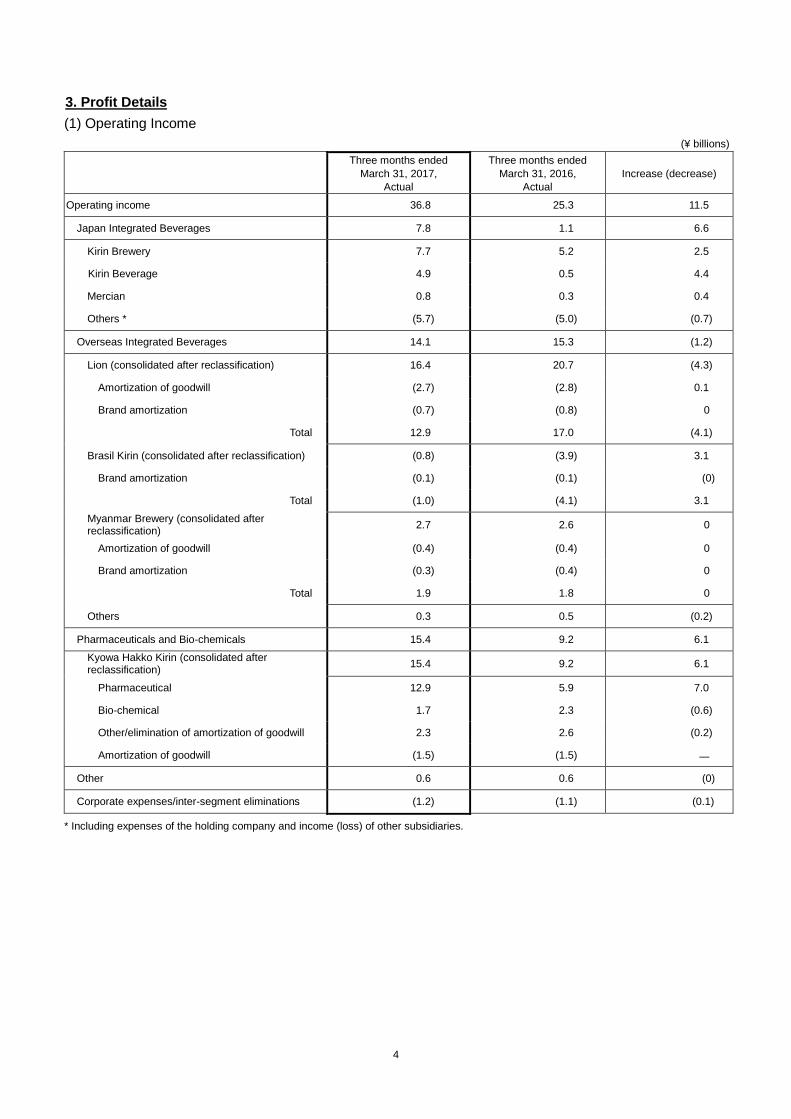
3. Profit Details
(1) Operating Income
(¥ billions)
Three months ended
March 31, 2017,
Actual
Three months ended
March 31, 2016,
Actual
Increase (decrease)
Operating income 36.8 25.3 11.5
Japan Integrated Beverages 7.8 1.1 6.6
Kirin Brewery 7.7 5.2 2.5
Kirin Beverage 4.9 0.5 4.4
Mercian 0.8 0.3 0.4
Others * (5.7) (5.0) (0.7)
Overseas Integrated Beverages 14.1 15.3 (1.2)
Lion (consolidated after reclassification) 16.4 20.7 (4.3)
Amortization of goodwill (2.7) (2.8) 0.1
Brand amortization (0.7) (0.8) 0
Total 12.9 17.0 (4.1)
Brasil Kirin (consolidated after reclassification) (0.8) (3.9) 3.1
Brand amortization (0.1) (0.1) (0)
Total (1.0) (4.1) 3.1
Myanmar Brewery (consolidated after reclassification)
2.7 2.6 0
Amortization of goodwill (0.4) (0.4) 0
Brand amortization (0.3) (0.4) 0
Total 1.9 1.8 0
Others 0.3 0.5 (0.2)
Pharmaceuticals and Bio-chemicals 15.4 9.2 6.1
Kyowa Hakko Kirin (consolidated after reclassification)
15.4 9.2 6.1
Pharmaceutical 12.9 5.9 7.0
Bio-chemical 1.7 2.3 (0.6)
Other/elimination of amortization of goodwill 2.3 2.6 (0.2)
Amortization of goodwill (1.5) (1.5) ―
Other 0.6 0.6 (0)
Corporate expenses/inter-segment eliminations (1.2) (1.1) (0.1)
* Including expenses of the holding company and income (loss) of other subsidiaries.
5
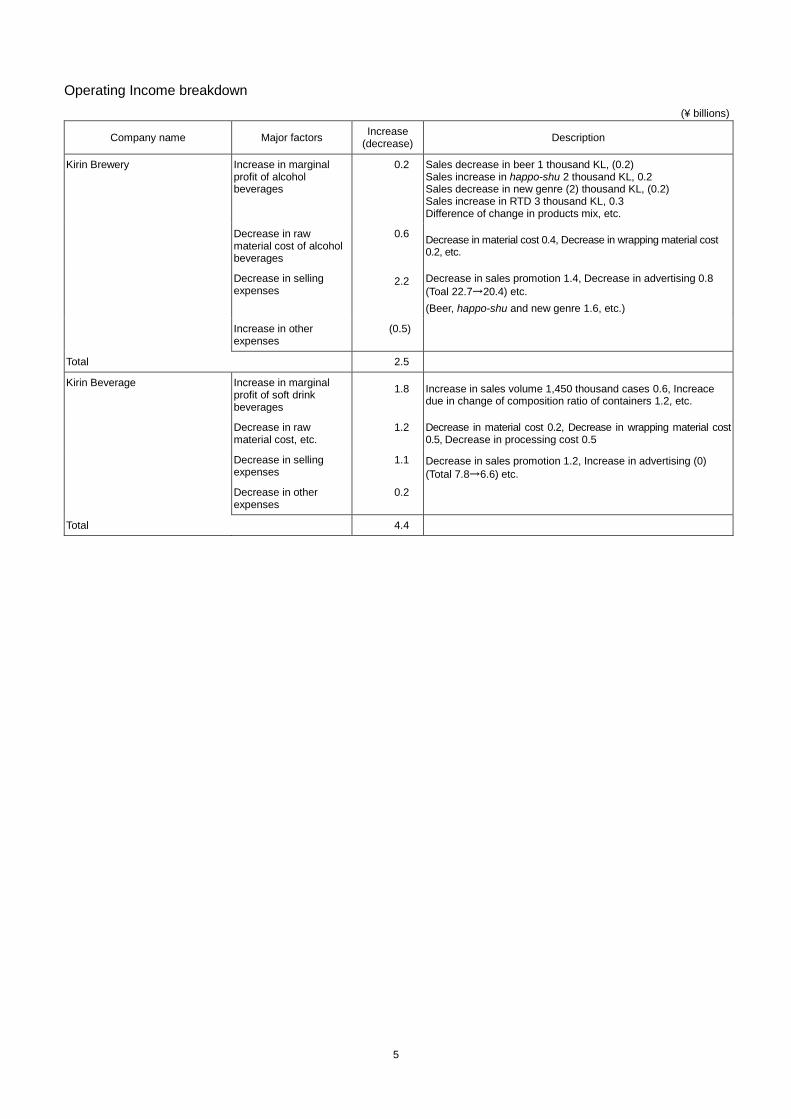
Operating Income breakdown
(¥ billions)
Company name Major factors Increase
(decrease) Description
Kirin Brewery Increase in marginal profit of alcohol beverages
0.2
Sales decrease in beer 1 thousand KL, (0.2) Sales increase in happo-shu 2 thousand KL, 0.2 Sales decrease in new genre (2) thousand KL, (0.2) Sales increase in RTD 3 thousand KL, 0.3 Difference of change in products mix, etc.
Decrease in raw material cost of alcohol beverages
0.6
Decrease in material cost 0.4, Decrease in wrapping material cost 0.2, etc.
Decrease in selling expenses
2.2
Decrease in sales promotion 1.4, Decrease in advertising 0.8
(Toal 22.7→20.4) etc.
(Beer, happo-shu and new genre 1.6, etc.)
Increase in other expenses
(0.5)
Total 2.5
Kirin Beverage Increase in marginal profit of soft drink beverages
1.8
Increase in sales volume 1,450 thousand cases 0.6, Increace due in change of composition ratio of containers 1.2, etc.
Decrease in raw material cost, etc.
1.2
Decrease in material cost 0.2, Decrease in wrapping material cost 0.5, Decrease in processing cost 0.5
Decrease in selling expenses
1.1
Decrease in sales promotion 1.2, Increase in advertising (0)
(Total 7.8→6.6) etc.
Decrease in other expenses
0.2
Total 4.4

6
(2) Ordinary Income and Net Income
(¥ billions)
Three months ended
March 31, 2017,
Actual
Three months ended
March 31, 2016,
Actual
Increase
(decrease) Description of changes
Non-operating income and expenses (0.7) (1.7) 1.0
Financial profit or loss, net (1.6) (2.4) 0.8
Equity in earnings or losses of affiliates 3.2 1.8 1.3
San Miguel Brewery 3.7 2.2 1.5 Equity in earnings or losses of local affiliates 1.4, etc.
Others (0.5) (0.3) (0.1)
Foreign exchange gains and losses (1.8) (0.4) (1.4)
Other (0.4) (0.7) 0.3
Ordinary income 36.1 23.5 12.5
Special income and expenses 1.4 5.0 (3.5)
Special income 3.7 7.1 (3.3)
Gain on sale of property, plant and equipment and intangible assets
0.7 5.2 (4.4)
Gain on sale of investment securities 0.1 0.3 (0.1)
Gain on sales of shares of subsidiaries and affiliates
2.4 ― 2.4
Other 0.3 1.5 (1.1)
Special expenses (2.3) (2.1) (0.1)
Loss on disposal of property, plant and equipment and intangible assets
(0) (0.6) 0.5
Loss on sale of property, plant and equipment and intangible assets
(0) (0.2) 0.1
Loss on impairment ― (0) 0
Loss on sale of investment securities (0) ― (0)
Gain on sales of shares of subsidiaries and affiliates
(0.1) ― (0.1)
Business restructuring expense (0.9) (0.6) (0.3)
Other (1.0) (0.6) (0.4)
Income taxes (13.4) (12.8) (0.5)
Minority interests (5.9) (5.2) (0.6)
Net income 18.1 10.4 7.7

7
4. Summary of Consolidated Balance Sheets
(¥ billions)
As of
March 31, 2017
As of
December 31, 2016
Increase
(decrease) Description of changes
Current assets 685.7 748.1 (62.3)
Cash and time deposits 70.9 58.9 11.9
Notes and accounts receivable, trade 324.8 393.5 (68.6) Decrease due to the year-end of previous year being a bank holiday, etc. Inventories 206.9 207.6 (0.6)
Other 83.0 88.0 (5.0)
Non-current assets 1,615.0 1,600.0 14.9
Property, plant and equipment 718.3 705.2 13.1
Intangible assets 401.4 401.9 (0.4)
Goodwill 233.1 228.9 4.2
Other 168.2 172.9 (4.6)
Investments and other assets 495.2 492.9 2.3
Total assets 2,300.7 2,348.1 (47.3)
Current liabilities 662.1 650.3 11.7
Notes and accounts payable, trade 114.2 135.8 (21.5)
Interest-bearing debt 251.7 134.9 116.7 Increase due to replacement of long-term bonds with short-term ones, etc.
Other 296.2 379.6 (83.3) Decrease in liquor taxes payable due to the year-end of previous year being a bank holiday, etc.
Non-current liabilities 652.9 751.7 (98.7)
Interest-bearing debt 422.3 513.7 (91.3) Decrease due to replacement of long-term bonds with short-term ones, etc.
Other 230.5 237.9 (7.4)
Total liabilities 1,315.1 1,402.0 (86.9)
Shareholders’ equity 728.4 728.9 (0.4)
Accumulated other comprehensive income (6.6) (48.2) 41.6 Increase in foreign currency transaction adjustments due to exchange rate changes
Subscription rights to shares 0.5 0.5 0
Minority interests 263.2 264.8 (1.5)
Total net assets 985.6 946.0 39.5
Total liabilities and net assets 2,300.7 2,348.1 (47.3)

8
5. Other Information
(1) Profit or Loss of Major Publicly-Listed Consolidated Companies (Consolidated after Reclassification)
Three months ended March 31, 2017, Actual
<Consolidated subsidiaries>
(¥ billions)
Sales Operating income Ordinary
income Net income
Consolidated
net income
Kyowa Hakko Kirin 90.9 14.7 13.6 8.4 4.4
Elimination of amortization of goodwill 2.3 2.3 2.3 1.2
Amortization of goodwill (1.5) (1.5) (1.5) (1.5)
Total included in consolidation 90.9 15.4 14.4 9.2 4.1
<Equity-method affiliates>
(¥ billions)
Sales Operating
income
Ordinary
income Net income
Consolidated
net income
San Miguel Brewery 62.9 19.0 17.5 11.8 5.7
Equity in earnings or losses of local
affiliates 5.7 5.7 5.7
Brand amortization (0.4) (0.4) (0.4)
Amortization of goodwill (1.5) (1.5) (1.5)
Total included in consolidation 3.7 3.7 3.7
(2) Sales Details of Major Business Companies
a. Kirin Brewery
Three months ended March 31, 2017 Three months ended March 31, 2016
Actual Increase (decrease) Actual Increase (decrease)
Breakdown of sales ¥ billions % ¥ billions %
Beer 49.6 (1.1) 50.1 (1.8)
Happo-shu 29.4 1.7 28.9 (11.5)
New genre 27.8 (2.0) 28.4 (18.5)
Sub-total 106.9 (0.6) 107.6 (9.4)
RTD 18.3 4.5 17.5 7.0
Whiskey and Spirits, etc. 8.1 2.4 7.9 18.3
Total sales 133.4 0.3 133.1 (6.2)

9
b. Kirin Beverage Group
Three months ended March 31, 2017 Three months ended March 31, 2016
Actual Increase (decrease) Actual Increase (decrease)
Category 10,000 cases % 10,000 cases %
Black tea 1,282 7.0 1,198 9.8
Japanese tea 608 39.1 437 27.4
Coffee 732 1.0 725 11.2
Fruit and vegetable juice 510 (7.3) 550 6.2
Carbonated beverage 387 (12.2) 441 9.2
Functional beverage 157 31.9 119 10.2
Water 809 (6.4) 864 18.7
Other 293 (2.0) ※299 (9.4)
Total 4,778 3.1 4,633 11.0
Container Type
Can 912 (0.5) 917 18.3
Large-sized PET bottles (2L, 1.5L, etc.) 1,489 0.3 1,485 14.0
Small-sized PET bottles (500ml, 280ml, etc.) 1,953 8.5 1,800 8.7
Other 424 (1.6) ※431 (2.0)
Total 4,778 3.1 4,633 11.0
※The above sales volume excludes contract manufacturing of subsidiaries excluded from the consolidation scope in 2017.


![Kirin Holdings Company, Limited Corporate Governance Report · Kirin Holdings Company, Limited ... [Reasons for Non-compliance with the Principles of the Corporate Governance Code]](https://static.fdocuments.in/doc/165x107/5ac008907f8b9add5f8e7256/kirin-holdings-company-limited-corporate-governance-holdings-company-limited-.jpg)