Kiribati STEPS REPORT - · PDF fileThe Kiribati STEPS report shows that:
111
Transcript of Kiribati STEPS REPORT - · PDF fileThe Kiribati STEPS report shows that:

Kiribati
NCD Risk Factors STEPS REPORT
Printed in Suva, Fiji May, 2009
Acknowledgements The Kiribati NCD Risk Factors STEPS REPORT (referred as “the Report”) is a record of a combined effort of several organizations and individuals. We would like to acknowledge each organization and everyone’s contributions, dedication and determination in completing the survey and finalizing the Report. The Report is a collaborative effort between the Kiribati Ministry of Health and Medical Services, World Health Organization, the Fiji School of Medicine and the Centre for Physical Activity and Health, University of Sydney. The Report Compiled by: Ms Tinai Iuta (MHMS), Dr Philayrath Phongsavan (CPAH), Dr Li Dan (WHO, Suva), Ms Leanne Riley (WHO, Geneva), Dr Airambiata Metai (MHMS), Mr Shalvindra Raj (WHO, Suva), Dr Jan Pryor (USA) and Ms Shakila Naidu (UNICEF). Appreciation is extended to the Hon. Minister for Health and Medical Services, Dr Kautu Tenaua; the Permanent Secretary, Ms Reina Timau; and the Acting Director for Public Health Services, Dr Revite Kirition for their leadership and support of the NCD STEPS work in Kiribati. A special thank is made to the country staff of the STEPS survey (see Appendix 3 of the Report). Grateful acknowledgement is made to the World Health Organization and its staff, to Dr Chen Ken (WHO Office in Suva) for his great support, to Dr Linda Milan, Dr Cherian Varghese (WHO Office in Manila) for their support. Thanks are due to the Fiji School of Medicine for Dr Jan Pryor and Ms Shakila Naidu as the research consultants for the Kiribati STEPS survey. We acknowledge the statistical support and result generation provided by Ms Leanne Riley, Ms Melanie Cowan, Ms Regina Guthold (WHO Office in Geneva) and Mr Shalvindra Raj who made substantial contribution to the completion of data analyses. Ms Taivuna Bulamaibau (WHO Office in Suva) and Ms Teretia Baraniko (WHO Office in Tarawa) provided administrative support to the finalization of the Report. The Kiribati STEPS survey and the Report were funded by the Australian Agency for International Development (AusAID), New Zealand Agency for International Development (NZAID) and WHO. The Ministry of Health and Medical Services, Kiribati provided contribution-in-kind. Dr Philayrath Phongsavan (Centre for Physical Activity and Health, University of Sydney) drafted the first version of the Report, working closely with WHO Office in Suva. Ms Leanne Riley, Dr Li Dan, Dr Graham Roberts (the Fiji School of Medicine), Dr Cherian Varghese, Mr Shalvindra Raj and Ms Melanie Cowan have conducted technical reviews for the Report. The country consultation held in Tarawa, Kiribati was attended by Hon. Kautu Tenaua, Ms Reina Timau, Dr Revite Kirition, Dr Airambiata Metai, Ms Tinai Iuta, Ms Pamela Ann Messervy (WHO Office in Tarawa) and Dr Li Dan. Dr Li Dan, Dr Graham Roberts and Dr Philayrath Phongsavan are the final technical and editorial reviewers of the Report. WHO Office in Suva arranged the printing, on behalf of the Kiribati Ministry of Health and Medical Services.
2

CONTENTS
FOREWORD 8EXECUTIVE SUMMARY 12 1. INTRODUCTION 151.1 Background and Rationale 151.2 The National Context 151.2.1 Geography 151.2.2 Population and Living Environment 161.2.3 Government, Culture and the Economy 16
1.2.4 Noncommunicable Disease Health Status and Health Infrastructure 16
1.3 Developing WHO STEPS Survey in Kiribati 17 2. OBJECTIVES 17 3. METHODOLOGY 173.1 Survey Structure 173.2 Survey Sampling Methodology 183.3 Sample Size 183.4 Data Collection Procedures 193.5 Data Collection Process 203.5.1 Registration of Participants 203.5.2 Step 1 - Behavioural Risk Factors Interviews 203.5.3 Step 2 - Physical Measurements 213.5.4 Step 3 - Biochemical Measurements 223.5.5 Check-out Station and Counselling 233.6 Data Management and Analyses 233.6.1 Data Entry 233.6.2 Data Weighting and Analysis 23 4. RESULTS 244.1 Characteristics of Survey Population 244.2 Tobacco Use 244.3 Alcohol Consumption and Kava Use 274.4 Intake of Fruit and Vegetables 314.5 Physical Activity 334.5.1 Measurements 334.5.2 Analyses 334.5.3 Levels of Physical Activity 344.6 Overweight and Obesity 374.6.1 Height and Weight 374.6.2 Body Mass Index Categories 374.6.3 Waist Circumference 39
3

4
4.7 Blood Pressure and Hypertension 394.8 Fasting Blood Glucose and Diabetes 414.9 Total Cholesterol 424.10 Combined Risk Factors 43 5. DISCUSSION AND CONCLUSIONS 44 6. RECOMMENDATIONS 46 APPENDICES 47Appendix 1 Kiribati STEPS Survey Questionnaire 48Appendix 2 The Whole Data Book of the Kiribati STEPS Survey 56Appendix 3 List of STEPS Survey Staff from Kiribati 107Appendix 4 References 108 KEY CONTACTS
LIST OF FIGURES
Figure 1 The WHO STEPwise approach to surveillance of NCDs 17Figure 2 Survey sampling methodology and sampling frame 18Figure 3 Flow chart of data collection activities 19
LIST OF TABLES
Table A Sample size for selected areas 18Table 1 Age distribution of survey population by gender 24Table 2 Mean number of years of education by gender and age group 24Table 3 Percentage of current smokers in the study population 25Table 4 Current smoking status among men in the study population by age
group 25
Table 5 Current smoking status among women in the study population by age group 25
Table 6 Current smoking status among both sexes in the study population by age group 26
Table 7 Mean age started smoking among current daily smokers 26Table 8 Mean number of years of smoking among current daily smokers 26Table 9 Percentage of current daily smokers who smoke manufactured
cigarettes 27
Table 10 Percentage of alcohol consumption among men during the past 12 months by age group 27
Table 11 Percentage of alcohol consumption among women during the past 12 months by age group 28
Table 12 Percentage of alcohol consumption among both sexes during the past 12 months by age group 28
Table 13 Frequency (days) and quantity of drinks consumed in the last 7 days by current (last 30 days) drinker among men 28
Table 14 Number of standard drinks per day among male current drinkers by age group 29
Table 15 Number of standard drinks per day among female current drinkers by age group 29
Table 16 Number of standard drinks per day among current drinkers by age group 29
Table 17 Percentage of kava consumption among men during the past 12 months by age group 30
Table 18 Percentage of kava consumption among women during the past 12 months by age group 30
Table 19 Percentage of kava consumption among both sexes during the past 12 months by age group 30
Table 20 Mean number of days fruits consumed in a typical week by gender and age group 31
Table 21 Mean number of days vegetables consumed in a typical week by gender and age group 31
Table 22 Mean number of servings of fruits consumed on a day when fruits were eaten 32
Table 23 Mean number of servings of vegetables consumed on a day when vegetables were eaten 32
Table 24 Mean number of combined servings of fruit and vegetables consumed per day of the week 32
Table 25 Percentage who consumed less than five combined servings of fruit and vegetables per day of the week 33
Table 26 Categories of total physical activity among men by age group 34Table 27 Categories of total physical activity among women by age group 34
5

Table 28 Categories of total physical activity among both sexes by age group 35Table 29 Mean minutes of total physical activity (mean METminutes per day)
by gender and age group 35
Table 30 Mean minutes of work-related physical activity (mean METminutes per day) by gender and age group 36
Table 31 Mean minutes of transport-related physical activity (mean MET- minutes per day) by gender and age group 36
Table 32 Mean minutes of recreation-related physical activity (mean MET- minutes per day) by gender and age group 36
Table 33 Mean height (cm) by gender and age group 37Table 34 Mean weight (kg) by gender and age group 37Table 35 Mean body mass index (kg/m2) by gender and age group 38Table 36 Body mass index classifications among men by age group 38Table 37 Body mass index classifications among women by age group 38Table 38 Body mass index classifications among both sexes by age group 38Table 39 Percentage of obesity (BMI ≥30 kg/m2) by gender and age group 39Table 40 Mean waist circumference (cm) by gender and age group 39Table 41 Mean resting systolic blood pressure (mmHg) by gender and age
group 40
Table 42 Mean resting diastolic blood pressure (mmHg) by gender and age group 40
Table 43 Percentage with hypertension (SBP≥140 and/or DBP ≥ 90 mmHg or currently on medication for raised blood pressure) 41
Table 44 Mean fasting blood glucose (mmol/L) by gender and age group 41Table 45 Prevalence of diabetes by gender and age group (Raised blood
glucose or currently on medication for diabetes and/or diagnosed with diabetes)
42
Table 46 Mean total blood cholesterol (mmol/L) by gender and age group 42Table 47 Percentage with raised total blood cholesterol (≥5.0 mmol/L or ≥190
mg/dl) 43
Table 48 Percentage of noncommunicable disease risk categories among men by age group 44
Table 49 Percentage of noncommunicable disease risk categories among women by age group 44
Table 50 Percentage of noncommunicable disease risk categories among both sexes by age group 44
6

7
LIST OF ABBREVIATIONS
BMI Body Mass Index BP Blood Pressure CHD Coronary Heart Disease CI Confidence Interval CVD Cardiovascular Disease DBP Diastolic Blood Pressure DM Diabetes Mellitus FBS Fasting Blood Sugar HTN Hypertension MET Metabolic equivalent mg/dl Milligrams per decilitre (unit of blood chemistry values) mmHg Millimetres of mercury (unit of blood pressure measurement) mmol/L Millimoles per litre (unit for blood chemistry values) NCD Noncommunicable disease PICs Pacific island countries and areas SBP Systolic Blood Pressure WHO World Health Organization

FOREWORD
Noncommunicable diseases (NCDs), including diabetes, cardiovascular diseases and cancer have become a high disease burden in most of the countries in the world. In order to address this growing problem, accurate information about the risk factors that contribute to the development of NCDs is needed. A “risk factor” is any characteristic or exposure that increases a person’s likelihood of developing a NCD. Risk factors include smoking, alcohol use, physical inactivity, obesity, high blood pressure, a raised level of blood glucose or cholesterol, and an unbalanced diet.
To increase our capacity to undertake population risk surveillance, the Ministry of Health and Medical Services, Kiribati (MHMS) joined forces with WHO and other partners to undertake a national NCD Risk Factors STEPS Survey. The STEPS survey has been specifically designed by WHO to assess the prevalence of the common NCDs and their risk factors in a country. The STEPS survey provides important information to develop and implement NCD plans and programs to address the growing epidemic of NCDs. Furthermore, the survey provides a firm foundation for an ongoing surveillance for NCDs and their various risk factors.
This report is the result of the STEPS survey carried out in Kiribati. It shows high prevalence of NCDs and their risk factors among our population and suggests actions to: control and prevent NCDs; provide a supportive physical environment and infrastructure, and improve health service delivery.
This is the first population-based national survey on the prevalence of the NCD risk affecting our population. It represents a milestone in our efforts to address the increasing NCD epidemic affecting our people and marks an increased commitment by MHMS to tackle the NCD challenge. The survey results will enable us to develop more effective health policies and programs in primary and secondary NCD prevention and in monitoring and evaluating our ongoing efforts in NCD prevention.
The WHO STEPS survey in Kiribati would not have been possible without the vision and leadership of our predecessors, the Honorable Bauro Tongai, former Minister of Health and Medical Services and Dr Airambiata Metai, former Acting Director Public Health. Their determination enabled this important survey to be given priority in MHMS.
The Kiribati STEPS survey involved intensive work, long days, and persistence and dedication from the Kiribati team that undertook the survey. We owe each of them our sincere appreciation.
8

We also wish to thank all the supporting staff in MHMS and our partners - the Fiji School of Medicine for its supervision of the survey team, AusAID for its financial support and WHO for its strong technical support.
This report is dedicated to the hard work and commitment of all those involved from the inception to the completion of the NCD Risk Factors STEPS survey in Kiribati.
The findings and recommendations in this report will guide our actions for improving health for all.
Dr Kautu Tenaua Ms Reina Timau Minister for Health and Medical Services Permanent Secretary Republic of Kiribati Ministry of Health and Medical Services Republic of Kiribati
9

Noncommunicable Diseases (NCDs) are a leading cause of death in Pacific island countries and areas, accounting for approximately 75% of all deaths. Pacific island health ministers have given high priority to NCD prevention, control and surveillance. The WHO STEPwise Approach to Surveillance of Risk Factors for NCDs (STEPS) is a WHO surveillance tool for chronic disease risk factors and chronic disease-specific morbidity and mortality to be used at national level. To date, 106 countries and territories throughout the world have used the WHO national STEPS tool. The STEPS approach gathers information on key risk factors in a representative sample of the population using interviews and questionnaires, obtaining simple physical measurements, and collecting blood samples for biochemical assessment. The data gathered enables Governments to put emphasis in the right place when planning and implementing activities to reduce NCD risk factors such as tobacco use, obesity, high blood pressure, diabetes, and physical inactivity. National STEPS results can also be used to evaluate the impact of NCD interventions, monitor national trends and judge a country's overall performance by comparing results with other countries. The publication of the “Kiribati NCD Risk Factors STEPS REPORT” is a milestone for Kiribati: to provide scientifically sound national data which will assist the government in addressing this emerging public health problem in Kiribati. The Kiribati STEPS report shows that:
• 59.0% of the population smoked tobacco daily. • 71.8% of men drank 5 or more standard drinks, 49.2% of women drank 4 or more standard
drinks on any day in the past week. • 99.3% of the population consumed less than five combined servings of fruit and vegetables
per day. • 50.1% of the population was with low level of physical activity. • 81.5% of the population was overweight, 50.6% was obese. • 28.1% of the population was diabetic.
10

The comprehensive assessment of combined risk factors shows that overall 74.6% of the Kiribati population are at high risk of NCDs with men and women between the age of 45 to 64 being a particular concern. Only 0.1% of the population aged 25-64 years in Kiribati was of low risk to NCDs. Effective primary prevention activities to reduce smoking, promote healthy diets, improve physical inactivity and reduce alcohol consumption can reduce the risk of NCDs and need to be scaled in Kiribati to reduce diseases such as diabetes, heart disease, stroke and cancer. Secondary prevention activities also need to be strengthened to prevent complications and disabilities of NCDs such as amputation resulting from diabetes. WHO through its offices in Tarawa, Suva, Manila and Geneva is honoured to have worked with the following partners to complete the survey and this publication: the Ministry of Health and Medical Services, Kiribati; the Fiji School of Medicine; the Centre for Physical Activity and Health, the University of Sydney; the Australian Agency for International Development and New Zealand Agency for International Development.
Dr Chen Ken Ms Pamela Ann Messervy World Health Organization Representative World Health Organization Country Liaison Officer in the South Pacific for Kiribati
11

EXECUTIVE SUMMARY The Kiribati NCD STEPS survey provides a snapshot on the state of noncommunicable diseases and their risk factors among I-Kiribati (the People of Kiribati). The data are based on a national representative population-wide sample of I-Kiribati. The survey was carried out in South Tarawa and the four outer islands of Butaritari, Makin, Onotoa and Beru from May, 2004 to Sept., 2006. The key objectives of the STEPS survey were:
• To document the prevalence and magnitude of key NCDs among adults • To document the prevalence and magnitude of major modifiable risk factors for NCDs
including tobacco use, excessive alcohol consumption, poor eating patterns, physical inactivity, obesity, high blood pressure, raised blood glucose and cholesterol
• To compare NCDs and their risk factors across different age groups and between men and women.
A total of 1755 individuals (response rate of 88%) participated in the survey. In this report, we presented data for those aged 25-64 years, following the standard age group reporting for WHO STEPS surveys. Additional results for respondents aged 15-24 years were also described in some details at the end of each section of behavioural risk factors of this report. Behavioural risk factors Overall, the prevalence of current smokers was 61.3%. The majority of men (75.7%) were current smokers as compared to just under half (48.3%) of women. Among current smokers, 59.0% smoked daily, with a gender difference of 74.0% of men and 45.4% of women. The mean age at which smoking started was 19.1 years; men started smoking at a marginally younger age than women, 18.2 years and 20.5 years, respectively. Overall, 25.5% of the I-Kiribati adult population had consumed alcohol in the past 12 months (defined as current drinkers). A significant gender difference of 46.9% of men and 6.1% of women current drinkers was observed. Generally, there were higher proportions of male than female drinkers across all age groups. Among male current drinkers, 71.8% reported ‘binge drinking’, that is, drinking 5 or more standard drinks on any day in the past week. The highest proportion of binge drinking among men was in the 25-34 years age group. An estimated 21.6% of male current drinkers also reported drinking 20 or more drinks in the past week. Among female current drinkers, 49.2% drank 4 or more standard drinks on any day in the past week. The overall prevalence of ever tried kava (kawa or nangkona) in the past 12 months was 23.2%. There was a substantial gender difference in kava consumption behaviour with 43.7% of men and only 4.6% of women having tried kava. Generally, kava drinking was more common among men and women aged 25-44 years. This survey showed that average consumption of fruit and vegetables among I-Kiribati was well below the recommended levels. The mean number of days per week fruit and vegetables were consumed were 1.5 and 1.9 days, respectively. When fruit and vegetables were consumed on those days, the self-reported mean number of combined fruit and vegetables servings was 0.8 serves. The overall prevalence of those consuming less than 5 combined servings of fruit and vegetables per day was 99.3%. The survey found that 50.1% of I-Kiribati reported low level of total physical activity, that is, engaged in physical activities of less than 600 METminutes per week. 600 METminutes per week are equivalent to 30 minutes of moderate-intensity physical activity for 5 days per week, or 20 minutes of vigorous activity for 3 days per week. A greater proportion of women (57.3%) undertook low level of physical activity compared to men (41.8%). Conversely, a higher proportion of men reported high level of total physical activity (>1500 METminutes per week) compared to women, 30.1% and 16.6%,
12
respectively. 1500 METminutes per week are equivalent to 1 hour of vigorous physical activity for 3 days per week. The total physical activity performed during work, transport and leisure time averaged 83.3 minutes/day for men and 56.8 minutes/day for women. Work-related physical activities comprised 48.0 minutes/day for men and 31.5 minutes/day for women; transport-related physical activities averaged 28.4 minutes/day for men and 22.5 minutes/day for women, and; leisure-related physical activities averaged 6.8 minutes/day for men and 2.8 minutes/day for women. Thus, most physical activity in Kiribati was undertaken as part of work, and to a lesser extent, as part of transport. Leisure-time physical activity contributed very little to the total time spent in physical activity. Physical risk factors The overall prevalence of overweight (BMI ≥25kg/m2) was 81.5%, and of obesity (BMI ≥30kg/m2) was 50.6%. Among women, 84.6% were overweight with 58.9% of these being obese. Among men, 78.2% were overweight with 41.7% being obese. An estimated 18.0% of the proportion of I-Kiribati had a normal body mass index (18.5 ≤ BMI ≤ 24.9): 14.8% of women and 21.6% of men. Mean waist circumference for women was significantly higher than men, 97.3 cm and 94.2 cm, respectively. Women in all age groups had mean waist circumference values exceeding 80 cm, a cut-off value for women considered to increase their cardiovascular disease risks. The survey found an estimated 17.3% of I-Kiribati had hypertension (defined as having SBP ≥140 mmHg and/or DBP ≥90 mmHg or on medication for raised blood pressure). While raised blood pressure increased with increasing age, this condition was more common among men than women. Biochemical risk factors Based on measures of fasting capillary whole blood, the overall prevalence of diabetes (fasting glucose level ≥6.1 mmol/L or on medication for raised blood glucose) among I-Kiribati aged 25-64 years was 28.1%, with a slightly higher rate among men (29.6%) as compared to women (26.7%). Overall, 27.7% of the population of I-Kiribati was found to have elevated total blood cholesterol level exceeding 5.0 mmol/L (≥190 mg/dl). The prevalence for men was 23.8% and for women was 30.6%. Combined risk factors As the number of NCD risk factors an individual has increases, so does his or her risk of developing a particular chronic condition. For this report, the surveyed population was classified into three NCD risk categories: high (with 3-5 risk factors), moderate (with 1-2 risk factors) or low risk (with no risk factor). The combined NCD risk factors included in the computation of NCD risk categories were current daily smokers, overweight (BMI ≥25 kg/m2), raised blood pressure (SBP ≥140 and/or DBP≥90 mmHg or currently on medication), consuming less than five combined servings of fruit and vegetables per day, and low level of physical activity (<600 METminutes per week). This survey found that only 0.1% of the population of I-Kiribati had zero risk factor for NCDs, compared with 25.4% at moderate risk and 74.6% at high risk. By aged 25-44 years, the majority of I-Kiribati (72.7%) already reported having 3 or more risk factors. The proportions were highest in the 45-64 years age group for both men (80.4%) and women (77.7%). Conclusion The Kiribati STEPS survey represents a significant step forward in gathering national representative and population-wide information for informing health planning services for the prevention, control and management of NCDs. The survey has provided strong evidence that NCDs and related modifiable risk factors are prevalent in Kiribati, with the majority of adults being at heightened risk of developing chronic conditions. In this context, the following recommendations are outlined as priority actions in Kiribati:
13

Addressing policy, organizational and environmental factors • Increase resources to implement the WHO Framework Convention on Tobacco Control.
• Generate resources to national health institutions.
• Develop policies supporting importation of healthy foods.
• Improve availability of fruit and vegetables.
• Develop policies to establish physical activity-friendly environments.
• Increase the capacity of the healthcare system for early detection and management of individuals with chronic diseases.
• Establish sustainable government funding mechanism and health infrastructure to support NCD strategy implementation and monitoring.
• Develop NCD related coalitions, networks and partnerships, e.g., Kiribati NCD Working Committee, Kiribati National Food and Nutrition Committee, for preventing and managing NCDs.
Addressing NCD behavioural risk factors • Comprehensive anti-smoking campaigns to reduce smoking rates across all age groups and in
both genders, particularly targeting the younger age groups to prevent smoking uptake.
• Comprehensive smoking cessation programs to reduce smoking rates across all age groups in both genders.
• Comprehensive health promotion campaigns to reduce alcohol (and at-risk kava) consumption, particularly targeting binge drinking among men.
• Comprehensive health promotion campaigns promoting the recommended levels of fruit and vegetable consumption across all age groups and in both genders, and increasing public awareness of the adverse effects of excessive consumption of high-fat, high-salt, and high-sugar foods.
• Develop and implement cultural-appropriate programs to promote daily incidental physical activity and encourage more moderate-intensity physical activity in all age groups, particularly among women.
• Public health programs to emphasize reduction in the prevalence of the five critical NCD risk factors (current daily smoking, being overweight or obese, having raised blood pressure, eating less than five combined servings of fruit and vegetables per day, and having a low level of physical activity).
Establishing a coordinated approach to noncommunicable disease management system
• Increase public awareness of the importance of regular monitoring and screening of blood pressure, blood cholesterol and blood sugar level.
• Establish and/or strengthen existing coordinated care and management of individuals with diagnosed chronic conditions, including providing a system of integrated care across multiple providers (primary health care and clinical care) and multiple chronic conditions that will reduce length of hospitalization and improving quality of life.
• Establish a coordinated NCD program supporting chronic disease care, including supporting patient self-management, self-monitoring of conditions, medications and lifestyle changes.
Maintaining quality surveillance and public health information
• Establish strong leadership and secure political and financial commitments to maintain a systematic and rigorous approach to national STEPS data collection – supported by workforce trained in implementing the survey, infrastructure and financial capacity - on an ongoing basis that will evolve to a robust STEPS surveillance system in Kiribati.
14

1. INTRODUCTION 1.1 Background and Rationale Countries across a broad spectrum of economic development are experiencing an unprecedented rise in noncommunicable diseases (NCDs)1 including cardiovascular conditions such as heart disease and stroke, Type 2 diabetes, some cancers, and chronic respiratory conditions. The NCDs affect all levels of socioeconomic and ethnic groups and have been estimated to account for approximately 60% of all deaths globally. It has also been estimated that around 80% of NCD-related deaths occur in low- and middle-income countries2. In the Western Pacific Region, the NCD conditions are contributing to a large share of death and disability3, with significant social and economic consequences on all levels of the society. Timely and valid surveillance of data relating to the magnitude and extent of NCDs and their risk factors are critical for informing healthcare spending, and for developing appropriate preventive public health programs to respond effectively to the growing burden of NCDs. As part of the regional and global effort to meet the emerging challenges posed by the NCD epidemics, the World Health Organization (WHO) is supporting a number of Pacific island countries and areas (PICs) to implement country-wide STEPwise approach to surveillance of NCD risk factors4. Countries implementing the STEPS surveys agreed to use standardised STEPS measures and protocols for assessing the following core NCD risk factors: tobacco use, alcohol consumption, fruit and vegetable consumption, physical activity, measured height, weight, waist, and blood pressure. Depending on needs and resources biochemical indicators such as fasting blood cholesterol and blood sugar level are also collected. Self-report and objective methods are used to collect the information. To facilitate between-country comparability, countries follow a standardised survey methodology, ask a core set of questionnaire items, and use similar technical materials and measurement protocol to support the planning and data collection activities. Countries also have the option of adding additional questionnaire items depending on local relevance and resource availability; these can include assessing kava consumption for example. Countries are also encouraged and supported to repeat the STEPS surveys to enable monitoring of NCD status over time. 1.2 The National Context 1.2.1 Geography The Republic of Kiribati 1 is an island nation with a total land area of 811km2 shared across approximately 33 low-lying coal atolls. Kiribati is considered to be one of the smallest island nations in the world. However, Kiribati is also considered to be the largest atoll country in the world, with its Exclusive Economic Zone spreading across 3.5 million km2 in the Central Pacific Ocean, and straddling the Equator. Being one of the most physically remote island countries make transportation and telecommunications within country and with the rest of the world time consuming, difficult and expensive. The 33 atolls of Kiribati are divided into three island groups: the Gilbert Islands (including Banaba), the Phoenic Islands, and the Line Islands. Most of the islands are vulnerable to sea level rising because they are low-lying and flat.
1 Formerly the Gilbert Islands.
15
1.2.2 Population and Living Environment The majority of the 93,000 (UN 2008 est.) inhabitants of Kiribati2 are Micronesians. Kiribati is the ethnic language but English is the official language; both are widely spoken in the country. 53% of the population is Roman Catholic, followed by 41% of Protestant and other religious groups (6%). Population growth rate in Kiribati is approximately 1.9% per annum (WHO est.). However, in recent years there has been significant in-migration of people from the outer islands to the capital island of South Tarawa looking for employment opportunities. Consequently, around half of the population now lives in the capital atoll. This has resulted in an urban population growth rate of 5.2% in South Tarawa, placing great stress on the natural resources and the infrastructure of an already overcrowded island. The demographic profile of Kiribati is typical of a developing country; around 35% of the population is aged under 15 years and only 5% are aged over 64 years (WHO). 1.2.3 Government, Culture and the Economy The Kiribati government is made up of a two-tier system: central and local government levels. The central government comprises 42 democratically elected members led by the President. The local government level consists of 23 elected Councils located in three urban areas and 20 in the outer islands. The Kiribati people place great value on family and community connectedness. Sharing goods and living spaces along the kinship lines is an important cultural practice. Consequently, large households containing extended families are not uncommon in Kiribati. Each village or community is built around a traditional maneaba or meeting place – usually a rectangular building with a thatched roof and no walls. Cultural ceremonies and village events take place in the maneaba. Churches provide the focus of community social activities. The government is regarded as the key provider of health and education services.
Kiribati has a low capita gross national product (GNP of less than US$1000), coupled with weak infrastructure and limited human resources, is classified as a least-developed country. The primary sources of income are fishing license revenues, grants and loans, and workers’ remittances. 1.2.4 Noncommunicable Disease Health Status and Health Infrastructure The average life expectancy at birth in Kiribati was estimated at 58.9 for men and 63.1 for women (2005 WHO est.). While respiratory infections, nutritional deficiency disorders and diarrhoea continue to contribute to the burden of illnesses among children, the emerging incidences of NCDs have also gained the attention of health authorities in recent years. However, an epidemiological study conducted in early 1980s (n=2938, ≥20 years) of non-insulin-dependent diabetes mellitus (NIDDM) in Kiribati found a relatively high prevalence of impaired glucose tolerance (10.6% of men and 13.7% of women in the rural sample)5. The study also found the age-standardised prevalence of NIDDM to be twice as high in the urban sample as compared with the rural sample (9.1% vs. 3.0% in men; 8.7% vs. 3.3% in women). To date, no other comprehensive epidemiological population-based surveys have been carried out in Kiribati to examine the extent and scope of NCD risks since those earlier surveys. Kiribati has one main government hospital located in South Tarawa. Government-run health clinics or dispensaries located on outer islands provide primary health care services. Because of limited medical supplies, the clinics mainly manage minor illnesses and injuries and refer major cases to the main hospital. The majority of doctors are located in the main hospital, while village health workers staff the dispensaries.
2 The people of Kiribati are referred to as ‘I-Kiribati’ (pronounced ‘ee-Kiribass’).
16
1.3 Developing WHO STEPS Survey in Kiribati At the time of writing no population-wide epidemiological data on NCD risk factors have been collected in Kiribati. Recognizing the gap in knowledge on the magnitude of major NCDs and their risk factors for planning and policy development in the country, a number of agencies came together to implement the WHO STEPS survey in 2004. The survey was conducted by the Kiribati Ministry of Health and Medical Services, with technical support provided by the Fiji School of Medicine and the World Health Organization. 2. OBJECTIVES The Kiribati STEPS survey seeks to document the prevalence and magnitude of key NCDs and their risk factors. The survey will provide representative data on key indicators of risk factors that are linked to several chronic conditions. The data will inform whole-of-government approach to health services planning and the development of an integrated strategy for preventing and managing NCDs. Specifically, the survey aimed to:
• Document the prevalence and magnitude of key NCDs among adults • Document the prevalence and magnitude of major modifiable risk factors for NCDs including
smoking, alcohol consumption, poor eating patterns, physical inactivity, obesity, high blood pressure, raised blood glucose and cholesterol
• Compare NCDs and their risk factors by age and sex groups. 3. METHODOLOGY
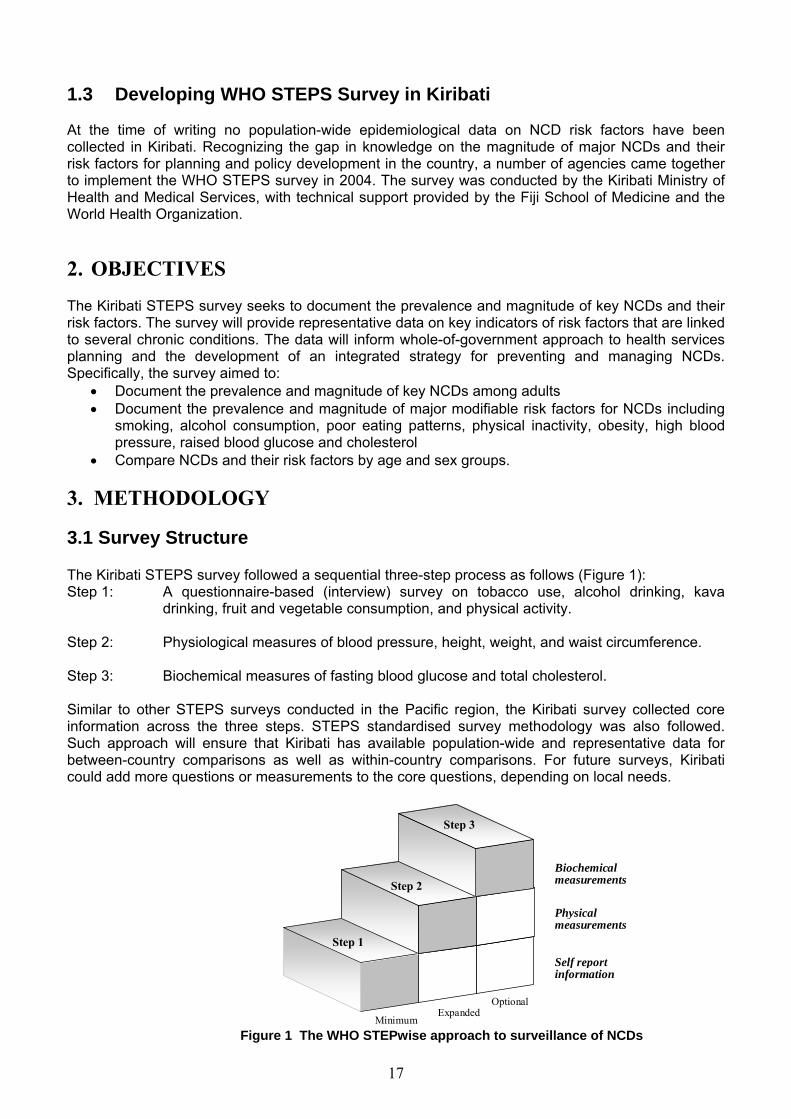
3.1 Survey Structure The Kiribati STEPS survey followed a sequential three-step process as follows (Figure 1): Step 1: A questionnaire-based (interview) survey on tobacco use, alcohol drinking, kava
drinking, fruit and vegetable consumption, and physical activity. Step 2: Physiological measures of blood pressure, height, weight, and waist circumference. Step 3: Biochemical measures of fasting blood glucose and total cholesterol. Similar to other STEPS surveys conducted in the Pacific region, the Kiribati survey collected core information across the three steps. STEPS standardised survey methodology was also followed. Such approach will ensure that Kiribati has available population-wide and representative data for between-country comparisons as well as within-country comparisons. For future surveys, Kiribati could add more questions or measurements to the core questions, depending on local needs.
Physical measurements
Biochemical measurements
Self report information
Step 1
Step 2
Step 3
MinimumExpanded
Optional
Figure 1 The WHO STEPwise approach to surveillance of NCDs
17
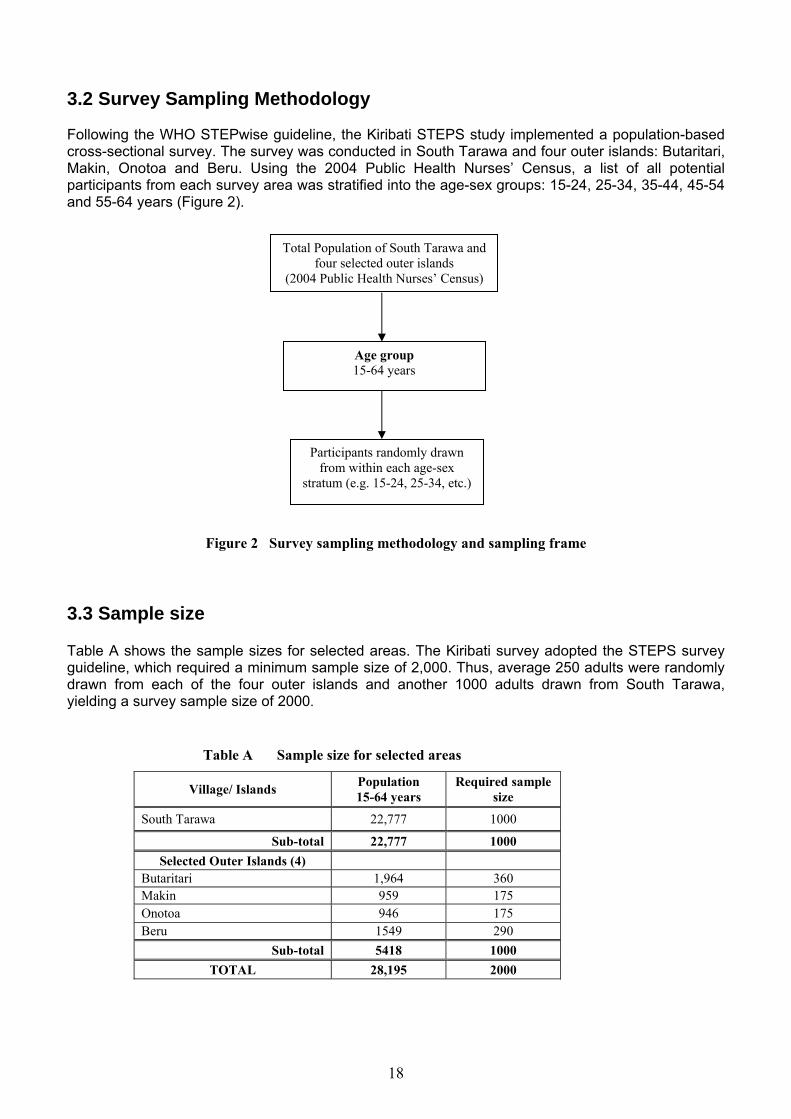
3.2 Survey Sampling Methodology Following the WHO STEPwise guideline, the Kiribati STEPS study implemented a population-based cross-sectional survey. The survey was conducted in South Tarawa and four outer islands: Butaritari, Makin, Onotoa and Beru. Using the 2004 Public Health Nurses’ Census, a list of all potential participants from each survey area was stratified into the age-sex groups: 15-24, 25-34, 35-44, 45-54 and 55-64 years (Figure 2).
Total Population of South Tarawa and
four selected outer islands (2004 Public Health Nurses’ Census)
Age group 15-64 years
Participants randomly drawn from within each age-sex
stratum (e.g. 15-24, 25-34, etc.)
Figure 2 Survey sampling methodology and sampling frame
3.3 Sample size Table A shows the sample sizes for selected areas. The Kiribati survey adopted the STEPS survey guideline, which required a minimum sample size of 2,000. Thus, average 250 adults were randomly drawn from each of the four outer islands and another 1000 adults drawn from South Tarawa, yielding a survey sample size of 2000.
Table A Sample size for selected areas
Village/ Islands Population 15-64 years
Required sample size
South Tarawa 22,777 1000
Sub-total 22,777 1000 Selected Outer Islands (4)
Butaritari 1,964 360 Makin 959 175 Onotoa 946 175 Beru 1549 290
Sub-total 5418 1000 TOTAL 28,195 2000
18

3.4 Data Collection Procedures The survey was conducted from May, 2004 through to Sept., 2006. In each survey area: • The survey approached randomly selected individuals from the list of all potential participants to
inform them of the aims of the study and to obtain signed informed consent. • The survey staff provided fasting instructions to participants and worked through appointment
schedules for interviews and measurements. Data collection activities are outlined in Figure 3.
Registration: Assessment of participant’s fasting status. Participants who have not fasted, will undertake Step 2/3 only and re-schedule appointm t for Step 3. en
STEP 1 10 interviewers STEP 2 & 3 3 MOH personnel
3 MOH personnel/Technician
4 MOH staff
2 MOH staff
Figure 3 Flow chart of data collection activities
Blood Pressure
Waiting area
Refreshment and waiting areas
Capillary Blood Tests (Fasting blood glucose & total cholesterol)
Interviews urvey site conducted at s
Waiting area
Height & Weight, &Waist Circumference
Check out & Counselling
19
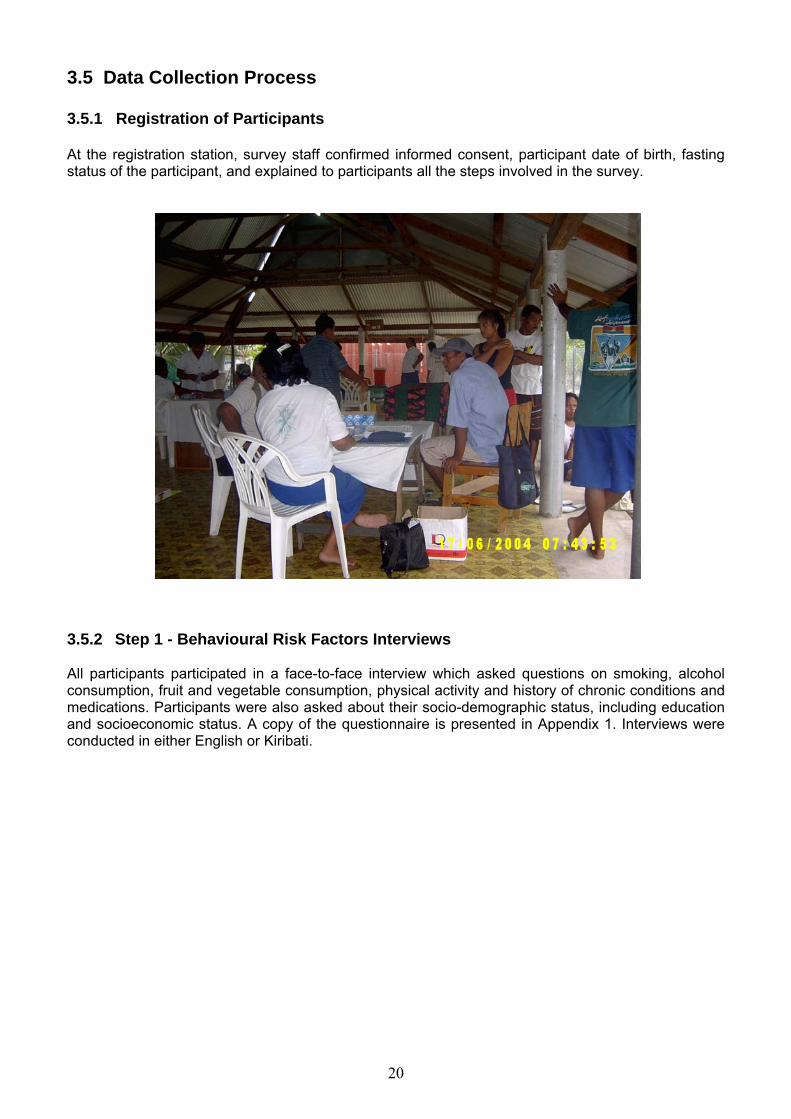
3.5 Data Collection Process 3.5.1 Registration of Participants At the registration station, survey staff confirmed informed consent, participant date of birth, fasting status of the participant, and explained to participants all the steps involved in the survey.
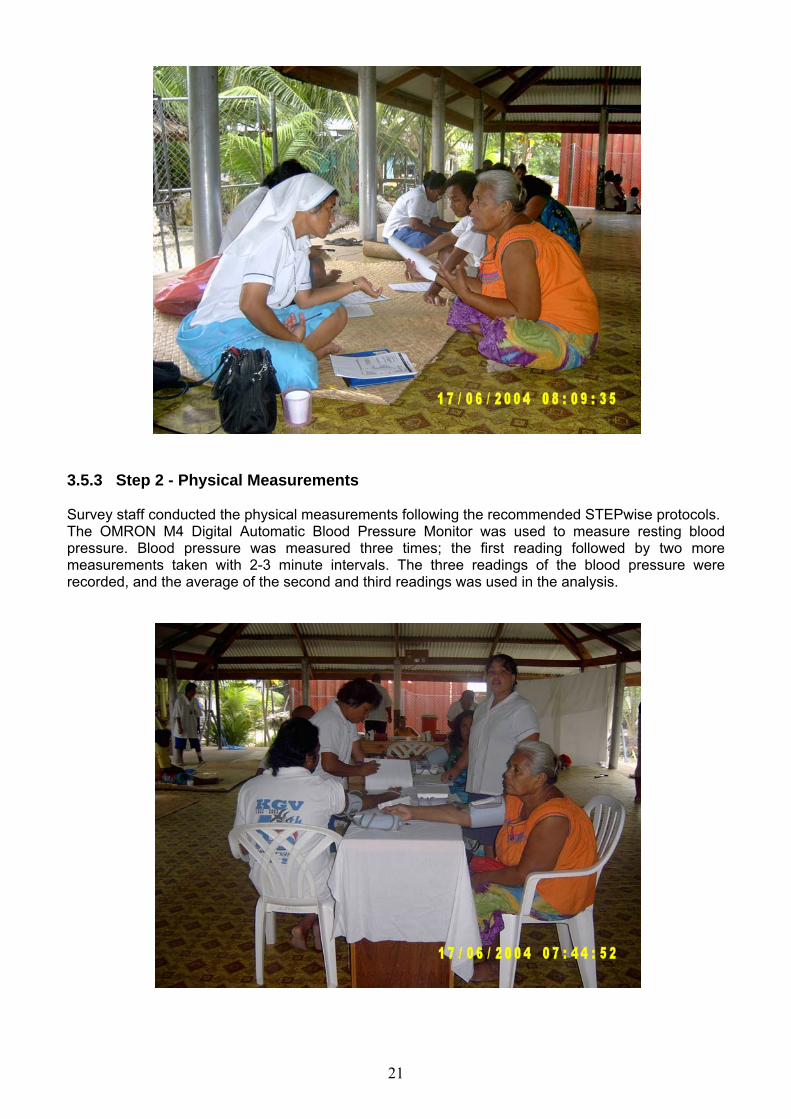
3.5.2 Step 1 - Behavioural Risk Factors Interviews All participants participated in a face-to-face interview which asked questions on smoking, alcohol consumption, fruit and vegetable consumption, physical activity and history of chronic conditions and medications. Participants were also asked about their socio-demographic status, including education and socioeconomic status. A copy of the questionnaire is presented in Appendix 1. Interviews were conducted in either English or Kiribati.
20
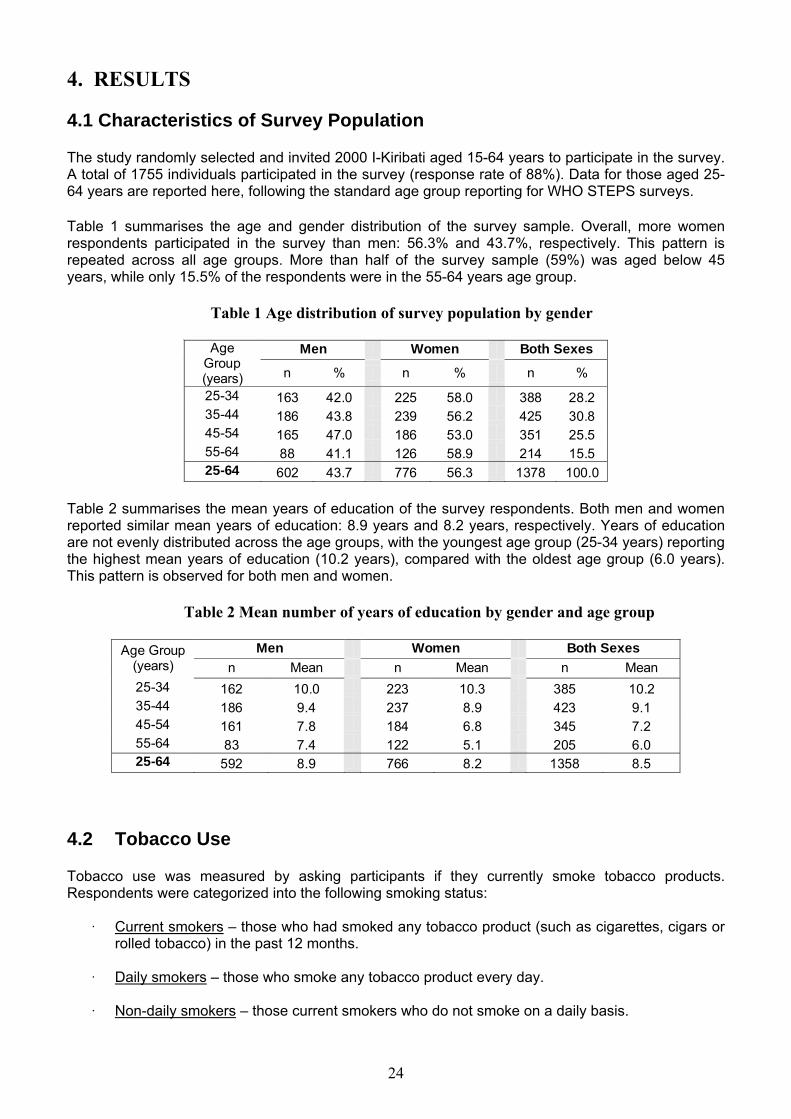
3.5.3 Step 2 - Physical Measurements Survey staff conducted the physical measurements following the recommended STEPwise protocols. The OMRON M4 Digital Automatic Blood Pressure Monitor was used to measure resting blood pressure. Blood pressure was measured three times; the first reading followed by two more measurements taken with 2-3 minute intervals. The three readings of the blood pressure were recorded, and the average of the second and third readings was used in the analysis.
21

Height and weight were measured once using the Seca Leicester Height Measure to the nearest whole centimeter and the Siltec PS500L to the nearest 0.1 kg, respectively. Participants were measured without shoes and wearing only light clothing. Waist circumference was measured once using the Figure Finder constant tension tape and recorded to the nearest 0.1 cm. Waist circumference of female pregnant participants was not measured.
3.5.4 Step 3 – Biochemical Measurements The Kiribati survey included assessments of fasting blood glucose and fasting total cholesterol. Participants fasted from 10:00pm the previous night until 7:00am the following morning when their capillary blood samples were drawn using the method of finger prick.
22

3.5.5 Check-out Station and Counselling All participants received health advice and counselling and were provided with literature about smoking, alcohol drinking, obesity and nutrition, physical activity, hypertension, diabetes, and heart diseases. Participants who were identified as being at high risk of developing or with advanced chronic conditions were referred for follow-up clinical examination. 3.6 Data Management and Analyses 3.6.1 Data Entry Submitted questionnaires were checked randomly by staff to assess overall quality of data collection and completeness. Data entry was conducted by the survey staff at the Ministry of Health and Medical Services office using the EpiData software configured for double data entry function. 3.6.2 Data Weighting and Analysis Post-stratification weights were calculated using the 2005 population projections based on Kiribati Census 2000 of the I-Kiribati population aged 15-64 years. This weighting adjusted for certain age/sex stratum being either over- or under-represented in the survey data. Weighted sample means were computed for continuous variables. Frequency distributions were calculated using weighted frequencies for categorical variables. For both weighted frequency estimates and weighted means, 95% confidence intervals were reported by 10-year age groups and gender. With support from the WHO Office in Suva, WHO Office in Geneva performed final data cleaning, data weighting, and analysis. Data analyses were conducted using the EpiInfo 2002 Version 3.5.1. WHO Office in Suva compiled the whole Data Book. In this report, we presented data for those aged 25-64 years, following the standard age group reporting for WHO STEPS surveys. Survey results for the age group of 15-24 years were presented at the end of each section of behavioural risk factors.
23
4. RESULTS 4.1 Characteristics of Survey Population The study randomly selected and invited 2000 I-Kiribati aged 15-64 years to participate in the survey. A total of 1755 individuals participated in the survey (response rate of 88%). Data for those aged 25-64 years are reported here, following the standard age group reporting for WHO STEPS surveys. Table 1 summarises the age and gender distribution of the survey sample. Overall, more women respondents participated in the survey than men: 56.3% and 43.7%, respectively. This pattern is repeated across all age groups. More than half of the survey sample (59%) was aged below 45 years, while only 15.5% of the respondents were in the 55-64 years age group.
Table 1 Age distribution of survey population by gender
Men Women Both Sexes Age
Group (years) n % n % n %
25-34 163 42.0 225 58.0 388 28.2 35-44 186 43.8 239 56.2 425 30.8 45-54 165 47.0 186 53.0 351 25.5 55-64 88 41.1 126 58.9 214 15.5 25-64 602 43.7 776 56.3 1378 100.0
Table 2 summarises the mean years of education of the survey respondents. Both men and women reported similar mean years of education: 8.9 years and 8.2 years, respectively. Years of education are not evenly distributed across the age groups, with the youngest age group (25-34 years) reporting the highest mean years of education (10.2 years), compared with the oldest age group (6.0 years). This pattern is observed for both men and women.
Table 2 Mean number of years of education by gender and age group
Men Women Both Sexes Age Group (years) n Mean n Mean n Mean 25-34 162 10.0 223 10.3 385 10.2 35-44 186 9.4 237 8.9 423 9.1 45-54 161 7.8 184 6.8 345 7.2 55-64 83 7.4 122 5.1 205 6.0 25-64 592 8.9 766 8.2 1358 8.5
4.2 Tobacco Use Tobacco use was measured by asking participants if they currently smoke tobacco products. Respondents were categorized into the following smoking status:
· Current smokers – those who had smoked any tobacco product (such as cigarettes, cigars or rolled tobacco) in the past 12 months.
· Daily smokers – those who smoke any tobacco product every day. · Non-daily smokers – those current smokers who do not smoke on a daily basis.
24

Table 3 shows that 61.3% of respondents were current smokers. The majority of men (75.7% ±4.7) were current smokers, compared to less than half of the women (48.3% ±4.9) surveyed. This gender difference was observed for those aged 25-44 years, with no significant gender difference in people aged 44-64 years. For men, the highest proportion of current smokers was in the 35-44 years age group (80.6%) and for women in the 45-54 years age group (61.6%).
Table 3 Percentage of current smokers in the study population
Men Women Both Sexes Age Group (years) n
% Current smoker
95% CI n
% Current smoker
95% CI n
% Current smoker
95% CI
25-34 163 74.8 ±9.3 225 43.1 ±8.1 388 58.1 ±6.935-44 186 80.6 ±6.2 239 46.4 ±7.0 425 62.8 ±4.445-54 164 76.8 ±7.1 185 61.6 ±8.4 349 69.0 ±6.055-64 87 62.1 ±12.4 126 49.2 ±11.0 213 55.1 ±8.925-64 600 75.7 ±4.7 775 48.3 ±4.9 1375 61.3 ±3.4
Among male current smokers, 74.0% classified themselves as daily smokers. A substantial proportion (74.2% ±9.2) of young men aged 25-34 years were already smoking daily. The proportion of daily smokers peaked at 35-44 years (78.5% ±6.0), decreasing thereafter with a substantial drop occurring in the 55-64 years age group, although the prevalence was still relatively high (59.8% ± 11.9) (Table 4).
Table 4 Current smoking status among men in the study population by age group
Men Current smoker Age Group
(years) n % Daily 95% CI % Non-daily 95% CI
% Does not
smoke 95% CI
25-34 163 74.2 ±9.2 0.6 ±1.3 25.2 ±9.3 35-44 186 78.5 ±6.0 2.2 ±1.9 19.4 ±6.2 45-54 164 74.4 ±8.0 2.4 ±2.3 23.2 ±7.1 55-64 87 59.8 ±11.9 2.3 ±3.5 37.9 ±12.4 25-64 600 74.0 ±4.9 1.6 ±0.9 24.3 ±4.7
Table 5 shows that among female current smokers, 45.4% were daily smokers. The proportions of daily smokers increased with increasing age, from 40.4% in the youngest age group (25-34 years) to 46.8% in the oldest age group (55-64 years). The highest percentage of daily smokers was within the 45-54 years age group (58.4%).
Table 5 Current smoking status among women in the study population by age group
Women Current smoker Age Group
(years) n % Daily 95% CI % Non-daily 95% CI
% Does not
smoke 95% CI
25-34 225 40.4 ±7.6 2.7 ±2.0 56.9 ±8.1 35-44 239 43.1 ±6.3 3.3 ±2.5 53.6 ±7.0 45-54 185 58.4 ±8.4 3.2 ±2.7 38.4 ±8.4 55-64 126 46.8 ±10.7 2.4 ±2.7 50.8 ±11.0 25-64 775 45.4 ±4.6 3.0 ±1.2 51.7 ±4.9
25
Table 6 summarises the prevalence of daily, non-daily and non-smokers for men and women combined. Overall, 59.0% of survey respondents were daily smokers, compared with 38.7% of non-smokers and 2.3% of non-daily smokers. The highest proportion of daily smokers (66.2%) was reported in people aged 45-54 years, and the lowest in those aged 55-64 years (52.7%).
Table 6 Current smoking status among both sexes in the study population by age group Both Sexes
Current smoker Age Group (years) n % Daily 95% CI % Non-
daily 95% CI
% Does not
smoke 95% CI
25-34 388 56.4 ±6.3 1.7 ±1.2 41.9 ±6.9 35-44 425 60.0 ±4.2 2.8 ±1.7 37.2 ±4.4 45-54 349 66.2 ±6.5 2.9 ±1.8 31.0 ±6.0 55-64 213 52.7 ±8.3 2.3 ±1.9 44.9 ±8.9 25-64 1375 59.0 ±3.4 2.3 ±0.7 38.7 ±3.4
Among current daily smokers, the mean age of starting smoking for women was 20.5 years (±0.8) and for men was 18.2 years (±0.5), which was significantly lower than women. This gender difference in the mean age of starting smoking was observed in all age groups, with the exception for those people aged 55-64 years. Across both genders, the youngest cohort (25-34 years) reported starting smoking earlier than the older cohorts (Table 7).
Table 7 Mean age started smoking among current daily smokers
Men Women Both Sexes Age Group (years) n Mean
age 95% CI n Mean
age 95% CI n Mean
age 95% CI
25-34 116 17.4 ±0.5 87 18.9 ±0.8 203 18.0 ±0.5 35-44 135 18.1 ±1.0 101 21.1 ±1.0 236 19.3 ±0.7 45-54 118 19.2 ±1.4 107 21.4 ±1.3 225 20.2 ±1.1 55-64 50 19.8 ±2.0 58 21.4 ±2.2 108 20.6 ±1.4 25-64 419 18.2 ±0.5 353 20.5 ±0.8 772 19.1 ±0.5
Table 8 reveals that among current daily smokers, the mean number of years of smoking was 20.8 years (±0.8). No significant gender difference was noted in the reported duration of smoking, with men smoking for a mean of 21.1 years (±1.0) and women smoking for 20.4 years (±1.0). It should be noted that due to the small numbers of responders in the 55-64 years age group, especially among men, estimates for this age group may be unreliable.
Table 8 Mean number of years of smoking among current daily smokers
Men Women Both Sexes Age Group (years) n
Mean duratio
n
95% CI n Mean
duration 95% CI n
Mean duratio
n
95% CI
25-34 116 12.2 ±0.6 87 11.3 ±0.9 203 11.9 ±0.5 35-44 135 21.3 ±1.0 101 18.2 ±1.1 236 20.1 ±0.7 45-54 118 29.8 ±1.3 107 27.3 ±1.4 225 28.7 ±1.0 55-64 50 39.0 ±2.4 58 37.2 ±2.5 108 38.1 ±1.5 25-64 419 21.1 ±1.0 353 20.4 ±1.0 772 20.8 ±0.8
Table 9 shows that manufactured cigarettes were the most common cigarettes smoked by current daily smokers: 43.5% (±5.0) of men and 45.7% (±5.4) of women. There were no significant
26
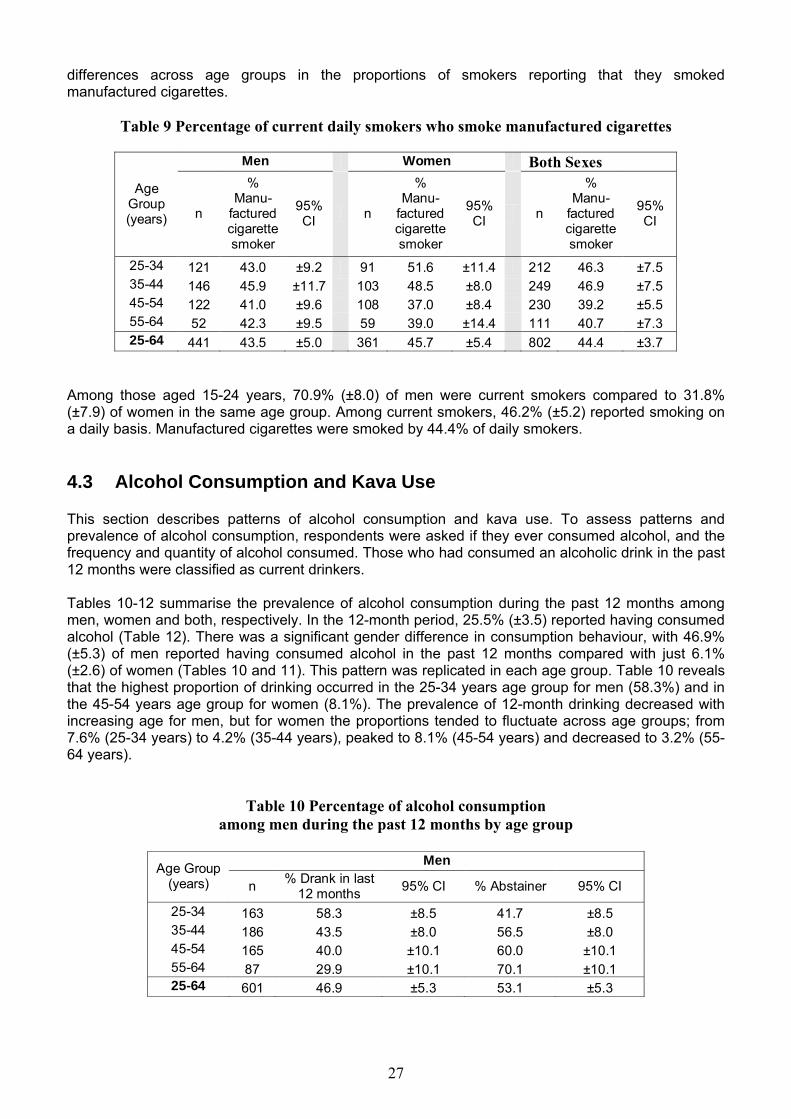
differences across age groups in the proportions of smokers reporting that they smoked manufactured cigarettes.
Table 9 Percentage of current daily smokers who smoke manufactured cigarettes
Men Women Both Sexes Age
Group (years) n
% Manu-
factured cigarette smoker
95% CI n
% Manu-
factured cigarette smoker
95% CI n
% Manu-
factured cigarette smoker
95% CI
25-34 121 43.0 ±9.2 91 51.6 ±11.4 212 46.3 ±7.5 35-44 146 45.9 ±11.7 103 48.5 ±8.0 249 46.9 ±7.5 45-54 122 41.0 ±9.6 108 37.0 ±8.4 230 39.2 ±5.5 55-64 52 42.3 ±9.5 59 39.0 ±14.4 111 40.7 ±7.3 25-64 441 43.5 ±5.0 361 45.7 ±5.4 802 44.4 ±3.7
Among those aged 15-24 years, 70.9% (±8.0) of men were current smokers compared to 31.8% (±7.9) of women in the same age group. Among current smokers, 46.2% (±5.2) reported smoking on a daily basis. Manufactured cigarettes were smoked by 44.4% of daily smokers. 4.3 Alcohol Consumption and Kava Use This section describes patterns of alcohol consumption and kava use. To assess patterns and prevalence of alcohol consumption, respondents were asked if they ever consumed alcohol, and the frequency and quantity of alcohol consumed. Those who had consumed an alcoholic drink in the past 12 months were classified as current drinkers. Tables 10-12 summarise the prevalence of alcohol consumption during the past 12 months among men, women and both, respectively. In the 12-month period, 25.5% (±3.5) reported having consumed alcohol (Table 12). There was a significant gender difference in consumption behaviour, with 46.9% (±5.3) of men reported having consumed alcohol in the past 12 months compared with just 6.1% (±2.6) of women (Tables 10 and 11). This pattern was replicated in each age group. Table 10 reveals that the highest proportion of drinking occurred in the 25-34 years age group for men (58.3%) and in the 45-54 years age group for women (8.1%). The prevalence of 12-month drinking decreased with increasing age for men, but for women the proportions tended to fluctuate across age groups; from 7.6% (25-34 years) to 4.2% (35-44 years), peaked to 8.1% (45-54 years) and decreased to 3.2% (55-64 years).
Table 10 Percentage of alcohol consumption among men during the past 12 months by age group
Men Age Group
(years) n % Drank in last 12 months 95% CI % Abstainer 95% CI
25-34 163 58.3 ±8.5 41.7 ±8.5 35-44 186 43.5 ±8.0 56.5 ±8.0 45-54 165 40.0 ±10.1 60.0 ±10.1 55-64 87 29.9 ±10.1 70.1 ±10.1 25-64 601 46.9 ±5.3 53.1 ±5.3
27
Table 11 Percentage of alcohol consumption among women during the past 12 months by age group
Women Age Group
(years) n % Drank in last 12 months 95% CI %
Abstainer 95% CI
25-34 225 7.6 ±4.0 92.4 ±4.0 35-44 239 4.2 ±3.0 95.8 ±3.0 45-54 186 8.1 ±4.7 91.9 ±4.7 55-64 126 3.2 ±3.2 96.8 ±3.2 25-64 776 6.1 ±2.6 93.9 ±2.6
Table 12 Percentage of alcohol consumption among both sexes during the past 12 months by age group
Both Sexes Age Group
(years) n % Drank in last 12 months 95% CI % Abstainer 95% CI
25-34 388 31.5 ±4.9 68.5 ±4.9 35-44 425 23.0 ±4.7 77.0 ±4.7 45-54 351 23.7 ±5.9 76.3 ±5.9 55-64 213 15.4 ±5.9 84.6 ±5.9 25-64 1377 25.5 ±3.5 74.5 ±3.5
Table 13 Frequency (days) and quantity of drinks consumed in the last 7 days by current (last 30 days) drinker among men
Men
Age Group (years) n
% Drank on 4+ days
95% CI % 5+
drinks on any day
95% CI % 20+
drinks in 7 days
95% CI
25-34 52 7.7 ±8.0 76.9 ±14.4 25.0 ±14.6 35-44 46 8.7 ±8.7 69.6 ±14.8 21.7 ±8.6 45-54 45 4.4 ±5.4 71.1 ±10.7 13.3 ±15.9 55-64 17 11.8 ±17.0 52.9 ±28.6 23.5 ±21.0 25-64 160 7.7 ±4.5 71.8 ±8.7 21.6 ±7.9
Table 13 summarises the frequency (number of drinking days) of alcohol consumed and quantity of drinks consumed (number of drinks on drinking day) by men current drinkers in the last 7 days. Among male current drinkers, 7.7% reported drinking on 4+ days in the last 7 days. Approximately 71.8% (±8.7) reported ‘binge drinking’, that is drinking 5 or more standard drinks on any day in the past week for males (Table 13). The highest proportion that drank 5 or more standard drinks was in the 25-34 age group (76.9%±14.4). While proportions of binge drinking declined with age, there were no significant differences between groups in the proportions of binge drinking. Table 13 also shows approximately 21.6% of male current drinkers consumed 20 or more drinks during the previous week of the survey. It should be noted that because of the small numbers in this table careful interpretation of the results presented here is required since the estimates are likely to be highly unreliable. Due to the very small numbers of respondents (n=21), data on the frequency (number of drinking days) of alcohol consumed and quantity of drinks consumed (number of drinks on drinking day) by women current drinkers in the last 7 days are not presented here. In general nearly half (49.2% ±21.8) reported binge drinking, that is consuming 4 or more standard drinks on any day in the last
28
week for females. This estimate needs careful interpretation because of the small numbers, as evident in the wide confidence intervals.
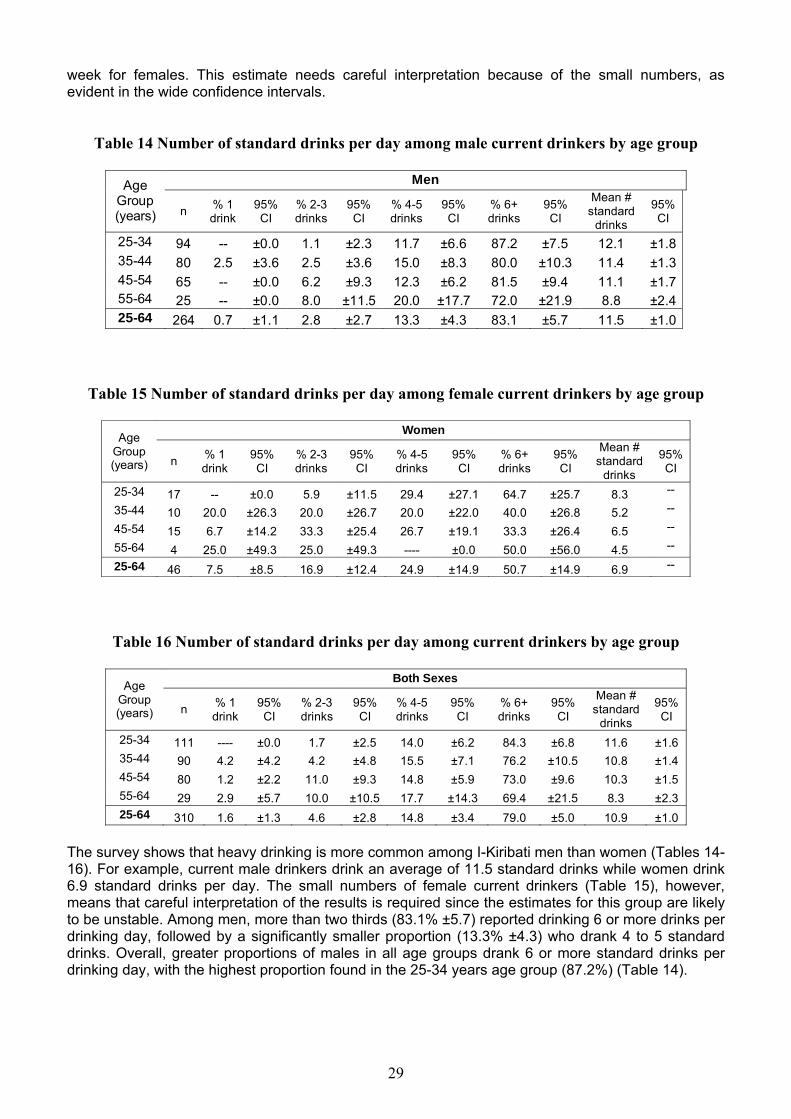
Table 14 Number of standard drinks per day among male current drinkers by age group
Men Age Group (years) n % 1
drink 95% CI
% 2-3 drinks
95% CI
% 4-5 drinks
95% CI
% 6+ drinks
95% CI
Mean # standard
drinks
95% CI
25-34 94 -- ±0.0 1.1 ±2.3 11.7 ±6.6 87.2 ±7.5 12.1 ±1.835-44 80 2.5 ±3.6 2.5 ±3.6 15.0 ±8.3 80.0 ±10.3 11.4 ±1.345-54 65 -- ±0.0 6.2 ±9.3 12.3 ±6.2 81.5 ±9.4 11.1 ±1.755-64 25 -- ±0.0 8.0 ±11.5 20.0 ±17.7 72.0 ±21.9 8.8 ±2.425-64 264 0.7 ±1.1 2.8 ±2.7 13.3 ±4.3 83.1 ±5.7 11.5 ±1.0
Table 15 Number of standard drinks per day among female current drinkers by age group Women Age
Group (years) n % 1
drink 95% CI
% 2-3 drinks
95% CI
% 4-5 drinks
95% CI
% 6+ drinks
95% CI
Mean # standard
drinks
95% CI
25-34 17 -- ±0.0 5.9 ±11.5 29.4 ±27.1 64.7 ±25.7 8.3 --
35-44 10 20.0 ±26.3 20.0 ±26.7 20.0 ±22.0 40.0 ±26.8 5.2 --
45-54 15 6.7 ±14.2 33.3 ±25.4 26.7 ±19.1 33.3 ±26.4 6.5 --
55-64 4 25.0 ±49.3 25.0 ±49.3 ---- ±0.0 50.0 ±56.0 4.5 --
25-64 46 7.5 ±8.5 16.9 ±12.4 24.9 ±14.9 50.7 ±14.9 6.9 --
Table 16 Number of standard drinks per day among current drinkers by age group
Both Sexes Age Group (years) n % 1
drink 95% CI
% 2-3 drinks
95% CI
% 4-5 drinks
95% CI
% 6+ drinks
95% CI
Mean # standard
drinks
95% CI
25-34 111 ---- ±0.0 1.7 ±2.5 14.0 ±6.2 84.3 ±6.8 11.6 ±1.6 35-44 90 4.2 ±4.2 4.2 ±4.8 15.5 ±7.1 76.2 ±10.5 10.8 ±1.4 45-54 80 1.2 ±2.2 11.0 ±9.3 14.8 ±5.9 73.0 ±9.6 10.3 ±1.5 55-64 29 2.9 ±5.7 10.0 ±10.5 17.7 ±14.3 69.4 ±21.5 8.3 ±2.3 25-64 310 1.6 ±1.3 4.6 ±2.8 14.8 ±3.4 79.0 ±5.0 10.9 ±1.0
The survey shows that heavy drinking is more common among I-Kiribati men than women (Tables 14-16). For example, current male drinkers drink an average of 11.5 standard drinks while women drink 6.9 standard drinks per day. The small numbers of female current drinkers (Table 15), however, means that careful interpretation of the results is required since the estimates for this group are likely to be unstable. Among men, more than two thirds (83.1% ±5.7) reported drinking 6 or more drinks per drinking day, followed by a significantly smaller proportion (13.3% ±4.3) who drank 4 to 5 standard drinks. Overall, greater proportions of males in all age groups drank 6 or more standard drinks per drinking day, with the highest proportion found in the 25-34 years age group (87.2%) (Table 14).
29

Table 17 Percentage of kava consumption among men during the past 12 months by age group
Men Age Group
(years) n % Drank in last 12 months 95% CI % Abstainer 95% CI
25-34 163 50.3 9.2 49.7 9.2 35-44 186 53.8 8.8 46.2 8.8 45-54 165 28.5 7.9 71.5 7.9 55-64 87 19.5 5.8 80.5 5.8 25-64 601 43.7 5.9 56.3 5.9
Table 18 Percentage of kava consumption among women during the past 12 months by age group
Women Age Group
(years) n % Drank in last 12 months 95% CI % Abstainer 95% CI
25-34 225 6.2 3.0 93.8 3.0 35-44 239 2.9 2.4 97.1 2.4 45-54 185 4.3 2.6 95.7 2.6 55-64 126 4.0 3.7 96.0 3.7 25-64 775 4.6 1.7 95.4 1.7
Table 19 Percentage of kava consumption among both sexes during the past 12 months by age group
Both Sexes Age Group
(years) n % Drank in last 12 months 95% CI % Abstainer 95% CI
25-34 388 27.0 5.3 73.0 5.3 35-44 425 27.3 4.9 72.7 4.9 45-54 350 16.2 4.4 83.8 4.4 55-64 213 11.1 3.8 88.9 3.8 25-64 1376 23.2 3.3 76.8 3.3
To determine the prevalence of kava (kawa or nangkona) consumption, respondents were asked if they ever tried or drunk kava in the past 12 months. Overall, 23.2% (±3.3) of those surveyed reported having ever tried kava (Table 19). There was a significant gender difference with 43.7% (±5.9) of men and 4.6% (±1.7) of women reported having tried kava (Tables 17 and 18). Generally, kava drinking was more common among younger men and women (25-44 years) than older cohorts (45-64 years). The proportion of respondents aged 15-24 years who reported consuming alcohol during the past 12 months was significantly higher in men (66.5%, ±7.8) than women (14.5%, ±5.6). Among current drinkers (defined as consumed alcohol in the last 30 days), 74.4% (±9.7) of men reported drinking 6 or more drinks on a drinking day, while drinking 2-3 drinks on a drinking day were reported by 39.3% (±20.5) of women.
30
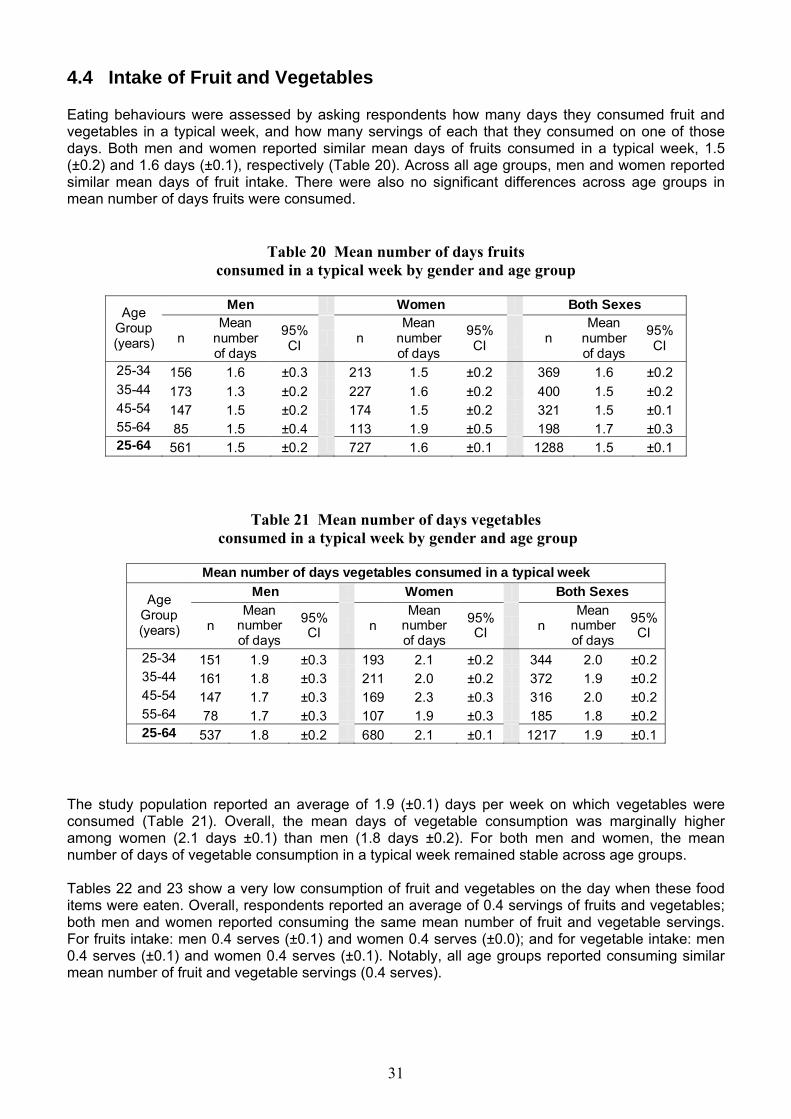
4.4 Intake of Fruit and Vegetables Eating behaviours were assessed by asking respondents how many days they consumed fruit and vegetables in a typical week, and how many servings of each that they consumed on one of those days. Both men and women reported similar mean days of fruits consumed in a typical week, 1.5 (±0.2) and 1.6 days (±0.1), respectively (Table 20). Across all age groups, men and women reported similar mean days of fruit intake. There were also no significant differences across age groups in mean number of days fruits were consumed.
Table 20 Mean number of days fruits
consumed in a typical week by gender and age group
Men Women Both Sexes Age Group (years) n
Mean number of days
95% CI n
Mean number of days
95% CI n
Mean number of days
95% CI
25-34 156 1.6 ±0.3 213 1.5 ±0.2 369 1.6 ±0.2 35-44 173 1.3 ±0.2 227 1.6 ±0.2 400 1.5 ±0.2 45-54 147 1.5 ±0.2 174 1.5 ±0.2 321 1.5 ±0.1 55-64 85 1.5 ±0.4 113 1.9 ±0.5 198 1.7 ±0.3 25-64 561 1.5 ±0.2 727 1.6 ±0.1 1288 1.5 ±0.1
Table 21 Mean number of days vegetables consumed in a typical week by gender and age group
Mean number of days vegetables consumed in a typical week
Men Women Both Sexes Age Group (years) n
Mean number of days
95% CI n
Mean number of days
95% CI n
Mean number of days
95% CI
25-34 151 1.9 ±0.3 193 2.1 ±0.2 344 2.0 ±0.2 35-44 161 1.8 ±0.3 211 2.0 ±0.2 372 1.9 ±0.2 45-54 147 1.7 ±0.3 169 2.3 ±0.3 316 2.0 ±0.2 55-64 78 1.7 ±0.3 107 1.9 ±0.3 185 1.8 ±0.2 25-64 537 1.8 ±0.2 680 2.1 ±0.1 1217 1.9 ±0.1
The study population reported an average of 1.9 (±0.1) days per week on which vegetables were consumed (Table 21). Overall, the mean days of vegetable consumption was marginally higher among women (2.1 days ±0.1) than men (1.8 days ±0.2). For both men and women, the mean number of days of vegetable consumption in a typical week remained stable across age groups. Tables 22 and 23 show a very low consumption of fruit and vegetables on the day when these food items were eaten. Overall, respondents reported an average of 0.4 servings of fruits and vegetables; both men and women reported consuming the same mean number of fruit and vegetable servings. For fruits intake: men 0.4 serves (±0.1) and women 0.4 serves (±0.0); and for vegetable intake: men 0.4 serves (±0.1) and women 0.4 serves (±0.1). Notably, all age groups reported consuming similar mean number of fruit and vegetable servings (0.4 serves).
31
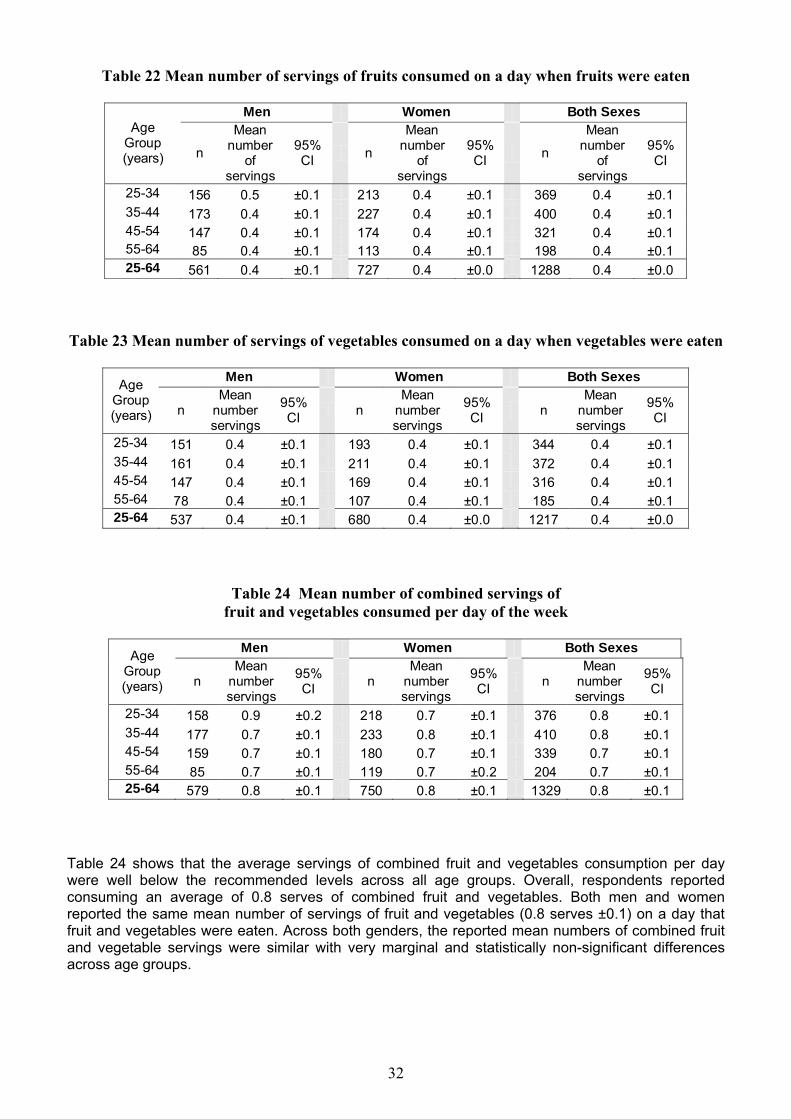
Table 22 Mean number of servings of fruits consumed on a day when fruits were eaten
Men Women Both Sexes Age
Group (years) n
Mean number
of servings
95% CI n
Mean number
of servings
95% CI n
Mean number
of servings
95% CI
25-34 156 0.5 ±0.1 213 0.4 ±0.1 369 0.4 ±0.1 35-44 173 0.4 ±0.1 227 0.4 ±0.1 400 0.4 ±0.1 45-54 147 0.4 ±0.1 174 0.4 ±0.1 321 0.4 ±0.1 55-64 85 0.4 ±0.1 113 0.4 ±0.1 198 0.4 ±0.1 25-64 561 0.4 ±0.1 727 0.4 ±0.0 1288 0.4 ±0.0
Table 23 Mean number of servings of vegetables consumed on a day when vegetables were eaten
Men Women Both Sexes Age
Group (years) n
Mean number servings
95% CI n
Mean number servings
95% CI n
Mean number servings
95% CI
25-34 151 0.4 ±0.1 193 0.4 ±0.1 344 0.4 ±0.1 35-44 161 0.4 ±0.1 211 0.4 ±0.1 372 0.4 ±0.1 45-54 147 0.4 ±0.1 169 0.4 ±0.1 316 0.4 ±0.1 55-64 78 0.4 ±0.1 107 0.4 ±0.1 185 0.4 ±0.1 25-64 537 0.4 ±0.1 680 0.4 ±0.0 1217 0.4 ±0.0
Table 24 Mean number of combined servings of fruit and vegetables consumed per day of the week
Men Women Both Sexes Age
Group (years) n
Mean number servings
95% CI n
Mean number servings
95% CI n
Mean number servings
95% CI
25-34 158 0.9 ±0.2 218 0.7 ±0.1 376 0.8 ±0.1 35-44 177 0.7 ±0.1 233 0.8 ±0.1 410 0.8 ±0.1 45-54 159 0.7 ±0.1 180 0.7 ±0.1 339 0.7 ±0.1 55-64 85 0.7 ±0.1 119 0.7 ±0.2 204 0.7 ±0.1 25-64 579 0.8 ±0.1 750 0.8 ±0.1 1329 0.8 ±0.1
Table 24 shows that the average servings of combined fruit and vegetables consumption per day were well below the recommended levels across all age groups. Overall, respondents reported consuming an average of 0.8 serves of combined fruit and vegetables. Both men and women reported the same mean number of servings of fruit and vegetables (0.8 serves ±0.1) on a day that fruit and vegetables were eaten. Across both genders, the reported mean numbers of combined fruit and vegetable servings were similar with very marginal and statistically non-significant differences across age groups.
32
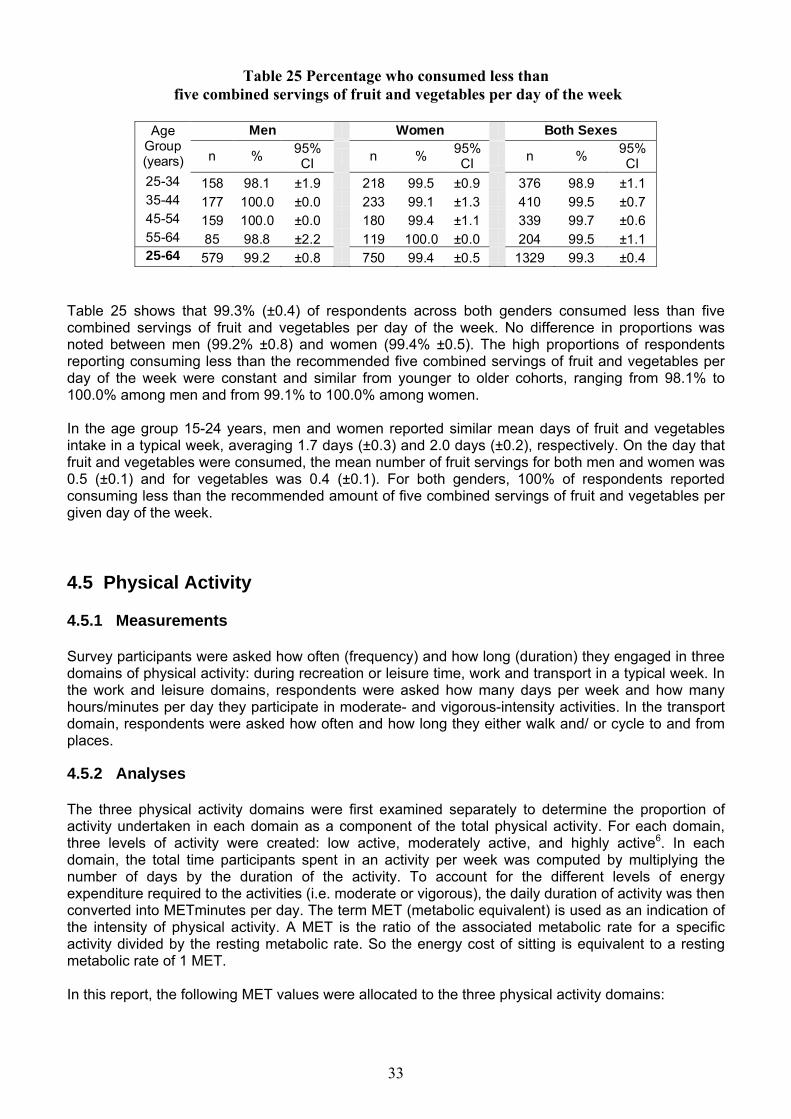
Table 25 Percentage who consumed less than five combined servings of fruit and vegetables per day of the week
Men Women Both Sexes Age
Group (years) n % 95%
CI n % 95% CI n % 95%
CI 25-34 158 98.1 ±1.9 218 99.5 ±0.9 376 98.9 ±1.1 35-44 177 100.0 ±0.0 233 99.1 ±1.3 410 99.5 ±0.7 45-54 159 100.0 ±0.0 180 99.4 ±1.1 339 99.7 ±0.6 55-64 85 98.8 ±2.2 119 100.0 ±0.0 204 99.5 ±1.1 25-64 579 99.2 ±0.8 750 99.4 ±0.5 1329 99.3 ±0.4
Table 25 shows that 99.3% (±0.4) of respondents across both genders consumed less than five combined servings of fruit and vegetables per day of the week. No difference in proportions was noted between men (99.2% ±0.8) and women (99.4% ±0.5). The high proportions of respondents reporting consuming less than the recommended five combined servings of fruit and vegetables per day of the week were constant and similar from younger to older cohorts, ranging from 98.1% to 100.0% among men and from 99.1% to 100.0% among women.
In the age group 15-24 years, men and women reported similar mean days of fruit and vegetables intake in a typical week, averaging 1.7 days (±0.3) and 2.0 days (±0.2), respectively. On the day that fruit and vegetables were consumed, the mean number of fruit servings for both men and women was 0.5 (±0.1) and for vegetables was 0.4 (±0.1). For both genders, 100% of respondents reported consuming less than the recommended amount of five combined servings of fruit and vegetables per given day of the week.
4.5 Physical Activity 4.5.1 Measurements Survey participants were asked how often (frequency) and how long (duration) they engaged in three domains of physical activity: during recreation or leisure time, work and transport in a typical week. In the work and leisure domains, respondents were asked how many days per week and how many hours/minutes per day they participate in moderate- and vigorous-intensity activities. In the transport domain, respondents were asked how often and how long they either walk and/ or cycle to and from places. 4.5.2 Analyses The three physical activity domains were first examined separately to determine the proportion of activity undertaken in each domain as a component of the total physical activity. For each domain, three levels of activity were created: low active, moderately active, and highly active6. In each domain, the total time participants spent in an activity per week was computed by multiplying the number of days by the duration of the activity. To account for the different levels of energy expenditure required to the activities (i.e. moderate or vigorous), the daily duration of activity was then converted into METminutes per day. The term MET (metabolic equivalent) is used as an indication of the intensity of physical activity. A MET is the ratio of the associated metabolic rate for a specific activity divided by the resting metabolic rate. So the energy cost of sitting is equivalent to a resting metabolic rate of 1 MET. In this report, the following MET values were allocated to the three physical activity domains:
33

Moderate physical activity (work and leisure domain) = 4.0 METS Vigorous physical activity (work and leisure domain) = 8.0 METS Travel related walking/cycling = 4.0 METS
The following levels of activity in terms of METminutes were defined as:
Low active: <600 METminutes per week Moderately active: 600-1500 METminutes per week Highly active: >1500 METminutes per week
4.5.3 Levels of Physical Activity Table 26 indicates that 41.8% (±3.8) of men reported a low level of total physical activity which combined their physical activity done as part of work, transport and leisure time. Moderate level of physical activity was reported by 28.1% (±3.9) and high level of physical activity by 30.1% (±5.5) of men. The proportions of low total physical activity generally increased with increasing age, while the proportions reporting moderate level of physical activity fluctuated across age groups. For high level of total physical activity, the proportions declined with increasing age but there was no significant difference across all the age groups.
Table 26 Categories of total physical activity among men by age group
Men Age Group (years) n %
Low 95% CI
% Moderate
95% CI
% High
95% CI
25-34 147 39.5 ±6.9 28.6 ±8.4 32.0 ±9.8 35-44 165 36.4 ±8.6 33.3 ±7.8 30.3 ±6.8 45-54 149 49.7 ±7.4 20.1 ±7.7 30.2 ±7.5 55-64 81 50.6 ±11.0 25.9 ±7.3 23.5 ±8.0 25-64 542 41.8 ±3.8 28.1 ±3.9 30.1 ±5.5
Table 27 Categories of total physical activity among women by age group
Women Age Group (years) n %
Low 95% CI
% Moderate
95% CI
% High
95% CI
25-34 216 54.2 ±7.3 25.5 ±5.3 20.4 ±6.5 35-44 231 59.3 ±7.7 27.3 ±5.9 13.4 ±4.6 45-54 179 61.5 ±7.1 25.1 ±7.2 13.4 ±6.0 55-64 120 55.0 ±7.3 26.7 ±6.1 18.3 ±4.7 25-64 746 57.3 ±3.4 26.1 ±2.8 16.6 ±3.1
A significantly greater proportion of women (57.3% ±3.4) was classified as engaging in low levels of physical activity, compared to men (41.8% ±3.8) (Tables 26 and 27, respectively). Approximately 26.1% (±2.8) of women reported a moderate level of physical activity, which was not significantly different from that reported by men (28.1% ±3.9). Only 16.6% (±3.1) of women reported a high level of physical activity, a proportion significantly lower than that reported by men (30.1% ±5.5). Table 28 shows that overall, about half (50.1% ±2.5) of the study population reported a low level of physical activity. Just over one quarter (27.0% ±2.6) of I-Kiribati aged 25-64 years engaged in moderate level of physical activity, and only 22.8% (±3.1) participated in high level of physical activity. For both categories of total physical activity, there were no significant differences in reported proportions of moderate or high activity across age groups.
34

Table 28 Categories of total physical activity among both sexes by age group
Both Sexes Age Group
(years) n % Low
95% CI
% Moderate
95% CI
% High
95% CI
25-34 363 47.5 ±4.8 26.9 ±5.5 25.7 ±5.9 35-44 396 48.8 ±5.6 30.0 ±4.1 21.1 ±4.2 45-54 328 55.9 ±4.5 22.8 ±4.7 21.3 ±5.1 55-64 201 53.0 ±5.4 26.3 ±4.4 20.6 ±4.2 25-64 1288 50.1 ±2.5 27.0 ±2.6 22.8 ±3.1
Table 29 Mean minutes of total physical activity (mean METminutes per day) by gender and age group
Men Women Both Sexes Age
Group (years) n Mean
minutes 95% CI n Mean
minutes95% CI n Mean
minutes 95% CI
25-34 147 83.8 ±18.5 216 66.7 ±13.1 363 74.5 ±10.435-44 165 82.8 ±14.6 231 50.0 ±10.9 396 65.0 ±9.5 45-54 149 82.8 ±17.1 179 45.8 ±10.1 328 63.3 ±10.755-64 81 83.3 ±28.7 120 60.1 ±10.0 201 70.6 ±14.425-64 542 83.3 ±10.9 746 56.8 ±6.9 1288 68.9 ±6.8
Table 29 summarises mean minutes of total physical activity (across all three domains) in METminutes per day by gender. Overall, the surveyed population reported an average of 68.9 (±6.8) minutes per day spent in total physical activity. There was a significant gender difference with men engaged in physical activity for a mean of 83.3 (±10.9) minutes per day, and women for a mean of 56.8 (±6.9) minutes per day.
Tables 30-32 present results on mean minutes per day engaged in work-, transport- and recreation-related physical activity. Table 30 shows that work-related physical activities comprised 48.0 minutes/day for men and 31.5 minutes/day for women. Across all age groups, men reported engaging in more minutes of physical activity as part of their work than women. Table 31 indicates that transport-related physical activities averaged 28.4 minutes/day for men and 22.5 minutes/day for women. Although men tended to engage in more active transport than women across most age groups, this difference was not statistically significant. Table 32 shows that I-Kiribati engaged in very low levels of leisure-related physical activities, averaging 6.8 minutes/day for men and 2.8 minutes/day for women. Thus, most physical activity in Kiribati was undertaken as part of work, and to a lesser extent, as part of transport. Leisure-time physical activity contributed very little to the total time spent doing physical activity.
35

Table 30 Mean minutes of work-related physical activity (mean METminutes per day) by gender and age group
Men Women Both Sexes Age
Group (years) n Mean
minutes 95% CI n Mean
minutes95% CI n Mean
minutes 95% CI
25-34 147 43.0 ±14.6 216 37.9 ±9.5 363 40.2 ±7.935-44 165 48.0 ±11.7 231 27.1 ±9.8 396 36.7 ±8.345-54 149 54.8 ±16.1 179 19.5 ±9.0 328 36.2 ±10.855-64 81 52.9 ±27.8 120 41.5 ±11.2 201 46.7 ±14.725-64 542 48.0 ±9.0 746 31.5 ±5.4 1288 39.1 ±5.4
Table 31 Mean minutes of transport-related physical activity (mean METminutes per day) by gender and age group
Men Women Both Sexes Age
Group (years) n Mean
minutes 95% CI n Mean
minutes95% CI n Mean
minutes 95% CI
25-34 147 30.6 ±11.7 216 23.1 ±4.3 363 26.5 ±6.9 35-44 165 28.5 ±8.5 231 21.1 ±5.2 396 24.5 ±4.7 45-54 149 24.4 ±7.1 179 26.0 ±7.7 328 25.2 ±5.8 55-64 81 28.3 ±12.6 120 18.5 ±3.7 201 22.9 ±5.6 25-64 542 28.4 ±6.1 746 22.5 ±3.1 1288 25.2 ±3.7
Table 32 Mean minutes of recreation-related physical activity (mean METminutes per day) by gender and age group
Men Women Both Sexes Age
Group (years) n Mean
minutes 95% CI n Mean
minutes95% CI n Mean
minutes 95% CI
25-34 147 10.3 ±5.4 216 5.7 ±4.4 363 7.8 ±3.2 35-44 165 6.3 ±3.2 231 1.8 ±1.7 396 3.8 ±1.9 45-54 149 3.6 ±2.3 179 0.3 ±0.6 328 1.9 ±1.1 55-64 81 2.1 ±2.9 120 0.1 ±0.2 201 1.0 ±1.3 25-64 542 6.8 ±2.4 746 2.8 ±1.8 1288 4.6 ±1.4
For respondents aged 15-24 years, 54.9% (±9.0) of men reported a high level of total physical activity, compared with 22.3% (±6.6) of women in the same age group. Moderate level of total physical activity was reported by 23.8% (±6.7) of men and 35.3% (±7.5) of women. The proportion of low physical activity was significantly higher among women in this age group (42.4% ±8.0) than men (21.3% ±7.2). There was a significant gender difference in the mean minutes of total physical activity per day, with men engaged in total physical activity for an average of 118.6 (±19.6) minutes per day, and women for an average of 75.9 (±13.5) minutes per day. Also in this age group, work-related physical activities comprised 53.0 (±13.1) minutes per day for men, compared with 31.5 (±11.2) minutes per day for women. For transport-related physical activities, however, both men and women reported similar duration spent engaging in this dimension of physical activities, averaging 34.9 (±9.1) minutes per day and 32.2 (±9.6) minutes per day, respectively. For leisure-related physical activities, women spent less time than men engaging in this physical activity domain, with women reporting doing an average of 12.2 (±6.9) minutes per day of leisure-time
36

physical activities compared to an average of 30.7 (±11.5) minutes per day reported by men. Overall, most physical activity among those aged 15-24 years was undertaken as part of work (for men) and transport (for women). Among women, leisure-time physical activity contributed around 16% to the total mean minutes spent doing physical activity, compared with approximately 26% for men.
4.6 Overweight and Obesity
eight and weight of each participant were measured following the standardised STEPS protocol
18.5
Overweight
.6.1 Height and Weight
ables 33 and 34 indicate that I-Kiribati men aged 25-64 years were significantly taller (169.0cm ±0.6)
Houtlined in the Methodology section of this report. The body mass index (BMI) of each participant was computed by dividing the weight (kilograms) by the square of the height (metres2). The BMI risk categories were defined as follows: Underweight BMI <
Normal weight 18.5 ≤ BMI ≤ 24.9 BMI ≥ 25.0
Obese BMI ≥ 30.0 4 Tand heavier (84.0kg ±1.6) than women (158.4cm ±0.5, 79.6kg ±1.3). For both genders, younger cohorts were marginally taller and heavier than the older cohorts. For men, mean weight peaked in the 35-44 year group (86.1kg ±2.8). For women, those in the 25-34 years age group and in the 45-54 years age group experienced the highest mean weight (80.6kg ±2.5 and 80.6 ±2.9, respectively) compared to other age groups. With the exception of the 35-44 years age group, there were no significant differences in mean weight between men and women across age groups.
Table 33 Mean height (cm) by gender and age group
Men Women Age Group (years) n Mean 95% CI n Mean 95% CI
25-34 163 169.8 ±0.8 225 158.6 ±0.6 35-44 184 169.3 ±0.9 239 159.1 ±0.7 45-54 164 168.1 ±0.9 186 158.1 ±1.1 55-64 87 167.3 ±1.5 125 156.8 ±1.2 25-64 598 169.0 ±0.6 775 158.4 ±0.5
Table 34 Mean weight (kg) by gender and age group
Men Women Age Group (years) n Mean 95% CI n Mean 95% CI 25-34 162 84.0 ±2.5 215 80.6 ±2.5 35-44 184 86.1 ±2.8 232 79.9 ±1.9 45-54 164 82.3 ±2.3 184 80.6 ±2.9 55-64 87 81.3 ±3.9 126 74.5 ±3.2 25-64 597 84.0 ±1.6 757 79.6 ±1.3
.6.2 Body Mass Index Categories
he distributions of mean BMI for men and women and combined are presented in Table 35. The
4 Toverall mean BMI of the surveyed population was 30.5 kg/m2 (±0.4). Women had a significantly higher mean BMI (31.5 kg/m2 ±0.5) than men (29.4 kg/m2 ±0.6). This gender difference was evident
37
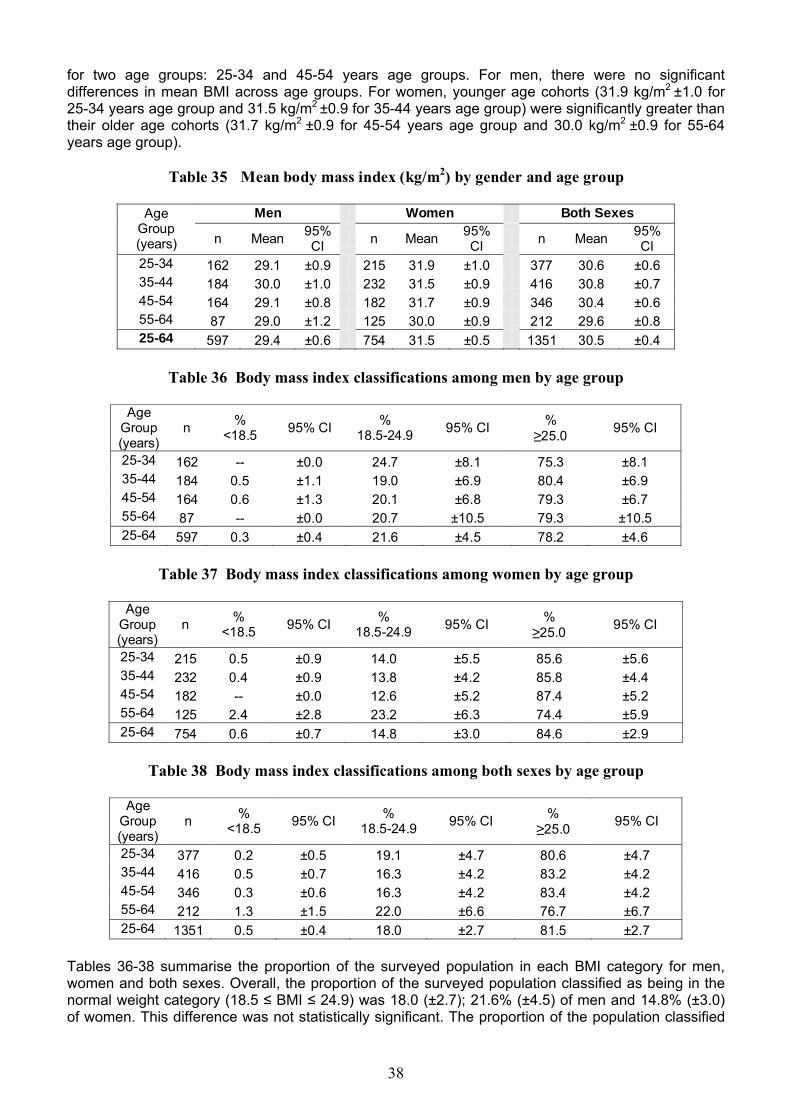
for two age groups: 25-34 and 45-54 years age groups. For men, there were no significant differences in mean BMI across age groups. For women, younger age cohorts (31.9 kg/m2 ±1.0 for 25-34 years age group and 31.5 kg/m2 ±0.9 for 35-44 years age group) were significantly greater than their older age cohorts (31.7 kg/m2 ±0.9 for 45-54 years age group and 30.0 kg/m2 ±0.9 for 55-64 years age group).
Table 35 Mean body mass index (kg/m2) by gender and age group
Men Women Both Sexes Age Group (years) n Mean 95%
CI n Mean 95% CI n Mean 95%
CI 25-34 162 29.1 ±0.9 215 31.9 ±1.0 377 30.6 ±0.6 35-44 184 30.0 ±1.0 232 31.5 ±0.9 416 30.8 ±0.7 45-54 164 29.1 ±0.8 182 31.7 ±0.9 346 30.4 ±0.6 55-64 87 29.0 ±1.2 125 30.0 ±0.9 212 29.6 ±0.8 25-64 597 29.4 ±0.6 754 31.5 ±0.5 1351 30.5 ±0.4
Table 36 Body mass index classifications among men by age group
Age
Group (years)
n % <18.5 95% CI %
18.5-24.9 95% CI % ≥25.0 95% CI
25-34 162 -- ±0.0 24.7 ±8.1 75.3 ±8.1 35-44 184 0.5 ±1.1 19.0 ±6.9 80.4 ±6.9 45-54 164 0.6 ±1.3 20.1 ±6.8 79.3 ±6.7 55-64 87 -- ±0.0 20.7 ±10.5 79.3 ±10.5 25-64 597 0.3 ±0.4 21.6 ±4.5 78.2 ±4.6
Table 37 Body mass index classifications among women by age group
Age
Group (years)
n % <18.5 95% CI %
18.5-24.9 95% CI % ≥25.0 95% CI
25-34 215 0.5 ±0.9 14.0 ±5.5 85.6 ±5.6 35-44 232 0.4 ±0.9 13.8 ±4.2 85.8 ±4.4 45-54 182 -- ±0.0 12.6 ±5.2 87.4 ±5.2 55-64 125 2.4 ±2.8 23.2 ±6.3 74.4 ±5.9 25-64 754 0.6 ±0.7 14.8 ±3.0 84.6 ±2.9
Table 38 Body mass index classifications among both sexes by age group
Age
Group (years)
n % <18.5 95% CI %
18.5-24.9 95% CI % ≥25.0 95% CI
25-34 377 0.2 ±0.5 19.1 ±4.7 80.6 ±4.7 35-44 416 0.5 ±0.7 16.3 ±4.2 83.2 ±4.2 45-54 346 0.3 ±0.6 16.3 ±4.2 83.4 ±4.2 55-64 212 1.3 ±1.5 22.0 ±6.6 76.7 ±6.7 25-64 1351 0.5 ±0.4 18.0 ±2.7 81.5 ±2.7
Tables 36-38 summarise the proportion of the surveyed population in each BMI category for men, women and both sexes. Overall, the proportion of the surveyed population classified as being in the normal weight category (18.5 ≤ BMI ≤ 24.9) was 18.0 (±2.7); 21.6% (±4.5) of men and 14.8% (±3.0) of women. This difference was not statistically significant. The proportion of the population classified
38
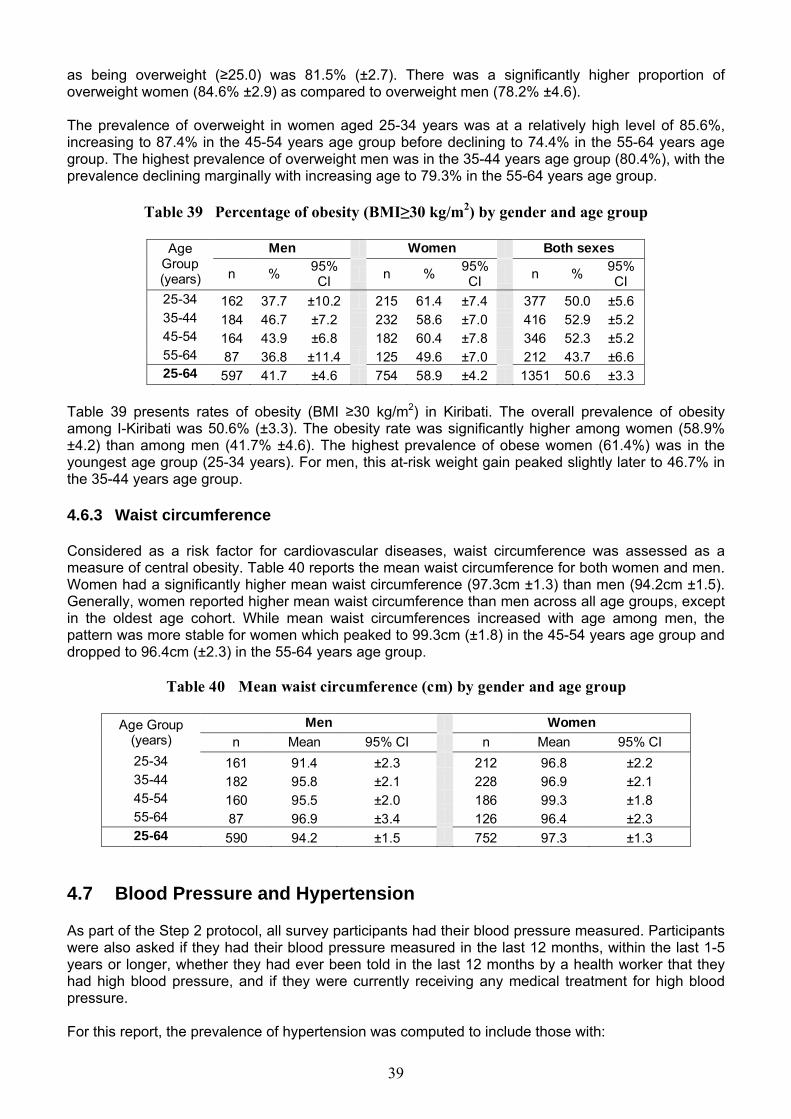
as being overweight (≥25.0) was 81.5% (±2.7). There was a significantly higher proportion of overweight women (84.6% ±2.9) as compared to overweight men (78.2% ±4.6). The prevalence of overweight in women aged 25-34 years was at a relatively high level of 85.6%, increasing to 87.4% in the 45-54 years age group before declining to 74.4% in the 55-64 years age group. The highest prevalence of overweight men was in the 35-44 years age group (80.4%), with the prevalence declining marginally with increasing age to 79.3% in the 55-64 years age group.
Table 39 Percentage of obesity (BMI≥30 kg/m2) by gender and age group
Men Women Both sexes Age Group (years) n % 95%
CI n % 95% CI n % 95%
CI 25-34 162 37.7 ±10.2 215 61.4 ±7.4 377 50.0 ±5.6 35-44 184 46.7 ±7.2 232 58.6 ±7.0 416 52.9 ±5.2 45-54 164 43.9 ±6.8 182 60.4 ±7.8 346 52.3 ±5.2 55-64 87 36.8 ±11.4 125 49.6 ±7.0 212 43.7 ±6.6 25-64 597 41.7 ±4.6 754 58.9 ±4.2 1351 50.6 ±3.3
Table 39 presents rates of obesity (BMI ≥30 kg/m2) in Kiribati. The overall prevalence of obesity among I-Kiribati was 50.6% (±3.3). The obesity rate was significantly higher among women (58.9% ±4.2) than among men (41.7% ±4.6). The highest prevalence of obese women (61.4%) was in the youngest age group (25-34 years). For men, this at-risk weight gain peaked slightly later to 46.7% in the 35-44 years age group. 4.6.3 Waist circumference Considered as a risk factor for cardiovascular diseases, waist circumference was assessed as a measure of central obesity. Table 40 reports the mean waist circumference for both women and men. Women had a significantly higher mean waist circumference (97.3cm ±1.3) than men (94.2cm ±1.5). Generally, women reported higher mean waist circumference than men across all age groups, except in the oldest age cohort. While mean waist circumferences increased with age among men, the pattern was more stable for women which peaked to 99.3cm (±1.8) in the 45-54 years age group and dropped to 96.4cm (±2.3) in the 55-64 years age group.
Table 40 Mean waist circumference (cm) by gender and age group
Men Women Age Group (years) n Mean 95% CI n Mean 95% CI 25-34 161 91.4 ±2.3 212 96.8 ±2.2 35-44 182 95.8 ±2.1 228 96.9 ±2.1 45-54 160 95.5 ±2.0 186 99.3 ±1.8 55-64 87 96.9 ±3.4 126 96.4 ±2.3 25-64 590 94.2 ±1.5 752 97.3 ±1.3
4.7 Blood Pressure and Hypertension As part of the Step 2 protocol, all survey participants had their blood pressure measured. Participants were also asked if they had their blood pressure measured in the last 12 months, within the last 1-5 years or longer, whether they had ever been told in the last 12 months by a health worker that they had high blood pressure, and if they were currently receiving any medical treatment for high blood pressure. For this report, the prevalence of hypertension was computed to include those with:
39

• a mean systolic pressure ≥140 mmHg, whether or not they had previously been told by a health worker that they had high blood pressure, OR
• a mean diastolic pressure ≥90 mmHg, whether or not they had previously been told by a health worker that they had high blood pressure, OR
• normal mean systolic and diastolic pressures (i.e. normotensive) AND who were currently receiving anti-hypertensive medication, whether or not they had previously been told by a health worker that they had high blood pressure.
Those participants who reported having been previously told by a health worker that they had high blood pressure but who were normotensive and NOT on anti-hypertensive medication were NOT included among those considered to have hypertension.
Tables 41 and 42 indicate a significant gender difference in systolic and diastolic blood pressure, with men having higher mean resting blood pressure (125.1/78.2mmHg) than women (115.2/75.3mmHg). Mean resting systolic blood pressure increased with increasing age in both genders with the oldest age group having the highest systolic blood pressure. Mean resting diastolic blood pressure also increased with age, especially among men while among women the mean diastolic blood pressure peaked in 35-44 years age group to 76.5mmHg and remained at this level throughout the older age groups.
Table 41 Mean resting systolic blood pressure (mmHg) by gender and age group
Men Women Both Sexes Age
Group (years) n Mean 95%
CI n Mean 95% CI n Mean 95%
CI 25-34 161 123.0 ±1.6 223 110.3 ±1.2 384 116.3 ±1.0 35-44 178 125.1 ±1.9 233 116.0 ±1.4 411 120.3 ±1.1 45-54 157 125.2 ±2.4 175 118.9 ±3.0 332 122.0 ±2.2 55-64 85 132.0 ±3.9 118 123.6 ±4.7 203 127.5 ±2.8 25-64 581 125.1 ±0.9 749 115.2 ±1.0 1330 119.9 ±0.7
Table 42 Mean resting diastolic blood pressure (mmHg) by gender and age group
Men Women Both Sexes Age Group (years) n Mean 95%
CI n Mean 95% CI n Mean 95%
CI 25-34 161 75.9 ±1.6 223 73.4 ±1.4 384 74.6 ±1.1 35-44 178 79.2 ±1.3 234 76.5 ±1.5 412 77.8 ±1.2 45-54 156 79.9 ±1.9 175 76.5 ±1.8 331 78.2 ±1.5 55-64 85 80.9 ±2.9 117 76.4 ±2.8 202 78.5 ±2.2 25-64 580 78.2 ±0.9 749 75.3 ±0.9 1329 76.7 ±0.8
40

Table 43 Percentage with hypertension (SBP ≥140 and/or DBP ≥ 90 mmHg or
currently on medication for raised blood pressure)
Men Women Both Sexes Age Group (years) n % 95%
CI n % 95% CI n % 95%
CI 25-34 163 14.1 ±4.8 225 7.1 ±2.7 388 10.4 ±2.7 35-44 185 18.9 ±4.6 237 16.9 ±4.4 422 17.9 ±3.3 45-54 164 24.4 ±7.5 182 17.6 ±6.9 346 20.9 ±6.1 55-64 88 43.2 ±12.7 124 23.4 ±10.3 212 32.6 ±8.3 25-64 600 20.9 ±3.4 768 14.0 ±3.0 1368 17.3 ±2.3
Table 43 summarises the prevalence of hypertension among the 25-64 year olds, according to measured blood pressure and those currently on medical for raised blood pressure. Overall, hypertension was more common among men than women, 20.9% (±3.4) and 14.0% (±3.0), respectively. The prevalence of hypertension increased with increasing age for both men and women, with nearly a three-fold increase in the prevalence in both genders in the oldest age group compared to the youngest age group. That is, for men from 14.1% (±4.8) in the 25-34 years age group to 43.2% (±12.7) in the 55-64 years age group, and for women from 7.1% (±2.7) to 23.4% (±10.3). 4.8 Fasting Blood Glucose and Diabetes All participants were asked if they had been told by a health worker that they had diabetes in the previous 12 months, within 1-5 yeas or longer, and whether they were currently receiving medical treatment for diabetes. Capillary whole blood drawn using the method of finger prick was also collected from participants to assess their fasting blood sugar level. Estimates of diabetes prevalence were computed based on the capillary whole blood and following the WHO guidelines for defining and classifying diabetes mellitus7: • fasting capillary whole blood value of glucose greater than or equal to ≥6.1 mmol/L (≥110 mg/dl
whether or not they had previously been told by a health worker that they had diabetes, OR • normal capillary whole blood value of glucose <6.1 mmol/L (<110 mg/dl) AND who were currently
receiving anti-diabetes medication prescribed by a health worker. Those participants who had been advised by a health worker that they had diabetes but who had normal fasting blood glucose, and those who were NOT on anti-diabetes medication or on a special diet prescribed by a health worker, were included among those considered as having diabetes.
Table 44 Mean fasting blood glucose (mmol/L) by gender and age group
Men Women Both Sexes Age Group (years) n Mean 95%
CI n Mean 95% CI n Mean 95%
CI 25-34 137 5.4 ±0.2 181 5.3 ±0.3 318 5.3 ±0.2 35-44 150 6.0 ±0.4 190 5.8 ±0.3 340 5.9 ±0.3 45-54 119 6.8 ±0.5 134 6.2 ±0.4 253 6.5 ±0.4 55-64 67 7.2 ±0.8 96 6.6 ±0.7 163 6.8 ±0.4 25-64 473 6.0 ±0.2 601 5.8 ±0.2 1074 5.9 ±0.2
41

Table 44 summarises results on mean fasting blood glucose for men and women and both genders. The overall mean fasting blood glucose was 5.9 mmol/L. Men reported a marginally higher mean fasting glucose level (6.0 mmol/L ± 0.2) than women (5.8 mmo/L ±0.2), although this difference was not statistically significant. For both men and women, mean fasting blood glucose levels increased with increasing age and peaked in the oldest age group.
Table 45 Prevalence of diabetes by gender and age group (Raised blood glucose or currently on medication
for diabetes and/or diagnosed with diabetes*)
Men Women Both Sexes Age Group (years) n % 95%
CI n % 95% CI n % 95%
CI 25-34 137 12.4 ±5.6 183 14.2 ±6.2 320 13.3 ±4.4 35-44 155 27.7 ±6.7 201 27.9 ±6.3 356 27.8 ±5.1 45-54 133 49.6 ±9.7 150 36.7 ±6.3 283 43.0 ±5.8 55-64 76 57.9 ±14.3 111 46.8 ±10.0 187 51.9 ±7.9 25-64 501 29.6 ±3.9 645 26.7 ±3.5 1146 28.1 ±3.3
* capillary whole blood value: ≥ 6.1 mmol/L (110 mg/dl)
Table 45 shows the overall prevalence of diabetes among I-Kiribati aged 25-64 years was 28.1% (±3.3). While men indicated a higher diabetes rate than women, this difference was not significant statistically (29.6% ±3.9 and 26.7% ±3.5, respectively). The prevalence of diabetes increased with increasing age across both genders. For men, a substantial and significant increase in diabetes prevalence occurred between the age of 35-44 years and 45-54 years, from 27.7% (±6.7) to 49.6% (±9.7), respectively. For women, diabetes prevalence rates between the ages of 25-34 years to 35-44 years almost doubled, from 14.2% (±6.2) to 27.9% (±6.3), respectively. 4.9 Total Cholesterol For elevated total blood cholesterol, a cut-off point ≥5.0 mmol/L (or ≥190 mg/dl) was used to classify participants as being in a high-risk group for coronary artery disease.
Table 46 Mean total blood cholesterol (mmol/L) by gender and age group
Men Women Both Sexes Age Group (years) n Mean 95%
CI n Mean 95% CI n Mean 95%
CI 25-34 58 4.4 ±0.1 90 4.6 ±0.3 148 4.5 ±0.1 35-44 84 4.7 ±0.2 141 4.7 ±0.1 225 4.7 ±0.1 45-54 88 4.5 ±0.1 134 4.9 ±0.2 222 4.7 ±0.1 55-64 55 4.6 ±0.2 91 4.9 ±0.1 146 4.7 ±0.1 25-64 285 4.6 ±0.1 456 4.7 ±0.1 741 4.7 ±0.1
Table 46 shows the overall mean cholesterol level among I-Kiribati adults aged 25-64 years was 4.7 mmol/L; similar mean levels were noted between men (4.6 mmol/L ±0.1) and women (4.7 mmol/L ±0.1). Mean total cholesterol level increased with age among women, peaking in the 45-54 age group (4.9 mmol/L ±0.2) and remaining at this level in the oldest age cohort. Mean total cholesterol levels
42

among men peaked earlier, in the age 35-44 age group (4.7 mmol/L ±0.2), and thereafter fluctuated between 4.5 mmol/L (45-54 years age group) and 4.6 mmol/L (55-64 years age group).
Table 47 Percentage with raised total blood cholesterol (≥ 5.0 mmol/L or ≥ 190 mg/dl)
Men Women Both Sexes Age Group
(years) n % 95% CI n % 95%
CI n % 95% CI
25-34 58 15.5 ±11.4 90 22.2 ±8.3 148 19.3 ±6.6 35-44 84 33.3 ±12.2 141 24.1 ±7.6 225 27.9 ±5.9 45-54 88 23.9 ±8.9 134 43.3 ±10.6 222 35.2 ±7.5 55-64 55 20.0 ±11.3 91 39.6 ±9.4 146 31.3 ±6.8 25-64 285 23.8 ±5.0 456 30.6 ±3.8 741 27.7 ±3.1
Table 47 shows that 27.7% of the surveyed population had a raised total cholesterol ≥5.0 mml/L (or ≥190 mg/dl). There was a higher proportion of women (30.6% ±3.8) with elevated cholesterol as compared to men (23.8% ±5.0), but this difference was not statistically significant. Among women, the proportions with high-risk cholesterol generally increased with increasing age with the highest proportion being in the 45-54 years age group (43.3%). Among men, the proportion with raised total blood cholesterol doubled from 15.5% (±11.4) in the 25-34 age group to 33.3% (±12.2) in the 35-44 years age group, declining thereafter in the older age cohorts. 4.10 Combined Risk Factors In summary, the Kiribati STEPS survey examined five important risk factors for NCDs:
• current daily smokers, • overweight (BMI ≥25 kg/m2), • raised blood pressure (SBP ≥140 and/or DBP≥90 mmHg or currently on medication), • consumed less than five combined servings of fruit and vegetables per day, and • low level of activity (<600 METminutes per week).
For this report, these five risk factors were summed to indicate the overall risk for NCDs as follows:
• Low risk: 0 of 5 risk factors • Moderate risk: 1-2 of 5 risk factors • High risk: 3 or more of 5 risk factors
Table 48 shows that no male respondents were classified as being at low risk for NCDs (i.e. with none of the five risk factors), compared with 0.1% of women (Table 49). Approximately 21.8% of men were at moderate risk (i.e. with 1-2 risk factors), compared with 28.4% of women. Having 3-5 risk factors was more common among men (78.2%) than women (71.5%). 79.0% of I-Kiribati had at least 3-5 risk factors (raised risk) reported by aged 45-64 years. While the proportion of raised risk (i.e. with 3 or more of the five risk factors) increased with increasing age for both genders, relatively high proportions of the younger cohort (25-44 years) were already at great risk for NCDs, with 77.2% of men and 68.8% of women in this age group being at high risk. Generally, in Kiribati as the number of risk factors increased, as does the proportions of people reporting having those conditions.
43

Table 48 Percentage of noncommunicable
disease risk categories among men by age group
Men Age Group (years) n 0 risk
factor 95% CI
1-2 risk factors
95% CI
3-5 risk factors
95% CI
25-44 298 -- -- 22.8 ±4.8 77.2 ±4.8 45-64 219 -- -- 19.6 ±6.2 80.4 ±6.2 25-64 517 -- -- 21.8 ±4.1 78.2 ±4.1
Table 49 Percentage of noncommunicable disease risk categories among women by age group
Women Age Group
(years) n 0 risk factor
95% CI
1-2 risk factors
95% CI
3-5 risk factors
95% CI
25-44 420 0.0 ±0.0 31.2 ±4.6 68.8 ±4.6 45-64 278 0.4 ±0.8 21.9 ±3.0 77.7 ±3.2 25-64 698 0.1 ±0.2 28.4 ±3.4 71.5 ±3.3
Table 50 Percentage of noncommunicable disease risk categories among both sexes by age group
Both Sexes Age Group
(years) n 0 risk factor
95% CI
1-2 risk factors
95% CI
3-5 risk factors
95% CI
25-44 718 0.0 ±0.0 27.3 ±3.1 72.7 ±3.1 45-64 497 0.2 ±0.4 20.9 ±3.5 79.0 ±3.7 25-64 1215 0.1 ±0.1 25.4 ±2.6 74.6 ±2.6
5. DISCUSSION AND CONCLUSIONS This section summarises key findings from the STEPS survey and on that basis presents a range of recommended public actions to address the chronic disease problems facing the Republic of Kiribati. Behavioural risk factors for chronic diseases are common in Kiribati and are a major public health problem at all ages. I-Kiribati women faced similar risk to chronic diseases as I-Kiribati men did. The survey clearly showed that two thirds of the population defined themselves as current smokers, with the majority of those reporting that they smoke on a daily basis. Smoking uptake occurred during late adolescence. Initiatives to delay and prevent the onset of smoking in this group are therefore critical and warrant concerted public health efforts. Given the high prevalence of smoking rates in Kiribati, implementing effective smoking cessation programs should also be considered as a fundamental component of a comprehensive anti-tobacco campaign. Supporting smokers to discontinue their at-risk behaviour will significantly lower their risk of chronic diseases. The survey showed that excessive alcohol drinking among men is a major concern in Kiribati. About 71.8% of men aged 25-64 years ‘binge’ drink, that is drinking 5 or more standard drinks on any day in the past week, while 21.6% reported drinking 20 or more drinks on a drinking day in the past week. Of concern was the high proportion of binge drinking among men in the 25-34 years age group. Binge
44

drinking was also not uncommon among women, with nearly half of those surveyed (49.2%) reported drinking 4 or more standard drinks on any day in the past week. The survey clearly showed that the majority of I-Kiribati (99.3%) aged 25-64 years was not consuming the recommended five combined servings of fruit and vegetables per day. This low level of fruit and vegetable consumption possibly reflects both the availability and demand issue. The physical remoteness of Kiribati coupled with limited capacity of the country to engage in sustainable production of local produce represent key challenges for addressing the eating behaviour of its population. While efforts to increase availability of quality and affordable nutritious foods are important, better understanding of I-Kiribati food preferences and tastes is also a critical component of comprehensive public health initiatives. Engaging in health-enhancing physical activity is not a common behaviour reported by I-Kiribati, that is, the majority of I-Kiribati are not achieving the minimum recommended levels of physical activity, which is 30 minutes of moderate-intensity physical activity for 5 days of the week. The survey showed half of I-Kiribati reported a low level of total physical activity not conducive for health. Women were more likely to report low physical activity compared to men. While high levels of physical activity were more common among young men, this dissipated with increasing age. The duration of total physical activity performed as part of work, transport and leisure time averaged 83.3 minutes per day for men and 56.8 minutes per day for women. The primary source of physical activity in Kiribati was work-related, followed by (active) transport such as cycling or walking. Leisure-time physical activity contributed very little to total physical activity. Similar to findings from other PICs, excessive body weight and consequent chronic conditions remain a critical public health issue in Kiribati. About half (50.6%) of I-Kiribati was found to have a body mass index ≥30 kg/m2. Obesity was common among women as compared to men at all ages. More alarmingly, the high rate of obesity was particularly evident among women aged 25-54 years (ranging from 58.6% to 61.4%). The mean waist circumference of women at all age groups exceeded 80 cm, a cut-off value considered to increase their risk for cardiovascular disease for women. The survey identified a substantial portion of the population with elevated risk for cardiovascular disease requiring immediate treatment and management. Nearly one in five of I-Kiribati (17.3%) had a raised blood pressure at the time of the survey and/or on medication for hypertension, with this condition being common among men than women. As expected, raised blood pressure generally increased with increasing age for both genders. Nearly one third (27.7%) of the surveyed population was found to have elevated fasting blood cholesterol warranting treatment. Kiribati faces a high degree of diabetes problem, with 28.1% of the population estimated to have fasting blood sugar level of ≥6.1 mmol/L. Although the prevalence is lower than that reported for the Federated States of Micronesia (32.1%) and substantially lower than that report in American Samoa (47.3%), it is higher than that found in Nauru (22.7%). As noted in other PICs, the diabetes prevalence generally increases with age. It is interesting to note that unlike other PICs, diabetes is somewhat more common among men than women, especially among those aged 45 years and older. This report focuses on critical and common NCD risk factors and related NCDs (e.g. diabetes), the results of which have been summarised in a series of succinct tables (to facilitate between-country comparisons of STEPS data). While the behavioural risk factors data were collected from self-report and as such the prevalence of some risk factors can be over-estimated or under-estimated, the key strength of the survey is its population-wide and representative characteristics. Another important strength of the survey is that key physiological and biochemical indicators were measured using objective and clinical techniques by staff trained in the STEPS protocol. The Kiribati STEPS survey has confirmed that NCDs pose a major public health challenge. A diverse but complementary multi-level and multi-professional approach, combining primary, secondary and tertiary preventative strategies, will be necessary to tackle the prevalent chronic diseases and associated conditions facing the Kiribati people. To be effective, public health and clinical approaches need to be innovative and sensitive to the prevailing social, economical and cultural environments of Kiribati.
45
46
6. RECOMMENDATIONS Addressing policy, organizational and environmental factors • Increase resources to implement the WHO Framework Convention on Tobacco Control.
• Generate resources to national health institutions, e.g., National Nutrition Centre.
• Develop policies supporting importation of healthy foods.
• Improve availability of fruit and vegetables.
• Develop policies to establish physical activity-friendly environments.
• Establish sustainable government funding mechanism and health infrastructure to support NCD strategy implementation and monitoring.
• Develop NCD related coalitions, networks and partnerships, e.g., Kiribati NCD Working Committee, Kiribati National Food and Nutrition Committee, for preventing and managing NCDs.
Addressing NCD behavioural risk factors • Comprehensive anti-smoking campaigns to reduce smoking rates across all age groups and in
both genders, particularly targeting the younger age groups to prevent smoking uptake.
• Smoking cessation programs to reduce smoking rates across all age groups in both genders.
• Comprehensive health promotion campaigns to reduce alcohol (and at-risk kava) consumption, particularly targeting binge drinking among men.
• Comprehensive health promotion campaigns promoting the recommended levels of fruit and vegetable consumption across all age groups and in both genders, and increasing public awareness of the adverse effects of excessive consumption of high-fat, high-salt, and high-sugar foods.
• Develop and implement cultural-appropriate programs to promote daily incidental physical activity and encourage more moderate-intensity physical activity in all age groups, particularly among women.
• Public health programs to emphasize reduction in the prevalence of the five combined critical NCD risk factors (current daily smoking, being overweight, having raised blood pressure, eating less than five combined servings of fruit and vegetables per day, and having a low level of physical activity).
Establishing a coordinated approach to noncommunicable disease management system
• Increase public awareness of the importance of regular monitoring and screening of blood pressure, blood cholesterol and blood sugar level.
• Establish and/or strengthen existing coordinated care and management of individuals with diagnosed chronic conditions, including providing a system of integrated care across multiple providers (primary health care and clinical care) and multiple chronic conditions that will reduce length of hospitalization and improving quality of life.
• Establish a coordinated NCD program supporting chronic disease care, including supporting patient self-management, self-monitoring of conditions, medications and lifestyle changes.
Maintaining quality surveillance and public health information
• Establish strong leadership and secure political and financial commitments to maintain a systematic and rigorous approach to STEPS data collection – supported by workforce trained in implementing the survey, infrastructure and financial capacity - on an ongoing basis that will evolve to a robust STEPS surveillance system in Kiribati.

47
APPENDICES
48
Check if the following are completed (to be checked by:) Yes No Fasting status (Step 2&3 Registration Station) Checkout (Step 2&3 Check-out Station) EpiData data entry (Data entry personnel) EpiInfo data entry (Data entry personnel) Data entry irregularities (Data entry personnel)
Identification Information:
V 1 Is the respondent on the participation list for the survey? Yes, on the original list
Yes, on the replacement list No (if “No”, then END)
1 2 3
I 1 Island code
I 2 Village name:
I 3 Village code: (SEE NOTE BELOW)
I 4 Interviewer code
I 5 Date of completion of the questionnaire / /2004 Day Month Year
Respondent ID Number
Consent
I 6 Consent has been read out to respondent Yes 1 No 2 If NO, read consent
I 7 Consent has been obtained (verbal or written) Yes 1 No 2 If NO, END
I 8 Interview Language English 1 Kiribati 2
I 9 Time of interview (24 hour clock) : I 10 Family Name
I 11 First Name Note: Identification information I6 to I13 should be stored separately from the questionnaire because it contains confidential information. Please note Village Code is required as part of main instrument for data analyses. Date of interview is required to calculate age
Appendix 1. Kiribati STEPS Survey Questionnaire
TThhee WWHHOO SSTTEEPPwwiissee AApppprrooaacchh ttoo SSuurrvveeiillllaannccee ooff NNoonnccoommmmuunniiccaabbllee DDiisseeaasseess ((SSTTEEPPSS))

49
Step 1 Demographic Information
Coding Column
C1 Sex (Record Male / Female as observed ) Male Female
1 2
C2 What is your date of birth?
If Don’t Know, See Note* below and Go to C3 Day Month Year19
C3 How old are you? Years
C4 In total, how many years have you spent at school or in full-time study (excluding pre-school)? Years
C5 What is your ethnic background? Kiribati 1 Other 2
Refused 3
C6 What is the highest level of education you have completed?
No formal schooling 1
Less than primary school 2 Primary school completed 3
Secondary school completed 4 College/University completed 5
Post graduate degree 6
C7 Which of the following best describes your main work status over the last 12 months?
Government employee 1
Non-government employee 2
Self-employed 3 Non-paid 4
Student 5 Homemaker 6
Retired 7 Unemployed (able to work) 8
Unemployed (unable to work) 9
C8 How many people older than 18 years, including yourself, live in your household? Number of people
C9 Taking the past year, can you tell me what the average earnings of the household have been?
Per week
OR per month
OR per year
Refused 1 Note*: 1) Missing values are not permissible for Village code, Date of Interview and Sex. 2) The Date of Birth (C2) or the age (C3) or both (C2 and C3) have to be filled. CODE “DK” FOR DON’T KNOW or DON’T REMEMBER.
Step 1 Behavioural Measures
Tobacco Use (Section S) Now I am going to ask you some questions about various health behaviours. This includes things like smoking, drinking alcohol, eating fruits and vegetables and physical activity. Let's start with smoking. Response Coding Column S 1a Do you currently smoke any tobacco products,
such as cigarettes, cigars or pipes? (NOTE: CURRENTLY = past 12 months)
Yes No
1 2
If No, go to S4
S 1b If Yes, Do you currently smoke tobacco products daily?
Yes No
1 2 If No, go to S4
S 2a How old were you when you first started smoking daily?
Age (years) Don’t remember
DK
If Known, go to S 3

50
S 2b Do you remember how long ago it was?
(CODE DK FOR DON’T REMEMBER)
In Years
Years
OR in Months
Months
OR in Weeks
Weeks S 3 On average, how many of the following do you
smoke each day? Manufactured cigarettes
(RECORD FOR EACH TYPE) Hand-rolled cigarettes
Hand-rolled rauara
________________ Other (please specify):
S 4 In the past, did you ever smoke daily? Yes No
1 2
If No, go to A1a
S 5a If Yes, How old were you when you stopped smoking daily?
Age (years)
If Known, go to A1a If DK, go to S 5b Don’t remember DK
S 5b How long ago did you stop smoking daily? Years ago Years
OR Months ago Months
OR Weeks ago Weeks
Alcohol Consumption (Section A) The next questions ask about the consumption of alcohol.
Response Coding Column A 1a Have you ever consumed a drink that contains
alcohol such as beer, wine, spirit, fermented toddy or yeast?
Yes No
1 2
If No, Go to K1
A 1b Have you consumed alcohol within the past 12 months?
Yes No
1 2
If No, Go to K1
A 2 In the past 12 months, how frequently have you had at least one drink? (READ RESPONSES) USE SHOWCARD
5 or more days a week 1-4 days per week 1-3 days a month
Less than once a month
1 2 3 4
A 3 When you drink alcohol, on average, how many drinks do you have during one day? Number
A 4 During each of the past 7 days, how many standard drinks of any alcoholic drink did you have each day? (RECORD FOR EACH DAY USE SHOWCARD)
Monday
Tuesday
Wednesday
Thursday
Friday
Saturday
Sunday Note: Code DK for “Don’t know” or “Don’t remember”.
Go to A1a

51
Kawa or Nangkona (Section K)
K1
Have you ever tried or drunk kawa or nangkona in the past 12 months?
Yes No
1 2 If No, go to D 1a
K2 During the last 30 days, on how many days did you drink kawa or nangkona? Number of days
K3 Do you usually drink alcohol during or after drinking kawa or nangkona?
Yes No
1 2
K 4 Do you usually smoke during or after drinking kawa or nangkona?
Yes No
1 2
Diet (Section D) The next questions ask about the fruits and vegetables that you usually eat. I have a nutrition card here that shows you some examples of local fruits and vegetables. Each picture represents the size of a serving. As you answer these questions please think of a typical week in the last year.
D 1a
In a typical week, on how many days do you eat fruit? USE SHOWCARD
Number of days
If Zero days, go to D 2a
D 1b How many servings of fruit do you eat on one of those days? USE SHOWCARD
Number of servings
D 2a In a typical week, on how many days do you eat vegetables? USE SHOWCARD
Number of days If Zero days, go to D3
D 2b How many servings of vegetables do you eat on one of those days? USE SHOWCARD
Number of servings
D 3
What type of oil or fat is most often used for meal preparation in your household? USE SHOWCARD SELECT ONLY ONE
Vegetable oil 1
Lard or drippings 2 Butter 3
Margarine 4 Coconut cream 5
Coconut oil 6 Other 7
None in particular 8 None used 9 Don’t know 10
D 4 In a typical week, on how many days do you eat fresh fish? Number of days
D 5 In a typical week, on how many days do you eat tinned fish? Number of days
Physical Activity (Section P) Next I am going to ask you about the time you spend doing different types of physical activity. Please answer these questions even if you do not consider yourself to be an active person. Think first about the time you spend doing work. Think of work as the things that you have to do such as paid or unpaid work, household chores, harvesting food, fishing or hunting for food, seeking employment.
P 1 Does your work involve mostly sitting or standing, with walking for no more than 10 minutes at a time?
Yes No
1 2
If Yes, go to P6
P 2 Does your work involve vigorous activity, like heavy lifting, digging or construction work for at least 10 minutes at a time?
Yes No
1 2
If No, go to P4
P 3a In a typical week, on how many days do you do vigorous activities as part of your work?
Days a week
P 3b On a typical day on which you do vigorous activity, how much time do you spend doing such work? In hours and minutes hrs : mins
OR in Minutes only or minutes

52
P 4 Does your work involve moderate-intensity activity, like brisk walking or carrying light loads for at least 10 minutes at a time? INSERT EXAMPLES & USE SHOWCARD
Yes No
1 2
If No, go to P6
P 5a In a typical week, on how many days do you do moderate-intensity activities as part of your work? Days a week
P 5b On a typical day on which you did moderate-intensity activities, how much time do you spend doing such work?
In hours and minutes hrs : mins OR in Minutes only or minutes
P 6 How long is your typical work day? Number of hours hrs
Other than activities that you’ve already mentioned, I would like to ask you about the way you travel to and from places. For example to work, for shopping, to market, to church.
P 7 Do you walk or use a bicycle (pedal cycle) for at least 10 minutes continuously to get to and from places?
Yes No
1 2
If No, go to P9
P 8a In a typical week, on how many days do you walk or bicycle for at least 10 minutes to get to and from places?
Days a week
P 8b How much time would you spend walking or bicycling for travel on a typical day? In hours and minutes hrs : mins
OR in Minutes only or minutes The next questions ask about activities you do in your leisure time. Think about activities you do for recreation, fitness or sports. Do not include the physical activities you do at work or for travel mentioned already.
P 9 Does your leisure time involve mostly sitting, reclining, or standing, with no physical activity lasting more than 10 minutes at a time?
Yes No
1 2
If Yes, go to P 14
P 10 In your leisure time, do you do any vigorous activities like running or strenuous sports, weight lifting for at least 10 minutes at a time? INSERT EXAMPLES & USE SHOWCARD
Yes No
1 2
If No, go to P 12
P 11a If Yes, In a typical week, on how many days do you do vigorous activities as part of your leisure time?
Days a week
P 11b How much time do you spend doing this on a typical day?
In hours and minutes hrs : mins
OR in Minutes only or minutes
P 12 In your leisure time, do you do any moderate-intensity activities like brisk walking, cycling or swimming for at least 10 minutes at a time? INSERT EXAMPLES & USE SHOWCARD
Yes No
1 2
If No, go to P 14
P 13a If Yes In a typical week, on how many days do you do moderate-intensity activities as part of [leisure time]?
Days a week
P 13b How much time do you spend doing this on a typical day?
In hours and minutes hrs : mins
OR in Minutes only or minutes
The following question is about sitting or reclining. Think back over the past 7 days, to time spent at work, at home, in leisure, including time spent sitting at a desk, visiting friends, reading, or watching television, but do not include time spent sleeping.
P 14 Over the past 7 days, how much time did you spend sitting or reclining on a typical day?
In hours and minutes hrs : mins
OR in Minutes only or minutes
Note: Code DK for “Don’t know” or “Don’t remember”.

53
History of High Blood Pressure
V 2 How many times did you visit the doctor during the last 12 months? (Include hospitalisation or visits to the outpatient department/health clinics; do not include visits to the dentist).
Number of times
H 1 When was your blood pressure last measured by a health professional?
Within past 12 months 1-5 years ago
Not within past 5 yrs
1 2 3
H 2 During the past 12 months have you been told by a doctor or other health worker that you have elevated blood pressure or hypertension?
Yes No
1 2
If No, skip to H6
H 3 Are you currently receiving any of the following treatments for high blood pressure prescribed by a doctor or other health worker?
H 3a Drugs (medication) that you have taken in the last 2 weeks Yes No
1 2
H 3b Special prescribed diet Yes No
1 2
H 3c Advice or treatment to lose weight Yes No
1 2
H 3d Advice or treatment to stop smoking Yes No
1 2
H 3e Advice to start or do more exercise Yes No
1 2
H 4 During the past 12 months have you seen a traditional healer for elevated blood pressure or hypertension
Yes No
1 2
H 5 Are you currently taking any herbal or traditional remedy for your high blood pressure?
Yes No
1 2
History of Diabetes H 6 When was your blood sugar last measured by a health professional? Within past 12 months
1-5 years ago Not within past 5 yrs
1 2 3
H 7 Have you ever been told by a doctor or other health worker that you have diabetes?
Yes No
1 2
If No, skip to V3
H 8 Are you currently receiving any of the following treatments for diabetes prescribed by a doctor or other health worker?
H 8a Insulin Yes No
1 2
H 8b Oral drug (medication that you have taken in the last 2 weeks Yes No
1 2
H 8c Special prescribed diet Yes No
1 2
H 8d Advice or treatment to lose weight Yes No
1 2
H 8e Advice or treatment to stop smoking Yes No
1 2
H 8f Advice to start or do more exercise Yes No
1 2
H 9 During the past 12 months have you seen a traditional healer for diabetes?
Yes No
1 2
H 10 Are you currently taking any herbal or traditional remedy for your diabetes?
Yes No
1 2
Comments: Step 1 (to be answered by the Interviewer)
V 3 Are there any irregularities or problems with the measurements? Yes No
1 2
If yes, please describe. _____________________________________________________________________________
54
_____________________________________________________________________________________________________________________
Step 2 Physical Measurements
Height and weight Coding Column M 1 Technician ID Code
M 2a & 2b
Device IDs for height and weight (2a) height (2b) weight
M 3 Height
(in Centimetres) .
M 4 Weight If too large for scale, use two scales
(in Kilograms) .
M 5 (For women) Are you pregnant?
Yes No
1 2
If Yes, Skip Waist
Waist
M 6 Technician ID
M 7 Device ID for waist M 8 Waist circumference
(in Centimetres) .
M 16 Hip circumference (in Centimetres) .
Blood pressure Coding Column M 9 Technician ID
M 10 Device ID for blood pressure
M 11 Cuff size used Standard Large
Extra large
1 2 3
M 12a Reading 1 Systolic BP Systolic mmHg M 12b Diastolic BP Diastolic mmHg
M 13a Reading 2 Systolic BP Systolic mmHg M 13b Diastolic BP Diastolic mmHg
M 14a Reading 3 Systolic BP Systolic mmHg M 14b Diastolic BP Diastolic mmHg
Heart Rate
M 17a Reading 1 Beats per minute:
M 17b Reading 2 Beats per minute:
M 17c Reading 3 Beats per minute:

55
Step 3 Biochemical Measurements
Blood glucose Coding Column B 1 Since 10pm last night, have you had anything to eat,
drink chew or suck, other than water? Yes No
1 2
B 2 Technician ID Code B 3 Device ID code B 4 Time of day blood specimen taken (24 hour clock)
hrs : mins B 5 Blood glucose
mmol/l . OR Low
High Unable to assess
1 2 3
OR
Blood Lipids B 6 Technician ID Code
B 7 Device ID code
B 8 Total cholesterol mmol/l .
OR Low High
Unable to assess
1 2 3
OR
Haemoglobin B 15 (For women age 15-44 years)
Are you breastfeeding? Yes No
1 2
B 16 Technician ID Code
B 17 Device ID code
B 18 Haemoglobin
.
Comments: Step 2 and 3 (to be answered by any Step 2 or 3 technician)
V 4 Are there any irregularities or problems with the measurements? Yes No
1 2
If yes, please describe. __________________________________________________________________________ __________________________________________________________________________________________________________________ __________________________________________________________________________________________________________________ __________________________________________________________________________________________________________________

56
Appendix 2. The Whole Data Book of the Kiribati STEPS Survey
WHO STEPS
CHRONIC DISEASE
RISK FACTOR SURVEILLANCE
DATA BOOK FOR
KIRIBATI

57
Demographic Information Results
Age group by sex
Description: Summary information by age group and sex of the respondents.
Instrument question: • Sex • What is your date of birth?
Age group and sex of respondents
Age Group (years)
Men Women Both Sexes n % n % n %
25-34 163 42.0 225 58.0 388 28.2 35-44 186 43.8 239 56.2 425 30.8 45-54 165 47.0 186 53.0 351 25.5 55-64 88 41.1 126 58.9 214 15.5 25-64 602 43.7 776 56.3 1378 100.0
Ethnicity
Description: Summary results for the ethnicity of the respondents.
Instrument Question: • What is your ethnic background?
Ethnic group of respondents
Age Group (years)
Both Sexes n % Kiribati % Other
25-34 386 99.2 0.8 35-44 422 99.5 0.5 45-54 351 99.4 0.6 55-64 213 98.6 1.4 25-64 1372 99.3 0.7
58
Education Description: Mean number of years of education among respondents.
Instrument question: • In total, how many years have you spent at school or in full-time study
(excluding pre-school)?
Mean number of years of education Age Group
(years) Men Women Both Sexes
n Mean n Mean n Mean 25-34 162 10.0 223 10.3 385 10.2 35-44 186 9.4 237 8.9 423 9.1 45-54 161 7.8 184 6.8 345 7.2 55-64 83 7.4 122 5.1 205 6.0 25-64 592 8.9 766 8.2 1358 8.5

59
Highest level of education
Description: Highest level of education achieved by the survey respondents.
Instrument question: • What is the highest level of education you have completed?
Highest level of education
Age Group (years)
Men
n % No formal
schooling
% Less than primary school
% Primary school
completed
% Secondary school
completed
% College/ University completed
% Post graduate degree
completed 25-34 163 0.6 9.8 65.0 20.9 3.7 0.0 35-44 186 0.5 10.2 75.3 11.8 2.2 0.0 45-54 164 6.7 29.3 51.2 9.1 3.0 0.6 55-64 85 8.2 30.6 42.4 10.6 7.1 1.2 25-64 598 3.3 18.2 61.2 13.4 3.5 0.3
Highest level of education
Age Group (years)
Women
n % No formal
schooling
% Less than primary school
% Primary school
completed
% Secondary school
completed
% College/ University completed
% Post graduate degree
completed 25-34 225 0.0 9.3 61.8 27.6 1.3 0.0 35-44 239 1.3 15.9 74.5 7.9 0.4 0.0 45-54 186 2.7 42.5 48.9 5.4 0.5 0.0 55-64 125 18.4 44.0 33.6 2.4 0.8 0.8 25-64 775 4.0 24.9 58.1 12.1 0.8 0.1
Highest level of education
Age Group (years)
Both Sexes
n % No formal
schooling
% Less than primary school
% Primary school
completed
% Secondary school
completed
% College/ University completed
% Post graduate degree
completed 25-34 388 0.3 9.5 63.1 24.7 2.3 0.0 35-44 425 0.9 13.4 74.8 9.6 1.2 0.0 45-54 350 4.6 36.3 50.0 7.1 1.7 0.3 55-64 210 14.3 38.6 37.1 5.7 3.3 1.0 25-64 1373 3.7 22.0 59.4 12.7 2.0 0.2
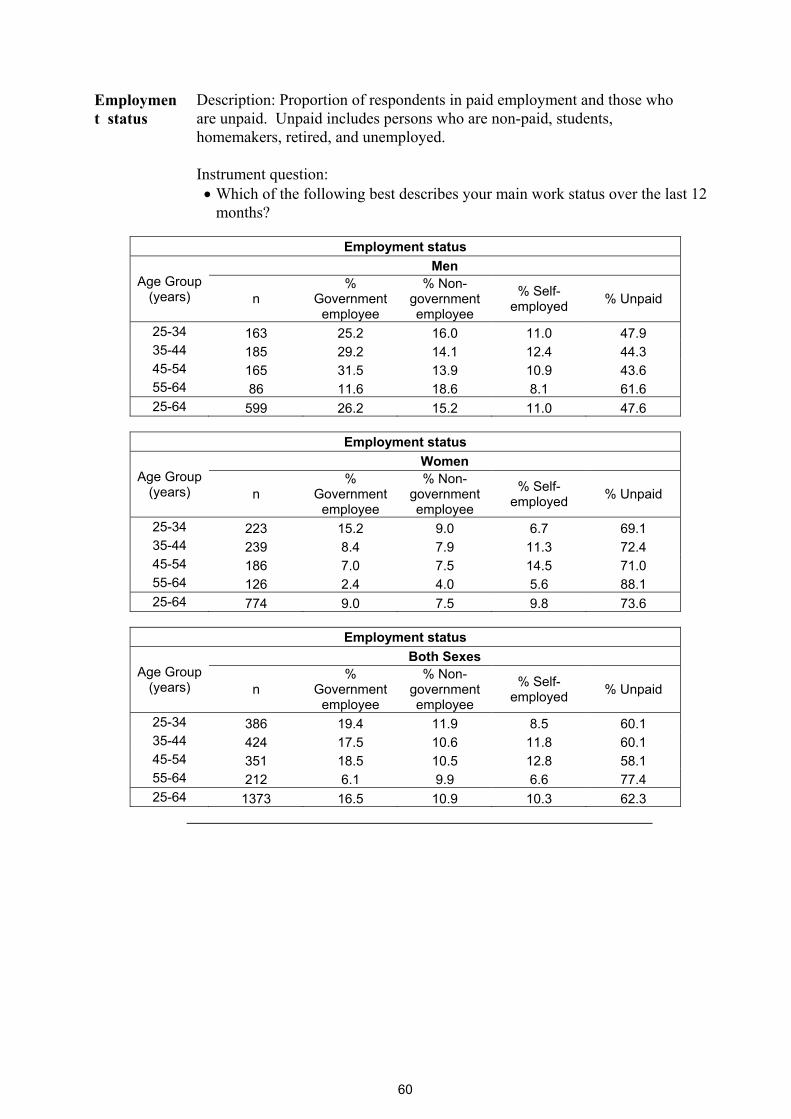
60
Employment status
Description: Proportion of respondents in paid employment and those who are unpaid. Unpaid includes persons who are non-paid, students, homemakers, retired, and unemployed.
Instrument question: • Which of the following best describes your main work status over the last 12
months?
Employment status
Age Group (years)
Men
n %
Government employee
% Non-government employee
% Self-employed % Unpaid
25-34 163 25.2 16.0 11.0 47.9 35-44 185 29.2 14.1 12.4 44.3 45-54 165 31.5 13.9 10.9 43.6 55-64 86 11.6 18.6 8.1 61.6 25-64 599 26.2 15.2 11.0 47.6
Employment status
Age Group (years)
Women
n %
Government employee
% Non-government employee
% Self-employed % Unpaid
25-34 223 15.2 9.0 6.7 69.1 35-44 239 8.4 7.9 11.3 72.4 45-54 186 7.0 7.5 14.5 71.0 55-64 126 2.4 4.0 5.6 88.1 25-64 774 9.0 7.5 9.8 73.6
Employment status
Age Group (years)
Both Sexes
n %
Government employee
% Non-government employee
% Self-employed % Unpaid
25-34 386 19.4 11.9 8.5 60.1 35-44 424 17.5 10.6 11.8 60.1 45-54 351 18.5 10.5 12.8 58.1 55-64 212 6.1 9.9 6.6 77.4 25-64 1373 16.5 10.9 10.3 62.3
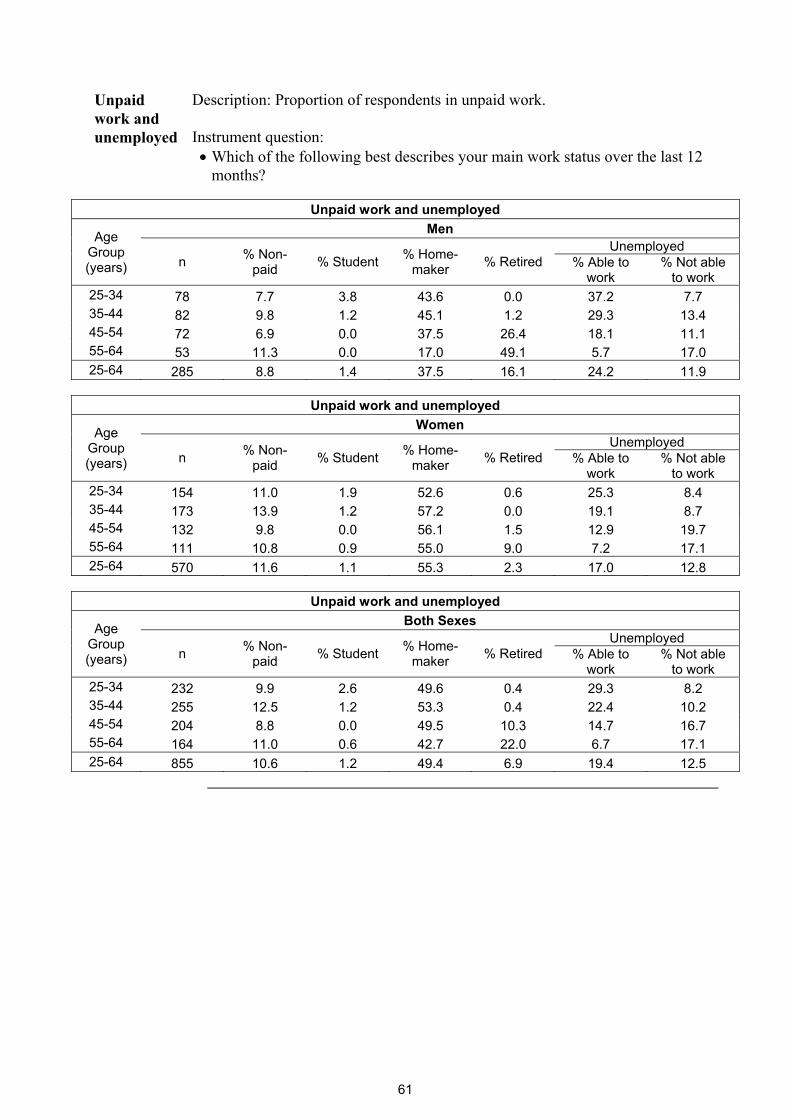
61
Unpaid work and unemployed
Description: Proportion of respondents in unpaid work.
Instrument question: • Which of the following best describes your main work status over the last 12
months?
Unpaid work and unemployed
Age Group (years)
Men
n % Non-paid % Student % Home-
maker % Retired Unemployed
% Able to work
% Not able to work
25-34 78 7.7 3.8 43.6 0.0 37.2 7.7 35-44 82 9.8 1.2 45.1 1.2 29.3 13.4 45-54 72 6.9 0.0 37.5 26.4 18.1 11.1 55-64 53 11.3 0.0 17.0 49.1 5.7 17.0 25-64 285 8.8 1.4 37.5 16.1 24.2 11.9
Unpaid work and unemployed
Age Group (years)
Women
n % Non-paid % Student % Home-
maker % Retired Unemployed
% Able to work
% Not able to work
25-34 154 11.0 1.9 52.6 0.6 25.3 8.4 35-44 173 13.9 1.2 57.2 0.0 19.1 8.7 45-54 132 9.8 0.0 56.1 1.5 12.9 19.7 55-64 111 10.8 0.9 55.0 9.0 7.2 17.1 25-64 570 11.6 1.1 55.3 2.3 17.0 12.8
Unpaid work and unemployed
Age Group (years)
Both Sexes
n % Non-paid % Student % Home-
maker % Retired Unemployed
% Able to work
% Not able to work
25-34 232 9.9 2.6 49.6 0.4 29.3 8.2 35-44 255 12.5 1.2 53.3 0.4 22.4 10.2 45-54 204 8.8 0.0 49.5 10.3 14.7 16.7 55-64 164 11.0 0.6 42.7 22.0 6.7 17.1 25-64 855 10.6 1.2 49.4 6.9 19.4 12.5

62
Per capita annual income
Description: Mean reported per capita annual income of respondents in local currency. Instrument question:
• How many people older than 18 years, including yourself, live in your household? • Taking the past year, can you tell me what the average earning of the household
has been?
Mean annual per capita income
n Mean 1226 1882.3
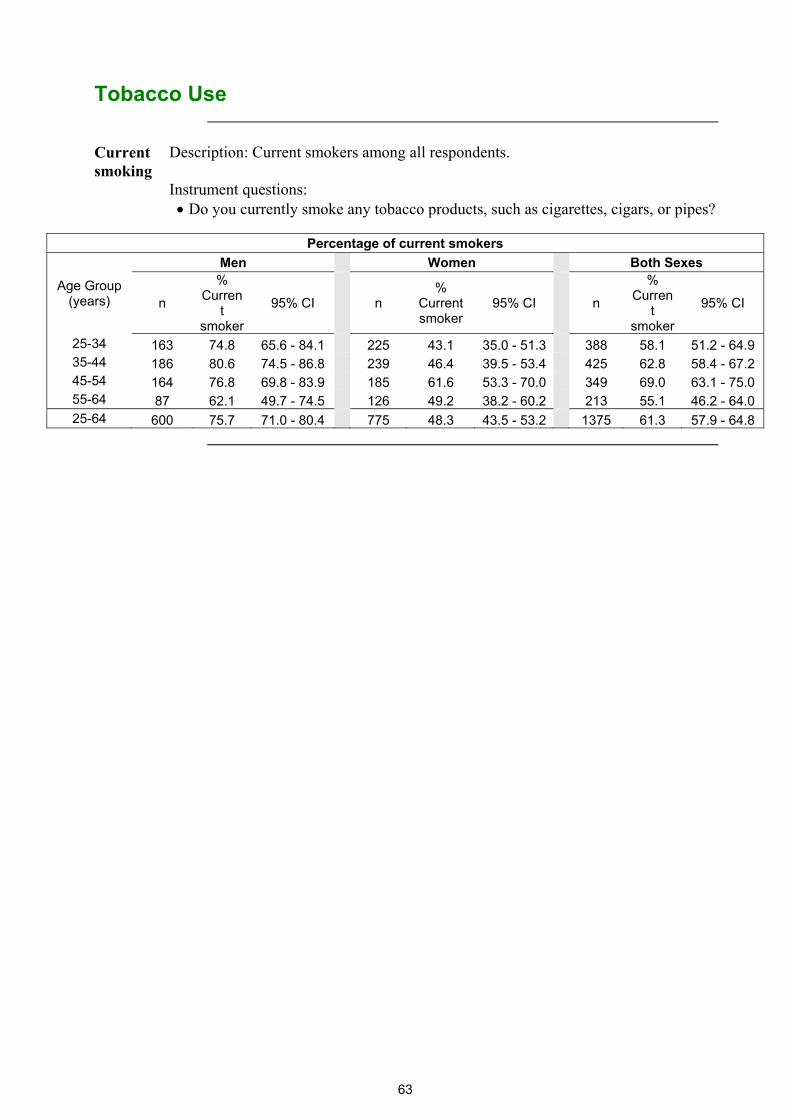
63
Tobacco Use
Current smoking
Description: Current smokers among all respondents.
Instrument questions: • Do you currently smoke any tobacco products, such as cigarettes, cigars, or pipes?
Percentage of current smokers
Age Group (years)
Men Women Both Sexes
n
% Curren
t smoker
95% CI n %
Current smoker
95% CI n
% Curren
t smoker
95% CI
25-34 163 74.8 65.6 - 84.1 225 43.1 35.0 - 51.3 388 58.1 51.2 - 64.9 35-44 186 80.6 74.5 - 86.8 239 46.4 39.5 - 53.4 425 62.8 58.4 - 67.2 45-54 164 76.8 69.8 - 83.9 185 61.6 53.3 - 70.0 349 69.0 63.1 - 75.0 55-64 87 62.1 49.7 - 74.5 126 49.2 38.2 - 60.2 213 55.1 46.2 - 64.0 25-64 600 75.7 71.0 - 80.4 775 48.3 43.5 - 53.2 1375 61.3 57.9 - 64.8
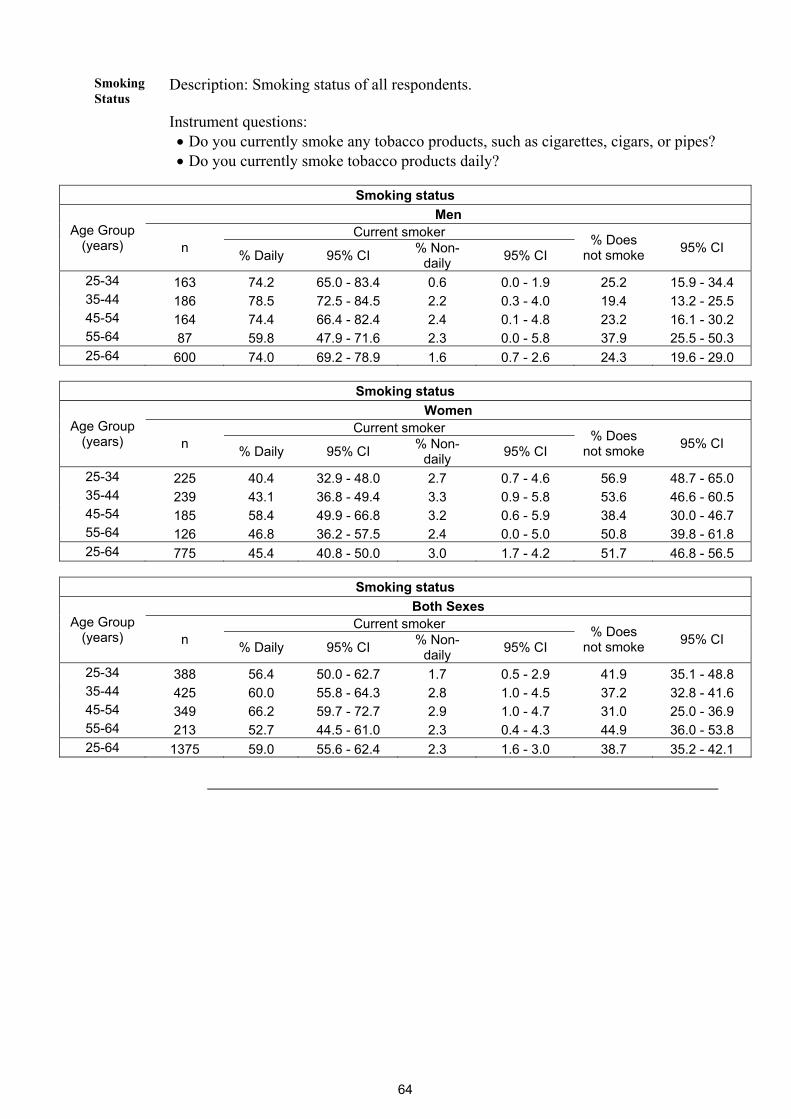
64
Smoking Status
Description: Smoking status of all respondents.
Instrument questions: • Do you currently smoke any tobacco products, such as cigarettes, cigars, or pipes? • Do you currently smoke tobacco products daily?
Smoking status
Age Group (years)
Men
n Current smoker % Does
not smoke 95% CI % Daily 95% CI % Non-daily 95% CI
25-34 163 74.2 65.0 - 83.4 0.6 0.0 - 1.9 25.2 15.9 - 34.4 35-44 186 78.5 72.5 - 84.5 2.2 0.3 - 4.0 19.4 13.2 - 25.5 45-54 164 74.4 66.4 - 82.4 2.4 0.1 - 4.8 23.2 16.1 - 30.2 55-64 87 59.8 47.9 - 71.6 2.3 0.0 - 5.8 37.9 25.5 - 50.3 25-64 600 74.0 69.2 - 78.9 1.6 0.7 - 2.6 24.3 19.6 - 29.0
Smoking status
Age Group (years)
Women
n Current smoker % Does
not smoke 95% CI % Daily 95% CI % Non-daily 95% CI
25-34 225 40.4 32.9 - 48.0 2.7 0.7 - 4.6 56.9 48.7 - 65.0 35-44 239 43.1 36.8 - 49.4 3.3 0.9 - 5.8 53.6 46.6 - 60.5 45-54 185 58.4 49.9 - 66.8 3.2 0.6 - 5.9 38.4 30.0 - 46.7 55-64 126 46.8 36.2 - 57.5 2.4 0.0 - 5.0 50.8 39.8 - 61.8 25-64 775 45.4 40.8 - 50.0 3.0 1.7 - 4.2 51.7 46.8 - 56.5
Smoking status
Age Group (years)
Both Sexes
n Current smoker % Does
not smoke 95% CI % Daily 95% CI % Non-daily 95% CI
25-34 388 56.4 50.0 - 62.7 1.7 0.5 - 2.9 41.9 35.1 - 48.8 35-44 425 60.0 55.8 - 64.3 2.8 1.0 - 4.5 37.2 32.8 - 41.6 45-54 349 66.2 59.7 - 72.7 2.9 1.0 - 4.7 31.0 25.0 - 36.9 55-64 213 52.7 44.5 - 61.0 2.3 0.4 - 4.3 44.9 36.0 - 53.8 25-64 1375 59.0 55.6 - 62.4 2.3 1.6 - 3.0 38.7 35.2 - 42.1

65
Frequency of smoking
Description: Percentage of current daily smokers among smokers.
Instrument question: • Do you currently smoke any tobacco products, such as cigarettes, cigars, or pipes? • Do you currently smoke tobacco products daily?
Current daily smokers among smokers
Age Group (years)
Men Women Both Sexes
n % Daily smokers 95% CI n % Daily
smokers 95% CI n % Daily smokers 95% CI
25-34 122 99.2 97.5 - 100.0 97 93.8 89.6 - 98.1 219 97.1 95.1 - 99.035-44 150 97.3 95.0 - 99.7 111 92.8 87.9 - 97.7 261 95.6 92.9 - 98.345-54 126 96.8 93.7 - 100.0 114 94.7 90.4 - 99.0 240 95.9 93.1 - 98.655-64 54 96.3 90.8 - 100.0 62 95.2 89.9 - 100.0 116 95.7 92.5 - 99.025-64 452 97.8 96.6 - 99.1 384 93.9 91.5 - 96.3 836 96.2 95.1 - 97.3
Manufactured cigarette smokers
Description: Percentage of smokers who use manufactured cigarettes among daily smokers.
Instrument question: • On average, how many of the following do you smoke each day?
Manufactured cigarette smokers among daily smokers
Age Group (years)
Men Women Both Sexes
n
% Manu-
factured cigarett
e smoker
95% CI n
% Manu-
factured cigarett
e smoker
95% CI n
% Manu-
factured cigarett
e smoker
95% CI
25-34 121 43.0 33.8 - 52.2 91 51.6 40.3 - 63.0 212 46.3 38.8 - 53.735-44 146 45.9 34.2 - 57.6 103 48.5 40.5 - 56.6 249 46.9 39.4 - 54.445-54 122 41.0 31.4 - 50.6 108 37.0 28.6 - 45.5 230 39.2 33.7 - 44.755-64 52 42.3 32.8 - 51.8 59 39.0 24.6 - 53.4 111 40.7 33.4 - 48.125-64 441 43.5 38.5 - 48.5 361 45.7 40.2 - 51.1 802 44.4 40.7 - 48.1
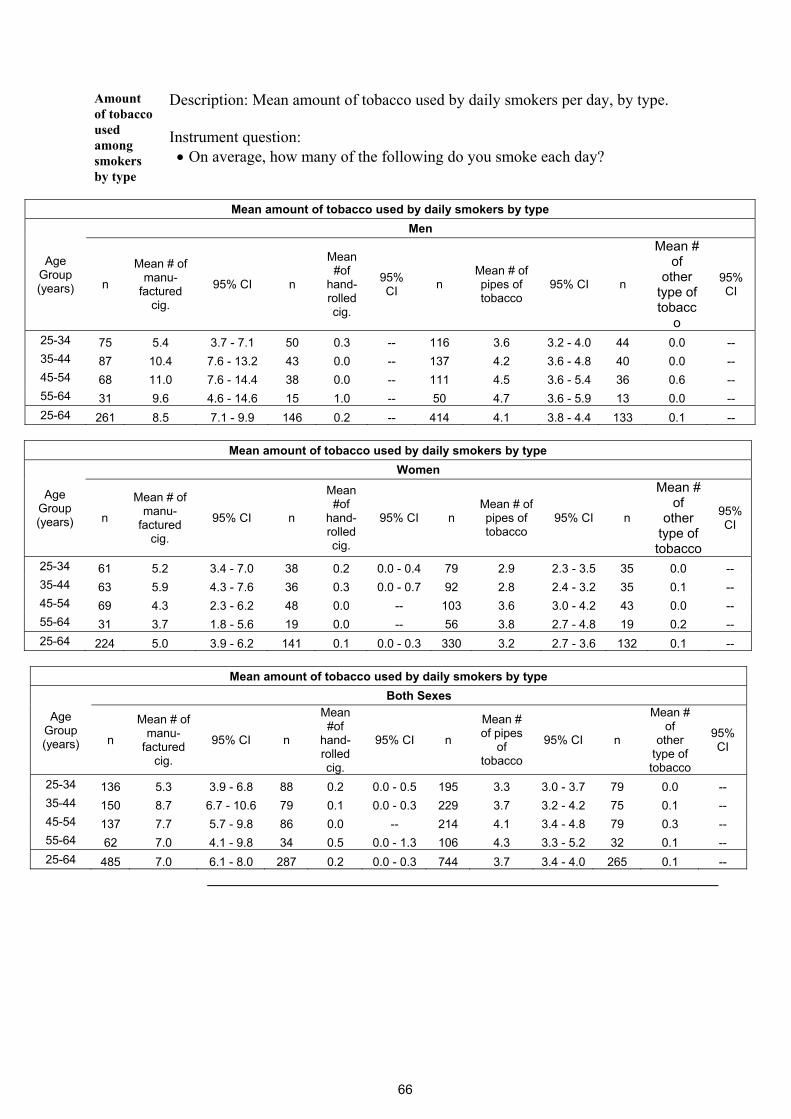
66
Amount of tobacco used among smokers by type
Description: Mean amount of tobacco used by daily smokers per day, by type.
Instrument question: • On average, how many of the following do you smoke each day?
Mean amount of tobacco used by daily smokers by type
Age Group (years)
Men
n
Mean # of manu-
factured cig.
95% CI n
Mean #of
hand-rolled cig.
95% CI n
Mean # of pipes of tobacco
95% CI n
Mean # of
other type of tobacc
o
95% CI
25-34 75 5.4 3.7 - 7.1 50 0.3 -- 116 3.6 3.2 - 4.0 44 0.0 -- 35-44 87 10.4 7.6 - 13.2 43 0.0 -- 137 4.2 3.6 - 4.8 40 0.0 -- 45-54 68 11.0 7.6 - 14.4 38 0.0 -- 111 4.5 3.6 - 5.4 36 0.6 -- 55-64 31 9.6 4.6 - 14.6 15 1.0 -- 50 4.7 3.6 - 5.9 13 0.0 -- 25-64 261 8.5 7.1 - 9.9 146 0.2 -- 414 4.1 3.8 - 4.4 133 0.1 --
Mean amount of tobacco used by daily smokers by type
Age Group (years)
Women
n
Mean # of manu-
factured cig.
95% CI n
Mean #of
hand-rolled cig.
95% CI n Mean # of pipes of tobacco
95% CI n
Mean # of
other type of tobacco
95% CI
25-34 61 5.2 3.4 - 7.0 38 0.2 0.0 - 0.4 79 2.9 2.3 - 3.5 35 0.0 -- 35-44 63 5.9 4.3 - 7.6 36 0.3 0.0 - 0.7 92 2.8 2.4 - 3.2 35 0.1 -- 45-54 69 4.3 2.3 - 6.2 48 0.0 -- 103 3.6 3.0 - 4.2 43 0.0 -- 55-64 31 3.7 1.8 - 5.6 19 0.0 -- 56 3.8 2.7 - 4.8 19 0.2 -- 25-64 224 5.0 3.9 - 6.2 141 0.1 0.0 - 0.3 330 3.2 2.7 - 3.6 132 0.1 --
Mean amount of tobacco used by daily smokers by type
Age Group (years)
Both Sexes
n
Mean # of manu-
factured cig.
95% CI n
Mean #of
hand-rolled cig.
95% CI n
Mean # of pipes
of tobacco
95% CI n
Mean # of
other type of tobacco
95% CI
25-34 136 5.3 3.9 - 6.8 88 0.2 0.0 - 0.5 195 3.3 3.0 - 3.7 79 0.0 -- 35-44 150 8.7 6.7 - 10.6 79 0.1 0.0 - 0.3 229 3.7 3.2 - 4.2 75 0.1 -- 45-54 137 7.7 5.7 - 9.8 86 0.0 -- 214 4.1 3.4 - 4.8 79 0.3 -- 55-64 62 7.0 4.1 - 9.8 34 0.5 0.0 - 1.3 106 4.3 3.3 - 5.2 32 0.1 -- 25-64 485 7.0 6.1 - 8.0 287 0.2 0.0 - 0.3 744 3.7 3.4 - 4.0 265 0.1 --

67
Initiation of smoking
Description: Mean age of initiation and mean duration of smoking, in years, among daily smokers (no total age group for mean duration of smoking as age influences these values).
Instrument questions: • How old were you when you first started smoking daily? • How long ago did you stop smoking daily?
Mean age started smoking
Age Group (years)
Men Women Both Sexes
n Mean age 95% CI n Mean
age 95% CI n Mean age 95% CI
25-34 116 17.4 16.9 - 17.9 87 18.9 18.1 - 19.8 203 18.0 17.5 - 18.4 35-44 135 18.1 17.1 - 19.1 101 21.1 20.1 - 22.2 236 19.3 18.6 - 20.0 45-54 118 19.2 17.8 - 20.6 107 21.4 20.1 - 22.7 225 20.2 19.1 - 21.3 55-64 50 19.8 17.8 - 21.8 58 21.4 19.1 - 23.6 108 20.6 19.2 - 22.0 25-64 419 18.2 17.7 - 18.7 353 20.5 19.7 - 21.3 772 19.1 18.7 - 19.6
Mean duration of smoking
Age Group (years)
Men Women Both Sexes
n Mean duratio
n 95% CI n Mean
duration 95% CI n Mean duratio
n 95% CI
25-34 116 12.2 11.7 - 12.8 87 11.3 10.3 - 12.2 203 11.9 11.4 - 12.4 35-44 135 21.3 20.2 - 22.3 101 18.2 17.1 - 19.4 236 20.1 19.4 - 20.8 45-54 118 29.8 28.5 - 31.1 107 27.3 25.9 - 28.8 225 28.7 27.6 - 29.7 55-64 50 39.0 36.6 - 41.4 58 37.2 34.7 - 39.6 108 38.1 36.6 - 39.6 25-64 419 21.1 20.1 - 22.2 353 20.4 19.4 - 21.5 772 20.8 20.1 - 21.6

68
Percentage of ex daily smokers in the population
Description: Percentage of ex-daily smokers among all respondents and the mean duration, in years, since ex-daily smokers quit smoking daily.
Instrument question: • In the past did you ever smoke daily? • How old were you when you stopped smoking daily?
Ex-daily smokers among all respondents
Age Group (years)
Men Women Both Sexes
n % ex daily
smokers 95% CI n
% ex daily
smokers 95% CI n
% ex daily
smokers 95% CI
25-34 42 35.7 16.8 - 54.7 131 17.6 11.2 - 23.9 173 22.7 15.5 - 29.9
35-44 39 28.2 11.4 - 45.0 128 25.0 15.8 - 34.2 167 25.8 18.8 - 32.9
45-54 43 48.8 34.0 - 63.7 73 26.0 17.8 - 34.3 116 34.9 27.5 - 42.3
55-64 34 64.7 50.5 - 78.9 64 34.4 21.7 - 47.1 98 46.3 37.1 - 55.5
25-64 158 41.2 31.9 - 50.5 396 23.1 19.0 - 27.1 554 28.6 24.5 - 32.7
Mean years since cessation
Age Group (years)
Men Women Both Sexes
n Mean years 95% CI n Mean
years 95% CI n Mean years 95% CI
25-34 4 14.3 -- 4 14.5 12.1 - 16.9 8 14.4 12.0 - 16.8 35-44 5 18.4 -- 9 21.9 17.0 - 26.7 14 20.5 16.3 - 24.7 45-54 4 28.0 -- 9 22.8 18.6 - 27.0 13 24.5 20.5 - 28.4 55-64 13 25.2 -- 12 21.9 19.2 - 24.6 25 23.8 17.6 - 30.0 25-64 26 21.5 -- 34 20.8 18.3 - 23.4 60 21.1 18.4 - 23.8

69
Alcohol Consumption
Alcohol consumption status
Description: Alcohol consumption status of all respondents. Abstainers have not consumed alcohol in the last 12 months.*
Instrument questions: • Have you consumed alcohol (such as beer, wine, spirits, fermented cider, or
(add other local examples) within the past 12 months?
Alcohol consumption status
Age Group (years)
Men
n % Drank in last 12 months 95% CI % Abstainer 95% CI
25-34 163 58.3 49.8 - 66.8 41.7 33.2 - 50.2 35-44 186 43.5 35.6 - 51.5 56.5 48.5 - 64.4 45-54 165 40.0 29.9 - 50.1 60.0 49.9 - 70.1 55-64 87 29.9 19.8 - 40.0 70.1 60.0 - 80.2 25-64 601 46.9 41.6 - 52.2 53.1 47.8 - 58.4
Alcohol consumption status
Age Group (years)
Women
n % Drank in last 12 months 95% CI % Abstainer 95% CI
25-34 225 7.6 3.6 - 11.6 92.4 88.4 - 96.4 35-44 239 4.2 1.2 - 7.2 95.8 92.8 - 98.8 45-54 186 8.1 3.3 - 12.8 91.9 87.2 - 96.7 55-64 126 3.2 0.0 - 6.4 96.8 93.6 - 100.0 25-64 776 6.1 3.5 - 8.7 93.9 91.3 - 96.5
Alcohol consumption status
Age Group (years)
Both Sexes
n % Drank in last 12 months 95% CI % Abstainer 95% CI
25-34 388 31.5 26.5 - 36.4 68.5 63.6 - 73.5 35-44 425 23.0 18.4 - 27.7 77.0 72.3 - 81.6 45-54 351 23.7 17.8 - 29.6 76.3 70.4 - 82.2 55-64 213 15.4 9.4 - 21.3 84.6 78.7 - 90.6 25-64 1377 25.5 21.9 - 29.0 74.5 71.0 - 78.1

70
Frequency of alcohol consumption
Description: Frequency of alcohol consumption in the last year among those respondents who have drank in the last 12 months.
Instrument question: • In the past 12 months, how frequently have you had at least one drink?
Frequency of alcohol consumption in the last 12 months
Age Group (years)
Men
n % ≥ 5 days p. week 95% CI % 1-4 days
p. week 95% CI % 1-3 days p. month 95% CI
% < once
a month 95% CI
25-34 94 6.4 1.0 - 11.8 24.5 16.0 - 32.9 37.2 30.1 - 44.3 31.9 20.6 - 43.3 35-44 80 8.8 2.5 - 15.0 27.5 17.3 - 37.7 40.0 27.8 - 52.2 23.8 15.2 - 32.3 45-54 66 6.1 1.1 - 11.0 31.8 23.6 - 40.1 37.9 27.7 - 48.0 24.2 14.5 - 33.9 55-64 25 12.0 1.1 - 22.9 32.0 12.6 - 51.4 28.0 12.6 - 43.4 28.0 7.5 - 48.5 25-64 265 7.4 4.2 - 10.6 27.1 21.4 - 32.9 37.5 30.7 - 44.4 27.9 20.1 - 35.8
Frequency of alcohol consumption in the last 12 months
Age Group (years)
Women
n % ≥ 5 days p. week 95% CI % 1-4 days
p. week 95% CI % 1-3 days p. month 95% CI
% < once a month
95% CI
25-34 17 -- -- 52.9 23.3 - 82.6 -- -- 47.1 17.4 - 76.7 35-44 10 10.0 2.4 - 17.6 10.0 0.0 - 28.5 30.0 5.3 - 54.7 50.0 30.4 - 69.6 45-54 15 -- -- 20.0 0.0 - 52.5 20.0 0.0 - 42.7 60.0 30.9 - 89.1 55-64 4 -- -- -- -- 75.0 29.2 - 100.0 25.0 0.0 - 70.8 25-64 46 2.2 1.3 - 3.0 32.2 11.9 - 52.6 16.0 7.4 - 24.7 49.6 29.3 - 69.9
Frequency of alcohol consumption in the last 12 months
Age Group (years)
Both Sexes
n % ≥ 5 days p. week 95% CI % 1-4 days
p. week 95% CI % 1-3 days p. month 95% CI
% < once a month
95% CI
25-34 111 5.6 0.9 - 10.2 28.1 20.9 - 35.4 32.5 25.8 - 39.1 33.9 23.5 - 44.2 35-44 90 8.9 3.2 - 14.5 25.8 16.5 - 35.1 39.0 27.8 - 50.3 26.3 16.9 - 35.6 45-54 81 5.0 0.8 - 9.2 29.8 19.6 - 40.0 34.8 26.0 - 43.5 30.5 21.2 - 39.8 55-64 29 10.6 1.3 - 19.9 28.3 11.4 - 45.2 33.5 16.0 - 50.9 27.7 7.7 - 47.6 25-64 311 6.7 3.8 - 9.7 27.8 22.5 - 33.0 34.8 28.5 - 41.2 30.7 23.2 - 38.2

71
Standard drinks per drinking day
Description: Number of standard drinks consumed on a drinking day among those respondents who have drank in the last 12 months.
Instrument question: • When you drink alcohol, on average, how many drinks do you have during one
day?
Number of standard drinks consumed on a drinking day
Age Group (years)
Men
n % 1 drink 95% CI % 2-3
drinks 95% CI % 4-5 drinks 95% CI % 6+
drinks 95% CI
Mean # of
standard drinks
95% CI
25-34 94 -- -- 1.1 0.0 - 3.3 11.7 5.1 - 18.3 87.2 79.7 - 94.7 12.1 10.3 - 13.9 35-44 80 2.5 0.0 - 6.1 2.5 0.0 - 6.1 15.0 6.7 - 23.3 80.0 69.7 - 90.3 11.4 10.2 - 12.7 45-54 65 -- -- 6.2 0.0 - 15.5 12.3 6.1 - 18.5 81.5 72.1 - 90.9 11.1 9.4 - 12.9 55-64 25 -- -- 8.0 0.0 - 19.5 20.0 2.3 - 37.7 72.0 50.1 - 93.9 8.8 6.4 - 11.2 25-64 264 0.7 0.0 - 1.8 2.8 0.1 - 5.5 13.3 9.0 - 17.6 83.1 77.4 - 88.8 11.5 10.5 - 12.5
Number of standard drinks consumed on a drinking day
Age Group (years)
Women
n % 1 drink 95% CI % 2-3
drinks 95% CI % 4-5 drinks 95% CI % 6+
drinks 95% CI
Mean # of
standard drinks
95% CI
25-34 17 -- -- 5.9 0.0 - 17.4 29.4 2.3 - 56.5 64.7 39.0 - 90.4 8.3 -- 35-44 10 20.0 0.0 - 46.3 20.0 0.0 - 46.7 20.0 0.0 - 42.0 40.0 13.2 - 66.8 5.2 -- 45-54 15 6.7 0.0 - 20.9 33.3 8.0 - 58.7 26.7 7.6 - 45.7 33.3 6.9 - 59.8 6.5 -- 55-64 4 25.0 0.0 - 74.3 25.0 0.0 - 74.3 -- -- 50.0 0.0 - 100.0 4.5 -- 25-64 46 7.5 0.0 - 16.0 16.9 4.6 - 29.3 24.9 10.0 - 39.8 50.7 35.8 - 65.6 6.9 --
Number of standard drinks consumed on a drinking day
Age Group (years)
Both Sexes
n % 1 drink 95% CI % 2-3
drinks 95% CI % 4-5 drinks 95% CI % 6+
drinks 95% CI
Mean # of
standard
drinks
95% CI
25-34 111 -- -- 1.7 0.0 - 4.2 14.0 7.8 - 20.1 84.3 77.5 - 91.2 11.6 10.0 - 13.2 35-44 90 4.2 0.0 - 8.3 4.2 0.0 - 9.0 15.5 8.4 - 22.6 76.2 65.7 - 86.6 10.8 9.5 - 12.2 45-54 80 1.2 0.0 - 3.3 11.0 1.6 - 20.3 14.8 8.9 - 20.8 73.0 63.4 - 82.6 10.3 8.8 - 11.8 55-64 29 2.9 0.0 - 8.6 10.0 0.0 - 20.5 17.7 3.3 - 32.0 69.4 48.0 - 90.9 8.3 6.0 - 10.6 25-64 310 1.6 0.3 - 2.9 4.6 1.8 - 7.4 14.8 11.4 - 18.2 79.0 74.0 - 84.0 10.9 10.0 - 11.9
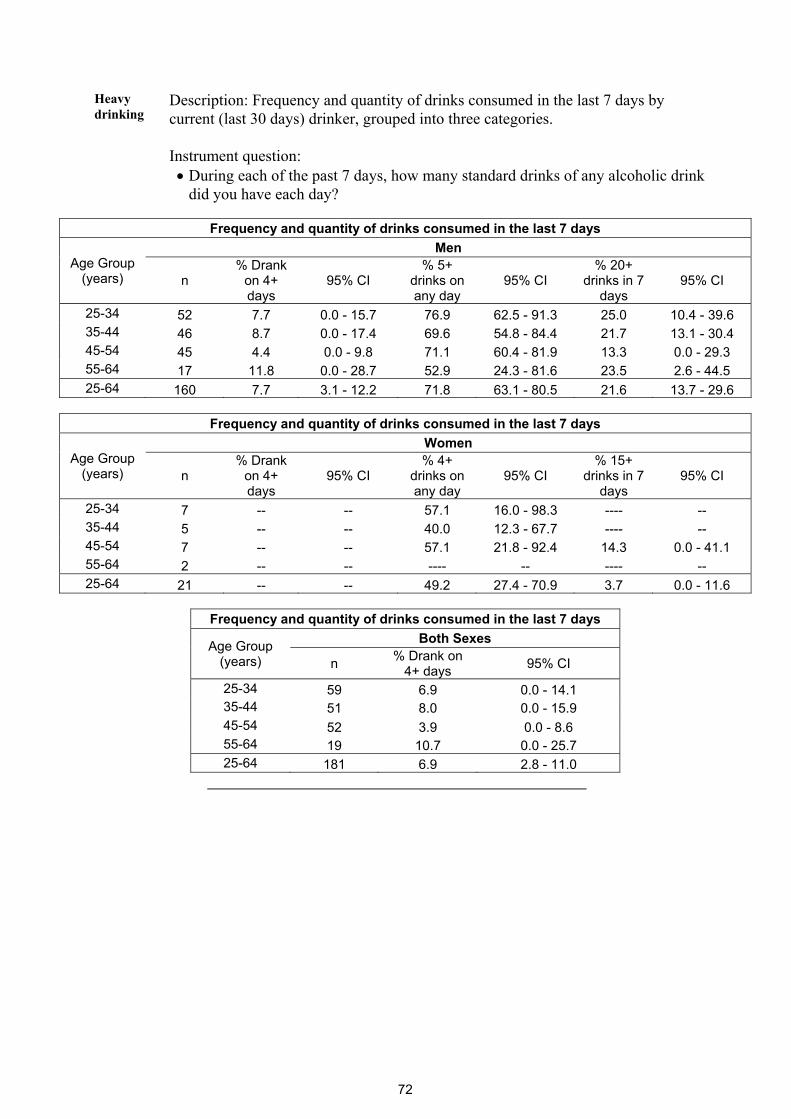
72
Heavy drinking
Description: Frequency and quantity of drinks consumed in the last 7 days by current (last 30 days) drinker, grouped into three categories.
Instrument question: • During each of the past 7 days, how many standard drinks of any alcoholic drink
did you have each day?
Frequency and quantity of drinks consumed in the last 7 days
Age Group (years)
Men
n % Drank
on 4+ days
95% CI % 5+
drinks on any day
95% CI % 20+
drinks in 7 days
95% CI
25-34 52 7.7 0.0 - 15.7 76.9 62.5 - 91.3 25.0 10.4 - 39.6 35-44 46 8.7 0.0 - 17.4 69.6 54.8 - 84.4 21.7 13.1 - 30.4 45-54 45 4.4 0.0 - 9.8 71.1 60.4 - 81.9 13.3 0.0 - 29.3 55-64 17 11.8 0.0 - 28.7 52.9 24.3 - 81.6 23.5 2.6 - 44.5 25-64 160 7.7 3.1 - 12.2 71.8 63.1 - 80.5 21.6 13.7 - 29.6
Frequency and quantity of drinks consumed in the last 7 days
Age Group (years)
Women
n % Drank
on 4+ days
95% CI % 4+
drinks on any day
95% CI % 15+
drinks in 7 days
95% CI
25-34 7 -- -- 57.1 16.0 - 98.3 ---- -- 35-44 5 -- -- 40.0 12.3 - 67.7 ---- -- 45-54 7 -- -- 57.1 21.8 - 92.4 14.3 0.0 - 41.1 55-64 2 -- -- ---- -- ---- -- 25-64 21 -- -- 49.2 27.4 - 70.9 3.7 0.0 - 11.6
Frequency and quantity of drinks consumed in the last 7 days
Age Group (years)
Both Sexes
n % Drank on 4+ days 95% CI
25-34 59 6.9 0.0 - 14.1 35-44 51 8.0 0.0 - 15.9 45-54 52 3.9 0.0 - 8.6 55-64 19 10.7 0.0 - 25.7 25-64 181 6.9 2.8 - 11.0
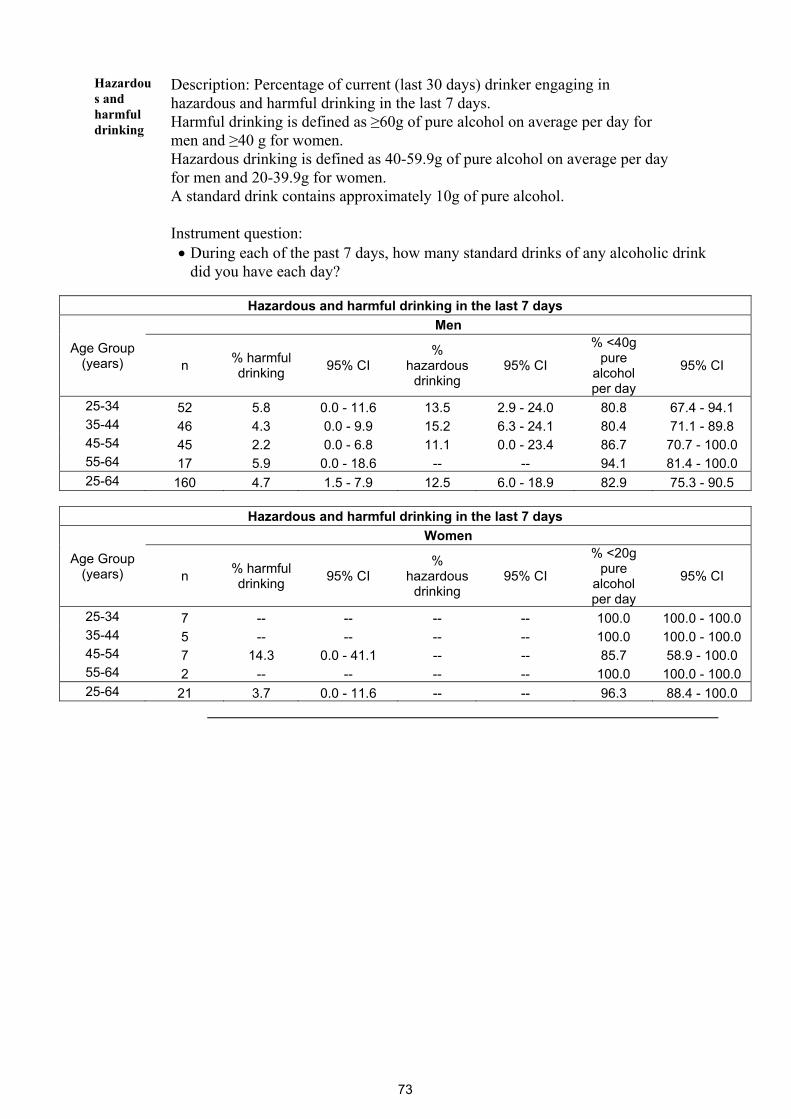
73
Hazardous and harmful drinking
Description: Percentage of current (last 30 days) drinker engaging in hazardous and harmful drinking in the last 7 days. Harmful drinking is defined as ≥60g of pure alcohol on average per day for men and ≥40 g for women. Hazardous drinking is defined as 40-59.9g of pure alcohol on average per day for men and 20-39.9g for women. A standard drink contains approximately 10g of pure alcohol.
Instrument question: • During each of the past 7 days, how many standard drinks of any alcoholic drink
did you have each day?
Hazardous and harmful drinking in the last 7 days
Age Group (years)
Men
n % harmful drinking 95% CI
% hazardous
drinking 95% CI
% <40g pure
alcohol per day
95% CI
25-34 52 5.8 0.0 - 11.6 13.5 2.9 - 24.0 80.8 67.4 - 94.1 35-44 46 4.3 0.0 - 9.9 15.2 6.3 - 24.1 80.4 71.1 - 89.8 45-54 45 2.2 0.0 - 6.8 11.1 0.0 - 23.4 86.7 70.7 - 100.0 55-64 17 5.9 0.0 - 18.6 -- -- 94.1 81.4 - 100.0 25-64 160 4.7 1.5 - 7.9 12.5 6.0 - 18.9 82.9 75.3 - 90.5
Hazardous and harmful drinking in the last 7 days
Age Group (years)
Women
n % harmful drinking 95% CI
% hazardous
drinking 95% CI
% <20g pure
alcohol per day
95% CI
25-34 7 -- -- -- -- 100.0 100.0 - 100.0 35-44 5 -- -- -- -- 100.0 100.0 - 100.0 45-54 7 14.3 0.0 - 41.1 -- -- 85.7 58.9 - 100.0 55-64 2 -- -- -- -- 100.0 100.0 - 100.0 25-64 21 3.7 0.0 - 11.6 -- -- 96.3 88.4 - 100.0

74
Fruit and Vegetable Consumption
Mean number of days of fruit and vegetable consumption
Description: mean number of days fruit and vegetables consumed.
Instrument questions: • In a typical week, on how many days do you eat fruit? • In a typical week, on how many days do you eat vegetables?
Mean number of days fruit consumed in a typical week
Age Group (years)
Men Women Both Sexes
n
Mean numbe
r of days
95% CI n Mean
number of days
95% CI n
Mean numbe
r of days
95% CI
25-34 156 1.6 1.3 - 1.9 213 1.5 1.3 - 1.7 369 1.6 1.4 - 1.8 35-44 173 1.3 1.1 - 1.5 227 1.6 1.4 - 1.8 400 1.5 1.3 - 1.6 45-54 147 1.5 1.2 - 1.7 174 1.5 1.3 - 1.7 321 1.5 1.3 - 1.6 55-64 85 1.5 1.1 - 1.8 113 1.9 1.4 - 2.4 198 1.7 1.3 - 2.0 25-64 561 1.5 1.3 - 1.6 727 1.6 1.4 - 1.7 1288 1.5 1.4 - 1.7
Mean number of days vegetables consumed in a typical week
Age Group (years)
Men Women Both Sexes
n
Mean numbe
r of days
95% CI n Mean
number of days
95% CI n
Mean numbe
r of days
95% CI
25-34 151 1.9 1.6 - 2.1 193 2.1 1.9 - 2.4 344 2.0 1.8 - 2.2 35-44 161 1.8 1.5 - 2.1 211 2.0 1.7 - 2.2 372 1.9 1.7 - 2.1 45-54 147 1.7 1.4 - 2.0 169 2.3 2.0 - 2.5 316 2.0 1.8 - 2.2 55-64 78 1.7 1.4 - 2.0 107 1.9 1.5 - 2.2 185 1.8 1.6 - 2.0 25-64 537 1.8 1.6 - 2.0 680 2.1 1.9 - 2.2 1217 1.9 1.8 - 2.1
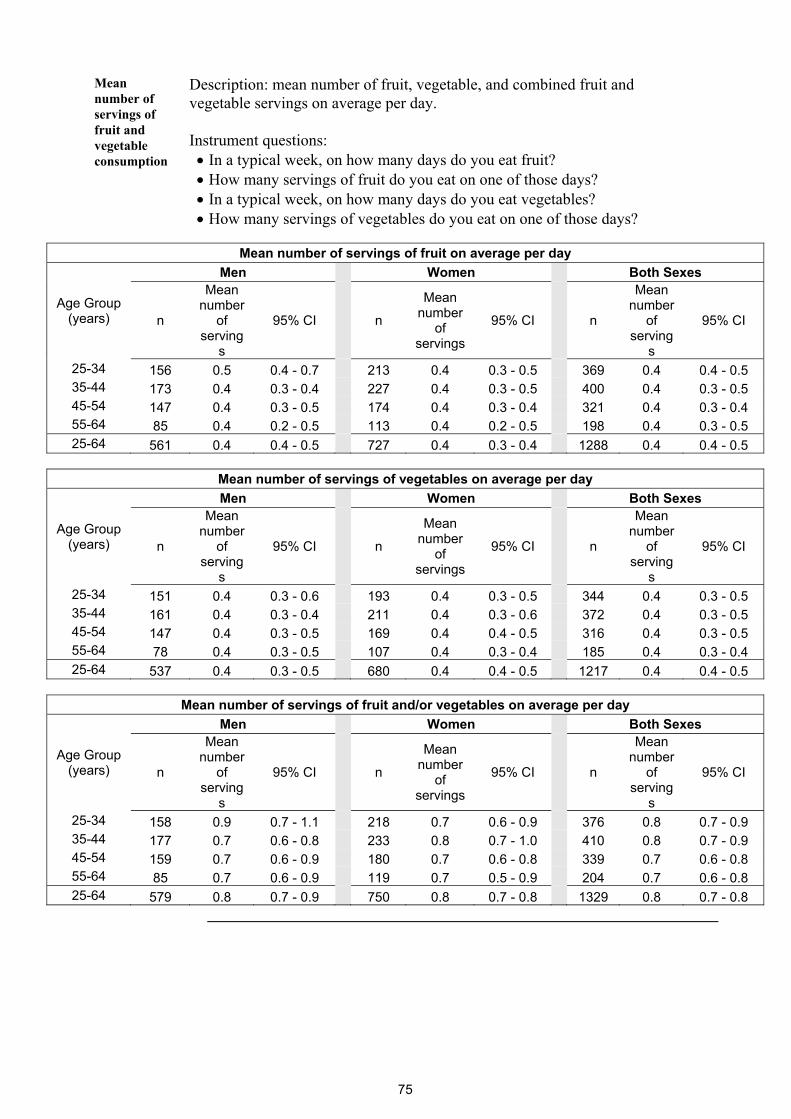
75
Mean number of servings of fruit and vegetable consumption
Description: mean number of fruit, vegetable, and combined fruit and vegetable servings on average per day.
Instrument questions: • In a typical week, on how many days do you eat fruit? • How many servings of fruit do you eat on one of those days? • In a typical week, on how many days do you eat vegetables? • How many servings of vegetables do you eat on one of those days?
Mean number of servings of fruit on average per day
Age Group (years)
Men Women Both Sexes
n
Mean number
of serving
s
95% CI n
Mean number
of servings
95% CI n
Mean number
of serving
s
95% CI
25-34 156 0.5 0.4 - 0.7 213 0.4 0.3 - 0.5 369 0.4 0.4 - 0.5 35-44 173 0.4 0.3 - 0.4 227 0.4 0.3 - 0.5 400 0.4 0.3 - 0.5 45-54 147 0.4 0.3 - 0.5 174 0.4 0.3 - 0.4 321 0.4 0.3 - 0.4 55-64 85 0.4 0.2 - 0.5 113 0.4 0.2 - 0.5 198 0.4 0.3 - 0.5 25-64 561 0.4 0.4 - 0.5 727 0.4 0.3 - 0.4 1288 0.4 0.4 - 0.5
Mean number of servings of vegetables on average per day
Age Group (years)
Men Women Both Sexes
n
Mean number
of serving
s
95% CI n
Mean number
of servings
95% CI n
Mean number
of serving
s
95% CI
25-34 151 0.4 0.3 - 0.6 193 0.4 0.3 - 0.5 344 0.4 0.3 - 0.5 35-44 161 0.4 0.3 - 0.4 211 0.4 0.3 - 0.6 372 0.4 0.3 - 0.5 45-54 147 0.4 0.3 - 0.5 169 0.4 0.4 - 0.5 316 0.4 0.3 - 0.5 55-64 78 0.4 0.3 - 0.5 107 0.4 0.3 - 0.4 185 0.4 0.3 - 0.4 25-64 537 0.4 0.3 - 0.5 680 0.4 0.4 - 0.5 1217 0.4 0.4 - 0.5
Mean number of servings of fruit and/or vegetables on average per day
Age Group (years)
Men Women Both Sexes
n
Mean number
of serving
s
95% CI n
Mean number
of servings
95% CI n
Mean number
of serving
s
95% CI
25-34 158 0.9 0.7 - 1.1 218 0.7 0.6 - 0.9 376 0.8 0.7 - 0.9 35-44 177 0.7 0.6 - 0.8 233 0.8 0.7 - 1.0 410 0.8 0.7 - 0.9 45-54 159 0.7 0.6 - 0.9 180 0.7 0.6 - 0.8 339 0.7 0.6 - 0.8 55-64 85 0.7 0.6 - 0.9 119 0.7 0.5 - 0.9 204 0.7 0.6 - 0.8 25-64 579 0.8 0.7 - 0.9 750 0.8 0.7 - 0.8 1329 0.8 0.7 - 0.8

76
Fruit and vegetable consumption per day
Description: Frequency of fruit and/or vegetable consumption.
Instrument questions: • In a typical week, on how many days do you eat fruit? • How many servings of fruit do you eat on one of those days? • In a typical week, on how many days do you eat vegetables? • How many servings of vegetables do you eat on one of those days?
Number of servings of fruit and/or vegetables on average per day
Age Group (years)
Men
n % no fruit
and/or vegetables
95% CI % 1-2
servings
95% CI % 3-4 servings 95% CI % ≥5
servings 95% CI
25-34 158 67.7 59.6 - 75.8 27.2 19.9 - 34.5 3.2 0.5 - 5.8 1.9 0.0 - 3.8 35-44 177 74.6 69.5 - 79.6 23.7 19.6 - 27.8 1.7 0.0 - 3.6 -- -- 45-54 159 72.3 64.9 - 79.8 25.8 18.9 - 32.6 1.9 0.0 - 4.1 -- -- 55-64 85 75.3 67.1 - 83.5 21.2 11.7 - 30.6 2.4 0.0 - 5.6 1.2 0.0 - 3.4 25-64 579 71.6 67.4 - 75.8 25.2 21.5 - 28.8 2.4 1.2 - 3.5 0.8 0.1 - 1.6
Number of servings of fruit and/or vegetables on average per day
Age Group (years)
Women
n % no fruit
and/or vegetables
95% CI % 1-2 servings 95% CI % 3-4
servings 95% CI % ≥5 servings 95% CI
25-34 218 70.2 63.8 - 76.5 27.5 22.3 - 32.7 1.8 0.0 - 4.8 0.5 0.0 - 1.4 35-44 233 70.0 64.3 - 75.6 26.2 20.8 - 31.5 3.0 1.0 - 5.0 0.9 0.0 - 2.1 45-54 180 75.0 69.6 - 80.4 23.9 18.4 - 29.3 0.6 0.0 - 1.7 0.6 0.0 - 1.7 55-64 119 74.0 62.7 - 85.2 25.2 14.4 - 36.0 0.8 0.0 - 2.6 -- -- 25-64 750 71.4 68.0 - 74.9 26.2 23.4 - 28.9 1.9 0.5 - 3.2 0.6 0.1 - 1.0
Number of servings of fruit and/or vegetables on average per day
Age Group (years)
Both Sexes
n % no fruit
and/or vegetables
95% CI % 1-2 servings 95% CI % 3-4
servings 95% CI % ≥5 servings 95% CI
25-34 376 69.0 64.4 - 73.6 27.4 23.3 - 31.5 2.5 0.7 - 4.2 1.1 0.1 - 2.2 35-44 410 72.1 68.1 - 76.1 25.0 21.7 - 28.4 2.4 1.2 - 3.6 0.5 0.0 - 1.1 45-54 339 73.7 69.1 - 78.3 24.8 20.4 - 29.2 1.2 0.0 - 2.4 0.3 0.0 - 0.9 55-64 204 74.6 66.8 - 82.4 23.3 15.1 - 31.5 1.5 0.0 - 3.3 0.5 0.0 - 1.6 25-64 1329 71.5 68.9 - 74.1 25.7 23.4 - 28.0 2.1 1.3 - 2.9 0.7 0.3 - 1.1

77
Fruit and vegetable consumption per day
Description: Percentage of those eating less than five servings of fruit and/or vegetables on average per day.
Instrument questions: • In a typical week, on how many days do you eat fruit? • How many servings of fruit do you eat on one of those days? • In a typical week, on how many days do you eat vegetables? • How many servings of vegetables do you eat on one of those days?
Less than five servings of fruit and/or vegetables on average per day
Age Group (years
)
Men Women Both Sexes
n % < five servings per day
95% CI n % < five servings per day
95% CI n % < five servings per day
95% CI
25-34 158 98.1 96.2 - 100.0 218 99.5 98.6 - 100.0 376 98.9 97.8 - 99.9 35-44 177 100.0 100.0 - 100.0 233 99.1 97.9 - 100.0 410 99.5 98.9 - 100.0 45-54 159 100.0 100.0 - 100.0 180 99.4 98.3 - 100.0 339 99.7 99.1 - 100.0 55-64 85 98.8 96.6 - 100.0 119 100.0 100.0 - 100.0 204 99.5 98.4 - 100.0 25-64 579 99.2 98.4 - 99.9 750 99.4 99.0 - 99.9 1329 99.3 98.9 - 99.7
Analysis Information: • Questions used: D1-D4 • Epi Info program name: Dfiveormore (unweighted); DfiveormoreWT (weighted)
Type of oil used most frequently
Description: type of oil or fat most often used for meal preparation in households (presented only for both sexes because results are for the household not individuals). Instrument question: • What type of oil or fat is most often used for meal preparation in your household?
Type of oil or fat most often used for meal preparation in household
n
% Vege-table
oil
95% CI % Lard 95% CI %
Butter 95% CI
% Marga-
rine
95% CI
% None used
95% CI
% Other 95% CI
1330 73.2 68.8 - 77.6 19.8 16.1 - 23.5 -- -- -- -- -- -- 7.0 4.7 - 9.2

78
Physical Activity
Introduction
Analysis physical activity data can be very complicated and the result confusing. The following guidelines will help clarify the results of the physical activity data and will also provide valuable information on the classifications. Make sure you use some of these guidelines when you report physical activity data.
• MET values are applied to vigorous and moderate intensity variables in the
work, transport and recreation domains. These have been calculated using an average of the typical types of activity undertaken. Different types of activities have been grouped together and given a MET value based on the intensity of the activity. Applying MET values to types of activities allows us to calculate total physical activity. For more information regarding MET values go the STEPS website at www.who.int/chp/steps .
• The calculations below use multiple questions in the physical activity section.
To simplify this a bit the questions have been clustered into four groups (as they appear in the Instrument). In the Instrument questions section of the table, only the group label appears. The specific questions for each group are presented below.
Activity at work:
Does your work involve vigorous-intensity activity that causes large increases in breathing or heart rate like [examples] for at least 10 minutes continuously?
In a typical week, on how many days do you do vigorous-intensity activities as part of your work?
How much time do you spend doing vigorous-intensity activities at work on a typical day?
Does your work involve moderate-intensity activity, that causes small increases in breathing or heart rate such as brisk walking for at least 10 minutes continuously?
In a typical week, on how many days do you do moderate-intensity activities as part of your work?
How much time do you spend doing moderate-intensity activities at work on a typical day?
Travel to and from places:
Do you walk or use a bicycle for at least 10 minutes continuously to get to and from places?
In a typical week, on how many days do you walk or bicycle for at least 10 minutes continuously to get to and from places?
Continued on next page

79
Physical Activity, Continued
Introduction (cont.)
How much time do you spend walking or bicycling for travel on a typical day?
Recreational activities: Do you do any involve vigorous-intensity sports, fitness or recreational
activities that cause large increases in breathing or heart rate like [examples] for at least 10 minutes continuously?
In a typical week, on how many days do you do vigorous-intensity sports, fitness or recreational activities?
How much time do you spend doing vigorous-intensity sports, fitness or recreational activities on a typical day?
Do you do any involve moderate-intensity sports, fitness or recreational activities that cause large increases in breathing or heart rate like [examples] for at least 10 minutes continuously?
In a typical week, on how many days do you do moderate--intensity sports, fitness or recreational activities?
How much time do you spend doing moderate--intensity sports, fitness or recreational activities on a typical day?
Sedentary behaviour :
How much time do you usually spend sitting or reclining on a typical day?
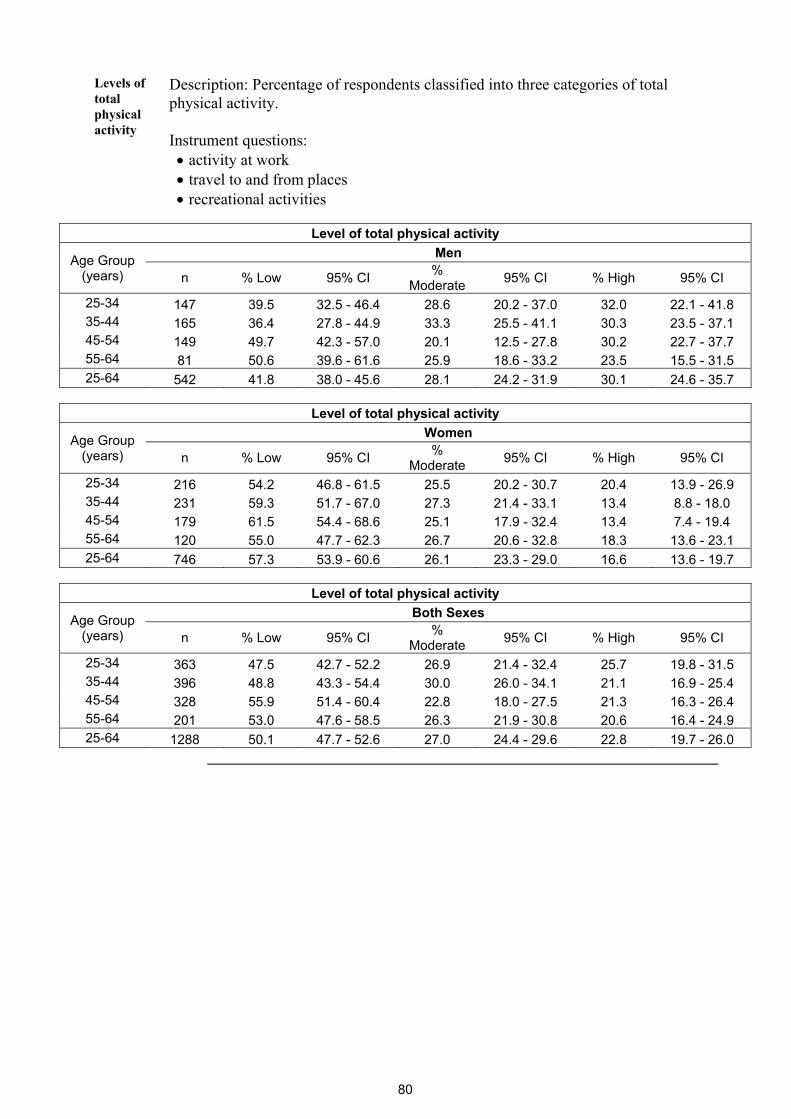
80
Levels of total physical activity
Description: Percentage of respondents classified into three categories of total physical activity.
Instrument questions: • activity at work • travel to and from places • recreational activities
Level of total physical activity
Age Group (years)
Men
n % Low 95% CI % Moderate 95% CI % High 95% CI
25-34 147 39.5 32.5 - 46.4 28.6 20.2 - 37.0 32.0 22.1 - 41.8 35-44 165 36.4 27.8 - 44.9 33.3 25.5 - 41.1 30.3 23.5 - 37.1 45-54 149 49.7 42.3 - 57.0 20.1 12.5 - 27.8 30.2 22.7 - 37.7 55-64 81 50.6 39.6 - 61.6 25.9 18.6 - 33.2 23.5 15.5 - 31.5 25-64 542 41.8 38.0 - 45.6 28.1 24.2 - 31.9 30.1 24.6 - 35.7
Level of total physical activity
Age Group (years)
Women
n % Low 95% CI % Moderate 95% CI % High 95% CI
25-34 216 54.2 46.8 - 61.5 25.5 20.2 - 30.7 20.4 13.9 - 26.9 35-44 231 59.3 51.7 - 67.0 27.3 21.4 - 33.1 13.4 8.8 - 18.0 45-54 179 61.5 54.4 - 68.6 25.1 17.9 - 32.4 13.4 7.4 - 19.4 55-64 120 55.0 47.7 - 62.3 26.7 20.6 - 32.8 18.3 13.6 - 23.1 25-64 746 57.3 53.9 - 60.6 26.1 23.3 - 29.0 16.6 13.6 - 19.7
Level of total physical activity
Age Group (years)
Both Sexes
n % Low 95% CI % Moderate 95% CI % High 95% CI
25-34 363 47.5 42.7 - 52.2 26.9 21.4 - 32.4 25.7 19.8 - 31.5 35-44 396 48.8 43.3 - 54.4 30.0 26.0 - 34.1 21.1 16.9 - 25.4 45-54 328 55.9 51.4 - 60.4 22.8 18.0 - 27.5 21.3 16.3 - 26.4 55-64 201 53.0 47.6 - 58.5 26.3 21.9 - 30.8 20.6 16.4 - 24.9 25-64 1288 50.1 47.7 - 52.6 27.0 24.4 - 29.6 22.8 19.7 - 26.0

81
Total physical activity- mean
Description: Mean minutes of total physical activity on average per day.
Instrument questions • activity at work • travel to and from places • recreational activities
Mean minutes of total physical activity on average per day
Age Group (years)
Men Women Both Sexes
n Mean minute
s 95% CI n Mean
minutes 95% CI n Mean minute
s 95% CI
25-34 147 83.8 65.4 - 102.3 216 66.7 53.6 - 79.8 363 74.5 64.1 - 85.0 35-44 165 82.8 68.2 - 97.4 231 50.0 39.2 - 60.9 396 65.0 55.5 - 74.5 45-54 149 82.8 65.7 - 99.9 179 45.8 35.7 - 55.9 328 63.3 52.6 - 73.9 55-64 81 83.3 54.7 - 112.0 120 60.1 50.0 - 70.1 201 70.6 56.2 - 85.0 25-64 542 83.3 72.4 - 94.1 746 56.8 49.9 - 63.6 1288 68.9 62.2 - 75.7
Total physical activity- median
Description: Median minutes of total physical activity on average per day.
Instrument questions • activity at work • travel to and from places • recreational activities
Median minutes of total physical activity on average per day
Age Group (years)
Men Women Both Sexes
n Median minutes
Inter-quartile range (P25-
P75) n
Median minute
s
Inter-quartile range (P25-
P75) n
Median minute
s
Inter-quartile range (P25-
P75) 25-34 189 51.4 14.3 - 111.4 226 25.7 6.4 - 90.0 415 34.3 10.7 - 98.6 35-44 157 45.0 14.0 - 120.0 187 20.0 0.0 - 60.0 344 30.0 5.7 - 90.0 45-54 100 25.7 8.6 - 105.7 111 20.0 2.9 - 60.0 211 25.0 5.7 - 77.1 55-64 57 21.4 6.4 - 75.7 69 27.9 7.1 - 77.1 125 21.4 6.9 - 77.1 25-64 503 40.0 12.9 - 120.0 593 21.4 4.3 - 70.0 1095 30.0 8.6 - 90.0
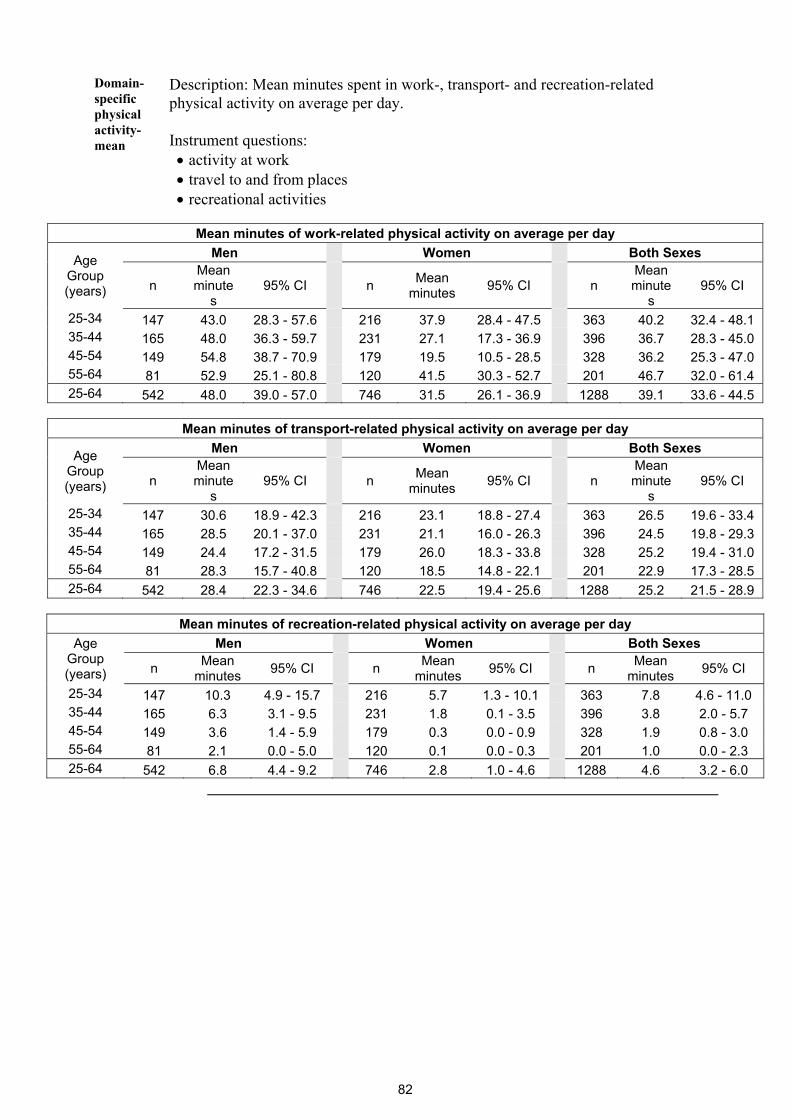
82
Domain-specific physical activity- mean
Description: Mean minutes spent in work-, transport- and recreation-related physical activity on average per day.
Instrument questions: • activity at work • travel to and from places • recreational activities
Mean minutes of work-related physical activity on average per day
Age Group (years)
Men Women Both Sexes
n Mean minute
s 95% CI n Mean
minutes 95% CI n Mean minute
s 95% CI
25-34 147 43.0 28.3 - 57.6 216 37.9 28.4 - 47.5 363 40.2 32.4 - 48.1 35-44 165 48.0 36.3 - 59.7 231 27.1 17.3 - 36.9 396 36.7 28.3 - 45.0 45-54 149 54.8 38.7 - 70.9 179 19.5 10.5 - 28.5 328 36.2 25.3 - 47.0 55-64 81 52.9 25.1 - 80.8 120 41.5 30.3 - 52.7 201 46.7 32.0 - 61.4 25-64 542 48.0 39.0 - 57.0 746 31.5 26.1 - 36.9 1288 39.1 33.6 - 44.5
Mean minutes of transport-related physical activity on average per day
Age Group (years)
Men Women Both Sexes
n Mean minute
s 95% CI n Mean
minutes 95% CI n Mean minute
s 95% CI
25-34 147 30.6 18.9 - 42.3 216 23.1 18.8 - 27.4 363 26.5 19.6 - 33.4 35-44 165 28.5 20.1 - 37.0 231 21.1 16.0 - 26.3 396 24.5 19.8 - 29.3 45-54 149 24.4 17.2 - 31.5 179 26.0 18.3 - 33.8 328 25.2 19.4 - 31.0 55-64 81 28.3 15.7 - 40.8 120 18.5 14.8 - 22.1 201 22.9 17.3 - 28.5 25-64 542 28.4 22.3 - 34.6 746 22.5 19.4 - 25.6 1288 25.2 21.5 - 28.9
Mean minutes of recreation-related physical activity on average per day
Age Group (years)
Men Women Both Sexes
n Mean minutes 95% CI n Mean
minutes 95% CI n Mean minutes 95% CI
25-34 147 10.3 4.9 - 15.7 216 5.7 1.3 - 10.1 363 7.8 4.6 - 11.0 35-44 165 6.3 3.1 - 9.5 231 1.8 0.1 - 3.5 396 3.8 2.0 - 5.7 45-54 149 3.6 1.4 - 5.9 179 0.3 0.0 - 0.9 328 1.9 0.8 - 3.0 55-64 81 2.1 0.0 - 5.0 120 0.1 0.0 - 0.3 201 1.0 0.0 - 2.3 25-64 542 6.8 4.4 - 9.2 746 2.8 1.0 - 4.6 1288 4.6 3.2 - 6.0
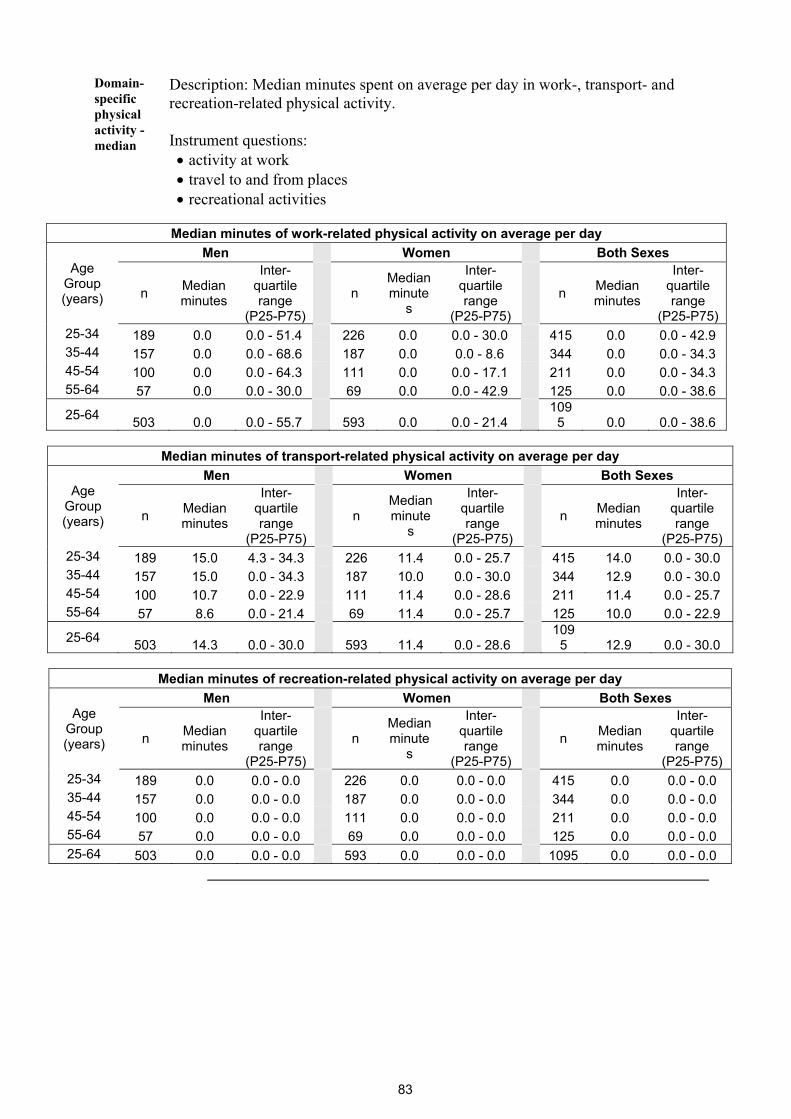
83
Domain-specific physical activity - median
Description: Median minutes spent on average per day in work-, transport- and recreation-related physical activity.
Instrument questions: • activity at work • travel to and from places • recreational activities
Median minutes of work-related physical activity on average per day
Age Group (years)
Men Women Both Sexes
n Median minutes
Inter-quartile range
(P25-P75)
n Median minute
s
Inter-quartile range
(P25-P75)
n Median minutes
Inter-quartile range
(P25-P75) 25-34 189 0.0 0.0 - 51.4 226 0.0 0.0 - 30.0 415 0.0 0.0 - 42.9 35-44 157 0.0 0.0 - 68.6 187 0.0 0.0 - 8.6 344 0.0 0.0 - 34.3 45-54 100 0.0 0.0 - 64.3 111 0.0 0.0 - 17.1 211 0.0 0.0 - 34.3 55-64 57 0.0 0.0 - 30.0 69 0.0 0.0 - 42.9 125 0.0 0.0 - 38.6
25-64 503 0.0 0.0 - 55.7 593 0.0 0.0 - 21.4 109
5 0.0 0.0 - 38.6
Median minutes of transport-related physical activity on average per day
Age Group (years)
Men Women Both Sexes
n Median minutes
Inter-quartile range
(P25-P75)
n Median minute
s
Inter-quartile range
(P25-P75)
n Median minutes
Inter-quartile range
(P25-P75) 25-34 189 15.0 4.3 - 34.3 226 11.4 0.0 - 25.7 415 14.0 0.0 - 30.0 35-44 157 15.0 0.0 - 34.3 187 10.0 0.0 - 30.0 344 12.9 0.0 - 30.0 45-54 100 10.7 0.0 - 22.9 111 11.4 0.0 - 28.6 211 11.4 0.0 - 25.7 55-64 57 8.6 0.0 - 21.4 69 11.4 0.0 - 25.7 125 10.0 0.0 - 22.9
25-64 503 14.3 0.0 - 30.0 593 11.4 0.0 - 28.6 109
5 12.9 0.0 - 30.0
Median minutes of recreation-related physical activity on average per day
Age Group (years)
Men Women Both Sexes
n Median minutes
Inter-quartile range
(P25-P75)
n Median minute
s
Inter-quartile range
(P25-P75)
n Median minutes
Inter-quartile range
(P25-P75) 25-34 189 0.0 0.0 - 0.0 226 0.0 0.0 - 0.0 415 0.0 0.0 - 0.0 35-44 157 0.0 0.0 - 0.0 187 0.0 0.0 - 0.0 344 0.0 0.0 - 0.0 45-54 100 0.0 0.0 - 0.0 111 0.0 0.0 - 0.0 211 0.0 0.0 - 0.0 55-64 57 0.0 0.0 - 0.0 69 0.0 0.0 - 0.0 125 0.0 0.0 - 0.0 25-64 503 0.0 0.0 - 0.0 593 0.0 0.0 - 0.0 1095 0.0 0.0 - 0.0
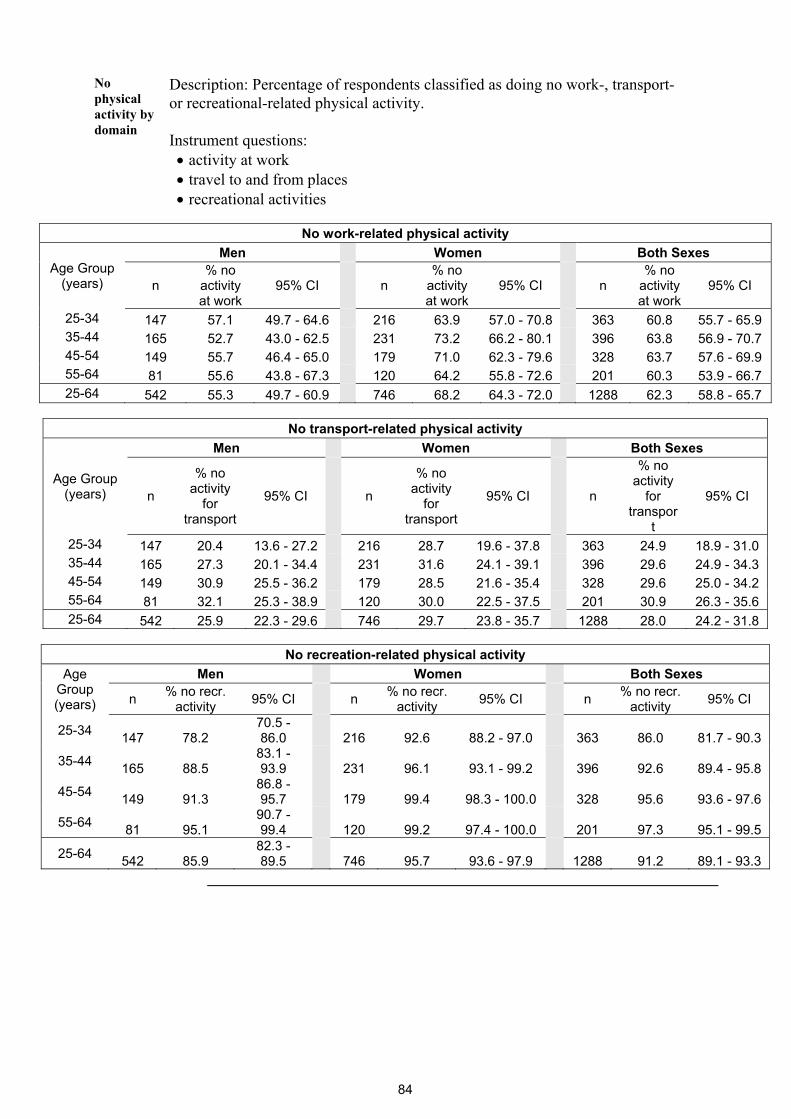
84
No physical activity by domain
Description: Percentage of respondents classified as doing no work-, transport- or recreational-related physical activity.
Instrument questions: • activity at work • travel to and from places • recreational activities
No work-related physical activity
Age Group (years)
Men Women Both Sexes
n % no
activity at work
95% CI n % no
activity at work
95% CI n % no
activity at work
95% CI
25-34 147 57.1 49.7 - 64.6 216 63.9 57.0 - 70.8 363 60.8 55.7 - 65.9 35-44 165 52.7 43.0 - 62.5 231 73.2 66.2 - 80.1 396 63.8 56.9 - 70.7 45-54 149 55.7 46.4 - 65.0 179 71.0 62.3 - 79.6 328 63.7 57.6 - 69.9 55-64 81 55.6 43.8 - 67.3 120 64.2 55.8 - 72.6 201 60.3 53.9 - 66.7 25-64 542 55.3 49.7 - 60.9 746 68.2 64.3 - 72.0 1288 62.3 58.8 - 65.7
No transport-related physical activity
Age Group (years)
Men Women Both Sexes
n
% no activity
for transport
95% CI n
% no activity
for transport
95% CI n
% no activity
for transpor
t
95% CI
25-34 147 20.4 13.6 - 27.2 216 28.7 19.6 - 37.8 363 24.9 18.9 - 31.0 35-44 165 27.3 20.1 - 34.4 231 31.6 24.1 - 39.1 396 29.6 24.9 - 34.3 45-54 149 30.9 25.5 - 36.2 179 28.5 21.6 - 35.4 328 29.6 25.0 - 34.2 55-64 81 32.1 25.3 - 38.9 120 30.0 22.5 - 37.5 201 30.9 26.3 - 35.6 25-64 542 25.9 22.3 - 29.6 746 29.7 23.8 - 35.7 1288 28.0 24.2 - 31.8
No recreation-related physical activity
Age Group (years)
Men Women Both Sexes
n % no recr. activity 95% CI n % no recr.
activity 95% CI n % no recr.activity 95% CI
25-34 147 78.2 70.5 - 86.0 216 92.6 88.2 - 97.0 363 86.0 81.7 - 90.3
35-44 165 88.5 83.1 - 93.9 231 96.1 93.1 - 99.2 396 92.6 89.4 - 95.8
45-54 149 91.3 86.8 - 95.7 179 99.4 98.3 - 100.0 328 95.6 93.6 - 97.6
55-64 81 95.1 90.7 - 99.4 120 99.2 97.4 - 100.0 201 97.3 95.1 - 99.5
25-64 542 85.9 82.3 - 89.5 746 95.7 93.6 - 97.9 1288 91.2 89.1 - 93.3

85
Composition of total physical activity
Description: Percentage of work, transport and recreational activity contributing to total activity.
Instrument questions: • activity at work • travel to and from places • recreational activities
Composition of total physical activity
Age Group (years)
Men
n % Activity from work 95% CI
% Activity for
transport 95% CI
% Activity during leisure time
95% CI
25-34 134 32.4 26.0 - 38.7 56.3 48.5 - 64.2 11.3 6.9 - 15.7 35-44 141 40.3 33.3 - 47.3 53.3 46.1 - 60.6 6.4 3.5 - 9.3 45-54 126 41.6 33.2 - 50.0 52.6 44.9 - 60.3 5.8 2.6 - 9.0 55-64 65 41.4 31.5 - 51.2 56.0 44.9 - 67.0 2.7 0.0 - 5.4 25-64 466 37.5 33.4 - 41.7 54.6 49.8 - 59.5 7.8 5.8 - 9.8
Composition of total physical activity
Age Group (years)
Women
n % Activity from work 95% CI
% Activity for
transport 95% CI
% Activity during leisure time
95% CI
25-34 174 32.1 24.8 - 39.5 63.7 55.3 - 72.0 4.2 1.4 - 7.0 35-44 173 26.6 20.2 - 33.0 70.8 63.8 - 77.8 2.6 0.0 - 5.3 45-54 140 27.6 18.2 - 37.1 72.1 62.5 - 81.6 0.3 0.0 - 0.9 55-64 98 35.8 27.8 - 43.9 63.7 55.5 - 71.8 0.5 0.0 - 1.4 25-64 585 30.1 25.2 - 34.9 67.4 62.1 - 72.7 2.5 0.9 - 4.1
Composition of total physical activity
Age Group (years)
Both Sexes
n % Activity from work 95% CI
% Activity for
transport 95% CI
% Activity during leisure time
95% CI
25-34 308 32.2 28.3 - 36.2 60.1 54.5 - 65.7 7.7 5.2 - 10.2 35-44 314 33.3 28.1 - 38.6 62.2 56.7 - 67.8 4.4 2.2 - 6.7 45-54 266 34.5 27.3 - 41.7 62.5 55.7 - 69.3 3.0 1.6 - 4.4 55-64 163 38.3 32.3 - 44.4 60.2 53.8 - 66.6 1.5 0.1 - 2.8 25-64 1051 33.7 30.4 - 37.0 61.2 57.4 - 65.0 5.1 3.8 - 6.4
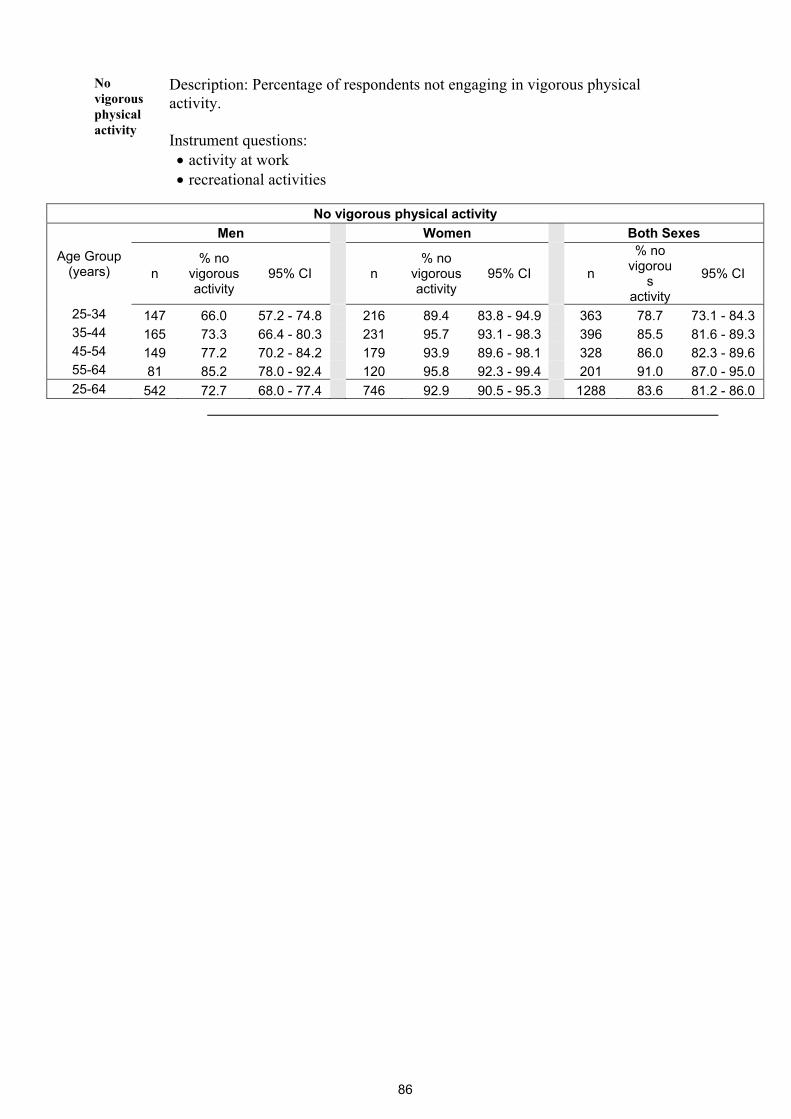
86
No vigorous physical activity
Description: Percentage of respondents not engaging in vigorous physical activity.
Instrument questions: • activity at work • recreational activities
No vigorous physical activity
Age Group (years)
Men Women Both Sexes
n % no
vigorous activity
95% CI n % no
vigorous activity
95% CI n
% no vigorou
s activity
95% CI
25-34 147 66.0 57.2 - 74.8 216 89.4 83.8 - 94.9 363 78.7 73.1 - 84.3 35-44 165 73.3 66.4 - 80.3 231 95.7 93.1 - 98.3 396 85.5 81.6 - 89.3 45-54 149 77.2 70.2 - 84.2 179 93.9 89.6 - 98.1 328 86.0 82.3 - 89.6 55-64 81 85.2 78.0 - 92.4 120 95.8 92.3 - 99.4 201 91.0 87.0 - 95.0 25-64 542 72.7 68.0 - 77.4 746 92.9 90.5 - 95.3 1288 83.6 81.2 - 86.0
87
Sedentary Description: Minutes spent in sedentary activities on a typical day.
Instrument question: • sedentary behaviour
Minutes spent in sedentary activities on average per day
Age Group (years)
Men
n Mean minutes 95% CI Median
minutes
Inter-quartile range
(P25-P75) 25-34 87 198.7 173.0 - 224.5 150.0 120.0 - 240.0 35-44 84 195.1 168.4 - 221.8 180.0 90.0 - 255.0 45-54 72 191.2 158.9 - 223.5 180.0 90.0 - 240.0 55-64 32 217.0 152.1 - 281.9 180.0 90.0 - 270.0 25-64 275 197.8 180.2 - 215.5 180.0 90.0 - 240.0
Minutes spent in sedentary activities on average per day
Age Group (years)
Women
n Mean minutes 95% CI Median
minutes
Inter-quartile range
(P25-P75) 25-34 108 180.8 157.1 - 204.5 150.0 90.0 - 240.0 35-44 109 169.6 146.8 - 192.4 150.0 90.0 - 210.0 45-54 88 178.3 150.8 - 205.8 150.0 90.0 - 240.0 55-64 51 233.5 180.3 - 286.8 180.0 120.0 - 255.0 25-64 356 182.3 166.5 - 198.0 150.0 90.0 - 240.0
Minutes spent in sedentary activities on average per day
Age Group (years)
Both Sexes
n Mean minutes 95% CI Median
minutes
Inter-quartile range
(P25-P75) 25-34 195 189.7 172.1 - 207.4 150.0 105.0 - 240.0 35-44 193 181.8 163.7 - 199.8 150.0 90.0 - 240.0 45-54 160 184.3 163.0 - 205.6 150.0 90.0 - 240.0 55-64 83 226.4 174.2 - 278.6 180.0 120.0 - 300.0 25-64 631 189.7 177.0 - 202.4 150.0 90.0 - 240.0
88
Blood Pressure and Diabetes History
Blood pressure diagnosis and treatment
Description: Raised blood pressure diagnosis and treatment results among all respondents.
Instrument questions: • During the past 12 months have you been told by a doctor or other health worker
that you have elevated blood pressure or hypertension? • Are you currently receiving any of the following treatments/advice for high blood
pressure prescribed by a doctor or other health worker? • Drugs (medication) that you have taken in the last 2 weeks?
Raised blood pressure diagnosed by doctor or health worker in last 12 months
Age Group (years)
Men Women Both Sexes
n %
diagnosed
95% CI n %
diagnosed
95% CI n %
diagnosed
95% CI
25-34 160 2.5 0.0 - 5.1 220 5.9 2.5 - 9.4 380 4.3 1.7 - 6.8 35-44 183 9.8 5.6 - 14.1 231 9.5 5.0 - 14.0 414 9.7 6.2 - 13.2 45-54 157 8.9 4.0 - 13.8 177 7.9 3.3 - 12.5 334 8.4 4.7 - 12.1 55-64 86 9.3 1.5 - 17.1 119 16.0 7.3 - 24.7 205 12.8 7.1 - 18.5 25-64 586 6.8 4.0 - 9.7 747 8.6 6.1 - 11.1 1333 7.7 5.6 - 9.9
Currently taking blood pressure drugs prescribed by doctor or health worker
Age Group (years)
Men Women Both Sexes
n % taking meds 95% CI n % taking
meds 95% CI n % taking meds 95% CI
25-34 6 33.3 0.0 - 71.9 18 11.1 0.0 - 26.1 24 17.6 1.7 - 33.5 35-44 21 33.3 12.1 - 54.5 28 14.3 0.6 - 28.0 49 23.2 10.3 - 36.1 45-54 22 36.4 8.6 - 64.1 24 33.3 16.4 - 50.2 46 34.8 17.8 - 51.9 55-64 9 33.3 1.5 - 65.2 26 26.9 7.4 - 46.4 35 28.8 11.2 - 46.4 25-64 58 34.2 16.5 - 52.0 96 20.1 9.8 - 30.3 154 25.8 15.1 - 36.5

89
Blood pressure lifestyle advice
Description: Percentage of respondents who received lifestyle advice from a doctor or health worker to treat raised blood pressure.
Instrument question: • Are you currently receiving any of the following treatments/advice for high blood
pressure prescribed by a doctor or other health worker?
Advised by doctor or health worker to have special prescribed diet Age Group
(years) Men Women Both Sexes
n % 95% CI n % 95% CI n % 95% CI 25-34 6 66.7 34.9 - 98.4 18 83.3 65.7 - 100.0 24 78.5 62.0 - 95.0 35-44 20 70.0 49.9 - 90.1 28 85.7 71.2 - 100.0 48 78.5 68.4 - 88.7 45-54 22 95.5 87.5 - 100.0 24 70.8 52.3 - 89.3 46 83.1 71.5 - 94.7 55-64 9 77.8 45.8 - 100.0 26 84.6 70.8 - 98.4 35 82.6 67.5 - 97.7 25-64 57 78.3 69.0 - 87.7 96 81.7 72.7 - 90.8 153 80.4 73.8 - 86.9
Advised by doctor or health worker to lose weight
Age Group (years)
Men Women Both Sexes n % 95% CI n % 95% CI n % 95% CI
25-34 6 66.7 34.9 - 98.4 18 77.8 59.9 - 95.6 24 74.5 55.6 - 93.5 35-44 20 60.0 37.2 - 82.8 28 64.3 46.6 - 82.0 48 62.3 51.5 - 73.1 45-54 22 68.2 49.9 - 86.5 24 66.7 53.3 - 80.0 46 67.4 56.3 - 78.6 55-64 9 55.6 21.0 - 90.1 26 65.4 47.5 - 83.3 35 62.5 45.5 - 79.5 25-64 57 63.0 54.5 - 71.5 96 68.6 60.2 - 76.9 153 66.3 59.4 - 73.3
Advised by doctor or health worker to stop smoking
Age Group (years)
Men Women Both Sexes n % 95% CI n % 95% CI n % 95% CI
25-34 6 50.0 3.3 - 96.7 18 72.2 54.6 - 89.8 24 65.8 47.1 - 84.4 35-44 20 60.0 40.6 - 79.4 28 64.3 51.4 - 77.2 48 62.3 50.6 - 74.0 45-54 22 68.2 51.8 - 84.6 24 75.0 61.7 - 88.3 46 71.6 61.5 - 81.7 55-64 9 55.6 21.0 - 90.1 26 65.4 50.0 - 80.8 35 62.5 46.4 - 78.5 25-64 57 60.3 45.8 - 74.9 96 68.9 61.5 - 76.3 153 65.4 58.3 - 72.6
Advised by doctor or health worker to start or do more exercise
Age Group (years)
Men Women Both Sexes n % 95% CI n % 95% CI n % 95% CI
25-34 6 66.7 34.9 - 98.4 18 72.2 53.5 - 91.0 24 70.6 52.7 - 88.5 35-44 20 70.0 48.8 - 91.2 28 75.0 59.9 - 90.1 48 72.7 59.5 - 85.9 45-54 22 81.8 58.1 - 100.0 24 75.0 58.9 - 91.1 46 78.4 64.5 - 92.3 55-64 9 66.7 34.8 - 98.5 26 69.2 55.3 - 83.2 35 68.5 53.3 - 83.6 25-64 57 72.7 60.8 - 84.5 96 73.1 64.1 - 82.0 153 72.9 66.2 - 79.6

90
Blood pressure advice by a traditional healer
Description: Percentage of respondents who have sought advice or received treatment from traditional healers for raised blood pressure.
Instrument questions: • During the past 12 months have you seen a traditional healer for raised blood
pressure? • Are you currently taking any herbal or traditional remedy for your high blood
pressure?
Seen a traditional healer in the last 12 months Age Group
(years) Men Women Both Sexes
n % 95% CI n % 95% CI n % 95% CI 25-34 6 16.7 0.0 - 48.8 18 22.2 3.4 - 41.0 24 20.6 1.4 - 39.8 35-44 20 20.0 2.9 - 37.1 28 28.6 10.1 - 47.1 48 24.7 11.3 - 38.0 45-54 22 27.3 8.7 - 45.8 24 45.8 28.3 - 63.3 46 36.6 24.4 - 48.8 55-64 9 44.4 3.4 - 85.5 26 42.3 22.1 - 62.5 35 42.9 21.7 - 64.2 25-64 57 24.9 11.3 - 38.5 96 33.4 22.1 - 44.7 153 30.0 20.7 - 39.3
Currently taking herbal or traditional remedy for high blood pressure
Age Group (years)
Men Women Both Sexes n % 95% CI n % 95% CI n % 95% CI
25-34 6 16.7 0.0 - 48.8 18 11.1 0.0 - 26.3 24 12.7 0.0 - 26.8 35-44 20 25.0 6.3 - 43.7 28 28.6 14.9 - 42.3 48 26.9 14.1 - 39.7 45-54 22 22.7 5.5 - 40.0 24 33.3 15.6 - 51.0 46 28.1 15.8 - 40.3 55-64 9 22.2 0.0 - 53.6 26 23.1 9.8 - 36.3 35 22.8 10.6 - 35.1 25-64 57 22.6 9.0 - 36.2 96 23.8 15.5 - 32.2 153 23.3 16.1 - 30.5

91
Diabetes diagnosis and treatment
Description: Diabetes diagnosis and treatment results among all respondents.
Instrument questions: • During the past 12 months, have you ever been told by a doctor or other health
worker that you have diabetes? • Are you currently taking any of the following treatments/advice for diabetes
prescribed by a doctor or other health worker?
Diabetes diagnosed by doctor or health worker in last 12 months Age
Group (years)
Men Women Both Sexes
n % diagnosed 95% CI n %
diagnosed 95% CI n % diagnosed 95% CI
25-34 51 -- -- 100 4.0 0.2 - 7.8 151 2.5 0.2 - 4.7 35-44 92 6.5 2.7 - 10.4 117 14.5 8.1 - 20.9 209 10.7 6.7 - 14.7 45-54 98 17.3 8.2 - 26.5 114 11.4 5.9 - 16.9 212 14.3 8.9 - 19.6
55-64 53 26.4 14.2 - 38.6 75 28.0 17.7 - 38.3 128 27.3 17.9 - 36.7
25-64 294 10.5 6.9 - 14.1 406 12.2 8.6 - 15.7 700 11.4 8.6 - 14.2
Currently taking insulin prescribed for diabetes by doctor or health worker Age
Group (years
)
Men Women Both Sexes
n % taking insulin 95% CI n
% taking insulin
95% CI n % taking insulin 95% CI
25-34 1 -- -- 10 10.0 0.0 - 28.0 11 8.9 0.0 - 25.2 35-44 7 28.6 0.0 - 65.7 21 14.3 1.2 - 27.4 28 18.3 7.2 - 29.4 45-54 25 12.0 0.0 - 25.4 23 8.7 0.0 - 21.5 48 10.5 1.4 - 19.6 55-64 19 10.5 0.9 - 20.1 29 6.9 0.0 - 17.1 48 8.5 0.2 - 16.8 25-64 52 14.0 2.9 - 25.1 83 10.0 3.4 - 16.7 135 11.6 6.3 - 16.9
Currently taking oral drugs prescribed for diabetes by doctor or health worker
Age Group (years)
Men Women Both Sexes
n %
taking meds
95% CI n %
taking meds
95% CI n %
taking meds
95% CI
25-34 -- -- -- 10 10.0 0.0 - 30.2 10 10.0 0.0 - 30.1 35-44 7 42.9 1.9 - 83.9 22 45.5 16.6 - 74.3 29 44.7 19.9 - 69.6 45-54 25 52.0 28.0 - 76.0 24 62.5 42.8 - 82.2 49 56.9 40.2 - 73.7 55-64 19 36.8 7.7 - 66.0 29 44.8 26.1 - 63.6 48 41.3 29.3 - 53.3 25-64 51 44.9 30.1 - 59.6 85 43.3 30.1 - 56.6 136 43.9 34.0 - 53.8

92
Diabetes lifestyle advice
Description: Percentage of respondents who received lifestyle advice from a doctor or health worker to diabetes.
Instrument question: • Are you currently taking any of the following treatments/advice for diabetes
prescribed by a doctor or other health worker?
Advised by doctor or health worker to have special prescribed diet Age Group
(years) Men Women Both Sexes
n % 95% CI n % 95% CI n % 95% CI 25-34 -- -- -- 10 90.0 69.6 - 100.0 10 90.0 69.8 - 100.0 35-44 7 71.4 34.3 - 100.0 23 91.3 78.1 - 100.0 30 86.1 73.6 - 98.5 45-54 25 84.0 68.4 - 99.6 24 75.0 59.5 - 90.5 49 79.8 70.8 - 88.8 55-64 19 78.9 62.3 - 95.6 29 86.2 71.5 - 100.0 48 83.0 71.8 - 94.2 25-64 51 79.9 66.5 - 93.2 86 85.7 77.7 - 93.6 137 83.5 77.1 - 89.9
Advised by doctor or health worker to lose weight
Age Group (years)
Men Women Both Sexes n % 95% CI n % 95% CI n % 95% CI
25-34 -- -- -- 10 70.0 39.1 - 100.0 10 70.0 39.3 - 100.0 35-44 7 42.9 1.9 - 83.9 22 63.6 46.7 - 80.6 29 58.0 41.2 - 74.7 45-54 25 64.0 46.9 - 81.1 24 66.7 50.5 - 82.8 49 65.3 53.6 - 77.0 55-64 19 63.2 44.8 - 81.5 29 48.3 34.2 - 62.4 48 54.9 43.0 - 66.8 25-64 51 59.9 49.7 - 70.0 85 61.2 51.7 - 70.8 136 60.7 52.3 - 69.1
Advised by doctor or health worker to stop smoking
Age Group (years)
Men Women Both Sexes n % 95% CI n % 95% CI n % 95% CI
25-34 -- -- -- 10 60.0 33.4 - 86.6 10 60.0 33.5 - 86.5 35-44 7 42.9 1.9 - 83.9 22 68.2 48.7 - 87.6 29 61.3 45.4 - 77.2 45-54 25 52.0 33.9 - 70.1 24 58.3 34.9 - 81.8 49 55.0 40.6 - 69.3 55-64 19 63.2 39.2 - 87.2 29 51.7 30.1 - 73.3 48 56.8 40.1 - 73.5 25-64 51 54.4 41.4 - 67.3 85 59.7 46.4 - 73.0 136 57.7 49.2 - 66.2
Advised doctor or health worker to start or do more exercise
Age Group (years)
Men Women Both Sexes n % 95% CI n % 95% CI n % 95% CI
25-34 -- -- -- 10 70.0 37.2 - 100.0 10 70.0 37.5 - 100.0 35-44 7 71.4 34.3 - 100.0 22 81.8 62.2 - 100.0 29 79.0 61.7 - 96.3 45-54 25 80.0 66.6 - 93.4 24 70.8 55.4 - 86.3 49 75.7 65.5 - 85.9 55-64 19 73.7 53.3 - 94.0 29 65.5 44.5 - 86.5 48 69.1 56.4 - 81.8 25-64 51 76.2 65.2 - 87.1 85 72.5 60.1 - 84.9 136 73.9 65.1 - 82.6

93
Diabetes advice by traditional healer
Description: Percentage of respondents who are have sought advice or treatment from traditional healers for diabetes.
Instrument questions: • During the past 12 months have you seen a traditional healer for diabetes? • Are you currently taking any herbal or traditional remedy for your diabetes?
Seen a traditional healer for diabetes in the last 12 months
Age Group (years)
Men Women Both Sexes n % 95% CI n % 95% CI n % 95% CI
25-34 -- -- -- 10 30.0 0.0 - 67.6 10 30.0 0.0 - 67.3 35-44 7 42.9 1.9 - 83.9 22 31.8 10.9 - 52.8 29 34.8 14.7 - 55.0 45-54 25 56.0 33.6 - 78.4 24 33.3 16.7 - 50.0 49 45.3 31.0 - 59.7 55-64 19 36.8 15.5 - 58.2 29 51.7 26.4 - 77.1 48 45.1 31.0 - 59.3 25-64 51 46.7 34.5 - 58.9 85 37.4 25.0 - 49.8 136 40.9 31.9 - 50.0
Currently taking herbal or traditional treatment for diabetes
Age Group (years)
Men Women Both Sexes n % 95% CI n % 95% CI n % 95% CI
25-34 -- -- -- 10 30.0 1.5 - 58.5 10 30.0 1.7 - 58.4 35-44 7 14.3 0.0 - 43.5 21 33.3 13.0 - 53.6 28 28.0 12.2 - 43.7 45-54 25 36.0 8.9 - 63.1 24 41.7 21.1 - 62.3 49 38.7 21.7 - 55.6 55-64 19 31.6 5.6 - 57.5 29 41.4 25.4 - 57.3 48 37.0 24.0 - 50.0 25-64 51 30.5 15.8 - 45.1 84 37.1 28.6 - 45.6 135 34.6 27.6 - 41.5

94
Physical Measurements
Height, weight and BMI
Description: Mean height, weight, and body mass index among all respondent (excluding pregnant women for weight and BMI).
Instrument questions: • Height • Weight
Mean height (cm)
Age Group (years)
Men Women n Mean 95% CI n Mean 95% CI
25-34 163 169.8 169.0 - 170.6 225 158.6 158.0 - 159.2 35-44 184 169.3 168.5 - 170.2 239 159.1 158.4 - 159.8 45-54 164 168.1 167.2 - 169.1 186 158.1 157.0 - 159.1 55-64 87 167.3 165.8 - 168.8 125 156.8 155.6 - 157.9 25-64 598 169.0 168.5 - 169.6 775 158.4 158.0 - 158.9
Mean weight (kg)
Age Group (years)
Men Women n Mean 95% CI n Mean 95% CI
25-34 162 84.0 81.5 - 86.5 215 80.6 78.1 - 83.0 35-44 184 86.1 83.3 - 88.9 232 79.9 77.9 - 81.8 45-54 164 82.3 80.0 - 84.6 184 80.6 77.7 - 83.5 55-64 87 81.3 77.3 - 85.2 126 74.5 71.3 - 77.7 25-64 597 84.0 82.5 - 85.6 757 79.6 78.3 - 81.0
Mean BMI (kg/m2)
Age Group (years)
Men Women Both Sexes n Mean 95% CI n Mean 95% CI n Mean 95% CI
25-34 162 29.1 28.2 - 30.0 215 31.9 30.9 - 33.0 377 30.6 30.0 - 31.2 35-44 184 30.0 29.1 - 31.0 232 31.5 30.7 - 32.4 416 30.8 30.1 - 31.5 45-54 164 29.1 28.3 - 29.9 182 31.7 30.8 - 32.6 346 30.4 29.9 - 31.0 55-64 87 29.0 27.8 - 30.2 125 30.0 29.1 - 31.0 212 29.6 28.7 - 30.4 25-64 597 29.4 28.8 - 29.9 754 31.5 31.0 - 32.1 1351 30.5 30.1 - 30.9

95
BMI categories
Description: Percentage of respondents (excluding pregnant women) in each BMI category.
Instrument questions: • Height • Weight
BMI classifications
Age Group (years)
Men
n
% Under-weight <18.5
95% CI % Normal
weight 18.5-24.9
95% CI % Over-weight
25.0-29.9 95% CI
% Obese ≥30.0
95% CI
25-34 162 -- -- 24.7 16.6 - 32.8 37.7 29.7 - 45.6 37.7 27.4 - 47.9 35-44 184 0.5 0.0 - 1.6 19.0 12.1 - 25.9 33.7 27.5 - 39.9 46.7 39.5 - 53.9 45-54 164 0.6 0.0 - 1.9 20.1 13.3 - 27.0 35.4 27.3 - 43.4 43.9 37.1 - 50.7 55-64 87 -- -- 20.7 10.2 - 31.2 42.5 30.5 - 54.6 36.8 25.4 - 48.2 25-64 597 0.3 0.0 - 0.7 21.6 17.0 - 26.1 36.5 32.1 - 40.8 41.7 37.1 - 46.2
BMI classifications
Age Group (years)
Women
n
% Under-weight <18.5
95% CI % Normal
weight 18.5-24.9
95% CI % Over-weight
25.0-29.9 95% CI
% Obese ≥30.0
95% CI
25-34 215 0.5 0.0 - 1.4 14.0 8.5 - 19.4 24.2 19.5 - 28.8 61.4 54.0 - 68.7 35-44 232 0.4 0.0 - 1.3 13.8 9.6 - 18.0 27.2 21.3 - 33.0 58.6 51.6 - 65.6 45-54 182 -- -- 12.6 7.4 - 17.8 26.9 22.1 - 31.8 60.4 52.7 - 68.2 55-64 125 2.4 0.0 - 5.2 23.2 16.9 - 29.5 24.8 19.4 - 30.2 49.6 42.6 - 56.6 25-64 754 0.6 0.0 - 1.3 14.8 11.8 - 17.7 25.7 23.2 - 28.2 58.9 54.7 - 63.1
BMI classifications
Age Group (years)
Both Sexes
n
% Under-weight <18.5
95% CI % Normal
weight 18.5-24.9
95% CI % Over-weight
25.0-29.9 95% CI
% Obese ≥30.0
95% CI
25-34 377 0.2 0.0 - 0.7 19.1 14.4 - 23.8 30.7 25.8 - 35.5 50.0 44.4 - 55.6 35-44 416 0.5 0.0 - 1.1 16.3 12.1 - 20.5 30.3 26.0 - 34.6 52.9 47.6 - 58.1 45-54 346 0.3 0.0 - 0.9 16.3 12.1 - 20.5 31.1 25.7 - 36.4 52.3 47.1 - 57.5 55-64 212 1.3 0.0 - 2.8 22.0 15.4 - 28.7 32.9 26.7 - 39.2 43.7 37.1 - 50.3 25-64 1351 0.5 0.1 - 0.9 18.0 15.3 - 20.7 30.9 28.4 - 33.4 50.6 47.3 - 53.9

96
BMI ≥25 Description: Percentage of respondents being classified as overweight
(BMI≥25)
Instrument questions: • Height • Weight
BMI≥25
Age Group (years)
Men Women Both Sexes
n %
BMI≥25
95% CI n %
BMI≥25
95% CI n %
BMI≥25
95% CI
25-34 162 75.3 67.2 - 83.4 215 85.6 79.9 - 91.2 377 80.6 75.9 - 85.3 35-44 184 80.4 73.6 - 87.3 232 85.8 81.3 - 90.2 416 83.2 79.0 - 87.4 45-54 164 79.3 72.5 - 86.0 182 87.4 82.2 - 92.6 346 83.4 79.2 - 87.5 55-64 87 79.3 68.8 - 89.8 125 74.4 68.5 - 80.3 212 76.7 70.0 - 83.3 25-64 597 78.2 73.5 - 82.8 754 84.6 81.7 - 87.6 1351 81.5 78.8 - 84.2
Analysis Information: • Questions used: M3, M4, M5 • Epi Info program name: Mbmiclass (unweighted); MbmiclassWT (weighted)

97
Waist circumference
Description: Mean waist circumference among all respondents (excluding pregnant women).
Instrument question: • Waist circumference measurement
Waist circumference (cm)
Age Group (years)
Men Women n Mean 95% CI n Mean 95% CI
25-34 161 91.4 89.1 - 93.7 212 96.8 94.6 - 99.0 35-44 182 95.8 93.7 - 97.9 228 96.9 94.8 - 99.0 45-54 160 95.5 93.5 - 97.5 186 99.3 97.5 - 101.1 55-64 87 96.9 93.5 - 100.3 126 96.4 94.2 - 98.7 25-64 590 94.2 92.8 - 95.7 752 97.3 96.0 - 98.5
Hip circumference
Description: Mean hip circumference among all respondents (excluding pregnant women).
Instrument question: • Hip circumference measurement
Hip circumference (cm)
Age Group (years)
Men Women n Mean 95% CI n Mean 95% CI
25-34 163 101.2 98.9 - 103.5 212 107.4 105.6 - 109.2 35-44 183 103.1 101.9 - 104.4 229 106.6 105.0 - 108.2 45-54 162 101.2 100.0 - 102.4 186 106.2 104.4 - 107.9 55-64 87 100.6 98.1 - 103.1 126 104.3 102.4 - 106.2 25-64 595 101.7 100.7 - 102.8 753 106.5 105.6 - 107.4
Waist / hip ratio
Description: Mean waist-to-hip ratio among all respondents (excluding pregnant women).
Instrument question: • Waist and hip circumference measurement
Mean waist / hip ratio
Age Group (years)
Men Women n Mean 95% CI n Mean 95% CI
25-34 161 0.9 0.9 - 0.9 212 0.9 0.9 - 0.9 35-44 182 0.9 0.9 - 0.9 228 0.9 0.9 - 0.9 45-54 160 0.9 0.9 - 1.0 186 0.9 0.9 - 0.9 55-64 87 1.0 0.9 - 1.0 126 0.9 0.9 - 0.9 25-64 590 0.9 0.9 - 0.9 752 0.9 0.9 - 0.9

98
Blood pressure Description: Mean blood pressure among all respondents, excluding those currently on medication for raised blood pressure.
Instrument question: • During the past two weeks, have you been treated for raised blood pressure
with drugs (medication) prescribed by a doctor or other health worker? • Reading 1-3 systolic and diastolic blood pressure
Mean systolic blood pressure (mmHg)
Age Group (years)
Men Women Both Sexes
n Mean 95% CI n Mean 95% CI n Mean 95% CI
25-34 161 123.0 121.4 - 124.7 223 110.3 109.1 - 111.5 384 116.3 115.3 - 117.3 35-44 178 125.1 123.2 - 127.0 233 116.0 114.6 - 117.4 411 120.3 119.2 - 121.4 45-54 157 125.2 122.7 - 127.6 175 118.9 115.9 - 121.9 332 122.0 119.7 - 124.2 55-64 85 132.0 128.1 - 135.9 118 123.6 118.9 - 128.2 203 127.5 124.7 - 130.3 25-64 581 125.1 124.2 - 126.0 749 115.2 114.2 - 116.1 1330 119.9 119.2 - 120.6
Mean diastolic blood pressure (mmHg)
Age Group (years)
Men Women Both Sexes n Mean 95% CI n Mean 95% CI n Mean 95% CI
25-34 161 75.9 74.3 - 77.5 223 73.4 72.0 - 74.7 384 74.6 73.4 - 75.7 35-44 178 79.2 77.8 - 80.5 234 76.5 75.0 - 78.0 412 77.8 76.6 - 78.9 45-54 156 79.9 78.0 - 81.8 175 76.5 74.7 - 78.4 331 78.2 76.7 - 79.6 55-64 85 80.9 77.9 - 83.8 117 76.4 73.6 - 79.1 202 78.5 76.2 - 80.7 25-64 580 78.2 77.3 - 79.1 749 75.3 74.4 - 76.1 1329 76.7 75.9 - 77.4

99
Raised blood pressure
Description: Percentage of respondents with raised blood pressure and percentage on medication for raised blood pressure.
Instrument question: • During the past two weeks, have you been treated for raised blood pressure
with drugs (medication) prescribed by a doctor or other health worker? • Reading 1-3 systolic and diastolic blood pressure
SBP ≥140 and/or DBP ≥ 90 mmHg, excluding those on meds
Age Group (years)
Men Women Both Sexes n % 95% CI n % 95% CI n % 95% CI
25-34 161 13.0 8.5 - 17.6 223 6.3 3.6 - 8.9 384 9.5 6.7 - 12.2 35-44 178 15.7 10.9 - 20.6 233 15.5 11.5 - 19.4 411 15.6 12.3 - 18.8 45-54 156 20.5 13.5 - 27.5 174 13.8 8.3 - 19.3 330 17.1 11.8 - 22.4 55-64 85 41.2 29.0 - 53.3 117 18.8 10.0 - 27.6 202 29.3 21.6 - 37.0 25-64 580 18.4 15.7 - 21.2 747 11.9 9.4 - 14.5 1327 15.0 13.0 - 17.1
SBP ≥140 and/or DBP ≥ 90 mmHg or currently on medication for raised blood pressure
Age Group (years)
Men Women Both Sexes n % 95% CI n % 95% CI n % 95% CI
25-34 163 14.1 9.3 - 18.9 225 7.1 4.4 - 9.8 388 10.4 7.7 - 13.2 35-44 185 18.9 14.4 - 23.5 237 16.9 12.5 - 21.3 422 17.9 14.5 - 21.2 45-54 164 24.4 16.9 - 31.9 182 17.6 10.6 - 24.5 346 20.9 14.9 - 27.0 55-64 88 43.2 30.5 - 55.9 124 23.4 13.1 - 33.7 212 32.6 24.3 - 40.9 25-64 600 20.9 17.5 - 24.2 768 14.0 11.0 - 17.0 1368 17.3 15.0 - 19.6
Currently on medication for raised blood pressure
Age Group (years)
Men Women Both Sexes n % 95% CI n % 95% CI n % 95% CI
25-34 163 1.2 0.0 - 3.0 225 0.9 0.0 - 2.0 388 1.0 0.1 - 2.0 35-44 185 3.8 1.1 - 6.5 237 1.7 0.0 - 3.4 422 2.7 1.1 - 4.3 45-54 164 4.9 0.3 - 9.4 182 4.4 1.7 - 7.1 346 4.6 1.8 - 7.5 55-64 88 3.4 0.0 - 7.4 124 5.6 1.2 - 10.1 212 4.6 1.4 - 7.8 25-64 600 3.0 0.9 - 5.1 768 2.3 1.2 - 3.5 1368 2.7 1.5 - 3.8

100
Raised blood pressure
Description: Percentage of respondents with raised blood pressure and percentage on medication for raised blood pressure.
Instrument question: • During the past two weeks, have you been treated for raised blood pressure
with drugs (medication) prescribed by a doctor or other health worker? • Reading 1-3 systolic and diastolic blood pressure
SBP ≥160 and/or DBP ≥ 100 mmHg, excluding those on meds
Age Group (years)
Men Women Both Sexes
n % 95% CI n % 95% CI n % 95% CI
25-34 161 1.2 0.0 - 3.1 223 1.3 0.0 - 2.8 384 1.3 0.0 - 2.7 35-44 178 4.5 1.2 - 7.8 233 2.6 0.5 - 4.7 411 3.5 1.6 - 5.4 45-54 156 7.7 4.3 - 11.1 174 4.0 1.3 - 6.8 330 5.8 3.6 - 8.1 55-64 85 15.3 8.3 - 22.3 117 6.0 0.3 - 11.7 202 10.4 5.7 - 15.0 25-64 580 5.1 3.6 - 6.5 747 2.7 1.7 - 3.8 1327 3.8 2.8 - 4.8
SBP ≥160 and/or DBP ≥ 100 mmHg or currently on medication for raised blood pressure
Age Group (years)
Men Women Both Sexes n % 95% CI n % 95% CI n % 95% CI
25-34 163 2.5 0.0 - 4.9 225 2.2 0.6 - 3.9 388 2.3 0.9 - 3.8 35-44 185 8.1 4.4 - 11.8 237 4.2 1.2 - 7.3 422 6.1 3.8 - 8.4 45-54 164 12.2 6.6 - 17.7 182 8.2 3.3 - 13.1 346 10.2 6.1 - 14.2 55-64 88 18.2 9.4 - 27.0 124 11.3 2.8 - 19.8 212 14.5 8.1 - 20.8 25-64 600 7.9 5.2 - 10.6 768 5.0 3.4 - 6.7 1368 6.4 4.9 - 7.9
Currently on medication for raised blood pressure
Age Group (years)
Men Women Both Sexes n % 95% CI n % 95% CI n % 95% CI
25-34 163 1.2 0.0 - 3.0 225 0.9 0.0 - 2.0 388 1.0 0.1 - 2.0 35-44 185 3.8 1.1 - 6.5 237 1.7 0.0 - 3.4 422 2.7 1.1 - 4.3 45-54 164 4.9 0.3 - 9.4 182 4.4 1.7 - 7.1 346 4.6 1.8 - 7.5 55-64 88 3.4 0.0 - 7.4 124 5.6 1.2 - 10.1 212 4.6 1.4 - 7.8 25-64 600 3.0 0.9 - 5.1 768 2.3 1.2 - 3.5 1368 2.7 1.5 - 3.8

101
Heart rate Description: Mean heart rate among all respondents and percentage with a raised heart rate.
Instrument question: • Heart Rate measurement
Mean beats per minute
Age Group (years)
Men Women Both Sexes n Mean 95% CI n Mean 95% CI n Mean 95% CI
25-34 161 74.6 72.6 - 76.6 224 75.1 73.9 - 76.2 385 74.9 73.7 - 76.0 35-44 183 74.2 72.9 - 75.4 237 74.0 72.8 - 75.2 420 74.1 73.1 - 75.0 45-54 165 74.8 73.4 - 76.2 181 72.1 71.0 - 73.3 346 73.5 72.5 - 74.4 55-64 88 74.1 72.6 - 75.7 125 72.9 70.9 - 74.9 213 73.5 72.2 - 74.8 25-64 597 74.5 73.5 - 75.5 767 73.9 73.2 - 74.7 1364 74.2 73.5 - 74.9
Percentage with beats per minute over 100
Age Group (years)
Men Women Both Sexes n % 95% CI n % 95% CI n % 95% CI
25-34 161 1.2 0.0 - 3.1 224 1.8 0.3 - 3.3 385 1.5 0.4 - 2.6 35-44 183 0.5 0.0 - 1.7 237 0.8 0.0 - 2.0 420 0.7 0.0 - 1.5 45-54 165 1.2 0.0 - 2.8 181 -- -- 346 0.6 0.0 - 1.4 55-64 88 2.3 0.0 - 5.5 125 1.6 0.0 - 3.9 213 1.9 0.0 - 4.2 25-64 597 1.1 0.3 - 2.0 767 1.1 0.4 - 1.9 1364 1.1 0.6 - 1.7

102
Biochemical Measurements
Mean fasting blood glucose
Description: mean fasting blood glucose results excluding those currently on medication for diabetes (Non-fasting recipients excluded). Instrument questions: • Are you currently receiving any of the following treatments for diabetes
prescribed by a doctor or other health worker? • Insulin? • Oral drugs (medication) that you have taken in the last 2 weeks? • During the last 12 hours have you had anything to eat or drink, other than
water? • Blood glucose measurement
Mean fasting blood glucose (mmol/L)
Age Group (years)
Men Women Both Sexes n Mean 95% CI n Mean 95% CI n Mean 95% CI
25-34 137 5.4 5.2 - 5.6 181 5.3 5.0 - 5.6 318 5.3 5.2 - 5.5 35-44 150 6.0 5.6 - 6.4 190 5.8 5.5 - 6.2 340 5.9 5.7 - 6.2 45-54 119 6.8 6.3 - 7.3 134 6.2 5.8 - 6.6 253 6.5 6.1 - 6.8 55-64 67 7.2 6.4 - 7.9 96 6.6 5.9 - 7.3 163 6.8 6.4 - 7.3 25-64 473 6.0 5.8 - 6.3 601 5.8 5.6 - 6.0 1074 5.9 5.7 - 6.1
Mean fasting blood glucose (mg/dl)
Age Group (years)
Men Women Both Sexes n Mean 95% CI n Mean 95% CI n Mean 95% CI
25-34 137 97.7 94.4 - 101.0 181 94.9 89.8 - 100.1 318 96.3 92.9 - 99.6
35-44 150 108.7 101.5 - 115.9 190 104.9 99.0 - 110.8 340 106.7 102.1 - 111.4
45-54 119 122.0 112.9 - 131.1 134 112.2 104.8 - 119.5 253 117.0 110.6 - 123.3
55-64 67 129.0 115.4 - 142.6 96 118.4 105.9 - 130.8 163 123.3 115.4 - 131.1
25-64 473 108.9 104.8 - 112.9 601 103.8 100.2 - 107.3 1074 106.2 103.0 - 109.4
103
Raised blood glucose
Description: Categorization of respondents into blood glucose level categories and percentage currently on medication for raised blood glucose (non-fasting recipients excluded).
Instrument questions: • Are you currently receiving any of the following treatments for diabetes
prescribed by a doctor or other health worker? • Insulin? • Oral drugs (medication) that you have taken in the last 2 weeks? • During the last 12 hours have you had anything to eat or drink, other than
water? • Blood glucose measurement
Impaired Fasting Glycaemia*
Age Group (years)
Men Women Both Sexes n % 95% CI n % 95% CI n % 95% CI
25-34 137 25.5 18.1 - 33.0 183 10.4 5.4 - 15.4 320 17.7 13.2 - 22.1 35-44 155 32.9 26.2 - 39.7 201 11.9 7.1 - 16.8 356 21.9 17.3 - 26.5 45-54 133 11.3 3.9 - 18.7 150 18.0 12.0 - 24.0 283 14.7 10.7 - 18.8 55-64 76 14.5 5.5 - 23.4 111 15.3 7.8 - 22.9 187 14.9 9.5 - 20.4 25-64 501 23.9 20.1 - 27.7 645 12.9 10.2 - 15.5 1146 18.1 15.8 - 20.4
Raised blood glucose or currently on medication for diabetes and/or diagnosed with diabetes**
Age Group (years)
Men Women Both Sexes n % 95% CI n % 95% CI n % 95% CI
25-34 137 12.4 6.8 - 18.1 183 14.2 8.0 - 20.4 320 13.3 9.0 - 17.7 35-44 155 27.7 21.0 - 34.5 201 27.9 21.6 - 34.1 356 27.8 22.7 - 32.9 45-54 133 49.6 39.9 - 59.3 150 36.7 30.4 - 42.9 283 43.0 37.2 - 48.8 55-64 76 57.9 43.6 - 72.2 111 46.8 36.9 - 56.8 187 51.9 44.0 - 59.7 25-64 501 29.6 25.6 - 33.5 645 26.7 23.2 - 30.2 1146 28.1 24.8 - 31.3
Currently on medication for diabetes
Age Group (years)
Men Women Both Sexes n % 95% CI n % 95% CI n % 95% CI
25-34 137 -- -- 183 1.1 0.0 - 2.7 320 0.6 0.0 - 1.4 35-44 155 3.2 0.5 - 5.9 201 5.0 1.4 - 8.6 356 4.1 1.7 - 6.6 45-54 133 10.5 4.2 - 16.8 150 10.0 5.3 - 14.7 283 10.3 6.6 - 14.0 55-64 76 10.5 3.4 - 17.7 111 11.7 6.3 - 17.1 187 11.2 6.9 - 15.4 25-64 501 4.2 2.7 - 5.8 645 5.3 3.5 - 7.0 1146 4.8 3.7 - 5.9
* Impaired fasting glycaemia is defined as either • plasma venous value: ≥6.1mmol/L (110mg/dl) and <7.0mmol/L (126mg/dl) • capillary whole blood value: ≥5.6mmol/L (100mg/dl) and <6.1mmol/L (110mg/dl)
** Raised blood glucose is defined as either • plasma venous value: ≥ 7.0 mmol/L (126 mg/dl) • capillary whole blood value: ≥ 6.1 mmol/L (110 mg/dl)
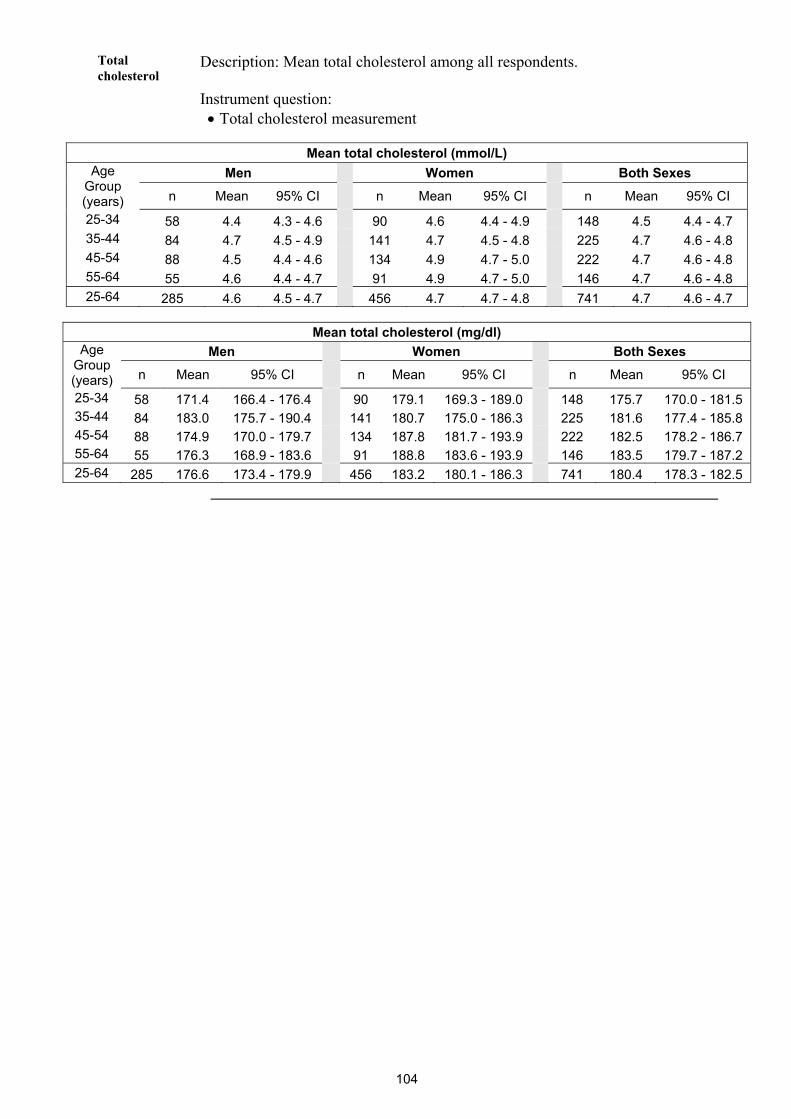
104
Total cholesterol
Description: Mean total cholesterol among all respondents.
Instrument question: • Total cholesterol measurement
Mean total cholesterol (mmol/L)
Age Group (years)
Men Women Both Sexes
n Mean 95% CI n Mean 95% CI n Mean 95% CI
25-34 58 4.4 4.3 - 4.6 90 4.6 4.4 - 4.9 148 4.5 4.4 - 4.7 35-44 84 4.7 4.5 - 4.9 141 4.7 4.5 - 4.8 225 4.7 4.6 - 4.8 45-54 88 4.5 4.4 - 4.6 134 4.9 4.7 - 5.0 222 4.7 4.6 - 4.8 55-64 55 4.6 4.4 - 4.7 91 4.9 4.7 - 5.0 146 4.7 4.6 - 4.8 25-64 285 4.6 4.5 - 4.7 456 4.7 4.7 - 4.8 741 4.7 4.6 - 4.7
Mean total cholesterol (mg/dl)
Age Group (years)
Men Women Both Sexes n Mean 95% CI n Mean 95% CI n Mean 95% CI
25-34 58 171.4 166.4 - 176.4 90 179.1 169.3 - 189.0 148 175.7 170.0 - 181.5 35-44 84 183.0 175.7 - 190.4 141 180.7 175.0 - 186.3 225 181.6 177.4 - 185.8 45-54 88 174.9 170.0 - 179.7 134 187.8 181.7 - 193.9 222 182.5 178.2 - 186.7 55-64 55 176.3 168.9 - 183.6 91 188.8 183.6 - 193.9 146 183.5 179.7 - 187.2 25-64 285 176.6 173.4 - 179.9 456 183.2 180.1 - 186.3 741 180.4 178.3 - 182.5

105
Raised total cholesterol
Description: Percentage of respondents with raised total cholesterol.
Instrument question: • Total cholesterol measurement
Total cholesterol ≥ 5.0 mmol/L or ≥ 190 mg/dl
Age Group (years)
Men Women Both Sexes n % 95% CI n % 95% CI n % 95% CI
25-34 58 15.5 4.1 - 26.9 90 22.2 14.0 - 30.5 148 19.3 12.7 - 25.8 35-44 84 33.3 21.2 - 45.5 141 24.1 16.5 - 31.7 225 27.9 22.0 - 33.8 45-54 88 23.9 14.9 - 32.8 134 43.3 32.7 - 53.9 222 35.2 27.7 - 42.8 55-64 55 20.0 8.7 - 31.3 91 39.6 30.2 - 49.0 146 31.3 24.4 - 38.1 25-64 285 23.8 18.8 - 28.8 456 30.6 26.7 - 34.4 741 27.7 24.6 - 30.8
Total cholesterol ≥ 6.2 mmol/L or ≥ 240 mg/dl
Age Group (years)
Men Women Both Sexes n % 95% CI n % 95% CI n % 95% CI
25-34 58 -- -- 90 2.2 0.0 - 5.5 148 1.2 0.0 - 3.1 35-44 84 4.8 0.0 - 11.7 141 5.0 0.2 - 9.8 225 4.9 1.0 - 8.8 45-54 88 2.3 0.0 - 5.3 134 6.7 2.3 - 11.1 222 4.9 1.7 - 8.0 55-64 55 3.6 0.0 - 8.8 91 3.3 0.0 - 6.8 146 3.4 0.8 - 6.1 25-64 285 2.6 0.2 - 5.0 456 4.4 2.3 - 6.5 741 3.6 2.2 - 5.1

106
Raised Risk
Raised risk Description: Percentage of respondents with 0, 1-2, or 3-5 of the following risk
factors: • current daily smoker • less than 5 servings of fruits & vegetables per day • low level of activity (<600 MET -minutes) • overweight (BMI ≥ 25 kg/m2) • raised BP (SBP ≥ 140 and/or DBP ≥ 90 mmHg or currently on medication
for raised BP).
Instrument question: combined from Step 1 and Step 2
Raised Risk
Age Group (years)
Men
n % with 0
risk factors
95% CI % with 1-2
risk factors
95% CI % with 3-5
risk factors
95% CI
25-44 298 -- -- 22.8 18.0-27.6 77.2 72.4-82.0 45-64 219 -- -- 19.6 13.4-25.9 80.4 74.1-86.6 25-64 517 -- -- 21.8 17.7-26.0 78.2 74.0-82.3
Raised Risk
Age Group (years)
Women
n % with 0
risk factors
95% CI % with 1-2
risk factors
95% CI % with 3-5
risk factors
95% CI
25-44 420 -- -- 31.2 26.6-35.9 68.8 64.1-73.4 45-64 278 0.4 0.0-1.1 21.9 19.0-24.9 77.7 74.5-80.9 25-64 698 0.1 0.0-0.3 28.4 25.0-31.8 71.5 68.1-74.8
Raised Risk
Age Group (years)
Both Sexes
n % with 0
risk factors
95% CI % with 1-2
risk factors
95% CI % with 3-5
risk factors
95% CI
25-44 718 -- -- 27.3 24.3-30.4 72.7 69.6-75.7 45-64 497 0.2 0.0-0.6 20.9 17.4-24.3 79.0 75.3-82.6 25-64 1215 0.1 0.0-0.2 25.4 22.8-27.9 74.6 72.0-77.2

107
Appendix 3. List of STEPS Survey Staff from Kiribati Team Leader Tinai Iuta Team Leader Benete Tokanang Registration Staff Bema Abere Interviewer Keene Rotitaake Interviewer Buari Tonganibeia Interviewer Sr. Rakena Viane Interviewer Roote Tong Interviewer Tietaake Moote Interviewer Meeri Paul Interviewer Uriam Erabute Interviewer Reenika Taniera Interviewer Kaua Eriakim Interviewer Mareti Teuee Interviewer Teeba Tiaon Interviewer Tiantaake Taoaba Interviewer Maere Anterea Interviewer Ranga Namai Interviewer Arote Uriam Height and Weight Measurement Staff Karote Tauroba Waist and Hip Measurement Staff Eretii Timeon Questionnaire Reviewer and Counsellor Tanimwakin Nootii Blood Test Staff (Tarawa) Kanimako Ieremia Blood Test Staff (Tarawa) Nuukai Tenaua Blood Test Staff (Outer Islands) Veronica Tokataam Blood Test Staff (Outer Islands) Baibuke Teikake Blood Test Staff (Outer Islands) Emeree Tataio Blood Test Staff (Outer Islands) Okobeta Kaiea Blood Test Staff (Outer Islands) Beia Tabwaia Blood Test Staff (Outer Islands) Amota Tebao Blood Pressure Measurement Staff Katua Tianuare Blood Pressure Measurement Staff Teotiua Puta Data Entry Staff Tutu Ueaiti Data Entry Staff Ereti Timeon Data Entry Staff Tinai Kwong

108
Appendix 4. References
1. Beaglehole R, Yach D. Globalisation and the prevention and control of non-communicable disease: the neglected chronic diseases of adults. Lancet 2003; 362:903-08.
2. Daar AS, Singer PA, Persad DL, et al. Grand challenges in chronic non-communicable
diseases. The top 20 policy and research priorities for conditions such as diabetes, stroke and heart disease. Nature 2007; 450:494-496.
3. Dwyer T, Tieru H, Hynes K, Zhang C. Profile of Cardiovascular Diseases, Diabetes
Mellitus and Associated Risk Factors in the Western Pacific Region. World Health Organization, Philippines, 1999.
4. World Health Organization. The WHO stepwise approach to surveillance of non-
communicable diseases (STEPS): Steps instrument for NCD risk factors (core and expanded version 1.4). Available from: http://www.who.int/ncd_surveillance/en/ [Accessed 28 January 2009].
5. King H, Taylor R, Zimmet P, et al. Non insulin dependent diabetes (NIDDM) in a newly
independent Pacific nation – the Republic of Kiribati. Diabetes Care 1984;7:1002-1007.
6. Global Physical Activity Questionnaire (GPAQ). Analysis Guide. World Health Organization. Department of Chronic Diseases and Health Promotion. Surveillance and Population-Based Prevention, 2007. Available at: http://www.who.int/chp/steps/resources/GPAQ_Analysis_Guide.pdf. (Accessed 29 January 2009)
7. World Health Organization (1999b). Definition, Diagnosis and Classification of Diabetes
Mellitus and its Complications. Report of a WHO Consultation. Part 1: Diagnosis and Classification of Diabetes Mellitus. Department of Noncommunicable Disease Surveillance, Geneva, World Health Organization. WHO/NCD/NCS/99.2.

KEY CONTACTS Kiribati Ministry of Health and Medical Services Contact:
Dr Revite Kirition Acting Director Public Health Services Ministry of Health and Medical Services P. O. Box 268 Bikenibeu, Nawerewere Tarawa Republic of Kiribati Tel: (686) 28100 Ext. 209 Fax: (686) 28152 Email: [email protected]
WHO Contact: Dr Li Dan Medical Officer Noncommunicable Diseases WHO Office for the South Pacific Plaza One, Downtown Boulevard P. O. Box 113 Suva, Fiji Tel: (679) 3234103 Fax: (679) 3234166 Email: [email protected] Centre for Physical Activity and Health Contact:
Dr Philayrath Phongsavan School of Public Health University of Sydney Level 2, Medical Foundation Building K25 94 Parramatta Road Camperdown NSW 2050 Sydney, Australia Tel: (61 2)9036 3248 Fax: (61 2)9036 3184 Email: [email protected]