Kirby Corporation - AnnualReports.com
22
Kirby Corporation 2014 Annual Report
Transcript of Kirby Corporation - AnnualReports.com
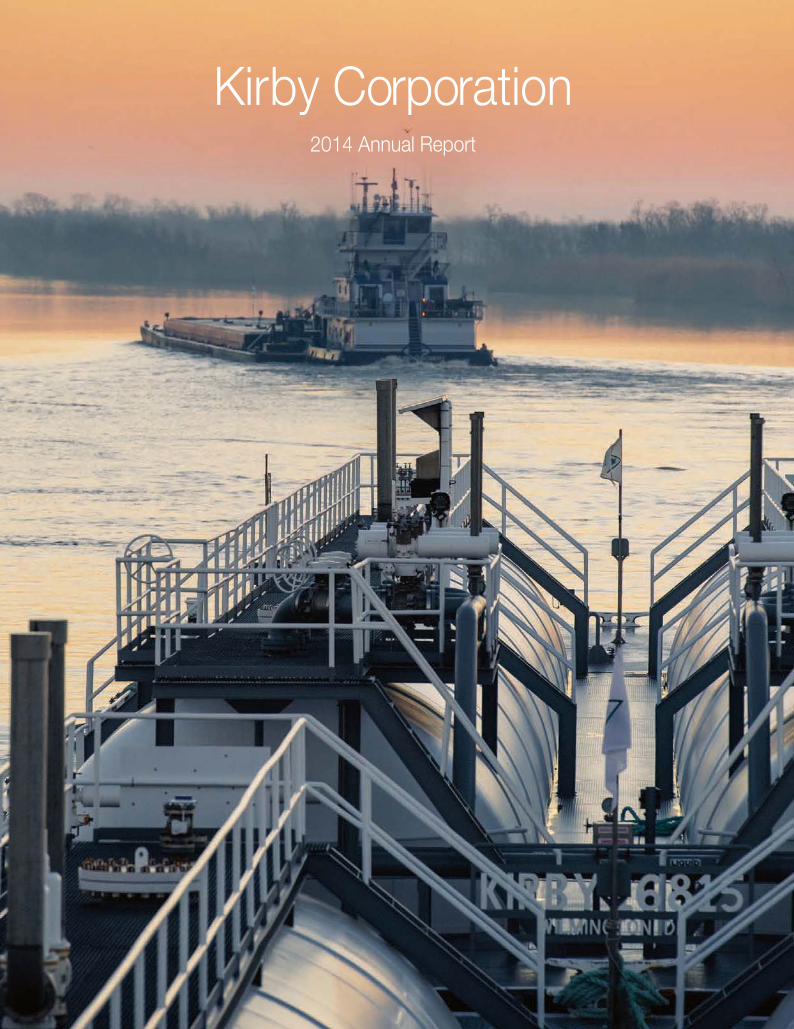
Kirby Corporation2014 Annual Report
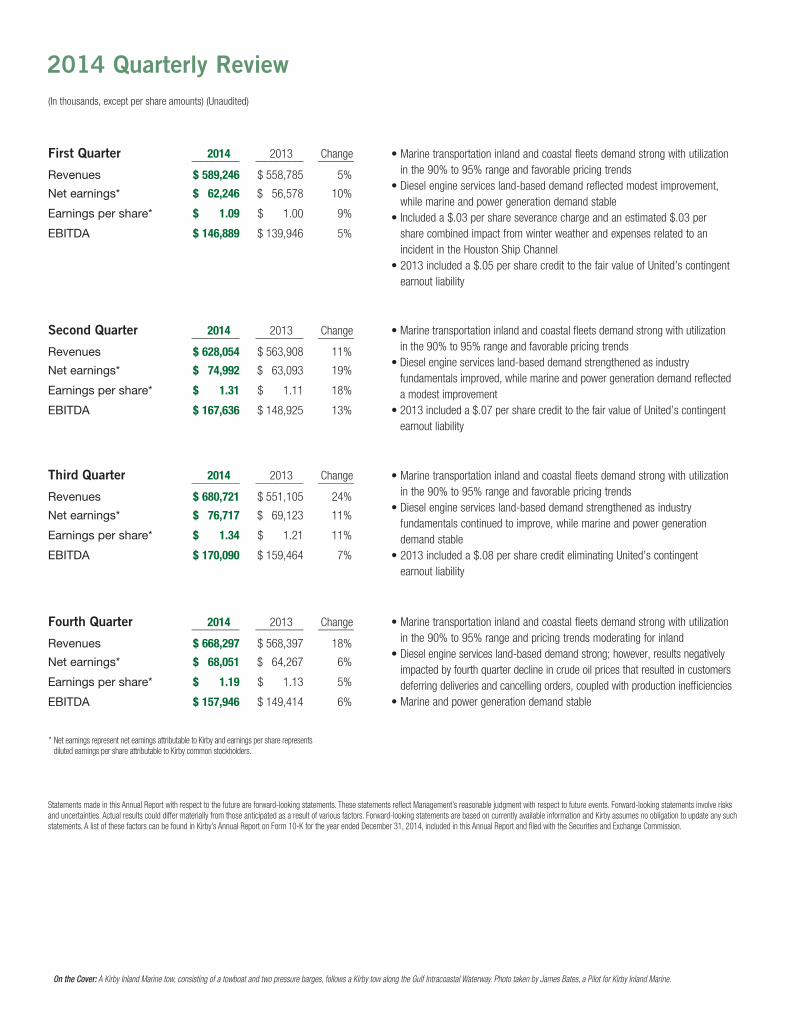
(In thousands, except per share amounts) (Unaudited)
Statements made in this Annual Report with respect to the future are forward-looking statements. These statements reflect Management’s reasonable judgment with respect to future events. Forward-looking statements involve risks and uncertainties. Actual results could differ materially from those anticipated as a result of various factors. Forward-looking statements are based on currently available information and Kirby assumes no obligation to update any such statements. A list of these factors can be found in Kirby’s Annual Report on Form 10-K for the year ended December 31, 2014, included in this Annual Report and filed with the Securities and Exchange Commission.
First Quarter 2014 2013 Change ________ ________ ______
Revenues $ 589,246 $ 558,785 5%
Net earnings* $ 62,246 $ 56,578 10%
Earnings per share* $ 1.09 $ 1.00 9%
EBITDA $ 146,889 $ 139,946 5%
• Marine transportation inland and coastal fleets demand strong with utilization
in the 90% to 95% range and favorable pricing trends
• Diesel engine services land-based demand reflected modest improvement,
while marine and power generation demand stable
• Included a $.03 per share severance charge and an estimated $.03 per
share combined impact from winter weather and expenses related to an
incident in the Houston Ship Channel
• 2013 included a $.05 per share credit to the fair value of United’s contingent
earnout liability
* Net earnings represent net earnings attributable to Kirby and earnings per share represents diluted earnings per share attributable to Kirby common stockholders.
2014 Quarterly Review
On the Cover: A Kirby Inland Marine tow, consisting of a towboat and two pressure barges, follows a Kirby tow along the Gulf Intracoastal Waterway. Photo taken by James Bates, a Pilot for Kirby Inland Marine.
• Marine transportation inland and coastal fleets demand strong with utilization
in the 90% to 95% range and favorable pricing trends
• Diesel engine services land-based demand strengthened as industry
fundamentals improved, while marine and power generation demand reflected
a modest improvement
• 2013 included a $.07 per share credit to the fair value of United’s contingent
earnout liability
Second Quarter 2014 2013 Change ________ ________ ______
Revenues $ 628,054 $ 563,908 11%
Net earnings* $ 74,992 $ 63,093 19%
Earnings per share* $ 1.31 $ 1.11 18%
EBITDA $ 167,636 $ 148,925 13%
• Marine transportation inland and coastal fleets demand strong with utilization
in the 90% to 95% range and favorable pricing trends
• Diesel engine services land-based demand strengthened as industry
fundamentals continued to improve, while marine and power generation
demand stable
• 2013 included a $.08 per share credit eliminating United’s contingent
earnout liability
Third Quarter 2014 2013 Change ________ ________ ______
Revenues $ 680,721 $ 551,105 24%
Net earnings* $ 76,717 $ 69,123 11%
Earnings per share* $ 1.34 $ 1.21 11%
EBITDA $ 170,090 $ 159,464 7%
• Marine transportation inland and coastal fleets demand strong with utilization
in the 90% to 95% range and pricing trends moderating for inland
• Diesel engine services land-based demand strong; however, results negatively
impacted by fourth quarter decline in crude oil prices that resulted in customers
deferring deliveries and cancelling orders, coupled with production inefficiencies
• Marine and power generation demand stable
Fourth Quarter 2014 2013 Change ________ ________ ______
Revenues $ 668,297 $ 568,397 18%
Net earnings* $ 68,051 $ 64,267 6%
Earnings per share* $ 1.19 $ 1.13 5%
EBITDA $ 157,946 $ 149,414 6%
* EBITDA, defined as net earnings attributable to Kirby before interest expense, taxes on income, depreciation and amortization, is a non-GAAP financial measure used by Kirby because of its wide acceptance as a measure of operating profitability before nonoperating expenses (interest and taxes) and noncash charges (depreciation and amortization).
** Return on invested capital is defined as net earnings attributable to Kirby plus interest expense (net of taxes) divided by total average invested capital (average equity plus average debt). For 2010, adjusted to reflect average debt levels net of cash and cash equivalents.
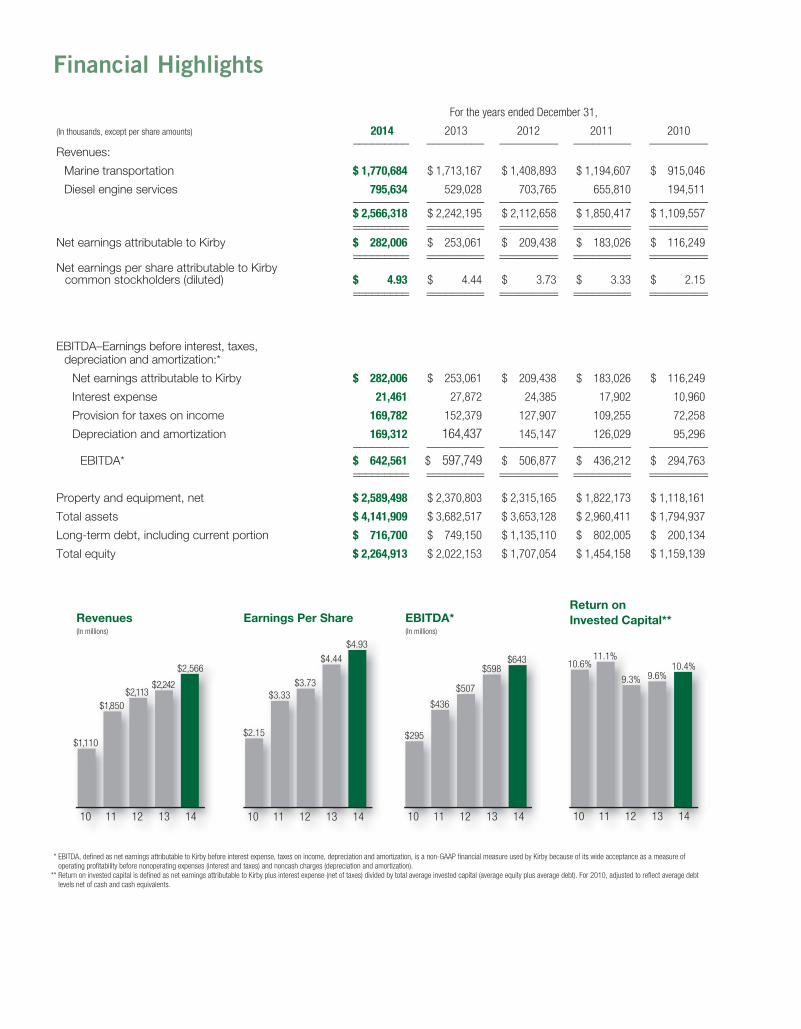
Revenues(In millions)
10
$1,110
11
$1,850
12
$2,113
13
$2,242
14
$2,566
Earnings Per Share
10
$2.15
11
$3.33
12
$3.73
13
$4.44
14
$4.93
EBITDA*(In millions)
10
$295
11
$436
12
$507
13
$598
14
$643
10
10.6%
11
11.1%
12
9.3%
13
9.6%
14
10.4%
Return on
Invested Capital**
Financial Highlights
For the years ended December 31,
(In thousands, except per share amounts) 2014 2013 2012 2011 2010 _________ _________ _________ _________ _________Revenues:
Marine transportation $ 1,770,684 $ 1,713,167 $ 1,408,893 $ 1,194,607 $ 915,046
Diesel engine services 795,634 529,028 703,765 655,810 194,511 _________ _________ _________ _________ _________
$ 2,566,318 $ 2,242,195 $ 2,112,658 $ 1,850,417 $ 1,109,557 _________ _________ _________ _________ _________ _________ _________ _________ _________ _________
Net earnings attributable to Kirby $ 282,006 $ 253,061 $ 209,438 $ 183,026 $ 116,249 _________ _________ _________ _________ _________ _________ _________ _________ _________ _________Net earnings per share attributable to Kirby common stockholders (diluted) $ 4.93 $ 4.44 $ 3.73 $ 3.33 $ 2.15 _________ _________ _________ _________ _________ _________ _________ _________ _________ _________
EBITDA–Earnings before interest, taxes, depreciation and amortization:*
Net earnings attributable to Kirby $ 282,006 $ 253,061 $ 209,438 $ 183,026 $ 116,249
Interest expense 21,461 27,872 24,385 17,902 10,960
Provision for taxes on income 169,782 152,379 127,907 109,255 72,258
Depreciation and amortization 169,312 164,437 145,147 126,029 95,296 _________ _________ _________ _________ _________
EBITDA* $ 642,561 $ 597,749 $ 506,877 $ 436,212 $ 294,763 _________ _________ _________ _________ _________ _________ _________ _________ _________ _________
Property and equipment, net $ 2,589,498 $ 2,370,803 $ 2,315,165 $ 1,822,173 $ 1,118,161
Total assets $ 4,141,909 $ 3,682,517 $ 3,653,128 $ 2,960,411 $ 1,794,937
Long-term debt, including current portion $ 716,700 $ 749,150 $ 1,135,110 $ 802,005 $ 200,134
Total equity $ 2,264,913 $ 2,022,153 $ 1,707,054 $ 1,454,158 $ 1,159,139
2 Kirby 2014 Annual Report
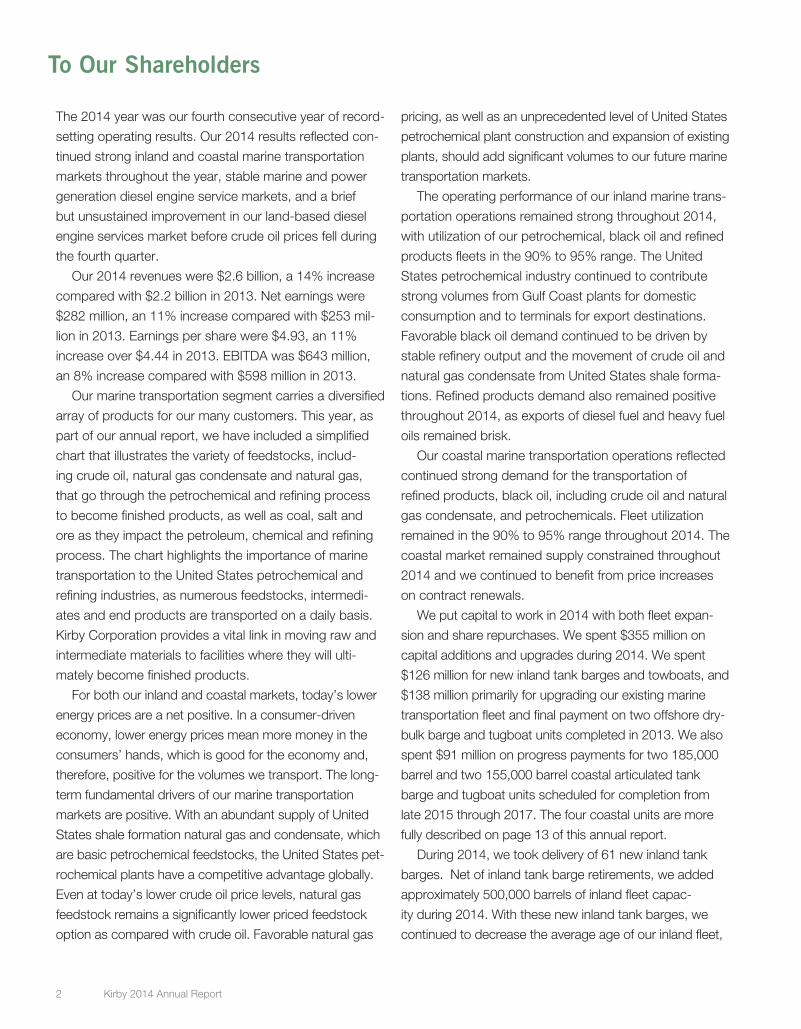
To Our Shareholders
The 2014 year was our fourth consecutive year of record-
setting operating results. Our 2014 results reflected con-
tinued strong inland and coastal marine transportation
markets throughout the year, stable marine and power
generation diesel engine service markets, and a brief
but unsustained improvement in our land-based diesel
engine services market before crude oil prices fell during
the fourth quarter.
Our 2014 revenues were $2.6 billion, a 14% increase
compared with $2.2 billion in 2013. Net earnings were
$282 million, an 11% increase compared with $253 mil-
lion in 2013. Earnings per share were $4.93, an 11%
increase over $4.44 in 2013. EBITDA was $643 million,
an 8% increase compared with $598 million in 2013.
Our marine transportation segment carries a diversified
array of products for our many customers. This year, as
part of our annual report, we have included a simplified
chart that illustrates the variety of feedstocks, includ-
ing crude oil, natural gas condensate and natural gas,
that go through the petrochemical and refining process
to become finished products, as well as coal, salt and
ore as they impact the petroleum, chemical and refining
process. The chart highlights the importance of marine
transportation to the United States petrochemical and
refining industries, as numerous feedstocks, intermedi-
ates and end products are transported on a daily basis.
Kirby Corporation provides a vital link in moving raw and
intermediate materials to facilities where they will ulti-
mately become finished products.
For both our inland and coastal markets, today’s lower
energy prices are a net positive. In a consumer-driven
economy, lower energy prices mean more money in the
consumers’ hands, which is good for the economy and,
therefore, positive for the volumes we transport. The long-
term fundamental drivers of our marine transportation
markets are positive. With an abundant supply of United
States shale formation natural gas and condensate, which
are basic petrochemical feedstocks, the United States pet-
rochemical plants have a competitive advantage globally.
Even at today’s lower crude oil price levels, natural gas
feedstock remains a significantly lower priced feedstock
option as compared with crude oil. Favorable natural gas
pricing, as well as an unprecedented level of United States
petrochemical plant construction and expansion of existing
plants, should add significant volumes to our future marine
transportation markets.
The operating performance of our inland marine trans-
portation operations remained strong throughout 2014,
with utilization of our petrochemical, black oil and refined
products fleets in the 90% to 95% range. The United
States petrochemical industry continued to contribute
strong volumes from Gulf Coast plants for domestic
consumption and to terminals for export destinations.
Favorable black oil demand continued to be driven by
stable refinery output and the movement of crude oil and
natural gas condensate from United States shale forma-
tions. Refined products demand also remained positive
throughout 2014, as exports of diesel fuel and heavy fuel
oils remained brisk.
Our coastal marine transportation operations reflected
continued strong demand for the transportation of
refined products, black oil, including crude oil and natural
gas condensate, and petrochemicals. Fleet utilization
remained in the 90% to 95% range throughout 2014. The
coastal market remained supply constrained throughout
2014 and we continued to benefit from price increases
on contract renewals.
We put capital to work in 2014 with both fleet expan-
sion and share repurchases. We spent $355 million on
capital additions and upgrades during 2014. We spent
$126 million for new inland tank barges and towboats, and
$138 million primarily for upgrading our existing marine
transportation fleet and final payment on two offshore dry-
bulk barge and tugboat units completed in 2013. We also
spent $91 million on progress payments for two 185,000
barrel and two 155,000 barrel coastal articulated tank
barge and tugboat units scheduled for completion from
late 2015 through 2017. The four coastal units are more
fully described on page 13 of this annual report.
During 2014, we took delivery of 61 new inland tank
barges. Net of inland tank barge retirements, we added
approximately 500,000 barrels of inland fleet capac-
ity during 2014. With these new inland tank barges, we
continued to decrease the average age of our inland fleet,
from 23.9 years old in 2008 to 15.3 years old today. The
newer inland tank barge fleet improves reliability and reduces
maintenance costs. A table on page 11 of this annual report
shows the decline in the average age of our inland tank
barge fleet.
In our diesel engine services segment, business
improved during 2014, but there were headwinds gather-
ing late in the year due to the collapse of crude oil pricing.
Through the third quarter of 2014, our land-based diesel
engine services market saw improving demand across its
entire oil services portfolio, including orders for the manu-
facture of new pressure pumping units and oil service
equipment, and increased demand for the remanufacture
of pressure pumping units, as well as increased service
and sale of engines and parts. With the significant drop
in crude oil prices in the fourth quarter, we experienced
some customer deferrals of new equipment deliveries until
2015, cancellations of new equipment orders and requests
for price reductions on new equipment. We continue to
emphasize growth in the remanufacturing portion of this
business and operating expense discipline to dampen the
earnings volatility in future oil and gas cycles.
Our marine diesel engine services market benefited from
modest improvements in service activity and direct parts
sales from its inland and offshore customers, as well as off-
shore oil service and drilling customers. Our power genera-
tion market remained stable as a result of engine generator
set upgrades and parts sales for both domestic and inter-
national customers.
During the 2014 fourth quarter and early 2015, we took
advantage of a significant reduction in the price of our
common stock and initiated a share repurchase program.
From mid-December 2014 through February 2015, we
have repurchased approximately 1.4 million shares of our
common stock for $113 million, at an average price of
$78.72 per share. Our remaining repurchase authorization
is currently 3.5 million shares.
We wish to thank each and every Kirby employee who
contributed to making 2014 a record-setting year. We truly
believe our marine transportation and diesel engines ser-
vices employees are the best in the business.
Our Board of
Directors brings a
wealth of exper-
tise to Kirby and
we want to thank
them for their sup-
port, guidance
and direction. We
are also pleased
to note the nomi-
nation of a new
director, Barry
Davis, President
and CEO of
EnLink Midstream
Partners, LP and
EnLink Midstream,
LLC, who has
been nominated for election to our Board at our 2015
Annual Meeting of Stockholders on April 28, 2015.
We also want to extend a special thank you to Bob
Gower, a Kirby Board member since 1998. Bob will retire
from the Board at our April Annual Meeting, having served
on our Board for 17 years. Bob’s wealth of petrochemical
and financial expertise, leadership and support contributed
greatly to the growth of Kirby during his tenure on the Board.
While the 2015 year is beginning with some uncer-
tainty related to lower crude oil prices, we are very well
positioned to continue to prosper and create value for our
shareholders. The long-term fundamentals of both our
marine transportation and diesel engine services segments
remain intact. Our balance sheet is very strong with a debt-
to-capital ratio of 24.0% at year-end 2014. We will continue
to be disciplined in our approach as we evaluate compet-
ing alternatives for our allocation of capital.
Respectfully submitted,
Joseph H. Pyne David W. GrzebinskiChairman of the Board President and Chief Executive Officer
Houston, TexasMarch 9, 2015
David GrzebinskiPresident and Chief Executive Officer
Joe PyneChairman
4 Kirby 2014 Annual Report
Marine Transportation
The United States tank barge industry serves the inland waterways, consisting of the Mississippi River
System and the Gulf Intracoastal Waterway, and coastal ports along all three coasts and in Alaska and
Hawaii. The nation’s inland tank barge fleet is comprised of approximately 3,650 liquid tank barges.
We operate 890 inland tank barges, or 24% of the nation’s inland fleet. The nation’s coastal tank barge
fleet, in the 195,000 barrels or less category, is comprised of approximately 260 liquid tank barges.
We operate 69 coastal tank barges, or 27% of the nation’s coastal fleet. We also operate six offshore
dry-bulk cargo barges.
Kirby Inland Marine is the United States’ largest inland tank barge operator, transporting petrochemicals,
black oil, refined petroleum products and agricultural chemicals throughout the Mississippi River
System, Gulf Intracoastal Waterway and Houston Ship Channel.
Kirby Offshore Marine is the United States’ largest coastal tank barge operator in the 195,000 barrels
or less category, transporting petrochemicals, black oil and refined petroleum products along all three
coasts and in Alaska and Hawaii, as well as dry bulk cargoes along the Gulf Coast and East Coast.
Our inland and coastal tank barge customers consist of the large petrochemical and refining companies
that operate in the United States, providing a critical link in customers’ supply chains, transporting and
transferring bulk liquid products that keep plants and refineries operating efficiently. The coastal dry-bulk
fleet’s customers primarily consist of a Florida utility, sugar producers and a concrete manufacturer.
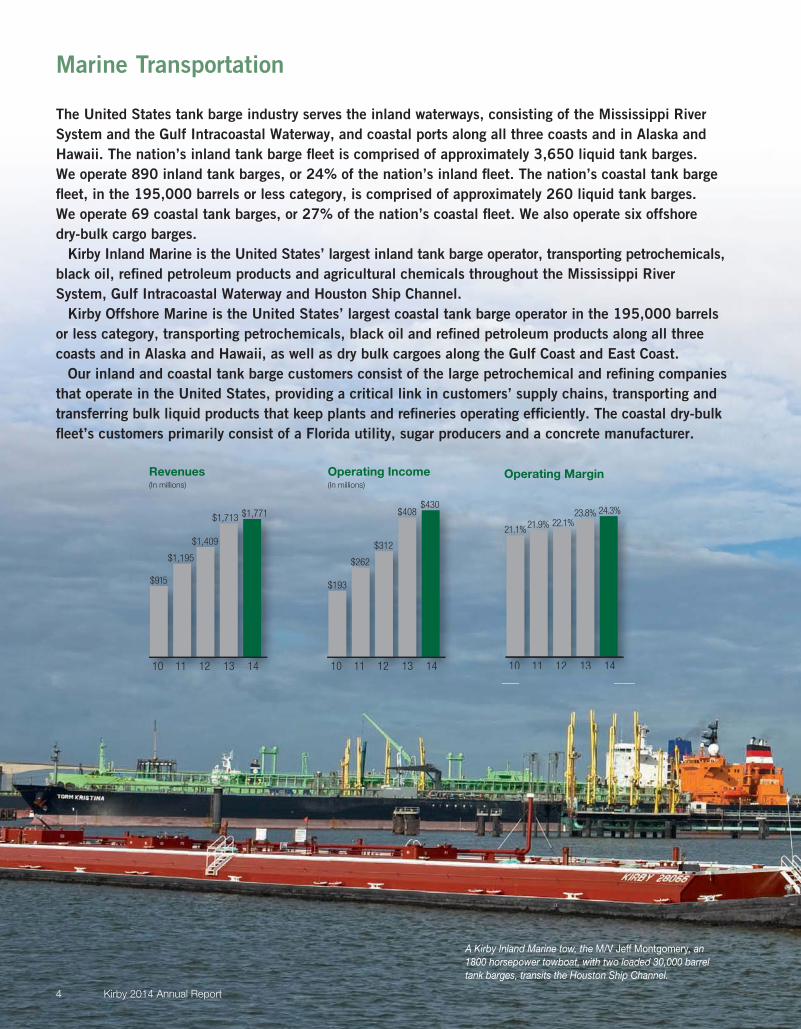
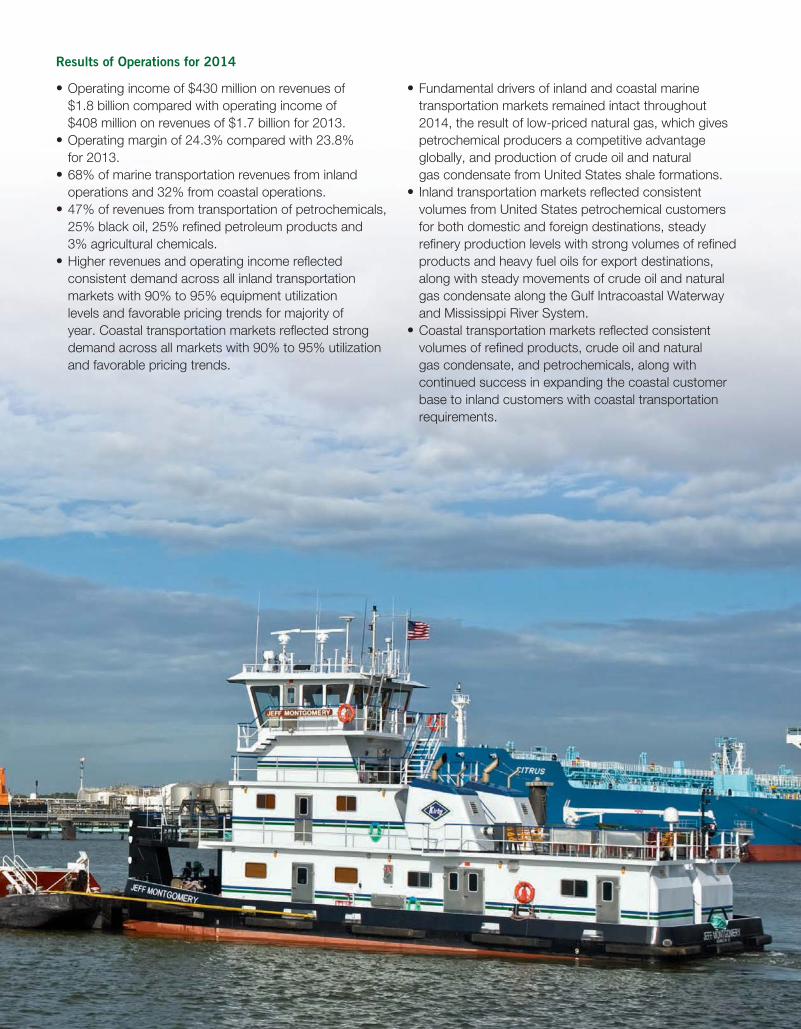
A Kirby Inland Marine tow, the M/V Jeff Montgomery, an 1800 horsepower towboat, with two loaded 30,000 barrel tank barges, transits the Houston Ship Channel.
Revenues(In millions)
10
$915
11
$1,195
12
$1,409
13
$1,713
14
$1,771
Operating Income(In millions)
10
$193
11
$262
12
$312
13
$408
14
$430
Operating Margin
10
21.1%
11
21.9%
12
22.1%
13
23.8%
14
24.3%
Results of Operations for 2014
• Operating income of $430 million on revenues of $1.8 billion compared with operating income of $408 million on revenues of $1.7 billion for 2013.
• Operating margin of 24.3% compared with 23.8% for 2013.
• 68% of marine transportation revenues from inland operations and 32% from coastal operations.
• 47% of revenues from transportation of petrochemicals, 25% black oil, 25% refined petroleum products and 3% agricultural chemicals.
• Higher revenues and operating income reflected consistent demand across all inland transportation markets with 90% to 95% equipment utilization levels and favorable pricing trends for majority of year. Coastal transportation markets reflected strong demand across all markets with 90% to 95% utilization and favorable pricing trends.
• Fundamental drivers of inland and coastal marine transportation markets remained intact throughout 2014, the result of low-priced natural gas, which gives petrochemical producers a competitive advantage globally, and production of crude oil and natural gas condensate from United States shale formations.
• Inland transportation markets reflected consistent volumes from United States petrochemical customers for both domestic and foreign destinations, steady refinery production levels with strong volumes of refined products and heavy fuel oils for export destinations, along with steady movements of crude oil and natural gas condensate along the Gulf Intracoastal Waterway and Mississippi River System.
• Coastal transportation markets reflected consistent volumes of refined products, crude oil and natural gas condensate, and petrochemicals, along with continued success in expanding the coastal customer base to inland customers with coastal transportation requirements.
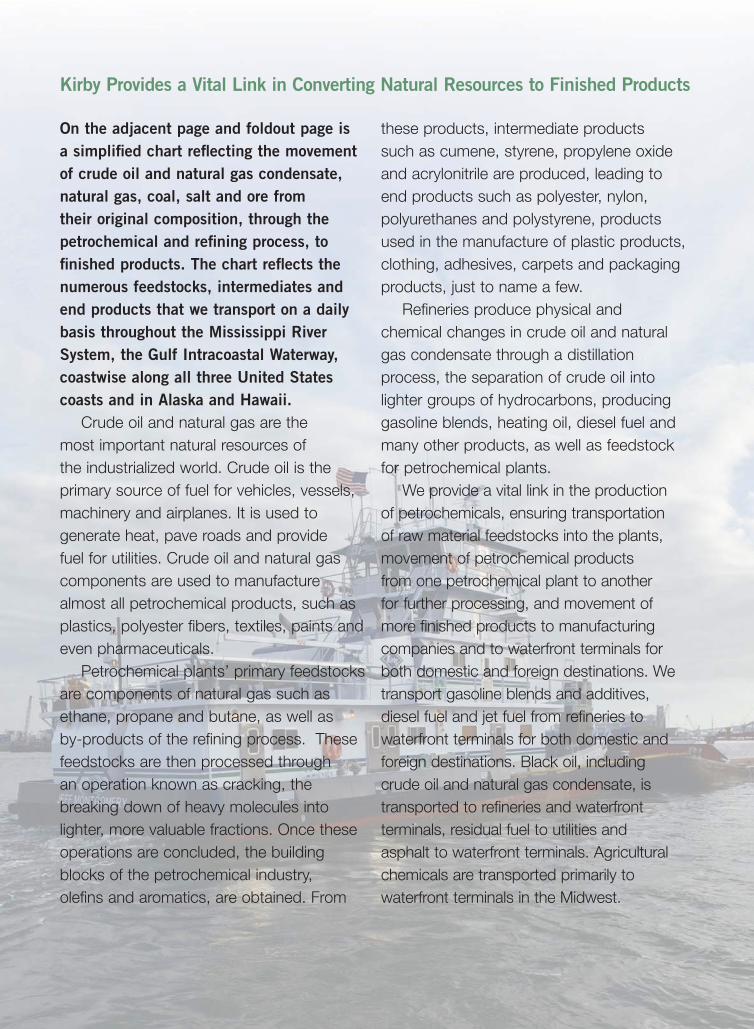
On the adjacent page and foldout page is
a simplified chart reflecting the movement
of crude oil and natural gas condensate,
natural gas, coal, salt and ore from
their original composition, through the
petrochemical and refining process, to
finished products. The chart reflects the
numerous feedstocks, intermediates and
end products that we transport on a daily
basis throughout the Mississippi River
System, the Gulf Intracoastal Waterway,
coastwise along all three United States
coasts and in Alaska and Hawaii.
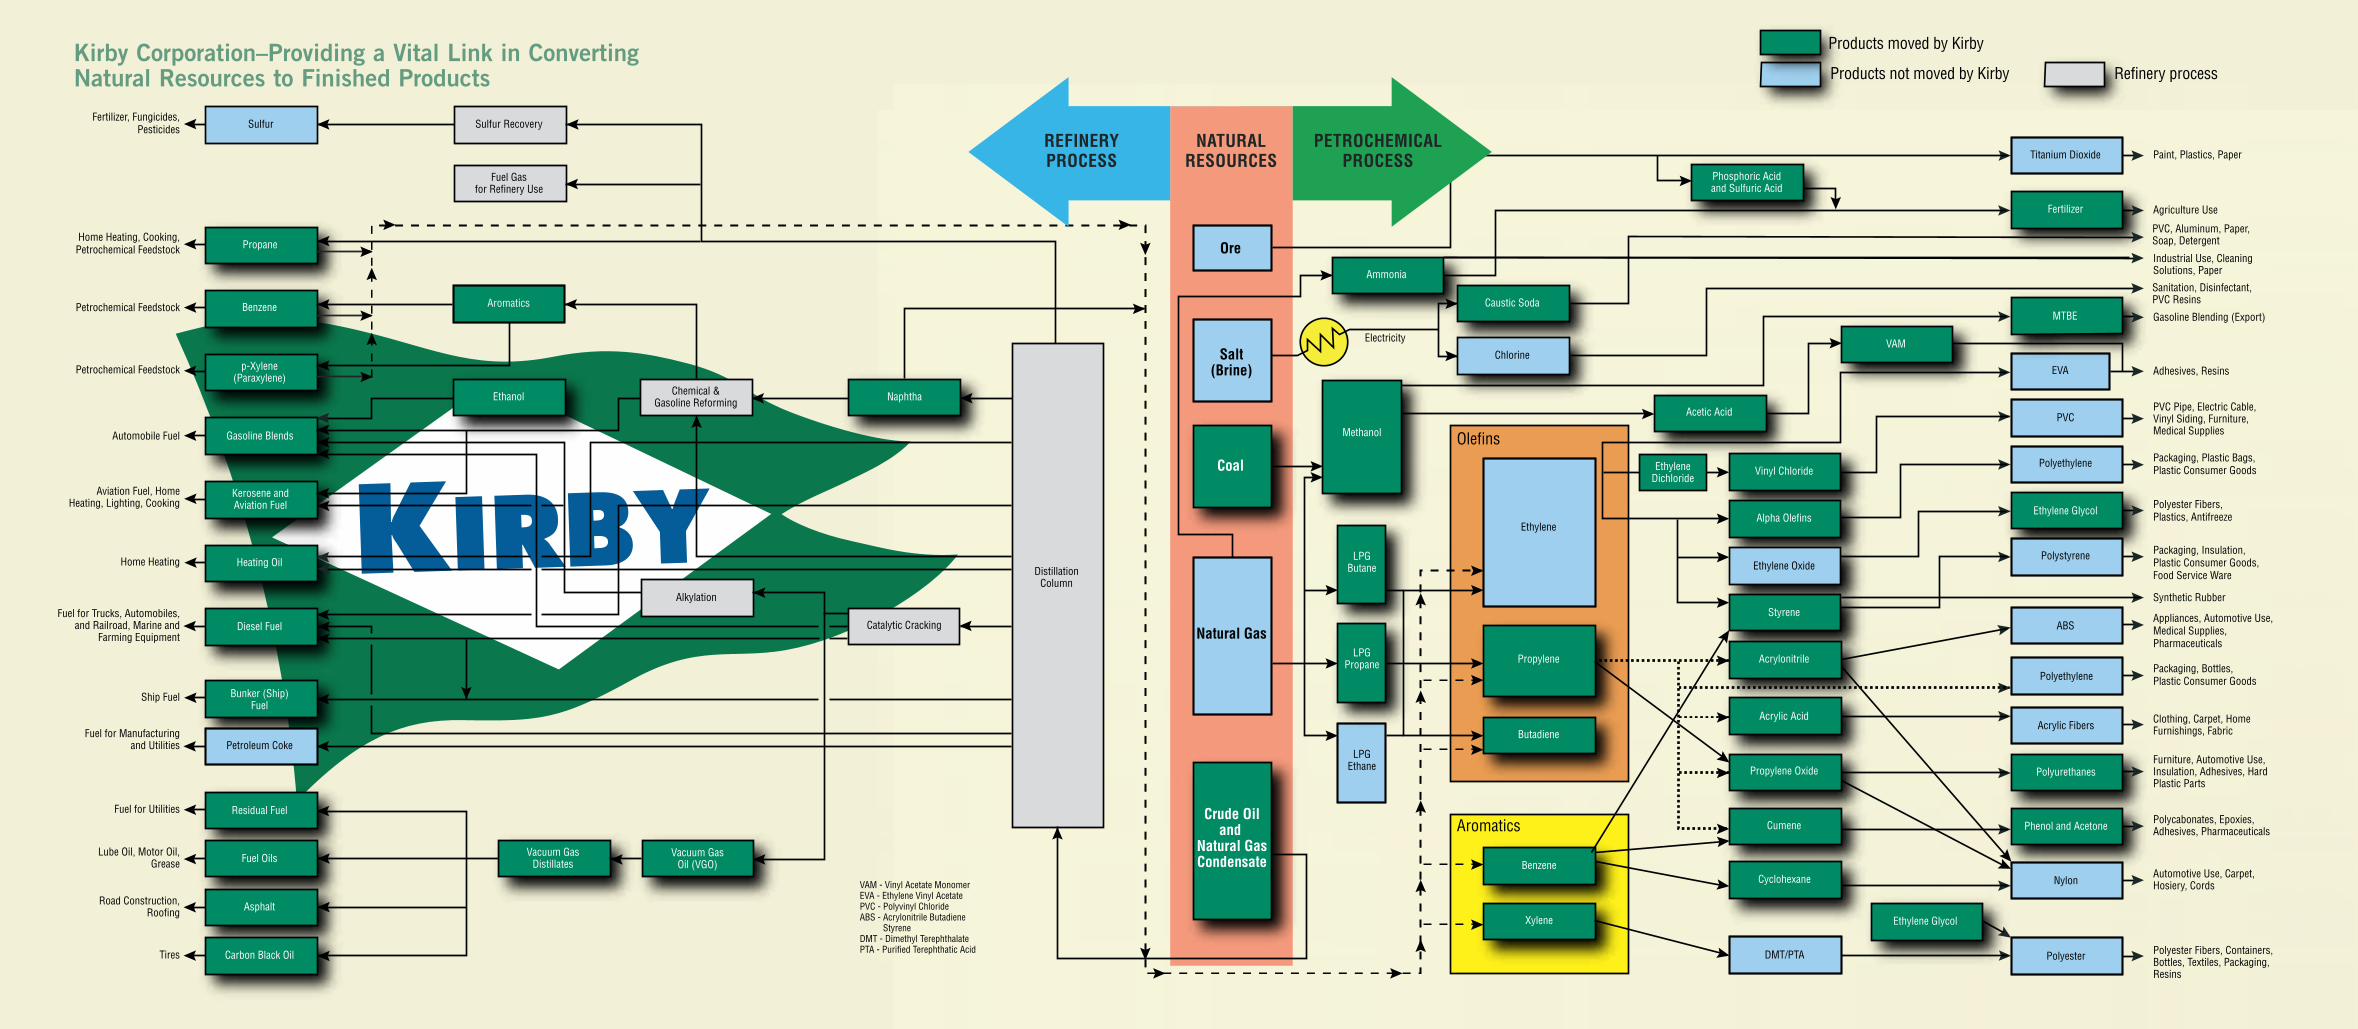
Crude oil and natural gas are the most important natural resources of the industrialized world. Crude oil is the primary source of fuel for vehicles, vessels, machinery and airplanes. It is used to generate heat, pave roads and provide fuel for utilities. Crude oil and natural gas components are used to manufacture almost all petrochemical products, such as plastics, polyester fibers, textiles, paints and even pharmaceuticals.
Petrochemical plants’ primary feedstocks are components of natural gas such as ethane, propane and butane, as well as by-products of the refining process. These feedstocks are then processed through an operation known as cracking, the breaking down of heavy molecules into lighter, more valuable fractions. Once these operations are concluded, the building blocks of the petrochemical industry, olefins and aromatics, are obtained. From
these products, intermediate products such as cumene, styrene, propylene oxide and acrylonitrile are produced, leading to end products such as polyester, nylon, polyurethanes and polystyrene, products used in the manufacture of plastic products, clothing, adhesives, carpets and packaging products, just to name a few.
Refineries produce physical and chemical changes in crude oil and natural gas condensate through a distillation process, the separation of crude oil into lighter groups of hydrocarbons, producing gasoline blends, heating oil, diesel fuel and many other products, as well as feedstock for petrochemical plants.
We provide a vital link in the production of petrochemicals, ensuring transportation of raw material feedstocks into the plants, movement of petrochemical products from one petrochemical plant to another for further processing, and movement of more finished products to manufacturing companies and to waterfront terminals for both domestic and foreign destinations. We transport gasoline blends and additives, diesel fuel and jet fuel from refineries to waterfront terminals for both domestic and foreign destinations. Black oil, including crude oil and natural gas condensate, is transported to refineries and waterfront terminals, residual fuel to utilities and asphalt to waterfront terminals. Agricultural chemicals are transported primarily to waterfront terminals in the Midwest.
Kirby Provides a Vital Link in Converting Natural Resources to Finished Products
Kirby CorporationThis Would be a Subhead Explaining What This Is
6 Kirby 2014 Annual Report
Home Heating, Cooking,Petrochemical Feedstock
Fertilizer, Fungicides,Pesticides
PVC, Aluminum, Paper,Soap, Detergent
Sanitation, Disinfectant,PVC Resins
Industrial Use, CleaningSolutions, Paper
Paint, Plastics, Paper
Agriculture Use
Gasoline Blending (Export)
PVC Pipe, Electric Cable,Vinyl Siding, Furniture,Medical Supplies
Adhesives, Resins
Petrochemical Feedstock
Petrochemical Feedstock
Automobile Fuel
Aviation Fuel, HomeHeating, Lighting, Cooking
Home Heating
Fuel for Trucks, Automobiles,and Railroad, Marine and
Farming Equipment
Fuel for Manufacturingand Utilities
Ship Fuel
Fuel for Utilities
Lube Oil, Motor Oil,Grease
Road Construction,Roofing
DistillationColumn
NaphthaChemical &Gasoline Reforming
Catalytic Cracking
Alkylation
Vacuum GasOil (VGO)
Sulfur Recovery Sulfur
Propane
Benzene
p-Xylene(Paraxylene)
Gasoline Blends
Heating Oil
Diesel Fuel
Bunker (Ship)Fuel
Petroleum Coke
Residual Fuel
Fuel Oils
Asphalt
Tires Carbon Black Oil
Vacuum GasDistillates
Kerosene andAviation Fuel
Fuel Gasfor Refinery Use
Aromatics
Ethanol
Ethylene Glycol
Polyester
Nylon
Phenol and Acetone
Polyurethanes
Acrylic Fibers
Polyethylene
ABS
Polystyrene
Polyethylene
PVC
EVA
MTBE
Fertilizer
Titanium Dioxide
Ethylene Glycol
DMT/PTA
Cyclohexane
Cumene
Propylene Oxide
Acrylic Acid
Acrylonitrile
Styrene
Ethylene Oxide
Alpha Olefins
Vinyl Chloride
Ammonia
Ore
Salt(Brine)
Coal
Natural Gas
Crude Oiland
Natural GasCondensate
Propylene
Caustic Soda
Chlorine
Electricity
Ethylene
Methanol
LPGButane
LPGPropane
LPGEthane
Butadiene
Xylene
Benzene
VAM
Acetic Acid
EthyleneDichloride
Olefins
Aromatics
Packaging, Plastic Bags,Plastic Consumer Goods
Polyester Fibers,Plastics, Antifreeze
Packaging, Insulation,Plastic Consumer Goods,Food Service Ware
Packaging, Bottles,Plastic Consumer Goods
Clothing, Carpet, HomeFurnishings, Fabric
Polycabonates, Epoxies,Adhesives, Pharmaceuticals
Automotive Use, Carpet, Hosiery, Cords
Polyester Fibers, Containers,Bottles, Textiles, Packaging,Resins
Furniture, Automotive Use,Insulation, Adhesives, HardPlastic Parts
Appliances, Automotive Use,Medical Supplies,Pharmaceuticals
Synthetic Rubber
NATURALRESOURCES
Products moved by Kirby
Products not moved by Kirby Refinery process
VAM - Vinyl Acetate MonomerEVA - Ethylene Vinyl AcetatePVC - Polyvinyl ChlorideABS - Acrylonitrile Butadiene StyreneDMT - Dimethyl TerephthalatePTA - Purified Terephthatic Acid
REFINERYPROCESS
PETROCHEMICALPROCESS
Phosphoric Acidand Sulfuric Acid
Kirby Corporation–Providing a Vital Link in Converting Natural Resources to Finished Products
10 Kirby 2014 Annual Report
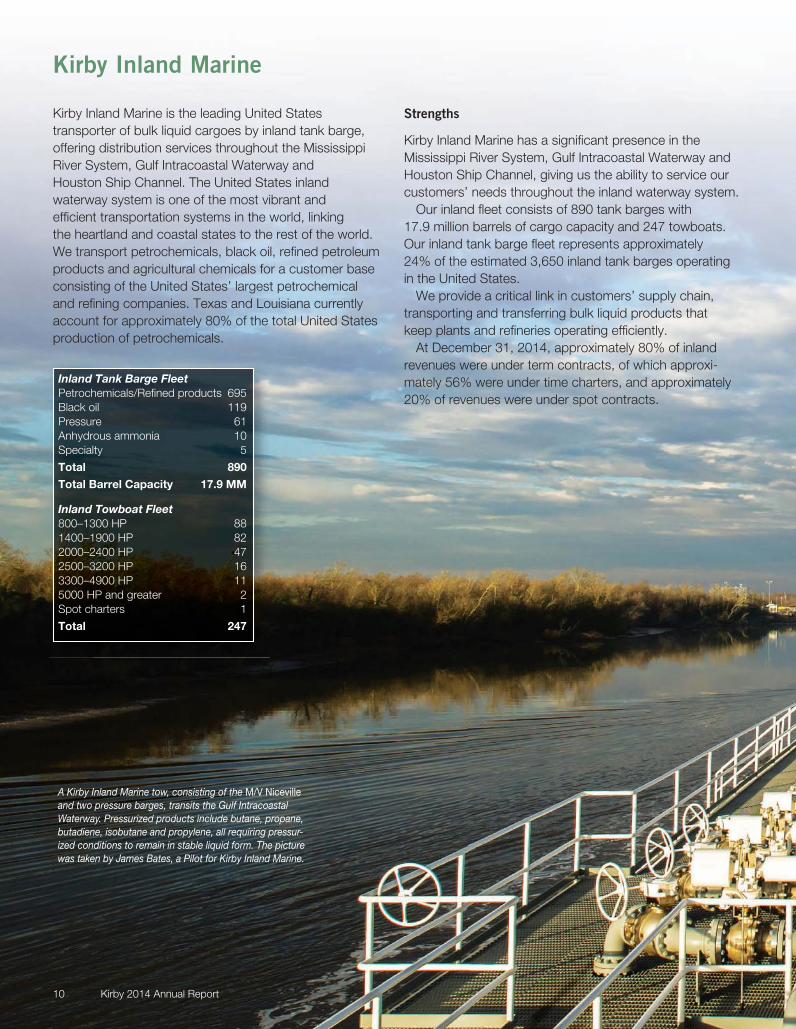
Kirby Inland Marine
Kirby Inland Marine is the leading United States transporter of bulk liquid cargoes by inland tank barge, offering distribution services throughout the Mississippi River System, Gulf Intracoastal Waterway and Houston Ship Channel. The United States inland waterway system is one of the most vibrant and efficient transportation systems in the world, linking the heartland and coastal states to the rest of the world. We transport petrochemicals, black oil, refined petroleum products and agricultural chemicals for a customer base consisting of the United States’ largest petrochemical and refining companies. Texas and Louisiana currently account for approximately 80% of the total United States production of petrochemicals.
Strengths
Kirby Inland Marine has a significant presence in the Mississippi River System, Gulf Intracoastal Waterway and Houston Ship Channel, giving us the ability to service our customers’ needs throughout the inland waterway system.
Our inland fleet consists of 890 tank barges with 17.9 million barrels of cargo capacity and 247 towboats. Our inland tank barge fleet represents approximately 24% of the estimated 3,650 inland tank barges operating in the United States.
We provide a critical link in customers’ supply chain, transporting and transferring bulk liquid products that keep plants and refineries operating efficiently.
At December 31, 2014, approximately 80% of inland revenues were under term contracts, of which approxi-mately 56% were under time charters, and approximately 20% of revenues were under spot contracts.
Inland Tank Barge Fleet
Petrochemicals/Refined products 695Black oil 119Pressure 61Anhydrous ammonia 10Specialty 5
Total 890
Total Barrel Capacity 17.9 MM
Inland Towboat Fleet
800–1300 HP 881400–1900 HP 822000–2400 HP 472500–3200 HP 163300–4900 HP 115000 HP and greater 2Spot charters 1
Total 247
A Kirby Inland Marine tow, consisting of the M/V Niceville and two pressure barges, transits the Gulf Intracoastal Waterway. Pressurized products include butane, propane, butadiene, isobutane and propylene, all requiring pressur-ized conditions to remain in stable liquid form. The picture was taken by James Bates, a Pilot for Kirby Inland Marine.
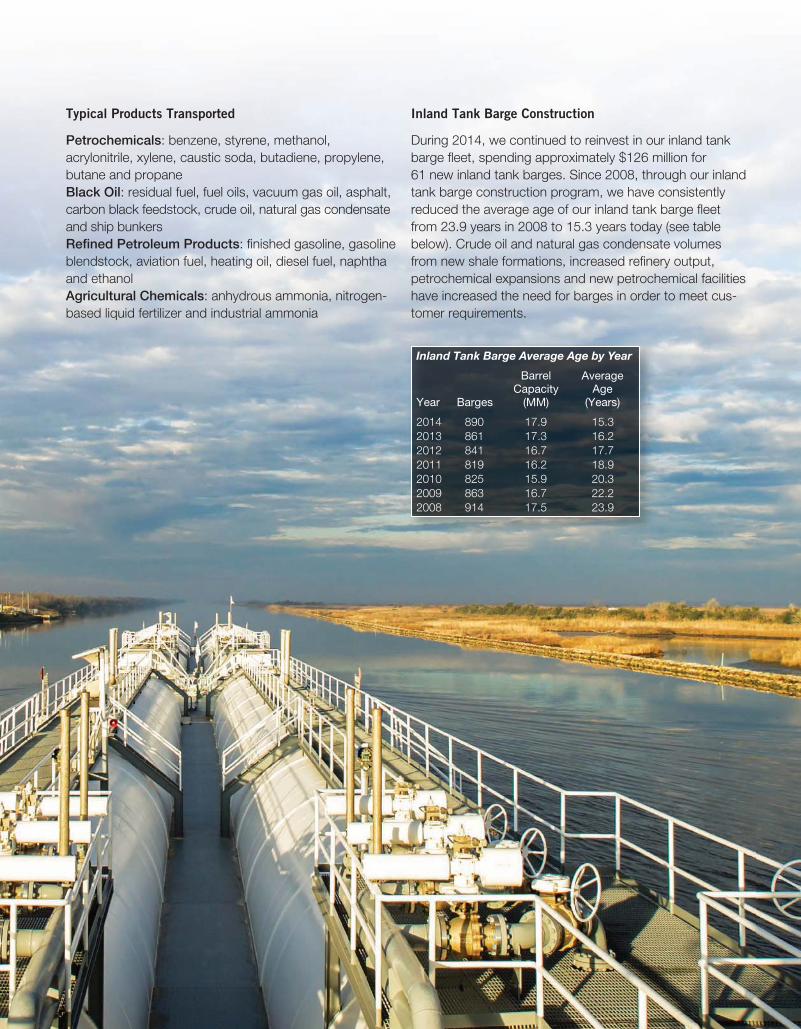
Typical Products Transported
Petrochemicals: benzene, styrene, methanol, acrylonitrile, xylene, caustic soda, butadiene, propylene, butane and propaneBlack Oil: residual fuel, fuel oils, vacuum gas oil, asphalt, carbon black feedstock, crude oil, natural gas condensate and ship bunkersRefined Petroleum Products: finished gasoline, gasoline blendstock, aviation fuel, heating oil, diesel fuel, naphtha and ethanolAgricultural Chemicals: anhydrous ammonia, nitrogen-based liquid fertilizer and industrial ammonia
Inland Tank Barge Construction
During 2014, we continued to reinvest in our inland tank barge fleet, spending approximately $126 million for 61 new inland tank barges. Since 2008, through our inland tank barge construction program, we have consistently reduced the average age of our inland tank barge fleet from 23.9 years in 2008 to 15.3 years today (see table below). Crude oil and natural gas condensate volumes from new shale formations, increased refinery output, petrochemical expansions and new petrochemical facilities have increased the need for barges in order to meet cus-tomer requirements.
Inland Tank Barge Average Age by Year
Barrel Average Capacity AgeYear Barges (MM) (Years)
2014 890 17.9 15.32013 861 17.3 16.22012 841 16.7 17.72011 819 16.2 18.92010 825 15.9 20.32009 863 16.7 22.22008 914 17.5 23.9
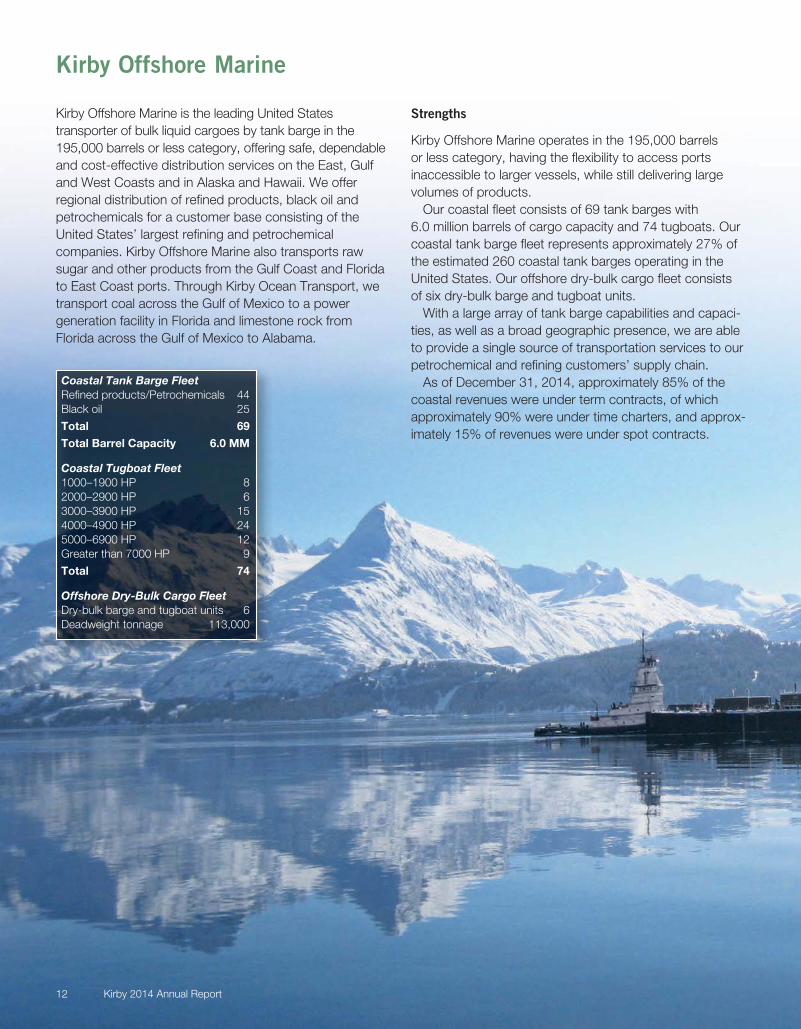
Kirby Offshore Marine is the leading United States transporter of bulk liquid cargoes by tank barge in the 195,000 barrels or less category, offering safe, dependable and cost-effective distribution services on the East, Gulf and West Coasts and in Alaska and Hawaii. We offer regional distribution of refined products, black oil and petrochemicals for a customer base consisting of the United States’ largest refining and petrochemical companies. Kirby Offshore Marine also transports raw sugar and other products from the Gulf Coast and Florida to East Coast ports. Through Kirby Ocean Transport, we transport coal across the Gulf of Mexico to a power generation facility in Florida and limestone rock from Florida across the Gulf of Mexico to Alabama.
Strengths
Kirby Offshore Marine operates in the 195,000 barrels or less category, having the flexibility to access ports inaccessible to larger vessels, while still delivering large volumes of products.
Our coastal fleet consists of 69 tank barges with 6.0 million barrels of cargo capacity and 74 tugboats. Our coastal tank barge fleet represents approximately 27% of the estimated 260 coastal tank barges operating in the United States. Our offshore dry-bulk cargo fleet consists of six dry-bulk barge and tugboat units.
With a large array of tank barge capabilities and capaci-ties, as well as a broad geographic presence, we are able to provide a single source of transportation services to our petrochemical and refining customers’ supply chain.
As of December 31, 2014, approximately 85% of the coastal revenues were under term contracts, of which approximately 90% were under time charters, and approx-imately 15% of revenues were under spot contracts.
12 Kirby 2014 Annual Report
Kirby Offshore Marine
Coastal Tank Barge Fleet
Refined products/Petrochemicals 44Black oil 25
Total 69
Total Barrel Capacity 6.0 MM
Coastal Tugboat Fleet
1000–1900 HP 82000–2900 HP 63000–3900 HP 154000–4900 HP 245000–6900 HP 12Greater than 7000 HP 9
Total 74
Offshore Dry-Bulk Cargo Fleet
Dry-bulk barge and tugboat units 6Deadweight tonnage 113,000
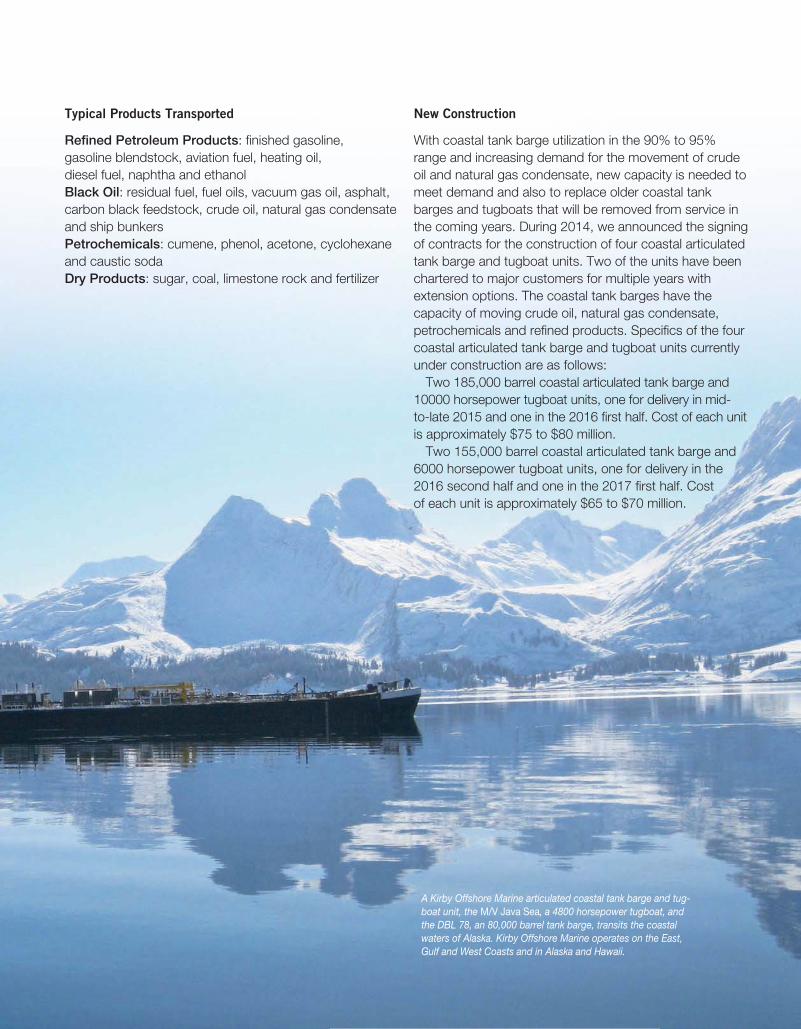
Typical Products Transported
Refined Petroleum Products: finished gasoline, gasoline blendstock, aviation fuel, heating oil, diesel fuel, naphtha and ethanolBlack Oil: residual fuel, fuel oils, vacuum gas oil, asphalt, carbon black feedstock, crude oil, natural gas condensate and ship bunkersPetrochemicals: cumene, phenol, acetone, cyclohexane and caustic sodaDry Products: sugar, coal, limestone rock and fertilizer
New Construction
With coastal tank barge utilization in the 90% to 95% range and increasing demand for the movement of crude oil and natural gas condensate, new capacity is needed to meet demand and also to replace older coastal tank barges and tugboats that will be removed from service in the coming years. During 2014, we announced the signing of contracts for the construction of four coastal articulated tank barge and tugboat units. Two of the units have been chartered to major customers for multiple years with extension options. The coastal tank barges have the capacity of moving crude oil, natural gas condensate, petrochemicals and refined products. Specifics of the four coastal articulated tank barge and tugboat units currently under construction are as follows:
Two 185,000 barrel coastal articulated tank barge and 10000 horsepower tugboat units, one for delivery in mid- to-late 2015 and one in the 2016 first half. Cost of each unit is approximately $75 to $80 million.
Two 155,000 barrel coastal articulated tank barge and 6000 horsepower tugboat units, one for delivery in the 2016 second half and one in the 2017 first half. Cost of each unit is approximately $65 to $70 million.
A Kirby Offshore Marine articulated coastal tank barge and tug-boat unit, the M/V Java Sea, a 4800 horsepower tugboat, and the DBL 78, an 80,000 barrel tank barge, transits the coastal waters of Alaska. Kirby Offshore Marine operates on the East, Gulf and West Coasts and in Alaska and Hawaii.
The marine transportation industry depends on diesel engines for propulsion of its vessels. The power generation industry depends on diesel engines for standby, peak and base load power generation. The oil and gas industry depends on diesel engines to power its oilfield service equipment. We offer our customers a single source for the service and distribution of diesel engines and ancillary products, and the manufacture and remanufacture of oilfield service equipment, including pressure pumping units.
Kirby Engine Systems serves the marine and power generation industries, providing aftermarket service and OEM replacement parts for medium-speed and high-speed diesel engines, and ancillary products including reduction gears, transmissions, starters, governors and marine clutches, as well as the sale of new engines.
United Holdings serves the land-based oil and gas industry, providing aftermarket service, OEM replacement parts and distribution of high-speed diesel engines, transmissions, pumps and compression products, and the manufacture and remanufacture of customized oilfield service equipment. There is approximately 19.5 million horsepower, or 9,000 pressure pumping units, operating in the North America oilfield service industry, and the heavy-duty cycle associated with hydraulic fracturing is creating an annuity for remanufacturing and servicing of pressure pumping units.
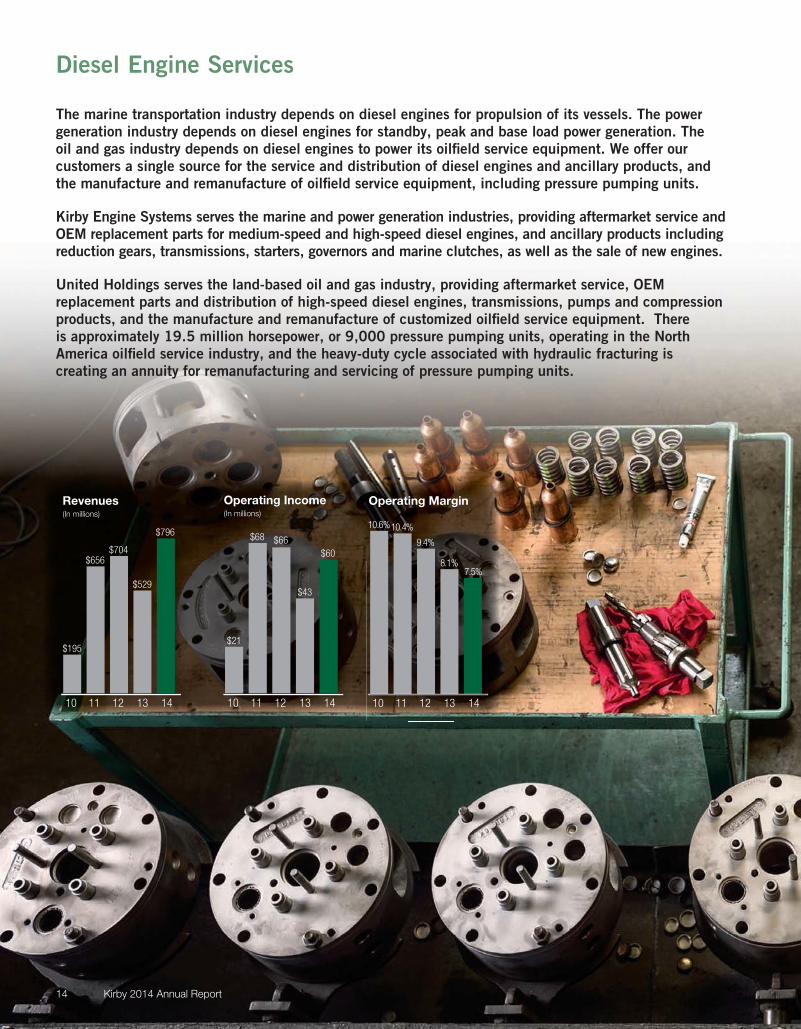
Diesel Engine Services
14 Kirby 2014 Annual Report
Revenues(In millions)
10
$195
11
$656
12
$704
13
$529
14
$796
Operating Income(In millions)
10
$21
11
$68
12
$66
13
$43
14
$60
Operating Margin
10
10.6%
11
10.4%
12
9.4%
13
8.1%
14
7.5%
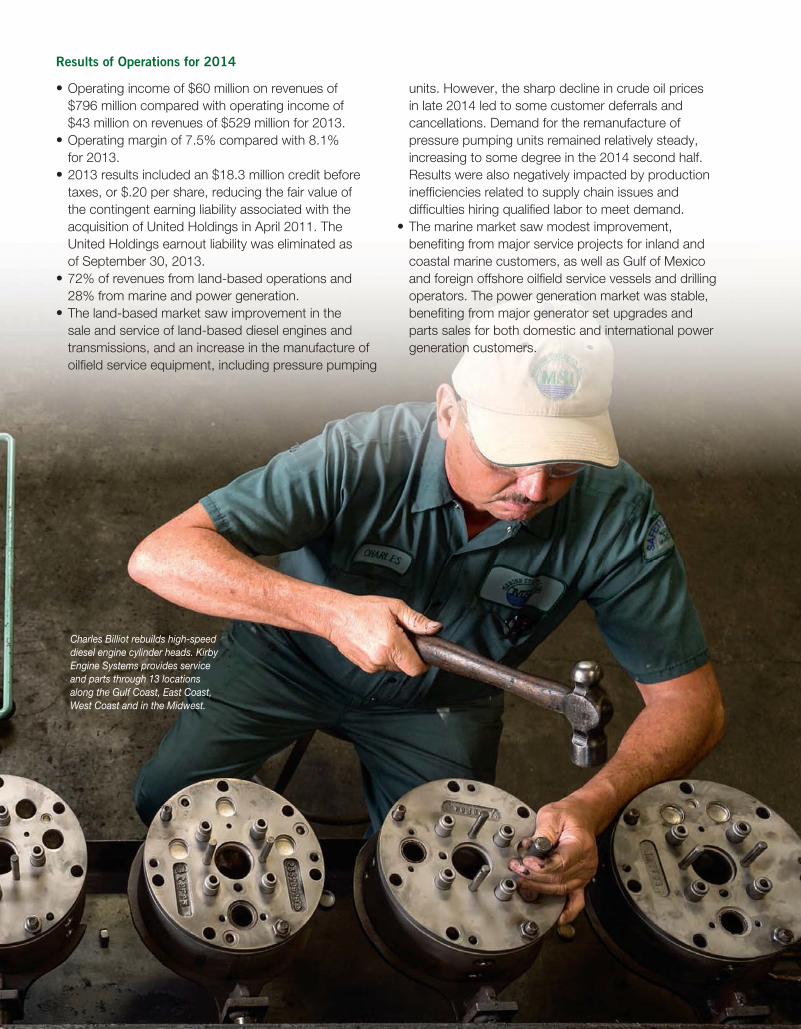
Charles Billiot rebuilds high-speed diesel engine cylinder heads. Kirby Engine Systems provides service and parts through 13 locations along the Gulf Coast, East Coast, West Coast and in the Midwest.
Results of Operations for 2014
• Operating income of $60 million on revenues of $796 million compared with operating income of $43 million on revenues of $529 million for 2013.
• Operating margin of 7.5% compared with 8.1% for 2013.
• 2013 results included an $18.3 million credit before taxes, or $.20 per share, reducing the fair value of the contingent earning liability associated with the acquisition of United Holdings in April 2011. The United Holdings earnout liability was eliminated as of September 30, 2013.
• 72% of revenues from land-based operations and 28% from marine and power generation.
• The land-based market saw improvement in the sale and service of land-based diesel engines and transmissions, and an increase in the manufacture of oilfield service equipment, including pressure pumping
units. However, the sharp decline in crude oil prices in late 2014 led to some customer deferrals and cancellations. Demand for the remanufacture of pressure pumping units remained relatively steady, increasing to some degree in the 2014 second half. Results were also negatively impacted by production inefficiencies related to supply chain issues and difficulties hiring qualified labor to meet demand.
• The marine market saw modest improvement, benefiting from major service projects for inland and coastal marine customers, as well as Gulf of Mexico and foreign offshore oilfield service vessels and drilling operators. The power generation market was stable, benefiting from major generator set upgrades and parts sales for both domestic and international power generation customers.
16 Kirby 2014 Annual Report
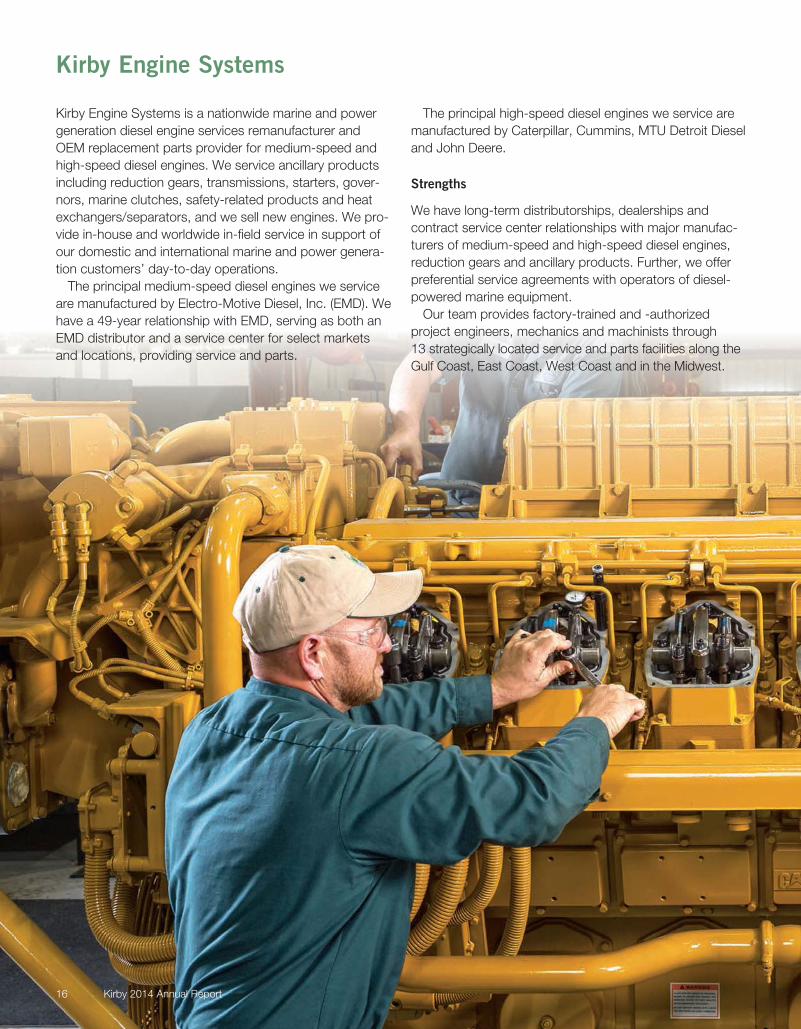
Kirby Engine Systems is a nationwide marine and power generation diesel engine services remanufacturer and OEM replacement parts provider for medium-speed and high-speed diesel engines. We service ancillary products including reduction gears, transmissions, starters, gover-nors, marine clutches, safety-related products and heat exchangers/separators, and we sell new engines. We pro-vide in-house and worldwide in-field service in support of our domestic and international marine and power genera-tion customers’ day-to-day operations.
The principal medium-speed diesel engines we service are manufactured by Electro-Motive Diesel, Inc. (EMD). We have a 49-year relationship with EMD, serving as both an EMD distributor and a service center for select markets and locations, providing service and parts.
The principal high-speed diesel engines we service are manufactured by Caterpillar, Cummins, MTU Detroit Diesel and John Deere.
Strengths
We have long-term distributorships, dealerships and contract service center relationships with major manufac-turers of medium-speed and high-speed diesel engines, reduction gears and ancillary products. Further, we offer preferential service agreements with operators of diesel-powered marine equipment.
Our team provides factory-trained and -authorized project engineers, mechanics and machinists through 13 strategically located service and parts facilities along the Gulf Coast, East Coast, West Coast and in the Midwest.
Kirby Engine Systems
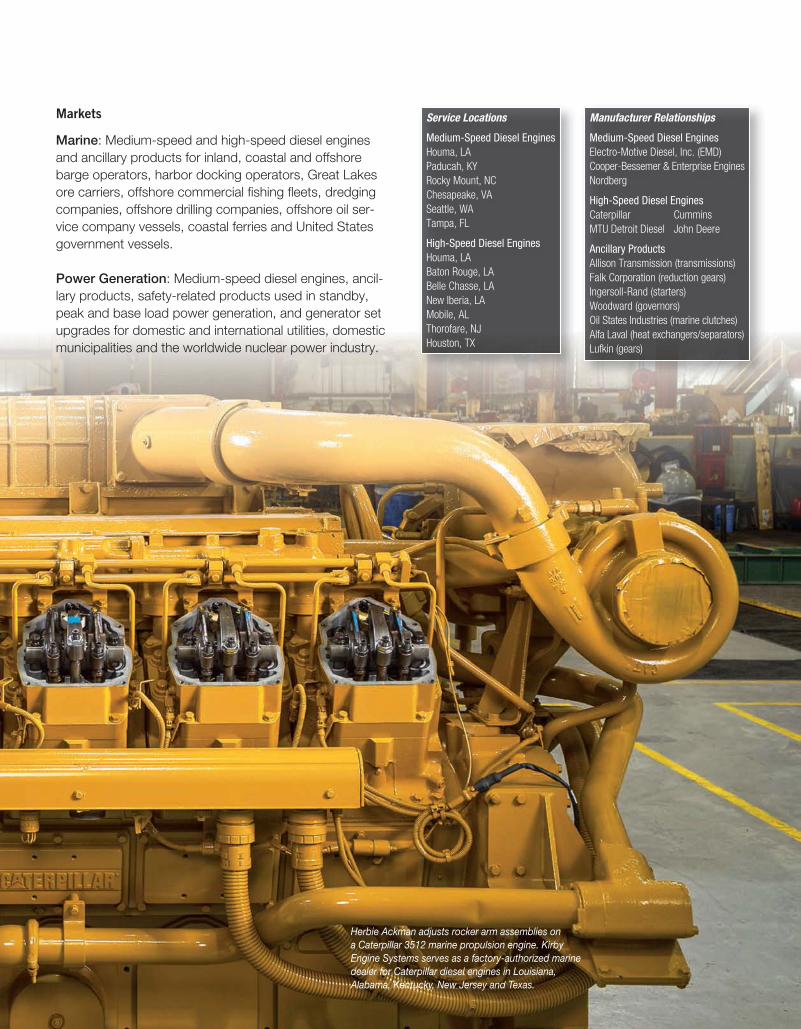
Herbie Ackman adjusts rocker arm assemblies on a Caterpillar 3512 marine propulsion engine. Kirby Engine Systems serves as a factory-authorized marine dealer for Caterpillar diesel engines in Louisiana, Alabama, Kentucky, New Jersey and Texas.
Markets
Marine: Medium-speed and high-speed diesel engines and ancillary products for inland, coastal and offshore barge operators, harbor docking operators, Great Lakes ore carriers, offshore commercial fishing fleets, dredging companies, offshore drilling companies, offshore oil ser-vice company vessels, coastal ferries and United States government vessels.
Power Generation: Medium-speed diesel engines, ancil-lary products, safety-related products used in standby, peak and base load power generation, and generator set upgrades for domestic and international utilities, domestic municipalities and the worldwide nuclear power industry.
Service Locations
Medium-Speed Diesel EnginesHouma, LA
Paducah, KY
Rocky Mount, NC
Chesapeake, VA
Seattle, WA
Tampa, FL
High-Speed Diesel EnginesHouma, LA
Baton Rouge, LA
Belle Chasse, LA
New Iberia, LA
Mobile, AL
Thorofare, NJ
Houston, TX
Manufacturer Relationships
Medium-Speed Diesel EnginesElectro-Motive Diesel, Inc. (EMD)
Cooper-Bessemer & Enterprise Engines
Nordberg
High-Speed Diesel EnginesCaterpillar Cummins
MTU Detroit Diesel John Deere
Ancillary ProductsAllison Transmission (transmissions)
Falk Corporation (reduction gears)
Ingersoll-Rand (starters)
Woodward (governors)
Oil States Industries (marine clutches)
Alfa Laval (heat exchangers/separators)
Lufkin (gears)
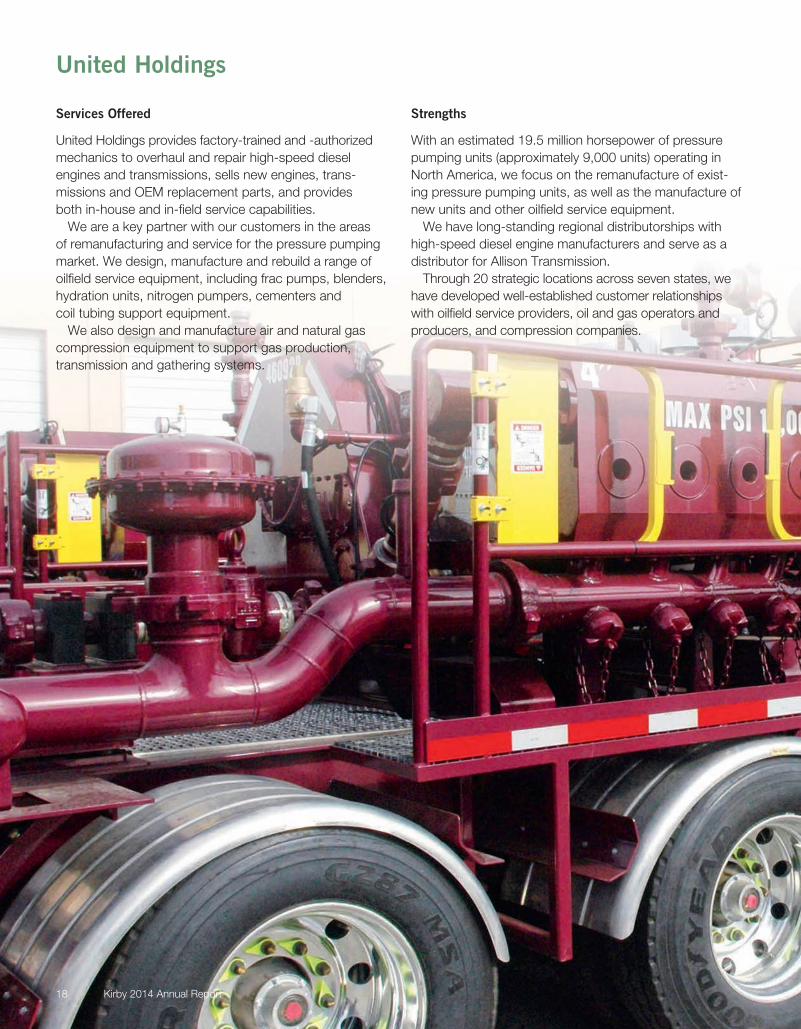
Services Offered
United Holdings provides factory-trained and -authorized mechanics to overhaul and repair high-speed diesel engines and transmissions, sells new engines, trans-missions and OEM replacement parts, and provides both in-house and in-field service capabilities.
We are a key partner with our customers in the areas of remanufacturing and service for the pressure pumping market. We design, manufacture and rebuild a range of oilfield service equipment, including frac pumps, blenders, hydration units, nitrogen pumpers, cementers and coil tubing support equipment.
We also design and manufacture air and natural gas compression equipment to support gas production, transmission and gathering systems.
Strengths
With an estimated 19.5 million horsepower of pressure pumping units (approximately 9,000 units) operating in North America, we focus on the remanufacture of exist-ing pressure pumping units, as well as the manufacture of new units and other oilfield service equipment.
We have long-standing regional distributorships with high-speed diesel engine manufacturers and serve as a distributor for Allison Transmission.
Through 20 strategic locations across seven states, we have developed well-established customer relationships with oilfield service providers, oil and gas operators and producers, and compression companies.
18 Kirby 2014 Annual Report
United Holdings
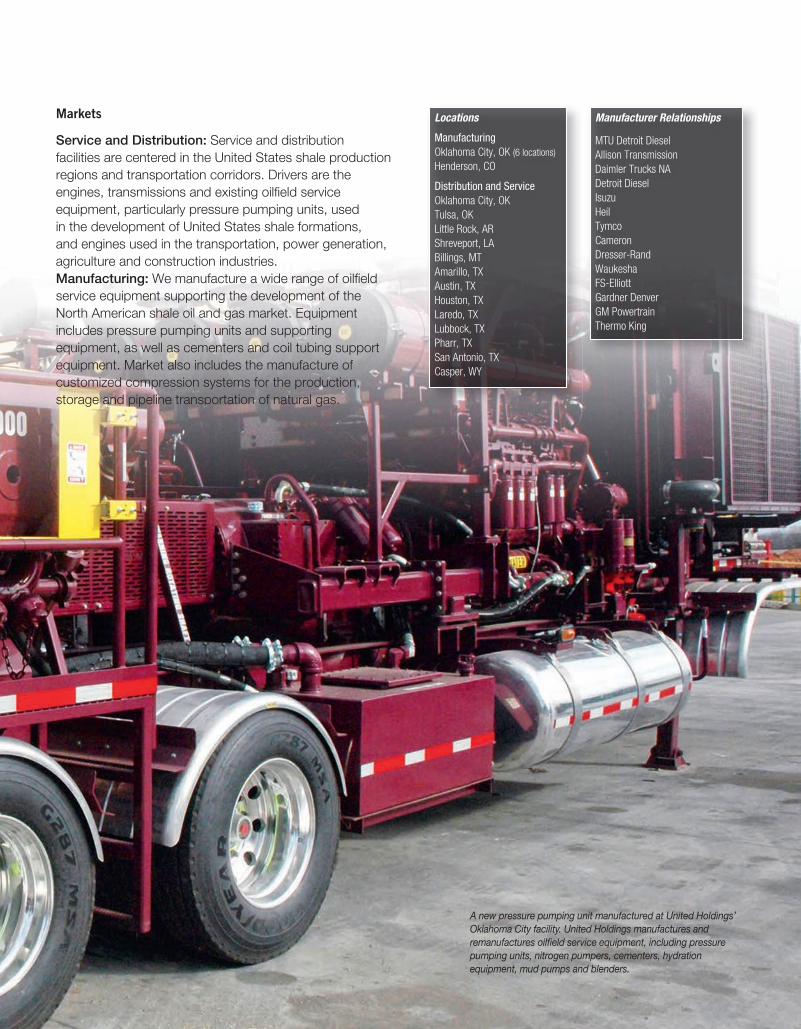
A new pressure pumping unit manufactured at United Holdings’ Oklahoma City facility. United Holdings manufactures and remanufactures oilfield service equipment, including pressure pumping units, nitrogen pumpers, cementers, hydration equipment, mud pumps and blenders.
Markets
Service and Distribution: Service and distribution facilities are centered in the United States shale production regions and transportation corridors. Drivers are the engines, transmissions and existing oilfield service equipment, particularly pressure pumping units, used in the development of United States shale formations, and engines used in the transportation, power generation, agriculture and construction industries.Manufacturing: We manufacture a wide range of oilfield service equipment supporting the development of the North American shale oil and gas market. Equipment includes pressure pumping units and supporting equipment, as well as cementers and coil tubing support equipment. Market also includes the manufacture of customized compression systems for the production, storage and pipeline transportation of natural gas.
Locations
ManufacturingOklahoma City, OK (6 locations)
Henderson, CO
Distribution and ServiceOklahoma City, OK
Tulsa, OK
Little Rock, AR
Shreveport, LA
Billings, MT
Amarillo, TX
Austin, TX
Houston, TX
Laredo, TX
Lubbock, TX
Pharr, TX
San Antonio, TX
Casper, WY
Manufacturer Relationships
MTU Detroit Diesel
Allison Transmission
Daimler Trucks NA
Detroit Diesel
Isuzu
Heil
Tymco
Cameron
Dresser-Rand
Waukesha
FS-Elliott
Gardner Denver
GM Powertrain
Thermo King
20 Kirby 2014 Annual Report
Joseph H. PyneChairman of the Board
David W. GrzebinskiPresident and Chief Executive Officer
C. Andrew SmithExecutive Vice President and Chief Financial Officer
William G. IveyPresident— Marine Transportation Group
Joseph H. ReniersSenior Vice President, Diesel Engine Services and Marine Facility Operations
Ronald A. DraggVice President and Controller
Mark K. ForbesVice President—Human Resources
Amy D. HustedVice President—Legal
David R. MosleyVice President and Chief Information Officer
Renato A. CastroTreasurer
Thomas G. AdlerSecretary
Kirby Inland Marine, LP
William G. IveyPresident
James C. GuidryExecutive Vice President— Vessel Operations
Christian G. O’NeilExecutive Vice President— Commercial Operations
Mel R. JodeitExecutive Vice President— Marketing
John E. RussellSenior Vice President—Sales
John W. Sansing, Jr.Senior Vice President— Maintenance
William M. WithersSenior Vice President—Sales
Stephen C. ButtsVice President—Sales
Patrick C. KellyVice President—Sales
Richard C. NorthcuttVice President—Sales and Horsepower Management
Lester A. ParkerVice President—River Vessel Operations
Cliff R. StanichVice President—Sales
Thomas H. WhiteheadVice President—Sales
Carl R. WhitlatchVice President and Controller
Kirby Offshore Marine, LLC
James F. FarleyPresident
James C. GuidryExecutive Vice President— Vessel Operations
Christian G. O’NeilExecutive Vice President— Commercial Operations
John W. Sansing, Jr.Senior Vice President— Maintenance
William M. WithersSenior Vice President—Sales
Charles R. Ferrer, Jr.Vice President—Sales
John T. HallmarkVice President—Sales
William L. OppenheimerVice President—Maintenance
C. Linn PetersonVice President—Vessel Operations
Carl R. WhitlatchVice President and Controller
Kirby Ocean Transport Company
Joseph H. PynePresident
William M. WithersVice President
Osprey Line, L.L.C.
John T. HallmarkPresident
Charles J. DuetVice President
Kirby Engine Systems, Inc.
Dorman Lynn StrahanPresident
Mia C. CradeurVice President and Controller
John A. MannoVice President—Business Development
Engine Systems, Inc.
John A. MannoVice President
P. Scott ManganVice President—East Coast
Marine Systems, Inc.
Lynn A. AhlemeyerVice President—Gulf Coast and West Coast
Thomas W. BottomsVice President—Midwest
Troy A. BourgeoisVice President—Sales
United Holdings LLC
Michael W. CoulterPresident
Derek C. CoffieVice President—Finance and Controller
Ronnie E. StoverVice President—Sales
Kirk K. Waite Chief Accounting Officer
United Engines
David L. TonneVice President—Aftermarket
UE Manufacturing
Christopher J. RinehartVice President—Engineered Products
Gregory L. CulpVice President
UE Compression
G. Keith KernVice President
Thermo King of Houston
Jason K. RobisonVice President
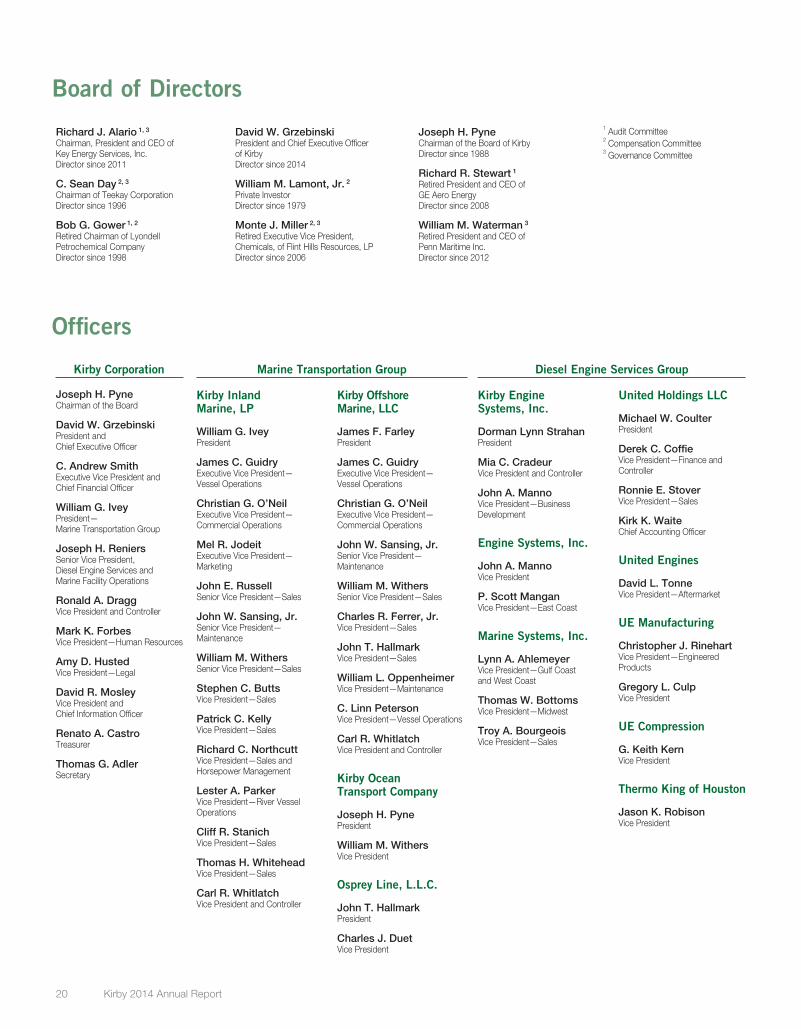
Richard J. Alario 1, 3
Chairman, President and CEO of Key Energy Services, Inc. Director since 2011
C. Sean Day 2, 3
Chairman of Teekay CorporationDirector since 1996
Bob G. Gower 1, 2
Retired Chairman of Lyondell Petrochemical CompanyDirector since 1998
David W. GrzebinskiPresident and Chief Executive Officer of KirbyDirector since 2014
William M. Lamont, Jr. 2Private InvestorDirector since 1979
Monte J. Miller 2, 3
Retired Executive Vice President, Chemicals, of Flint Hills Resources, LPDirector since 2006
Joseph H. Pyne
Chairman of the Board of KirbyDirector since 1988
Richard R. Stewart 1
Retired President and CEO of GE Aero EnergyDirector since 2008
William M. Waterman 3
Retired President and CEO of Penn Maritime Inc.Director since 2012
1 Audit Committee2 Compensation Committee3 Governance Committee
Officers
Board of Directors
Kirby Corporation Marine Transportation Group Diesel Engine Services Group
Annual Meeting
The 2015 Annual Meeting of Stockholders will be held at Kirby’s Houston office, 55 Waugh Drive, 9th Floor, Houston, Texas 77007, at 10:00 a.m. (CDT), Tuesday, April 28, 2015.
Corporate Headquarters
Executive Office: 55 Waugh Drive, Suite 1000 Houston, Texas 77007 Telephone: (713) 435-1000 Fax: (713) 435-1010 Web site: www.kirbycorp.com
Mailing Address: P.O. Box 1745 Houston, Texas 77251-1745
Inquiries Regarding Stock Holdings
Registered shareholders (shares held in owner’s name) should address communica-tions concerning address changes, lost certificates and stock transfers to:
Computershare Trust Company, N.A. P.O. Box 43078 Providence, Rhode Island 02940-3078 Telephone: (781) 575-2879 Web site: www.computershare.com
Beneficial shareholders (shares held in the name of banks or brokers) should address communications to their banks or stockbrokers.
All other inquiries should be addressed to Mary E. Tucker, Assistant Controller, at Kirby’s corporate headquarters.
Web Site
For more investor information, as well as information about Kirby, visit Kirby’s web site at www.kirbycorp.com.
Independent Registered Accountants
KPMG LLP BG Group Place811 Main Street, Suite 4500 Houston, Texas 77002
Common Stock Information
Stock trading symbol—KEXThe New York Stock Exchange is the principal market for Kirby’s common stock. As of March 9, 2015, there were 55,703,000 common shares outstanding held by approximately 800 registered shareholders. The number of registered shareholders does not reflect the number of beneficial owners of common stock.
Common Stock Market Price
Sales Price High Low2015 First Quarter $ 82.91 $ 70.89(through March 9, 2015)
2014First Quarter $106.93 $ 92.86 Second Quarter $117.18 $ 96.00 Third Quarter $124.12 $114.11 Fourth Quarter $117.78 $ 78.84
2013First Quarter $ 78.04 $ 61.41 Second Quarter $ 82.84 $ 71.44 Third Quarter $ 89.19 $ 79.15 Fourth Quarter $ 99.41 $ 82.16
Financial and Investor Relations
Copies of Kirby’s Form 10-K (which is incorporated in this annual report) are available free of charge. Either contact Mary E. Tucker, Assistant Controller, at Kirby’s corporate headquarters, e-mail [email protected], or visit Kirby’s web site at www.kirbycorp.com.
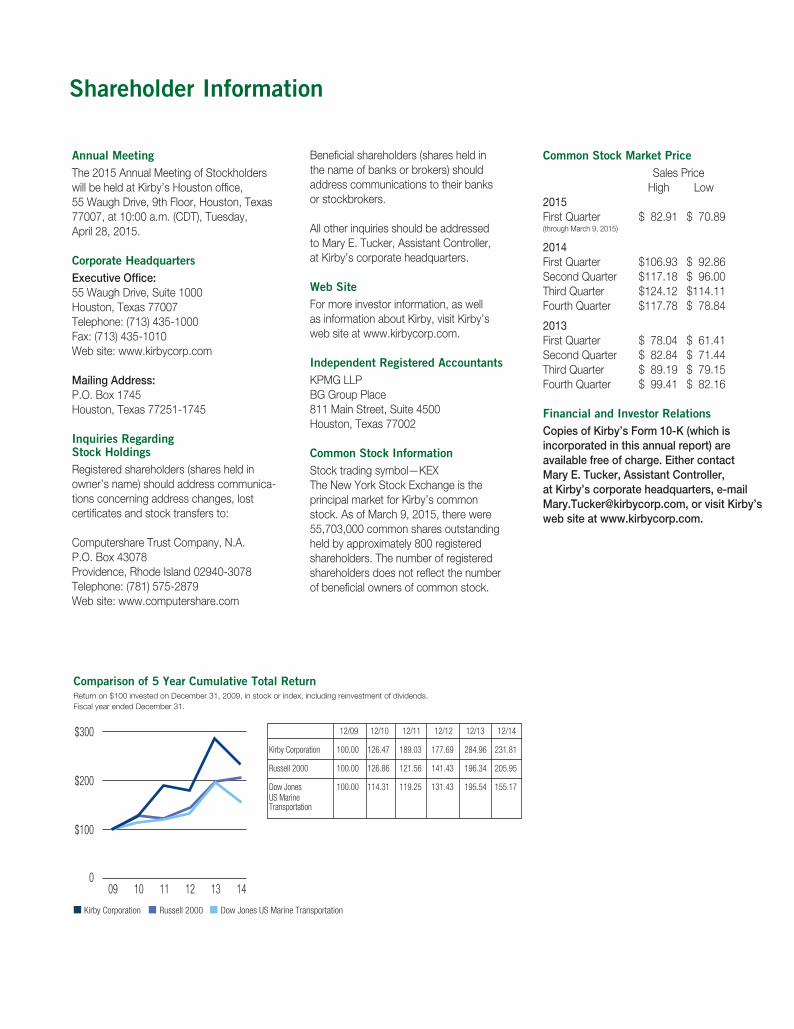
Comparison of 5 Year Cumulative Total ReturnReturn on $100 invested on December 31, 2009, in stock or index, including reinvestment of dividends.Fiscal year ended December 31.
Kirby Corporation Russell 2000 Dow Jones US Marine Transportation
12/09 12/10 12/11 12/12 12/13 12/14
Kirby Corporation 100.00 126.47 189.03 177.69 284.96 231.81
Russell 2000 100.00 126.86 121.56 141.43 196.34 205.95
Dow Jones 100.00 114.31 119.25 131.43 195.54 155.17US MarineTransportation
09 10 12 13 14110
$100
$200
$300
Shareholder Information
Kirby Corporation
Corporate Headquarters: 55 Waugh Drive, Suite 1000, Houston, Texas 77007
Mailing Address: P. O. Box 1745, Houston, Texas 77251-1745
Telephone: (713) 435-1000 Fax: (713) 435-1010
Web Site: www.kirbycorp.com