Kings - Cornell University · Kings. County Profile. 2017. A collection of recent demographic,...
31
Kings County Profile 2017 A collection of recent demographic, social and economic data Compiled by Jan Vink Cornell Program on Applied Demographics
Transcript of Kings - Cornell University · Kings. County Profile. 2017. A collection of recent demographic,...

Kings County Profile
2017
A collection of recent demographic, social and economic data
Compiled by
Jan Vink
Cornell Program on Applied Demographics

Kings County Profile
Page 1 of 30
This profile is a part of a set of profiles generated for each county in New York State. The profiles were developed and generated by the Cornell Program on Applied Demographics. The work is sponsored by the New York State Data Center in the New York State Department of Labor.
Cornell Program on Applied Demographics:
The Program on Applied Demographics (PAD) brings skills in demographics, economics, statistics, data gathering and data analysis together to provide a variety of organizations with data, information and advice. PAD is located in the Department of Policy Analysis and Management within the College of Human Ecology at Cornell University. PAD is also affiliated with the Cornell Institute for Social and Economic Research and the Cornell Population Center.
For more information: http://pad.human.cornell.edu/
New York State Data Center:
The New York State Data Center (NYSDC) is located in the Division of Research and Statistics within the New York State Department of Labor. The State Data Center operates as part of a nationwide effort to improve public access to data provided by the U.S. Census Bureau. The U.S. Census Bureau collects and tabulates data on a multitude of subjects such as population, social, economic and housing demographics, labor force data, health care, migration and transportation. These data play a critical role in understanding our local and larger surrounding communities. Census data also influence state and federal funding, aid decision making in the legislative process, and determine each state's number of congressional seats. As the lead agency in New York for the SDC program, the New York State Data Center helps users navigate through the multitude of surveys and products provided by the U.S. Census Bureau.
For more information: https://labor.ny.gov/nys-data-center/
All profiles are freely downloadable as PDF documents on the PAD website:
http://pad.human.cornell.edu/profiles/index.cfm
This profile is an update from the County Profile produced in 2013. The 2013 profile also contained information on agriculture related items and can be found at https://pad.human.cornell.edu/profiles/2013/Kings.pdf

Kings County Profile
Page 2 of 30
Contents 1 Reference Maps (towns and places as defined in 2010) .....................................................................................3 2 Population density and Urban Areas Map ...........................................................................................................5 3 Total Population ...................................................................................................................................................6
3.1 Historic and projected .................................................................................................................................6 3.2 Change since previous Census .....................................................................................................................6 3.3 Annual population estimates .......................................................................................................................7 3.4 New York City population change 2010-2016 .............................................................................................8 3.5 New York City population change 2010-2016 .............................................................................................8
4 Components of population change .....................................................................................................................9 4.1 Vital Statistics ...............................................................................................................................................9 4.2 Migration .................................................................................................................................................. 10
5 Population by age ............................................................................................................................................. 11 5.1 Historic and projected population pyramids ............................................................................................ 11 5.2 Selected age groups .................................................................................................................................. 12 5.3 Median age ............................................................................................................................................... 13
6 Race ................................................................................................................................................................... 14 6.1 Total and household population by race .................................................................................................. 14 6.2 Race composition by age .......................................................................................................................... 14
7 Housing units .................................................................................................................................................... 15 7.1 Characteristics .......................................................................................................................................... 15 7.2 Historical data on number of housing units and occupancy status .......................................................... 16 7.3 Building Permits 2000-2015 ...................................................................................................................... 16
8 Education .......................................................................................................................................................... 17 8.1 Enrollment by level of school ................................................................................................................... 17 8.2 Enrollment by age ..................................................................................................................................... 17 8.3 Percentage age 18-24 enrolled in college ................................................................................................ 17 8.4 Educational attainment ............................................................................................................................ 18
9 Language spoken at home ................................................................................................................................ 18 10 Labor Force Characteristics ............................................................................................................................... 19
10.1 Labor force, employment and unemployment ........................................................................................ 19 10.2 Annual unemployment rate ...................................................................................................................... 20 10.3 Employment and number of jobs ............................................................................................................. 20 10.4 Class of worker .......................................................................................................................................... 21
11 Household Income ............................................................................................................................................ 22 11.1 Income Distribution .................................................................................................................................. 22 11.2 Median household income: Trends over time.......................................................................................... 23
12 Poverty .............................................................................................................................................................. 23 12.1 Family Income to Poverty Ratio ................................................................................................................ 23 12.2 Poverty: Trends over time: Count ............................................................................................................. 24 12.3 Poverty: Trends over time: Rate ............................................................................................................... 24 12.4 Poverty characteristics.............................................................................................................................. 25
13 Glossary ............................................................................................................................................................. 26 14 References ........................................................................................................................................................ 29

Kings County Profile
Page 3 of 30
1 Reference Maps (towns and places as defined in 2010)

Kings County Profile
Page 4 of 30
Kings County Profile
Page 5 of 30
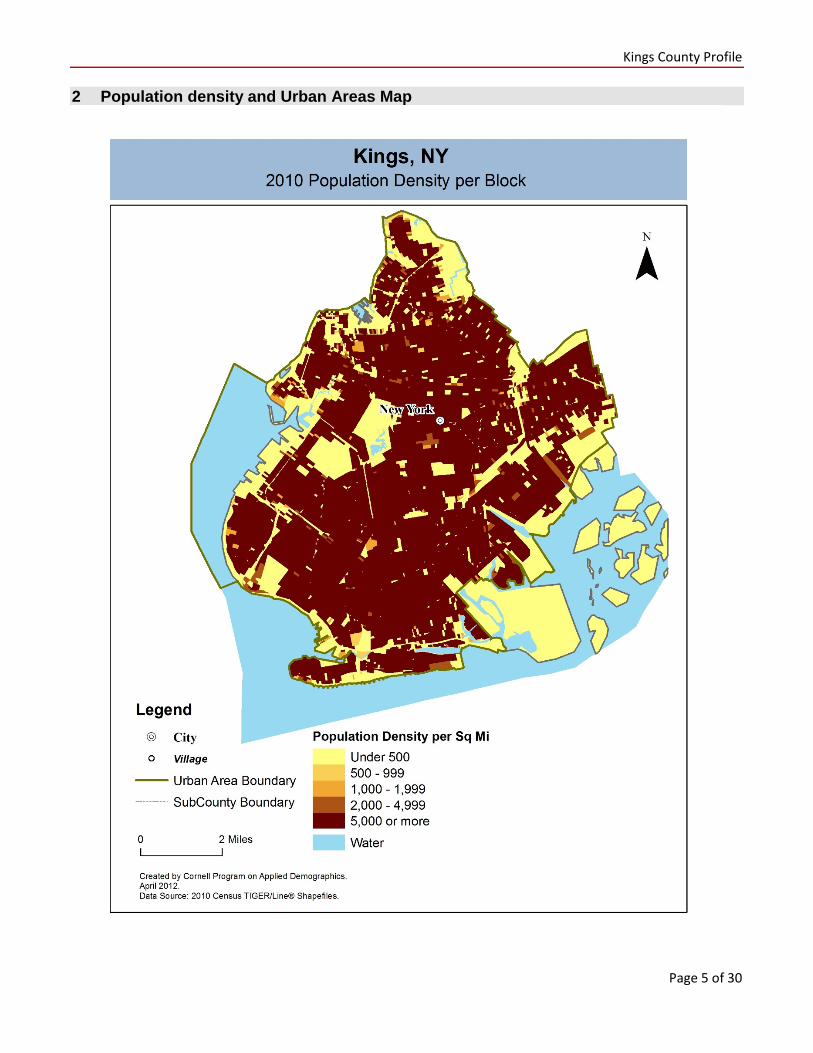
2 Population density and Urban Areas Map

Kings County Profile
Page 6 of 30
3 Total Population 3.1 Historic and projected
Source: 1940-2010 Decennial Census and projections by Cornell Program on Applied Demographics
3.2 Change since previous Census
Total
population Change
Number Percent
Dece
nnia
l Cen
sus
1940 2,698,285 1950 2,738,175 39,890 1.5% 1960 2,627,319 -110,856 -4.0% 1970 2,603,413 -23,906 -0.9% 1980 2,230,936 -372,477 -14.3% 1990 2,300,664 69,728 3.1% 2000 2,465,326 164,662 7.2% 2010 2,504,700 39,374 1.6%
PAD
proj
ec-
tions
2020 2,567,047 62,347 2.5%
2030 2,592,364 25,317 1.0%
2040 2,599,940 7,576 0.3% Source: 1940-2010 Decennial Census and projections by Cornell Program on Applied Demographics
2,69
8,28
5
2,73
8,17
5
2,62
7,31
9
2,60
3,41
3
2,23
0,93
6
2,30
0,66
4
2,46
5,32
6
2,50
4,70
0
2,56
7,04
7
2,59
2,36
4
2,59
9,94
0
1940 1950 1960 1970 1980 1990 2000 2010 2020 2030 2040
Total population, Kings County, 1940-2040
Decennial Census PAD projections

Kings County Profile
Page 7 of 30
3.3 Annual population estimates
Source: U.S. Census Bureau population estimates (1990-1999 and 2000-2009 intercensal and vintage 2016 postcensal)
Min1990
2,303,679
Max2016
2,629,150
1990 1995 2000 2005 2010 2015
Annual population estimatesKings County, 1990-2016

Kings County Profile
Page 8 of 30
3.4 New York City population change 2010-2016
Total Population Difference
2000 2010
Count % New York State 18,976,457 * 19,378,102 401,645 2.1% New York City 8,008,278 * 8,175,133 166,855 2.1% Counties (Boroughs) Bronx 1,332,650 1,385,108 52,458 3.9% Kings (Brooklyn) 2,465,525 * 2,504,700 39,175 1.6% New York (Manhattan) 1,537,372 * 1,585,873 48,501 3.2% Queens 2,229,379 2,230,722 1,343 0.1% Richmond (Staten Island) 443,728 468,730 25,002 5.6%
* Original counts revised through Count Question Resolution Program (CQR) Source: U.S. Census Bureau intercensal population estimates 2000-2010
3.5 New York City population change 2010-2016
Total Population Difference
2010 base 2016
Count % New York State 19,378,087 19,795,791 417,704 2.2% New York City 8,174,962 8,537,673 362,711 4.4% Counties (Boroughs) Bronx 1,385,107 1,455,720 70,613 5.1% Kings (Brooklyn) 2,504,706 2,629,150 124,444 5.0% New York (Manhattan) 1,585,874 1,643,734 57,860 3.6% Queens 2,230,545 2,333,054 102,509 4.6% Richmond (Staten Island) 468,730 476,015 7,285 1.6%
Source: U.S. Census Bureau population estimates 2010-2015

Kings County Profile
Page 9 of 30
4 Components of population change 4.1 Vital Statistics
Source: New York State Department of Health
05,000
10,00015,00020,00025,00030,00035,00040,00045,000
2000 2005 2010 2015
Vital Statistics, Kings County
Births Deaths
0
5,000
10,000
15,000
20,000
25,000
30,000Natural increase

Kings County Profile
Page 10 of 30
4.2 Migration
Source: Census Bureau population estimates (V2010 and V2016)
-80,000
-60,000
-40,000
-20,000
0
20,000
40,000
2000 2005 2010 2015
Domestic and international migration, Kings County
Net Domestic Migration Net International Migration

Kings County Profile
Page 11 of 30
5 Population by age 5.1 Historic and projected population pyramids
Source: 1950, 1980, 2010 Decennial Census and projections by Cornell Program on Applied Demographics
150,000 100,000 50,000 0 50,000 100,000 150,000
0-45-9
10-1415-1920-2425-2930-3435-3940-4445-4950-5455-5960-6465-6970-74
75+
1950 Population Pyramid, Kings County
Male Female
150,000 100,000 50,000 0 50,000 100,000 150,000
0-45-9
10-1415-1920-2425-2930-3435-3940-4445-4950-5455-5960-6465-6970-74
75+
1980 Population Pyramid, Kings County
Male Female
150,000 100,000 50,000 0 50,000 100,000 150,000
0-45-9
10-1415-1920-2425-2930-3435-3940-4445-4950-5455-5960-6465-6970-7475-7980-84
85+
2010 Population Pyramid, Kings County
Male Female
150,000 100,000 50,000 0 50,000 100,000 150,000
0-45-9
10-1415-1920-2425-2930-3435-3940-4445-4950-5455-5960-6465-6970-7475-7980-84
85+
2040 Population Pyramid, Kings County
Male Female

Kings County Profile
Page 12 of 30
5.2 Selected age groups
Source: 1940-2010 Decennial Census and projections by Cornell Program on Applied Demographics
Source: 1940-2010 Decennial Census and projections by Cornell Program on Applied Demographics
405,
553
367,
390
422,
331
461,
189
337,
979
330,
432
372,
543
315,
954
352,
217
354,
752
347,
580
15.0%13.4%
16.1%17.7%
15.1% 14.4% 15.1%
12.6%13.7% 13.7% 13.4%
1940 1950 1960 1970 1980 1990 2000 2010 2020 2030 2040
Population age 5-14, Kings County, 1940-2040
Decennial Census PAD projections Share of total population
1,48
7,45
6
1,53
3,98
4
1,35
2,00
0
1,20
0,48
2
1,05
1,81
9
1,16
2,15
6
1,26
7,02
8
1,35
7,43
4
1,35
5,13
1
1,33
2,94
3
1,31
8,74
1
55.1% 56.0%51.5%
46.1% 47.1%50.5% 51.4%
54.2% 52.8% 51.4% 50.7%
1940 1950 1960 1970 1980 1990 2000 2010 2020 2030 2040
Population age 25-64, Kings County, 1940-2040
Decennial Census PAD projections Share of total population

Kings County Profile
Page 13 of 30
Source: 1940-2010 Decennial Census and projections by Cornell Program on Applied Demographics
5.3 Median age
Kings County New York State Median age 2000 33.1 35.9 2010 34.1 38.0 2015 34.7 38.3
Source: 2000, 2010 Decennial Census, 2015 Population Estimates
145,
054
202,
838
259,
158
287,
151
279,
544
285,
057
282,
658
287,
633
336,
144
376,
198
378,
317
5.4%
7.4%
9.9%11.0%
12.5% 12.4%11.5% 11.5%
13.1%14.5% 14.6%
1940 1950 1960 1970 1980 1990 2000 2010 2020 2030 2040
Population age 65 and over, Kings County, 1940-2040
Decennial Census PAD projections Share of total population

Kings County Profile
Page 14 of 30
6 Race 6.1 Total and household population by race
Total In households In Group Quarters
Count Percentage Count Percentage Count
Total population 2,504,700 100% 2,469,091 100% 35,609
Not Hispanic or Latino
One race
White 893,306 35.7% 881,687 35.7% 11,619
Black or African American 799,066 31.9% 784,937 31.8% 14,129
American Indian and Alaska Native 4,638 0.2% 4,543 0.2% 95
Asian 260,129 10.4% 258,394 10.5% 1,735
Native Hawaiian and Other Pacific Islander 633 0.0% 618 0.0% 15
Some other race 10,633 0.4% 10,543 0.4% 90
Two or more races 40,010 1.6% 39,430 1.6% 580
Hispanic or Latino (of any race) 496,285 19.8% 488,939 19.8% 7,346 Source: 2010 Decennial Census
6.2 Race composition by age
Source: 2010 Decennial Census
0%10%20%30%40%50%60%70%80%90%
100%
0 10 20 30 40 50 60 70 80 90 100
Shar
e of
tot
al p
opul
atio
n
Age
Race composition by age, Kings County
White alone, not Hispanic or Latino
Black or African American alone, not Hispanic or Latino
American Indian and Alaska Native alone, not Hispanic or Latino
Asian alone, not Hispanic or Latino
Hispanic or Latino (of any race)

Kings County Profile
Page 15 of 30
7 Housing units 7.1 Characteristics
COUNT PERCENTAGE
HOUSING OCCUPANCY Estimate Margin of error Estimate Margin
of error Total housing units 1,017,282 ± 660 100.0%
Occupied housing units 931,786 ± 2,496 91.6% ± 0.2
Vacant housing units 85,496 ± 2,318 8.4% ± 0.2
YEAR STRUCTURE BUILT Total housing units 1,017,282 ± 660 100.0%
Built 2014 or later 296 ± 102 0.0% ± 0.1
Built 2010 to 2013 9,558 ± 556 0.9% ± 0.1
Built 2000 to 2009 59,429 ± 1,326 5.8% ± 0.1
Built 1990 to 1999 27,798 ± 1,092 2.7% ± 0.1
Built 1980 to 1989 29,991 ± 1,089 2.9% ± 0.1
Built 1970 to 1979 53,606 ± 1,358 5.3% ± 0.1
Built 1960 to 1969 113,216 ± 1,885 11.1% ± 0.2
Built 1950 to 1959 110,462 ± 1,752 10.9% ± 0.2
Built 1940 to 1949 90,948 ± 1,735 8.9% ± 0.2
Built 1939 or earlier 521,978 ± 2,698 51.3% ± 0.3
HOUSING TENURE Occupied housing units 931,786 ± 2,496 100.0%
Owner-occupied 272,717 ± 2,374 29.3% ± 0.2
Renter-occupied 659,069 ± 2,885 70.7% ± 0.2
HOUSE HEATING FUEL Occupied housing units 931,786 ± 2,496 100.0%
Utility gas 706,797 ± 3,265 75.9% ± 0.3
Bottled, tank, or LP gas 16,439 ± 788 1.8% ± 0.1
Electricity 61,954 ± 1,490 6.6% ± 0.2
Fuel oil, kerosene, etc. 123,594 ± 1,951 13.3% ± 0.2
Coal or coke 346 ± 105 0.0% ± 0.1
Wood 520 ± 145 0.1% ± 0.1
Solar energy 327 ± 101 0.0% ± 0.1
Other fuel 9,016 ± 552 1.0% ± 0.1
No fuel used 12,793 ± 743 1.4% ± 0.1
VALUE Owner-occupied units 272,717 ± 2,374 100.0%
Less than $50,000 7,106 ± 466 2.6% ± 0.2
$50,000 to $99,999 4,970 ± 354 1.8% ± 0.1
$100,000 to $149,999 4,942 ± 402 1.8% ± 0.1
$150,000 to $199,999 6,347 ± 386 2.3% ± 0.1
$200,000 to $299,999 19,132 ± 756 7.0% ± 0.3
$300,000 to $499,999 70,970 ± 1,640 26.0% ± 0.5
$500,000 to $999,999 121,619 ± 1,604 44.6% ± 0.5
$1,000,000 or more 37,631 ± 1,140 13.8% ± 0.4
Median (dollars) 570,200 ± 4,219
Source: 2011-2015 American Community Survey

Kings County Profile
Page 16 of 30
7.2 Historical data on number of housing units and occupancy status
Year Number of
Housing Units
Change since
previous Census
Occupied Occupancy rate Vacant
1970 902,622 876,119 97.1% 26,503 1980 881,367 -2.4% 828,257 94.0% 53,110 1990 873,671 -0.9% 828,199 94.8% 45,472 2000 930,866 6.5% 880,727 94.6% 50,139 2010 1,000,293 7.5% 916,856 91.7% 83,437
Source: 1970-2010 Decennial Census
7.3 Building Permits 2000-2015
Source: Census Bureau Building Permits Survey
0
2,000
4,000
6,000
8,000
10,000
2000 2005 2010 2015
Building permits by number of permitted units in building, Kings County
Units in 1 unit buildings Units in 2 unit buildings
Units in 3-4 unit buildings Units in buildings with 5 or more units
Total permitted units

Kings County Profile
Page 17 of 30
8 Education 8.1 Enrollment by level of school
Estimate Margin of error
Total enrolled in school 670,238 ± 3,124 Nursery school, preschool 47,076 ± 1,156 Kindergarten to 12th grade 425,832 ± 1,526 Kindergarten 39,491 ± 1,257 Elementary: grade 1 to grade 4 130,536 ± 1,831 Elementary: grade 5 to grade 8 122,940 ± 1,711 High school: grade 9 to grade 12 132,865 ± 1,422 College, undergraduate 153,997 ± 2,631 Graduate, professional school 43,333 ± 1,248
Source: 2011-2015 American Community Survey
8.2 Enrollment by age
Estimate Margin of error
3 and 4 years 64.4% ± 1.3 5 to 9 years 96.9% ± 0.3 10 to 14 years 97.7% ± 0.3 15 to 17 years 96.6% ± 0.4 18 and 19 years 75.2% ± 1.1 20 to 24 years 42.5% ± 0.8 25 to 34 years 12.8% ± 0.4 35 years and over 2.6% ± 0.1
Source: 2011-2015 American Community Survey
8.3 Percentage age 18-24 enrolled in college
Estimate Margin of error
Population 18 to 24 years 251,964 ± 86 Enrolled in college or graduate school 42.6% ± 0.8
Males 18 to 24 years 124,237 ± 86 Enrolled in college or graduate school 40.5% ± 1.0
Females 18 to 24 years 127,727 ± ***** Enrolled in college or graduate school 44.6% ± 1.0
Source: 2011-2015 American Community Survey

Kings County Profile
Page 18 of 30
8.4 Educational attainment
COUNT PERCENTAGE
Estimate Margin of error Estimate Margin
of error Population 25 years and over 1,735,647 ± 87 100% EDUCATIONAL ATTAINMENT
Less than 9th grade 178,723 ± 2,850 10.3% ± 0.2 9th to 12th grade, no diploma 180,433 ± 2,508 10.4% ± 0.1 High school graduate (includes equivalency) 455,076 ± 3,827 26.2% ± 0.2 Some college, no degree 244,089 ± 2,881 14.1% ± 0.2 Associate's degree 107,313 ± 2,478 6.2% ± 0.1 Bachelor's degree 348,413 ± 3,548 20.1% ± 0.2 Graduate or professional degree 221,600 ± 3,089 12.8% ± 0.2
Percent high school graduate or higher 79.3% ± 0.2 Percent bachelor's degree or higher 32.8% ± 0.2
Source: 2011-2015 American Community Survey
9 Language spoken at home
COUNT PERCENTAGE SPEAK ENGLISH LESS THAN "VERY WELL"
Estimate Margin of error
Estimate Margin of error
Estimate Margin of error
Population 5 years and over 2,401,850 ± ***** 100% LANGUAGE SPOKEN AT HOME English only 1,283,679 ± 5,549 53.4% ± 0.2 Language other than English 1,118,171 ± 5,550 46.6% ± 0.2 565,781 ± 4,518
Spanish 399,247 ± 2,855 16.6% ± 0.1 180,283 ± 3,082 Other Indo-European languages 440,054 ± 5,128 18.3% ± 0.2 218,058 ± 3,532 Asian and Pacific Islander languages 205,649 ± 2,850 8.6% ± 0.1 140,341 ± 2,424 Other languages 73,221 ± 3,011 3.0% ± 0.1 27,099 ± 1,763
Source: 2011-2015 American Community Survey

Kings County Profile
Page 19 of 30
10 Labor Force Characteristics 10.1 Labor force, employment and unemployment
TOTAL IN LABOR FORCE EMPLOYED UNEMPLOYMENT
RATE
Estimate Margin
of error
Estimate Margin
of error
Estimate Margin
of error
Estimate Margin
of error
Population 16 years and over 2,051,603 ± 925 63.3% ± 0.2 56.9% ± 0.2 10.0% ± 0.2 AGE
16 to 19 years 122,486 ± 931 19.3% ± 0.8 11.7% ± 0.5 39.4% ± 2.0
20 to 24 years 193,470 ± 118 63.0% ± 0.7 50.7% ± 0.8 19.4% ± 0.8
25 to 29 years 239,599 ± 86 80.8% ± 0.6 72.3% ± 0.6 10.4% ± 0.4
30 to 34 years 221,790 ± ***** 83.8% ± 0.5 76.9% ± 0.6 8.2% ± 0.4
35 to 44 years 358,326 ± ***** 82.6% ± 0.4 76.1% ± 0.5 7.9% ± 0.3
45 to 54 years 323,000 ± ***** 77.9% ± 0.5 71.2% ± 0.6 8.6% ± 0.4
55 to 59 years 149,914 ± 1,668 70.8% ± 0.8 65.3% ± 0.8 7.8% ± 0.5
60 to 64 years 133,755 ± 1,653 55.8% ± 0.8 51.7% ± 0.8 7.3% ± 0.6
65 to 74 years 170,664 ± 96 22.9% ± 0.7 21.4% ± 0.7 6.6% ± 0.7
75 years and over 138,599 ± 99 3.9% ± 0.3 3.6% ± 0.3 6.4% ± 1.8
RACE AND HISPANIC OR LATINO ORIGIN
White alone 896,741 ± 3,562 64.1% ± 0.3 59.3% ± 0.3 7.5% ± 0.2
Black or African American alone 693,559 ± 2,389 62.1% ± 0.4 53.6% ± 0.4 13.8% ± 0.4
American Indian and Alaska Native alone 6,703 ± 785 59.7% ± 4.6 51.1% ± 5.3 14.3% ± 4.7
Asian alone 241,108 ± 1,017 63.4% ± 0.5 58.1% ± 0.5 8.2% ± 0.5
Two or more races 39,420 ± 1,737 68.5% ± 1.5 60.8% ± 1.6 11.1% ± 1.4
Hispanic or Latino origin (of any race) 386,499 ± 457 62.1% ± 0.5 54.8% ± 0.5 11.6% ± 0.4
White alone, not Hispanic or Latino 741,725 ± 709 64.7% ± 0.3 60.4% ± 0.3 6.6% ± 0.3
SEX Population 20 to 64 years 1,619,854 ± 134 75.9% ± 0.2 68.6% ± 0.3 9.6% ± 0.2
Male 765,296 ± 106 80.7% ± 0.2 72.6% ± 0.3 10.0% ± 0.2
Female 854,558 ± 59 71.6% ± 0.4 65.1% ± 0.4 9.1% ± 0.3
With own children under 18 years 281,471 ± 3,120 69.3% ± 0.5 62.6% ± 0.5 9.7% ± 0.4
EDUCATIONAL ATTAINMENT Population 25 to 64 years 1,426,384 ± 130 77.7% ± 0.2 71.0% ± 0.3 8.5% ± 0.2
Less than high school graduate 252,123 ± 3,167 63.2% ± 0.7 55.3% ± 0.7 12.5% ± 0.6
High school graduate (includes equivalency) 358,853 ± 3,456 71.8% ± 0.5 64.1% ± 0.6 10.6% ± 0.4
Some college or associate's degree 307,269 ± 3,590 78.3% ± 0.5 70.8% ± 0.5 9.5% ± 0.4
Bachelor's degree or higher 508,139 ± 3,851 88.6% ± 0.3 83.9% ± 0.3 5.3% ± 0.2
Table formula: LABOR FORCE = # EMPLOYED + # UNEMPLOYED % IN LABOR FORCE = LABOR FORCE / TOTAL * 100% % EMPLOYED = # EMPLOYED / TOTAL * 100% UNEMPLOYMENT RATE = # UNEMPLOYED / LABOR FORCE * 100% Source: 2011-2015 American Community Survey
Kings County Profile
Page 20 of 30
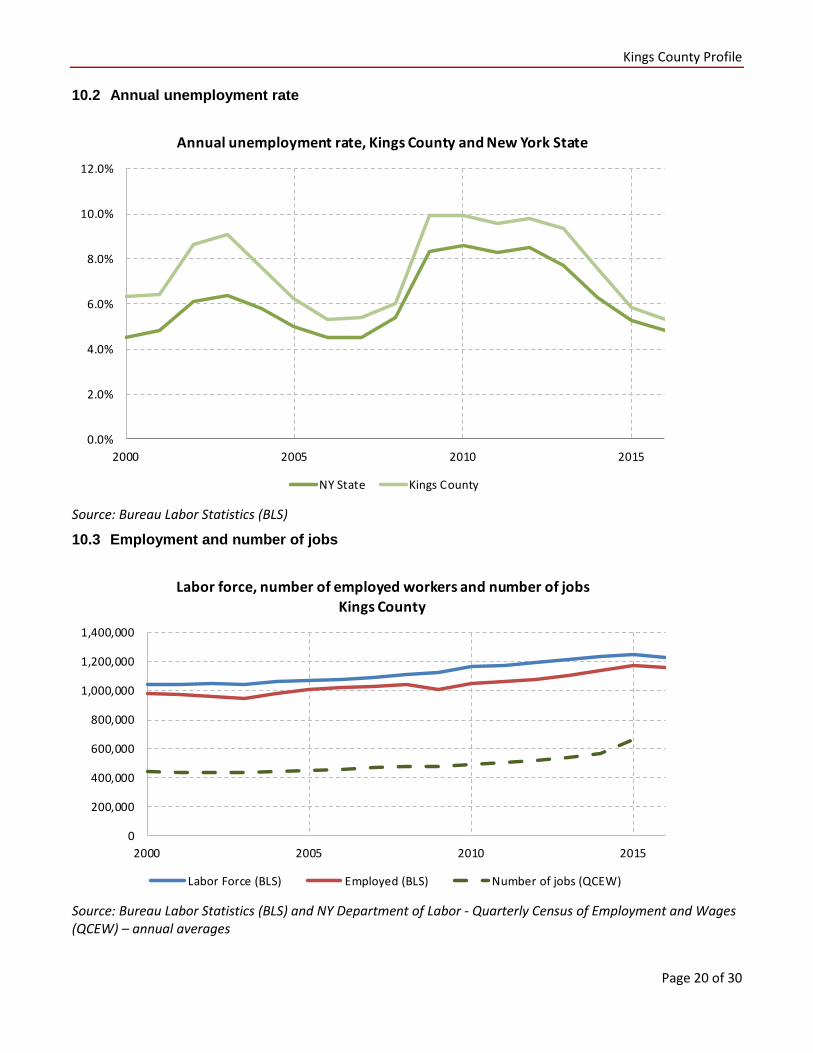
10.2 Annual unemployment rate
Source: Bureau Labor Statistics (BLS)
10.3 Employment and number of jobs
Source: Bureau Labor Statistics (BLS) and NY Department of Labor - Quarterly Census of Employment and Wages (QCEW) – annual averages
0.0%
2.0%
4.0%
6.0%
8.0%
10.0%
12.0%
2000 2005 2010 2015
Annual unemployment rate, Kings County and New York State
NY State Kings County
0
200,000
400,000
600,000
800,000
1,000,000
1,200,000
1,400,000
2000 2005 2010 2015
Labor force, number of employed workers and number of jobsKings County
Labor Force (BLS) Employed (BLS) Number of jobs (QCEW)
Kings County Profile
Page 21 of 30
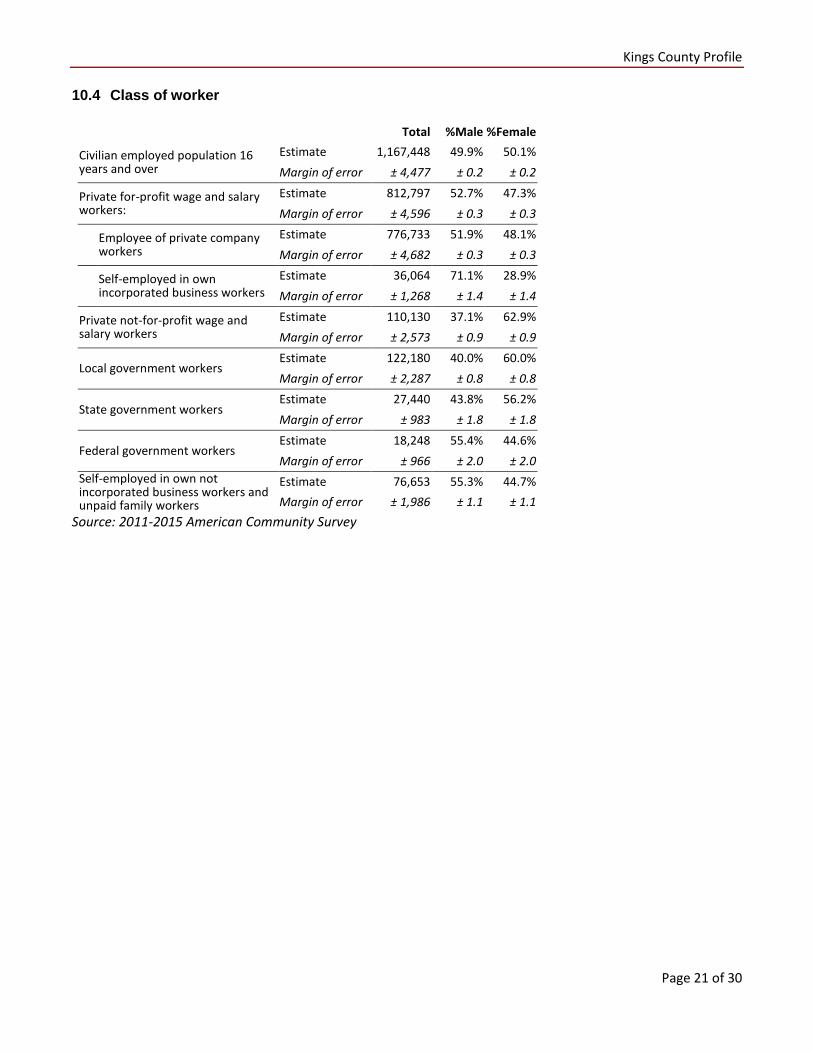
10.4 Class of worker
Total %Male %Female
Civilian employed population 16 years and over
Estimate 1,167,448 49.9% 50.1% Margin of error ± 4,477 ± 0.2 ± 0.2
Private for-profit wage and salary workers:
Estimate 812,797 52.7% 47.3% Margin of error ± 4,596 ± 0.3 ± 0.3
Employee of private company workers
Estimate 776,733 51.9% 48.1%
Margin of error ± 4,682 ± 0.3 ± 0.3
Self-employed in own incorporated business workers
Estimate 36,064 71.1% 28.9%
Margin of error ± 1,268 ± 1.4 ± 1.4
Private not-for-profit wage and salary workers
Estimate 110,130 37.1% 62.9% Margin of error ± 2,573 ± 0.9 ± 0.9
Local government workers Estimate 122,180 40.0% 60.0% Margin of error ± 2,287 ± 0.8 ± 0.8
State government workers Estimate 27,440 43.8% 56.2% Margin of error ± 983 ± 1.8 ± 1.8
Federal government workers Estimate 18,248 55.4% 44.6% Margin of error ± 966 ± 2.0 ± 2.0
Self-employed in own not incorporated business workers and unpaid family workers
Estimate 76,653 55.3% 44.7% Margin of error ± 1,986 ± 1.1 ± 1.1
Source: 2011-2015 American Community Survey

Kings County Profile
Page 22 of 30
11 Household Income 11.1 Income Distribution
Estimate
Margin of error
Interval width (in
$1,000)
Est. per $1,000 section
Total: 931,786 ± 2,496
Less than $10,000 105,997 ± 2,160 10 10,599.7
$10,000 to $14,999 63,160 ± 1,396 5 12,632.0
$15,000 to $19,999 55,172 ± 1,369 5 11,034.4
$20,000 to $24,999 50,018 ± 1,228 5 10,003.6
$25,000 to $29,999 45,052 ± 1,391 5 9,010.4
$30,000 to $34,999 44,464 ± 1,392 5 8,892.8
$35,000 to $39,999 40,748 ± 1,262 5 8,149.6
$40,000 to $44,999 39,804 ± 1,361 5 7,960.8
$45,000 to $49,999 32,156 ± 1,200 5 6,431.2
$50,000 to $59,999 63,549 ± 1,419 10 6,354.9
$60,000 to $74,999 84,581 ± 1,744 15 5,638.7
$75,000 to $99,999 99,552 ± 1,868 25 3,982.1
$100,000 to $124,999 67,623 ± 1,360 25 2,704.9
$125,000 to $149,999 42,701 ± 1,265 25 1,708.0
$150,000 to $199,999 46,922 ± 1,350 50 938.4
$200,000 or more 50,287 ± 1,347 - -
Source: 2011-2015 American Community Survey
Source: 2011-2015 American Community Survey
0.0%
0.2%
0.4%
0.6%
0.8%
1.0%
1.2%
1.4%
1.6%
0 50 100 150 200
% p
er $
1,00
0 se
ctio
n
Household Income (in Thousands)
Income distribution, Kings County
NY State Kings County
Kings County Profile
Page 23 of 30
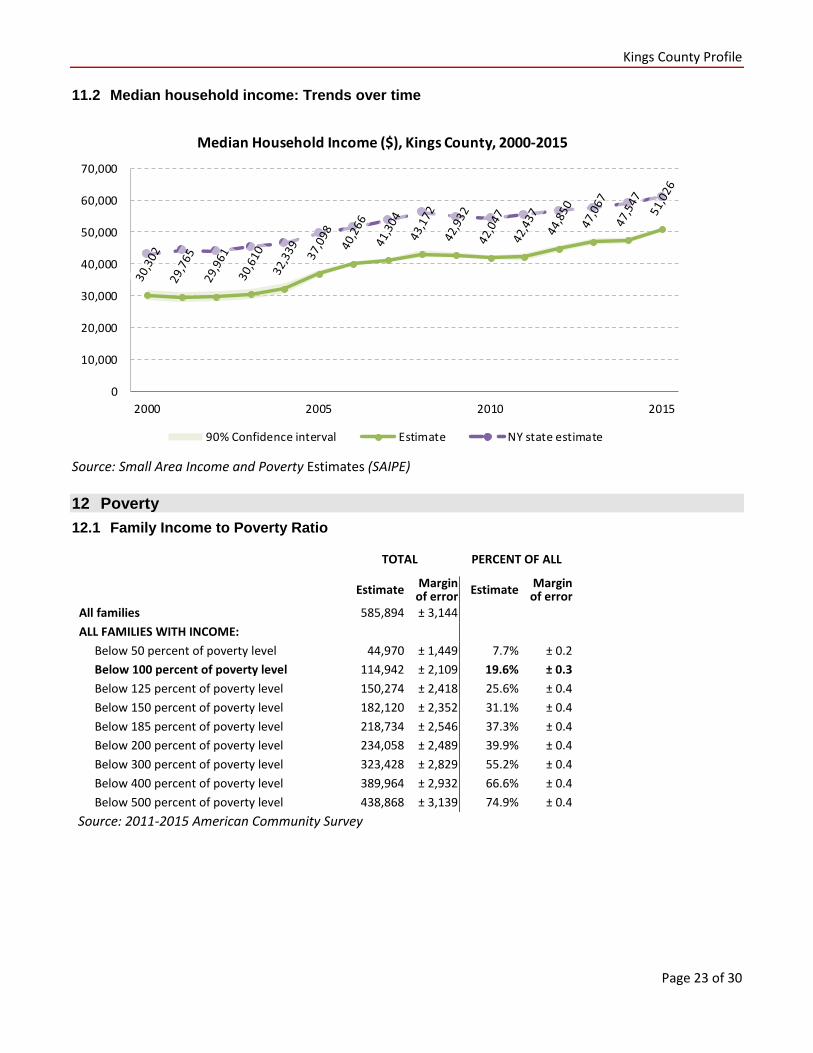
11.2 Median household income: Trends over time
Source: Small Area Income and Poverty Estimates (SAIPE)
12 Poverty 12.1 Family Income to Poverty Ratio
TOTAL PERCENT OF ALL
Estimate Margin of error Estimate Margin
of error All families 585,894 ± 3,144 ALL FAMILIES WITH INCOME:
Below 50 percent of poverty level 44,970 ± 1,449 7.7% ± 0.2
Below 100 percent of poverty level 114,942 ± 2,109 19.6% ± 0.3
Below 125 percent of poverty level 150,274 ± 2,418 25.6% ± 0.4
Below 150 percent of poverty level 182,120 ± 2,352 31.1% ± 0.4
Below 185 percent of poverty level 218,734 ± 2,546 37.3% ± 0.4
Below 200 percent of poverty level 234,058 ± 2,489 39.9% ± 0.4
Below 300 percent of poverty level 323,428 ± 2,829 55.2% ± 0.4
Below 400 percent of poverty level 389,964 ± 2,932 66.6% ± 0.4
Below 500 percent of poverty level 438,868 ± 3,139 74.9% ± 0.4
Source: 2011-2015 American Community Survey
0
10,000
20,000
30,000
40,000
50,000
60,000
70,000
2000 2005 2010 2015
Median Household Income ($), Kings County, 2000-2015
90% Confidence interval Estimate NY state estimate

Kings County Profile
Page 24 of 30
12.2 Poverty: Trends over time: Count
Source: Small Area Income and Poverty Estimates (SAIPE)
12.3 Poverty: Trends over time: Rate
Source: Small Area Income and Poverty Estimates (SAIPE)
0
100,000
200,000
300,000
400,000
500,000
600,000
700,000
800,000
2000 2005 2010 2015
Number of people in poverty, Kings County, 2000-2015
90% Confidence interval Estimate
21.4% 22.5% 23.5% 23.3% 23.8%22.3% 22.6% 21.9% 21.1% 21.7% 22.9% 23.6% 24.2% 23.3% 23.4% 22.3%
0%
5%
10%
15%
20%
25%
30%
35%
2000 2005 2010 2015
Poverty rate, Kings County, 2000-2015
90% Confidence interval Estimate NY State estimate

Kings County Profile
Page 25 of 30
12.4 Poverty characteristics
TOTAL BELOW POVERTY
LEVEL PERCENT BELOW POVERTY LEVEL
Estimate Margin of error Estimate Margin
of error Estimate Margin of error
Population for whom poverty status is determined 2,574,154 ± 1,448 597,404 ± 8,266 23.2% ± 0.3 AGE
Under 18 years 600,094 ± 1,195 197,426 ± 3,845 32.9% ± 0.6
Under 5 years 190,984 ± 407 63,240 ± 1,803 33.1% ± 1.0
5 to 17 years 409,110 ± 1,009 134,186 ± 2,798 32.8% ± 0.7
18 to 34 years 707,470 ± 427 150,197 ± 3,287 21.2% ± 0.5
35 to 64 years 962,362 ± 343 179,703 ± 2,941 18.7% ± 0.3
65 years and over 304,228 ± 652 70,078 ± 1,515 23.0% ± 0.5
SEX
Male 1,218,274 ± 724 265,335 ± 4,407 21.8% ± 0.4
Female 1,355,880 ± 942 332,069 ± 4,544 24.5% ± 0.3
RACE AND HISPANIC OR LATINO ORIGIN
White alone 1,119,164 ± 4,661 232,745 ± 4,707 20.8% ± 0.4
Black or African American alone 861,984 ± 3,472 198,586 ± 4,982 23.0% ± 0.6
American Indian and Alaska Native alone 8,621 ± 1,007 2,888 ± 601 33.5% ± 5.2
Asian alone 296,312 ± 1,475 72,151 ± 2,784 24.3% ± 0.9
Hispanic or Latino origin (of any race) 504,026 ± 661 154,601 ± 4,624 30.7% ± 0.9
White alone, not Hispanic or Latino 921,241 ± 968 178,505 ± 4,006 19.4% ± 0.4
EDUCATIONAL ATTAINMENT Population 25 years and over 1,726,650 ± 813 330,000 ± 4,354 19.1% ± 0.3
Less than high school graduate 355,299 ± 3,259 121,135 ± 2,420 34.1% ± 0.6
High school graduate (includes equivalency) 452,249 ± 3,810 102,303 ± 2,302 22.6% ± 0.5
Some college, associate's degree 350,296 ± 3,708 58,270 ± 1,709 16.6% ± 0.5
Bachelor's degree or higher 568,806 ± 4,192 48,292 ± 1,691 8.5% ± 0.3
EMPLOYMENT STATUS Civilian labor force 16 years and over 1,295,465 ± 4,283 163,621 ± 3,221 12.6% ± 0.2
Employed 1,166,085 ± 4,464 117,324 ± 2,498 10.1% ± 0.2
Male 582,265 ± 2,635 55,632 ± 1,451 9.6% ± 0.3
Female 583,820 ± 3,425 61,692 ± 1,745 10.6% ± 0.3
Unemployed 129,380 ± 2,646 46,297 ± 1,579 35.8% ± 0.9
Male 68,230 ± 1,612 22,814 ± 1,060 33.4% ± 1.3
Female 61,150 ± 1,842 23,483 ± 1,065 38.4% ± 1.4
WORK EXPERIENCE IN THE PAST 12 MONTHS Population 16 years and over 583,820 ± 3,425 61,692 ± 1,745 10.6% ± 0.3
Worked full-time, year-round 129,380 ± 2,646 46,297 ± 1,579 35.8% ± 0.9
Worked part-time or part-year 68,230 ± 1,612 22,814 ± 1,060 33.4% ± 1.3
Did not work 61,150 ± 1,842 23,483 ± 1,065 38.4% ± 1.4
Source: 2011-2015 American Community Survey

Kings County Profile
Page 26 of 30
13 Glossary
American Community Survey (ACS) - The American Community Survey is an ongoing survey of the population that provides data every year on a variety of social and economic characteristics—age, sex, race, family and relationships, income and benefits, health insurance, education, veteran status, disabilities, where you work and how you get there, where you live and how much you pay for some essentials. The ACS replaced the information previously gathered by what was known as the “long form” of the decennial censuses. The ACS provides communities, companies and other institutions with current information they need to plan investments and services. Information from the survey generates data that help determine how more than $400 billion in federal and state funds are distributed each year. Every estimate presented in the American Community Survey, as in other surveys, has an uncertainty associated with it. Often the magnitude of that uncertainty is expressed as the Margin of Error.
Confidence Interval (CI) - indication of the degree of uncertainty about a sample estimates. Confidence intervals have been traditionally reported at the 90, 95 and 99 percent levels. A 90 percent confidence interval can be interpreted, for example, roughly as providing 90 percent certainty that the interval defined by the upper and lower bounds contain the true value of the characteristic. If a Margin of Error is given, the lower bound of the confidence interval is equal to the estimate minus the Margin of Error and the upper bound is equal to the estimate plus the Margin of Error. (See further, Margin of Error definition below.)
County subdivision or Minor Civil Division (MCD) - The Census Bureau geography for primary administrative units below the county level in New York is collectively referred to as county subdivisions or minor civil divisions. These include towns, cities and Indian Reservations.
Decennial Census - the Census of the population and housing taken every 10 years in the United States, at the start of each decade, since 1790.
Employed – either “at work” or “with a job, but not at work”.
Group Quarters Population - all U.S. residents who live in group living facilities including correctional institutions, juvenile facilities, skilled nursing facilities, college residence halls, military barracks, group homes, and workers' dormitories.
Household Population - all U.S. residents who live in housing units such as single family homes, townhouses, apartments, and mobile homes.
Intercensal Population Estimates - estimates produced for the years between two decennial censuses when both the beginning and ending populations are known. They are produced once a decade by adjusting the existing time series of postcensal estimates for the entire decade to smooth the transition from one decennial census count to the next. They differ from the postcensal estimates that are released annually because the difference between the April 1 postcensal estimate and April 1 census count for the end of the decade is redistributed across the estimates for that decade. For dates when both postcensal and intercensal estimates are available, intercensal estimates are preferred.
Labor Force - consists of people classified as employed or unemployed.
Margin of Error (MOE) - a measure of the precision of an estimate at a given level of confidence. The confidence level of a margin of error indicates the likelihood that the difference between the population value (which you

Kings County Profile
Page 27 of 30
would get if you could measure the whole population instead of a sample) and the estimate is less than or equal to the margin of error. The range from the estimate minus the margin of error to the estimate plus the margin of error is called the confidence interval. All ACS estimates are published with their margins of error at the 90 percent confidence level. Margins of error are useful in assessing the reliability of estimates and whether differences between estimates are significant.
Numeric Population Change - difference between the population of an area at the beginning and end of a time period. It is computed by taking the difference between the population at one point in time (t1) and some future time (t2).
Percent Population Change - difference between the population of an area at the beginning and end of a time period, expressed as a percentage of the beginning population. It is computed by dividing the population change (t2 - t1) by t1 and multiplying the result by 100.
Population Estimates - The calculated number of people living in an area as of a specified point in time, usually July 1st. The estimated population is calculated using a component of change model that incorporates information on natural increase (births, deaths) and net migration (net domestic migration, net international migration) that has occurred in an area since the latest decennial census. A procedure for estimating the current population using a procedure involving a “base population” value at time t -1, adding to that the births during the interval t-1 to t, subtracting the deaths during that interval t-1 to t, and then adding the net domestic and net international migration that occurred during that interval.
Population Density - Total number of people per areal unit like a square mile or square kilometer.
Population Pyramids - A graphical way of portraying a population’s age and sex composition at a given slice in time. The first horizontal bar, constituting the base of the graph, is the youngest age group (typically 0-4) with the number of males in that age group on the left and the number of females in that age group on the right. On top of that age group is another horizontal bar for the next age group (e.g. 5-9) and so forth with the top bar typically for those aged 75 and over. In a population with lots of births and deaths, the shape typically forms a pyramid with a broad base and a narrow top. It is one of the most basic ways to understand population change over time as well as between different geographic units of a similar status (e.g. counties).
Postcensal Estimates - estimates produced for the years after a decennial census when only the beginning population is known. They are produced and revised each year, targeted to July 1 of that year.
Projection - estimated population at some future time based on assumptions about births, deaths, migration, and ages.
Race/Ethnicity - the Census Bureau collects racial data in accordance with guidelines provided by the U.S. Office of Management and Budget (OMB), and these data are based on self-identification. The racial categories included in the census questionnaire generally reflect a social definition of race recognized in this country and not an attempt to define race biologically, anthropologically, or genetically. In addition, it is recognized that the categories of the race item include racial and national origin or sociocultural groups. People may choose to report more than one race to indicate their racial mixture, such as “American Indian” and “White.” People who identify their origin as Hispanic, Latino, or Spanish may be of any race. OMB requires five minimum categories: White, Black or African American, American Indian or Alaska Native, Asian, and Native Hawaiian or Other Pacific Islander. Hispanics may be classified as white or black. So we generally separate them out as an ethnic group first.
Kings County Profile
Page 28 of 30
Unemployed – Not employed, but actively looking for work and available to accept a job.
Unemployment rate – Fraction of the Labor Force that is unemployed.
Urban Area – A densely settled area with at least 2,500 people. If the total number of people is less than 50,000 the Census Bureau calls it an Urban Cluster, otherwise an Urbanized Area.
Vintage - each year, the U.S. Census Bureau produces and publishes estimates of the population for each state and county, as well as the nation as a whole. These are called “vintages.” In producing these vintages, the Bureau utilizes administrative data from a number of sources to estimate 1) the change in population since the most recent decennial census, and 2) the population for each year since the most recent decennial census. With each annual release of population estimates (vintage), the entire time series of estimates beginning on April 1, 2010 is revised and updated.
Vital Statistics - quantitative data concerning a population, such as the number of births, marriages, and deaths.

Kings County Profile
Page 29 of 30
14 References
Kings County homepage: http://www1.nyc.gov/
At Cornell:
• Program on Applied Demographics (PAD) URL: http://pad.human.cornell.edu/
o More county trends: https://pad.human.cornell.edu/counties/trends1geo.cfm?geo=47 • Community and Regional Development Institute (CaRDI)
URL: https://cardi.cals.cornell.edu/ • Cornell Cooperative Extensions (CCE)
Home page: http://www.cce.cornell.edu o New York City local office: http://nyc.cce.cornell.edu/
Data sources and background information:
• New York State Data Center o https://labor.ny.gov/nys-data-center/index.shtm
• U.S. Census Bureau - general o QuickFacts: https://www.census.gov/quickfacts/table/PST045216/36,36047 o American FactFinder: http://factfinder.census.gov/
• U.S. Census Bureau - population o Decennial Census
Background: https://www.census.gov/2010census/ Demographic Profile:
http://factfinder2.census.gov/bkmk/table/1.0/en/DEC/10_SF1/SF1DP1/0500000US36047
o American Community Survey (ACS) Background: https://www.census.gov/programs-surveys/acs/ Social Data Profile:
http://factfinder2.census.gov/bkmk/table/1.0/en/ACS/15_5YR/DP02/0500000US36047 Economic Data Profile:
http://factfinder2.census.gov/bkmk/table/1.0/en/ACS/15_5YR/DP03/0500000US36047 Housing Data Profile:
http://factfinder2.census.gov/bkmk/table/1.0/en/ACS/15_5YR/DP04/0500000US36047 Demographics Data Profile:
http://factfinder2.census.gov/bkmk/table/1.0/en/ACS/15_5YR/DP05/0500000US36047 o Population estimates:
General: https://www.census.gov/programs-surveys/popest.html Explorer: https://www.census.gov/censusexplorer/censusexplorer-popest.html
• U.S. Census Bureau – Small Area Income & Poverty Estimates (SAIPE) o http://www.census.gov/did/www/saipe/
• U.S. Census Bureau - Public Use Quarterly Workforce Indicators (QWI) – annual averages o https://qwiexplorer.ces.census.gov/static/explore.html
• U.S. Census Bureau – Building Permits Survey o https://www.census.gov/construction/bps/

Kings County Profile
Page 30 of 30
• Bureau Labor Statistics (BLS) o Local Area Unemployment Statistics: http://www.bls.gov/lau/ o Quarterly Census of Employment and Wages (QCEW): https://www.bls.gov/cew/data.htm
• NY Department of Labor - o Labor statistics: https://labor.ny.gov/stats/index.shtm o Quarterly Census of Employment and Wages (QCEW): https://labor.ny.gov/stats/LSQCEW.shtm
• NY State Department of Health o Vital Statistics: https://www.health.ny.gov/statistics/vital_statistics/
• Bureau of Economic Analysis (BEA) – Local Area Personal Income and Employment: http://bea.gov/iTable/iTable.cfm?ReqID=70&step=1
Alternative sites for data retrieval:
• The Nelson A. Rockefeller Institute of Government – New York State Statistical Yearbooks http://www.rockinst.org/nys_statistics/
• Headwaters Economics: Economic Profile System – Human Dimensions Toolkit http://headwaterseconomics.org/tools/eps-hdt
• National Historical Geographic Information System (NHGIS) https://www.nhgis.org/
• Social Explorer http://www.socialexplorer.com/pub/home/home.aspx
• Stats America http://www.statsamerica.org/Default.aspx
• Missouri Census Data Center http://mcdc.missouri.edu/
• DataFerret http://dataferrett.census.gov/
• Investigative Reporters and Editors (IRE) Census project http://census.ire.org/