King s Research Portal - COnnecting REpositories · 2017-02-18 · 133 according to the total...
53
King’s Research Portal DOI: 10.7554/eLife.08384 Document Version Peer reviewed version Link to publication record in King's Research Portal Citation for published version (APA): Villarino, A., Laurence, A., Robinson, G. W., Bonelli, M., Dema, B., Afzali, B., ... O'Shea, J. J. (2016). Signal transducer and activator of transcription 5 (STAT5) paralog dose governs T cell effector and regulatory functions. Elife, 5. 10.7554/eLife.08384 Citing this paper Please note that where the full-text provided on King's Research Portal is the Author Accepted Manuscript or Post-Print version this may differ from the final Published version. If citing, it is advised that you check and use the publisher's definitive version for pagination, volume/issue, and date of publication details. And where the final published version is provided on the Research Portal, if citing you are again advised to check the publisher's website for any subsequent corrections. General rights Copyright and moral rights for the publications made accessible in the Research Portal are retained by the authors and/or other copyright owners and it is a condition of accessing publications that users recognize and abide by the legal requirements associated with these rights. •Users may download and print one copy of any publication from the Research Portal for the purpose of private study or research. •You may not further distribute the material or use it for any profit-making activity or commercial gain •You may freely distribute the URL identifying the publication in the Research Portal Take down policy If you believe that this document breaches copyright please contact [email protected] providing details, and we will remove access to the work immediately and investigate your claim. Download date: 18. Feb. 2017
Transcript of King s Research Portal - COnnecting REpositories · 2017-02-18 · 133 according to the total...

King’s Research Portal
DOI:10.7554/eLife.08384
Document VersionPeer reviewed version
Link to publication record in King's Research Portal
Citation for published version (APA):Villarino, A., Laurence, A., Robinson, G. W., Bonelli, M., Dema, B., Afzali, B., ... O'Shea, J. J. (2016). Signaltransducer and activator of transcription 5 (STAT5) paralog dose governs T cell effector and regulatoryfunctions. Elife, 5. 10.7554/eLife.08384
Citing this paperPlease note that where the full-text provided on King's Research Portal is the Author Accepted Manuscript or Post-Print version this maydiffer from the final Published version. If citing, it is advised that you check and use the publisher's definitive version for pagination,volume/issue, and date of publication details. And where the final published version is provided on the Research Portal, if citing you areagain advised to check the publisher's website for any subsequent corrections.
General rightsCopyright and moral rights for the publications made accessible in the Research Portal are retained by the authors and/or other copyrightowners and it is a condition of accessing publications that users recognize and abide by the legal requirements associated with these rights.
•Users may download and print one copy of any publication from the Research Portal for the purpose of private study or research.•You may not further distribute the material or use it for any profit-making activity or commercial gain•You may freely distribute the URL identifying the publication in the Research Portal
Take down policyIf you believe that this document breaches copyright please contact [email protected] providing details, and we will remove access tothe work immediately and investigate your claim.
Download date: 18. Feb. 2017

1
2
Signal transducer and activator of transcription 5 (STAT5) paralog dose 3
governs T cell effector and regulatory functions 4 5
6
Alejandro V. Villarino 1*, Arian Laurence 1, Gertraud W. Robinson 2, Michael Bonelli 1, Barbara Dema 1, Behdad Afzali 1, 7
Han-Yu Shih 1, Hong-Wei Sun 1, Stephen R. Brooks 1, Lothar Hennighausen 2, Yuka Kanno 1 & John J. O'Shea 1 8
9
1 Molecular Immunology and Inflammation Branch, National Institute of Arthritis, Musculoskeletal and Skin Diseases, 10 National Institutes of Health, Bethesda, MD 20892, USA 11 12
2 Laboratory of Genetics and Physiology, National Institute of Diabetes, Digestive and Kidney Diseases, 13 National Institutes of Health, Bethesda, MD 20892, USA 14 15 16 17
* Correspondence to Dr. Alejandro V. Villarino: National Institutes of Health, 9000 Rockville Pike, 18 10 Center Drive, Building 10 - Room 13C120 19 Bethesda, MD 20892 20 Phone: (301) 451-6275 21 Fax: (301) 480-6372 22 E-mail: [email protected] 23
24 25 26 27 28 29 30 31 32 33 34 35 36 37 38 39 40 41 42 43 44 45 46 47 48 49 50 51 52 53
54

Villarino et al. 2 Summary (139 words) 55
56
The transcription factor STAT5 is fundamental to the mammalian immune system. However, the 57
relationship between its two paralogs, STAT5A and STAT5B, and the extent to which they are 58
functionally distinct, remains uncertain. Using mouse models of paralog deficiency, we 59
demonstrate that they are not equivalent for CD4+ 'helper' T cells, the principal orchestrators of 60
adaptive immunity. Instead, we find that STAT5B is dominant in both effector and regulatory 61
(Treg) responses and, therefore, uniquely necessary for immunological tolerance. Comparative 62
analysis of genomic distribution and transcriptomic output reveals that STAT5B has greater 63
transcriptional output but, surprisingly, our data point towards asymmetric expression (i.e. 64
paralog dose), rather than distinct functional properties, as the key distinguishing feature. Thus, 65
we propose a quantitative model of STAT5 paralog activity whereby relative abundance 66
imposes functional specificity (or dominance) in the face of widespread structural homology. 67

Villarino et al.[Type the document title] 3 Introduction 68
69
Signal Transducers and Activators of Transcription (STAT) family proteins are an evolutionarily 70
conserved set of transcription factors which operate downstream of cytokine and hormone 71
receptors to convert extracellular stimuli into biochemical signals that instruct gene expression 72
(Villarino et al. 2015; Stark and Darnell 2012). In mammals, STAT5 is unique because it is 73
encoded by two genes, termed Stat5a and Stat5b, derived from a relatively recent duplication 74
event (Wang and Levy 2012). In fact, the ancestral STAT5 gene appears to have duplicated on 75
two separate occasions during vertebrate evolution. Once in teleosts, resulting in two paralogs 76
on different chromosomes, and again in eutherians, resulting in the two contiguous mammalian 77
paralogs (Liongue et al. 2012). 78
79
Because of their recent divergence, STAT5A and STAT5B are homologous at the DNA, RNA 80
and protein levels, which has led to persisting questions about whether they are redundant or 81
functionally distinct. Genetically engineered mice lacking Stat5a or Stat5b have provided 82
compelling evidence for both arguments. On one hand, there are phenotypic differences; 83
Stat5a-deficient mice exhibit poor mammary function (Liu et al. 1997), reduced hematopoietic 84
stem cell proliferation (S. Zhang et al. 2000) and diminished antibody class switching (Kagami et 85
al. 2000), while Stat5b-deficient mice exhibit dwarfism (Udy et al. 1997), more pronounced 86
lymphopenia, and greater defects in cytokine-driven lymphocyte proliferation (Moriggl, Sexl, et 87
al. 1999; Imada et al. 1998). On the other hand, deletion of Stat5a and Stat5b has comparable 88
effects on some physiological processes, such as eosinophil recruitment (Kagami et al. 2000), 89
and the most dramatic phenotypes, such as infertility, anemia and perinatal lethality, are evident 90
only in mice lacking both paralogs, which implies redundancy and/or cooperativity (Teglund et 91
al. 1998; Socolovsky et al. 1999; Cui et al. 2004). Genome-wide DNA-binding profiles also 92
support both viewpoints. The target repertoires for STAT5A and STAT5B mostly overlap, which 93
implies redundancy, but there are also a subset of sites that may be differentially bound, which 94
implies specificity (Liao et al. 2008; Liao et al. 2011; Yamaji et al. 2013; Kanai et al. 2014). 95
Consistent with the latter point, humans with germline mutations in STAT5B exhibit a range of 96
clinical abnormalities, indicating that STAT5A cannot compensate for some vital functions 97
(Kanai, Jenks, and Nadeau 2012). 98
99
Compound STAT5 deficiency manifests striking immunological abnormalities in mice, most 100
notably lymphopenia, splenomegaly and autoimmunity. These are typically attributed to its role 101

Villarino et al.[Type the document title] 4 downstream of the common gamma chain (ɣc) receptor and its dedicated Janus kinase, Jak3 102
(Moriggl, Topham, et al. 1999; Snow et al. 2003; Yao et al. 2006). The ɣc is shared by 6 103
different cytokines, IL-2 IL-4, IL-7, IL-9, IL-15 and IL-21, each of which employs a unique co-104
receptor subunit that determines which cell types can be influenced (Rochman, Spolski, and 105
Leonard 2009). ɣc cytokines impact all lymphocytes but have been most extensively studied in 106
CD4+ 'helper' T cells, the key orchestrators of adaptive immunity. Among the many functions 107
ascribed to the ɣc-STAT5 axis in this lineage are the ability to promote Th1- and Th2-type 108
effector responses, to support T cell memory, to promote activation-induced cell death, to 109
suppress Th17-type and T follicular helper cell (Tfh) responses, and to promote T regulatory cell 110
(Treg) responses (Moriggl, Topham, et al. 1999; Liao et al. 2008; Liao et al. 2011; Dooms et al. 111
2007; J. Zhu et al. 2003; Kagami et al. 2001; Lenardo 1991; Laurence et al. 2007; Ballesteros-112
Tato et al. 2012; Johnston et al. 2012; Mahmud, Manlove, and Farrar 2013). 113
114
To assess redundancy between STAT5 paralogs, we developed a mouse model where STAT5A 115
and/or STAT5B were reduced but not absent, allowing us to compare their respective functions 116
while avoiding the confounding lymphopenia associated with complete STAT5 deficiency. These 117
studies reveal STAT5B as the dominant paralog in helper T cells; exhibiting far greater impact 118
on pathogenic effector and host-protective regulatory responses and, therefore, uniquely 119
required for immunological tolerance. Surprisingly, genome-wide DNA binding and 120
transcriptome surveys did not uncover widespread differences in target gene selection but, 121
instead, point towards relative abundance as the key distinguishing factor. Thus, we propose 122
that asymmetric expression (i.e. paralog dose), rather than differential function, determines the 123
dominant STAT5 paralog in lymphoid cells. 124
125

Villarino et al.[Type the document title] 5 Results 126
127
A dominant role for STAT5B in immunological tolerance 128
129
To investigate the relationship between STAT5A and STAT5B, we generated a series of mice 130
with pre-determined combinations of Stat5 alleles, ranging from two alleles each of A and B (4 131
total) to one allele of either A or B (Figure 1A)(Yamaji et al. 2013). We refer to each genotype 132
according to the total number of Stat5 alleles that are retained. For example, two-allele Stat5a-133
deficient mice lack both Stat5a alleles but retain two of Stat5b (Stat5a-/- Stat5b+/+), while one-134
allele Stat5a-deficient mice lack both Stat5a alleles and retain just one of Stat5b (Stat5a-/- 135
Stat5b+/-). All 8 genotypes were born at the expected Mendelian ratios and survived beyond 6 136
months of age, thereby demonstrating that a single allele of either paralog is sufficient to 137
prevent the perinatal lethality seen in STAT5-null mice (Data not shown)(Hoelbl et al. 2006; Cui 138
et al. 2004). Red blood cell counts and hematocrits were comparable across all genotypes, 139
indicating that a single allele is also enough to support erythropoiesis, but white blood cell 140
(WBC) counts were sharply reduced in one-allele Stat5a- or Stat5b-deficient mice, as well as 141
two-allele Stat5b-deficient mice. By contrast, two-allele Stat5a-deficient mice had relatively 142
normal WBC counts (Figure 1B). 143
144
None of the STAT5 mutants exhibited histological abnormalities in the liver, spleen or intestine, 145
tissues known to be affected in STAT5-null mice (Data not shown)(Snow et al. 2003; Yao et al. 146
2006). However, Stat5b-deficient mice did exhibit kidney pathology with a penetrance of 75% or 147
25%, depending on whether they harbored one or two Stat5a alleles (Figure 1C). Afflicted 148
individuals presented a loss of glomerular structure, proteinuria and systemic anti-DNA 149
antibodies (Figure 1D-F). Therefore, as in humans, Stat5b is required for immunological 150
tolerance in mice but, given the clear difference between having one or two Stat5a alleles, 151
redundancy and/or cooperativity is also evident. 152
153
STAT5 paralog dose governs T follicular helper cell responses 154
155
To probe for immunological phenotypes, we first assessed the cellularity and composition of 156
primary lymphoid organs. Although not completely lymphopenic like STAT5-null mice (Yao et al. 157
2006), one- and two-allele Stat5b-deficient mice did have fewer splenocytes than WT controls 158
(Figure 2A). Cell counts were also reduced in one-allele Stat5a-deficient mice, suggesting that, 159
while STAT5B may be dominant, STAT5A does have substantial influence. Lymph node 160

Villarino et al.[Type the document title] 6 cellularity was similarly affected by the loss of either paralog and, in fact, all genotypes with less 161
than three-alleles had reduced cell counts (Figure 2A). 162
163
Frequencies of CD4+ T cells were comparable across all genotypes, whereas CD8+ T cells were 164
reduced in one-allele Stat5b-deficient mice and, to a lesser extent, in one-allele Stat5a-deficient 165
mice (Figure 2B). By contrast, B cells were increased in one-allele Stat5b-deficient mice and, 166
consistent with the appearance of auto-antibodies, GL7+ Fashigh IgDlow germinal center (GC) B 167
cells were dramatically enriched (Figure 2B-C and data not shown). One-allele Stat5a-168
deficient mice had a more modest accumulation of GC B cells, again, illustrating both the 169
relevance and redundancy of STAT5A (Figure 2B-C). 170
171
The ability to promote B cell responses is a defining characteristic of CD4+ ‘helper’ T cells 172
(Crotty 2011). Therefore, given the appearance of GC B cells, we next investigated the CD4+ T 173
cell compartment. Not surprisingly, there was a marked accumulation of CD44high IL-7Rαlow 174
effector/memory T cells in Stat5b-deficient mice which, as with the incidence of kidney disease, 175
was more pronounced in those bearing one-allele of Stat5a than in those bearing two (Figure 176
3A-B & Figure 3-figure supplement 1A). We also measured production of IFN-ɣ and IL-17, 177
two effector cytokines that are dysregulated in STAT5-null mice (Laurence et al. 2007). IFN-ɣ+ 178
cells were highly enriched in the autoimmune-prone Stat5b-deficient mice but not age-matched 179
Stat5a-deficient counterparts, suggesting that STAT5B may be particularly important for limiting 180
Th1-type responses. IL-17A+ Th17-type cells were also increased but this trend did not reach 181
statistical significance (Figure 3C-D). 182
183
CD4+ Tfh cells specialize in promoting B cell responses (Crotty 2011). Mirroring the abundance 184
of GC B cells, there was dramatic accumulation of PD1high CXCR5high ICOShigh Tfh cells in one-185
allele Stat5b-deficient mice, and a more modest enrichment in one-allele Stat5a-deficient mice 186
(Figure 3E-F, Figure 3-figure supplement 1B & data not shown). At least two interpretations 187
can be made for this disparity; either the two proteins are not functionally equivalent or the two 188
genes have different outputs. Consistent with the latter view, mice lacking one-allele each of 189
Stat5a and Stat5b (i.e. double-heterozygotes) had more Tfh cells than those lacking two-alleles 190
of Stat5a, despite having the same total number of alleles. Moreover, the percentage of Tfh 191
cells was comparable between two-allele Stat5b-deficient mice and one-allele Stat5a-deficient 192
mice, suggesting that two alleles of Stat5a are roughly equal to one allele of Stat5b (Figure 3F 193
& Figure 3-figure supplement 1B). 194

Villarino et al.[Type the document title] 7 STAT5 paralog dose impacts multiple aspects of regulatory T cell function 195
196
CD4+ T regulatory (Treg) cells expressing the forkhead transcription factor, FOXP3, are 197
essential for immunological tolerance (Malek and Castro 2010). Given the importance of STAT5 198
in Treg cells (Mahmud, Manlove, and Farrar 2013), we next inspected this subset. Unlike 199
STAT5-null mice, which exhibit a profound lack of Treg cells (Yao et al. 2007; Burchill et al. 200
2006), frequencies of splenic FOXP3+ cells were relatively normal across our STAT5 mutants. 201
However, due to differences in overall cellularity, absolute counts were significantly lower in 202
one- and two-allele Stat5b-deficient mice, as well one-allele Stat5a-deficient mice. A similar 203
trend was observed for LN resident Treg cells; frequencies were comparable to WT controls but 204
total numbers were reduced in all genotypes bearing less than 3 total alleles (Figure 4-figure 205
supplement 1). To further characterize the Treg compartment, we measured IL-2Rα, a 206
component of the IL-2 receptor that is critical for Treg cell homeostasis and function. It is also a 207
both upstream and downstream of STAT5 signaling and, thus, can be viewed as an indicator of 208
STAT5 activity (Malek and Castro 2010). We found that the percentage of IL-2Rα+ Treg cells 209
mirrored the total number of Stat5 alleles; it was slightly reduced in mice with three alleles, lower 210
in those with 2, and lower still in those with 1 (Figure 4A-B). We also noted that residual IL-211
2Rα+ Treg cells from one-allele mice had reduced suppressive capacity and were unable to 212
maintain expression of IL-2Rα during in vitro culture (Figure 4C-E). Each of these phenotypes 213
was more pronounced in the absence of Stat5b than Stat5a, again, illustrating both the 214
dominance of the former and the relevance (and/or redundancy) of the latter. 215
216
Given the appearance of IFN-ɣ+ effector T cells in Stat5b-deficient mice, we next asked whether 217
Stat5b-deficient Treg cells express TBX21, a transcription factor required for Treg cells to limit 218
Th1-type responses (Koch et al. 2009). Similar to conventional T cells (Liao et al. 2011), we 219
found that IL-2 was sufficient to induce TBX21 in WT Treg cells (Figure 4F). This effect was 220
slightly reduced in the absence of Stat5a but almost completely abolished in the absence of 221
Stat5b, consistent with the disparity of other STAT5-dependent parameters (e.g. Tfh cell and 222
Treg cell responses). Both Stat5a- and Stat5b-deficient Treg cells maintained FOXP3 223
expression similar to WT controls and, surprisingly, both gained the ability to produce IL-2, a 224
cytokine that is typically restricted in this lineage (Figure 4F-G). 225

Villarino et al.[Type the document title] 8 STAT5 is required for in vitro differentiation of induced regulatory (iTreg) T cells (Yao et al. 226
2007). To dissect the contributions of STAT5A and STAT5B, we purified naive CD4+ T cells from 227
our STAT5 mutants, cultured them under iTreg polarizing conditions and compared expression 228
of FOXP3. We found that, although both paralogs appear to play a role, STAT5B has far greater 229
influence on iTreg generation - see the striking reduction of FOXP3+ cells in one-allele Stat5b-230
deficient cultures (Figure 5A). We also found that deletion of either paralog endowed FOXP3+ 231
iTreg cells with the ability to produce IL-2, which suggests that, beyond its effects on 232
differentiation, STAT5 may also limit the inflammatory potential of this subset (Figure 5A-B). 233
234
Next, we compared the transcriptomes of Stat5a- and Stat5b-deficient T cells cultured under 235
iTreg polarizing conditions. Gene set enrichment analysis revealed that the overall Treg gene 236
signature - defined by a combination of FOXP3- and IL-2-dependent transcriptional programs 237
(Hill et al. 2007) - was similarly affected in both genotypes, meaning that there were no broad 238
qualitative differences (Figure 5C). However, there were obvious quantitative differences; 239
several key genes, including Foxp3 and Il2ra, were more impacted by the loss of STAT5B than 240
STAT5A (Figure 5D). Thus, while both paralogs can impact multiple aspects Treg cell biology, 241
deletion of Stat5b is clearly more disruptive, befitting its dominant station within immunological 242
tolerance. 243
244
Specificity and redundancy of STAT5 paralogs for gene transcription 245
246
To define the molecular basis for phenotypic differences between Stat5a- and Stat5b-deficient T 247
cells, we employed a bioinformatic approach. First, we compared their transcriptomes either 248
directly ex vivo or after acute exposure to STAT5-activating stimuli. The ex vivo set included 249
naive T cells and Treg cells, while the in vitro set included naive T cells cultured with IL-7 and 250
effector T cells cultured with IL-2 (Figure 6A & Figure 6-figure supplement 1A). These 251
pairings were chosen to match the expression patterns of requisite χc co-receptors; IL-7R, 252
which is highly expressed on naive T cells, and IL-2Rα, which is highly expressed on effector T 253
cells (Rochman, Spolski, and Leonard 2009). One-allele mice were used because they 254
exhibited the most dramatic T cell phenotypes. 255
256
We began our transcriptomic survey by performing multidimensional scaling of the datasets, 257
thereby gaining a broad overview of the experimental groups. Stat5a- and Stat5b-deficient cells 258
typically clustered together and equidistant from WT controls, suggesting that the loss of either 259

Villarino et al.[Type the document title] 9 paralog has comparable genome-wide effects (Figure 6-figure supplement 1B). Next, we used 260
statistical variance to identify differentially expressed genes. Surprisingly, we found widespread 261
discord between Stat5a- and Stat5b-deficient cells; many transcripts appeared dysregulated in 262
the absence of one paralog or the other (Figure 6-figure supplement 1C-D). However, upon 263
close inspection, we concluded that the disparity was largely due to the fold-change cutoff that 264
was chosen. Most genes that were designated as STAT5B-specific were also affected by the 265
loss of STAT5A (and vice versa), albeit to a lesser degree that did not reach the arbitrary 2-fold 266
threshold (Figure 6-figure supplement 1E). To avoid this statistical artifact, we devised a 267
‘paralog preference’ scale whereby all STAT5-sensitive genes were compiled and ranked 268
according to how much they were impacted by the loss of Stat5a or Stat5b. This analysis 269
revealed a binomial distribution for all experimental conditions. The majority of genes were in 270
central bins, affected by both STAT5A and STAT5B, while membership in peripheral bins 271
decreased steadily as paralog preference increased. Importantly, all curves were shifted 272
towards STAT5B, suggesting that STAT5-sensitive genes are generally more impacted by 273
STAT5B than STAT5A (Figure 6B). This latter trend was also evident at the protein level; IL-2-274
driven (but not IL-6-driven) induction of IL-2Rα was clearly more diminished in Stat5b-deficient 275
cells than in Stat5a-deficient counterparts (Figure 6E). Collectively, these data affirm that 276
STAT5B is dominant over STAT5A while, at the same time, demonstrating pervasive 277
redundancy at the level of gene transcription. 278
279
Beyond quantitative differences, our transcriptomic survey also revealed qualitative differences 280
between Stat5a- and Stat5b-deficient cells. Using strict analysis criteria, we discovered that 281
between 12% and 22% of all STAT5-sensitive genes can be classified as paralog-specific, 282
meaning that they are solely dependent on either STAT5A or STAT5B. The absolute number of 283
paralog-specific genes varied across cell states and stimuli, with the largest allotment found in 284
IL-7-treated naive cells, and was typically skewed towards STAT5B (Figure 6C & Figure 6-285
figure supplement 1E). Thus, we can create 2 general categories: ‘pan-STAT5' genes that are 286
regulated by both STAT5A and STAT5B (e.g. Pdk1, Cish, Lta) and 'paralog specific' genes that 287
are regulated by either STAT5A (e.g. Smc6) or STAT5B (e.g. Cd74)(Figure 6D & Figure 6-288
figure supplement 2). Given that pan-STAT5 genes are much more numerous, we propose 289
that phenotypic differences between Stat5a and Stat5b deficient T cells are due largely to 290
paralog preference, owing to the fact that deletion of Stat5b has greater quantitative impact, with 291
limited contribution from paralog-specific effects. 292

Villarino et al.[Type the document title] 10 Paralog dose dictates genome wide distribution of STAT5 293
294
Functional divergence between STAT5A and STAT5B could be due to differences in target 295
gene selection. Previous studies have addressed this issue by comparing genomic distributions 296
by ChIP-seq (chromatin immunoprecipitation followed by massively parallel sequencing) using 297
separate, paralog-specific antibodies in WT T cells (Liao et al. 2008; Liao et al. 2011; Kanai et 298
al. 2014). We took an alternative approach involving a single antibody that recognizes both 299
paralogs and T cells from Stat5a- or Stat5b-deficient mice, as well as ‘double heterozygotes’ 300
(hereafter referred to as Stat5a/bhet mice). Stringent peak calling identified 1275 unique regions 301
of STAT5 occupancy in WT cells, consistent with prior inquiries (Figure 7A). By contrast, 302
Stat5a/bhet cells had fewer peaks (658 total; Figure 7A) that tended to be less robust (i.e. lower 303
signal intensity) than those found in WT controls (Figure 7D), indicating that changes in STAT5 304
availability can impact genomic distribution even when both paralogs are present. Total peaks 305
were also reduced in Stat5a-deficient cells (609 total) and almost expunged in Stat5b-deficient 306
cells (97 total), again, illustrating both the relevance of the former and the dominance of the 307
latter (Figure 7A). STAT5 peaks were similarly localized across all genotypes - they typically 308
congregated near transcriptional start sites but could also be found at distal regions, sometimes 309
>100 kb from annotated genes - and were highly enriched for STAT-binding motifs (Figure 7B 310
& Figure 7-figure supplement 1). 311
312
Most peaks found in Stat5b-deficient cells could be matched to peaks in Stat5a-deficient, 313
Stat5a/bhet or WT cells (Figure 7C). This implies a hierarchy whereby certain sites are 314
preserved even when STAT5B is absent. STAT5B-independent peaks tended to occur near 315
genes that were highly occupied in WT controls and whose expression was highly dysregulated 316
in Stat5b-deficient cells (e.g. Cish, Lta), suggesting that only the most robust (i.e. high-affinity) 317
STAT5 binding sites were preserved (Figure 8). Peaks detected within Stat5a/bhet and Stat5a-318
deficient cells also tended to be highly occupied in WT controls and dysregulated in STAT5-319
deficient cells, but the trend was not as dramatic, indicating that, while a full complement of 320
STAT5 alleles may be necessary to achieve optimal responses, STAT5B has the greatest 321
influence on genomic distribution (Figure 8). 322
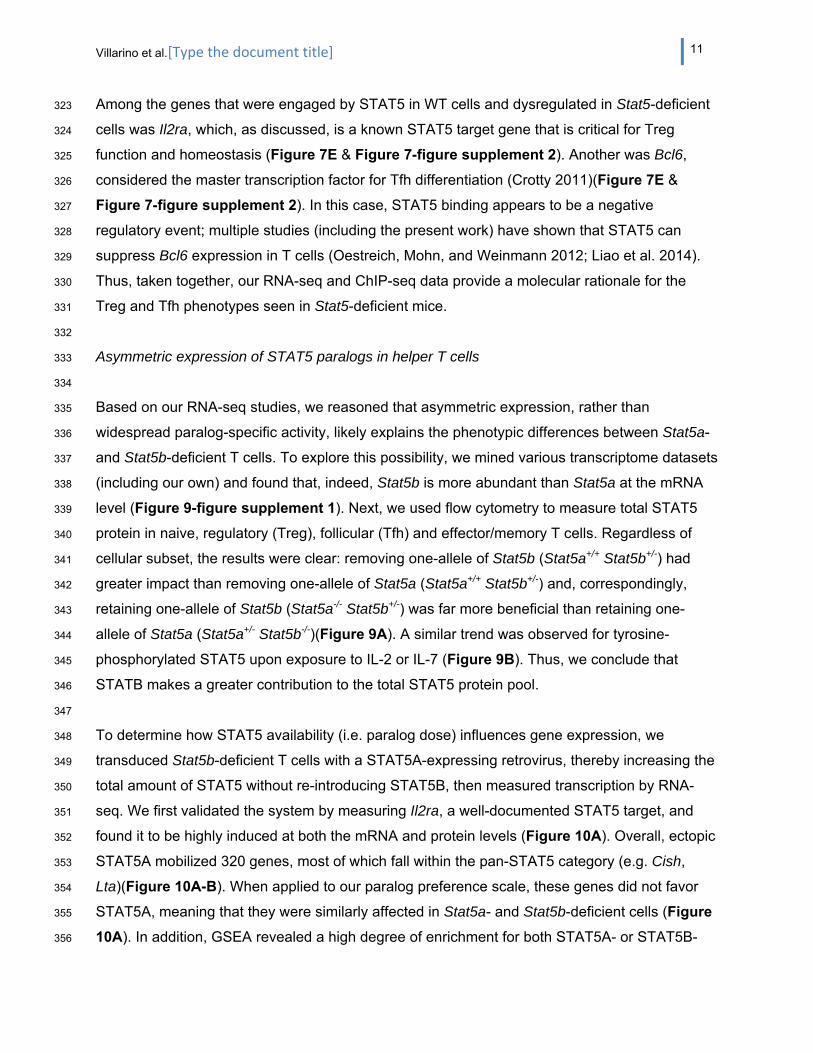
Villarino et al.[Type the document title] 11 Among the genes that were engaged by STAT5 in WT cells and dysregulated in Stat5-deficient 323
cells was Il2ra, which, as discussed, is a known STAT5 target gene that is critical for Treg 324
function and homeostasis (Figure 7E & Figure 7-figure supplement 2). Another was Bcl6, 325
considered the master transcription factor for Tfh differentiation (Crotty 2011)(Figure 7E & 326
Figure 7-figure supplement 2). In this case, STAT5 binding appears to be a negative 327
regulatory event; multiple studies (including the present work) have shown that STAT5 can 328
suppress Bcl6 expression in T cells (Oestreich, Mohn, and Weinmann 2012; Liao et al. 2014). 329
Thus, taken together, our RNA-seq and ChIP-seq data provide a molecular rationale for the 330
Treg and Tfh phenotypes seen in Stat5-deficient mice. 331
332
Asymmetric expression of STAT5 paralogs in helper T cells 333
334
Based on our RNA-seq studies, we reasoned that asymmetric expression, rather than 335
widespread paralog-specific activity, likely explains the phenotypic differences between Stat5a- 336
and Stat5b-deficient T cells. To explore this possibility, we mined various transcriptome datasets 337
(including our own) and found that, indeed, Stat5b is more abundant than Stat5a at the mRNA 338
level (Figure 9-figure supplement 1). Next, we used flow cytometry to measure total STAT5 339
protein in naive, regulatory (Treg), follicular (Tfh) and effector/memory T cells. Regardless of 340
cellular subset, the results were clear: removing one-allele of Stat5b (Stat5a+/+ Stat5b+/-) had 341
greater impact than removing one-allele of Stat5a (Stat5a+/+ Stat5b+/-) and, correspondingly, 342
retaining one-allele of Stat5b (Stat5a-/- Stat5b+/-) was far more beneficial than retaining one-343
allele of Stat5a (Stat5a+/- Stat5b-/-)(Figure 9A). A similar trend was observed for tyrosine-344
phosphorylated STAT5 upon exposure to IL-2 or IL-7 (Figure 9B). Thus, we conclude that 345
STATB makes a greater contribution to the total STAT5 protein pool. 346
347
To determine how STAT5 availability (i.e. paralog dose) influences gene expression, we 348
transduced Stat5b-deficient T cells with a STAT5A-expressing retrovirus, thereby increasing the 349
total amount of STAT5 without re-introducing STAT5B, then measured transcription by RNA-350
seq. We first validated the system by measuring Il2ra, a well-documented STAT5 target, and 351
found it to be highly induced at both the mRNA and protein levels (Figure 10A). Overall, ectopic 352
STAT5A mobilized 320 genes, most of which fall within the pan-STAT5 category (e.g. Cish, 353
Lta)(Figure 10A-B). When applied to our paralog preference scale, these genes did not favor 354
STAT5A, meaning that they were similarly affected in Stat5a- and Stat5b-deficient cells (Figure 355
10A). In addition, GSEA revealed a high degree of enrichment for both STAT5A- or STAT5B-356
Villarino et al.[Type the document title] 12 dependent gene sets (Figure 10C). Taken together, these data support the idea that differing 357
STAT5 protein concentrations underlie many (if not most) of the transcriptomic divergence 358
between Stat5a- and Stat5b-deficient cells. 359
360
Having established that ectopic STAT5A can rescue gene expression in Stat5b-deficient T cells, 361
we next asked whether it can rescue iTreg differentiation. For these studies, naive T cells from 362
wild type, Stat5a/bhet or one-allele Stat5b-deficient mice were cultured under iTreg polarizing 363
conditions, then transduced with either control or STAT5A retrovirus and FOXP3 measured to 364
assess lineage commitment. FOXP3 induction was greatly reduced in control-transduced 365
Stat5a/bhet cells and almost completely abolished in control-transduced Stat5b-deficient cells 366
(Figure 10D). However, when ectopic STAT5A was introduced, the percentage of FOXP3+ cells 367
was comparable across all genotypes and, whether endogenous (top row) or ectopic (bottom 368
row), there was a clear linear correlation between STAT5 and FOXP3 protein levels (Figure 369
10D). IL-2Rα, another key STAT5 target, was also diminished in Stat5a/bhet and Stat5b-370
deficients cells, and restored by ectopic STAT5A (Figure 10E). Collectively, these data argue 371
that a threshold concentration of STAT5 must be reached to institute the Treg program and, 372
given the conspicuous effect of ectopic STAT5A on WT cells (Figure 10D & Figure 10-figure 373
supplement 1A), they imply that availability of STAT5 is a limiting factor in this process. 374
375
Although they share a common instructive cytokine (TGF-β), Th17 cells and Treg cells have 376
opposing pro- and anti-inflammatory functions. STAT5 is key to this divergence - it promotes 377
Treg responses at the expense of Th17 responses – so we next investigated the effect of 378
paralog dose on Th17-type responses. First, we found that the percentage of IL-17+ cells was 379
4-fold higher in Stat5a/bhet Th17 cultures and >25-fold higher in Stat5b-deficient Th17 cultures 380
than in WT controls, consistent with a high paralog dose threshold. More importantly, we found 381
that ectopic STAT5 not only extinguished IL-17 but also induced FOXP3 in all genotypes, 382
thereby demonstrating that changes in STAT5 concentration can tip the balance between 383
effector and regulatory T cells programs (Figure 10-figure supplement 1B). 384

Villarino et al.[Type the document title] 13 Discussion 385
386
Although the importance of STAT5 is widely recognized, there is no consensus on whether its 387
closely related paralogs, STAT5A and STAT5B, are redundant or functionally distinct. Assuming 388
the latter, it is also unclear how specificity would be achieved given their extensive structural 389
homology. Both positions are grounded in sound experimental evidence but, until the present 390
studies, there has been no comprehensive inquiry on their relationship in immune cells. We 391
addressed this longstanding question in primary CD4+ helper T cells, the principal orchestrators 392
of adaptive immunity. Using a combination of genetic and genomic approaches, we 393
demonstrate that STAT5B is dominant over STAT5A and, thus, plays a non-redundant role in 394
controlling effector and regulatory T cell responses. This conclusion is based on phenotypic 395
differences between Stat5a- and Stat5b-deficient mice, as well as bioinformatic analyses 396
showing that STAT5B has greater impact on both selection and transcription of STAT5 target 397
genes. The disparity does not appear to be due to differences in genome wide distribution or 398
transcriptional capacity but, instead, relates to differences in relative abundance. Consistent 399
with the latter point, our loss- and gain-of-function studies demonstrate that a threshold 400
concentration of STAT5 must be reached to execute STAT5-dependent gene expression and 401
differentiation programs. Based on these findings, we submit that STAT5A and STAT5B are 402
largely redundant at the molecular level, but not at the cellular or organismal levels, where 403
STAT5B is dominant due to increased availability. 404
405
It has been proposed that the target repertoires of STAT5A and STAT5B vary due to subtle 406
differences in the amino acid composition of their DNA-binding domains (Boucheron et al. 407
1998). However, this notion has been disputed because the nature and location of these 408
changes may not alter protein structure enough to impact specificity. In addition, multiple studies 409
have shown that the consensus DNA binding motifs for STAT5A and STAT5B are identical, 410
although it should be noted that these measured optimal binding to synthetic oligonucleotides in 411
cell free systems, leaving open the possibility that divergent binding properties become 412
apparent only at lower affinity sites or in the context of native chromatin (Soldaini et al. 1999; 413
Ehret et al. 2001). Indeed, differential binding of STAT5A or STAT5B has been detected at 414
several loci in primary immune cells but it remains unclear whether this reflects bona fide 415
differences in specificity or other factors that may influence target gene selection (Liao et al. 416
2008; Liao et al. 2011; Yamaji et al. 2013; Kanai et al. 2014). For instance, it is known that 417
STAT5A and STAT5B can exhibit distinct phosphorylation patterns, so preferential binding may 418

Villarino et al.[Type the document title] 14 reflect cell type- or stimulus-specific differences in activation rather than distinct targeting 419
capabilities (Caldenhoven et al. 1998; Hennighausen and Robinson 2008; Rosen et al. 1996; 420
Meinke et al. 1996). Our work supports this latter view by establishing that, even before 421
activation, relative abundance of STAT5A versus STAT5B determines which paralog will 422
dominate a given transcriptional response. 423
424
Recent work has shown that small oscillations in transcription factor availability can have 425
genome-wide consequences (Brewster et al. 2014). The idea that STAT5 concentration can 426
impact cellular function also has precedent. Of particular interest are studies reporting severe 427
immunological phenotypes in transgenic mice which over-express STAT5A or STAT5B (Kelly, 428
Spolski, Kovanen, et al. 2003; Kelly, Spolski, Imada, et al. 2003), and studies showing that 429
Stat5a/b haplo-insufficiency ameliorates contact hypersensitivity (Nivarthi et al. 2014). In 430
addition, we have previously demonstrated that ectopic STAT5A can expand the target 431
repertoire of STAT5 in mouse embryonic fibroblasts (B. M. Zhu et al. 2012), and have explored 432
the concept of STAT5 gene dosage in the context of mammary development, finding that a high 433
STAT5 threshold must be reached for mammary epithelial cell differentiation (Yamaji et al. 434
2013). Given that STAT5A is the dominant paralog in mammary epithelium, we can infer that 435
asymmetric expression of STAT5 paralogs is not just a feature of immune cells, and that it must 436
be controlled in a tissue-specific manner (Metser et al. 2016). Several mechanisms may explain 437
this phenomenon. First, it is known that Stat5a and Stat5b are transcribed from opposite DNA 438
strands and, thus, may be subject to strand-specific modes of regulation (Figure 9-figure 439
supplement 2). Second, differential transcription could be achieved through paralog-specific 440
enhancer elements whose accessibility is tissue- and/or cell type-restricted. We have recently 441
characterized an intergenic enhancer that drives expression of Stat5a in mammary epithelium 442
and have identified multiple DNase hypersensitivity sites within the Stat5b locus that are present 443
in T cells but not in non-lymphoid tissues, perhaps indicating an analogous mechanism for 444
immune cells (Metser et al. 2016)(Figure 9-figure supplement 3). Third, paralog-specific 445
epigenetic modifications, such as histone or DNA methylation, may impose distinct 446
transcriptional outputs, as shown for tumor cells (Q. Zhang et al. 2007). Fourth, the 3’ UTRs of 447
Stat5a and Stat5b are highly divergent so it is possible that their mRNAs are subject to post-448
transcriptional regulation via distinct sets of microRNAs and/or RNA-binding proteins (Liu et al. 449
1995). 450
451
Beyond asserting the dominance of STAT5B, our work also affirms the importance of STAT5A. 452

Villarino et al.[Type the document title] 15 Several observations support this latter point: 1) deletion of one Stat5a allele exaggerates the 453
gross and cellular phenotypes of Stat5b-deficient mice, 2) transcription of STAT5 target genes is 454
typically influenced by both STAT5A or STAT5B, and 3) ectopic STAT5A can rescue gene 455
expression in Stat5b-deficient cells. Furthermore, just one-allele of either Stat5a or Stat5b is 456
sufficient to prevent the perinatal lethality and anemia seen in STAT5-null mice, suggesting that 457
molecular redundancy protects the most critical ‘life-and-death’ functions. We also identified a 458
small subset of genes that appear to be regulated by either STAT5A or STAT5B, some of which 459
have known immunological functions. Given that STAT5B is more abundant, it can be argued 460
that all STAT5B-dependency may be due to a high paralog dose threshold, but this cannot 461
explain the appearance of STAT5A-dependent genes. Thus, we propose that phenotypic 462
differences between Stat5a- and Stat5b-deficient T cells result from widespread ‘paralog 463
preference’ and circumscribed 'paralog specificity'. 464
465
Our ChIP-seq studies indicate that the overall availability of STAT5, whether STAT5A or 466
STAT5B, has profound influence on target gene selection. Previous studies have compared 467
genomic distribution of STAT5A and STAT5B in primary CD4+ T cells and found that they 468
mostly overlap, thereby supporting the idea of redundancy (Liao et al. 2008; Liao et al. 2011; 469
Kanai et al. 2014). However, they also identified a subset of sites that are occupied by one 470
paralog or the other and, thus, have been taken as evidence for paralog specificity. All such 471
comparisons (including ours) should be interpreted with care. Shared sites can be appointed 472
with confidence but, due to technical confounders (e.g. differences in antibody affinity), 473
incongruent sites cannot be definitively classified as STAT5A- or STAT5B-specific. The 474
mechanisms underlying differential binding must also be considered. It is possible that bona fide 475
paralog-specific binding sites do exist, but these are probably only a minor fraction. In most 476
cases, differential binding likely reflects competition; the more abundant paralog is more likely to 477
be detected. Given this nuance, claims that certain genes are uniquely regulated by STAT5A or 478
STAT5B should be tempered. For instance, it has been suggested that Bcl2l1 is regulated only 479
by STAT5A and that Bcl2, Il2ra and Foxp3 are regulated only by STAT5B (Kanai et al. 2014; 480
Jenks et al. 2013). Our data indicate that these are more accurately described as 'pan-STAT5' 481
genes that are more impacted by deletion of one paralog or the other. 482
483
STAT5 is essential for immunological tolerance (Mahmud, Manlove, and Farrar 2013). This 484
principle is well illustrated in humans with congenital STAT5B defects, who typically manifest a 485
range of autoimmune symptoms (Kanai, Jenks, and Nadeau 2012), and is further supported by 486

Villarino et al.[Type the document title] 16 the present work, which demonstrates that Stat5b deficiency leads to spontaneous kidney 487
disease in mice. The link between STAT5 and autoimmunity is often attributed to its role 488
downstream of IL-2/IL-2Rα in Treg cells (Malek and Castro 2010; Mahmud, Manlove, and Farrar 489
2013). Our work clearly endorses this viewpoint and brings to mind the autoimmune phenotype 490
of Treg-deficient Scurfy mice which, like Stat5b-deficient mice, exhibit both autoantibodies and 491
kidney disease {Aschermann:2013gn}. We demonstrate that, similar to STAT5B-deficient 492
humans (Cohen et al. 2006), Treg cells are functionally compromised in Stat5b-deficient mice, 493
but, surprisingly, the baseline frequency of FOXP3+ cells was not reduced, likely reflecting 494
immunological and/or environmental differences between the two species. We also present new 495
ideas about why STAT5-deficient Treg cells are impaired. First, they acquire the ability to 496
produce IL-2, a cytokine that is typically restricted in Treg cells (Malek and Castro 2010). This 497
finding is consistent with previous studies demonstrating that STAT5 can suppress IL-2 498
production by conventional T cells and, given that Treg cells are thought to operate, in part, by 499
consuming IL-2, it provides one explanation for their ineffectiveness (Villarino et al. 2007; 500
Pandiyan et al. 2007). Second, they fail to express TBX21, a transcription factor that is required 501
to limit Th1-type T cell responses (Koch et al. 2009). Previous studies have shown that STAT1-502
activating cytokines (e.g. interferons, IL-27) can induce TBX21 in Treg cells but we are the first 503
to show that IL-2, a STAT5-activating cytokine, can do it (Hall et al. 2012; Koch et al. 2012). 504
505
Aside from its role in Treg cells, STAT5 promotes immunological tolerance via effector cell-506
intrinsic mechanisms. Given the dramatic accumulation of Tfh cells in our STAT5 mutants, the 507
capacity of Tfh cells to promote autoimmunity, and recent work showing that STAT5 can 508
suppress Tfh differentiation (Ballesteros-Tato et al. 2012; Johnston et al. 2012), we conclude 509
that exaggerated Tfh responses factor heavily in the autoantibody responses and attendant 510
kidney pathology seen in Stat5b-deficient mice. Our data also suggest an intimate relationship 511
between STAT5 and BCL6, the ‘master’ transcription factor for Tfh cells. We report that STAT5 512
directly engages the Bcl6 locus, where it likely acts as a transcriptional repressor, and that 513
STAT5 binding sites are often enriched for BCL6 motifs, consistent with published accounts of 514
co-localization between these two transcription factors (Y. Zhang, Laz, and Waxman 2012; Liao 515
et al. 2014). These findings strongly implicate Tfh cells in the pathogenesis of Stat5b-deficient 516
mice but, since these are germline ‘knockouts’, we must consider the (likely) possibility that 517
intrinsic defects in other cell types contribute to the autoimmune phenotype. For instance, 518
multiple dendritic cell subsets are known to be dysregulated in Stat5- or Jak3-deficient mice 519
(Esashi et al. 2008; Yamaoka 2005), and its influence on non-immune cells, particularly 520

Villarino et al.[Type the document title] 17 downstream of hormone receptors, cannot be ignored (Kuhrt and Wojchowski 2015; 521
Hennighausen and Robinson 2008). 522
523
Because of its prominent role within the immune system, STAT5 has long been viewed as an 524
attractive target for therapeutic intervention. Clinical use of STAT5-activating cytokines and 525
growth factors (e.g. IL-2, erythropoetin) is now commonplace and the recent approval of Jak3 526
inhibitors for the treatment of autoimmune disease and malignancy points to sustained interest 527
in this pathway (Villarino et al. 2015). Consequently, a detailed understanding of how STAT5 528
signaling works is imperative not only to inform new drugs, but also to improve existing 529
regimens. The present study yields multiple clinically relevant insights and, in particular, raises 530
two key issues that should be considered. First, partial inhibition of STAT5 expression and or 531
activity may be sufficient to have desired effects on immune cell function. Second, targeting of 532
STAT5A may be safer (though perhaps less robust) than targeting of STAT5B. Therefore, taking 533
a broad view, our findings provide a molecular rationale for exploiting STAT5 paralog 534
redundancy in clinical settings. 535
536

Villarino et al.[Type the document title] 18 Materials & Methods 537
538
Experimental Animals 539
540
STAT5 mutants were generated as described (Yamaji et al. 2013). Briefly, mice lacking the 541
entire Stat5 locus (Stat5a/b+/-) were crossed with mice lacking one-allele of Stat5a (Stat5a+/- 542
Stat5b+/+) or Stat5b (Stat5a+/+ Stat5b+/-) to produce 8 combinations of Stat5 alleles (Figure 1A). 543
We refer to each genotype according to the total number of Stat5 alleles that are retained. For 544
example, two-allele Stat5a-deficient mice lack both Stat5a alleles but retain two Stat5b alleles 545
(Stat5a-/- Stat5b+/+), while one-allele Stat5a-deficient mice lack both Stat5a alleles but retain one 546
Stat5b allele (Stat5a-/- Stat5b+/-). Wild type and CD45.1+ C57BL/6 mice were purchased from 547
Jackson Labs (Bar Harbor, ME). Animals were handled in accordance with NIH guidelines and 548
all experiments approved by the NIAMS Animal Care and Use Committee. 549
550
Blood, Urine & Lymphoid Tissue Analysis 551
552
Complete blood counts were taken from 8-12 week old mice (NIH Clinical Center, Division of 553
Veterinary Services, Bethesda, MD). Anti-double stranded DNA antibodies were measured in 554
serum collected from 4-6 month old mice (Calbiotech, Spring Valley, CA). Albumin/creatinine 555
ratio was measured in urine collected from 4-6 month old mice (Exocell, Philadelphia, PA). 556
Spleen and lymph node (cervical, axillary, brachial and inguinal) cellularity was measured in 8-557
12 week old mice using a Nexcelom X1 Cellometer (Lawrence, MA). 558
559
Histology 560
561
Kidneys were dissected from 4-6 month old mice, fixed, embedded in paraffin, sectioned and 562
stained with hematoxylin and eosin (American Histolabs, Gaithersburg, MD). Blinded scoring 563
was performed by a veterinary pathologist (Diagnostic & Research Services Branch, National 564
Institutes of Health, Bethesda, MD). Specimens from at least 3 mice per genotype were 565
inspected. Micrograph images were collected using a BioRevo BZ-9000 digital microscope 566
(Keyence, Itasca, IL). 567

Villarino et al.[Type the document title] 19 Flow cytometry 568
569
For surface proteins, cells were stained directly ex vivo with fluorochrome labelled anti-mouse 570
CD3ε, CD4, CD8α, CD25 (IL-2Rα), CD44, CD45R (B220), CD95 (FAS), CD127 (IL-7R), CD185 571
(CXCR5), CD279 (PD1), GL-7, and IgD. For intracellular proteins, cells were fixed and 572
permeabilized using Transcription Factor Staining Buffer Set (eBioscience, San Diego, CA), 573
then stained with fluorochrome labelled anti-mouse FOXP3 and/or TBX21. For cytokine 574
production, cells were stimulated with Phorbol 12-myristate 13-acetate and ionomycin for 4 575
hours (50 ng/ml and 500 ng/ml, respectively; Sigma-Aldrich, St. Louis, MO), treated with 576
Brefeldin A for 2 hours (10 μg/ml; Sigma-Aldrich), fixed (2% formaldehyde; Sigma-Aldrich), 577
permeabilized (0.25% Saponin; Sigma/Aldrich), and stained with fluorochrome labelled anti-578
mouse IFN-ɣ, IL-2 and/or IL-17A. For IL-2Rα induction, naive CD4+ CD44low CD25- cells were 579
purified from pooled lymph nodes and spleens using a FACS Aria Cell Sorter (>98% purity; BD 580
Biosciences, San Diego, CA). These were stimulated with plate-bound anti-CD3 (10 μg/ml; 581
Clone 17A2) and soluble anti-CD28 (1 μg/ml; Clone 37.51) in the presence of soluble anti-582
mouse IL-2, IL-4 and IFN-ɣ (10 μg/ml each; Clones S4B6, BVD6-24G2 and XMG1.2; BioXcell, 583
West Lebanon, NH) for 18 hours, then treated with human IL-2 (100 units/ml; NIH/NCI BRB 584
Preclinical Repository) or mouse IL-6 (20 ng/ml; eBioscience) for 18 hours and stained with 585
fluorochrome labelled anti-mouse CD25. For tyrosine-phosphorylated STAT5, splenocytes were 586
treated directly ex vivo with human IL-2 (100 units/ml) or mouse IL-7 (20 ng/ml; eBioscience) for 587
1 hour, or stimulated with anti-CD3 and anti-CD28 in the presence of anti-mouse IL-2 for 18 588
hours, then pulsed with human IL-2 for 1 hour (100 units/ml). These were then fixed with 2% 589
formaldehyde, permeabilized with 100% methanol and stained with Alexa Fluor 647-labelled 590
anti-human/mouse pY694 STAT5 (Clone 47; BD Biosciences) in conjunction with fluorochrome 591
labelled anti-mouse CD3ε, CD4, CD25, CD44, CD127 and/or FOXP3. Total STAT5 protein was 592
measured in splenocytes directly ex vivo or following retroviral transduction of purified CD4+ T 593
cells (described below). In both cases, cells were fixed with 2% formaldehyde, permeabilized 594
with 100% methanol, then stained with a rabbit polyclonal IgG that recognizes both STAT5A 595
and STAT5B (sc-835; Santa Cruz Biotechnology, Santa Cruz, CA) in conjunction with 596
fluorochrome labelled anti-mouse CD3ε, CD4, CD25, CD44, CD127, (IL-7R), CD185 (CXCR5), 597
CD279 (PD1), IL-17A and/or FOXP3. Phycoerythrin labelled goat anti-rabbit IgG was used for 598
detection (ac-3739; Santa Cruz Biotechnology). Normal rabbit IgG was used as a negative 599
control (ac-2027; Santa Cruz Biotechnology). 600
601

Villarino et al.[Type the document title] 20 All fluorochrome labelled antibodies were purchased from eBioscience, BD Biosciences or 602
Biolegend (San Diego, CA), unless noted otherwise. Data was collected on a FACSverse 603
cytometer (BD Biosciences) and analyzed using FlowJo software (FlowJo LLC, Ashland, OR). 604
Compiled cytometry data is presented as scatter plots where each element represents a single 605
replicate (horizontal line indicates the mean), or box plots where the the fold change for each 606
replicate was calculated relative to WT controls and log 2 transformed (horizontal line indicates 607
the mean and whiskers indicate minimum and maximum values). Cells were maintained in 608
supplemented tissue culture medium (RPMI-1640 with 10% fetal calf serum, 1% sodium 609
pyruvate, 1% nonessential amino acids, 0.1% β-Mercaptoethanol, 100 U/ml penicillin, 100 610
mg/ml streptomycin; Life Technologies, Grand Island, NY) and cultured at a density of 0.25-0.5 611
x 106 cells/ml in flat bottomed 96 well plates (200 ml/ well; Sigma/Costar, St. Louis, MO). 612
613
T regulatory cell assays 614
615
For in vitro suppression assays, CD4+ CD25high Neuropilin+ Treg cells were sorted from WT and 616
one-allele Stat5a- or Stat5b-deficient mice. Naive, CD4+ CD44low CD25- responder cells were 617
sorted from congenic CD45.1 mice and labelled with Carboxyfluorescein succinimidyl ester 618
(CFSE; Sigma-Aldrich). CD11c+ antigen presenting cells (APCs) were purified from WT mice 619
using positive selection beads (Miltenyi Biotec). 5 x 10⁴ CD4+ responder cells were stimulated 620
with soluble anti-mouse CD3ε (1 μg/ml) in round bottom 96 well plates containing 1 x 10⁴ APCs 621
and varying numbers of Treg cells, ranging from 5 x 10⁴ (1:1 ratio) to 1.56 x 10³ (1:32 ratio). 622
After 96 hours, cells were stained with fluorochrome labelled anti-mouse CD4, CD45.1, and 623
CD25. Percent suppression was calculated relative to WT controls and reflects the percentage 624
of responder cells exhibiting at least one cell division. For 'Treg only' cultures, cells were 625
stimulated with anti-CD3 and anti-CD28 in the presence human IL-2 (100 units/ml) for 72 hours. 626
For iTreg differentiation, naive CD4+ CD44low CD25- cells were sorted and cultured for 72 hours 627
in the presence anti-CD3, anti-CD28, human TGF-β (10 ng/ml; R&D Systems, Minneapolis, 628
MN), human IL-2 (100 units/ml) and anti-mouse IL-2, IL-4 and IFN-ɣ. 629
630
RNA sequencing and transcriptome analysis 631
632
Cell sorting was used to purify cells from pooled lymph nodes and spleens of WT and one-allele 633
Stat5a- or Stat5b-deficient mice (>99% purity). Ex vivo groups included naive T cells (CD4+ 634
CD44low CD25-) and Treg cells (CD4+ CD25high Neuropilin+). In vitro groups included naive T 635
Villarino et al.[Type the document title] 21 cells that were treated with mouse IL-7 for 18 hours, effector T cells that were stimulated with 636
anti-CD3 and anti-CD28 in the presence of human IL-2 for 72 hours, and induced Treg cells. All 637
cultures included anti-mouse IL-2, IL-4 and IFN-ɣ (10 μg/ml each). Equal numbers of cells (0.5-638
2.5 x 10⁵) were collected for each replicate. These were lysed in Trizol reagent and total RNA 639
isolated by phenol-chloroform extraction with GlycoBlue as co-precipitant (7 μg per sample; Life 640
Technologies). Single-end libraries were prepared with 0.25-1 μg of total RNA using the TruSeq 641
RNA Sample Preparation Kit V2 and sequenced for 50 cycles with a HiSeq 2500 instrument (4-642
6 samples multiplexed per lane; Illumina, San Diego, CA). 50 bp reads were then mapped onto 643
mouse genome build mm9 using TopHat and further processed using Cufflinks (Garber et al. 644
2011). 2-3 biological replicates were sequenced per genotype for every cell type and culture 645
condition. QC-passing read counts are presented in Supplementary File 1. 646
647
Datasets are normalized based on RPKM (reads per kilobase exon model per million mapped 648
reads) and purged of micro-RNAs, sno-RNAs and sca-RNAs. To minimize fold-change artifacts 649
caused by low abundance transcripts, a small offset (0.2-0.3; equal to the second quartile of 650
each dataset) was added to all RPKM values (Warden, Yuan, and Wu 2013). When multiple 651
transcripts were detected for a single gene, only the most abundant (i.e. highest average RPKM 652
across all 3 genotypes) was considered for downstream analyses. Transcripts with RPKM 653
values of less than 1 in all genotypes within a given cell type or condition were excluded. Fold 654
change and variance across genotypes and biological replicates were calculated using EdgeR 655
(M. D. Robinson, McCarthy, and Smyth 2009). Transcripts were classified as differentially 656
expressed if they exhibited a >1.5 fold change and significant pairwise variance (p<0.05) 657
relative to WT controls. The 500 transcripts with greatest variance within each cell type or 658
condition were used for multidimensional scaling (MDS) using the RobiNA software package 659
(Lohse et al. 2012). 660
661
A 'paralog preference' scale was devised to illustrate the relative impact of Stat5a - or Stat5b- 662
deficiency. First, all transcripts that were differentially expressed in Stat5a- or Stat5b- deficient 663
cells (relative to WT controls) were pooled to generate a single list of STAT5-regulated genes 664
for each cell type or condition. Next, the absolute fold change was calculated and multiplied by 665
the higher of the two RPKMs (WT or KO), thereby generating a 'paralog score'. Note that the 666
use of absolute fold change negates the distinction between up- and down-regulated genes, 667
while the multiplication step improves the score for high-abundance transcripts. The paralog 668
score for STAT5B was then divided by the paralog score for STAT5A and the resulting 669

Villarino et al.[Type the document title] 22 'preference score' was log 2 transformed so that transcripts which are more impacted by the 670
loss of STAT5B are assigned positive values while those which are more impacted by the loss 671
of STAT5A are assigned negative values. All transcripts were then segregated into 12 bins 672
according to preference scores (Bin 1 includes values of less than -5, Bin 2 ranges from -5 to -4, 673
and so on). Data are displayed as smoothed histograms and the median preference score is 674
indicated. 675
676
To identify ‘paralog specific’ transcripts, we first identified those exhibiting >1.5 fold change and 677
significant variance (p<0.05) when comparing Stat5a- or Stat5b-deficient cells directly to one 678
another. Next, we refined this list by stipulating that transcripts must be differentially expressed 679
in one KO relative to WT controls (>1.5 fold change) but not in the other (<1.2 fold change). 680
Rare transcripts with opposite expression patterns (i.e. up-regulated in one genotype but down-681
regulated in the other) were excluded. Data are presented as pie charts. 682
683
All volcano plots, XY plots, histograms and pie charts were generated with the DataGraph 684
software suite (Visual Data Tools, Inc.). Heat maps were generated with Multi Experiment 685
Viewer (MeV; J. Craig Venter Institute, La Jolla, CA). Genome browser files (BigWig format) 686
were processed to remove intronic reads using TopHat and are displayed with the Integrative 687
Genomics Viewer (IGV; Broad Institute, Cambridge, MA). 688
689
GSEA analysis was performed as described (Subramanian et al. 2005). Unabridged RNA-seq 690
datasets were used in conjunction with the following user-generated Gene Sets: 1) Treg 691
signature genes (132 members)(Hill et al. 2007), 2) IL-2-regulated, STAT5A-dependent genes 692
(258 members)(from the comparison of WT and 'one copy' Stat5a-deficient T cells; Figure 6), 3) 693
IL-2-regulated, STAT5B-dependent genes (329 members)(from the comparison of WT and 'one 694
copy' Stat5b-deficient T cells; Figure 6). Enrichment score curves and member ranks were 695
generated by the GSEA software (Broad Institute). Normalized enrichment score (NES), false 696
discovery rate (FDR) and nominal p Value is shown on each plot. 697
698
See Supplementary File 2 for RPKM, fold change and p values for all experimental groups 699
and conditions, Supplementary File 3 for paralog preference calculations and Supplementary 700
File 4 for paralog-specific genes. 701
702

Villarino et al.[Type the document title] 23 Chromatin immuno-precipitation and DNA sequencing 703
704
Cell sorting was used to purify naive CD4+ CD44low CD25- cells from WT, Stat5a/bhet and two-705
allele Stat5a- or Stat5b-deficient mice (>99% purity). These were stimulated with anti-CD3 and 706
anti-CD28 in the presence of human IL-2 for 48 hours (10 U/ml with anti-mouse IL-2, IL-4 and 707
IFN-ɣ), then pulsed with IL-2 (100 U/ml) for one hour before fixing with 1% formaldehyde. They 708
were then lysed (1 x 10⁷ cells/sample), sonicated and immuno-precipated using a polyclonal 709
rabbit anti-mouse IgG that recognizes both STAT5A and STAT5B (ab7969; Abcam, Cambridge, 710
MA). Recovered STAT5-bound DNA fragments, along with un-precipitated ‘input controls’, were 711
blunt-end ligated to adaptors and single-end libraries constructed using the NEBNext ChIP-Seq 712
Library Prep for Illumina kit (New England Biolabs, Ipswich, MA). Sequencing was performed on 713
a HiSeq 2500 instrument (50 cycles; Illumina) and short reads (50 bps) aligned using Bowtie 714
(Langmead et al. 2009). Non-redundant reads were mapped to the mouse genome (mm9) and 715
aggregated into peaks and using MACS 1.4.2 (Feng et al. 2012). Only peaks with >3 fold 716
enrichment over background and p values <0.00005 were called. Positive false discovery rates, 717
or q-values, were calculated empirically for each peak and all were below 0.2% (Storey 2003). 2 718
biological replicates were sequenced per genotype. 'bamCorrelate' from deepTools 1.5 was 719
used to calculate Spearman's rank correlation coefficients as a measure of inter-replicate 720
variability (WT=0.82, Stat5a/bhet=0.83, Stat5a-deficient=0.82, Stat5b-deficient=0.81; all pairwise 721
p-values <2.2. x 10-16)(Ramirez et al. 2014). Read depth for all replicates is presented in 722
Supplementary File 1. 723
724
Peaks were annotated to the nearest known gene using HOMER (Y. Zhang et al. 2008; Heinz et 725
al. 2010). Localization was calculated as the percentage of peaks found within 10 kb intervals of 726
the nearest transcriptional start sites and plotted as histograms. Direct comparison between 727
experimental groups (i.e. peak overlap) was done with PAPST (Bible et al. 2015). Circos plot 728
was generated by inputing the number of shared peaks between experimental groups to the 729
Circos Table Viewer (http://mkweb.bcgsc.ca/tableviewer)(Krzywinski et al. 2009). Violin plot was 730
generated by inputing tag numbers to the online BoxPlotR applet 731
(http://boxplot.tyerslab.com)(Editorial 2014). Transcription factor motif analysis was done with 732
HOMER using an 'in house' database generated by applying de novo motif discovery to 733
published ChIP-seq datasets. Genome browser files are displayed with IGV. 734
Villarino et al.[Type the document title] 24 ENCODE Analysis 735
736
Strand-specific RNA sequencing data was generated by the ENCODE Transcriptome Group 737
from Cold Spring Harbor Laboratories (U.S.A.) and the Center for Genomic Regulation 738
(Spain)(https://genome.ucsc.edu/cgi-739
bin/hgTrackUi?hgsid=424400999_9OI4vJsT1sakRAPyi9mNSC7V81zc&g=wgEncodeCshlLong740
RnaSeq). DNAseI hyper-sensitivity data was generated by the University of Washington 741
ENCODE group (https://genome.ucsc.edu/cgi-742
bin/hgTrackUi?hgsid=424401115_qgaAWZ6Xs38F1laFE3UuHnvAG7AS&g=wgEncodeUwDnas743
e). Data are used in accordance with the ENCODE data release policy (Yue et al. 2014) and 744
visualized with the UCSC genome browser, focusing on the mouse Stat5a/b locus 745
(chr11:100642045-100746483). 746
747
Retroviral Gene Transduction 748
749
Retroviral vector expressing phosphatase-insensitive STAT5A was generated as described (J. 750
Zhu et al. 2003). Plasmids were transfected into Phoenix packaging cells using Lipofectamine 751
(Invitrogen) and the resulting viral supernatants used to transduce CD4+ cells from WT, 752
Stat5a/bhet or one-allele Stat5b-deficient mice. These were stimulated (anti-CD3/CD28) in the 753
presence of anti-mouse IL-2 for 48 hours, exposed to viral supernatant for 1 hour (at 2200 rpm, 754
18°C), and cultured for an additional 48 hours in the presence of human IL-2 (100 U/ml). For 755
some experiments, cells were cultured under iTreg (10 ng/ml human TGF-β) or Th17 (2.5 ng/ml 756
human TGF-β + 20 ng/ml mouse IL-6) polarizing conditions before and after transduction (both 757
in the presence of anti-mouse IL-4 and IFN-ɣ). For RNA-seq, 1-2 x 10⁵ cells expressing the 758
bicistronic transduction marker (human NGFR) were purified by cell sorting. Transcripts that 759
were significantly impacted (>1.5 fold change, p<0.05) by ectopic STAT5A relative to empty 760
vector were enumerated using EdgeR. 761
762
Relative Paralog Measurements 763
764
Transcriptome data for CD4+ naive and Treg cells was sourced from: 1) Immunological Genome 765
Project (mouse microarrays: http://www.immgen.org), 2) EMBL-EBI Expression Atlas (mouse 766
RNA-seq: https://www.ebi.ac.uk/gxa/experiments/E-MTAB-2582), 3) BioGPS Primary Cell Atlas 767
(human microarrays: http://biogps.org/dataset/BDS_00013/), and 4) our RNA-seq catalogue 768

Villarino et al.[Type the document title] 25 (described above; Figure 6). Normalized expression values (microarray signal intensity or 769
FPKM) for Stat5a and Stat5b were first divided by one another to generate a paralog ratio which 770
was then converted to a percentage (% total STAT5 mRNA accounted for by each paralog) and 771
presented as pie charts. 772
773
Total STAT5 protein was measured by flow cytometry in naive (CD3ε+ CD4+ CD44low IL-7R+), 774
Treg (CD3ε + CD4+ FOXP3+), Tfh (CD3ε + CD4+ PD1+ CXCR5high) and effector/memory (CD3ε 775
+CD4+CD44high) T cells from one- or three-allele Stat5a- or Stat5b-deficient mice, as well as 776
Stat5a/bhet mice and WT controls. Mean fluorescence intensity (MFI) was first divided by the 777
baseline (i.e. WT controls) to generate 'fold change' values which, in turn, were divided across 778
Stat5a- and Stat5b-deficient genotypes bearing the same total number of alleles. The resulting 779
paralog ratios (one for one-allele cells and one for three-allele cells) were then averaged, 780
converted to a percentage (% total STAT5 protein accounted for by each paralog) and 781
presented as pie charts. 782
783
Statistics 784
785
Unpaired ANOVA was used to quantify statistical deviation between experimental groups. In all 786
figures, black asterisks denote significant differences (p < 0.05) between the indicated group 787
and WT controls. Orange asterisks denote significant differences between Stat5a- and Stat5b-788
deficient mice bearing the same total number of STAT5 alleles. 789
790
Data Deposition 791
792
All sequencing data have been deposited to the Gene Expression Omnibus under the accession 793
number GSE77656. 794

Villarino et al.[Type the document title] 26 Acknowledgements 795
796
We thank members of the O'Shea lab for helpful discussions, Victoria Hoffman for pathology 797
scoring, Gustavo Gutierrez-Cruz for sequencing and the NIAMS Flow Cytometry Group for cell 798
sorting. This study utilized the high-performance computational capabilities of the Helix System 799
at the National Institutes of Health, Bethesda, MD (http://helix.nih.gov) and was supported by 800
NIDDK and NIAMS intramural research programs. J.J.O'S. and the NIH hold patents related to 801
therapeutic targeting of Jak kinases and have a Collaborative Research Agreement and 802
Development Award with Pfizer Inc. 803

Villarino et al.[Type the document title] 27 References 804 805 Ballesteros-Tato, André, Beatriz León, Beth A Graf, Amy Moquin, Pamela Scott Adams, 806
Frances E Lund, and Troy D Randall. 2012. “Interleukin-2 Inhibits Germinal Center 807 Formation by Limiting T Follicular Helper Cell Differentiation.” Immunity, March. Elsevier 808 Inc., 1–10. doi:10.1016/j.immuni.2012.02.012. 809
810 Bible, Paul W, Yuka Kanno, Lai Wei, Stephen R Brooks, John J O'Shea, Maria I Morasso, 811
Rasiah Loganantharaj, and Hong-Wei Sun. 2015. “PAPST, a User Friendly and Powerful 812 Java Platform for ChIP-Seq Peak Co-Localization Analysis and Beyond..” Edited by 813 Vladimir B Bajic. PLoS ONE 10 (5): e0127285. doi:10.1371/journal.pone.0127285.s007. 814
815 Boucheron, C, S Dumon, S C Santos, R Moriggl, Lothar Hennighausen, S Gisselbrecht, and F 816
Gouilleux. 1998. “A Single Amino Acid in the DNA Binding Regions of STAT5A and 817 STAT5B Confers Distinct DNA Binding Specificities..” Journal of Biological Chemistry 273 818 (51): 33936–41. doi:10.1074/jbc.273.51.33936. 819
820 Brewster, Robert C, Franz M Weinert, Hernan G Garcia, Dan Song, Mattias Rydenfelt, and Rob 821
Phillips. 2014. “The Transcription Factor Titration Effect Dictates Level of Gene Expression.” 822 Cell 156 (6): 1312–23. doi:10.1016/j.cell.2014.02.022. 823
824 Burchill, Matthew A, Jianying Yang, Christine Vogtenhuber, Bruce R Blazar, and Michael A 825
Farrar. 2006. “IL-2 Receptor Beta-Dependent STAT5 Activation Is Required for the 826 Development of Foxp3+ Regulatory T Cells..” Journal of Immunology 178 (1): 280–90. 827 doi:10.4049/jimmunol.178.1.280. 828
829 Caldenhoven, E, T B van Dijk, A Tijmensen, J A Raaijmakers, J W Lammers, L Koenderman, 830
and R P de Groot. 1998. “Differential Activation of Functionally Distinct STAT5 Proteins by 831 IL-5 and GM-CSF During Eosinophil and Neutrophil Differentiation From Human CD34+ 832 Hematopoietic Stem Cells..” Stem Cells 16 (6): 397–403. doi:10.1002/stem.160397. 833
834 Cohen, Aileen C, Kari C Nadeau, Wenwei Tu, Vivian Hwa, Kira Dionis, Liliana Bezrodnik, 835
Alejandro Teper, et al. 2006. “Cutting Edge: Decreased Accumulation and Regulatory 836 Function of CD4+ CD25(High) T Cells in Human STAT5b Deficiency..” Journal of 837 Immunology 177 (5): 2770–74. doi:10.4049/jimmunol.177.5.2770. 838
839 Crotty, Shane. 2011. “Follicular Helper CD4 T Cells (TFH).” Annual Review of Immunology 29: 840
621–63. doi:10.1146/annurev-immunol-031210-101400. 841 842 Cui, Yongzhi, Greg Riedlinger, Keiko Miyoshi, Wei Tang, Cuiling Li, Chu-Xia Deng, Gertraud W 843
Robinson, and Lothar Hennighausen. 2004. “Inactivation of Stat5 in Mouse Mammary 844 Epithelium During Pregnancy Reveals Distinct Functions in Cell Proliferation, Survival, and 845 Differentiation..” Molecular and Cellular Biology 24 (18): 8037–47. 846 doi:10.1128/MCB.24.18.8037-8047.2004. 847
848 Dooms, H, K Wolslegel, P Lin, and Abul K Abbas. 2007. “Interleukin-2 Enhances CD4+ T Cell 849
Memory by Promoting the Generation of IL-7R -Expressing Cells.” Journal of Experimental 850 Medicine 204 (3): 547–57. doi:10.1084/jem.20062381. 851

Villarino et al.[Type the document title] 28 Editorial. 2014. “Kick the Bar Chart Habit.” Nature Methods 11 (2). Nature Publishing Group, a 852
division of Macmillan Publishers Limited. All Rights Reserved.: 113–13. 853 doi:10.1038/nmeth.2837. 854
855 Ehret, G B, P Reichenbach, U Schindler, C M Horvath, S Fritz, M Nabholz, and P Bucher. 2001. 856
“DNA Binding Specificity of Different STAT Proteins. Comparison of in Vitro Specificity with 857 Natural Target Sites..” Journal of Biological Chemistry 276 (9): 6675–88. 858 doi:10.1074/jbc.M001748200. 859
860 Esashi, Eiji, Yui-Hsi Wang, Olivia Perng, Xiao-Feng Qin, Yong-Jun Liu, and Stephanie S 861
Watowich. 2008. “The Signal Transducer STAT5 Inhibits Plasmacytoid Dendritic Cell 862 Development by Suppressing Transcription Factor IRF8.” Immunity 28 (4): 509–20. 863 doi:10.1016/j.immuni.2008.02.013. 864
865 Feng, Jianxing, Tao Liu, Bo Qin, Yong Zhang, and Xiaole Shirley Liu. 2012. “Identifying ChIP-866
Seq Enrichment Using MACS.” Nature Protocols 7 (9). Nature Publishing Group: 1728–40. 867 doi:10.1038/nprot.2012.101. 868
869 Garber, Manuel, Manfred G Grabherr, Mitchell Guttman, and Cole Trapnell. 2011. 870
“Computational Methods for Transcriptome Annotation and Quantification Using RNA-Seq.” 871 Nature Methods 8 (6): 469–77. doi:10.1038/nmeth.1613. 872
873 Hall, Aisling O’Hara, Daniel P Beiting, Cristina Tato, Beena John, Guillaume Oldenhove, 874
Claudia Gonzalez Lombana, Gretchen Harms Pritchard, et al. 2012. “The Cytokines 875 Interleukin 27 and Interferon-Γ Promote Distinct Treg Cell Populations Required to 876 Limit Infection-Induced Pathology.” Immunity 37 (3). Elsevier Inc.: 511–23. 877 doi:10.1016/j.immuni.2012.06.014. 878
879 Heinz, Sven, Christopher Benner, Nathanael Spann, Eric Bertolino, Yin C Lin, Peter Laslo, 880
Jason X Cheng, Cornelis Murre, Harinder Singh, and Christopher K Glass. 2010. “Simple 881 Combinations of Lineage-Determining Transcription Factors Prime Cis-Regulatory Elements 882 Required for Macrophage and B Cell Identities.” Molecular Cell 38 (4). Elsevier: 576–89. 883 doi:10.1016/j.molcel.2010.05.004. 884
885 Hennighausen, Lothar, and Gertraud W Robinson. 2008. “Interpretation of Cytokine Signaling 886
Through the Transcription Factors STAT5A and STAT5B..” Genes & Development 22 (6): 887 711–21. doi:10.1101/gad.1643908. 888
889 Hill, Jonathan A, Markus Feuerer, Kaley Tash, Sokol Haxhinasto, Jasmine Perez, Rachel 890
Melamed, Diane Mathis, and Christophe Benoist. 2007. “Foxp3 Transcription-Factor-891 Dependent and -Independent Regulation of the Regulatory T Cell Transcriptional 892 Signature..” Immunity 27 (5): 786–800. doi:10.1016/j.immuni.2007.09.010. 893
894 Hoelbl, Andrea, Boris Kovacic, Marc A Kerenyi, Olivia Simma, Wolfgang Warsch, Yongzhi Cui, 895
Hartmut Beug, Lothar Hennighausen, R Moriggl, and Veronika Sexl. 2006. “Clarifying the 896 Role of Stat5 in Lymphoid Development and Abelson-Induced Transformation..” Blood 107 897 (12): 4898–4906. doi:10.1182/blood-2005-09-3596. 898
899 Imada, K, E T Bloom, H Nakajima, J A Horvath-Arcidiacono, G B Udy, H W Davey, and Warren 900
J Leonard. 1998. “Stat5b Is Essential for Natural Killer Cell-Mediated Proliferation and 901 Cytolytic Activity..” Journal of Experimental Medicine 188 (11): 2067–74. 902

Villarino et al.[Type the document title] 29 Jenks, Jennifer A, Scott Seki, Takahiro Kanai, Jennifer Huang, Alexander A Morgan, Renata C 903
Scalco, Ruhi Nath, et al. 2013. “Differentiating the Roles of STAT5B and STAT5A in Human 904 CD4+ T Cells..” Clinical Immunology 148 (2). Elsevier Inc.: 227–36. 905 doi:10.1016/j.clim.2013.04.014. 906
907 Johnston, R J, Y S Choi, J A Diamond, J A Yang, and Shane Crotty. 2012. “STAT5 Is a Potent 908
Negative Regulator of TFH Cell Differentiation.” Journal of Experimental Medicine 209 (2): 909 243–50. doi:10.1084/jem.20111174. 910
911 Kagami, S i, H Nakajima, K Kumano, K Suzuki, A Suto, K Imada, H W Davey, et al. 2000. “Both 912
Stat5a and Stat5b Are Required for Antigen-Induced Eosinophil and T-Cell Recruitment Into 913 the Tissue..” Blood 95 (4): 1370–77. 914
915 Kagami, S, H Nakajima, A Suto, K Hirose, K Suzuki, S Morita, I Kato, Y Saito, T Kitamura, and I 916
Iwamoto. 2001. “Stat5a Regulates T Helper Cell Differentiation by Several Distinct 917 Mechanisms..” Blood 97 (8): 2358–65. 918
919 Kanai, Takahiro, Jennifer Jenks, and Kari C Nadeau. 2012. “The STAT5b Pathway Defect and 920
Autoimmunity..” Frontiers in Immunology 3: 234. doi:10.3389/fimmu.2012.00234. 921 922 Kanai, Takahiro, Scott Seki, Jennifer A Jenks, Arunima Kohli, Trupti Kawli, Dorrelyn Patacsil 923
Martin, Michael Snyder, Rosa Bacchetta, and Kari C Nadeau. 2014. “Identification of 924 STAT5A and STAT5B Target Genes in Human T Cells..” PLoS ONE 9 (1): e86790. 925
926 Kelly, J, R Spolski, K Imada, J Bollenbacher, S Lee, and Warren J Leonard. 2003. “A Role for 927
Stat5 in CD8+ T Cell Homeostasis.” Journal of Immunology 170 (1): 210–17. 928 doi:10.4049/jimmunol.170.1.210. 929
930 Kelly, John A, Rosanne Spolski, Panu E Kovanen, Takeshi Suzuki, Julie Bollenbacher, Cynthia 931
A Pise-Masison, Michael F Radonovich, et al. 2003. “Stat5 Synergizes with T Cell 932 Receptor/Antigen Stimulation in the Development of Lymphoblastic Lymphoma..” Journal of 933 Experimental Medicine 198 (1): 79–89. doi:10.1084/jem.20021548. 934
935 Koch, Meghan A, Glady's Tucker-Heard, Nikole R Perdue, Justin R Killebrew, Kevin B Urdahl, 936
and Daniel J Campbell. 2009. “The Transcription Factor TBX21 Controls Regulatory T Cell 937 Homeostasis and Function During Type 1 Inflammation.” Nature Immunology 10 (6): 595–938 602. doi:10.1038/ni.1731. 939
940 Koch, Meghan A, Kerri R Thomas, Nikole R Perdue, Kate S Smigiel, Shivani Srivastava, and 941
Daniel J Campbell. 2012. “TBX21+ Treg Cells Undergo Abortive Th1 Cell Differentiation 942 Due to Impaired Expression of IL-12 Receptor Β2.” Immunity 37 (3). Elsevier Inc.: 943 501–10. doi:10.1016/j.immuni.2012.05.031. 944
945 Krzywinski, M, J Schein, I Birol, J Connors, R Gascoyne, D Horsman, S J Jones, and M A 946
Marra. 2009. “Circos: an Information Aesthetic for Comparative Genomics.” Genome 947 Research 19 (9): 1639–45. doi:10.1101/gr.092759.109. 948
949 Kuhrt, D, and D M Wojchowski. 2015. “Emerging EPO and EPO Receptor Regulators and 950
Signal Transducers.” Blood. doi:10.1182/blood-2014-11. 951

Villarino et al.[Type the document title] 30 Langmead, Ben, Cole Trapnell, Mihai Pop, and Steven L Salzberg. 2009. “Ultrafast and 952
Memory-Efficient Alignment of Short DNA Sequences to the Human Genome..” Genome 953 Biology 10 (3): R25. doi:10.1186/gb-2009-10-3-r25. 954
955 Laurence, Arian, Cristina M Tato, Todd S Davidson, Yuka Kanno, Zhi Chen, Zhengju Yao, 956
Rebecca B Blank, et al. 2007. “Interleukin-2 Signaling via STAT5 Constrains T Helper 17 957 Cell Generation.” Immunity 26 (3): 371–81. doi:10.1016/j.immuni.2007.02.009. 958
959 Lenardo, Michael J. 1991. “Interleukin-2 Programs Mouse Alpha Beta T Lymphocytes for 960
Apoptosis..” Nature 353 (6347): 858–61. doi:10.1038/353858a0. 961 962 Liao, Wei, Dustin E Schones, Jangsuk Oh, Yongzhi Cui, Kairong Cui, Tae-Young Roh, Keji 963
Zhao, and Warren J Leonard. 2008. “Priming for T Helper Type 2 Differentiation by 964 Interleukin 2–Mediated Induction of Interleukin 4 Receptor Α-Chain Expression.” Nature 965 Immunology 9 (11): 1288–96. doi:10.1038/ni.1656. 966
967 Liao, Wei, Jian-Xin Lin, Lu Wang, Peng Li, and Warren J Leonard. 2011. “Modulation of 968
Cytokine Receptors by IL-2 Broadly Regulates Differentiation Into Helper T Cell Lineages.” 969 Nature Immunology 12 (6): 551–59. doi:10.1038/ni.2030. 970
971 Liao, Wei, Rosanne Spolski, Peng Li, Ning Du, Erin E West, Min Ren, Suman Mitra, and Warren 972
J Leonard. 2014. “Opposing Actions of IL-2 and IL-21 on Th9 Differentiation Correlate with 973 Their Differential Regulation of BCL6 Expression..” Proceedings of the National Academy of 974 Sciences 111 (9): 3508–13. doi:10.1073/pnas.1301138111. 975
976 Liongue, Clifford, Lynda A O'Sullivan, Monique C Trengove, and Alister C Ward. 2012. 977
“Evolution of JAK-STAT Pathway Components: Mechanisms and Role in Immune System 978 Development.” Edited by Shree Ram Singh. PLoS ONE 7 (3): e32777. 979 doi:10.1371/journal.pone.0032777.s008. 980
981 Liu, X, G W Robinson, F Gouilleux, B Groner, and Lothar Hennighausen. 1995. “Cloning and 982
Expression of Stat5 and an Additional Homologue (Stat5b) Involved in Prolactin Signal 983 Transduction in Mouse Mammary Tissue..” Proceedings of the National Academy of 984 Sciences of the United States of America 92 (19): 8831–35. doi:10.1128/AEM.00326-09. 985
986 Liu, X, G W Robinson, K U Wagner, L Garrett, A Wynshaw-Boris, and Lothar Hennighausen. 987
1997. “Stat5a Is Mandatory for Adult Mammary Gland Development and Lactogenesis.” 988 Genes & Development 11 (2): 179–86. 989
990 Lohse, M, A M Bolger, A Nagel, A R Fernie, J E Lunn, M Stitt, and B Usadel. 2012. “RobiNA: a 991
User-Friendly, Integrated Software Solution for RNA-Seq-Based Transcriptomics.” Nucleic 992 Acids Research 40 (W1): W622–27. doi:10.1093/nar/gks540. 993
994 Mahmud, Shawn A, Luke S Manlove, and Michael A Farrar. 2013. “Interleukin-2 and STAT5 in 995
Regulatory T Cell Development and Function..” Jak-Stat 2 (1): e23154. 996

Villarino et al.[Type the document title] 31 Malek, Thomas R, and Iris Castro. 2010. “Interleukin-2 Receptor Signaling: at the Interface 997
Between Tolerance and Immunity.” Immunity 33 (2). Elsevier Inc.: 153–65. 998 doi:10.1016/j.immuni.2010.08.004. 999
1000 Meinke, A, F Barahmand-Pour, S Wöhrl, D Stoiber, and T Decker. 1996. “Activation of 1001
Different Stat5 Isoforms Contributes to Cell-Type-Restricted Signaling in Response to 1002 Interferons..” Molecular and Cellular Biology 16 (12): 6937–44. 1003
1004 Metser, Gil, Ha Youn Shin, Chaochen Wang, Kyung Hyun Yoo, Sumin Oh, Alejandro V Villarino, 1005
John J O'Shea, Keunsoo Kang, and Lothar Hennighausen. 2016. “An Autoregulatory 1006 Enhancer Controls Mammary-Specific STAT5 Functions..” Nucleic Acids Research 44 (3): 1007 1052–63. doi:10.1093/nar/gkv999. 1008
1009 Moriggl, R, D J Topham, S Teglund, V Sexl, C McKay, D Wang, A Hoffmeyer, et al. 1999. “Stat5 1010
Is Required for IL-2-Induced Cell Cycle Progression of Peripheral T Cells..” Immunity 10 (2): 1011 249–59. 1012
1013 Moriggl, R, V Sexl, R Piekorz, D Topham, and James N Ihle. 1999. “Stat5 Activation Is Uniquely 1014
Associated with Cytokine Signaling in Peripheral T Cells..” Immunity 11 (2): 225–30. 1015 1016 Nivarthi, Harini, Michaela Prchal-Murphy, Alexander Swoboda, Matthias Hager, Michaela 1017
Schlederer, Lukas Kenner, Jan Tuckermann, Veronika Sexl, R Moriggl, and Olga 1018 Ermakova. 2014. “Stat5 Gene Dosage in T Cells Modulates CD8(+) T Cell Homeostasis and 1019 Attenuates Contact Hypersensitivity Response in Mice..” Allergy, October. 1020 doi:10.1111/all.12535. 1021
1022 Oestreich, Kenneth J, Sarah E Mohn, and Amy S Weinmann. 2012. “Molecular Mechanisms 1023
That Control the Expression and Activity of Bcl-6 in TH1 Cells to Regulate Flexibility with a 1024 TFH-Like Gene Profile.” Nature Immunology 13 (4): 405–11. doi:10.1038/ni.2242. 1025
1026 Pandiyan, Pushpa, Lixin Zheng, Satoru Ishihara, Jennifer Reed, and Michael J Lenardo. 2007. 1027
“CD4+CD25+Foxp3+ Regulatory T Cells Induce Cytokine Deprivation–Mediated Apoptosis 1028 of Effector CD4+ T Cells.” Nature Immunology 8 (12): 1353–62. doi:10.1038/ni1536. 1029
1030 Ramirez, F, F Dundar, S Diehl, B A Gruning, and T Manke. 2014. “deepTools: a Flexible 1031
Platform for Exploring Deep-Sequencing Data.” Nucleic Acids Research 42 (W1): W187–91. 1032 doi:10.1093/nar/gku365. 1033
1034 Robinson, M D, D J McCarthy, and G K Smyth. 2009. “edgeR: a Bioconductor Package for 1035
Differential Expression Analysis of Digital Gene Expression Data.” Bioinformatics 26 (1): 1036 139–40. doi:10.1093/bioinformatics/btp616. 1037
1038 Rochman, Yrina, Rosanne Spolski, and Warren J Leonard. 2009. “New Insights Into the 1039
Regulation of T Cells by Γc Family Cytokines.” Nature Reviews Immunology 9 (7). Nature 1040 Publishing Group: 480–90. doi:10.1038/nri2580. 1041
1042 Rosen, R L, K D Winestock, G Chen, X Liu, Lothar Hennighausen, and D S Finbloom. 1996. 1043
“Granulocyte-Macrophage Colony-Stimulating Factor Preferentially Activates the 94-kD 1044 STAT5A and an 80-kD STAT5A Isoform in Human Peripheral Blood Monocytes..” Blood 88 1045 (4): 1206–14. 1046

Villarino et al.[Type the document title] 32 Snow, J W, N Abraham, M C Ma, B G Herndier, A W Pastuszak, and M A Goldsmith. 2003. 1047
“Loss of Tolerance and Autoimmunity Affecting Multiple Organs in STAT5A/5B-Deficient 1048 Mice.” Journal of Immunology 171 (10): 5042–50. doi:10.4049/jimmunol.171.10.5042. 1049
1050 Socolovsky, M, A E Fallon, S Wang, C Brugnara, and H F Lodish. 1999. “Fetal Anemia and 1051
Apoptosis of Red Cell Progenitors in Stat5a-/-5b-/- Mice: a Direct Role for Stat5 in Bcl-X(L) 1052 Induction..” Cell 98 (2): 181–91. 1053
1054 Soldaini, E, S John, S Moro, J Bollenbacher, U Schindler, and Warren J Leonard. 1999. “DNA 1055
Binding Site Selection of Dimeric and Tetrameric Stat5 Proteins Reveals a Large Repertoire 1056 of Divergent Tetrameric Stat5a Binding Sites..” Molecular and Cellular Biology 20 (1): 389–1057 401. doi:10.1128/MCB.20.1.389-401.2000. 1058
1059 Stark, George R, and James E Darnell Jr. 2012. “The JAK-STAT Pathway at Twenty..” Immunity 1060
36 (4): 503–14. doi:10.1016/j.immuni.2012.03.013. 1061 1062 Storey, J D. 2003. “The Positive False Discovery Rate: a Bayesian Interpretation and the Q-1063
Value.” Annals of Statistics. 1064 1065 Subramanian, Aravind, Pablo Tamayo, Vamsi K Mootha, Sayan Mukherjee, Benjamin L Ebert, 1066
Michael A Gillette, Amanda Paulovich, et al. 2005. “Gene Set Enrichment Analysis: a 1067 Knowledge-Based Approach for Interpreting Genome-Wide Expression Profiles..” 1068 Proceedings of the National Academy of Sciences of the United States of America 102 (43): 1069 15545–50. doi:10.1073/pnas.0506580102. 1070
1071 Teglund, S, C McKay, E Schuetz, J M van Deursen, D Stravopodis, D Wang, M Brown, S 1072
Bodner, G Grosveld, and James N Ihle. 1998. “Stat5a and Stat5b Proteins Have Essential 1073 and Nonessential, or Redundant, Roles in Cytokine Responses.” Cell 93 (5): 841–50. 1074
1075 Udy, G B, R P Towers, R G Snell, R J Wilkins, S H Park, P A Ram, D J Waxman, and H W 1076
Davey. 1997. “Requirement of STAT5b for Sexual Dimorphism of Body Growth Rates and 1077 Liver Gene Expression..” Proceedings of the National Academy of Sciences of the United 1078 States of America 94 (14): 7239–44. 1079
1080 Villarino, Alejandro V, C M Tato, J S Stumhofer, Z Yao, Y K Cui, Lothar Hennighausen, John J 1081
O'Shea, and Christopher A Hunter. 2007. “Helper T Cell IL-2 Production Is Limited by 1082 Negative Feedback and STAT-Dependent Cytokine Signals.” Journal of Experimental 1083 Medicine 204 (1): 65–71. doi:10.1084/jem.20061198. 1084
1085 Villarino, Alejandro V, Yuka Kanno, John R Ferdinand, and John J O'Shea. 2015. “Mechanisms 1086
of Jak/STAT Signaling in Immunity and Disease..” Journal of Immunology 194 (1): 21–27. 1087 doi:10.4049/jimmunol.1401867. 1088
1089 Wang, Yaming, and David E Levy. 2012. “Comparative Evolutionary Genomics of the STAT 1090
Family of Transcription Factors..” Jak-Stat 1 (1): 23–33. doi:10.4161/jkst.19418. 1091 1092 Warden, Charles D, Yate-Ching Yuan, and Xiwei Wu. 2013. “Optimal Calculation of RNA-Seq 1093
Fold-Change Values.” International Journal of Computational Bioinformatics and in Silico 1094 Modeling 10. 1095

Villarino et al.[Type the document title] 33 Yamaji, D, K Kang, G W Robinson, and Lothar Hennighausen. 2013. “Sequential Activation of 1096
Genetic Programs in Mouse Mammary Epithelium During Pregnancy Depends on 1097 STAT5A/B Concentration.” Nucleic Acids Research 41 (3): 1622–36. 1098 doi:10.1093/nar/gks1310. 1099
1100 Yamaoka, K. 2005. “Jak3 Negatively Regulates Dendritic-Cell Cytokine Production and 1101
Survival.” Blood 106 (9): 3227–33. doi:10.1182/blood-2005-02-0769. 1102 1103 Yao, Z, Y Kanno, M Kerenyi, G Stephens, L Durant, W T Watford, Arian Laurence, et al. 2007. 1104
“Nonredundant Roles for Stat5a/B in Directly Regulating Foxp3.” Blood 109 (10): 4368–75. 1105 doi:10.1182/blood-2006-11-055756. 1106
1107 Yao, Zhengju, Yongzhi Cui, Wendy T Watford, Jay H Bream, Kunihiro Yamaoka, Bruce D 1108
Hissong, Denise Li, et al. 2006. “Stat5a/B Are Essential for Normal Lymphoid Development 1109 and Differentiation..” Proceedings of the National Academy of Sciences of the United States 1110 of America 103 (4): 1000–1005. doi:10.1073/pnas.0507350103. 1111
1112 Yue, Feng, Yong Cheng, Alessandra Breschi, Jeff Vierstra, Weisheng Wu, Tyrone Ryba, 1113
Richard Sandstrom, et al. 2014. “A Comparative Encyclopedia of DNA Elements in the 1114 Mouse Genome..” Nature 515 (7527). Nature Publishing Group: 355–64. 1115 doi:10.1038/nature13992. 1116
1117 Zhang, Qian, Hong Y Wang, Xiaobin Liu, and Mariusz A Wasik. 2007. “STAT5A Is 1118
Epigenetically Silenced by the Tyrosine Kinase NPM1-ALK and Acts as a Tumor 1119 Suppressor by Reciprocally Inhibiting NPM1-ALK Expression.” Nature Medicine 13 (11): 1120 1341–48. doi:10.1038/nm1659. 1121
1122 Zhang, S, S Fukuda, Y Lee, G Hangoc, S Cooper, R Spolski, Warren J Leonard, and H E 1123
Broxmeyer. 2000. “Essential Role of Signal Transducer and Activator of Transcription 1124 (Stat)5a but Not Stat5b for Flt3-Dependent Signaling..” Journal of Experimental Medicine 1125 192 (5): 719–28. 1126
1127 Zhang, Y, E V Laz, and D J Waxman. 2012. “Dynamic, Sex-Differential STAT5 and BCL6 1128
Binding to Sex-Biased, Growth Hormone-Regulated Genes in Adult Mouse Liver.” Molecular 1129 and Cellular Biology 32 (4): 880–96. doi:10.1128/MCB.06312-11. 1130
1131 Zhang, Yong, Tao Liu, Clifford A Meyer, Jérôme Eeckhoute, David S Johnson, Bradley E 1132
Bernstein, Chad Nussbaum, et al. 2008. “Model-Based Analysis of ChIP-Seq (MACS).” 1133 Genome Biology 9 (9): R137. doi:10.1186/gb-2008-9-9-r137. 1134
1135 Zhu, B m, K Kang, J H Yu, W Chen, H E Smith, D Lee, H W Sun, L Wei, and Lothar 1136
Hennighausen. 2012. “Genome-Wide Analyses Reveal the Extent of Opportunistic STAT5 1137 Binding That Does Not Yield Transcriptional Activation of Neighboring Genes.” Nucleic 1138 Acids Research 40 (10): 4461–72. doi:10.1093/nar/gks056. 1139
1140 Zhu, Jinfang, J Cote-Sierra, L Guo, and W E Paul. 2003. “Stat5 Activation Plays a Critical Role 1141 in Th2 Differentiation.” Immunity 19 (5): 739–48. 1142

Villarino et al.[Type the document title] 34 Figure Legends 1143
1144
Figure 1. Stat5b is required for immunological tolerance. (A) Cartoon depicts the mutant mice 1145
used in this study. Genotypes are grouped according to total Stat5 alleles. (B) Bar graphs show 1146
averaged RBC, hematocrit and WBC counts. (C) Scatter plot shows kidney pathology scores. 1147
(D) Scatter plot shows urinary albumin/creatinine protein ratios. (E) Bar graph shows ELISA 1148
measurements (O.D.) for anti-double stranded DNA antibodies in serum. (F) Micrographs show 1149
representative H & E kidney sections (40X magnification). (B-E) Number of Stat5a, Stat5b and 1150
total Stat5 alleles (i.e. genotype) is explained in the key below each graph. Data are compiled 1151
from 3-5 mice per genotype. Error bars indicate standard deviation. 1152
1153
Figure 2. Impact of STAT5 paralog deficiency on B and T cells. (A) Bar graphs show averaged 1154
cell counts for spleens (top row) and lymph nodes (bottom row). Error bars indicate standard 1155
deviation. (B) Percentages of CD4+ T cells (CD3+ CD4+ CD8α-), CD8+ T cells (CD3+ CD4- 1156
CD8α+) and B cells (CD3- B220+) were measured in spleens (top row) and LNs (bottom row). 1157
Box plots show log2 fold changes relative to wild type controls (WT=0; not shown). Dotted red 1158
lines indicate two-fold changes. (A-B) Number of Stat5a, Stat5b and total Stat5 alleles is 1159
explained in the key below each graph. Data are compiled from 5 experiments. (C) Contour 1160
plots show percentages of GL7+ Fas+ germinal center B cells in lymph nodes. Scatter plot shows 1161
percentages of LN resident GC B cells compiled from 3 experiments (3-4 mice per group). 1162
Genotypes are ordered as in Figure 1E (WT mice = white, one-allele Stat5a-deficient mice = 1163
blue, one-allele Stat5b-deficient mice = orange). 1164
1165
Figure 3. Aberrant effector T cell responses in the absence of Stat5b. (A) Contour plots show 1166
percentages of CD44low IL-7R+naive and CD44high effector/memory CD4+ T cells in the spleens 1167
of 8 week-old mice. (B) Scatter plots show percentages of naive CD4+ T cells in spleens (left) 1168
and lymph nodes (right). Genotypes are ordered as in Figure 1C. (C) Contour plots show 1169
percentages of IFN-ɣ+ or IL-17+ CD4+ T cells in the spleens of 8 week-old mice. (D) Box plots 1170
show log2 fold changes for IFN-ɣ+ and IL-17+ cells relative to wild type controls (WT=0; not 1171
shown). (E) Contour plots show percentages of PD1+ CXCR5high Tfh cells in the spleens of 8 1172
week-old mice. (F) Box plots show log2 fold changes for Tfh cells in spleens (left) and LNs 1173
(right) relative to wild type controls (WT=0; not shown). (D & F) Genotypes are ordered as in 1174
Figure 1D. Data are compiled from 4 experiments (3-6 mice/group). Dotted red lines indicate 1175
two-fold changes. 1176
1177

Villarino et al.[Type the document title] 35 Figure 4. T regulatory cell function is impaired in Stat5b-deficient mice. (A) Contour plots show 1178
percentages of IL-2Rα+ cells within the FOXP3+ Treg compartment in spleens of 8 week-old 1179
mice. (B) Box plots show log2 fold changes in the ratio of IL-2Rα+/IL-2Rα- Treg (WT=0; not 1180
shown). LN (top) and spleen (bottom) data are compiled from 5 experiments (4-6 mice/group) 1181
and genotypes ordered as in Figure 1D. (C) IL-2Rα+ Treg cells from WT and Stat5a- or Stat5b-1182
deficient mice were used for in vitro suppression assays. Histograms show CFSE dilution of 1183
responder T cells. (D) Line graph shows percent suppression across a range of responder:Treg 1184
ratios. Baseline is set according to WT controls at a 1:1 ratio. Data are compiled from 3 1185
experiments. (E) Line graph shows the percent Treg cells that remained IL-2Rα+ during in vitro 1186
suppression. (F) IL-2Rα+ Treg cells were cultured with IL-2 for 72 hours. Contour plots show the 1187
percentage of FOXP3+ Treg cells expressing TBX21 (top) or IL-2 (bottom). (G) Box plots show 1188
log2 fold changes for TBX21+, FOXP3+ and IL-2+ cells relative to wild type controls (WT=0; not 1189
shown). Data are compiled from 3 experiments. Dotted red lines indicate two-fold changes. 1190
1191
Figure 5. Defective iTreg differentiation in the absence of Stat5b. (A) Naive CD4+ T cells were 1192
cultured under iTreg-inducing conditions. Contour plots show percentages of FOXP3+ and IL-2+ 1193
cells. (B) Box plots show log2 fold changes for FOXP3+ and IL-2+ cells relative to wild type 1194
controls (WT=0; not shown). Data are compiled from 3 experiments and genotypes ordered as 1195
in Figure 1D (C) Naive T cells from one-allele Stat5a- or Stat5b-deficient mice were cultured as 1196
in (A) and processed for RNA-seq. GSEA plots show enrichment of Treg signature genes within 1197
the Stat5a-deficient (top) or Stat5b-deficient (bottom) datasets relative to WT controls. (D) Heat 1198
map shows a selection of STAT5-regulated, Treg signature transcripts. Data are presented as 1199
log2 fold changes relative to WT controls (not shown). RNA-seq analyses are compiled from 2 1200
biological replicates per genotype. 1201
1202
Figure 6. Redundancy and specificity of STAT5 paralogs for gene transcription. (A) Cartoons 1203
depict the cell types and experimental conditions used for RNA-seq. (B) Histograms show 1204
STAT5 paralog preference for all STAT5-regulated transcripts. Those which were more 1205
influenced by the loss of Stat5a are positioned to the left (X<0) while those that were more 1206
influenced by the loss of Stat5b are positioned to the right (X>0). Dotted red lines denote 1207
equivalence (X=0) and numbers indicate median paralog preference. (C) Pie charts depict 1208
paralog specific transcripts. Those impacted only in Stat5a-deficient cells are indicated in blue, 1209
those impacted only in Stat5b-deficient cells are indicated in orange and those impacted in both 1210
genotypes are indicated in black. (D) Heat maps show a selection of STAT5-regulated 1211

Villarino et al.[Type the document title] 36 transcripts. Data are presented as the log2 fold change relative to WT controls (not shown). (E) 1212
IL-2Rα protein was measured in T cells treated with IL-2 (left) or IL-6 (right). Box plots show 1213
log2 fold changes for mean fluorescence intensity relative to wild type controls (WT=0; not 1214
shown). Genotypes are ordered as in Figure 1D. Dotted red lines indicate a two-fold change. (A-1215
D) RNA-seq analyses are compiled from 2-3 biological replicates per genotype. 1216
1217
Figure 7. Influence of paralog dose on genomic distribution of STAT5. (A) CD4+ T cells from 1218
WT, Stat5a/bhet and two-allele Stat5a- or Stat5b-deficient mice were cultured in the presence of 1219
IL-2, then processed for pan-STAT5 ChIP-seq. Bar graph shows the total number of STAT5-1220
bound peaks in each genotype. (B) Histogram shows distribution of STAT5-bound peaks 1221
relative to transcriptional start sites (TSS). (C) Circos plot shows overlap of STAT5-bound beaks 1222
across genotypes. Connection width represents the number of overlapping peaks. Only peaks 1223
shared with WT cells are shown. Those found only in WT cells are presented as a white semi-1224
circle at the top. (D) Bar graph shows the percentage of WT peaks detected in each genotype 1225
(WT=100%). Violin plot depicts the total number of sequenced tags (i.e. peak intensity) for peak 1226
shared with WT controls. (E) Genome browser tracks show STAT5 peaks near selected genes. 1227
Numbers indicate the maximum peak height within the interval. (A-E) Data are representative of 1228
two biological replicates. 1229
1230
Figure 8. Preservation of high affinity targets in the absence of STAT5B. 1231
Circle plot relates STAT5 occupancy and STAT5-dependent transcription for genes bound in: 1232
(1) only WT cells (white circle), (2) WT and Stat5a/bhet, cells (grey circle), (3) WT, Stat5a/bhet, 1233
and Stat5a-/- cells (blue circle), (4) WT, Stat5a/bhet, Stat5a-/- and Stat5b-/- cells (orange circle). 1234
STAT5 ChIP-seq peaks were assigned to genes based on proximity to transcriptional start sites 1235
(+/- 10 kb). X axis denotes the average height of gene-associated peaks in WT cells. Y axis 1236
denotes the average mRNA expression variance (-log10 p value) for the corresponding peak-1237
associated genes. Variance is derived from the comparison WT and one-allele Stat5a- or 1238
Stat5b-deficient cells cultured in the presence of IL-2 (from Figure 6). Size of each circle 1239
represents the total number of gene-associated peaks in each group (number is shown). 1240
1241
Figure 9. Relative abundance of STAT5A and STAT5B in helper T cells. (A) Total STAT5 1242
protein was measured in naive, Treg, Tfh and effector/memory T cells. Donut charts indicate the 1243
percentage of total STAT5 protein accounted for by each paralog. Histograms show 1244
representative flow cytometry data from one of three experiments. (B) Naive, Treg and 1245

Villarino et al.[Type the document title] 37 effector/memory T cells were treated with IL-2 or IL-7 and phospho-STAT5 measured by flow 1246
cytometry. Box plots show log2 fold changes for the percentage of p-STAT5high cells relative to 1247
wild type controls (WT=0; not shown). Genotypes are ordered as in Figure 1D. Dotted red lines 1248
indicate a two-fold change (3-4 replicates/group). 1249
1250
Figure 10. Paralog dose governs STAT5-driven gene transcription. (A) CD4+ T cells from one-1251
allele Stat5b-deficient mice were transduced with STAT5A retrovirus, then processed for RNA-1252
seq. Contour plots (left) show correlation between the transduction marker (hNGFR) and IL-2Rα 1253
protein. Volcano plot (middle) shows log2 fold changes and variances for all transcripts relative 1254
to control retrovirus. Those exhibiting >1.5 fold change and p<0.05 are depicted in blue. Dotted 1255
red lines indicate 2 fold change and 0.05 p value. Histogram (right) shows STAT5 paralog 1256
preference for transcripts mobilized by ectopic STAT5A. Dotted red line denotes equivalence 1257
and number indicates median paralog preference. (B) Heat map shows selected transcripts in 1258
STAT5A-transduced helper T cells (top row) or IL-2 treated Stat5a- or Stat5b-deficient cells 1259
(bottom rows; from Figure 6). Data are presented as the log2 fold change relative to controls 1260
(not shown). (C) GSEA plots show enrichment of STAT5A-dependent (left) or STAT5B-1261
dependent (right) genes within the STAT5A-RV dataset. (A-C). RNA-seq analysis is compiled 1262
from 2 biological replicates. (D) CD4+ T cells from WT, Stat5a/bhet and one-allele Stat5b-1263
deficient mice were transduced with control (top row) or STAT5A (bottom row) retrovirus under 1264
iTreg polarizing conditions. Contour plots show total STAT5 and FOXP3 protein levels in 1265
transduced cells. (E) Histograms denote IL-2Rα protein levels on transduced cells. (D-E) Shown 1266
is one of two independent experiments. 1267
1268

Villarino et al.[Type the document title] 38 Figure Supplement Legends 1269
1270
Figure 3-figure supplement 1. Impact of Stat5 allele depletion on effector T cell responses. (A) 1271
Contour plots show percentages of CD44low IL-7R+ naive and CD44high effector/memory CD4+ T 1272
cells. (B) Contour plots show percentages of PD1+ CXCR5high T follicular helper cells. (A & B) 1273
Data are from spleens of 8 week-old mice and are representative of 4-5 experiments. 1274
1275
Figure 4-figure supplement 1. Impact of Stat5 allele depletion on Treg cells. 1276
Bar graphs show total numbers of Treg cells in spleens and LNs of 8 week old mice (4-6 mice 1277
per genotype). Number of Stat5a, Stat5b and total Stat5 alleles (i.e. genotype) is explained in 1278
the key below each graph. Error bars indicate standard deviation. 1279
1280
Figure 6-figure supplement 1. Transcriptomic analysis of Stat5a- and Stat5b-deficient T cells. 1281
(A) Cartoons depict the experimental conditions used for RNA-seq. CD4+ T cells were purified 1282
from WT and one-allele Stat5a- or Stat5b-deficient mice, then transcriptomes measured either 1283
directly ex vivo or after in vitro treatment with acute STAT5 stimuli. The ex vivo set included 1284
naive cells (first row) and IL-2Rα+ Treg cells (second row), while the in vitro set included naive 1285
cells exposed to IL-7 (third row) and effector cells exposed to IL-2 (fourth row). (B) 1286
Multidimensional scaling (MDS) plots show the overall relatedness between experimental 1287
groups. Each biological replicate is represented by black (WT), blue (Stat5a-deficient) or orange 1288
(Stat5b-deficient) elements. (C) Volcano plots show fold changes and variances for all 1289
transcripts relative to WT controls. Those exhibiting >1.5 fold change and p<0.05 are 1290
highlighted. Numbers indicate the sum of transcripts that were down-regulated (upper left) or 1291
up-regulated (upper right) in Stat5a- or Stat5b-deficient cells. Dotted red lines are drawn at 2 1292
fold changes and 0.05 p values. (D) Venn diagrams indicate the number of transcripts exhibiting 1293
>1.5 fold change and <0.05 p values only in Stat5a-deficient cells (blue), only in Stat5b-deficient 1294
cells (orange) or in both genotypes (black). (E) XY plots show log2 fold change for STAT5-1295
regulated genes in Stat5a-deficient (x axis) versus Stat5b-deficient (y axis) cells. Blue and 1296
orange elements represent transcripts designated as STAT5A- or STAT5B-specific, 1297
respectively. Dotted red lines are drawn at 1.5 fold changes. (A-E) Analyses are compiled from 1298
2-3 biological replicates per genotype. 1299

Villarino et al.[Type the document title] 39 Figure 6-figure supplement 2. Transcriptomic analysis of Stat5a- and Stat5b-deficient T cells. 1300
Genome browser tracks show transcript abundance in WT (grey), Stat5a-deficient (blue) or 1301
Stat5b-deficient (orange) cells. Vertical RPKM scale varies from gene to gene (but not across 1302
experimental conditions) and is denoted by the numbers at the upper left of each column. 1303
Shown is one of 2-3 biological replicates per genotype. 1304
1305
Figure 7-figure supplement 1. Transcription factor motifs associated with STAT5 binding 1306
peaks. 1307
CD4+ T cells were isolated from WT, Stat5a/bhet and two-allele Stat5a- or Stat5b-deficient mice, 1308
then cultured in the presence of IL-2 and processed for ChIP-seq. Chart shows the top ten 1309
transcription factor binding motifs associated with STAT5 peaks in each genotype. p Values and 1310
enrichment (% STAT5 peaks with indicated motif ÷ % random peaks with indicated motif) are 1311
shown for one of two biological replicates. 1312
1313
Figure 7-figure supplement 2. Correlation between STAT5 binding and transcription of Il2ra, 1314
Bcl2 and Bcl6. 1315
(A) Effector CD4+ T cells from one-allele Stat5a- or Stat5b-deficient mice were cultured in the 1316
presence of IL-2 and processed for RNA-seq. (B) Effector CD4+ T cells from one-allele Stat5b-1317
deficient mice were transduced with control or STAT5A-expressing retrovirus and processed for 1318
RNA-seq. (C) Effector CD4+ T cells from WT, Stat5a/bhet and two-allele Stat5a- or Stat5b-1319
deficient mice were cultured in the presence of IL-2 and processed for ChIP-seq. (A-C) Genome 1320
browser tracks show transcript abundance or STAT5 binding for selected genes. Numbers 1321
indicate either RPKM values for the most detected exon (RNA-seq) or maximum STAT5 binding 1322
peak intensity within the interval (ChIP-seq). Shown is one of two biological replicates for each 1323
genotype and/or experimental condition. 1324
1325
Figure 9 (Figure Supplement 1). Relative abundance of STAT5A and STAT5B in helper T 1326
cells. (A) Donut charts indicate the percentage total STAT5 mRNA (top) or protein (bottom) 1327
accounted for by each paralog in ex vivo naive or Treg cells. mRNA data are compiled from 2-3 1328
RNA-seq replicates and protein data are compiled from 3 flow cytometry replicates (B) Donut 1329
charts indicate the percentage total STAT5 mRNA accounted for by each paralog in mouse 1330
naive or Treg cells. Data were sourced from the Immunological Genome Project (top) or the 1331
EMBL-EBI Expression Atlas (bottom). (C) Donut charts indicate the percentage total STAT5 1332
mRNA accounted for by each paralog in human naive or Treg cells. Data were sourced from the 1333

Villarino et al.[Type the document title] 40 BioGPS Primary Cell Atlas. 1334
1335

Villarino et al.[Type the document title] 41 Figure 9-figure supplement 2. Stat5a and Stat5b are transcribed from opposite DNA strands. 1336
Genome browser tracks show relative abundance and DNA strand origin of Stat5a and Stat5b 1337
mRNAs within mouse spleen, thymus and mammary gland. Transcripts originating from the 1338
minus (-) strand are presented in the ascending orientation while those from the plus (+) strand 1339
are in the descending orientation. Numbers indicate RNA-seq FPKM values for the most 1340
detected exon within the interval. Data are sourced from the ENCODE consortium and one of 2 1341
biological replicates visualized using the UCSC genome browser. 1342
1343
Figure 9-figure supplement 3. Putative lymphocyte-restricted enhancers within the Stat5a/b 1344
locus. 1345
Genome browser tracks display DNAse I hypersensitivity sites (DHS) within the mouse Stat5a/b 1346
locus. Shown are data for primary CD4+ T cells (naive, activated, Treg), as well as spleen, 1347
thymus and multiple non-lymphoid tissues. 3 putative lymphoid-specific DHS sites are 1348
highlighted. Numbers indicate maximum tag count for all DHS sites within the interval. Data are 1349
sourced from the ENCODE consortium and one of 2 biological replicates visualized using the 1350
UCSC genome browser. 1351
1352
Figure 10-figure supplement 1. STAT5 paralog dose tips the balance between effector and 1353
regulatory T cell programs. CD4+ T cells from WT, Stat5a/bhet and one-allele Stat5b-deficient 1354
mice were were transduced with control or STAT5A retrovirus under (A) non-polarizing or (B) 1355
Th17-polarizing conditions. Contour plots denote FOXP3 and IL-17A protein levels in 1356
transduced cells. Shown is one of two independent experiments. 1357

Villarino et al.[Type the document title] 42 Supplementary File Legends 1358
1359
Supplementary File 1. Read depth for sequencing experiments. Spreadsheet reports QC-1360
passing reads for all RNA-seq and ChIP-seq experiments. 1361
1362
Supplementary File 2. RPKM values for transcriptome analysis of STAT5-deficient CD4+ T 1363
cells. Spreadsheet includes RPKM values for all experimental groups and biological replicates. 1364
1365
Supplementary File 3. Paralog preference calculations for STAT5-deficient CD4+ T cells. 1366
Spreadsheet includes paralog preference calculations for all relevant cell types and 1367
experimental conditions. 1368
1369
Supplementary File 4. STAT5 paralog-specific genes. Spreadsheet lists STAT5 paralog-1370
specific genes for all relevant cell types and experimental conditions. 1371