King Fahd Bin Abdulaziz - OPEC...As this issue of the OPEC Bulletin was about to be published, it...
67
Transcript of King Fahd Bin Abdulaziz - OPEC...As this issue of the OPEC Bulletin was about to be published, it...


As this issue of the OPEC Bulletin was about to be published, it was announced that Saudi Arabia’s King Fahd Bin Abdulaziz had died. He was born in 1923, the son of King Abdulaziz Al-Saud and died on August 1. Here follows an official statement from the Saudi Ministry of Foreign Affairs received from the Royal Court: “With all sorrow and sadness, the Royal Court in the name of Crown Prince Abdullah Bin Abdulaziz, the Deputy Premier and Commander of the National Guard and all members of the Royal Family and on behalf of the nation announces the death of the Custodian of the two Holy Mosques King Fahd bin Abdulaziz.” A further Ministry statement added: “In line with the fifth article of the basic rule system, members of the Royal Family pledged allegiance to Crown Prince Abdullah Bin Abdulaziz as the King of the Kingdom of Saudi Arabia.” King Fahd was the son of King Abdulaziz and became King of the Kingdom of Saudi Arabia on June 13, 1982, following the death of King Khalid. He was Minister of Education in 1953, Minister of Interior in 1962 and from 1967 Second Deputy Premier when he also started to chair cabinet meet-ings. He became Crown Prince and First Deputy Prime Minister on March 25, 1975. He headed the following councils and commis-sions: The Cabinet, The National Security Council, The Supreme Petroleum Council, The Council of Higher Education and Universities, The Royal Commission for Jubail and Yanbu, The Supreme Youth Welfare Council, The Higher Commission for the Educational Policy, The Royal Commission for the Development of Madinah, The Higher Commission for King Abdulaziz City for Sciences and Technology. He was Head of the Council of the Royal Family and The Supreme Commander of the Armed Forces.
King Fahd Bin Abdulaziz1923–2005
Reu
ters

Co
mm
en
tary
The issue of downstream bottlenecks is very topical in
the oil market at present and the direct impact this is having on
industries and sectors that rely heavily on products to conduct
their businesses is demonstrated in this issue of the OPEC Bul-
letin on page 10.
Here, the head of the International Road Transport Union
(IRU) explains how high product prices are undermining opera-
tions for his members who are already subject to high levels of
government taxation. As every driver knows, filling up your car
can be an expensive business, but for road transportation com-
panies, the costs of filling up fleets of lorries every day can be
excessive.
The IRU believes that its members are being unfairly penal-
ized by government fuel taxation policies. With road transportation
mainly centered in consuming countries, the IRU says that many
governments in these countries are not assuming their respon-
sibilities with regard to transportation policy and thus affecting
wider economic development. The future of the road transport
sector is key to overall economic growth as it accounts for the
transportation of 95 per cent of all goods around the world.
The IRU-OPEC meeting in Vienna is in line with the Organiza-
tion’s promotion of institutional co-operation with major stake-
holders in the oil industry, including, of course, key consumers.
A Taxing Issue Win-Win Technology
Environmental issues are also covered in this edition
(see page 14), namely, carbon dioxide (CO2) capture and stor-
age, whereby CO2 is captured from stationary sources such as
power plants and injected into geologic formations for long-term
storage.
This is now viewed as one of the most promising technologies
to reduce CO2 emissions and, excitingly, the storage of CO
2 in de-
pleting oil reservoirs could increase reserves through enhanced
or improved oil recovery processes.
As this article explains, this technology represents a ‘win-
win’ situation — offering the possibility to reduce a significant
amount of emissions but at the same time to exploit oil reserves
that would otherwise not be easy to access. OPEC is very inter-
ested in this technology for the obvious benefits it offers.
In today’s world, oil must be cleaner, safer and more efficient
than ever before. This means the focus must be on new technology.
It is hoped that research now underway into CO2 capture and its
application for enhanced oil recovery will make it commercially
viable on a widespread basis.
Technology will help expand sources of oil supply, reduce
costs, improve oil-use efficiency and satisfy beneficial environ-
ment requirements. OPEC supports all efforts in this import-
ant area.
Reu
ters

Co
nte
nts
PublishersOPEC
Organization of the Petroleum Exporting Countries
Obere Donaustrasse 93
1020 Vienna, Austria
Telephone: +43 1 211 12/0
Telefax: +43 1 216 4320
Public Relations & Information
Department fax: +43 1 214 9827
E-mail: [email protected]
Web site: www.opec.orgVisit the OPEC Web site for the latest news and infor-
mation about the Organization and back issues of the
OPEC Bulletin which is also available free of charge
in PDF format.
Hard copy subscription: $70/year
Membership and aimsOPEC is a permanent, intergovernmental
Organization, established in Baghdad, September
10–14, 1960, by IR Iran, Iraq, Kuwait, Saudi Arabia
and Venezuela. Its objective is to co-ordinate and
unify petroleum policies among Member Countries,
in order to secure fair and stable prices for petroleum
producers; an efficient, economic and regular supply
of petroleum to consuming nations; and a fair return
on capital to those investing in the industry. The
Organization comprises the five Founding Members
and six other Full Members: Qatar (joined in 1961);
Indonesia (1962); SP Libyan AJ (1962); United Arab
Emirates (Abu Dhabi, 1967); Algeria (1969); and
Nigeria (1971). Ecuador joined the Organization in
1973 and left in 1992; Gabon joined in 1975 and left
in 1995.
CoverSpotlight on Libya (see story on pp4–9).AP Photo
OP
EC
bu
lle
tin
Vol XXXVI, No 7, July/August 2005, ISSN 0474–6279
Features 4
Hit the road (p10)
Newsline 20
Iran, Iraq sign energy deal (p20)
Iraq oil plans proceeding (p21)
Saudi-Chinese energy co-operation (p23)
Libyan investment opportunitiesExclusive interview
Technology to help production and the environment (p14)
AP
Pho
toN
OC
Reu
ters
Wey
burn

Printed in Austria by Ueberreuter Print and Digimedia
Indexed and abstracted in PAIS International
ContributionsThe OPEC Bulletin welcomes original contri butions on
the technical, financial and en vi ronmental aspects
of all stages of the energy industry, including letters
for publication, research reports and project descrip-
tions with supporting illustrations and photographs.
Editorial policyThe OPEC Bulletin is published by the PR & Informa-
tion Department. The contents do not necessarily
reflect the official views of OPEC or its Mem ber Coun-
tries. Names and boundaries on any maps should not
be regarded as authoritative. No responsibility is
taken for claims or contents of advertisements.
Editorial material may be freely reproduced (un-
less copyrighted), crediting the OPEC Bulletin as the
source. A copy to the Editor would be appreciated.
Secretariat officialsSecretary GeneralHE Sheikh Ahmad Fahad Al-Ahmad Al-SabahActing for the Secretary General, Director, Research DivisionDr Adnan Shihab-EldinHead, Administration & Human Resources DepartmentSenussi J SenussiHead, Energy Studies DepartmentMohamed HamelHead, PR & Information DepartmentDr Omar Farouk IbrahimHead, Petroleum Market Analysis DepartmentMohammad Alipour-JeddiSenior Legal CounselDr Ibibia Lucky WorikaHead, Data Services DepartmentFuad Al-ZayerHead, Office of the Secretary GeneralKarin Chacin
Editorial staffEditor-in-Chief
Dr Omar Farouk Ibrahim
Senior Co-ordinator
Umar Gbobe Aminu
Editor
David Townsend
Deputy Editor
Philippa Webb-Muegge (maternity leave)
Production
Diana Lavnick
Design
Elfi Plakolm
Fund highlights 2004 achievements
Market Review 42
Noticeboard 62
Advertising Rates 63
OPEC Publications 64
OPEC Fund News 36
Member Countr y Focus 28
Iraq reconstruction meeting claims success
Saudi Arabia boosts investment climate (p31)
Libya praised for Darfur effort (p30)R
eute
rs
Reu
ters
Reu
ters
Ana
juli
a Ta
rtar
Ana
juli
a Ta
rtar

4
OPE
C bu
lleti
n 7–
8/05
ups
trea
mF
ea
ture
do
wn
stream

5
OPE
C bu
lleti
n 7–
8/05
In April Libya’s National Oil Corporation (NOC) invited bids for 44 blocks in the second international licensing round since the lifting of sanctions. According to Shatwan, the response received so far from international oil companies (IOCs) has been very positive. The NOC has held two meetings in London and Tripoli and details and data relating to the blocks (see Table 1) have been viewed by over 120 companies. “We are now in the process of receiving the IOCs,” Shatwan said. Bids have to be submitted by October 2 and an opening ceremony will be held — in public — with the winners announced at the end of that meeting. Contract agreements will be signed during the first half of November. Shatwan said the round represented “a very big oppor-tunity for Libya to increase reserves and production capac-ity” and that further rounds would be held in the future although no dates for these had yet been set. The new acreage offered in the second round will, Libya hopes, help it achieve a planned target production capac-ity of 3 million barrels/day from 2010 although Shatwan admits, “it is difficult to put a precise figure on future pro-duction.” Libya’s possible reserves are viewed as much higher than those already identified because large parts of the country remain unexplored. As a result, the potential for future oil and gas success is viewed as high, especially as the country has some of the lowest oil recovery costs in the world. As Shatwan points out, “one-third of the area of the eight basins in Libya is still viewed as virgin terri-tory, so we have a lot of exploration work to do.”
The Socialist People’s Libyan Arab
Jamahiriya is hoping to encourage major
investments in its oil and gas sector over
the coming years as part of a plan to boost
oil and gas production and also create
integrated energy projects.
OPEC Bulletin spoke to Secretary of the
People’s Committee for Energy, HE Dr Fathi
Hamed Ben Shatwan about these plans.
OP
EC

6
OPE
C bu
lleti
n 7–
8/05
Fe
atu
re
The current round is the second this year. The first, awarded at the
end of January, saw US-based Occidental Petroleum and its partners
Woodside Petroleum of Australia and Liwa Energy of the United Arab
Emirates receive stakes in no less than nine of the 15 blocks on offer.
Other US winners were Chevron and Amerada Hess with one block each.
The remaining successful bidders included consortia featuring Brazil’s
Petrobras and Australia’s Oil Search; Canada’s Verenex Energy and
Indonesia’s Medco Energy; two Indian companies, Indian Oil Corporation
and Oil India; and Algeria’s state oil firm, Sonatrach.
Shatwan says the fact that Occidental was the biggest winner in the
first licensing round should not be interpreted to mean that US firms are
being favoured. “That’s not the case at all and, anyway, we have a trans-
parent and completely business-like bidding and approval system. The
fact that the US firms (and in some cases UK firms) have been making
good offers reflects the fact that they have been working
in the country since the 1950s so they know the areas and
the resources available. So, maybe their bidding will be
more accurate.” However, Libya, he says, welcomes any
bids. “We are open to everybody. We are talking to com-
panies from Europe, India, Japan and Latin America.”
In order to be able to process the new crude produc-
tion capacity, Libya wants to expand its refinery facilities.
At present, domestic refining capacity totals 380,000 b/d.
“There are several projects planned,” Shatwan says.
Under a first phase, capacity would rise to 500,000 b/d
and then maybe 1m b/d at a later stage. The aim, he
explains, is to have refining capacity equivalent to around
one-third of future crude output.
As well as increasing oil production, Libya is very
keen to continue to explore its gas potential. Here too,
the country is viewed as under-explored. Several of the
blocks in the current second round are gas-bearing.
“We are relatively new to gas production and we want
to expand and increase this in the future.” Reserves could
be as high as 100 trillion cubic feet. As well as increas-
ing domestic gas supplies, particularly for power gen-
Much of Libya remains unexplored.
Left: Polyethylene plant in Libya.

7
OPE
C bu
lleti
n 7–
8/05
eration, Libya’s location, just to the south of one of the
world’s major gas consuming markets, Europe, means
there is great potential for the country to join fellow OPEC
Member Country and neighbour, Algeria as a major sup-
plier of gas (both liquefied natural gas (LNG) and pipe-
line) to the region and beyond.
In May, the NOC and Shell Exploration and Production
Libya announced a long-term agreement for a major gas
exploration and development deal. As well as exploration
work on five blocks, Shell will modernize and upgrade
the existing LNG plant at Marsa Al-Brega at a minimum
cost of $105m, possibly rising to $450m to boost output
from 700,000 to 3.2m tonnes per year. Depending on gas
availability, Shell will also jointly develop with the NOC a
new LNG plant.
“We are looking at several LNG projects and also
some integrated upstream and downstream gas projects,”
Shatwan says, adding that he expects future ventures
similar to the Western Libya Gas Project (WLGP) which
exports gas to Italy under a 50:50 joint venture between
the NOC and Italy’s ENI.
“Previously, our power plants used heavy oil and now we are changing
to gas and also want to increase local consumption through a domestic
gas network,” Shatwan says. “We also want to use the new gas as a feed-
stock for petrochemical projects as well as LNG and pipeline exports.”
He adds: “We expect we will find very large gas reserves. We estimate
them to be around 47tr cu ft right now but we think this figure could be
trebled and our role as a gas supplier will become much bigger. We want
to increase gas sales to our traditional market, Europe, but also create
Right: SPLAJ Secretary of the People’s Committee for
Energy, HE Dr Fathi Hamed Ben Shatwan (l) and Libyan OPEC
Governor, Hammouda M El-Aswad (c) examine an oil facility.

8
OPE
C bu
lleti
n 7–
8/05
Fe
atu
re new supplies to the Middle East and China, India, Japan
and even the US. We also want to work with our neigh-
bours in Algeria and Egypt.”
Shatwan explains that integrated gas projects are a
main focus for Libya at present. “This is our new strat-
egy in both oil and gas and energy in general. We want
to connect the upstream and the downstream.”
He adds: “Most [foreign] companies come to Libya
for the upstream because obviously there’s a lot of profit
to be made but many don’t like to work downstream.
However, we want to see more integrated projects simi-
lar to the agreement we have with Shell.”
Achieving all these new projects will not only require
financing (this has been estimated at as much as $30 bil-
lion in the present decade alone) but also mean easing
the path for foreign investors. Shatwan says much work
in this area has been carried out such as the new terms
and conditions and contract signing process.
“We want to make investment in Libya as easy as
possible. We are working very hard on a new strategy for
investments and also amending the existing hydrocarbon
law. We have also speeded up the approval process for
licensing rounds thanks to the open bidding system. We
used to have direct negotiations, which could take years,
but now they only take one month. The energy sector in
Libya has changed, we have become more transparent
and we are making life easy for the IOCs.”
Contracts awarded under the first licensing round
in January were made under the framework of Libya’s
Exploration and Production Sharing Agreement IV model
(EPSA-IV). However, both this and the existing hydrocar-
bon law are under review, Shatwan says.
“We are open to all types of agreements. In the future,
we are going to have two types of service agreement —
one with risk and one without. Our future strategy is to
have different agreements not just EPSA-IV — and the
whole system will be transparent.”
Transparency and a simplified bidding process as
well as the various new agreement frameworks will all
be enshrined in the new hydrocarbon law, Shatwan says.
“We are going to simplify all the rules and procedures and
that will be reflected in the new law.”
Right: Libya wants to create major integrated energy projects
in the country to develop its existing petrochemical sector.
Left: Ethylene plant in Libya.
OP
EC
All photos except otherwise credited NOC.

9
OPE
C bu
lleti
n 7–
8/05
Exploration programme
Basin Area no Block no 2D seismic 3D seismic wells commitment $ m
Offshore 2 1 + 2 1,000 1,000 1 21.0
17 3 1,000 3 42.0
4 1,000 500 1 18.0
40 3 + 4 1,000 500 2 32.0
44 1–4 1,000 1,000 1 22.0
Cyrenaica 42 1 + 3 2,500 1 21.5
2 + 4 2,500 1 21.5
94 1–4 3,000 1 24.0
Ghadames 81 1 500 500 1 12.5
2 500 500 1 12.5
82 3 1,200 1 10.0
4 500 500 2 16.5
Sirte 102 3 1,000 500 1 17.0
4 1,000 500 1 17.0
121 2 1,500 1 13.5
123 1 700 500 1 15.5
2 500 500 1 14.5
3 700 300 2 19.1
Murzuq 146 1 750 2 13.75
147 3 + 4 500 300 2 16.1
161 1 1,500 1 12.5
2 + 4 2,000 2 20.0
176 3 2,000 1 15.0
4 2,000 1 15.0
Kufra 171 1–4 2,000 2 26.0
186 1–4 2,000 2 26.0
Total 44 32,850 8,100 36 494.45
Table 1: Second licensing round details
Source: NOC.

10
OPE
C bu
lleti
n 7–
8/05
Fe
atu
re
The Secretary General of the International Road
Transport Union, Martin Marmy, has spoken of
the need for co-operation between oil producers
and consumers in order to ensure a more stable
oil market. The OPEC Bulletin spoke to Marmy
about this and other issues on his recent visit
to the OPEC Secretariat.
Hit the
RoadR
eute
rs
By U ma r G b ob e A m i n u a n d D a vi d Tow ns e n d

11
he International Road Transport Union
(IRU) was formed in 1948 with the man-
date to “assist bus and coach as well as
taxi and truck operators throughout the
world” and “to ensure the mobility of people and goods.”
Based in Geneva, Switzerland, the Organization provides
information on issues affecting the business of its mem-
bers who include national road transport associations
around the world as well as vehicle manufacturers, com-
bined transport companies and similar bodies.
As Marmy explains, the road transport sector is
unique in that it depends “100 per cent” on oil — it is
also responsible for the transportation of 95 per cent of
all goods around the world making it a vital component
of the global economy.
“We have no alternative to oil and at the same time,
we have a responsibility towards society to make road
transport as reliable as possible. We have become a
production tool, thanks to globalization and the increas-
ing liberalization of economies and transport sectors.
We are a fully integrated part of the production process
and, therefore, it is our task to make transport possible
for society at large.”
Marmy says that any “penalties” imposed on the road
transport sector — either in the form of government taxa-
tion, punitive transport infrastructure policies or, for that
matter, high oil prices — “affect not just our members
but wider economic development as a whole. Therefore,
we need to work hand in hand with both governments
and also oil suppliers because, I repeat, there can be no
transport without oil.”
Unfair taxes
According to IRU data, the international road transpor-
tation sector accounts for between seven and eight per
cent of total global oil consumption. “We are not the big-
gest consumer, but we are the only sector that depends
100 per cent on oil. Governments in consuming coun-
tries know that very well and so they tax us far more than
other sectors.”
In addition, if governments in consuming countries
fail to correctly address issues such as road capacity and
do not remove bottlenecks in transportation, this also
affects IRU members. This, Marmy believes, is a form of
“double taxation.”
But what of the argument made by several govern-
ments that the reason road transportation is highly taxed
is due to its environmental impact and the fact that it is a
high user of government resources in terms of roads and
transport links?
Marmy claims this argument is misleading. He points
OP
EC
Taxes versus revenues
Source: Research Division, OPEC, Vienna, Austria, 2004.
T
�
���
���
�����
�����
���
�
��
���
���
���
���
���
��������������
��������������
������������������������������������
��������������������������������
���������
������������
������������
������������������������������������
���������
����������������������������������������
���������
Mr Martin Marmy (r) with OPEC Acting for the Secretary General, Dr Adnan Shihab-Eldin.

12
OPE
C bu
lleti
n 7–
8/05
Fe
atu
re
out that in the UK, which has a high level of road trans-
portation, the government is taking £56 billion in road
taxes but only spending something like £4bn on roads
each year. “So, they’re not investing in road infrastruc-
ture and thus creating bottlenecks, which, in turn, create
problems with carbon dioxide.”
Bottlenecks in refining capacity are also cause for
concern for the IRU. A shortage, particularly in middle
distillate supplies in key petroleum product consuming
countries, is a major factor in the current high oil price.
In addition, Marmy describes the present oil market as
“a speculative one.”
He adds: “There is too much talk of high oil prices and
consumers are stock-piling unnecessarily. This is making
it extremely difficult, from an analytical point of view, to
evaluate how much product is available. This has created
a very unstable situation and also represents another pen-
alty for our industry because we cannot store fuel nor can
we speculate because we have no alternative [to oil].”
Consuming governments, Marmy believes, should be
using road tax revenues to diversify their oil consumption
patterns or invest in new road infrastructure; but, this, he
claims, is not the case today. Furthermore, value-added
tax, also a large component of the fuel price paid by con-
sumers, acts as a further penalty to the road transporta-
tion sector.
Consumer/producerco-operation
Against this background, Marmy says his visit to the OPEC
Secretariat, where he met with Acting for the Secretary
General, Dr Adnan Shihab-Eldin, had underscored the
need for co-operation between oil producers and con-
sumers in order to ensure a stable oil market.
“The main topic of our talks was to demonstrate that
we share a responsibility in the stabilization of the oil
market and that it is not the responsibility of just the IRU
Reu
ters

13
OPE
C bu
lleti
n 7–
8/05
Who gets what from a litre of oil in the G7?
OP
EC
Figures are estimated prices in US dollars per litre
for the year 2004 until the end of September 2004.
Unleaded premium (95 RON) gasoline for France,
Germany, Italy, UK; regular unleaded gasoline for
Canada, Japan and USA.
Source: Research Division, OPEC, Vienna, Austria, 2004.
or OPEC, it’s also up to consuming countries. Road trans-
portation is mainly centred in consuming countries and,
in my view, many of the governments of these countries
are not assuming their responsibilities, particularly when
it comes to diversification of energy markets.”
Dr Shihab-Eldin welcomed the views expressed by
the IRU and noted that OPEC has always encouraged the
promotion of this kind of institutional co-operation with
major stakeholders in the oil industry, including, of course
key consumers. He welcomed the opportunity afforded by
the IRU’s visit to interact directly with oil consumers in the
transportation sector and said that OPEC had expressed
its commitment to market stability.
Shihab-Eldin added OPEC was doing all it could to pro-
vide a stable supply of oil to the market but that current
constraints due to refining bottlenecks in major consum-
ing countries continued to affect the market. In addition,
the failure of major consuming countries to invest in new
refineries and upgrade existing capacity was a cause for
concern. The ASG also said he had highlighted to the IRU
some of the misconceptions surrounding crude oil prices
and the price of petroleum products (see graphs).
�������
���
� ��� ��� ��� ��� ���
���
������
�����
������
�����
��
������������������������������������������������������������
���������������������������������������������������������������������
�� � � � � �

14
OPE
C bu
lleti
n 7–
8/05
Carbon Dioxide (CO2) Capture and Storage (CCS) whereby CO
2
is captured from stationary sources such as power plants and injected
into geologic formations for long-term storage is viewed as one of the
most promising technologies to reduce CO2 emissions.
Fe
atu
re
AP
Pho
to

15
OPE
C bu
lleti
n 7–
8/05
AP
Pho
to
In addition, the storage of CO2 in depleting oil reservoirs could increase
reserves through enhanced or improved oil recovery processes.

16
OPE
C bu
lleti
n 7–
8/05
The perceived threat of global warming caused
by increasing emissions of CO2, methane and
other greenhouse gases is driving policies
geared towards achieving reductions in the
emission of these gases. This has led to consid-
erable international resources being dedicated
to the development of technologies and policies
related to reducing greenhouse gas emissions.
CCS is a means of reducing CO2 emissions from
power plants and stationary industrial sources.
Over 60 per cent of global CO2 emissions come
from power plants and stationary industrial sources.
If a large portion of these emissions could be cap-
tured and stored, then it would place the world on
a path towards stabilization of CO2 in the atmos-
phere. Also, if the CO2 could be injected into deplet-
ing oil reservoirs, it could increase recovery through an
enhanced oil recovery (EOR) process. The technology
is of interest to both oil producers and consumers as it
will help both to reduce CO2 emissions and, in the case
of producers, could also be of benefit in terms of EOR.
Capture technologies have been used for many years
to remove CO2 from natural gas prior to sales or liquefac-
tion. Also, geologic formations are already commonly
used to store natural gas and for waste disposal while
CO2 EOR is a mature technology widely used in parts of
the US and Canada.
In the West Texas Permian, 28 million tonnes per
year of CO2 are being injected into oil reservoirs through
a 2,500-kilometre pipeline network. EOR is responsible
for 20 per cent of the region’s oil production. However,
what is new is the use of these technologies for the addi-
tional purpose of reducing CO2 emissions.
OPEC is very interested in the possibilities the tech-
nology represents. The Organization, together with the
World Petroleum Congress, held a workshop on CO2
Capture and Storage, CO2 for EOR and gas flaring reduc-
tion in Vienna in June 2004. The process was also high-
lighted at OPEC’s first meeting in April of the officials of
Petroleum Research and Development (R&D) Institutions
The CO2 plant at the Weyburn Demonstration Project, Canada.
Fe
atu
re

17
OPE
C bu
lleti
n 7–
8/05
Research into CCS has been under way for some
time to find ways to overcome the cost and security of
storage challenges. The IEA Greenhouse Gas Reduction
Programme was formed in 1991 to conduct co-operative
R&D on technologies capable of making large reductions
in greenhouse gas emissions. Its primary role with respect
to CCS is to review and report on technologies being devel-
oped by others, facilitate technology R&D, look for gaps
in R&D efforts, and work to fill the gaps to ensure that all
relevant aspects of the problem are being worked.
In 2002, the CO2 Capture Project was formed by a
consortium of eight energy companies and four govern-
ment organizations which hope to achieve major reduc-
tions in CCS costs. The members of this group are: BP,
Chevron, EnCana, ENI, Hydro, Shell, Statoil, Suncor,
the US Department of Energy, the Norwegian Research
Council (Norges Forskningsråd), the European Union
in OPEC Member Countries (MCs) and a Working Group of
MC research officials has been formed to co-operate on
the development of carbon management technologies.
The potential CCS offers is substantial; the Internat-
ional Energy Agency (IEA) estimates that the global CO2
storage potential in depleting oil and gas reservoirs is
close to 1,000 gigatonnes (gt) — about 25 years’ worth of
CO2 emissions at today’s rate. Storage potential in deep
saline aquifers is even greater — up to 10,000 gt.
Three major hurdles, however, will have to be over-
come before CCS can achieve widespread use as a means
of reducing greenhouse gas emissions. These are: the
high cost of capture — existing technologies are expen-
sive and can reduce power plant efficiency; concerns
over the safety and security of storage of large volumes
of CO2; and the absence of any commercial incentives to
avoid CO2 emissions.
An Anadarko Petroleum well that pumps CO2 into the old Salt Creek oil field in Wyoming, USA.
Reu
ters

18
OPE
C bu
lleti
n 7–
8/05
(EU) Research Directorate General Programme and the
EU Energy and Transport Programme.
Another group carrying out research is the Carbon
Sequestration Leadership Forum, initiated by the US gov-
ernment in 2003. This is focusing on facilitating interna-
tional co-operation on the development of improved and
cost effective technologies for the separation and capture
of CO2 transport and long-term safe storage. The group
aims to make these technologies available internation-
ally and identify and address wider issues relating to
CCS. Members include: Australia, Brazil, Canada, China,
Colombia, the European Commission, France, Germany,
India and Italy
There are also two commercial-scale demonstration
projects for the injection of captured CO2 into saline aqui-
fers — the In Salah project in Algeria and the Sleipner
project in Norway. In Salah is a joint venture between
Sonatrach and BP and is the first gas development in
the region that will store CO2 captured from a gas sales
stream.
The Sleipner project operated by Statoil was con-
ceived in 1991 and, since it started in 1996, one mil-
lion tonnes of CO2 per year have been injected into the
aquifer. The EU has also sponsored a research project
to monitor the movement of CO2 which has resulted in
improved confidence that saline aquifers represent a
long-term storage option.
Meanwhile, the UAE’s Abu Dhabi National Oil
Company (ADNOC) has carried out a CO2 injection study
in the western area of the Upper Zakum field and evalu-
ated ways for its use in EOR, concluding that this is tech-
nically feasible.
ADNOC says the objective of its studies in this area
are “in line with [our] long-term strategy to enhance oil
recovery by injecting carbon dioxide into oil reservoirs to
protect the environment by reducing emissions of green-
house gases and to conserve hydrocarbon gas resulting
from CO2 use as a substitute of hydrocarbon gas for injec-
tion into reservoirs.” Indonesia has also carried out CCS-
EOR studies at one of its basins, East Kalimantan, and
Qatar Petroleum has done research in the field.
There is one prominent demonstration project in
using captured CO2 for EOR, the Weyburn Demonstration
Project in Canada (see picture page 16), which uses CO2
captured from a gasification plant. Currently 105m cf/d
of CO2 is being purchased and injected and incremental
oil production from the EOR process has reached 9,000
b/d out of 22,000 b/d in total for the field.
Although it was designed as a research project, the
field response to CO2 injection has been so positive that
the project is economic on its own at 2004 oil price lev-
els. In addition, an extensive data base has been com-
piled to assess the issues around risks of leakage and
remediation.
Meanwhile, in April, the US DOE’s Office of Fossil
Energy released six basin-oriented studies which
examined the potential to economically recover the oil
remaining in mature fields in the US using CO2 EOR tech-
nologies.
The six regions have a technically recoverable poten-
tial of 43 billion barrels using the latest CO2-EOR technolo-
gies. The DOE believes that the emerging, advanced EOR
technologies could double the incremental oil recovery.
The process was first attempted in 1972 in large
scale at the SACROC unit of the Kelly-Snyder field in
Scurry County, Texas. Today CO2-EOR is only used in a few
regions of the US, primarily in West Texas and southern
Wyoming.
Elsewhere, the Norwegian Petroleum Directorate
completed a study earlier this year on behalf of the
Ministry of Petroleum and Energy into the possibilities
of implementing projects with injection of CO2 for IOR in
the Norwegian Continental Shelf (NCS). This report con-
cluded that although the process was technically feasible,
it does not represent a commercial alternative for IOR at
this moment in time. However, it should be noted that
costs will be significantly higher offshore than onshore
and NCS operators would not at present benefit from any
government incentives to launch such projects.
The cost of CO2 capture has fallen in recent years and
new technology is expected to reduce this even further.
“
”
Fe
atu
re
The IEA estimates that the
global CO2 storage poten-
tial in depleting oil and gas
reservoirs is close to 1,000
gigatonnes — about 25
years’ worth of CO2 emis-
sions at today’s rate.

19
OPE
C bu
lleti
n 7–
8/05
Now, with the prospect that CO2-based EOR projects could
prolong global oil production and increase recovery in
fields already discovered, interest in the technology is
growing rapidly.
It is true that large-scale CO2 EOR would require huge
infrastructure investments to transport the captured CO2
from major sources to the oil fields. However, these costs
are expected to fall as technology improves and the overall
cost has to be viewed against increased revenues from EOR
not to mention, of course, the immeasurable benefits the
technology could bring in helping reduce CO2 emissions.
While research is relatively new and there are signifi-
cant challenges to be overcome, the potential the tech-
nology offers makes it a very attractive prospect.
Considerable international resources are being dedicated to the development of technologies and policies related to reducing greenhouse gas emissions.
Reu
ters
This article is part of an occasional series of
features planned in the OPEC Bulletin that
will look at areas of interest around technol-
ogy in the oil and wider energy sector. The
OPEC Bulletin would welcome contributions
in this area for possible inclusion in future
editions.

20
OPE
C bu
lleti
n 7–
8/05
Ne
ws
lin
e
The Islamic Republic of Iran has signed
an agreement with Iraq to swap crude for
petroleum products. The deal was signed
during a meeting in Tehran between Iraq’s
Minister of Oil, HE Dr Ibrahim Bahr Alolom,
and his Iranian counterpart, HE Bijan Namdar
Zangeneh.
The agreement will require the construc-
tion of three new pipelines running across the
two countries’ common border in the south.
One will transport Iraqi crude from Basra to
Iran’s Abadan refinery with an initial capacity
of 150,000 barrels per day although Zangeneh
said a proposal to increase this to an eventual
370,000 b/d had also been agreed.
Of the two products’ pipelines, one will
carry imported gasoline from the Iranian port
of Mahshahr to Basra, and the other, Iranian
fuel oil and kerosene from the Abadan refin-
ery to the southern Iraqi city. A contract for the
construction of the pipelines was expected to
be awarded by the end of August. All financ-
ing will be provided by Iran and construction
of the pipelines is expected to be completed
within 10 months. The deal will help alleviate
Iraq’s current shortage of refined petroleum
products.
As well as the pipeline agreement, Iran is
also extending a $1bn credit facility to Iraq to
help increase Iranian exports to the country,
in particular engineering and technical prod-
ucts. The facility will be backed by Iran’s Export
Guarantee Fund with repayment to be made by
the Trade Bank of Iraq at low interest rates.
In addition, a memorandum of under-
standing was signed covering co-operation
in industrial and mining activities between
the two countries and five working groups are
to be formed to study future areas of mutual
interest, including economic, political and
security issues. Alolom was reported as say-
ing that talks would also begin on the pos-
sible linking of the two countries’ electricity
networks as well as future co-operation in
Iraq’s oil industry.
Reu
ters
Iran, Iraqsign energy deal

21
OPE
C bu
lleti
n 7–
8/05
Right: Discussions on various
oil projects have already
been held with IOCs.
Iraq oil plans proceedingA
P P
hoto
Iraq’s Ministry of Oil is working on plans
that will eventually permit the return of inter-
national oil companies (IOCs) to the country.
Preliminary talks have been held in recent
weeks based on the Ministry’s already stated
intention to build strong relations with IOCs
and increase oil production to between 5
million and 6 million barrels per day by the
end of this decade (see OPEC Bulletin 5/05,
page 4).
In July, Ministry spokesman, Asim Jihad,
was quoted as saying that 11 oil fields were
being considered as possible targets for IOC
investment. These would be used to increase
production to around 3m b/d — around the
level prior to the US-led invasion of Iraq.
Options being considered include a possi-
ble licensing round similar to that being used
by Libya this year (see article on p4). Jihad sug-
gested that the fields would be awarded on a
competitive basis and that the Ministry was
also interested in encouraging investment in
Iraq’s refining sector.
Initial discussions on upstream projects
have been held with several IOCs including
Russia’s Lukoil, which met with Iraq’s Minister
of Oil, HE Dr Ibrahim Bahr Alolom, in early July.
Ministry spokesman Jihad said the Russian
company was interested in co-operating in
both oil and power projects. Lukoil is one of
several IOCs that had signed contracts with
Iraq for oil field development in the years lead-
ing up to the US-led invasion. These contracts
were unable to be realized because of sanc-
tions imposed on Iraq.
Separately, Irish independent Petrel
Resources said in July that it was in talks to
extend its area of exploration interest in Iraq.
Any new acreage will be under the transitional
Technical Co-operation Agreement developed
by the Ministry while future energy policy is
being determined. The company also said that
Ministry officials were satisfied with techni-
cal and commercial clarifications made to its
Subba and Luhais oil field development ten-
der of late 2004.
It has been suggested that Iraq will need
as much as $25bn in foreign investment to
rebuild its oil and gas sector and return out-
put to its previous peak level of around 3m
b/d. The Ministry has said that $11.5 billion
of damage has been caused to the country’s
oil infrastructure since the US-led invasion.
The latest quarterly update from the US
Left: Iran’s Minister of
Petroleum, HE Bijan Namdar
Zangeneh (l), talks to Iraq’s
Minister of Oil, HE Dr Ibrahim
Bahr Alolom, during their
meeting in Tehran.

22
OPE
C bu
lleti
n 7–
8/05
Ne
ws
lin
e
Iraq’s Ministry of Oil wants to encourage invest-
ment in the country’s refining sector.
AP
Pho
to
State Department to the US Congress, released
by the Bureau of Resource Management, said
that Iraqi crude production and exports had
remained essentially unchanged from the pre-
vious quarter, at about 2.1m b/d and 1.4m
b/d, respectively.
The report, which covers the three months
to the end of June, noted that the Interim
Transitional Government was addressing
security, technical and operational issues
and had assigned a capital budget to provide
funds for field development and production
facilities, pipelines for refining and export and
increased refining capacity.
It said that the Ministry had been able
to “move forward” on a number of rehabili-
tation and maintenance projects during the
quarter. In particular, the restoration of the
pipeline crossing over the Kirkuk canal and
Tigris River at Bajii, has the potential to sig-
nificantly increase Iraqi oil production. The
Ministry has identified funding and contrac-
tors for this work, which, when completed,
will allow Iraq to increase oil production and
exports in the north by 200–300,000 b/d.
Meanwhile, the US-Iraq Joint Commission
on Reconstruction and Economic Development
(JCRED) held a meeting in Amman, Jordan in
the middle of July. JCRED Regional Director,
Carl Kress and Alolom, jointly announced the
development of a $2m training programme
for the Iraqi oil and gas sector. The pro-
gramme was developed following a meeting
in Washington, DC, last December, when the
then Interim Government formally requested
US Government assistance in modernizing
the institutional and technical operations of
its oil and gas sector.
The programme is the result of extended
and close discussions between Iraqi and US
Government officials to: develop a training
programme that addresses the immediate
term training needs of the Ministry of Oil; pro-
vide a road map for longer-term training that
could be instituted by the Ministry as part of
its human resources management and devel-
opment strategy; and provide a foundation for
continued linkage between the Ministry and
US organizations in the areas of knowledge
and expertise in oil sector management and
operations. Specific training programmes
have been designed in the areas of man-
agement, technical operations, and human
resources.

23
OPE
C bu
lleti
n 7–
8/05
The ground-breaking and signing cer-emony for the $3.5-billion Fujian Integrated
Refining and Ethylene joint venture Project
(FREP) has been held in Quanzhou, China,
with the President and Chief Executive of
Saudi Aramco, Abdallah S Jum’ah, praising
the level of co-operation between the two
countries.
The ceremony marked the beginning
of construction of the FREP and the formal
signing of the joint-venture agreement for
the project by partners Fujian Petrochemical
Company, 50 per cent; ExxonMobil China
Petrochemical, 25 per cent; and Aramco
Overseas, 25 per cent.
Saudi-Chineseenergy co-operation
“Given the tremendous economic growth
of your nation, and the extensive petroleum
reserves and production capabilities of ours,”
Jum’ah said, “the bonds that join us together
are among the most important energy relation-
ships on the planet. These strong ties have not
only contributed to the economic well-being
of our nations but have served to strengthen
the global economy as a whole.”
The Chinese government approved
the project, located in QuanGang district
in Quanzhou City in south-eastern China’s
coastal Fujian province, in September 2002,
and in August 2004, the three joint- venture
partners signed the front-end loading agree-
ment and officially started the basic design
of the project.
The Chinese Government’s Ministry of
Commerce is reviewing all documents, and
the joint-venture company is expected to be
formed by year’s end with the project expec-
ted to be completely operational by the end
of 2008.
It will dramatically increase Fujian
Petrochemical Company’s existing 4 million
tons per year, or 80,000 barrels per day , refin-
ing facilities by adding 8m t/y (160,000 b/d)
of refining capacity. The plant will be able to
process sour crude mainly supplied by Saudi
Aramco.
China’s rise as aneconomic power
has been one of the most important global
developments ofrecent decades.
Abdallah S Jum’ah
Reu
ters

24
OPE
C bu
lleti
n 7–
8/05
Ne
ws
lin
e
China’s strong economic growth is fueling an unprecedented level of demand for energy in the country.
New processing units and corresponding
utilities will also be built to support produc-
tion of 800,000 t/y of ethylene, 650,000 t of
polyethylene, 400,000 t of polypropylene,
700,000 t of paraxylene, and 1m t of aro-
matics. Construction is also under way on a
300,000 t/y crude terminal. Ultimately, the
plant will produce 7m t/y combined of high-
quality product, including gasoline and diesel
that meet Euro-III Emission Standards.
Mechanical completion of the refin-
ing units is projected by the end of 2007,
with commercial start-up one year later.
Mechanical completion of the chemical units
is planned by the end of July 2008, with start-
up by December 2008.
Saudi Minister of Petroleum & Mineral
Resources, HE Ali I Al-Naimi, said: “The
Kingdom of Saudi Arabia and the People’s
Republic of China have strong mutual rela-
tions in the oil industry, and it is expected
that such co-operation will grow stronger dur-
ing the next few years, due to that fact that
Saudi Arabia is China’s largest supplier of
oil.” Currently, China’s imports of Saudi oil
have reached 450,000 b/d — a figure that is
expected to increase.
Jum’ah said the rise of China as an eco-
nomic power “has been one of the most impor-
tant global developments of recent decades.”
In 2004, China accounted for one third of glo-
bal growth in petroleum demand, overtaking
Japan as the world’s second largest oil con-
sumer — behind the US.
“By 2030, Chinese oil consumption is
expected to more than double, rising to over
13m b/d,” he said. “Even more critically,
China’s oil imports will increase nearly five-
fold over the same period, to nearly 10m b/d
— roughly equivalent to the United States’
current crude oil imports.”
Saudi production plans
Jum’ah said that, in addition to Saudi
Aramco’s 260bn b of oil reserves, potential
recoverable oil is expected to be in the range
of 200bn b. “At current production levels our
reserves will therefore translate into well over
a century’s worth of oil.
Production capacity is also expanding rap-
idly. “Before the end of the decade, we will
expand Saudi Aramco’s production capac-
ity from 10.5m to 12m b/d — with scenarios
to boost this to even 15m b/d, if required,”
Jum’ah said. “We already have in progress
a half dozen oil production projects that
represent a combined production capacity
of more than 3m b/d, some of which will off-
set natural decline while the remainder will
serve to expand our total production capac-
ity.” The initiatives will allow Saudi Aramco
to maintain a surplus capacity of between
1.5–2m b/d.
Energy links between the two coun-
tries are well-established. In 2004, China’s
SINOPEC entered into a partnership with Saudi
Aramco to explore for non-associated gas in
the Kingdom’s Empty Quarter. Saudi Aramco
is also exploring the feasibility of develop-
ing a new grassroots refinery with Sinopec
in Qingdao, Shandong Province, China.
Right: Kuwait is modernizing two of its existing refineries, including Al-Ahmadi, shown here.
AP
Pho
to

25
OPE
C bu
lleti
n 7–
8/05
i n b r i e fNigeria ultra-deep discoveries
Shell has made discoveries in two ‘Big Cat’ pros-pects in deep-water frontier areas offshore Nigeria. Bobo-1X was drilled in block OPL 322, to a depth of 5,173 metres in 2,479 m of water, the second deepest well in offshore Nigeria. Drilling found over 140 m of hydrocarbon-bearing sands. Etan-1X was drilled in block OPL 245 to a total depth of 4,574 m in 1,720 m of water. The well logged 120 m of hydrocarbon bearing sands. The wells were drilled by Transocean’s rig, the Deepwater Pathfinder, under a sharing initiative with other Nigeria-based operators.
Angola Kizomba B on stream
ExxonMobil has started production of the $3.5 bil-lion Kizomba B project to develop 1bn barrels of oil from the Kissanje and Dikanza fields offshore Angola. The project, which includes the deployment of the world’s largest floating production, storage and offloading vessel with a storage capacity of 2.2m b of oil, has come on stream five months ahead of schedule. The fields have combined estimated recoverable reserves of 2bn b of oil. Peak output of 550,000 b/d is expected by the end of this year.
New processing plant for UAE’s Gasco
US firm Bechtel has signed a $1.24 billion lump-sum turnkey contract to build a giant gas process-ing plant for the Abu Dhabi Gas Industries (Gasco). Located in United Arab Emirates, the plant will be designed to treat nearly 23 million cubic metres of natural gas and produce 6,400 tonnes of lique-fied natural gas (LNG) per day. Bechtel will perform engineering, procurement, construction, and com-missioning work. The plant will be completed in 38 months. Bechtel is also working on the expansion of a big onshore gas development project for Gasco in Habshan, 130 km south-west of Abu Dhabi.
Project Kuwait vote due October
A vote in Kuwait’s National Assembly on the draft law for Project Kuwait — the plan to boost output from northern oil fields with the help of interna-tional oil companies — will now be held in October. It had been hoped that the vote would take place before the Assembly’s recess in early July. Now, it must wait for the next session in October. Kuwait’s Minister of Energy and President of the OPEC Conference, HE Sheikh Ahmad Fahad Al-Ahmad, has said he expects to launch the project in 2006.
Kuwait’s Supreme Petroleum Council has approved an increase in the production
capacity of the new refinery to be built in the
country to 600,000 barrels per day. When,
the new project was announced in April, the
capacity had been put at 450,000 b/d or
above. As a result, the cost of the new refinery
has also risen and is now estimated at 1.85
billion Kuwaiti dinars ($6.3bn).
Kuwait plans to increase refining capac-
ity to over 1.2m b/d by 2010 from 930,000
b/d at present. Kuwait Petroleum Corporation
(KPC) plans to spend over $8bn moderniz-
ing two of the countries existing three refin-
eries — Al-Ahmadi and Mina Abdullah — as
well as constructing the new facility. Once
the new refinery comes on stream in 2010,
Kuwait’s 200,000 b/d Shu’aiba plant will be
shut down.
In early July, international companies
were invited to pre-qualify for the lump-sum
turnkey contract to build the new refinery and,
at the time of writing, eight were reported
to have pre-qualified. The deadline for pre-
qualification was in early August. Bids are
expected to be invited early in 2006. KPC has
selected the US Fluor Corporation to provide
front-end engineering and design services for
the new refinery.
While Shu’aiba’s petroleum refining oper-
ations will end, the site is to become home
to a major petrochemical complex. In July, the
Kuwait Olefins Company awarded
a contract to Technip for the con-
struction of an 850,000 tonne per
year ethylene plant at the new
Olefins-2 Petrochemical Complex.
The plant will play an important
role in Kuwait’s programme to sig-
nificantly increase ethylene deriva-
tives production by 2008.
Meanwhile, Kuwait Oil Com-
pany (KOC) has made a new 45°
API, light-crude discovery at the
Sabriya field in the north of the
country on well SA-215, which
flowed at over 3,000 b/d. The
field is part of the Marat formation
which the company believes will
hold future significant hydrocarbon
potential. KOC Chairman, Farouq Al
Zanki said this was the second well
on the field with another discovery
made two years ago at the same
depth producing 4,000–5,000
b/d. The two discoveries are an
extension of the Jurassic layer in
Al Sabriya field.
Kuwait upsnew refinery capacity
AP
Pho
to

26
OPE
C bu
lleti
n 7–
8/05
Ne
ws
lin
e
Indonesia’s attempts to increase oil and
gas production have received a boost in the
form of a new exploration joint venture agree-
ment signed between Anadarko Petroleum
of the US and Medco Energi International,
Indonesia’s largest independent exploration
and production company.
Under the agreement, Anadarko subsid-
iaries are gaining access to 13 production-
sharing contracts covering 7.8 million acres
onshore and offshore Sumatra, Kalimantan,
Sulawesi, Java and Papua (see map).
Anadarko has committed to a three-year
work programme to fund exploration activi-
ties at a cost of $80m, subject to the satisfac-
tion of certain conditions. The company has
the opportunity to earn up to a 40 per cent
interest in each production-sharing contract
where a successful exploration well is drilled
at Anadarko’s cost and a plan of development
is approved.
“Anadarko is very pleased to have reached
this joint venture because it provides access
to a large amount of highly prospective
acreage in prolific basins across Indonesia
where we look forward to applying our
proven exploration expertise,” said Anadarko
Senior Vice President, Exploration &
Production, Bob Daniels, “Medco Energi is a
very experienced Indonesian operator, and
this agreement, coupled with the offshore
block we are currently exploring, strength-
ens Anadarko’s commitment to the region
and provides Anadarko a stronger foothold
from which to explore in a proven hydrocar-
bon province.”
$80m exploration boostfor Indonesia
In December 2004, Anadarko was
awarded exploration and production rights
to the North East Madura III (NEM III) Block
by the government of Indonesia. Anadarko
recently opened an office in Jakarta, Indonesia
and is preparing to drill the initial two wells
on the NEM III block.
Meanwhile, at the time of writing,
Indonesia was expected to make an announce-
ment any day on the results of bids it had
received for 13 blocks subject to direct offers
— part of the 27 announced in June (see OPEC
Bulletin, 6/05, page 24). It was reported that
over 20 companies had submitted bids, of
which at least 15 were foreign. Bids for the
remaining 14 blocks being offered under an
open tender system have to be received by
November 10, 2005.

27
OPE
C bu
lleti
n 7–
8/05
i n b r i e fSABIC profits rise
Saudi Basic Industries Corporation (SABIC) reported firts half 2005 net profits of Saudi Riyals 9.84 billion ($2.6bn), up 84 per cent compared with the second half of 2004. Second quarter 2005 reported profits were SR4.76bn ($1.3bn) compared to SR5bn ($1.35bn). SABIC said that while 1Q 2005 sales volumes were higher than in 2004, earn-ings were lower because of a fall in petrochemical product prices. Sales during the first half were 17.4 million tonnes, an increase of 10 per cent over the same period last year while total production was 22.5m t, an increase of 10 per cent over the previ-ous year. SABIC is aiming for total annual produc-tion capacity of 60m t by 2008.
Venezuela ethanol project
Venezuela plans to produce ethanol from sugar cane for use in domestic gasoline, PDVSA has announced. Around 300,000 hectares of sugar cane will be planted between now and 2012, and 14 sugar cen-tres built around the country as part of the project, which is expected to create 400,000 new jobs. Until national production reaches sufficient levels, Venezuela will import ethanol from Brazil. It will be used to replace lead tetraethyl in gasoline, which was to be banned from the middle of August.
Total research in Qatar
Total has announced that it will establish new research and training facilities at the Qatar Science & Technology Park to support Qatar’s growth in oil, gas and petrochemicals. The centre will be fully operational in late 2006 and Total plans to invest around $25m in the first five years on research and development of new technologies, training and technical assistance.
Nigeria Usan field development approved
Elf Petroleum Nigeria, a unit of France’s Total has succesfully drilled two appraisal wells in the Usan field in deep-water oil prospecting licence 222, offshore south eastern Nigeria. The field is located 110 km offshore in water depths of 800 m. The Nigerian National Petroleum Corporation (NNPC), as concessionaire of the licence, has approved a field development plan which envisages 35 sub-sea wells connected to a 2 million barrel capacity floating production, storage and offloading vessel. The processing capacity is around 150,000 b/d and first oil is expected in 2010.
The Dolphin Gas Project, which will
process raw gas from Qatar’s North Field
and deliver it by pipeline to customers in the
United Arab Emirates (UAE), has secured $4bn
in binding financing commitments from 25
national, Islamic and international financing
institutions for its forthcoming gas project.
Dolphin’s Chief Executive Officer, Ahmed
Ali Al Sayegh, said: “The financial markets for
both Islamic financing and the conventional
lending, have made a strong statement about
the confidence they have in Dolphin Energy
and the vision for regional energy integration
behind it.”
Dolphin will accept around $3.5bn of the
four year commitments offered, which will
cover the construction costs of the project
in line with its scheduled completion in
late 2006. The conventional lending facility
amounts to $2.45bn and the Islamic financ-
ing is expected to be $1bn.
The Islamic facility will innovatively com-
bine two Sharia’a compliant financing tech-
niques, an Ijara (sale-leaseback of operational
assets) and an Istisna’a (forward lease of
assets not yet in service).
Al Sayegh said: “We are especially proud
Dolphin Gas secures financing
Gas from Qatar will be piped to Dubai under one of the Gulf’s most important regional energy projects.
to offer Islamic institutions the opportunity
to participate in the $1bn facility, the largest
ever Islamically structured oil and gas financ-
ing. We are particularly pleased that our lead
banks are making a special point to invite
Islamic investors from across the Middle East
and Asia to join the financing.”
There are five Islamic Mandated Lead
Arrangers (MLAs) and the conventional facil-
ity of $2.45bn is led by 15 MLAs
The funding comes one month after a cer-
emony to mark the formal start of construction
work on the $1.6bn gas processing plant for
the project in Ras Laffan City, Doha. This will
come on stream in 2006 with gas from the
plant being piped 370 km via Dolphin’s ded-
icated two billion cubic feet per day, 48-inch
pipeline to Taweelah in Abu Dhabi for distri-
bution to customers throughout the UAE. A
spur link will then carry 700m cu ft/d of gas
onto Dubai.
Dolphin Energy is owned 51 per cent by
Mubadala Development Company, on behalf
of the Government of Abu Dhabi with Total of
France and Occidental Petroleum of the US
each holding a stake of 25 per cent in the
company.
AP
Pho
to

28
OPE
C bu
lleti
n 7–
8/05
Me
mb
er
Co
un
try
Fo
cu
s
Iraq reconstruction meeting claims success
From l-r: Deputy Special
Representative for the UN Secretary General in Iraq,
Staffan Demistura, Chair of the IRFFI Donor Committee,
Michael Bell, Iraqi Minister of
Planning,HE Barham
Salih and World Bank Vice-
President, Middle East, Christian
Poortman, attend a news conference after the meeting.
Dead Sea, Jordan — A meeting of the Donor Committee
of the International Reconstruction Fund Facility for Iraq
(IRFFI) held in Jordan in July ended with a “very strong com-
mitment” on behalf of the attendees to advance the role
of the Iraqi government in the country’s reconstruction.
“I feel that we have had a remarkably successful two
days,” said Chair of the IRFFI and Canadian Ambassador,
Michael Bell, “we have made important decisions. In
particular, the Donor Committee has signaled its strong
support for Iraqi ownership of the process of reconstruc-
tion. We strive to better align the work of the Trust Funds
to Iraqi priorities and we have welcomed Iraq’s stronger
role in the IRFFI.”
A delegation from the Iraqi government, headed by
Minister of Planning and Development Co-operation, HE
Barham Salih, presented its vision for the reconstruc-
tion of the country and identified governance and basic
human needs as priorities for the near-term.
The government also called for an accelerated imple-
mentation of reconstruction efforts, “consistent with Iraqi
priorities based on national execution and equitable dis-
tribution of developmental resources.” The delegates
also discussed how best to co-ordinate efforts to move
the reconstruction process forward.
The IRFFI was established in Madrid in 2003 to facil-
itate the provision of reconstruction assistance to Iraq
in a co-ordinated and effective manner. It has two trust
funds, separately administered by the World Bank and
the United Nations, which work in close co-ordination
with the Iraqi authorities and donors.
To date, international donors have committed a total
of $1 billion to the two funds. At the meeting in Jordan,
Denmark became the newest member and made an
additional pledge of $5.5m. Pledges were also announced
from Australia ($20m), Greece ($2.4m), the European
Commission ($150m), Italy ($10m) and Spain ($20m).
Reu
ters

29
OPE
C bu
lleti
n 7–
8/05
“This is good news and I thank the new donors for
their generous contributions,” Salih said. “I warmly wel-
come them and view these new pledges as a sign of
the increasing international commitment to helping the
people of Iraq.”
The next IRFFI Donor Committee meeting will be
held in February 2006 either in Erbil, Iraq or Istanbul,
Turkey. Deputy Special Representative of the UN Secretary
General for Iraq, Staffan de Mistura said, “We will now
go forward in the next six months with clear key priori-
ties to make a difference for the people of Iraq in their
every day lives.”
The meeting also saw the World Bank extend its first
lending to Iraq in three decades. In response to a request
from the Iraqi Government, up to $500m in soft loans will
be made available over the next two years to finance devel-
opment projects in priority sectors. The Bank’s Country
Director for Iraq, Joseph Saba, said it would “intensify
efforts to support Iraq in providing basic services and
deliver results on the ground.”
Algiers — Investments in Algeria through the European
Union’s (EU) Euro-Mediterranean programme totaled $6
billion in 2004, making the North African country the larg-
est recipient amongst programme members. Investments
in Algeria were ahead of Morocco, ($4bn) and Turkey
($2bn). The high level of investment reflects the positive
economic outlook in the country.
The majority of the investments were made in some
23 oil and gas projects, nine power projects, as well
as desalination plants and tourism-related activities,
including the construction of six new hotels in resort areas
along Algeria’s Mediterranean coast.
Algeria signed an Association Agreement with the
EU in 2002. These agreements, which apply to certain
Algeria tops EuroMed investments
EU Commissioner for External Relations and European Neighbourhood Policy,Benita Ferrero-Waldner (l)meets with Algerian President Abdelaziz Bouteflika (r).
nations bordering the Mediterranean, cover several areas
of co-operation. The EU’s Commissioner for External
Relations and European Neighbourhood Policy, Benita
Ferrero-Waldner, recently conducted a two-day working
visit to Algiers (see picture below) where she met with
Algeria’s President, Abdelaziz Bouteflika, to discuss the
specific steps to be taken to implement and realize the
Association Agreement.
Meanwhile, it has been announced that a ninth round
of official negotiations between the Algerian government
and the World Trade Organization (WTO) will be held in
September. An informal meeting on Algeria’s accession
to the WTO was held at the Organization’s headquarters
in Geneva, Switzerland, in the middle of July.
Reu
ters

30
OPE
C bu
lleti
n 7–
8/05
Me
mb
er
Co
un
try
Fo
cu
s
Tripoli — The United Nations World Food Programme
(WFP) has welcomed Libya’s agreement to help cover
the costs of its airlift of food to western Sudan’s Darfur
region, where up to 3.25 million people require its
assistance.
“We thank the Libyan people and its government for
this generous gesture which will allow for the continua-
tion of WFP’s humanitarian airlift of food from Al Kufra
in Libya to Darfur,” said WFP Deputy Executive Director,
John Powell.
The Socialist People’s Libyan Arab Jamahiriya has
agreed to waive tariff increases on jet fuel for this human-
itarian cargo. Without this help, the WFP said it would
Libya praised for Darfur effort
Sudanese women brush up cereal grains spilled from food aid bags dropped by aircraft under the UN World Food Programme (WFP) near Habilla, west Darfur.
Reu
ters
have been forced to suspend the airlift because rising
jet fuel prices would have cost the agency an additional
$1.5m to maintain the operation.
“It was money we don’t have and we are extremely
grateful to the Libyan government for their assistance,”
said WFP Regional Director for the Middle East, Central
Asia and Eastern Europe, Amir Abdulla. The WFP said
the Libyan offer had come “just in time” as airlifts are
important during the rainy season, when roads in Darfur
become impassable and the need for food aid peaks.
“The Libyan corridor has been a vital link to the refu-
gees and internally displaced population by allowing us
to dramatically increase the amount of food aid we can
deliver,” said WFP Sudan Country Director, Ramiro Lopes
da Silva.
Since August 2004, Libya has provided a crucial trans-
portation corridor which allows for substantial deliveries
of WFP food aid to be moved by truck and air from the
Libyan port of Benghazi into eastern Chad and the three
Darfur states in western Sudan. The airlift began on May
7 with an aircraft carrying the first 38 tonnes of food from
Al Kufra to Darfur. There are currently two daily flights to
the North Darfur capital of El-Fasher and the South Darfur
capital of Nyala. To date, the airlift has delivered a total of
5,623 t of food — enough to feed almost 150,000 people
for two months.
“It is a relief not to have to suspend this airlift. We are
already using all possible means to get food into Darfur.
The loss of this route would have made it more difficult for
WFP to provide for up to 3.25m people we plan to assist
from August through to October,” Abdulla said.

31
OPE
C bu
lleti
n 7–
8/05
Riyadh — Saudi Arabia has announced a series of
measures to improve the country’s investment climate,
removing obstacles facing private investors, allowing
foreign manpower recruitment and speeding up licens-
ing procedures.
The Kingdom’s Supreme Economic Council in charge
of economic reform has already approved the implementa-
tion of 17 agreements between the Saudi Arabian General
Investment Authority (SAGIA) and relevant government
departments to make Saudi Arabia more investment-
friendly.
SAGIA Chief Executive, Amr Al-Dabbagh, said the
agreements encouraged the private sector to set up spe-
cialized universities and colleges in conjunction with
renowned world universities, foster industrial projects by
giving exemptions on customs tariffs, and grant facilities
such as entry visas to foreign investors.
The agreements also call for the streamlining of judi-
cial procedures to resolve trade disputes, strengthening
guarantees for investors, promoting women’s input in
investment and speeding up the process of collecting
imports from entry ports, he said.
Other measures include offering special incentives to
locals and foreigners who invest in less developed areas
of the Kingdom and drafting plans to raise the operational
capacity of Saudi ports.
In addition, the time for getting investment permis-
sion and trade registration to launch foreign projects is
to be reduced, while special incentives are to be offered
for projects that contribute to GDP. The process of bring-
ing in expatriate workers will be eased and incentives
offered to attract projects that will employ large numbers
of Saudis.
The mechanisms to improve the Kingdom’s invest-
ment climate were prepared with the support of a number
of government agencies including most Ministeries.
Dabbagh said the challenge for SAGIA and the other
agencies in the next stage was implementing the agree-
ments. He added that the updates would be provided on
the effect of the agreements on the Kingdom’s investment
competitiveness.
Saudi Arabia boosts investment climate
Saudi Arabia has unveiled a series of measures aimed at improving the investment climate in the Kingdom.
Reu
ters

32
OPE
C bu
lleti
n 7–
8/05
Me
mb
er
Co
un
try
Fo
cu
s
Doha — Qatar Airways has announced plans for a $15.2
billion order for new aircraft from both Airbus and Boeing
as part of its ongoing expansion. The order for up to 60
Airbus A350s worth $10.6bn, makes Qatar Airways the
largest customer for the aircraft so far. The airline said
negotiations were under way with both Airbus and Boeing
“subject to the resolution of certain important outstand-
ing issues with each manufacturer.”
The planned Airbus order is for a mix of two variants,
A350-800s and larger A350-900s. Deliveries of the first
type will begin in the third quarter of 2010 followed sev-
eral months later by the larger version.
Qatar Airways is the largest all-Airbus operator in the
Middle East with a 40-strong fleet that comprises aircraft
from the A320, A300/A310 and A330/A340 families.
The airline said it would use the A350-800s and –
900s to complement its A330s and A340s on regional
and long-haul routes, respectively. Envisaged non-stop
routes from Qatar Airways’ Doha base include New York
and Melbourne for the A350-800s, and Johannesburg,
Manila and Tokyo for its A350-900s.
Qatar Airways major aircraft order
Qatar Airways Chief Executive Officer, Akbar Al Baker,
said: “The order was made after a very detailed evaluation
and a very extensive analysis. In the end, the commonal-
ity with the A330s already in our fleet and the advantage
of the A350 in terms of seat mile cost were the decision
factors.”
The order with Boeing of the US is worth $4.6bn, with
the airline planning to buy at least 20 Boeing 777 aircraft
of three variants: B777-300ER, B777-200LR and B777-
200F. Qatar Airways said it planned to make the B777
the airline’s standard large wide-body aircraft with the
B777-300ER version likely to account for around half of
the orders.
Deliveries will take place between 2007 and 2010.
The B777-300ER will be used to increase capacity on air-
port slot-constrained routes while the B777-200LR will be
allocated to new routes in North America and Australasia.
The B777-200F is a freight aircraft which, the airline said,
would be used to increase cargo capacity once the new
Doha International Airport opens in 2009 (see OPEC
Bulletin, March 2005, page 56).
Air
bus
Qatar Airways’ planned order is the largest to date for the
new Airbus A350.

33
OPE
C bu
lleti
n 7–
8/05
Abu Dhabi — An outward-oriented development strat-
egy, a good record in macro-economic management, and
a business-friendly environment have resulted in impres-
sive economic growth in the United Arab Emirates (UAE)
over recent years, according to a new report from the
International Monetary Fund (IMF).
Economic diversification has advanced rapidly, it
said, supported by an increased role of the private sec-
tor, which has laid the foundation for further economic
and social progress in the period ahead.
“Reflecting sharply higher oil prices and increased
oil production, strong investor confidence, and a signifi-
cant increase in foreign direct investment (FDI), economic
IMF praises UAE economy
The UAE has seen impressive economic growth in recent years.
growth in the UAE is estimated to have been very strong
in 2004,” the report said.
Preliminary data from the IMF for 2004 suggests that
real non-hydrocarbon GDP grew at 10 per cent, while
hydrocarbon production rose three per cent. Growth was
broad based with most sub-sectors growing at historically
high rates, with manufacturing leading the way, followed
by services and construction.
The IMF’s Executive Directors said the medium-term
economic outlook for the UAE was favorable and that it was
“in a good position to consolidate the recent gains from the
high oil prices”, while “soaring assets prices and emerg-
ing inflationary pressures warrant close monitoring.”
AP
Pho
to

OPE
C bu
lleti
n 7–
8/05
Tehran — Iran’s Bourse Council is to launch the first-ever oil, gas and pet-
rochemical stock market in the Islamic Republic, according to a report from
the Tehran-based Petroenergy Information Network (PIN).
Iran’s Deputy Minister of Petroleum, Mohammad Javad Assemipour,
told PIN the stock market would play a significant role in national revenues
and transparency in oil deals. The idea for the new exchange originated in
the government of outgoing President, Mohammad Khatami.
“We sought consultation from 180 stock markets and relevant insti-
tutes in the world before deciding to open this bourse in Iran. But we have
not copied their structures and we have our own system in the country,”
Assemipour told PIN. “In the first stage, oil products and petrochemicals
will be traded on this bourse.” The new market will be located on Kish
Island with branch offices at Assaluyeh and Ahvaz.
Nigeria to bid for Commonwealth Games
Abuja — Nigerian President, Olusegun Obasanjo, has inaugurated a com-
mittee that will supervise the country’s bid to host the 2014 Commonwealth
Games sporting event in Abuja. The 18-member committee to be led by
Former Head of State, Yakubu Gowon, will be responsible for creating a bid
package and documentation
Gowon said the task was “an enormous one — considering that five
other Commonwealth countries — Canada, Scotland, New Zealand, Wales
and Singapore had started their bid process more than one year ago.”
Obasanjo, who is currently Chairman of the Commonwealth Heads of
Government Meeting, said the decision to proceed with the bid was “based
on the conviction that now was the right time for the country.” He added
that hosting the games would expose the Nigerian country and people to
the outside world, involve the development of new road, telecommunica-
tions and sporting infrastructure, boost foreign exchange earnings and
help promote tourism in the country. A successful bid would also repre-
sent Nigeria’s “first critical step towards hosting the Olympics,” sometime
in the future.
The announcement of the bid comes after Nigeria successfully hosted
the All-Africa Games in October 2003 at Abuja’s modern sports’ stadium.
The Commonwealth Games, which see sportsmen and sportswomen com-
peting from 53 countries, began in 1930, and are held every four years.
Iran’s new energy exchange will be the first of its kind in the region.
Iran to launch energystock market
Nigeria hopes its successful hosting of the All-Africa Games in 2003 will support the new bid.
Reu
ters
AP
Pho
to

OPE
C bu
lleti
n 7–
8/05
Caracas — The Government of the Bolivarian Republic
of Venezuela has made a donation of $8.2 million to
help victims of last December’s tsunami in Sri Lanka
and Indonesia. The donations, in the form of $6.2m to
Sri Lanka and $2m to Indonesia, were handed over by
the Foreign Ministry following a campaign initiated by
President Hugo Chavez, called ‘One Bolivar for Asia’.
Venezuelan citizens were asked to donate one Bolivar
to the campaign as a gesture of solidarity with people
whose lives were affected by the tsunami that hit coun-
Venezuela helps tsunami victims
Many tsunami survivors in Sri Lanka are living intemporary housing.
tries surrounding the Indian Ocean on December 26,
2004. Over 180,000 people died in the disaster and a
further three million were injured, displaced or suffered
material losses as a result. Coastal areas of Indonesia
and Sri Lanka were among the hardest hit.
The donations to Sri Lanka will go the country’s
Tsunami Relief Fund and will be used to build 100 new
homes at various locations to be determined by the local
government. The Sri Lankan government has officially
thanked Venezuela for the donation.
Reu
ters

36
OPE
C bu
lleti
n 7–
8/05
OP
EC
Fu
nd
Lo
an
s a
nd
Gra
nts
Fund highlights
Reu
ters
Developing countries inthe southern hemisphere
registered their highestaggregate growth rate in 2004
for almost three decades,according to the OPEC Fund
for International Development’sAnnual Report.

37
OPE
C bu
lleti
n 7–
8/05
The Fund’s Director-General, Suleiman J Al-Herbish,
described 2004 as “encouraging” but also warned that
“systemic vulnerabilities” remained along with “prob-
lems of sustainable growth with equity.”
By the end of 2004, the Fund’s cumulative commit-
ments since its inception stood at $7,474.5 million and
total disbursements had reached $4,925.8m.
During the year, $528.624m was committed in loans
and grants and $287.722m was disbursed. In 2004, the
Fund approved 42 project loans worth $413.4m to 37
countries, helping finance development operations in
a range of sectors, with transportation (35.5 per cent)
and agriculture (16.7 per cent) taking the largest shares.
Substantial resources were also directed towards the
multi-sectoral, energy, health, education and water sup-
ply and sewerage sectors.
Cumulatively, to the end of 2004, the Fund had
approved 1,024 public sector loans, amounting to
$5,845.7m. Countries in all developing regions of the
world had benefitted from the Fund’s lending activities
with Africa receiving a total of 583 loans, Asia 272 loans,
Latin America and the Caribbean 158 loans and Europe
10 loans. In line with its mandate to target the neediest
nations, $3,143.9m or 54 per cent of the Fund’s total
lending commitments have been channelled to the least
developed nations.
For the private sector, cumulative approvals had,
by the end of 2004, reached $335.4m in support of 67
operations in Africa, Asia, the Middle East, Latin America,
the Caribbean and Europe. Approvals for 2004 included
18 loans valued at $91.5m, one line of credit worth $5m
and one equity investment of $810,000.
In 2004, the Fund approved 52 grants worth a total
of $17.93m of which $2.95m went to finance technical
In 2004 the OPEC Fund extended aid to
countries affected by natural disasters,
including the tsunami.
2004 achievements

38
OPE
C bu
lleti
n 7–
8/05
assistance schemes; $6.59m supported projects within
the framework of the HIV/AIDS Special Grant Account;
$5.775m was committed from the Special Grant Account
for Palestine; $761,000 went to fund research and similar
activities; and $1.85m helped support emergency relief
operations.
The technical assistance grants benefitted a diverse
range of causes, covering primarily initiatives in the health,
education and agriculture sectors. In the area of emer-
gency assistance, aid was extended to a number of coun-
tries affected by natural disasters, including the tsunami
as well as to victims of the humanitarian crisis in Darfur.
In all, some 711 grants valued at $321.6m had been
cumulatively committed by the Fund as of December
31, 2004. Of this sum, $107.2m was made available
as technical assistance; $21.2m was given to finance
projects within the framework of the HIV/AIDS Special
Grant Account; $20m was given to the Food Aid Special
Grant Account; $13.3m was approved from the Special
Grant Account for Palestine; $49.1m was provided in
support of emergency relief operations; and $7.3m
sponsored research and similar activities. In addition, a
special grant of $20m was extended to the International
Fund for Agricultural Development (IFAD) and a contri-
bution of $83.6m was made to the Common Fund for
Commodities.
Among the various international institutions which
have received OPEC Fund support since 1976 are IFAD,
which supports rural development ($861.1m) and the IMF
Trust Fund, which benefits low-income member countries
($110.7m).
The 2004 Annual Report was adopted by the Fund’s
Ministerial Council which held its annual meeting in
Seefeld, Austria, in June 2004. Al-Herbish reported that
the Fund had successfully completed its 15th Lending
Programme (2001–2004) and also highlighted a new
Corporate Plan (2006–2015) which he described as
“crafting a vision for the way ahead and shaping a new,
more innovative and progressive OPEC Fund.”
He also stressed the need for partnership and harmo-
nization in achieving the eight Millenium Development
Goals (see OPEC Bulletin 5/05 page 38): “As we strive to
move toward their accomplishment, we would need to
increase harmonization of our efforts with others, includ-
ing strengthening of relations with partner countries and
institutions.” In this regards, 2004 saw the Fund hold pro-
ductive discussions both with several partner countries
and with other donors.
Al-Herbish has called for a re-thinking of trends in
development co-operation and urged donors “to focus
on basic needs and on areas of critical under-investment
such as agriculture and infrastructure.”
AP
Pho
to
The OPEC Fund is working closely
with the United Nations Relief
and Works Agency to help
Palestinian refugees.
OP
EC
Fu
nd
Lo
an
s a
nd
Gra
nts

39
The Fund’s Ministerial Council also approved the allo-
cation of fresh resources to two Special Grant Accounts
— one for Palestine and the other for HIV/AIDS opera-
tions.
Some $15m has been allocated to the Palestine
account, which was established in 2002 with an initial
endowment of $10m and designed to alleviate hardship
and prevent further impoverishment and suffering among
the Palestinian people. The Account has supported numer-
ous initiatives, ranging from the rebuilding of damaged
infrastructure and the provision of medical assistance to
micro-credit and a wide range of capacity-building and
social projects.
The OPEC Fund is working closely with leading Arab
aid institutions in the selection and preparation of the
projects supported under the special account. Partners
include the Islamic Development Bank and the Arab Fund
for Social and Economic Development, as well as the
United Nations Relief and Works Agency for Palestinian
Refugees.
Meanwhile, another $15m has been approved for
the Special Grant Account for HIV/AIDS Operations.
This account was established in June 2001 with initial
resources of $15m and has subsequently been replen-
ished twice. The new allocation boosts the account to
$50m.
With its HIV/AIDS Programme, the Fund is currently
implementing projects and programmes in all developing
regions of the world, providing assistance to countries and
communities in Africa, Asia, the Pacific, the Caribbean,
Latin America and the Middle East. The Fund’s primary
areas of intervention cover prevention and reduction of
vulnerability together with care and support to people
living with the virus.
The Fund’s initiatives are being carried out in close
co-operation with leading international agencies such
as UNAIDS, the World Health Organization, the United
Nations Population Fund, the International Labour Office,
UNESCO, UNICEF and the International Federation of Red
Cross and Red Crescent Societies. A total of 64 countries
are currently benefiting from these joint efforts.
Ethiopian orphans who lost their parents through HIV/AIDS.
New resources for Palestine,HIV/AIDS
Reu
ters

40
OPE
C bu
lleti
n 7–
8/05
OP
EC
Fu
nd
Lo
an
s a
nd
Gra
nts
In late June 2005, the OPEC Fund signed a $5 million loan
agreement with the Republic of Cameroon in support of the
Yaoundé-Kribi Road Project to upgrade the first section of
the existing RN8 from the southern outskirts of the capital
Yaoundé to the town of Olama. The project road stretches
over 271 kilometres and consists of two sections. The Fund’s
loan will complement the recently upgraded 191 km section
linking Olama to Kribi.
The rehabilitation of the National Road 8 linking Yaoundé
to Kribi through Olama, is one of the development priorities
of the government of Cameroon, due to its regional strategic
importance for transit traffic from the
landlocked neighbouring countries of
Chad and the Central African Republic
to the port of Kribi.
On completion, the enhanced
road will serve in the transport of
agricultural products of the region
both to the capital city and the port
of Kribi. Furthermore, the importance
of the road stems from the need to
develop the port of Kribi as a deep-
sea port to complement the activities
of the existing port of Douala, whose
present location on the river Wouri
constrains its expansion.
Other factors include the devel-
opment of an industrial zone close
to Kribi port and plans for processing
and exporting liquefied natural gas
(LNG) and an export terminal for the
crude oil coming from Chad, in addi-
tion to meeting the export require-
ments for bauxite, steel and timber.
This is the third loan approved by
the Fund to Cameroon in support of
transport.
Fund extends $5m to Cameroon
New roads will help agricultural
distribution and improve links for
Chad and the Central African Republic.
Ana
juli
a Ta
rter
Ana
juli
a Ta
rter

41
In July, the Fund signed five grant agreements, totalling
$4.6 million, for projects in the social, health and agri-
culture sectors. The recipient organizations are UNICEF,
the League of Arab States (LAS), the International Center
for Agricultural Research in the Dry Areas (ICARDA), the
International Crops Research Institute for Semi-Arid
Tropics (ICRISAT), and the International Center for Potato
Research (CIP).
The $4m grant to UNICEF will co-finance a joint OPEC
Fund/UNICEF Mother/Child Global Project to Fight HIV/
AIDS. The initiative aims to assist orphans, street chil-
dren and vulnerable mothers and will concentrate on
three areas: care, protection and support for orphans;
HIV prevention and life skills development for street chil-
dren; and prevention of mother to child transmission of
HIV. The grant will be drawn from the Fund’s Special Grant
Account for Combating HIV/AIDS.
Social, health and agricultural grants A grant of $250,000 will support phase two of the Pan
Arab Project for Family Health (PAPFAM). Spearheaded by
the LAS, the project seeks to improve family and reproduc-
tive health in 16 Arab countries, by developing mecha-
nisms for the implementation of effective health policies
and programmes.
The remaining three grants will support agricultural
research being carried out by member institutes of the
Consultative Group on International Agricultural Research
(CGIAR): $150,000 was extended to ICARDA to co-finance
a major regional research project aimed at institutionaliz-
ing and scaling-up participatory barley breeding in West
Asia and North Africa; ICRISAT received $100,000 for a
four-year project to promote and improve groundnut pro-
duction among poor farmers in Asia; and $100,000 to
CIP for a capacity-building project designed to enhance
potato crop management in Latin America and Africa.
Reu
ters
Part of the grants will fund agricultural
research in the dry areas.

42
OPE
C bu
lleti
n 7–
8/05
Crude oil price movements
OPEC Reference Basket1
The crude oil market had a strong start in
the month of June as tight downstream capacity
and concern over distillates supply added bull-
ish momentum to the market. In the first week,
the Basket saw a gain of $2.55 or 5.5 per cent
to average $48.57/barrel. A US refinery glitch
also heightened concern over tight fuel supplies
in the Western hemisphere. However, the nar-
rowing Brent/Dubai spread opened arbitrage
opportunities for western crude to flow east-
ward, which capped any further rise in prices
amid a healthy build in the US distillates stocks.
In the second week, the Basket rose a healthy
$2.16 or 4.5 per cent to settle at $50.73/b as
the daily price broke through the $51 level for
the first time since early April. During the third
week, the market moved steadily upward fol-
lowing an early start of the hurricane season
in the Gulf of Mexico amid product concerns
and varying opinions over the outcome of the
OPEC’s June Meeting of the Conference. While
the market digested the OPEC decision to raise
the production ceiling by 500,000 b/d to 28m
b/d, a larger-than-expected drop in US gasoline
stocks amid another hefty draw in crude oil
inventories sent the Basket price soaring above
the $52 mark. As a result, the Basket registered
a weekly gain of 1.8 per cent or 89¢ to stand at
$51.62/b (see Table A).
On June 15, the OPEC Meeting of the
Conference adopted a new OPEC Reference
Basket (ORB). The new Basket consists of 11
crudes, representing the main export crudes
of the Member Countries weighted according
to production and exports to the main markets.
In that same week, concern over tight summer
fuels continued to pressure prices, while a
security alert in Nigeria added to market fears.
The new ORB began on a bullish note surging
$1.40 or 2.8 per cent, before gaining another
$1.20 or 2.3 per cent. Accordingly, the fourth
weekly average for the ORB closed 1.6 per cent
higher for a gain of 83¢/b to settle at $52.45/b.
Continued healthy demand growth into the final
week amid concern over bottlenecks in down-
stream capacity kept bulls intact.
However, high outright prices prevented
some regional markets from moving any farther
while the futures market slumped on hefty profit
taking. Bearish US weekly data amid weakened
demand from China pressured prices further
downward as the Basket dropped 2.5 per cent
in one day, but still closed the week 74¢ higher
at $53.19/b.
On a monthly basis, with the new calcula-
tion, the Basket averaged higher on concern
over refinery bottlenecks amid several refinery
glitches in the western hemisphere. Using a com-
bination of the old and new Basket calculations,
the monthly average for June rose to $52.04/b,
a gain of $5.08/b or 11 per cent from the pre-
vious month. When solely applying the old
methodology, the ORB rose average $52.72/b,
a gain of $5.76 or 12 per cent for the month
higher, while the new methodology would show
an average of $50.92/b for a gain of $5.81 or 13
per cent. The Basket continued to move higher
in the early part of July on concern over winter
fuels amid an abrupt start to the hurricane sea-
son. As a consequence, the Basket peaked at an
all time high of nearly $55/b on July 8.
US market The US market began June on a bullish note
following the inauguration of the driving sea-
son and prospect of tight distillate fuels amid
strong demand for diesel oil. WTI cash crude
surged by nearly five per cent on the first day
of the month. However, petroleum data for the
first week revealed growing stocks of gasoline
and other fuels, which helped to ease the mar-
ket with WTI cash crude plunging nearly two
per cent in the second day. In contrast, strong
implied demand growth inspired bullishness
in the marketplace, furthered by tight refining
capacity and concern that distillates stocks
would not be sufficient to meet demand needs
in the second half of the year. The first week
average for WTI cash crude was up $3.38 or
1. An average of Saharan Blend (Algeria), Minas (Indonesia), Iran Heavy (IR Iran), Basra Light (Iraq), Es Sider (SP Libyan AJ), Bonny Light (Nigeria), Qatar Marine (Qatar), Arab Light (Saudi Arabia), Murban (United Arab Emirates) and BCF-17 (Bachaquero, Venezuela).
This section includes the OPEC Monthly Oil Market Reports (MOMR)
for July published by the Research Division of the Secretariat, con tain ing
up-to-date anal y sis, ad di tion al in for ma tion, graphs and tables.
The publication may be downloaded in PDF format from our Web site
(www.opec.org), provided OPEC is cred it ed as the source for any usage.
Ma
rke
t R
ev
iew
July
July
July
July

43
OPE
C bu
lleti
n 7–
8/05
nearly seven per cent to settle at $52.88/b
with the WTI/WTS spread 9¢ lower at $2.64/b.
In the second week, US stock data showed
a draw in crude oil stocks, while distillates
saw a healthy build. The higher distillate lev-
els exerted downward pressure on US cash
crude. The formation of tropical storm Arlene
signaled an early start to the US hurricane
season and raised supply fears in the Gulf of
Mexico. In the second week, WTI rallied over
two per cent to average $54.02/b and the West
Texas Intermdiate/West Texas Sour (WTI/WTS)
spread widened 26¢ to $2.90/b.
The market was divided over various
aspects of the IEA’s report which forecast slow-
ing demand from China. Better weather in the
US Gulf and an OPEC decision to increase the
output quota by 500,000m b/d to 28m b/d also
eased prices. Prices surged again in the third
week on the back of an unexpected draw in
crude stocks amid continuing market concern
over tight refining capacity and the perception
that surging global fuel consumption would
stretch the production capacity of OPEC and
other producers.
WTI cash crude surged another 2.2 per cent
to close at $55.21/b, while the WTI/WTS spread
edged 20¢ lower to $2.70/b. Volatility contin-
ued into the fourth week following a security
alert in Nigeria amid concern over increasing
demand in the second half of the year, which
sent WTI up 3.7 per cent in the first day of the
weekly period. The unexpected build in US
distillates stocks stalled the bulls; however, a
refinery glitch at BP’s 460,000 b/d Texas City
refinery revived fears of a supply shortfall. WTI
weekly average surged 6.4 per cent to settle at
$58.73/b while WTI/WTS spread inched up 4¢
to $2.74/b. In the final week, the stride contin-
ued as crude futures prices peaked over $60/b
sending the message that higher prices were
not yet choking the US economy.
However, fund sell-offs in the futures market
amid weekly petroleum data revealing a healthy
build in the US petroleum complex caused the
market to slump by well over six per cent in the
final three days of June. As a result, the weekly
average for WTI cash crude plunged $3.67/b to
settle at 56.73/b.
European market The market in Europe mirrored movement
in the paper market on unsold Brent barrels
for second half June loading. Brent was out of
favour in the north which forced sellers to raise
their discounts, causing cargoes to clear quickly
in the first decade. The market then saw hope
for improvement in differentials as cargoes
cleared ahead of the new programme amid an
opening of the transatlantic window, which
firmed sentiment into the third week. Several
cargoes moved out of the region continuing to
support the bullish market sentiment for North
Sea grades inspired by refinery demand amid
concerns following a security alert in Nigeria.
Nevertheless, high outright prices kept buyers
on the sidelines, pressuring price differentials
in the final week of June, although concern over
refined product supplies strengthened distillate
margins. The market was briefly supported by a
move by Norway to eliminate two July stems fol-
lowing output problems for Oseberg amid thin
refinery interest for second decade July cargoes.
In the Mediterranean, strong Urals differen-
tials on healthy refining margins supported the
market for other grades amid availability and
stronger demand in the Black Sea. However, a
slip in refiner margins in the second week kept
buyers on the sidelines in the hope that prices
would fall. Widening fuel oil cracks and late
month availability continued to pressure the
market early in the third week. Nevertheless,
the market regained balance as some barrels
began to flow out of the region amid strength-
ening refinery interest due to improved mar-
gins. The sentiment softened into the fourth
week amid a long-awaited sell tender for Iraq’s
Kirkuk crude, which left the market looking well
Table A: Monthly average spot quotations for OPEC’s Reference Basketand selected crudes including differentials $/b
May 05 Jun 05 2004 2005OPEC Reference Basket 46.96 52.04a 32.59 46.71a
Arab Light1 47.09 52.47a 32.31 45.68a
Basrah Light 44.57 50.59a 31.72 44.37a
BCF-17 32.39 37.48 na 33.73b
Bonny Light1 50.23 55.93 33.72 50.43Es Sider 47.90 53.16 32.76 47.47Iran Heavy 43.25 49.60a 30.09 43.67a
Kuwait Export 46.36 51.15a 31.58 45.18a
Marine 46.66 52.27 31.36 45.47Minas1 50.34 55.02 33.11 50.60Murban 51.03 55.16 33.63 49.12Saharan Blend1 48.69 54.41 33.73 49.66Other crudesDubai1 45.68 51.37 31.41 44.59Isthmus1 45.05 51.48 33.39 45.12Tia Juana Light1 41.67 48.19 30.45 41.61Brent 48.90 54.73 33.70 49.59West Texas Intermediate 50.25 56.60 36.82 51.45DifferentialsWTI/Brent 1.35 1.87 3.12 1.86Brent/Dubai 3.22 3.36 2.29 5.00
Based on the current Basket methodology, the average for May would be: $45.11/bBased on the current Basket methodology, the average for June would be: $50.92/bBased on the old Basket methodology, the average for June would be: $52.72/b1. Old Basket components: Arab Light, Bonny Light, Dubai, Isthmus, Minas, Saharan Blend and T J Light.a. June average and year-to-date average 2005: As of the third week of June, the price is calculated ac-
cording to the current basket methodology that came into effect as of June 16, 2005.b. As of March 1, 2005.na not availableSource: Platt’s, direct communication and Secretariat’s assessments.

44
OPE
C bu
lleti
n 7–
8/05
Ma
rke
t R
ev
iew supplied. This put Urals under pressure and
weakened refining margins amid the expec-
tation that price differentials would narrow.
Volatility in the futures market contributed to
refiners’ reluctance to buy late in the month.
Far East market The market began June on hold, await-
ing the release of retroactive Mideast prices.
However, the last barrels of July Oman were
assessed at a 1–8¢/b premium to MOG while
Abu Dhabi Murban was heard to trade at as
much as a $1/b discount to ADNOC’s official
selling price (OSP) amid high outright prices in
the first weekly period. The narrowing Dubai/
Brent swap furthered pressure on Middle East
grades as rival western grades began to head
eastward. August Oman was on offer at a 2¢ pre-
mium and bid at a 10¢/b discount to the MOG
as the Brent/Dubai spread fell to its lowest level
in 11 months in the second week. The bearish
sentiment furthered into the third week on fall-
ing fuel crack spread, which left August Oman
valued at 15¢/b discount. Moreover, despite a
decline in May retroactive OSP for Abu Dhabi
crudes, sentiment was bearish on the expecta-
tion for ample supplies for August loading amid
the expectation of an increase in the OPEC out-
put ceiling. At the end of the third weekly period,
sentiment switched as the arbitrage opportu-
nity for western barrels closed. August Oman
was still assessed at an 8–15¢/b discount due
to the overhang in the August programme. The
bearishness sustained strength throughout the
month on the narrowing Brent/Dubai spread
amid an excess supply of fuel oil. Abu Dhabi
crudes remained under pressure on the per-
ception of larger allocation in July, while August
Murban fetched a 15¢/b discount to OSP. The
final week saw further weakening sentient as
Taiwan failed to take up their normal procure-
ment of Oman barrels. This left August Oman
under pressure on overhanging supplies to sell
at 20¢/b discount to MOG before being at a
55–60¢/b discount later in the week as refiners
remained on the sidelines due to high outright
prices. Moreover, Abu Dhabi slipped to –30¢/
b to the OSP on indisposed prompt cargoes at
the end of the trade window.
Asian market The Asian-Pacific market got off to a slow
start, despite the fact that the Tapis OSP for
May was lower than April. Soaring outright
prices hit Asian demand with India cancelling
its import-tender for sweet crude and China
shying away from Vietnamese grades. Hence,
Malaysia’s Petronas sold a July Tapis cargo at a
lower premium of 5¢/b compared to 10¢ for the
first cargo while they were on offer at a 30¢/b
premium to Tapis Asian Petroleum Price Index
(APPI). Overhanging July barrels forced Petronas
to sell a Bintulu cargo at parity while the final
cargo dipped into the negative territory to
be sold at a 30¢ discount to the APPI quote.
Moreover, in mid-month, the market focused
on a Pertamina buy-tender which doubled the
volume for August loading barrels amid an
overhang in supply and high outright prices for
benchmark Minas. Ongoing production prob-
lems at Australia’s Cossack field where output
was reduced by a third until October revived
hopes of a stronger market and boosted regional
crude differentials. Sellers of sweet regional
crudes stayed on the sidelines awaiting higher
premiums as August Tapis stood at 80¢/b over
the APPI quote. Towards the end of the month,
the market became concerned that the drought
in eastern Thailand might affect the petrochemi-
cal sector. Healthier refining margins for distil-
late rich grades gave a kick to the market. Hence,
August Australian grades saw a $1.80/b pre-
mium to Tapis APPI, while Malaysia Miri stood
at $1.50/b above Indonesia’s medium-sweet
Widuri and Cinta fetched 60¢/b more than the
Indonesian Crude Pricing (ICP). Nevertheless,
high outright prices caused refiners to hold
back in the hopes of opportunities for western
crude and cheaper Mideast barrels.
Product markets and refinery operations
The choppy ride in crude prices has outpaced
the performance of the product markets in June
and undermined refinery margins for sweet and
sour benchmark crudes across the globe com-
pared to the previous month. Refinery margins
for WTI in the US Gulf Coast dropped to $2.88/b
in June from $5.81/b in May. Similarly, refinery
margins for Brent and Dubai benchmark crudes
in Rotterdam and Singapore declined from
$4.33/b to $3.82/b and $4.96/b to $3.96/b.
Despite the drop in June, refinery margins still
looked healthy, especially in the wake of recent
storms in the US Gulf Coast, which allowed
margins to recover part of their earlier losses.
Meanwhile, the abrupt start of the hurricane
season has shifted market attention to the
products and the potential for shortages in
the months to come has lifted crude and prod-
uct prices. These developments suggest that,
despite the recent improvements in middle
distillate product stocks across the globe, the
market is highly sensitive to even small refinery
outages, which signals a potentially new bullish
factor for the product markets (see Table B).
Furthermore, following the completion of
spring maintenance and due to attractive refin-
ery margins for the light and middle cut of the
barrel, the refinery utilization rate rose globally,
particularly in the USA, where it reached 96.2
per cent in June from 93.2 per cent in the previ-
ous month. In Europe and Japan, margins surged
by 1.6 per cent and 5.3 per cent to record 87.4
per cent and 82 per cent, respectively.
US market Tropical storms, which resulted in the tem-
porary outage of a few refineries in the Gulf
Coast, further strengthened the sentiment of the
product market and lifted product prices, par-
ticularly gasoline. The gasoline market has also
been reinforced by rising demand. According
to the Energy Information Administration (EIA)
report of July 7, US gasoline demand increased
to 2.5 per cent over the last four weeks com-
pared to last year (see Table C).
Similarly, over the same period, distillate
demand has surged four per cent. However, at
the same time, the 8.5 per cent rise in output
has resulted in higher stock builds, easing ear-
lier acute concern about a potential shortage
of distillates in the latter part of the year. As
a result, distillate prices could not match the
recent gains of crude and gasoline prices, but
the crack spread for the middle of the barrel

45
OPE
C bu
lleti
n 7–
8/05
Table B: Selected refined product prices $/b
Apr 05 May 05 Jun 05Change Jun/May
US Gulf (cargoes)Naphtha 61.54 58.02 58.74 –3.52Premium gasoline (unleaded 93) 69.83 63.33 67.61 –6.50Regular gasoline (unleaded 87) 65.03 59.41 64.21 –5.62Jet/Kerosene 66.24 61.94 69.69 –8.01Gasoil (0.05% S) 65.62 61.64 69.49 –3.98Fuel oil (1.0% S) 39.65 39.81 41.40 0.16Fuel oil (3.0% S) 34.74 36.96 37.41 2.22
Rotterdam (barges fob)Naphtha 61.62 54.65 57.23 –6.97Premium gasoline (unleaded 50 ppm) 68.55 62.85 69.54 –5.70Premium gasoline (unleaded 95) 61.36 56.26 62.17 –5.10Jet/Kerosene 71.67 64.90 72.32 –6.77Gasoil/Diesel (50 ppm) 70.38 64.51 73.02 –5.87Fuel oil (1.0% S) 35.59 34.56 35.01 –1.03Fuel oil (3.5% S) 34.53 33.79 34.86 –0.74
Mediterranean (cargoes)Naphtha 51.05 44.97 46.94 –6.08Premium gasoline (unleaded 95) 59.51 53.58 59.95 –5.93Jet/Kerosene 69.93 62.57 69.74 naGasoil/Diesel (50 ppm) 71.44 64.90 73.65 –6.54Fuel oil (1.0% S) 38.31 35.99 38.33 –2.32Fuel oil (3.5% S) 33.67 32.20 33.59 –1.47
Singapore (cargoes)Naphtha 49.85 44.76 45.71 –5.09Premium gasoline (unleaded 95) 61.50 54.46 59.65 –7.04Regular gasoline (unleaded 92) 60.23 53.37 58.38 –6.86Jet/Kerosene 71.40 63.39 68.93 –8.01Gasoil/Diesel (50 ppm) 69.39 63.83 72.42 –5.56Fuel oil (180 cst 2.0% S) 38.30 38.00 39.34 –0.30Fuel oil (380 cst 3.5% S) 37.75 37.18 38.11 –0.57
remains strong. Despite the healthy situation
for the top and the middle cut of the barrel, US
market demand, particularly for high sulphur
fuel oil, has deteriorated further compared to
the previous month, although utility demand
has lent some support to low sulphur fuel oil.
European market The lack of favourable economic arbitrage
opportunities for gasoline exports to the USA,
ample diesel supply from the Baltic area and
the return of regional refineries from mainte-
nance had put pressure on clean and middle
distillate products in Europe. The crack spreads
for those products lost their earlier strength but
have recovered recently, supported by fear of
supply shortfalls due to the tropical storms in
the Gulf of Mexico.
Among clean products, market sentiment
for naphtha is still weak, as depressed condi-
tions in Asia spurred traders to send surplus
cargoes to Europe and competition from other
alternative sources like propane and LPG, as
feedstock for petrochemicals in replacement
of naphtha remains strong. Furthermore, heavy
products like high sulphur fuel oil, lost more
ground to the Brent benchmark amid plentiful
supply from the Baltic area and a lack of arbi-
trage opportunities to Asia. The crack spread for
high sulphur fuel oil against Brent declined from
–$15/b in mid-May to about –$24b on June 23,
but this decline has been partially offset recently
with the opening of export opportunities to
the USA for use as feedstock (see Table C).
Asian market The gasoline market, which has suffered
from slowing regional demand since the begin-
ning of April, recently recovered amid strong
demand from south-east Asian buyers. The
gasoline crack spread in the Singapore mar-
ket versus its corresponding Dubai benchmark
rebounded, rising to nearly $9/b from about
$6/b in early June. However, despite the recent
improvement in the reforming margin and petro-
chemical product prices, the market for naphtha
remained as poor as it has been over the last
two months. Heavy regional supply continued
to dog the market and concerns about slowing
regional demand pressured prices further, par-
ticularly in Thailand where a severe water short-
age has affected petrochemical plant operations
and feedstock requirements (see Table B).
With regard to distillates, the tight situation
globally along with healthy Indian gasoil imports
and recent robust demand from Indonesia,
have overwhelmed the impact of sluggish die-
sel demand from China, which switched to
become a net exporter of gasoil. As of June 25,
China increased the retail price of transpor-
tation fuel with diesel rising 3.8 per cent and
gasoline increasing 4.5 per cent. However, the
market believed that this is not likely to encour-
age Chinese companies to import diesel as
these gains are not significant enough to wipe
out import losses. The jet kerosene market was
relatively quiet in June, and its crack spread
against Dubai crude remained almost flat com-
pared to the previous month. Concerning high
sulphur fuel oil, the Asian market looked more
bearish, as Chinese buyers were absent from
the market and over 2.5 million tonnes of arbi-
trage cargoes were expected to arrive in July.
However, rising demand for thermal fuel oil from
Japan and South Korea lent support to the low
na: not available.
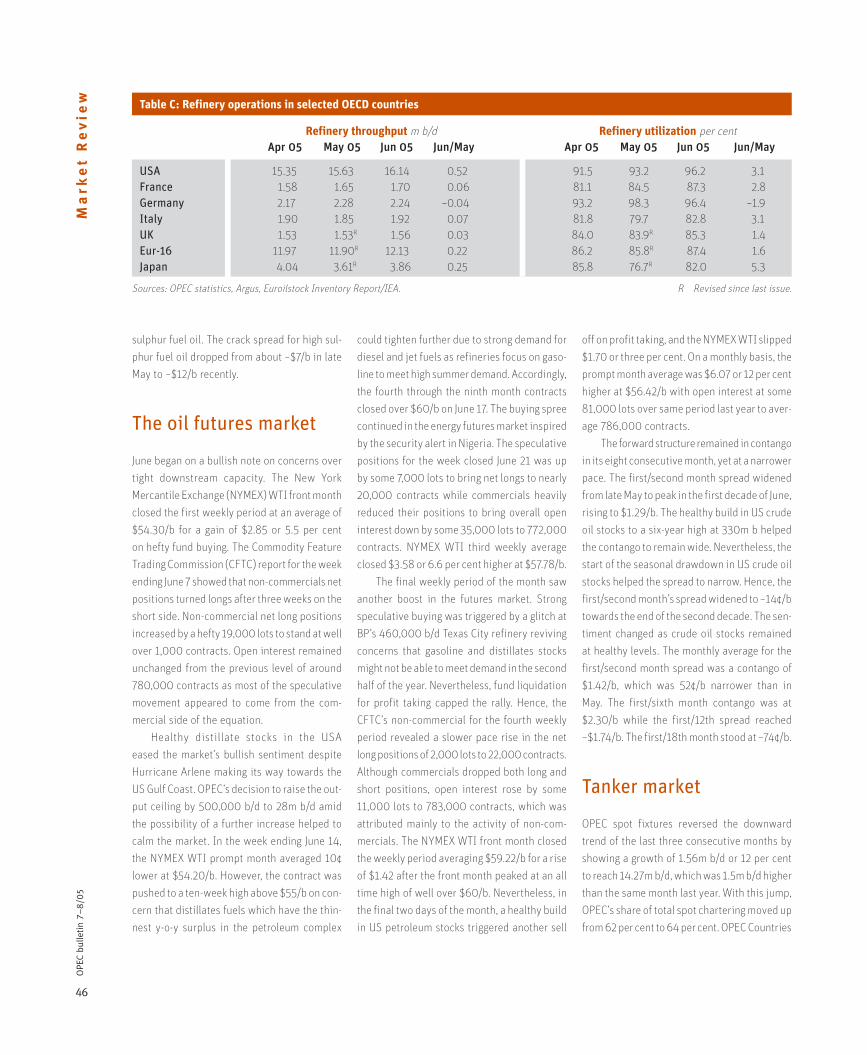
46
OPE
C bu
lleti
n 7–
8/05
Ma
rke
t R
ev
iew
sulphur fuel oil. The crack spread for high sul-
phur fuel oil dropped from about –$7/b in late
May to –$12/b recently.
The oil futures market
June began on a bullish note on concerns over
tight downstream capacity. The New York
Mercantile Exchange (NYMEX) WTI front month
closed the first weekly period at an average of
$54.30/b for a gain of $2.85 or 5.5 per cent
on hefty fund buying. The Commodity Feature
Trading Commission (CFTC) report for the week
ending June 7 showed that non-commercials net
positions turned longs after three weeks on the
short side. Non-commercial net long positions
increased by a hefty 19,000 lots to stand at well
over 1,000 contracts. Open interest remained
unchanged from the previous level of around
780,000 contracts as most of the speculative
movement appeared to come from the com-
mercial side of the equation.
Healthy distillate stocks in the USA
eased the market’s bullish sentiment despite
Hurricane Arlene making its way towards the
US Gulf Coast. OPEC’s decision to raise the out-
put ceiling by 500,000 b/d to 28m b/d amid
the possibility of a further increase helped to
calm the market. In the week ending June 14,
the NYMEX WTI prompt month averaged 10¢
lower at $54.20/b. However, the contract was
pushed to a ten-week high above $55/b on con-
cern that distillates fuels which have the thin-
nest y-o-y surplus in the petroleum complex
could tighten further due to strong demand for
diesel and jet fuels as refineries focus on gaso-
line to meet high summer demand. Accordingly,
the fourth through the ninth month contracts
closed over $60/b on June 17. The buying spree
continued in the energy futures market inspired
by the security alert in Nigeria. The speculative
positions for the week closed June 21 was up
by some 7,000 lots to bring net longs to nearly
20,000 contracts while commercials heavily
reduced their positions to bring overall open
interest down by some 35,000 lots to 772,000
contracts. NYMEX WTI third weekly average
closed $3.58 or 6.6 per cent higher at $57.78/b.
The final weekly period of the month saw
another boost in the futures market. Strong
speculative buying was triggered by a glitch at
BP’s 460,000 b/d Texas City refinery reviving
concerns that gasoline and distillates stocks
might not be able to meet demand in the second
half of the year. Nevertheless, fund liquidation
for profit taking capped the rally. Hence, the
CFTC’s non-commercial for the fourth weekly
period revealed a slower pace rise in the net
long positions of 2,000 lots to 22,000 contracts.
Although commercials dropped both long and
short positions, open interest rose by some
11,000 lots to 783,000 contracts, which was
attributed mainly to the activity of non-com-
mercials. The NYMEX WTI front month closed
the weekly period averaging $59.22/b for a rise
of $1.42 after the front month peaked at an all
time high of well over $60/b. Nevertheless, in
the final two days of the month, a healthy build
in US petroleum stocks triggered another sell
off on profit taking, and the NYMEX WTI slipped
$1.70 or three per cent. On a monthly basis, the
prompt month average was $6.07 or 12 per cent
higher at $56.42/b with open interest at some
81,000 lots over same period last year to aver-
age 786,000 contracts.
The forward structure remained in contango
in its eight consecutive month, yet at a narrower
pace. The first/second month spread widened
from late May to peak in the first decade of June,
rising to $1.29/b. The healthy build in US crude
oil stocks to a six-year high at 330m b helped
the contango to remain wide. Nevertheless, the
start of the seasonal drawdown in US crude oil
stocks helped the spread to narrow. Hence, the
first/second month’s spread widened to –14¢/b
towards the end of the second decade. The sen-
timent changed as crude oil stocks remained
at healthy levels. The monthly average for the
first/second month spread was a contango of
$1.42/b, which was 52¢/b narrower than in
May. The first/sixth month contango was at
$2.30/b while the first/12th spread reached
–$1.74/b. The first/18th month stood at –74¢/b.
Tanker market
OPEC spot fixtures reversed the downward
trend of the last three consecutive months by
showing a growth of 1.56m b/d or 12 per cent
to reach 14.27m b/d, which was 1.5m b/d higher
than the same month last year. With this jump,
OPEC’s share of total spot chartering moved up
from 62 per cent to 64 per cent. OPEC Countries
Table C: Refinery operations in selected OECD countries
Refinery throughput m b/d Refinery utilization per cent Apr 05 May 05 Jun 05 Jun/May Apr 05 May 05 Jun 05 Jun/May
USA 15.35 15.63 16.14 0.52 91.5 93.2 96.2 3.1France 1.58 1.65 1.70 0.06 81.1 84.5 87.3 2.8Germany 2.17 2.28 2.24 –0.04 93.2 98.3 96.4 –1.9Italy 1.90 1.85 1.92 0.07 81.8 79.7 82.8 3.1UK 1.53 1.53R 1.56 0.03 84.0 83.9R 85.3 1.4Eur-16 11.97 11.90R 12.13 0.22 86.2 85.8R 87.4 1.6Japan 4.04 3.61R 3.86 0.25 85.8 76.7R 82.0 5.3
Sources: OPEC statistics, Argus, Euroilstock Inventory Report/IEA. R Revised since last issue.

47
OPE
C bu
lleti
n 7–
8/05
outside the Middle East accounted for most of
the increase in OPEC’s spot fixtures, contribut-
ing 1m b/d or two thirds of the growth. Middle
East/eastbound long-haul fixtures increased by
460,000 b/d to 5.23m b/d, while Middle East/
westbound fixtures remained relatively stable
at 2m b/d. However, the Middle East/east- and
westbound share in OPEC spot fixtures fell to 51
per cent from 53 per cent in the previous month
due to the sharp increase in spot fixtures from
OPEC Countries outside the Middle East. Non-
OPEC spot fixtures increased by 350,000 b/d
to 8.04m b/d, which was 340,000 b/d higher
than the same month last year. Despite the
growth in volume, non-OPEC share in global
spot chartering moved down from 38 per cent
to 36 per cent. The 1.9m b/d growth in OPEC
and non-OPEC spot fixtures pushed up global
fixtures to 22.3m b/d, which was nearly 1.9m
b/d higher than the June 2004 level.
Preliminary data showed that sailings from
the OPEC area moved up slightly by 100,000
b/d to settle at 27.2m b/d. Middle Eastern sail-
ings, which represented 70 per cent of OPEC’s
sailings, remained stable at around 19m b/d.
Compared to the same month last year, sail-
ings from OPEC were up 3.6m b/d with the
Middle East contributing 80 per cent to the
growth. According to preliminary estimates,
arrivals in the USA and the Caribbean went
down by 240,000 b/d to stand at almost 11m
b/d. However, despite this decline, arrivals were
900,000 b/d higher than the June 2004 level.
Arrivals at north-west Europe and Euromed
regions dropped by 500,000 b/d and 400,000
b/d to stand at 7.1m b/d and 4.3m b/d, respec-
tively, while arrivals in Japan remained almost
stable at around 4m b/d, but 500,000 b/d
higher than the June 2004 figure.
Crude oil spot freight rates displayed
mixed patterns with very large crude carrier
(VLCC) rates plunging to late 2003 levels in the
Worldscale 50s. VLCC freight rates continued
their downward trend for the fourth consecutive
month with Middle East/east- and westbound
rates declining by 14 and 16 points to monthly
averages of W56 and W53, respectively, due
to a glut in tanker supply following the entry
into the market of 15 new vessels since the
beginning of this year. In addition, the widen-
ing spread between the fuel oil crack and the
Dubai price and lower refining margins in Asia
encouraged regional refiners to reduce their
fixtures from the Middle East. Compared to the
same month last year, VLCC freight rates were
more than 50 per cent lower. VLCC freight rates
strengthened at the end of the month following
the chartering of four VLCCs to the US market
by Vela International Marine.
For the Suezmax, freight rates on both the
West Africa/US Gulf Coast and the north-west
Europe/US East and Gulf Coasts routes declined
by two and 19 points, respectively, reversing the
growth to almost the same levels as displayed
in May. However, rates for cargoes moving
from West Africa to the US Gulf Coast, which
fell by just two points, remained quite stable
at W126 thanks to strong US demand for light
sweet African grades. The north-west Europe/
US East and US Gulf Coast routes showed a
higher drop of 19 points or 13 per cent, result-
ing in a monthly average of W127 due to limited
transatlantic arbitrage opportunities for North
Sea crudes. According to secondary sources, in
June just 33,000 b/d were lifted from Sullom
Voe for delivery to the US East Coast while no
barrels were sent to the US Gulf Coast, sharply
down from the 49,000 b/d and 173,000 b/d
seen in May. Freight rates in the Aframax sector
showed mixed patterns with the Mediterranean/
NW Europe route plummeting by 61 points or 27
per cent to average W161, while the Caribbean/
US East Cost route lost 35 points to settle at
W236 as a result of low levels of activity and
growing tonnage availability.
In contrast, freight rates within the
Mediterranean continued to increase for the
second consecutive month, gaining 17 points
to stand at a monthly average of W231 due
to increased activity following the return of
some refineries to the market with the end of
the maintenance season. After displaying huge
declines of 53 points and 62 points over April
and May, freight rates on the Indonesia/US West
Coast route recovered slightly by three points
to W127, to move up from the 20-month lows
level seen in May. Compared to the same month
of the previous year, freight rates were lower
on all routes, except for the Caribbean/US East
Coast route, where they were 31 points or 15
per cent higher.
Similarly to crude oil, product freight rates
continued to weaken on all routes except for the
Mediterranean/north-west Europe route amid
limited activity freight rates for tankers mov-
ing from the Middle East to the East and from
Singapore to the East continued to fall for the
third consecutive month, hitting their lowest
levels in 10 months. Rates for tankers carrying
30,000–50,000 dwt moving along the Middle
East/East route slipped from W236 to W215
losing 21 points, whilst rates for those carry-
ing 25,000–30,000 dwt on the Singapore/East
route declined by 33 points or 12 per cent to
settle at an average of W253, due essentially
to a slow-down in Chinese imports. In addition,
maintenance on some petrochemical plants has
exerted downward pressure on freight rates.
Similarly, the Caribbean/US Gulf Coast route
lost 10 points to average W240, an 18-month
low, and the north-west Europe/US East and
Gulf Coasts route dropped 25 points to W258. In
contrast, the Mediterranean region saw healthy
activity resulting in a jump of 30 points in freight
rates on the Mediterranean/north-west Europe
route to reach an average of W320, while within
the Mediterranean region rates remained sta-
ble at W276. Product freight rates were lower
than the June 2004 figures, except within the
Mediterranean region and from there to north-
west Europe. However, it is worth noting that
freight rates began to improve towards the end
of the month.

48
OPE
C bu
lleti
n 7–
8/05
Ma
rke
t R
ev
iew World oil demand
Revisions to previous years (1997–02) World oil consumption figures from 1997 to
2002 saw minor downward revisions, averag-
ing 70,000 b/d per year and originating mainly
in OECD countries. The latest data indicates a
significant downward adjustment of 310,000
b/d for 2003. The largest part of the revisions
(250,000 b/d) took place in OECD, in particu-
lar Western Europe (120,000 b/d) and Pacific
(60,000 b/d). Marginal downward changes of
40,000 b/d and 20,000 b/d have also been
observed in Other Asia and Latin America,
respectively. Likewise, oil demand for 2004 has
been revised by 130,000 b/d. Downward revi-
sions of 170,000 b/d in Western Europe and
100,000 b/d in OECD Pacific have counteracted
upward adjustments of 160,000 b/d in North
America. Developing countries consumption fell
a slight 50,000 b/d and increased by 20,000
b/d each in the Middle East and Africa.
Forecast for 2005 World oil demand in 2005 is estimated to
average 83.66m b/d, with growth of 1.62m b/d
or 1.98 per cent.
With world economic activity indicating a
slowdown — the latest estimate shows only a
4.09 per cent growth rate versus 4.14 per cent
last month — and latest preliminary demand
figures from some major consuming countries
pointing to significantly lower consumption
for the first half of the year, global demand
growth has been revised down. Thus, world oil
demand growth is projected to rise by 1.62m
b/d — 150,000 b/d lower than the June estimate
— to 83.66m b/d which translates into two per
cent y-o-y growth.
On a regional basis the OECD countries
saw a negligible 0.56 per cent y-o-y growth or
280,000 b/d to average 49.73m b/d. The rise
in consumption is concentrated in the North
American region with the USA accounting for
most of the growth, while Western Europe and
OECD Pacific continue to show negative growth
rates. In contrast, developing countries esti-
mated growth of 820,000 b/d for the whole
year constitutes more than half of the total pro-
jected global demand growth. Most of the revi-
sions to global demand growth for the present
year originated in the group ‘Other regions’.
Demand is estimated to increase by 530,000
b/d or 4.7 per cent to 11.75m b/d contributing
with one-third of total growth.
Apparent demand from China, the major
consuming country in this group, was exten-
sively revised down as trade and production
data for the first half of the year revealed a slow-
down in product imports and at the same time
a rise in exports. All quarters suffered down-
ward revisions, in part due to revisions made to
the previous year’s data but also on projected
lower growth for the present year. World oil
demand is projected to rise by 1.85m b/d or
2.26 per cent to 83.51m b/d during 1Q while
rising by 910,000 b/d or 1.12m b/d to 81.92m
b/d in 2Q. Slightly higher y-o-y growth rates of
2.14 per cent and 2.36 per cent, respectively,
are estimated for 3Q and 4Q.
OECD Demand of crude and products is forecast to
grow by 0.6 per cent or 280,000 b/d to 49.73m
b/d. According to the latest preliminary data, oil
consumption in North America has been slug-
gish in the first half of 2005 — growth rates
were slightly lower than one per cent y-o-y for
1Q and 2Q. Demand growth rates for the last two
quarters have been estimated at 1.3 per cent
and 1.6 per cent based on the higher US GDP
figure and good demand in Mexico. The EIA’s
Weekly Petroleum Status Report showed that
total US product supply for the period January-
June 2005 stood at 20.55m b/d, 1.2 per cent
higher compared to the same period of 2004.
The major product categories for the first
six-month period show the following y-o-y
growth: gasoline 1.3 per cent, distillates 1.9
per cent, fuel oil 8.3 per cent and kerosene 2.8
per cent. Canada’s demand fell by 1.6 per cent
in April following a 2.7 per cent rise in 1Q2005
and there are indications of a further decline in
May. In contrast, Mexico’s appetite for oil has
been growing rapidly with consumption rising
by 6.1 per cent in April after a three per cent
rise in 1Q2005. Oil demand in Western Europe
appears to have picked up in April and May fol-
lowing a contraction in 1Q2005 — 1Q prelimi-
nary figures point to a 0.5 per cent contraction
versus the same period last year. The increased
dieselization of the transportation sector, lower
gasoline consumption and ongoing fuel oil sub-
stitution continue unabated. Unexpectedly,
demand strength is also coming from OECD
Pacific countries. Oil demand grew by a solid
2.2 per cent y-o-y during the 1Q2005 and pre-
liminary data for April indicates that consump-
tion rose by 0.8 per cent; however, initial May
inland delivery figures suggest that demand
contracted in the major consuming countries
in this group (Japan and South Korea).
Developing countries Oil demand growth in developing countries
is forecast to increase by 820,000 b/d or 3.8
per cent to average 22.18m b/d for the whole
of 2005. However, the latest forecast has been
revised down to reflect lower GDP rates in three
of the four sub-regions: Asia (excluding China),
Latin America and Africa. Sustained robust
international oil prices seem to have begun to
erode demand in some countries, especially in
Asia, who have recently implemented a series
of measures designed to mitigate the negative
effects of oil prices on their national coffers, eg
subsidies phase-out, new transport technology
(flex-fuelled vehicles), fuel substitution, and
higher domestic retail product prices.
Oil demand growth rates in the four sub-
regions Asia, Latin America, the Middle East
and Africa, based on income and price elasticity
and forecast GDP growth rates of 5.5 per cent,
3.8 per cent, 7.4 per cent and 4.8 per cent, are
estimated at 4.8 per cent, 2.1 per cent, 4.4 per
cent and 2.7 per cent, respectively. It is impor-
tant to reiterate the increasing risk that devel-
oping countries pose to any demand assessment
due to the quality, availability and timeliness of
data. The forecast for this group depends greatly
on past income and price elasticity of demand
which is applied to forecast economic growth
rates. Therefore, extreme caution must be exer-
cised as 820,000 b/d, or more than half of the
total 1.62m b/d global consumption growth for
2005, is assumed to originate in this group.
Very preliminary data for the first quarter of

49
OPE
C bu
lleti
n 7–
8/05
2005, which shows 4.2 per cent y-o-y growth
or 880,000 b/d, seems to corroborate the pro-
jections for the whole year.
Other regions The bulk of revisions to demand growth
originated within the Other regions group, with
apparent demand in China suffering a partic-
ularly sizeable downward adjustment. Other
regions apparent demand growth for the year
is projected at 530,000 b/d or 4.7 per cent to
average 11.75m b/d — significantly lower than
the 660,000 b/d or 5.5 per cent projected in
the last months’ report. Apparent demand in
the FSU came up strong in 1Q2005 rising by
more than eight per cent y-o-y to 3.9m b/d.
Of course these are very preliminary figures
and as such subject to extensive revisions.
Available preliminary trade and production
figures suggest that apparent demand grew in
2Q2005 but at a slower pace of 2.5 per cent.
The pace of growth is estimated to slow further
in 3Q but then rebound towards the end of the
year. Apparent demand growth in the group
Other Europe — which includes many Central
European countries — is projected to remain
flat or show marginal growth of less than one
per cent.
China: so far not so good Many things are said by market gurus, ana-
lysts and commentators about China, a huge
and complex country inhabited by 1.3 billion
people. Some of them are probably true while
some are certainly exaggerated. However, the
compelling evidence from the hard data on pro-
duction and trade points to a less than rosy start
to 2005 — certainly far less optimistic than ini-
tially believed by just about all forecasts —and
here is why. To summarize, apparent demand
measured by production and net crude and
product trade (imports) indicates that for the
period January–May 2005 domestic consump-
tion rose by a mere two per cent compared to
the same period last year. Initial estimates were
pointing to growth rates of around seven to nine
per cent for the first two quarters of the year,
based on and justified by GDP growth of 8.6
per cent and above for 2005. Perhaps, these
growth rates were overly optimistic if we take
into account that Chinese domestic consump-
tion rose by 15 per cent and 24 per cent in the
first two quarters of 2004, and it would be
extremely unlikely for further two-digit growth
rates.
Closer scrutiny on the figures shows that the
fall in apparent demand was in most part due
to the substantial decline in product imports.
According to the latest figures, product imports
for the first five months of the year fell by
38 per cent compared to the same period of
2004. Exports of gasoline and other products
have been on the rise this year while imports
of LPG and diesel have declined. But it would
not be too wise to radically change the out-
look for Chinese demand for the remainder of
the present year — even last year’s experience
would tell us that it would be a mistake.
After the rise in apparent demand of 24
per cent in 2Q2004 came a sharp drop to ten
per cent in 3Q of the year but in the last three
months of 2004, demand growth rebounded by
an astounding 20 per cent. For the second half
of 2005 demand is expected to grow by around
ten per cent, in part due to the low growth rate
seen in 3Q2004 and the possibility that China
will commence filling its Strategic Petroleum
Reserve. Plans to build strategic reserves in
China are well under way with the first 9.5m b
storage scheduled to be completed by August
of this year.
The remaining capacity at Zhenhai (a
Sinopec project), which will hold 33m b, will be
ready by the second half of 2006. Filling up of
this depot will depend on international crude
prices, according to statements by Chinese
officials, but from the purely operational stand
point, reserve building could start in 4Q of the
current year. China will continue to be the big-
gest headache for anyone who attempts to
assess demand for oil in the years to come; all
that we can do is to continue to closely monitor
developments and hope to learn from them.
Forecast for 2006 A preliminary forecast for world oil demand
has been drawn on the basis of the following
set of assumptions:
— World economic expansion is assumed
at 4.0 per cent for 2006 (1995 on a PPP
basis), which is marginally lower than the
present 4.1 per cent estimate for 2005. The
world economy will continue to grow but
at a slightly slower pace than that seen in
the present year.
— Temperatures are assumed to return to nor-
mal conditions.
— The Chinese economy, which was the major
engine behind the abnormally high growth
in oil demand in the recent past, has shown
signs of more moderate growth. The pace
of economic expansion will slow from the
8.6 per cent projected for 2005 to 8.2 per
cent next year.
— Economic expansion in developing coun-
tries, a major source of demand growth
in 2004 and 2005 (estimate), is forecast
to contract significantly to 4.8 per cent in
2006 following 6.1 per cent in 2004 and
5.2 per cent in 2005 (estimate).
— Sustained robust international oil prices
seem to have begun to erode demand.
Several countries, especially in Asia, have
recently implemented a series of measures
designed to mitigate the negative effects
of oil prices, eg subsidies phase-out, new
transport technology (flex-fuelled vehicles),
fuel substitution, and higher domestic retail
product prices.
— Economic growth in the USA is forecast to
contract further in 2006 to 2.9 per cent,
while total OECD Europe GDP will rise to
two per cent.
Average world oil demand is projected at
85.2m b/d, implying a rise of 1.5m b/d or 1.9
per cent over total 2005 consumption. This pre-
liminary assessment is indeed subject to further
adjustments as new information becomes avail-
able on key factors such as the economic growth
outlook, weather conditions, unforeseen social
and geopolitical events, and variations in crude
and product prices. Oil consumption is expected
to grow in all major regions with the sole
exception of Other Europe where demand will
remain almost flat. North America, especially
the USA, will contribute the bulk of demand
growth within the OECD but some growth is

50
OPE
C bu
lleti
n 7–
8/05
Ma
rke
t R
ev
iew expected in Western Europe and OECD Pacific.
China will make up about one-fourth of total
world oil demand growth in 2006. Demand is
projected to rise in each single quarter versus
2005 reaching 87.31m b/d by 4Q of the year.
The seasonality effect has somehow been flat-
tened by the rise in Chinese demand, which
has offset the seasonal decline in the spring
quarter of the northern hemisphere.
World oil supply
Non-OPEC
Forecast for 2005 The full year estimate for non-OPEC sup-
ply growth in 2005 has been revised slightly
down from last month’s report. Non-OPEC sup-
ply (including processing gains) is expected
to average 50.55m b/d, which represents an
increase of 770,000 b/d over the previous year
and a revision of 40,000 b/d from last month’s
report. On a quarterly basis, non-OPEC supply
is now expected to average 50.3m b/d, 50.6m
b/d, 50.3m b/d and 50.9m b/d in 1Q, 2Q, 3Q
and 4Q. The revisions are distributed as fol-
lows: down 22,000 b/d in 1Q, up 11,000 b/d
in 2Q, down 83,000 b/d and 68,000 b/d in 3Q
and 4Q, respectively. Revisions in the outlook
for Russia account for the bulk of the negative
revisions in 3Q and 4Q2005.
OECD OECD production has been revised up to
reflect actual and preliminary data for 2Q2005
for the USA and OECD Pacific combined with
better expectations for Canada in 4Q2005.
OECD oil production is now estimated to aver-
age 20.9m b/d in 2005, which represents a
decline of 370,000 b/d from 2004 and a posi-
tive revision of 48,000 b/d from last month’s
report. The full year outlook for the USA has
marginally improved (up 10,000 b/d) as a
result of better-than-expected production in
1Q2005. However, US oil production is still
expected to average 7.65m b/d, which repre-
sents a decline of 20,000 b/d. The outlook
remains subject to downward revisions that
may result from weather-related shut-downs
in the Gulf of Mexico. During the first weeks of
July, five tropical storms, including hurricane
Dennis, have reached the USA resulting in the
shutdown of production across several facili-
ties. In particular, on July 12, the US Minerals
Management Service reported that 1.4m b/d
— 99 per cent of total production — were shut
in which lasted until July 14 resulting in the loss
of over 5m b.
More importantly, the impact of weather-
related events is now expected to delay instal-
lation work on new and ongoing projects, most
notably at the giant 250,000 b/d Thunder
Horse platform which was expected to start in
late 2005 and is now more likely to start early
2006. It is worth noting that prior to hurricane
Ivan, which hit the US Coast last year, Gulf of
Mexico production was close to 1.7m b/d, but
now it is close to 1.5m b/d, a significant reduc-
tion of 200,000 b/d.
The outlook for Mexico and Canada remains
broadly unchanged and both countries are
expected to show a net decline. However,
Canadian oil production is expected to benefit
from a faster ramp up than previously thought in
two new project start-ups in 4Q2005 including
Primrose North and White Rose. Total Canadian
output is now expected to average 3.05m b/d
in 2005.
The outlook for OECD Europe remains
broadly unchanged. Oil production is expected
to average 5.9m b/d, which represents a decline
of 240,000 b/d versus last year. Preliminary
data for Norway shows lower-than-expected
production in 2Q2005 and this has led to a
downward revision for that quarter of around
70,000 b/d. Production in Norway is lagging
due to ongoing shut-downs and production
restrictions across several facilities, but the
full year outlook remains unchanged as fields
return to capacity in 3Q and 4Q2005.
For the UK there are no changes in the data
or outlook. OECD Pacific is expected to show a
decline of 20,000 b/d versus a previous expec-
tation of a decline of 50,000 b/d, driven by an
improved outlook for Australia. The latest data
for 1Q and 2Q prod is showing that production
is performing just above expectations and this
has led us to revise our outlook for the remain-
der of the year.
Developing countries The full year outlook for developing coun-
tries (DCs) remains unchanged from last
month’s report. Oil production is estimated to
average 12.48m b/d in 2005, which represents
an increase of 610,000 b/d from 2004. Major
production increases are expected in Angola,
Brazil, and Sudan contributing 500,000 b/d
to the full year average, or 80 per cent of the
total for DCs. The project Kizomba B in Angola
is expected to start producing in July, add-
ing 250,000 b/d and should reach plateau by
October of this year. In the second half of 2005,
two more deepwater projects are also expected
to start in Brazil (Albacora Leste and Jubarte
Phase I), adding another 240,000 b/d in the
latter part of 2005 and 2006. In Sudan, the
Dar project is also expected to start in July at
140,000 b/d rising to 200,000 b/d by the end
of the year/early 2006. The outlook for the coun-
tries expected to experience a decline in pro-
duction, notably Oman, Colombia, Syria, Egypt,
Yemen, and Argentina, remains unchanged.
Other regions The forecast for Other regions (FSU, Other
Europe, and China) has been revised down
primarily due to lower expectations in 3Qand
4Q2005 for Russia. Total oil production is esti-
mated to average 15.3m b/d in 2005, which
represents an increase of 500,000 b/d from
2004 and a downward revision of 82,000 b/d
from last month’s report . The new forecast sees
Russian oil production growing 170,000 b/d in
2005 versus 250,000 b/d last month for the
same reasons presented in the May and June
reports. Data for 1Q and 2Q indicate that Russian
cumulative production growth was just 45,000
b/d in 2005 compared to 440,000 b/d in the
same period last year. Evidence of declining
production at Yukos and other producers, lag-
ging investment in the Russian oil and gas sec-
tor, and the impact of higher export taxes (via
pipeline and rail) on margins, cash flow, and
near term expectations of the typical Russian
producers/exporters are likely to continue to

51
OPE
C bu
lleti
n 7–
8/05
impact investment plans and operations for the
remainder of the year and into 2006. Very few
companies have potential to grow production
significantly in the near term, mainly Sibneft
and TNK-BP, whilst others such as Rofneft and
Gazprom, are preoccupied with complex cor-
porate transactions.
The outlook remains unchanged for
Azerbaijan, Kazakhstan, other FSU and
European producers. Full year average oil pro-
duction growth is expected to reach 80,000
b/d and 100,000 b/d in Azerbaijan and
Kazakhstan, respectively. Caspian producers are
now expected to show a combined growth that
is twice the level of Russia for the first time in
several years. The outlook for China has been
revised slightly down to reflect a lower than
expected performance in 2Q2005. The new
forecast sees China growing at 140,000 b/d in
2005 versus a previous expectation of 150,000
b/d.
Forecast for 2006 Non-OPEC oil production is expected to
average 51.7m b/d, an increase of 1.08m b/d
over 2005. And including processing gains,
OPEC NGLs and non-conventional oils, non-
OPEC oil supply is expected to average 56.2m
b/d, an increase of 1.4m b/d over 2005. On
a regional basis, the largest contributor is
expected to be the African region, followed
by the FSU, Latin America and North America
(mainly Canada), whilst OECD Europe and
Pacific and the Middle East are expected to
show a net decline. The net contribution from
Russia is expected to be just 80,000–100,000
b/d and is considered the main risk factor for
non-OPEC growth next year. Oil production
growth is underpinned by the start-up of several
projects in deepwater, bitumen extraction and
syncrude projects, and the continuing expan-
sion of the Caspian region. In terms of overall
crude quality, the net increase is expected to be
overwhelmingly medium sweet, in contrast to
recent years when increases have been mainly
medium sour.
Oil production in the African region is
expected to grow by 430,000 b/d driven by
additions in Angola, Sudan, Côte d’Ivoire, and
Mauritania. Only Egypt, Gabon and South Africa
are expected to show moderate declines. The
main projects that will contribute to Africa’s
growth include Baobab (Côte d’Ivoire), BBLT
Phase I (Angola), Dalia (Angola), Adar Yale/Tale
(Sudan), and Chinguetti (Mauritania). Angola
continues to be the main engine of growth in
the region followed by Sudan. In 2006, Angolan
oil production is expected to average 1.47m b/d
and to reach a record high of 1.66m b/d in 4Q.
Angola’s deepwater oil production is expected
to increase to around 700,000 b/d by 2006. In
Sudan, several onshore projects are being devel-
oped on a fast track basis, the most important
of which is the Adar Yale/Tale project with a
capacity of 200,000 b/d which is expected to
reach peak production in 2006.
The FSU region is expected to grow by
330,000 b/d, slightly less than in 2005. For the
first time in years the bulk of the increase will
come from the Caspian region rather than from
Russia. In the period 2000–2004, Russia rep-
resented around 65 per cent of total non-OPEC
growth, but in 2005/2006, it is expected to
represent just 15 per cent of the total. In 2006,
Russian production growth is estimated at just
80,000–100,000 b/d, compared to 730,000
b/d in 2004 and 170,000 b/d in 2005. Ongoing
field ramp ups, brownfield developments,
and new field start-ups offshore Sakhalin are
expected to offset Russia’s estimated decline
of 150,000 b/d per year and further production
losses at Yukos and other producers. In con-
trast, oil production in Azerbaijan is expected
to increase by 140,000 b/d versus 2005. The
bulk of the additions will come from the con-
tinuing ramp up of the ACG Phase I project that
started in 1Q of this year and Phase II which
is scheduled to start in 3Q2006. Kazakhstan
is expected to show an increase of 100,000
b/d, most of which is expected to come with the
expansion of the Tengiz oil field in the second
half of next year.
Oil production in Latin America is expected
to grow by 220,000 b/d, driven primarily by
significant increases in Brazil and minor addi-
tions in Trinidad and Peru. Only Argentina and
Colombia are expected to show a net decline.
Brazilian oil production is expected to increase
by 250,000 b/d in 2006 on top of an increase
of 160,000 b/d in 2005. There are seven impor-
tant greenfield projects in deepwater starting
between 2005 and 2006 with an average oil
capacity of 120,000 b/d each at peak, all of
which will make significant contributions in
the two-year period. Two projects have already
started in 2005 (Barracuda and Caratinga), two
more are expected to start before the end of this
year (Albacora Leste and Jubarte Phase I), and
three projects are expected in 2006 (Golfinho,
ESS 132 and Espadarte). Trinidad and Peru are
expected to show minor increases, mainly due
to the addition of condensates related to the
expansion of gas-condensate fields. Argentina
and Colombia have seen their production drop
on average 30,000 b/d per year for four con-
secutive years, and this trend is not expected
to reverse in 2006.
North America is expected to show an
increase of 150,000 b/d driven by significant
additions in Canada. The USA is expected to
show a decline of 80,000 b/d, broadly simi-
lar to 2005. Interestingly, there are only two
large greenfield deepwater projects in the Gulf
of Mexico that are expected to start in 2006
(Thunder Horse and Atlantis), compared to five
in 2005. Deepwater is the main source of new
oil in the USA but 2006 is going to be a light
year for new deepwater start-ups. The produc-
tion of condensates, NGL and unconventional
oils, which together account for around 30 per
cent of US production, is expected to remain
flat y-o-y. Canadian oil production is expected
to increase by 230,000 b/d in 2006 under-
pinned by the start-up of six new projects,
mainly extraction and syncrude projects. The
projects are Syncrude Phase III, Surmont
Phase I, Kirby, Fire Bag II, Deer Creek Phase
I, and Foster Creek P II. Mexican oil produc-
tion is expected to remain broadly flat relative
to 2005. However, production is expected to
show an increase in 4Q2006 with the start-up
of several projects, but in particular the Sihil
Pa and Akal Q/W platforms.
OECD Europe is expected to show a net
decline of 60,000 b/d. However, Norway is
forecast to show an increase of 60,000 b/d
underpinned by growth in condensates and

52
OPE
C bu
lleti
n 7–
8/05
ongoing field enhancements. There are no new
greenfield oil projects starting in Norway next
year, but there are several brownfield develop-
ments that are expected to keep the base rela-
tive flat. The UK is expected to show a decline
of 80,000 b/d, which is better than in previ-
ous years. This improvement is primarily due
to the start-up of the Buzzard field (190,000
b/d at peak) in 4Q2006, which should provide
a positive kick to oil production later in the
year. In Denmark, oil production is expected
to decline by 30,000 b/d due to field maturity
and the lack of new projects.
OECD Asia in expected to show a minor
decline of 20,000 b/d. Oil production in
Australia is expected to decline 40,000 b/d
despite the start-up of the Vincent/Laverda
and the Geograph fields in 4Q of the year
given ongoing field declines elsewhere and the
extended ramp up period of these two fields.
However, New Zealand may add around 20,000
b/d of new production with the start-up of the
Pohokura condensate field later in 2006.
Non-OPEC Middle East is expected to show
a decline of 110,000 b/d, similar to 2005.
Oman, Syria and Yemen are all expected to
see its production decline whilst Bahrain is
expected to keep production flat. The multi
year decline trend in Oman is unlikely to be
reversed until 2007 at the earliest. Syria is
looking to maintain its total output flat at cur-
rent levels for the foreseeable future but y-o-y
fluctuations are expected. In 2006, Syria is
likely to lose 30,000 b/d, while output from
Bahrain is expected to continue at the previ-
ous year’s level.
FSU net oil export (crude and products) FSU net oil exports are expected to aver-
age 7.55m b/d, an increase of 240,000 b/d
over the previous year. The outlook has been
revised down following the downward revision
of Russian production. The latest available data
— April 2005 — shows Russian net oil exports
averaging 6.3m b/d, compared to 5.7m b/d in the
same month last year. Exports from Kazakhstan
are estimated at 365,000 b/d for April 2005,
slightly higher than last year. Exports from
Kazakhstan are expected to increase moderately
in 2005 versus 2004 due to ongoing pipeline
bottlenecks and modest growth in production.
However, exports from Azerbaijan are expected
to increase significantly, particularly in the
second half of 2005, underpinned by volume
growth in Phase I of the ACG project via the
newly inaugurated BTC pipeline, a trend that
is expected to continue in 2006. In 2006, FSU
net oil exports are expected to average 7.83m
b/d, an increase of 280,000 b/d over 2005
(see Table D).
OPEC NGLs and non-conventional oils The 2005 forecast for OPEC NGLs and non-
conventional oils remains broadly unchanged at
4.21m b/d, representing an increase of 210,000
b/d over 2004. The quarterly distribution is
projected at 4.13m b/d, 4.18m b/d, 4.23m b/d
and 4.28m b/d, respectively. A minor upward
adjustment of 18,000 b/d for 2004 has been
applied to reflect the latest data, which has
impacted the 2005 base and growth number.
In 2006, OPEC NGLs is expected to increase
by around 330,000 b/d (see Table E).
OPEC crude oil production Total OPEC crude production averaged
30.01m b/d in June, which represents an
increase of 90,000 b/d from last month,
according to secondary sources. Year-to-date
OPEC production has increased 900,000 b/d.
Production increased primarily in Algeria, IR
Iran and Nigeria and remained broadly flat in
the rest of OPEC. Iraqi oil production averaged
1.8m b/d, broadly unchanged from last month
(see Table F).
Rig count
Non-OPEC Non-OPEC rig count stood at 2,282 rigs,
which represents an increase of 96 rigs com-
pared to the previous month. Of the total, 306
rigs were operating offshore and 1,976 onshore
and in terms of the oil and gas split, there were
705 oil rigs and 1,554 gas rigs.* Regionally,
North America gained 87 rigs versus last month.
The sharp movements either way of rig count
in North America is generally attributed to
Canadian rig activity which tends to vary sig-
nificantly from month to month, particularly in
gas operations. Western Europe gained six rigs
over the previous month, whilst OECD Pacific
lost three rigs. The Middle East, Africa, Latin
America and rest of Asia gained a total of six
rigs.
* The oil and gas split now includes Canada.
Table D: FSU net oil exports m b/d
1Q 2Q 3Q 4Q Year
2001 4.30 4.71 4.89 4.47 4.59
2002 5.14 5.84 5.85 5.49 5.58
2003 5.87 6.75 6.72 6.61 6.49
2004 7.17 7.30 7.38 7.37 7.31
20051 7.49 7.64 7.61 7.46 7.55
20062 7.62 7.88 7.97 7.84 7.83
1. Estimate.2. Forecast.
Table E: OPEC NGL production, 2001–05
2002 2003 204 3.62 3.71 3.95
1Q05 2Q05 3Q05 4Q05 4.13 4.18 4.23 4.28
2005 05/04 2006 06/05 4.21 0.21 4.53 0.33
m b/d
Ma
rke
t R
ev
iew

53
OPE
C bu
lleti
n 7–
8/05
OPEC OPEC rig count was 279 which represents a
decrease of one rig from last month. Increases
took place in Libya (three), Saudi Arabia (three),
and Nigeria (one). These gains were offset by
declines in other OPEC Countries. Of the total,
209 rigs were operating onshore and 70 rigs
offshore and in terms of oil and gas split, there
were 218 oil rigs whilst the remainder was gas
and other rigs.
Stock movements
USA US commercial oil stocks (total crude and
petroleum product excluding SPR) in June
exceeded the one billion barrel mark for the first
time since August 2002 to stand at 1,015.5m
b, which was about two per cent higher than
the level registered in the previous month and
about five per cent above last year’s level. Two
thirds of this build came from distillate inven-
tories, while other major product stocks con-
tributed marginally, except for gasoline inven-
tories which showed a slight draw. Crude oil
inventories lost the previous month’s gain,
decreasing by 4.5m b to 324.9m b on the back
of lower imports which declined by 200,000
b/d to 10.48m b/d in June compared with
10.46m b/d in May. Further support came from
higher refinery runs which observed an increase
of two per cent to stand at 96.4 per cent com-
pared with the previous month. This draw on
crude oil stocks narrowed the y-o-y surplus to
seven per cent from the nine per cent registered
last month but still remained seven per cent
higher than the five-year average. At 20.1, the
days of forward cover at the end of June were
three per cent or 0.5 days higher than last year’s
level and were two per cent or 0.4 days above
the five-year average (see Table G).
The most significant stock movement
change in June happened with distillates which
showed a very strong build despite healthy
demand six per cent above last year. Higher
distillate production, which stood at 4.52m b/d
or eight per cent above last year and 18 per
cent higher than the five-year average, was the
main reason behind a massive build in distil-
late inventories of 9.5m b to 1,172m b. A mar-
ginal increase of distillate imports added to this
build. At 28.6, the days of forward consumption
remained one per cent or 0.3 days and seven per
cent or two days below last year and the five-
year average respectively. A well supplied crude
oil market combined with high utilization rates
should help distillate inventories to continue
heading up in the next few months ahead of
the winter season when consumption tradition-
ally peaks, especially for heating oil. Gasoline
stocks behaved contrary to distillates reaching
their highest level especially ahead of the long
July 4 Independence holiday weekend and lift-
ing implied demand to 9.72m b/d or four per
cent higher than the previous period and about
three per cent above last year’s level. Gasoline
imports, which stagnated at 1.01m b/d by the
end of June, which was about 200,000 b/d
below a month ago and about seven per cent
higher than the five-year average, also contrib-
uted to the draw on gasoline inventories. At
215.3m b or 1.3m b below the previous period,
gasoline inventories remained about four per
cent above last year’s figure and two per cent
higher than the five-year average.
During June, the SPR continued to approach
its full capacity of 700m b, increasing by 2.4m
b to 696.3m b. Full capacity is expected to be
reached by the end of August.
In the week ending July 8, total commercial
oil stocks continued to move upward, standing
at 1,016.44m b or 1m b higher than the previ-
ous week. Distillate stocks remained almost the
sole contributor to this build, rising by 3.19m
b to stand at 120.43m b due to sustained high
production and imports while demand stayed
relatively stagnant. Crude oil and gasoline
inventories experienced expected draws as
refinery runs remained high and imports of
crude oil dipped below 10m b, an uncommon
development in 2005. The draw on gasoline
stocks was mainly due to strong demand and
lower production and imports as well.
Western Europe Total oil stocks in Eur-16 (EU plus Norway)
in June remained almost unchanged at 1,114.0m
b compared with the previous month. The build
in crude oil stocks was nearly cancelled out by
marginal draws on product inventories. Despite
this situation, the y-o-y surplus rose slightly to
about four per cent from two per cent registered
last month. Increasing imports as refiners ben-
efited from the contango market of the North
Sea grades to fill their depleted tanks were the
main reason for a build of 4.3m b to 479.5m
b in crude oil stocks. Lower refinery runs, as
some refineries were shut down due to seasonal
maintenance, were another factor responsible
for this build although most of them started to
return to normal run levels by the end of June
(see Table H).
The picture was differed for product inven-
tories where lower refinery runs forced product
stocks to head south especially seasonal fuels
such as gasoline and distillates. Gasoline regis-
tered the highest draw among its peers, declin-
ing by 1.8m b to 146.0m b. But this draw does
not affect the y-o-y average which widened to
about 10 per cent from about eight per cent
last month. Distillate inventories lost a small
part of the previous month’s gain, decreas-
ing by 400,000 b to 359.6m b on the back
of healthy seasonal demand. This slight draw
resulted in a minor change of the y-o-y surplus,
which narrowed marginally by 0.2 per cent, to
stand at 2.2 per cent. Fuel oils stocks showed
a moderate draw of 1.2m b to 108.2m b due to
higher exports to the US and Asia-Pacific mar-
kets where opened arbitrage encouraged trad-
ers to ship European materials to benefit from
high prices.
Japan Total commercial oil stocks in Japan during
May witnessed a significant build of 470,000
b/d to stand at 174.1m b. Crude oil and product
inventories contributed nearly equally to this
rise. Last month’s y-o-y deficit turned to a sur-
plus of about three per cent. The strong build in
crude oil stocks of 7.5m b to 110.8m b has not
been seen since October 2004. The reason for
such a high stock-build was the sharp decline
in refinery runs which dropped by about nine
per cent to 76.9 per cent in May. Continued flow
of crude oil imports also helped inventories to

54
OPE
C bu
lleti
n 7–
8/05
Ma
rke
t R
ev
iew
grow to the same level as last year, canceling
out the y-o-y surplus of last month.
Despite lower refining output, gasoline
inventories managed to build modestly by
300,000 b to 144.3m b due to weak demand
and higher imports. But this slight build changed
the y-o-y deficit of the last report to a very wide
surplus of about 14 per cent. The picture was
brighter for distillate inventories which rose
by 4.5m b to stand at 27.7m b on the back of
increasing imports and very weak local con-
sumption. This rise also helped the y-o-y defi-
cit to turn to a considerably surplus of six per
cent. Residual fuel oil inventories followed the
general upward trend, showing an increase of
2.6m b to 21.7m b, a level not seen since January
2004 (see Table I).
Balance ofsupply/demand
Forecast for 2005 Table J for 2005 has been revised signifi-
cantly following downward revisions to the base
and growth of world oil demand. As indicated in
the demand section, demand is now expected
to average 83.7m b/d, or around 300,000 b/d
Table F: OPEC crude oil production, based on secondary sources 1,000 b/d
2003 2004 4Q04 1Q05 2Q05 Apr 05 May 05 Jun 05 Jun/May
Algeria 1,134 1,229 1,289 1,316 1,339 1,332 1,337 1,349 12.3
Indonesia 1,027 968 963 948 941 945 942 937 –5.1
IR Iran 3,757 3,920 3,947 3,900 3,957 3,914 3,958 3,998 39.8
Iraq 1,322 2,015 1,960 1,834 1,833 1,857 1,821 1,822 1.6
Kuwait 2,172 2,344 2,448 2,438 2,513 2,519 2,513 2,508 –5.3
SP Libyan AJ 1,422 1,537 1,608 1,613 1,633 1,628 1,633 1,639 6.5
Nigeria 2,131 2,352 2,344 2,332 2,424 2,418 2,406 2,447 40.9
Qatar 743 781 798 789 796 796 795 796 1.2
Saudi Arabia 8,709 8,982 9,450 9,220 9,463 9,438 9,473 9,478 5.2
UAE 2,243 2,360 2,486 2,396 2,421 2,455 2,405 2,403 –2.0
Venezuela 2,305 2,580 2,617 2,699 2,636 2,630 2,641 2,637 –-3.8
OPEC-10 25,644 27,052 27,950 27,653 28,123 28,074 28,103 28,192 89.7
Total OPEC 26,965 29,067 29,910 29,487 29,956 29,932 29,923 30,015 91.3
Totals may not add, due to independent rounding.
less than in our previous forecast. On the supply
side, total non OPEC supply is expected to aver-
age 54.8m b/d, unchanged from last month’s
report. As a result, the estimated demand for
OPEC crude in 2005 [(a)+(b)] is now forecast
at 28.9m b/d, which represents a reduction
of approximately 260,000 b/d versus last
month’s report. On a quarterly basis, the esti-
mated demand for OPEC crude has been revised
down 280,000 b/d in 1Q, 430,000 b/d in 2Q,
220,000 b/d in 3Q and 120,000 b/d in 4Q.
OPEC crude production averaged 29.5m
b/d in 1Q2005 and 30m b/d in 2Q, approxi-
mately 400,000 b/d and 2.7m b/d, respectively,
more than the estimated OPEC crude require-
ments for these two periods. As anticipated and
reported in the stock section, such production
levels have translated into crude inventory
builds in the OECD, particularly in the USA
where total oil stocks (commercial and SPR) are
at record highs surpassing the level of 1.7bn b
as well as allowing for forward cover to improve
to close to the last five-year average.
In terms of OPEC capacity, taking into
account the supply/demand balance, the result-
ing required OPEC crude production levels and
the projected production capacity, OPEC’s spare
capacity is estimated to average around 7.9 per
cent in the second half of 2005, compared to
4.9 per cent in the same period of 2004.
Forecast for 2006 For 2006, demand is expected to average
85.2m b/d whilst non-OPEC supply is expected
to average 56.2m b/d. This results in an average
estimated demand for OPEC crude [(a)+(b)] of
29m b/d, or 100,000 b/d more than in 2005.
Furthermore, the quarterly distribution shows
that the demand for OPEC crude is expected
to be 29.4m b/d in 1Q, 27.7m b/d in 2Q, 29.1m
b/d in 3Q and 29.9m b/d in 4Q representing a
y-o-y increase of 300,000 b/d, 500,000 b/d,
200,000 b/d for 1Q, 2Q and 3Q, respectively.
In 4Q, the estimated requirements for OPEC
crude [(a)+(b)] at 29.9m b/d is expected to be
significantly less than in 4Q2005.
In terms of OPEC capacity, in 2006 OPEC
capacity is expected to average around 33.4m
b/d, representing an average increase of
710,000 b/d from 2005. Taking into account
the supply/demand balance for 2006, the result-
ing required OPEC crude production levels and
the projected production capacity, OPEC’s spare
capacity in 2006 is estimated to average around
12 per cent assuming there is no significant
improvement in Iraq.

55
OPE
C bu
lleti
n 7–
8/05
Table G: US onland commercial petroleum stocks1 m b
Change Apr 29, 05 Jun 3, 05 Jul 1, 05 Jun/May Jul 1, 04
Crude oil (excl SPR) 327.0 330.8 324.9 -5.9 304.5Gasoline 213.5 216.6 215.3 -1.3 208.8Distillate fuel 102.3 107.7 117.2 9.5 114.0Residual fuel oil 37.2 36.5 37.5 1.0 37.5Jet fuel 40.3 40.7 41.2 0.5 38.8Total 972.2 998.6 1,015.5 16.9 966.5SPR 691.2 693.9 696.3 2.4 662.4
1. At end of month, unless otherwise stated. Source: US/DoE-EIA.
Table H: Western Europe onland commercial petroleum stocks1 m b
Change Apr 05 May 05 Jun 05 Jun/May Jun 04
Crude oil 468.7 475.2 479.5 4.4 464.8Mogas 148.8 147.7 146.0 -1.7 132.9Naphtha 31.7 31.7 30.8 -0.9 23.6Middle distillates 351.8 350.0 349.6 -0.4 342.0Fuel oils 108.9 109.4 108.2 -1.2 112.6Total products 641.2 638.7 634.5 -4.2 611.1Overall total 1,109.8 1,113.8 1,114.0 0.2 1,075.9
1. At end of month, and includes Eur-16. Source: Argus, Euroilstock.
Table I: Japan’s commercial oil stocks1 m b
Change Mar 05 Apr 05 May 05 May/Apr May 04
Crude oil 112.8 103.6 110.8 7.2 110.8Gasoline 13.9 14.0 14.3 0.4 12.6Middle distillates 21.7 23.2 27.7 4.5 26.2Residual fuel oil 17.1 18.7 21.3 2.7 18.8Total products 52.7 55.9 63.3 7.5 57.6Overall total2 165.5 159.5 174.1 14.6 168.4
1. At end of month. Source: MITI, Japan.2. Includes crude oil and main products only.

56
OPE
C bu
lleti
n 7–
8/05
Ma
rke
t R
ev
iew Table J: World crude oil demand/supply balance m b/d
1. Secondary sources. Note: Totals may not add up due to independent rounding.2. Stock change and miscellaneous.
Table J above, prepared by the Secretariat’s Energy Studies Department, shows OPEC’s current forecast of world supply and demand for oil and natural gas liquids. The monthly evolution of spot prices for selected OPEC and non-OPEC crudes is presented in Tables One and Two on page 57, while Graphs One and Two (on page 58) show the evolution on a weekly basis. Tables Three to Eight, and the corresponding graphs on pages 59–60, show the evolution of monthly average spot prices for important products in six major markets. (Data for Tables 1–8 is provided by courtesy of Platt’s Energy Services).
World demand 2000 2001 2002 2003 1Q04 2Q04 3Q04 4Q04 2004 1Q05 2Q05 3Q05 4Q05 2005
OECD 48.0 48.0 48.7 49.5 50.5 48.3 49.4 50.8 49.7 50.9 48.8 49.9 51.2 50.2North America 24.0 24.1 24.5 25.4 25.5 25.3 25.7 26.1 25.7 25.9 25.7 26.1 26.3 26.0Western Europe 15.3 15.3 15.4 15.6 15.5 15.1 15.6 15.9 15.5 15.6 15.2 15.7 15.9 15.6Pacific 8.6 8.6 8.7 8.5 9.5 7.9 8.1 8.8 8.5 9.4 7.9 8.1 8.9 8.6Developing countries 19.7 20.2 20.4 21.4 21.7 22.2 22.2 22.6 22.2 22.4 22.7 23.0 23.2 22.8FSU 3.9 3.7 3.8 3.8 3.9 3.9 4.0 4.2 4.0 4.0 3.8 3.9 4.4 4.0Other Europe 0.8 0.8 0.8 0.9 0.9 0.8 0.8 0.9 0.9 0.9 0.8 0.8 0.9 0.9China 4.7 5.0 5.6 6.5 6.5 6.8 7.1 7.3 6.9 7.0 7.2 7.3 7.7 7.3(a) Total world demand 77.1 77.7 79.2 82.0 83.5 81.9 83.4 85.7 83.7 85.2 83.4 84.9 87.3 85.2
Non-OPEC supplyOECD 21.8 21.9 21.6 21.3 21.0 21.1 20.6 20.9 20.9 21.2 20.9 20.5 21.3 21.0North America 14.3 14.5 14.6 14.6 14.5 14.6 14.4 14.4 14.5 14.7 14.6 14.5 14.7 14.6Western Europe 6.7 6.6 6.4 6.1 6.0 6.0 5.7 6.0 5.9 6.0 5.9 5.5 6.0 5.8Pacific 0.8 0.8 0.7 0.6 0.5 0.6 0.6 0.5 0.5 0.5 0.5 0.5 0.6 0.5Developing countries 10.9 11.2 11.3 11.9 12.2 12.3 12.5 12.8 12.5 12.9 12.9 13.1 13.4 13.1FSU 8.5 9.3 10.3 11.2 11.4 11.5 11.6 11.6 11.5 11.6 11.6 11.9 12.2 11.8Other Europe 0.2 0.2 0.2 0.2 0.2 0.2 0.2 0.2 0.2 0.2 0.2 0.2 0.2 0.2China 3.3 3.4 3.4 3.5 3.6 3.6 3.6 3.6 3.6 3.7 3.7 3.7 3.7 3.7Processing gains 1.7 1.7 1.8 1.8 1.9 1.8 1.8 1.9 1.9 1.9 1.9 1.9 1.9 1.9Total non-OPEC supply 46.4 47.7 48.6 49.8 50.3 50.6 50.3 51.0 50.6 51.4 51.2 51.3 52.7 51.7OPEC ngls and non-conventionals 3.6 3.6 3.7 4.0 4.1 4.2 4.2 4.3 4.2 4.4 4.5 4.6 4.7 4.5
(b) Total non-OPEC supply and OPEC ngls
50.0 51.4 52.3 53.8 54.4 54.7 54.6 55.3 54.8 55.8 55.7 55.8 57.4 56.2
OPEC crude supply and balanceOPEC crude oil production1 27.2 25.4 27.0 29.1 29.5 30.0 Total supply 77.2 76.7 79.3 82.8 83.9 84.7 Balance2 0.1 –1.0 0.1 0.8 0.4 2.8
StocksClosing stock level (outside FCPEs) m bOECD onland commercial 2,630 2,476 2,520 2,556 2,551OECD SPR 1,285 1,345 1,408 1,444 1,456OECD total 3,915 3,821 3,928 4,000 4,007Oil-on-water 830 816 887 909 929Days of forward consumption in OECDCommercial onland stocks 55 51 51 51 53SPR 27 28 28 29 30Total 82 79 79 80 83
Memo itemsFSU net exports 4.6 5.6 6.5 7.3 7.5 7.5 7.6 7.5 7.5 7.6 7.9 8.0 7.8 7.8[(a) — (b)] 27.1 26.4 26.9 28.3 29.1 27.2 28.9 30.5 28.9 29.4 27.7 29.1 29.9 29.0

57
OPE
C bu
lleti
n 7–
8/05
Note: As of June 16, 2005 (ie 3W June), the OPEC Reference Basket has been calculated according to the new methodology as agreed by the 136th (Extraordinary) Meeting of the Conference.1. Tia Juana Light spot price = (TJL netback/Isthmus netback) x Isthmus spot price.2. OPEC Basket: an average of Saharan Blend, Minas, Bonny Light, Arabian Light, Dubai, Tia Juana Light and Isthmus.Kirkuk ex Ceyhan; Brent for dated cargoes; Urals cif Mediterranean. All others fob loading port.Sources: The netback values for TJL price calculations are taken from RVM; Platt’s Oilgram Price Report; Reuters; Secretariat’s calculations.
2004 2005Member Country/ Oct Nov Dec Jan Feb Mar April May JuneCrude (API°) 4Wav 5Wav 4Wav 4Wav 4Wav 5Wav 1W 2W 3W 4W 4Wav 5Wav 1W 2W 3W 4W 4Wav
AlgeriaSaharan Blend (44.1) 50.48 42.97 39.61 44.39 45.44 52.59 53.92 50.65 50.78 52.55 51.98 48.69 51.79 53.18 56.27 56.40 54.41
IndonesiaMinas (33.9) 49.68 37.25 34.76 42.55 44.56 54.30 58.60 55.73 54.26 55.25 55.96 50.34 55.35 54.68 55.26 54.77 55.02
IR IranLight (33.9) 43.59 37.81 34.77 39.87 40.56 48.50 52.02 46.82 46.58 48.24 48.42 45.53 48.91 51.49 54.41 54.68 52.37
IraqKirkuk (36.1) — — — — — — — — — — — — — — — — —
KuwaitExport (31.4) 38.81 35.87 34.91 38.55 40.09 46.42 50.33 47.46 45.88 47.89 47.89 46.36 50.19 51.03 51.43 51.95 51.15
SP Libyan AJBrega (40.4) 50.14 43.21 37.98 43.61 44.97 52.11 54.27 50.56 50.13 51.73 51.67 48.36 51.23 52.61 56.15 56.14 54.03
NigeriaBonny Light (36.7) 49.91 43.60 39.08 44.01 45.43 53.15 55.70 51.91 51.72 53.40 53.18 50.23 53.51 54.76 57.71 57.74 55.93
Saudi ArabiaLight (34.2) 39.00 35.56 34.64 38.26 40.10 46.85 50.83 48.35 46.77 48.78 48.68 47.09 50.87 51.71 53.50 53.80 52.47Heavy (28.0) 33.79 30.17 29.34 33.41 35.62 41.81 45.63 42.95 41.37 43.38 43.33 42.21 46.57 47.41 49.33 50.04 48.34
UAEDubai (32.5) 37.61 34.87 34.16 37.78 39.35 45.60 49.76 46.76 45.25 47.19 47.24 45.68 49.49 50.40 52.35 53.23 51.37
VenezuelaTia Juana Light1 (32.4) 43.55 37.37 32.36 35.75 36.77 43.50 45.80 42.41 41.76 43.11 43.27 41.67 45.76 46.97 50.13 49.91 48.19
OPEC Basket2 45.37 38.96 35.70 40.24 41.68 49.07 52.07 48.86 48.00 49.60 49.63 46.96 50.81 51.70 52.45 53.19 52.04
2004 2005Country/ Oct Nov Dec Jan Feb Mar April May JuneCrude (API°) 4Wav 5Wav 4Wav 4Wav 4Wav 5Wav 1W 2W 3W 4W 4Wav 5Wav 1W 2W 3W 4W 4Wav
Gulf AreaOman Blend (34.0) 39.81 36.65 35.40 39.04 40.54 46.95 50.59 47.84 46.19 48.27 48.22 46.70 50.55 51.31 53.21 53.74 52.20
MediterraneanSuez Mix (Egypt, 33.0) 39.56 35.34 32.48 36.37 36.98 44.58 46.72 43.21 43.75 45.56 44.81 43.11 46.68 47.72 50.76 50.34 48.88
North SeaBrent (UK, 38.0) 49.74 42.80 39.43 44.01 44.87 52.60 54.47 50.76 50.33 51.93 51.87 48.90 51.93 53.31 56.85 56.84 54.73Ekofisk (Norway, 43.0) 49.75 42.23 39.26 43.92 44.70 52.34 53.82 50.46 50.23 52.20 51.68 48.85 52.21 53.57 57.16 57.16 55.03
Latin AmericaIsthmus (Mexico, 32.8) 47.40 41.10 35.315 38.89 40.08 47.52 49.89 46.19 45.49 46.95 47.13 45.05 48.88 50.18 53.55 53.32 51.48
North AmericaWTI (US, 40.0) 53.32 48.22 43.12 46.64 47.69 54.09 56.05 52.04 51.59 52.69 53.09 50.25 54.02 55.21 58.73 58.45 56.60
OthersUrals (Russia, 36.1) 42.12 37.52 35.52 38.89 40.46 47.16 49.82 46.30 46.77 48.65 47.89 46.27 49.74 50.76 53.66 53.30 51.87
Table 1: OPEC spot crude oil prices, 2004–05 $/b
Table 2: Selected non-OPEC spot crude oil prices, 2004–05 $/b

58
OPE
C bu
lleti
n 7–
8/05
Ma
rke
t R
ev
iew Graph 1: Evolution of spot prices for selected OPEC crudes, March to June 2005
Graph 2: Evolution of spot prices for selected non-OPEC crudes, March to June 2005
��
��
��
��
��
��
��
��
�����������
���������������
�����
����������
����������
�����������
�����
�������������
����������
�����
�������������
�����������������
�� �� �� �� �� �� �� �� �� �� �� �� �� �� �� ������
��
��
��
��
��
��
��
��
�����������������
�����������
�����
����������
�������
�������
�����
��������
����
�� �� �� �� �� �� �� �� �� �� �� �� �� �� �� ������
Note: As of June 16, 2005 (ie 3W June), the OPEC Reference Basket has been calculated according to the new methodology as agreed by the 136th (Extraordinary) Meeting of the Conference.

59
naphtha
regular gasoline unleaded
premium gasoline 50ppm
dieselultra light jet kero
fuel oil1%S
fuel oil3.5%S
2004 June 45.70 45.79 50.95 44.31 45.26 24.21 23.39
July 48.87 52.01 57.43 49.51 49.88 24.28 24.44
August 54.96 51.06 55.95 55.88 55.74 23.73 24.62
September 54.88 50.73 56.15 58.04 58.49 23.40 24.12
October 61.21 55.81 61.90 66.82 65.91 28.10 25.88
November 56.49 50.64 56.00 63.76 60.31 25.23 21.49
December 50.20 42.42 46.52 60.36 54.05 24.96 20.93
2005 January 51.32 47.72 52.89 55.54 55.05 26.68 23.54
February 54.49 49.69 55.53 58.33 58.05 27.78 25.48
March 62.33 55.94 62.03 69.30 68.81 34.06 30.09
April 61.62 61.29 68.55 70.38 71.67 35.59 34.53
May 54.65 56.14 62.85 64.51 64.90 34.56 33.79
June 57.23 61.88 69.54 73.02 72.32 35.01 34.86
Table and graph 5: US East Coast market — spot cargoes, New York $/b, duties and fees included
naphtha
premium gasoline unl 95
premium gasoline50ppm
diesel ultra light
fuel oil1%S
fuel oil3.5%S
2004 June 37.48 44.64 na na 26.54 21.07
July 40.37 49.37 57.28 50.30 26.47 23.03
August 45.94 48.76 56.30 56.17 25.47 23.59
September 45.90 49.84 57.04 58.93 25.66 22.81
October 50.76 54.43 62.14 67.84 29.03 24.20
November 45.68 48.70 55.83 64.72 26.72 18.65
December 39.98 39.72 46.58 62.29 25.65 18.62
2005 January 41.69 45.72 53.17 58.75 28.69 21.80
February 44.26 48.28 56.09 59.29 29.59 24.79
March 51.34 54.23 62.87 73.26 35.31 29.07
April 51.05 59.51 68.88 71.44 38.31 33.67
May 44.97 53.58 61.99 64.90 35.99 32.20
June 46.94 59.95 68.85 73.65 38.33 33.59
regular gasoline
unleaded 87
regular gasoline unl 87rfg gasoil jet kero
fuel oil0.3%S
fuel oil2.2%S
2004 June 48.06 50.82 42.57 43.80 34.16 25.62
July 51.30 53.41 46.87 49.26 32.46 25.07
August 50.39 52.05 50.39 52.29 34.85 25.34
September 52.80 52.68 55.52 58.16 35.58 26.47
October 57.67 57.54 64.14 65.82 42.86 31.16
November 53.12 52.99 58.95 59.01 41.90 24.50
December 44.66 44.87 54.27 54.25 35.83 22.74
2005 January 51.67 51.84 55.50 58.76 36.87 27.62
February 51.32 51.57 57.00 57.64 40.57 28.91
March 60.28 58.57 65.62 66.52 43.66 32.22
April 61.50 63.04 65.76 66.31 46.23 35.36
May 57.38 60.37 62.04 62.05 44.83 36.50
June 63.29 66.13 70.25 70.60 47.52 37.00
Table and graph 3: North European market — spot barges, fob Rotterdam $/b
Table and graph 4: South European market — spot cargoes, fob Italy $/b
na not available.Source: Platts. Prices are average of available days.
��
��
��
��
��
��
��
����������������������������������
��������������������������
�������
�������������������������������������������� ����
��
��
��
��
��
��
����������������������������
����������������
������������������
������������������������������������������� ����
��
��
��
��
��
��
���������������������������������
��������������
������������������������
����������������������������������������������� ��������

60
Graph and table 6: Caribbean market — spot cargoes, fob $/b
Graph and table 7: Singapore market — spot cargoes, fob $/b
Graph and table 8: Middle East Gulf market — spot cargoes, fob $/b
naphtha gasoil jet kerofuel oil
2%Sfuel oil2.8%S
2004 June 43.00 41.30 44.16 21.62 21.37
July 44.95 45.39 49.00 21.06 20.82
August 46.62 48.67 52.38 21.34 21.04
September 49.65 52.80 58.10 22.47 26.87
October 55.18 62.12 64.83 27.16 26.87
November 56.02 56.02 57.23 20.50 20.26
December 41.06 50.50 52.15 18.75 18.41
2005 January 49.21 53.75 56.75 23.62 22.60
February 47.01 55.09 56.83 24.91 24.25
March 58.11 64.23 66.41 28.22 27.50
April 59.86 63.31 66.87 31.36 31.07
May 56.34 58.95 62.57 32.50 31.64
June 57.06 67.54 70.32 33.00 32.58
naphtha
premium gasoline unl 95
premium gasoline unl 92
dieselultra light jet kero
fuel oil2%S
fuel oil3.5%S
2004 June 37.19 45.19 44.04 0.00 43.17 27.43 26.87
July 38.60 46.52 45.12 0.00 48.08 27.64 26.98
August 44.19 51.50 50.62 0.00 52.29 28.82 28.19
September 43.95 49.06 48.20 0.00 61.25 27.84 27.18
October 48.81 54.73 53.68 0.00 61.25 30.96 29.95
November 47.46 52.45 51.74 0.00 57.64 29.40 27.99
December 42.79 44.81 44.24 0.00 50.07 26.93 24.00
2005 January 41.34 47.57 46.87 52.21 51.10 28.08 26.61
February 44.61 54.27 53.70 56.72 54.54 30.35 29.28
March 50.74 59.47 58.72 68.34 66.33 34.13 33.61
April 49.85 61.50 60.23 69.39 71.40 38.30 37.75
May 44.76 54.46 53.37 63.83 63.39 38.00 37.18
June 45.71 59.65 58.38 72.42 68.93 39.34 38.11
naphtha gasoil jet kerofuel oil180 Cst
2004 June 40.08 38.79 40.88 24.61
July 42.83 42.75 45.58 24.86
August 48.11 47.98 50.03 25.72
September 48.04 50.44 53.04 24.71
October 53.53 53.79 58.29 26.79
November 49.44 50.90 53.56 24.02
December 44.01 45.16 46.20 21.97
2005 January 44.99 45.60 47.68 25.20
February 47.71 50.10 52.24 27.39
March 54.66 59.83 63.74 29.44
April 53.98 61.36 69.00 34.54
May 47.91 56.45 61.09 34.75
June 50.08 65.62 66.98 36.24
na not available.Source: Platts. Prices are average of available days.
��
��
��
��
��
��
��������������������������������������
�������������
����������������������������������������������� ��������
��
��
��
��
��
��
��
��������������������������������
��������������
����������������������
�������
����������������������������������������������� ��������
��
��
��
��
��
��
��
������������������������
�������������
������������������������������������������� ����

61
OPE
C bu
lleti
n 7–
8/05

62
OPE
C bu
lleti
n 7–
8/05
No
tic
eb
oa
rd
Production forecasting in upstream oil and gas, August 23–24, 2005, Kuala Lumpur, Malaysia. Details: IQPC, 1 Shenton Way #13–7, 068803 Singapore. Tel: +65 6722 9388; fax: +65 6720 3804; e-mail: [email protected]; Web site: www.oilandgasiq.com.
Shutdowns and turnarounds, August 24–25, 2005, Sydney, Australia. Details: IQPC, Level 6, 25 Bligh Street, Sydney NSW 2000, Australia. Tel: +61 2 9223 2600; fax +61 2 9223 2622; e-mail: [email protected]; Web site: www.iqpc.com.au/MaintenanceIQ.
National oil companies: briefing and summit, August 31–September 2, 2005, The Hague, The Netherlands. Details: Global Pacific & Partners, 264 Groot Hertogrnnelaan, 2571 EZ, The Hague, The Netherlands. Tel: +31 70 324 6154; fax: +31 70 324 1741; e-mail: [email protected]; Web site: www.petro21.com.
Heavy oil development, September 4–8, 2005, Sanya, Hainan Island, China. Details: Society of Petroleum Engineers (SPE), Suite B–11–1, Level 11, Block B, Plaza Mont’Kiara, Jalan Bukit Kiara, Mont’Kiara, Kuala Lumpur 50480, Malaysia. Tel: +60 3 6201 2330; fax: +60 3 6201 3220; e-mail: [email protected]; Web site: www.spe.org.
Understanding and modelling the near wellbore, September 4–9, 2005, Dubrovnik, Croatia. Details: SPE, Part Third Floor East, Portland House, 4 Great Portland Street, London W1W 8QJ, UK.Tel: +44 207 299 3300; fax: +44 207 299 3309; e-mail: [email protected]; Web site: www.spe.org.
Gas commercialisation Asia 2005, September 6–7, 2005, Kuala Lumpur, Malaysia. Details: IQPC, 1 Shenton Way #13–7, 068803 Singapore. Tel: +65 6722 9388; fax: +65 6720 3804; e-mail: [email protected]; Web site: www.oilandgasiq.com.
Offshore Europe 2005, September 6–9, 2005, Aberdeen, UK. Details: The Offshore Europe Partnership, Oriel House, The Quadrant, Richmond TW9 1DL, UK. Tel: +44 20 8439 8890; fax: +44 20 8439 8897; e-mail: [email protected]; Web site: www.offshore-europe.co.uk.
Introduction to the upstream petroleum industry, September 12–13, 2005, Calgary, Canada; September 29–30, 2005, Montreal, Canada. Details: Canadian Energy Research Institute (CERI), #150, 3512–3 Street NW, Calgary T2L 2A6, Canada. Tel: +1 403 220 2357; fax: +1 403 284 4181; e-mail: [email protected]; Web site: www.ceri.ca/training.
Upstream government petroleum contracts, September 12–13, 2005, Singapore. Details: The Conference Connection Inc, PO Box 1736, Raffles City, 911758 Singapore. Tel: +65 6222 0230; fax: +65 6222 0121; e-mail: [email protected]; Web site: www.cconnection.org.
Natural gas market fundamentals, September 12–13, 2005, Toronto, Canada; September 15–16, 2005, Edmonton, Canada. Details: CERI, #150, 3512–3 Street NW, Calgary T2L 2A6, Canada. Tel: +1 403 220 2357; fax: +1 403 284 4181; e-mail: [email protected]; Web site: www.ceri.ca/training.
An introduction to upstream economics and risk analysis, September 12–15, 2005, London, UK. Details: Petroleum Economist Ltd, 15/17 St. Cross Street, London EC1N 8UW, UK. Tel: +44 20 7831 5588; fax: +44 20 7831 4567/5313; e-mail: [email protected]; Web site: www.petro-leum-economist.com.
Asia Pacific refining 2005, September 13–14, 2005, Bangkok, Thailand. Details: Centre for Management Technology, 80 Marine Parade Rd, #13–02 Parkway Parade, 449269 Singapore. Tel: +65 6345 7322; fax: +65 6345 5928; e-mail: [email protected]; Web site: www.cmtevents.com.
LNG terminals, September 13–14, 2005, Costa Mesa, CA, USA. Details: IQPC, 555 Route 1 South, Iselin, NJ 08830, USA. Tel: +1 973 256 0211; fax: 1 973 256 0205; e-mail: [email protected]; Web site: www.oilandgasIQ.com.
13th Asia petrochemical summit, September 15–16, 2005, Bangkok, Thailand. Details: Centre for Management Technology, 80 Marine Parade Rd, #13–02 Parkway Parade, 449269 Singapore. Tel: +65 6345 7322; fax: +65 6345 5928; e-mail: [email protected]; Web site: www.cmtevents.com.
Advance price risk management, September 15–16, 2005, Singapore. Details: Conference Connection Administrators Pte, 105 Cecil Street, #07–02, The Octagon, 069534 Singapore. Tel: +65 6222 0230; fax: +65 6222 0121; e-mail: [email protected]; Web site: www.cconnection.org.
Production sharing contracts and international petroleum fiscal systems, September 15–17, 2005, Singapore; September 21–23, 2005, Houston, TX, USA. Details: The Conference Connection Inc, PO Box 1736, Raffles City, 911758 Singapore. Tel: +65 6222 0230; fax: +65 6222 0121; e-mail: [email protected]; Web site: www.cconnection.org.
Pacific petroleum insiders, September 16–17, 2005, Singapore. Details: The Conference Connection Inc, PO Box 1736, Raffles City, 911758 Singapore. Tel: +65 6222 0230; fax: +65 6222 0121; e-mail: [email protected]; Web site: www.cconnection.org.
Understanding the natural gas and LNG industry, September 19–21, 2005, London, UK. Details: Petroleum Economist, 15/17 St. Cross Street, London EC1N 8UW, UK. Tel: +44 20 7831 5588; fax: +44 20 7831 4567/5313; e-mail: [email protected]; Web site: www.petroleum-economist.com.
Oil and gas technology Indonesia 2005, September 21–24, 2005, Jakarta, Indonesia. Details: Allworld Exhibitions, OES, 11 Manchester Square, London W1U 3PL, UK. Tel: +44 20 7862 2071; fax: +44 20 7862 2078; e-mail: [email protected]; Web site: www.allworldexhibitions.com.
Introduction to the natural gas industry … from wellhead to burner-tip, September 22–23, 2005, Calgary, Canada. Details: CERI, #150, 3512–33 Street NW, Calgary T2L 2A6, Canada. Tel: +1 403 220 2357; fax: +1 403 284 4181; e-mail: [email protected]; Web site: www.ceri.ca/Training.
LNG plant optimisation strategies, September 22–23, 2005, Kuala Lumpur, Malaysia. Details: IQPC, 1 Shenton Way #13–07, 068803 Singapore. Tel: +65 6722 9388; fax: +65 6720 3804; e-mail: [email protected]; Web site: www.oilandgasiq.com.
Crude oil marketing and valuation, September 22–23, 2005, Singapore. Details: The Conference Connection Inc, PO Box 1736, Raffles City, 911758 Singapore. Tel: +65 6222 0230; fax: +65 6222 0121; e-mail: [email protected]; Web site: www.cconnection.org.
Commercial and trading aspects of oil refining, September 25–29, 2005, London, UK. Details: Petroleum Economist, 15/17 St Cross Street, London EC1N 8UW, UK. Tel: +44 20 7831 5588; fax: +44 20 7831 4567/5313; e-mail: [email protected]; Web site: www.petroleum-economist.com.
18th World Petroleum Congress, September 26–30, 2005, Johannesburg, South Africa. Details: ITE South Africa, PO Box 785170, Sandton, 2146, Johannesburg, South Africa. Tel: +27 11 302 4600; fax: +27 11 302 4601; e-mail: [email protected]; Web site: www.18wpc.com.
26th Executive retreat, September 29–30, 2005, Bagshot, UK. Details: CGES, 17 Knightsbridge, London SW1X 7LY, UK. Tel +44 20 7235 4334; fax: +44 20 7235 4338/5038; e-mail: [email protected]; Web site: www.cges.co.uk.
Call for papers
2nd Kuwait international petroleum conference and exhibition, KIPCE 2005, December 10–12, 2005, Kuwait City, Kuwait. Details: Department of Petroleum Engineering, Kuwait University, PO Box 5969, Safat 13060, Kuwait. Tel: +965 481 1188-5212; fax: +965 484 9558; e-mail: [email protected]; Web site: www.kipce.net.
Forthcoming events

63
OPE
C bu
lleti
n 7–
8/05
Ad
ve
rtis
ing
Ra
tes
an
d D
ataReach decision-makers through OPEC Bulletin
The OPEC Bulletin is distributed on subscription and to a selected readership in the following fields: oil and gas industry; energy and econom-ics ministries; press and media; consultancy, science and research; service and ancillary industries. Recipients include OPEC Ministers, other top-level officials and decision-makers in government and business circles, together with policy advisers in key industrial organizations. The magazine not only conveys the viewpoints of OPEC and its Member Countries but also promotes discussion and dialogue among all interested parties in the industry. It regularly features articles by officials of the Secretariat and leading industry observers. Each issue includes a topical OPEC commentary, oil and product market reports, official statements, and the latest energy and non-energy news from Member Countries and other developing countries.
General termsOrders are accepted subject to the terms and conditions, current rates and technical data set out in the advertising brochure. These may be varied without notice by the Publisher (OPEC). In particular, the Publisher reserves the right to refuse or withdraw advertising felt to be incompatible with the aims, standards or interests of the Organization, without necessarily stating a reason.
Advertising RepresentativesNorth America: Donnelly & Associates, PO Box 851471, Richardson, Texas 75085-1471, USA. Tel: +1 972 437 9557; fax: +1 972 437 9558.Europe: G Arnold Teesing BV, Molenland 32, 3994 TA Houten, The Netherlands. Tel: +31 30 6340660; fax: +31 30 6590690.Middle East: Imprint International, Suite 3, 16 Colinette Rd, London SW15 6QQ, UK. Tel: +44 (0)181 785 3775; fax: +44 (0)171 837 2764Southern Africa: International Media Reps, Pvt Bag X18, Bryanston, 2021 South Africa. Tel: +2711 706 2820; fax: +2711 706 2892.Orders from Member Countries (and areas not listed below) should be sent directly to OPEC.
Black & white rates (US dollars)Multiple: 1X 3X 6X 12Xfull page 2,300 2,150 2,000 1,8501/2 (horizontal) 1,500 1,400 1,300 1,2001/3 (1 column) 800 750 700 6501/6 (1/2 column) 500 450 400 3501/9 (1/3 column) 300 275 250 225Colour surcharge Special position surchargeSpot colour: 400 per page; 550 per spread. Specific inside page: plus 10 per cent 3 or 4 colours: 950 per page; 1,300 per spread. Inside cover (front or back): plus 35 per cent The back cover: plus 50 per cent
DiscountsPayment sent within 10 days of invoice date qualifies for two per cent discount. Agency commission of 15 per cent of gross billing (rate, colour, position, but excluding any charges for process work), if client’s payment received by Publisher within 30 days.
Technical data about OPEC BulletinFrequency: Published ten times/year.Deadlines: Contact Publisher or local advertising representative at the address above.Language: Advertisement text is acceptable in any OPEC Member Country language, but orders should be placed in English.Printing/binding: Sheet-fed offset-litho; perfect binding (glued spine).Page size: 210 mm x 275 mm (8 1/
4" x 10 7/
8").
Full bleed: +3 mm (1/4") overlap, live material up to 5 mm (1/
2") from edge.
Text block: 175 mm x 241 mm (6 7/8" x 9 1/
2").
Readership: Estimated to be on circulation to around 6,000 readers in 100 countries.Material: Originals preferred as film positives (right-reading when emulsion side down). Design and typesetting charged at 15 per
cent of advert cost. Artwork accepted (but deadline advanced by one week). Reversing and artwork processing charged at cost and billed separately. Printer requires proof or pre-print.
Screen: 60 dots per inch (133dpi) ±5 per cent (North America: 133 line screen).Colour indication: Use Pantone matching scheme, or send proof (otherwise no responsibility can be accepted for colour match).Proofs: Sent only on request; approval assumed unless corrections received within two weeks of despatch.Payment: Due upon receipt of invoice/proof of printing, either by direct transfer to the following account number: 2646784 Credi-
tanstalt, Vienna, Austria. Or by banker’s cheque, made payable to OPEC. Net 30 days. Payment may also be made by the following credit cards: Visa, Euro Card/Master Card and Diners’ Club.

64
OPE
C bu
lleti
n 7–
8/05
Ord
er
Fo
rm OPEC Annual Statistical Bulletin 2003This 144-page book, including colour graphs and tables, comes with a CD-ROM featuring all the data in the book and more (for Microsoft Windows only).
The book with CD-ROM package costs $85.
❐ Please send me ................. copies of the OPEC Annual Statistical Bulletin 2003 (book plus CD-ROM)
OPEC Bulletinis published ten times/year and a subscription costs $70. Subscription commences with the current issue (unless otherwise requested) after receipt of
payment.
❐ I wish to subscribe to the OPEC Bulletin for a one-year period
OPEC Monthly Oil Market ReportPublished monthly, this source of key information about OPEC Member Country output also contains the Secretariat’s analyses of oil and product price
movements, futures markets, the energy supply/demand balance, stock movements and global economic trends. $525 per year for an annual subscription
of 12 issues.
❐ I wish to subscribe to the MOMR for a one-year period ❐ Please send me a sample copy
OPEC Reviewcontains research papers by international experts on energy, the oil market, economic development and the environment.
Available quarterly only from the commercial publisher.
For details contact: Blackwell Publishing Ltd, 9600 Garsington Road, Oxford OX4 2DQ, UK.
Tel: +44 (0)1865 776868; fax: +44 (0)1865 714591; e-mail: [email protected]; www.blackwellpublishing.com.
Institutional subscribers £265/yr (North/South America $429); Individuals £117/yr (North/South America $126).
Shipping address (please print in block letters): Invoicing address (if different from shipping address):
Name: Name:Address: Address:
How to pay:Invoice me ❐ Credit card ❐ (Visa, Eurocard/MasterCard and Diners Club)Credit card company: Credit card no: Expiry date:
Holder: Signature:
Please mail this form to: PR & Information Department or telefax to:OPEC Secretariat PR & Information Department Obere Donaustrasse 93, A-1020 Vienna, Austria +43 1 214 98 27
All prices include airmail delivery. Windows™ is a trademark of the Microsoft Corporation

OP
EC
Pu
bli
ca
tio
nsOPEC offers a range of publications that reflect its ac tiv i ties. Single copies and subscrip-
tions can be obtained by contacting this De part ment, which regular readers shouldalso notify in the event of a change of address:
PR & Information Department, OPEC SecretariatObere Donaustrasse 93, A-1020 Vienna, AustriaTel: +43 1 211 12-0; fax: +43 1 214 98 27; e-mail: [email protected]
OPEC Month ly Oil Market Report
Crude oil and product prices analysis Member Country output figures Stocks and supply/demand anal y sisAnnual subscription $525 (12 issues)
To order, please fill in the form
Annual Report 2003Free of charge
OPEC Review(published quarterly)
annual subscription rates for 2004: Institutional sub scrib ers £265/yr
(North/South America $429);Individuals £117/yr
(North/South America $126).Orders and enquiries:
Blackwell Publishing Journals, 9600 Garsington Road,
Oxford OX4 2DQ, UK.Tel: +44 (0)1865 776868; fax: +44
(0)1865 714591;e-mail: jnlinfo@
blackwellpublishers.co.uk;www.blackwellpublishing.com
OPEC Annual Statistical Bulletin 2003144-page book with CD-ROM
Single issue $85The CD-ROM (for Microsoft
Windows only) contains all thedata in the book and much more.
• Easy to install and display• Easy to manipulate and query
• Easy to export to spreadsheets such as Excel
OPEC Bul le tinAnnual sub scrip tion $70
Vol XXIX, No 2 June 2005
Towards a more coherent oil policy in Russia?
Energy conservation:an alternative for investment
in the oil sector forOPEC Member Countries
Energy partnership: China and the Gulf States
Explaining the so-called “pricepremium” in oil markets
Sadek Boussena and Catherine Locatelli
Mehrzad Zamani
Gawdat Bahgat
Antonio Merino andÁlvaro Ortiz
OPEC offers a range of publications that reflect its ac tiv i ties. Single copies and subscrip-tions can be obtained by contacting this De part ment, which regular readers should
Annual Report 2003