Kinetics and Yields of Pesticide Biodegradation at Low...
8
Kinetics and Yields of Pesticide Biodegradation at Low Substrate Concentrations and under Conditions Restricting Assimilable Organic Carbon Damian E. Helbling, a,b Frederik Hammes, a Thomas Egli, a,c Hans-Peter E. Kohler a Eawag, Swiss Federal Institute of Aquatic Science and Technology, Department of Environmental Microbiology, Dübendorf, Switzerland a ; School of Civil and Environmental Engineering, Cornell University, Ithaca, New York, USA b ; Microbes-in-Water GmbH, Feldmeilen, Switzerland c The fundamentals of growth-linked biodegradation occurring at low substrate concentrations are poorly understood. Substrate utilization kinetics and microbial growth yields are two critically important process parameters that can be influenced by low substrate concentrations. Standard biodegradation tests aimed at measuring these parameters generally ignore the ubiquitous occurrence of assimilable organic carbon (AOC) in experimental systems which can be present at concentrations exceeding the concentration of the target substrate. The occurrence of AOC effectively makes biodegradation assays conducted at low substrate concentrations mixed-substrate assays, which can have profound effects on observed substrate utilization kinetics and microbial growth yields. In this work, we introduce a novel methodology for investigating biodegradation at low concentrations by re- stricting AOC in our experiments. We modified an existing method designed to measure trace concentrations of AOC in water samples and applied it to systems in which pure bacterial strains were growing on pesticide substrates between 0.01 and 50 mg liter 1 . We simultaneously measured substrate concentrations by means of high-performance liquid chromatography with UV detection (HPLC-UV) or mass spectrometry (MS) and cell densities by means of flow cytometry. Our data demonstrate that sub- strate utilization kinetic parameters estimated from high-concentration experiments can be used to predict substrate utilization at low concentrations under AOC-restricted conditions. Further, restricting AOC in our experiments enabled accurate and di- rect measurement of microbial growth yields at environmentally relevant concentrations for the first time. These are critical measurements for evaluating the degradation potential of natural or engineered remediation systems. Our work provides novel insights into the kinetics of biodegradation processes and growth yields at low substrate concentrations. T he global use of pesticides to increase crop yields and control unwanted organisms has resulted in extensive pollution to wa- ter resources. This pollution can impair water quality (1, 2) and lead to significant economic effects when pollutant concentra- tions warrant closure or mandated remediation of a contaminated drinking water source (3, 4). Exploitation of microbial processes has long been considered an attractive option to remediate con- taminated water resources (5). However, there are unique chal- lenges inherent in developing remediation strategies for pesticide- contaminated waters. One major challenge is the occurrence of most pesticides at low (sub-microgram/liter) concentrations (6); the fundamentals of growth-linked biodegradation occurring at these low concentrations remain poorly understood. Substrate utilization kinetics and microbial growth yields are two critically important biodegradation process parameters. Pre- vious research has reported that substrate utilization kinetics can differ significantly at substrate concentrations below a certain threshold (on the order of 100 g liter 1 ) compared to high con- centrations (7–10), a phenomenon attributed to the presence of at least two separate, concentration-dependent uptake and transfor- mation systems (7, 10). The consequence of these multiphasic kinetics is that extrapolation of kinetic data measured at higher concentrations may significantly under- or overestimate observed kinetics at low, environmentally relevant concentrations (10, 11). Comparatively few studies have investigated microbial growth and yield of bacterial strains at low substrate concentrations (12, 13). Several authors have reported threshold concentrations (typ- ically less than 10 g liter 1 ) below which degradation continues in a nongrowth regime (9, 11, 14), but these conclusions are based solely on observed first-order substrate utilization kinetics; direct measurements of microbial growth or yield at these low concen- trations have not been reported. A major limitation in interpreting previous studies on bio- degradation at low concentrations is the ubiquitous presence of contaminating assimilable organic carbon (AOC) in experi- mental systems. Even with extreme preparative measures, it is not possible to limit AOC concentrations in experimental sys- tems to below 5 to 10 g liter 1 (15). Experience in our lab suggests that experiments conducted with mineral medium in glassware treated according to standard laboratory practices can contain up to 100-fold more AOC than experiments con- ducted with more rigorously treated glassware (15). In fact, it can be assumed that growth experiments that were conducted in glassware and mineral medium prepared according to stan- dard laboratory procedures may have contained up to 1 mg liter 1 of contaminating AOC as the extent of growth in nega- tive controls could not be distinguished from growth in exper- iments conducted with up to 1 mg liter 1 of substrate (12, 16, Received 5 November 2013 Accepted 2 December 2013 Published ahead of print 6 December 2013 Address correspondence to Damian E. Helbling, [email protected]. Supplemental material for this article may be found at http://dx.doi.org/10.1128 /AEM.03622-13. Copyright © 2014, American Society for Microbiology. All Rights Reserved. doi:10.1128/AEM.03622-13 1306 aem.asm.org Applied and Environmental Microbiology p. 1306 –1313 February 2014 Volume 80 Number 4 on May 14, 2018 by guest http://aem.asm.org/ Downloaded from
Transcript of Kinetics and Yields of Pesticide Biodegradation at Low...
Kinetics and Yields of Pesticide Biodegradation at Low SubstrateConcentrations and under Conditions Restricting Assimilable OrganicCarbon
Damian E. Helbling,a,b Frederik Hammes,a Thomas Egli,a,c Hans-Peter E. Kohlera
Eawag, Swiss Federal Institute of Aquatic Science and Technology, Department of Environmental Microbiology, Dübendorf, Switzerlanda; School of Civil andEnvironmental Engineering, Cornell University, Ithaca, New York, USAb; Microbes-in-Water GmbH, Feldmeilen, Switzerlandc
The fundamentals of growth-linked biodegradation occurring at low substrate concentrations are poorly understood. Substrateutilization kinetics and microbial growth yields are two critically important process parameters that can be influenced by lowsubstrate concentrations. Standard biodegradation tests aimed at measuring these parameters generally ignore the ubiquitousoccurrence of assimilable organic carbon (AOC) in experimental systems which can be present at concentrations exceeding theconcentration of the target substrate. The occurrence of AOC effectively makes biodegradation assays conducted at low substrateconcentrations mixed-substrate assays, which can have profound effects on observed substrate utilization kinetics and microbialgrowth yields. In this work, we introduce a novel methodology for investigating biodegradation at low concentrations by re-stricting AOC in our experiments. We modified an existing method designed to measure trace concentrations of AOC in watersamples and applied it to systems in which pure bacterial strains were growing on pesticide substrates between 0.01 and 50 mgliter�1. We simultaneously measured substrate concentrations by means of high-performance liquid chromatography with UVdetection (HPLC-UV) or mass spectrometry (MS) and cell densities by means of flow cytometry. Our data demonstrate that sub-strate utilization kinetic parameters estimated from high-concentration experiments can be used to predict substrate utilizationat low concentrations under AOC-restricted conditions. Further, restricting AOC in our experiments enabled accurate and di-rect measurement of microbial growth yields at environmentally relevant concentrations for the first time. These are criticalmeasurements for evaluating the degradation potential of natural or engineered remediation systems. Our work provides novelinsights into the kinetics of biodegradation processes and growth yields at low substrate concentrations.
The global use of pesticides to increase crop yields and controlunwanted organisms has resulted in extensive pollution to wa-
ter resources. This pollution can impair water quality (1, 2) andlead to significant economic effects when pollutant concentra-tions warrant closure or mandated remediation of a contaminateddrinking water source (3, 4). Exploitation of microbial processeshas long been considered an attractive option to remediate con-taminated water resources (5). However, there are unique chal-lenges inherent in developing remediation strategies for pesticide-contaminated waters. One major challenge is the occurrence ofmost pesticides at low (sub-microgram/liter) concentrations (6);the fundamentals of growth-linked biodegradation occurring atthese low concentrations remain poorly understood.
Substrate utilization kinetics and microbial growth yields aretwo critically important biodegradation process parameters. Pre-vious research has reported that substrate utilization kinetics candiffer significantly at substrate concentrations below a certainthreshold (on the order of 100 �g liter�1) compared to high con-centrations (7–10), a phenomenon attributed to the presence of atleast two separate, concentration-dependent uptake and transfor-mation systems (7, 10). The consequence of these multiphasickinetics is that extrapolation of kinetic data measured at higherconcentrations may significantly under- or overestimate observedkinetics at low, environmentally relevant concentrations (10, 11).Comparatively few studies have investigated microbial growthand yield of bacterial strains at low substrate concentrations (12,13). Several authors have reported threshold concentrations (typ-ically less than 10 �g liter�1) below which degradation continuesin a nongrowth regime (9, 11, 14), but these conclusions are based
solely on observed first-order substrate utilization kinetics; directmeasurements of microbial growth or yield at these low concen-trations have not been reported.
A major limitation in interpreting previous studies on bio-degradation at low concentrations is the ubiquitous presence ofcontaminating assimilable organic carbon (AOC) in experi-mental systems. Even with extreme preparative measures, it isnot possible to limit AOC concentrations in experimental sys-tems to below 5 to 10 �g liter�1 (15). Experience in our labsuggests that experiments conducted with mineral medium inglassware treated according to standard laboratory practicescan contain up to 100-fold more AOC than experiments con-ducted with more rigorously treated glassware (15). In fact, itcan be assumed that growth experiments that were conductedin glassware and mineral medium prepared according to stan-dard laboratory procedures may have contained up to 1 mgliter�1 of contaminating AOC as the extent of growth in nega-tive controls could not be distinguished from growth in exper-iments conducted with up to 1 mg liter�1 of substrate (12, 16,
Received 5 November 2013 Accepted 2 December 2013
Published ahead of print 6 December 2013
Address correspondence to Damian E. Helbling, [email protected].
Supplemental material for this article may be found at http://dx.doi.org/10.1128/AEM.03622-13.
Copyright © 2014, American Society for Microbiology. All Rights Reserved.
doi:10.1128/AEM.03622-13
1306 aem.asm.org Applied and Environmental Microbiology p. 1306 –1313 February 2014 Volume 80 Number 4
on May 14, 2018 by guest
http://aem.asm
.org/D
ownloaded from

17). In effect, this implies that any biodegradation assay con-ducted at low substrate concentrations (below approximately 1mg liter�1) is a mixed-substrate assay, which will inevitablyhave profound effects on both substrate utilization kinetics(18–20) and yield measurements (12, 21). Therefore, experi-ments designed to quantify substrate utilization kinetics andmicrobial growth yields at low substrate concentrations shouldinclude appropriate measures to minimize the interfering ef-fects of contaminating AOC.
The goal of this work was to measure substrate utilization ki-netics and microbial growth yields of pesticide biodegradationunder AOC-restricted conditions. With respect to substrate utili-zation kinetics, we hypothesized that previously reported multi-phasic kinetics can also be explained as the result of a shift fromsingle-substrate utilization to mixed-substrate utilization. There-fore, we surmised that minimizing the concentration of interfer-ing AOC in our experimental system would help to resolve thesekinetic issues. With respect to microbial growth yields, we expectthat restricting the AOC in our experiments will allow us to accu-rately and directly measure yield at environmentally relevant con-centrations for the first time. To meet this goal, we modified anexisting method designed to measure trace concentrations ofAOC in water samples and applied it to systems where pure bac-terial strains were growing on pesticide substrates at concentra-tions between 0.01 and 50 mg liter�1. We simultaneously mea-sured substrate concentrations by means of high-performanceliquid chromatography with UV detection (HPLC-UV) or massspectrometry (MS) and cell densities by means of flow cytometry.We used data derived from high-concentration experiments toestimate substrate utilization kinetic parameters. The parameterswere used to simulate substrate utilization at lower concentrationsand were compared directly to measured data. Microbial growthyields were likewise calculated over a range of concentrations.Here, we present a novel methodology for investigating biodegra-dation at low concentrations, and the results provide novel in-sights into the kinetics of biodegradation processes and growthyields at low substrate concentrations.
MATERIALS AND METHODSChemicals. All chemicals were reagent grade. Linuron (99.5% purity) waspurchased from Ehrenstorfer GmbH (Augsburg, Germany). Carbofuran(99.9% purity) was purchased from Sigma-Aldrich (Seelze, Germany).Spike solutions were maintained in AOC-restricted mineral medium atconcentrations of 50 mg liter�1 for linuron and 100 mg liter�1 for carbo-furan. Chemical structures along with relevant physicochemical and ther-modynamic properties are provided in Table 1.
Strains. The bacterial strains investigated included the linuron de-grader Variovorax sp. strain SRS16 and the carbofuran degrader Novo-sphingobium sp. strain KN65.2. These strains were selected as candidatesfor engineered biological processes targeting two specific pesticide pollut-ants typically found at trace concentrations in groundwater, a primarilyAOC-restricted habitat (22). Variovorax sp. SRS16 was received as a streakon R2A agar plates from S. Sørensen (Department of Geochemistry, Geo-logical Survey of Denmark and Greenland). Novosphingobium sp. KN65.2was received as a streak on an R2A agar plate from D. Springael (Depart-ment of Earth and Environmental Sciences, Katholieke Universiteit [KU]Leuven). For each strain, a single colony was picked from the agar plateand added to 5 ml of sterilized LB medium. Cells were grown to earlystationary phase and diluted to approximately 15% glycerol (0.5 ml of50% sterile glycerol added to 1 ml of cell culture) and stored at �80°C.
AOC-restricted mineral medium. Experiments were conducted in asynthetic, AOC-restricted mineral medium containing 3.73 g liter�1
KH2PO4, 2.24 g liter�1 Na2HPO4 · 2H2O, 120 mg liter�1 (NH4)2SO4, 70mg liter�1 MgSO4, and 1 mg liter�1 Ca(NO3)2 at a pH of 6.5. Traceelements were added to final concentrations of 100 �g liter�1 H3BO3, 2.5mg liter�1 FeSO4 · 7H2O, 750 �g liter�1 MnSO4 · H2O, 1.3 mg liter�1
ZnSO4 · 7H2O, 250 �g liter�1 CuSO4 · 5H2O, 300 �g liter�1 Co(NO3) ·6H2O, 150 �g liter�1 Na2MoO4 · 2H2O, and 10 �g liter�1 NiSO4 · 7H2O.The mineral medium recipe was modified from recipes previously de-scribed for cultivation of each strain on its target substrate (23; T. P. O.Nguyen, D. E. Helbling, K. Bers, T. T. Fida, R. Wattiez, H. P.-E. Kohler, R.De Mot, D. Springael, submitted for publication).
Inoculum preparation. A sterile loop was used to inoculate frozencells maintained in 15% glycerol at �80°C into 5 ml of sterilized 10-fold-diluted LB growth medium amended with approximately 10 mg liter�1 ofthe target substrate. Cells were grown at 30°C to late exponential phase, atwhich point 1 ml of culture was sampled, centrifuged at 5,000 � g for 5min, carefully decanted, and resuspended in an equal volume of AOC-restricted mineral medium. This washing procedure was repeated threetimes. The final cell density was determined by means of flow cytometry.Cells were subsequently inoculated at 105 cells ml�1 into 20 ml of mineralmedium amended with approximately 10 mg liter�1 of the target sub-strate. Cells were incubated until the chemical was completely degraded(monitored by HPLC-UV), at which point 1 ml of culture was sampled,centrifuged at 5,000 � g for 5 min, carefully decanted, and resuspended inan equal volume of AOC-restricted mineral medium. This washing pro-cedure was again repeated three times to ensure complete removal ofresidual AOC. The final inoculum concentration was determined bymeans of flow cytometry.
TABLE 1 Chemical structures and relevant physicochemical andthermodynamic properties
Characteristic Linuron Carbofuran
Structure
Cl
NH
Cl
NO
CH3
O
CH3O
CH3
CH3
O
NH
O
CH3
CAS no.h 330-55-2 1563-66-2Molecular formula C9H10Cl2N2O2 C12H15NO3
Molecular mass (Da) 248.0113 221.1046log Kow
a 2.91 2.30Solubility (mg liter�1)b 44.27 353.9Henry’s constant (atm m3 mol�1)c 1.15 � 10�08 1.63 � 10�09
pKad 11.9 14.8
Degree of reductance (�D) 4.44 4.67�GCS
0= (kJ mol�1)e �276.14 �251.46�GD
0= (kJ e� equivalent�1)f 34.81 29.48Theoretical YC/C
g 0.39 0.41a Kow is the octanol-water partition coefficient, estimated from KOWWIN, version 1.67(46).b Water solubility at 25°C from WSKOW, version 1.41 (46).c Henry’s constant from HENRYWIN, version 3.10 (46).d pKa values were estimated using MarvinSketch, version 5.11.3, from ChemAxon(Cambridge, MA).e Gibbs energy of formation of each substrate estimated according to the groupcontribution approach (47, 48).f Gibbs free energy of the electron donor half-reaction for each substrate.g Theoretical yield (YC/C, calculated as mol of C in cells per mol of C in substrate) wasestimated using the McCarty efficiency approach (32, 37–39).h CAS, Chemical Abstract Services.
Micropollutant Biodegradation at Low Concentrations
February 2014 Volume 80 Number 4 aem.asm.org 1307
on May 14, 2018 by guest
http://aem.asm
.org/D
ownloaded from

Incubation experiments. All experiments were designed based onmethods previously established for measuring bacterial growth on traceconcentrations of AOC (15). Briefly, experiments were conducted in40-ml carbon-free borosilicate glass vials. All glassware and caps weretreated rigorously to remove residual AOC as previously described (15,24, 25). Microbial growth and substrate utilization were measured in 20ml of AOC-restricted mineral medium amended with the target sub-strates. A series of three incubation experiments was designed to addressthree main objectives. First, high-concentration incubation experimentswere conducted in triplicate at approximate initial conditions of 105 cellsml�1 and 50 mg liter�1 of the target substrate to confirm growth-linkedsubstrate utilization for each strain-substrate pair. Second, low-concen-tration incubation experiments were conducted under a matrix of initialcell densities (106, 105, 104, and 103 cells ml�1) and substrate concentra-tions (10, 3, 1, 0.3, 0.1, 0.03, and 0.01 mg liter�1) to systematically inves-tigate the effects of stepwise changes in initial conditions on microbialgrowth and substrate utilization. Third, a series of incubation experi-ments was conducted at an initial cell density of 105 cells ml�1 and a rangeof initial substrate concentrations from 1 to 50 mg liter�1 to obtain anoptimal data set for estimation of kinetic parameters. All reaction mix-tures were incubated at 30°C until cells attained stationary phase or untilthe measured substrate concentration was below the limit of detection.Samples were taken at the time of inoculation and periodically thereafterto measure cell growth by means of flow cytometry and substrate concen-tration by means of HPLC-UV or HPLC-MS. As a positive control, 103
cells ml�1 was inoculated into 5 ml of sterilized LB medium, and growthwas confirmed by visual inspection of changes in optical density. As neg-ative controls, incubation experiments were run in the absence of eithercells or substrate.
Flow cytometry. Cell densities were measured on a BD Accuri C6Flow Cytometer (Erembodegem, Belgium). Aliquots of 500 �l from anincubation experiment were combined with 5 �l of SYBR green stain(Molecular Probes, Basel, Switzerland) diluted 100-fold in dimethyl sul-foxide (Fluka Chemie AG, Buchs, Switzerland) in a 1.5-ml plastic centri-fuge tube (Greiner Bio One, Frickenhausen, Germany), vortexed briefly,and incubated in the dark at 40°C for 10 min. For cell densities of less than5 � 105 cells ml�1, samples were measured directly on a BD Accuri C6Flow Cytometer without dilution. In the case of higher cell densities,samples were appropriately diluted with 0.1-�m-pore-size-filtered bot-tled mineral water (Evian, France) to achieve a cell density in the range of3 � 103 cells ml�1 and 5 � 105 cells ml�1. Data were analyzed with theCFlow, version 1.0.227.4, flow cytometry software. For all strains, enu-meration was achieved with signals collected on the gated combined 533nm/670 nm density plot (26).
Chemical analysis. Chemical analysis was conducted on either anHPLC-UV (0.3 to 50 mg liter�1 experiments) or HPLC-MS (0.01 to 0.3mg liter�1 experiments) instrument. HPLC-UV analyses were performedon a Gynkotek system with a Dionex ASI-100 autosampler and a UVD340U diode array detector. Compounds were separated on a Nucleosil100-5 C18 HD column (250 by 4.0 mm) with an octadecyl modified high-density silica stationary phase (Macherey-Nagel, Düren, Germany). Thesystem was operated isocratically at a flow rate of 0.7 ml min�1 withdifferent eluents and detection wavelengths for carbofuran (55% metha-nol and 45% nanopure water) and linuron (70% methanol and 30%nanopure water; 213 nm). Limits of quantification of HPLC-UV were lessthan 0.05 mg liter�1 with a 50-�l injection volume. The ChromeleonClient, version 6.6 (Dionex), was used for chromatogram analysis andinterpretation. HPLC-MS analyses were performed on a high-resolutionmass spectrometer (QExactive, Thermo, Waltham, MA, USA) with ananalytical method that was previously described (27, 28). Briefly, com-pounds were separated on an XBridge (Waters, Milford, MA) C18 column(2.1 mm by 50 mm; particle size, 3.5 mm) at a flow rate of 200 �l min�1.The mobile phase consisted of nanopure water and HPLC-grade metha-nol (Acros Organics, Geel, Belgium), each amended with 0.1% (volume)formic acid (98 to 100%; Acros Organics, Geel, Belgium). Samples were
injected into the column at 20 �l with an initial mobile phase of 90:10water/methanol, and elution from the column was achieved with a finalmobile phase of 5:95 water/methanol. The QExactive spectrometer wasused with electrospray ionization in positive mode. XCalibur, version2.0.7, software (Thermo, Waltham, MA) was used for chromatogramanalysis and interpretation. Limits of quantification for each compoundon HPLC-MS were less than 0.001 mg liter�1.
Dry weight of cells. The dry weight of cells (XDW) was measured byfirst collecting stationary-phase cells on an oven-dried 0.2-�m-pore-sizeNuclepore polycarbonate track-etched membrane filter (Whatman, Pis-cataway, NJ, USA). The wetted filter was then dried at 105°C, and the XDW
given as the mass per cell was calculated as:
XDW �(mf � mi)
V � Xs(1)
where mf is the mass of the dry filter after filtration (mg), mi is the mass ofthe dry filter before filtration (mg), V is the volume of stationary-phasecells filtered (ml), and Xs is the stationary-phase cell density determinedby means of flow cytometry (cells ml�1).
Estimation of kinetic parameters. Microbial growth and substrateutilization parameters were estimated from the experimental data by as-suming Monod kinetics as given in equations 2 and 3 (29):
dX
dt�
�max S
Ks � SX (2)
dS
dt�
1
YC ⁄C
�max S
KS � SX (3)
where S is the concentration of carbon in the substrate (mM Csubstrate),�max is the maximum specific growth rate (day�1), Ks is the concen-tration of carbon in the substrate giving one-half the maximum rate(mM Csubstrate), X is the biomass concentration of carbon in cells (mMCcells), and YC/C is the molar yield in mol of carbon in cells per mol ofcarbon in the substrate (mol of Ccells � mol of Csubstrate
�1). All concentra-tions were converted to millimolar carbon for consistency and to follow thepreviously established convention (30–32). Cell densities measured by meansof flow cytometry in units of cells ml�1 were converted to mM Ccells by usingthe measured dry weight of cells (XDW) and an assumed molecular weight ofcells of 22.6 g XDW C mol�1 (32) and by assuming that the organic cell for-mulation CH1.4O0.4N0.2 is 95% of the XDW (33).
We used R, version 3.0.0 (34), and the flexible modeling environment(FME) package (35) to numerically and simultaneously solve the differ-ential equations provided in equations 2 and 3 and to estimate the valuesof �max, Ks, and YC/C by minimizing the sum of the squared residualsbetween measured and modeled data. We then used a Markov chainMonte Carlo (MCMC) method that uses a delayed rejection and adaptiveMetropolis procedure (36) to construct a Markov chain and sample fromprobability distributions over 50,000 iterations to generate a marginaldistribution of parameter values to assess uncertainty and drift in theparameter estimates.
Estimation of theoretical and experimental molar yield. The theo-retical molar yield for each substrate was estimated by using the efficiencyapproach of McCarty (32, 37–39). We further adjusted theoretical molaryield predictions to account for putative oxygenase activation reactionsthrough a previously described method (33). More information on theprocedures to estimate theoretical molar yield along with an examplecalculation for carbofuran is provided in the supplemental material.
Experimental yield is reported as numeric yield (i.e., Y#/s, yield re-ported as cell numbers per mass of substrate) and as molar yield (i.e., YC/C,yield reported as moles of cell carbon per moles of substrate carbon).Numeric yield was estimated as:
Y#⁄s �(S0 � Ss)
(Xs � Xs,c)(4)
where Y#/s is the numeric yield (cells �g substrate�1), S0 is the initialsubstrate concentration (�g ml�1), Ss is the residual substrate concentra-
Helbling et al.
1308 aem.asm.org Applied and Environmental Microbiology
on May 14, 2018 by guest
http://aem.asm
.org/D
ownloaded from

tion remaining when cells reach stationary phase (�g ml�1), Xs is the celldensity at stationary phase (cells ml�1), and Xs,c is the cell density atstationary phase in the no-substrate negative control (cells ml�1). Nu-meric yield was converted to molar yield by using the dry weight of cells(XDW) and an assumed molecular weight of cells of 22.6 g XDW C mol�1
(32) and by assuming that the organic cell formulation CH1.4O0.4N0.2 is95% of the XDW (33).
RESULTS AND DISCUSSIONAOC concentrations in mineral medium. The goal of this workwas to measure substrate utilization kinetics and microbial growthyields at low substrate concentrations and under AOC-restrictedconditions. We therefore first sought to determine the concentra-tion of background AOC in our experimental system. To do this,we inoculated each strain into the mineral medium at initial celldensities of 103 cells ml�1. Cell densities measured after 7 dayswere 1.3 � 105 and 6.6 � 104 cells ml�1, which corresponds to thenutritional equivalent of 13 and 6.6 �g liter�1 of AOC for strainsSRS16 and KN65.2, respectively, using standard yield conversionfactors (15). Achieving these low concentrations of backgroundAOC enabled quantification of substrate utilization kineticsand microbial growth yield on target substrates down to ap-proximately 10 �g liter�1; experiments conducted below thislimit would be difficult to interpret due to the influence ofbackground AOC.
High-concentration incubation experiments. The first set ofincubation experiments were designed to confirm growth-linkedsubstrate utilization for both strain-substrate pairs under AOC-restricted conditions; both of the strains selected for this workhave previously been shown to mineralize a target pesticide over awide range of concentrations (40; Nguyen et al., submitted), butso far only limited data on growth and yield have been reported(see the supplemental material for the discussion on each strain).The results of these experiments are presented in Fig. 1. High-concentration incubation experiments were conducted at initialconditions of approximately 50 mg liter�1 of substrate and 105
cells ml�1. Under these conditions, strains SRS16 and KN65.2grew as shown in Fig. 1a and b, respectively. Stationary phase wasattained within 9 days, and cell densities exceeded 107 cells ml�1 inexperiments with strain SRS16; stationary phase was attainedwithin 4 days, and cell densities exceeded 108 cells ml�1 in exper-
iments with strain KN65.2. No residual linuron or carbofuranconcentrations were measured. In negative controls, there was nomeasurable growth in the AOC-restricted mineral medium in theabsence of the pesticide substrate (growth on the backgroundAOC was less than the initial cell density of these experiments) andpesticides did not disappear in the absence of cells (Fig. 1, dashedlines).
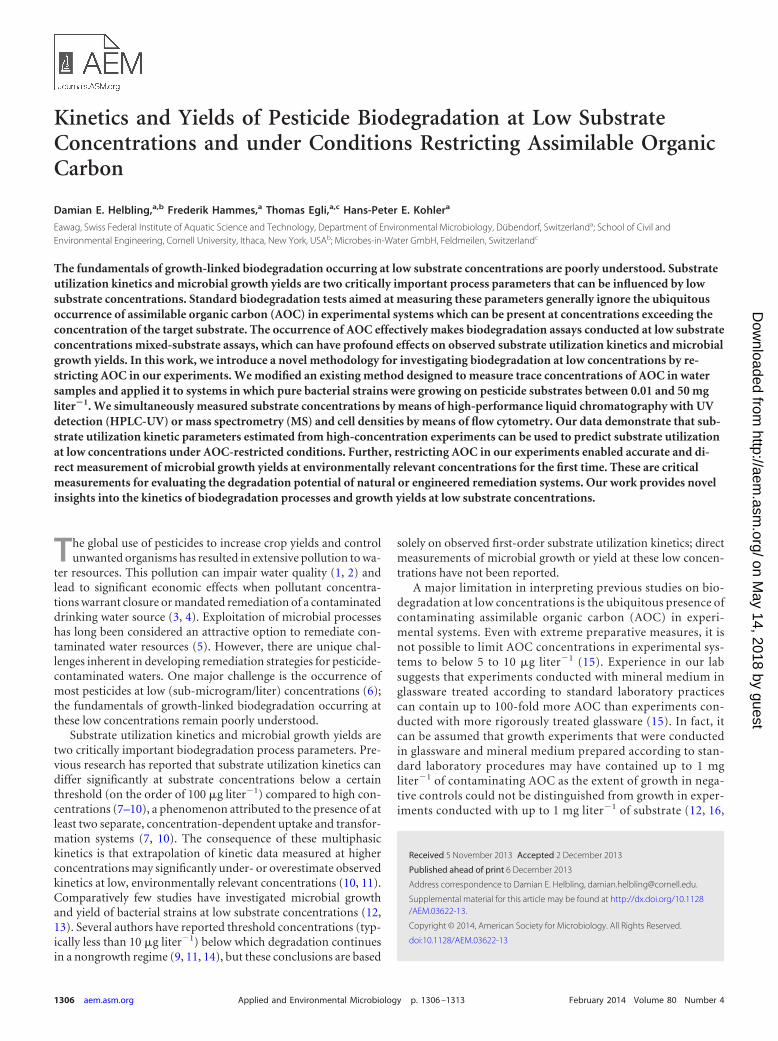
Low-concentration incubation experiments. In the secondset of incubation experiments, we aimed to measure substrateutilization and microbial growth over a range of initial substrateconcentrations and cell densities to elucidate the effects of step-wise changes in initial conditions on substrate utilization kineticsand microbial growth yields. We designed a matrix of 28 incuba-tion experiments investigating seven initial substrate concentra-tions and four initial cell densities. We selected initial substrateconcentrations between 0.01 and 10 mg liter�1 to test for shifts insubstrate utilization kinetics below previously reported thresholdsfor multiphasic kinetics on the order of 100 �g liter�1 (7–10). Weselected initial cell densities between 103 to 106 cells ml�1 to like-wise test for shifts in substrate utilization kinetics in potentialgrowth (high ratio of substrate concentration to cell density) andnongrowth (low ratio of substrate concentration to cell density)regimes (9, 11, 14). A summary of substrate utilization observed inthese incubation experiments is provided in Fig. 2, where the frac-tion of the initial substrate concentration remaining after incuba-tion periods of 3 and 28 days is reported.
The effect of lowering initial substrate concentrations and celldensities on the extent and kinetics of substrate utilization variedconsiderably between the two strains. In experiments with strainSRS16, the extent of substrate utilization was unaffected by lowerinitial substrate concentrations and cell densities; we observedpartial substrate utilization in all incubations after an incubationperiod of 3 days (Fig. 2a) and nearly complete substrate utilizationafter an incubation period of 28 days (Fig. 2b). In experimentswith strain KN65.2, substrate utilization was apparently affectedby both lower initial substrate concentrations and cell densities.We observed nearly no substrate utilization after an incubationperiod of 3 days (Fig. 2c) and a bipartite substrate utilization pat-tern after an incubation period of 28 days (Fig. 2d); completesubstrate utilization was observed for most incubations with the
FIG 1 Growth and substrate utilization in high-concentration incubation experiments for Variovorax sp. SRS16 with linuron (X0 � 9.8 � 104 � 8 � 103 cellsml�1; S0 � 33.6 � 0.7 mg liter�1) (a) and Novosphingobium sp. KN65.2 with carbofuran (X0 � 7.0 � 104 � 6 � 103 cells ml�1; S0 � 45.1 � 0.5 mg liter�1) (b).Solid lines represent the average of three replicate experiments for cell growth (gray circles) and substrate utilization (black diamonds). The dashed lines are thenegative controls for no cells (black diamonds) and no substrate (gray circles). X0 is the initial cell density. S0 is the initial substrate concentrations.
Micropollutant Biodegradation at Low Concentrations
February 2014 Volume 80 Number 4 aem.asm.org 1309
on May 14, 2018 by guest
http://aem.asm
.org/D
ownloaded from
exception of those at initial cell densities of 103 and 104 cells ml�1
and initial substrate concentrations below 1 mg liter�1 and 0.1 mgliter�1, respectively, where we observed nearly no substrate utili-zation.
Incubation experiments for kinetic parameter estimation.Estimating parameters to describe Monod growth and substrateutilization kinetics from experimental data is problematic due tothe potential colinearity of �max and Ks (41). Other investigatorshave demonstrated that optimal experimental conditions can beestablished to limit the colinearity of �max and Ks, thus renderingthose parameters identifiable (42, 43). Optimal conditions arebased on ratios between the initial cell and substrate concentra-tions and the magnitude of �max and Ks. Because we had no apriori knowledge of the magnitude of �max and Ks, we designed aseries of independent incubation experiments to obtain an opti-mal data set for estimation of kinetic parameters. These experi-ments were conducted at an initial cell density of 105 cells ml�1
and at initial substrate concentrations between 1 and 50 mg liter�1
to obtain substrate utilization and microbial growth data encom-passing a wide range of ratios between initial cell densities andsubstrate concentrations. We then selected the experimental con-ditions that produced the lowest colinearity between �max and Ks
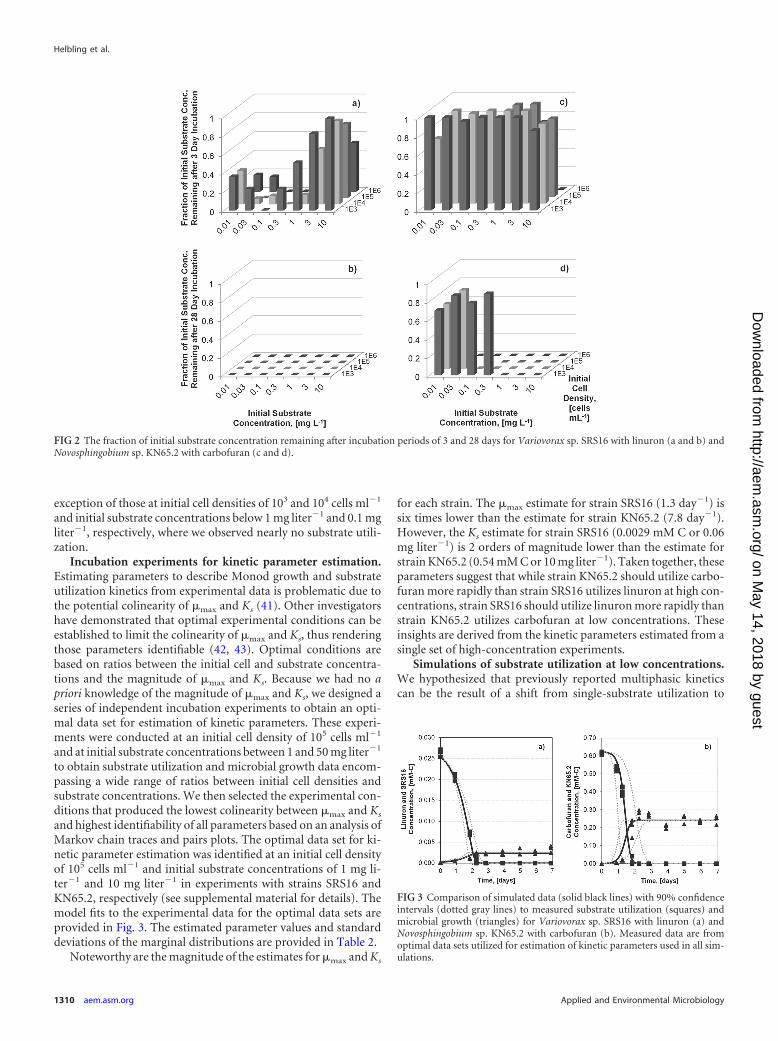
and highest identifiability of all parameters based on an analysis ofMarkov chain traces and pairs plots. The optimal data set for ki-netic parameter estimation was identified at an initial cell densityof 105 cells ml�1 and initial substrate concentrations of 1 mg li-ter�1 and 10 mg liter�1 in experiments with strains SRS16 andKN65.2, respectively (see supplemental material for details). Themodel fits to the experimental data for the optimal data sets areprovided in Fig. 3. The estimated parameter values and standarddeviations of the marginal distributions are provided in Table 2.
Noteworthy are the magnitude of the estimates for �max and Ks
for each strain. The �max estimate for strain SRS16 (1.3 day�1) issix times lower than the estimate for strain KN65.2 (7.8 day�1).However, the Ks estimate for strain SRS16 (0.0029 mM C or 0.06mg liter�1) is 2 orders of magnitude lower than the estimate forstrain KN65.2 (0.54 mM C or 10 mg liter�1). Taken together, theseparameters suggest that while strain KN65.2 should utilize carbo-furan more rapidly than strain SRS16 utilizes linuron at high con-centrations, strain SRS16 should utilize linuron more rapidly thanstrain KN65.2 utilizes carbofuran at low concentrations. Theseinsights are derived from the kinetic parameters estimated from asingle set of high-concentration experiments.
Simulations of substrate utilization at low concentrations.We hypothesized that previously reported multiphasic kineticscan be the result of a shift from single-substrate utilization to
FIG 2 The fraction of initial substrate concentration remaining after incubation periods of 3 and 28 days for Variovorax sp. SRS16 with linuron (a and b) andNovosphingobium sp. KN65.2 with carbofuran (c and d).
FIG 3 Comparison of simulated data (solid black lines) with 90% confidenceintervals (dotted gray lines) to measured substrate utilization (squares) andmicrobial growth (triangles) for Variovorax sp. SRS16 with linuron (a) andNovosphingobium sp. KN65.2 with carbofuran (b). Measured data are fromoptimal data sets utilized for estimation of kinetic parameters used in all sim-ulations.
Helbling et al.
1310 aem.asm.org Applied and Environmental Microbiology
on May 14, 2018 by guest
http://aem.asm
.org/D
ownloaded from

mixed-substrate utilization. Therefore, we expected that restrict-ing AOC in our experimental system would eliminate observedshifts in kinetics and enable extrapolation of kinetic parametersfrom high-concentration to low-concentration conditions. Totest this hypothesis, we used the kinetic parameters reported inTable 2 to simulate substrate utilization under the matrix of initialconditions investigated in the low-concentration incubation ex-periments. We then compared the measured and simulated datafor each set of initial conditions; fits of the raw data are presentedin Fig. S4 and S5 of the supplemental material. A plot of the sum ofthe squared error (SSE) of the residuals measured between mea-sured and simulated data are provided in Fig. 4 as a measure ofthe goodness of fit. All data are presented in Fig. S4 and S5 as thefraction of substrate remaining as a function of time so that themagnitude of the SSE can be compared across all experiments,regardless of initial substrate concentration.
Examination of Fig. S4 and S5 in the supplemental materialand of Fig. 4 reveals that the substrate utilization kinetics mea-sured at high concentrations predict substrate utilization at lowerinitial conditions well. In experiments with strain SRS16, rapidlinuron utilization resulted in a limited number of nonzero datapoints to compare with the simulated data (see Fig. S5). Neverthe-less, nearly all of the measured data (92%) fall within the 90%
confidence interval of the simulation, resulting in very low SSEvalues for the full matrix of initial conditions (Fig. 4a). In experi-ments with strain KN65.2, the bipartite behavior of observed sub-strate utilization shown in Fig. 2d was likewise predicted from theestimated substrate utilization kinetics; very slow utilization ofcarbofuran is predicted at cell inoculum concentrations of 103 and104 cells ml�1 and initial substrate concentrations below 1 mgliter�1 and 0.1 mg liter�1, respectively. This confirms that thebipartite behavior is solely a consequence of substrate utilizationkinetics and can be predicted with parameters estimated fromhigh-concentration experiments. In a few cases, measured carbo-furan utilization was more rapid than predicted, resulting inrather high SSE values and indicating a relatively poor perfor-mance of the model under these few sets of initial conditions. Inthese cases, the poor performance of the model was at the bound-ary of the observed bipartite behavior (Fig. 4b). Because the modelaccurately predicts the observed bipartite behavior of substrateutilization, we attribute these errors at the boundary to uncer-tainty in the estimated parameters, the magnitude of which deter-mines the predicted boundary of the bipartite behavior. Overall,77% of the measured data falls within the 90% confidence intervalof the simulation for strain KN65.2 utilizing carbofuran.
Our results demonstrate that parameters of substrate utiliza-tion kinetics estimated at high concentrations can accurately pre-dict substrate utilization at lower concentrations under AOC-re-stricted conditions. Multiphasic kinetics were not observed. Whileour data cannot disprove the existence of multiple, concentration-dependent uptake and transformation systems in bacteria thatlead to observed shifts in substrate kinetics at low concentrations,our data are consistent with our hypothesis that observed shifts inkinetics could be the result of shifts from single-substrate utiliza-tion to mixed-substrate utilization. Published data suggest thatshifts to mixed-substrate utilization can likewise result in shifts inkinetics (18–20, 44).
Estimation of theoretical and experimental molar yield. Wealso expected that restricting AOC in our experiments will enableaccurate and direct measurement of yield at environmentally rel-evant concentrations for the first time. We estimated numericyields from the high- and low-concentration incubation experi-ments (when final cell densities were significantly greater than initialcell densities) according to equation 4. Restricting the AOC in ourexperimental system enabled yield estimates for strains SRS16 andKN65.2 at initial substrate concentrations as low as 0.1 and 0.03 mg
TABLE 2 Estimated and measured parameters for each strain
Parameter namea
Value for the strain (substrate)
SRS16(linuron)
KN65.2(carbofuran)
Estimated kinetic parameters�max (day�1) 1.3 � 0.1 7.8 � 1.4Ks (mM C) 0.0029 � 0.001 0.54 � 0.2YC/C (mol of Ccells mol Csubstrate
�1) 0.08 � 0.01 0.39 � 0.01
XDW by substrate concentrationS0 � 50 mg liter�1 (10�13 g cell�1) 1.4 2.2S0 � 10 mg liter�1 (10�13 g cell�1) 1.0 1.6S0 � 1 mg liter�1 (10�13 g cell�1) 0.6 1.3
YC/C (mol of Ccells mol Csubstrate�1)
Theoretical 0.39 0.41Measured 0.06 � 0.01 0.42 � 0.07
a �max, the maximum specific growth rate; Ks, the half-saturation constant; YC/C, yield;XDW, dry weight of cells.
FIG 4 Sum of the squared error (SSE) for the fits of the kinetics model to the low-concentration incubation experiment data for Variovorax sp. SRS16 withlinuron (a) and Novosphingobium sp. KN65.2 with carbofuran (b).
Micropollutant Biodegradation at Low Concentrations
February 2014 Volume 80 Number 4 aem.asm.org 1311
on May 14, 2018 by guest
http://aem.asm
.org/D
ownloaded from

liter�1, respectively. Numeric yield over the full range of initial sub-strate concentrations is provided in Fig. 5. Numeric yield increased byapproximately 1 order of magnitude with decreasing initial substrateconcentrations for both strains. This increase in numeric yield, how-ever, could be explained by a corresponding decrease in stationary-phase cell size (XDW) with decreasing initial substrate concentrations;it has previously been demonstrated that cellular composition andcell size are directly related to growth rate and initial substrate con-centration (45). We confirmed the changes in cellular compositionand cell size by measuring the XDW of stationary-phase cells for strainsSRS16 and KN65.2 following growth in 50 mg liter�1, 10 mg liter�1,and 1 mg liter�1 of their respective pesticide substrates. Measuredvalues of XDW as a function of initial substrate concentration are re-ported in Table 2. Using these measured values of XDW, molar yieldwas calculated as described in Materials and Methods. Molar yieldover this range of substrate concentrations was found to be relativelyconstant and is reported in Table 2 as the average molar yield �standard deviation.
We also estimated the maximum theoretical molar yield of eachsubstrate by using the efficiency approach of McCarty (5, 32, 38, 39).In this approach, it is assumed that yield is primarily dependent onthe degree of reductance of the carbon source substrate, the Gibbsenergy of formation of the carbon source substrate, and the Gibbs freeenergy of the electron donor half-reaction. These parameters wereestimated for each substrate and are provided in Table 1 along withthe theoretical molar yield. The theoretical molar yield of growth oncarbofuran matches the measured molar yield for strain KN65.2.However, the theoretical molar yield of growth on linuron predictssignificantly more growth than was measured for strain SRS16. Thereare two likely explanations for this discrepancy. One is the formationof recalcitrant metabolites that limit the amount of carbon and en-ergy available for biomass formation though no recalcitrant metabo-lites were detected in acquired UV and MS chromatograms. Theother is an overestimation of the theoretical molar yield due to incor-rect assumptions for the magnitude of specific parameters (e.g., theefficiency constant) in the thermodynamic efficiency approach (31).More detailed analysis of the metabolite spectrum, biodegradationpathway, or biomass composition would be required to resolve thisdiscrepancy. Nevertheless, our data show that strains SRS16 andKN65.2 degrade their target pesticide substrates by means of growth-
linked processes even at low concentrations. The molar yields areconstant over large ranges of initial substrate concentrations; therewere no observed shifts to a nongrowth degradation regime.
Environmental relevance. It is clearly important to investigategrowth-linked biodegradation of trace pollutants at low, environ-mentally relevant concentrations. Substrate utilization kineticsand microbial growth yields are parameters of particular impor-tance if one wishes to model pollutant removal through natural orengineered remediation systems. However, previously reportedestimates of these parameters have limited utility because they aregenerally estimated in experimental systems that have not consid-ered the presence of contaminating AOC, which can have pro-found effects on observed substrate utilization kinetics andgrowth yields. The novel methodology presented in this workmakes estimates of these parameters under AOC-restricted con-ditions for the first time. The parameters estimated herein andpresented in Table 2 can be used to predict substrate utilizationand strain growth under a variety of scenarios.
We acknowledge that working under AOC-restricted condi-tions is a simplification of reality with respect to environmentalsystems. However, this simplification was required to isolate thespecific metabolic processes we aimed to measure and to improveour fundamental understanding of biodegradation processes atlow concentrations. Further, true models for the prediction ofsubstrate utilization under environmental conditions (i.e., lowsubstrate concentrations and in the presence of AOC and compet-ing microbial flora) should incorporate separate measures of sub-strate utilization kinetics on the target substrate (as presentedhere) and on environmental AOC at environmentally relevantconcentrations. Future work will focus on elucidating these effectsof mixed-substrate availability and competing microbial flora ontarget pesticide utilization, strain growth, and cellular yield.
ACKNOWLEDGMENTS
This work was funded by the EU-FP7 project titled Biotreat.We thank S. Sørensen (Department of Geochemistry, Geological Sur-
vey of Denmark and Greenland) and D. Springael (Department of Earthand Environmental Sciences, KU Leuven, The Netherlands) for providingus with three of the strains. We thank David R. Johnson for critical dis-cussions and for critically reading preliminary versions of the manuscript.
REFERENCES1. Benner J, Helbling DE, Kohler HPE, Wittebol J, Kaiser E, Prasse C,
Ternes TA, Albers CN, Aamand J, Horemans B, Springael D, WalravensE, Boon N. 2013. Is biological treatment a viable alternative for micropo-llutant removal in drinking water treatment processes? Water Res. 47:5955–5976. http://dx.doi.org/10.1016/j.watres.2013.07.015.
2. Fenner K, Canonica S, Wackett LP, Elsner M. 2013. Evaluating pesticidedegradation in the environment: blind spots and emerging opportunities.Science 341:752–758. http://dx.doi.org/10.1126/science.1236281.
3. Simonsen A, Badawi N, Anskjær GG, Albers CN, Sørensen SR, Sø-rensen J, Aamand J. 2012. Intermediate accumulation of metabolitesresults in a bottleneck for mineralisation of the herbicide metabolite 2,6-dichlorobenzamide (BAM) by Aminobacter spp. Appl. Microbiol. Bio-technol. 94:237–245. http://dx.doi.org/10.1007/s00253-011-3591-x.
4. Simonsen A, Holtze MS, Sørensen SR, Sørensen SJ, Aamand J. 2006.Mineralisation of 2,6-dichlorobenzamide (BAM) in dichlobenil-exposedsoils and isolation of a BAM-mineralising Aminobacter sp. Environ. Pol-lut. 144:289 –295. http://dx.doi.org/10.1016/j.envpol.2005.11.047.
5. Alexander M. 1981. Biodegradation of chemicals of environmental con-cern. Science 211:132–138. http://dx.doi.org/10.1126/science.7444456.
6. Kolpin DW, Barbash JE, Gilliom RJ. 1998. Occurrence of pesticides inshallow groundwater of the United States: initial results from the nationalwater-quality assessment program. Environ. Sci. Technol. 32:558 –566.http://dx.doi.org/10.1021/es970412g.
FIG 5 Numeric yield as a function of initial substrate concentration for strainsKN65.2 and SRS16.
Helbling et al.
1312 aem.asm.org Applied and Environmental Microbiology
on May 14, 2018 by guest
http://aem.asm
.org/D
ownloaded from

7. Lewis DL, Hodson RE, Freeman LF, III. 1985. Multiphasic kinetics fortransformation of methyl parathion by Flavobacterium species. Appl. En-viron. Microbiol. 50:553–557.
8. Rapp P. 2001. Multiphasic kinetics of transformation of 1,2,4-trichlorobenzene at nano- and micromolar concentrations by Burkhold-eria sp. strain PS14. Appl. Environ. Microbiol. 67:3496 –3500. http://dx.doi.org/10.1128/AEM.67.8.3496-3500.2001.
9. Toräng L, Nyholm N, Albrechtsen HJ. 2003. Shifts in biodegradationkinetics of the herbicides MCPP and 2,4-D at low concentrations in aer-obic aquifer materials. Environ. Sci. Technol. 37:3095–3103. http://dx.doi.org/10.1021/es026307a.
10. Tros ME, Schraa G, Zehnder AJB. 1996. Transformation of low concen-trations of 3-chlorobenzoate by Pseudomonas sp. strain B13: kinetics andresidual concentrations. Appl. Environ. Microbiol. 62:437– 442.
11. Boethling RS, Alexander M. 1979. Microbial degradation of organiccompounds at trace levels. Environ. Sci. Technol. 13:989 –991. http://dx.doi.org/10.1021/es60156a012.
12. Tarao M, Seto M. 2000. Estimation of the yield coefficient of Pseudomo-nas sp. strain DP-4 with a low substrate (2,4-dichlorophenol [DCP]) con-centration in a mineral medium from which uncharacterized organiccompounds were eliminated by a non-DCP-degrading organism. Appl.Environ. Microbiol. 66:566 –570. http://dx.doi.org/10.1128/AEM.66.2.566-570.2000.
13. Seto M, Alexander M. 1985. Effect of bacterial density and substrateconcentration on yield coefficients. Appl. Environ. Microbiol. 50:1132–1136.
14. Boethling RS, Alexander M. 1979. Effect of concentration of organicchemicals on their biodegradation by natural microbial communities.Appl. Environ. Microbiol. 37:1211–1216.
15. Hammes FA, Egli T. 2005. New method for assimilable organic carbondetermination using flow-cytometric enumeration and a natural micro-bial consortium as inoculum. Environ. Sci. Technol. 39:3289 –3294. http://dx.doi.org/10.1021/es048277c.
16. Sørensen SR, Holtze MS, Simonsen A, Aamand J. 2007. Degradationand mineralization of nanomolar concentrations of the herbicide dichlo-benil and its persistent metabolite 2,6-dichlorobenzamide by Aminobacterspp. isolated from dichlobenil-treated soils. Appl. Environ. Microbiol. 73:399 – 406. http://dx.doi.org/10.1128/AEM.01498-06.
17. Sørensen SR, Rasmussen J, Jacobsen CS, Jacobsen OS, Juhler RK,Aamand J. 2005. Elucidating the key member of a linuron-mineralizing bacterial community by PCR and reverse transcription-PCR denaturing gradient gel electrophoresis 16S rRNA gene finger-printing and cultivation. Appl. Environ. Microbiol. 71:4144 – 4148.http://dx.doi.org/10.1128/AEM.71.7.4144-4148.2005.
18. Schmidt SK, Alexander M. 1985. Effects of dissolved organic carbon andsecond substrates on the biodegradation of organic compounds at lowconcentrations. Appl. Environ. Microbiol. 49:822– 827.
19. Kovárová-Kovar K, Egli T. 1998. Growth kinetics of suspended microbialcells: from single-substrate-controlled growth to mixed-substrate kinet-ics. Microbiol. Mol. Biol. Rev. 62:646 – 666.
20. Lendenmann U, Snozzi M, Egli T. 1996. Kinetics of the simultaneousutilization of sugar mixtures by Escherichia coli in continuous culture.Appl. Environ. Microbiol. 62:1493–1499.
21. Aa K, Olsen RA. 1996. The use of various substrates and substrate con-centrations by a Hyphomicrobium sp. isolated from soil: effect on growthrate and growth yield. Microb. Ecol. 31:67–76.
22. Egli T. 2010. How to live at very low substrate concentration. Water Res.44:4826 – 4837. http://dx.doi.org/10.1016/j.watres.2010.07.023.
23. Sørensen SR, Aamand J. 2003. Rapid mineralisation of the herbicideisoproturon in soil from a previously treated Danish agricultural field. PestManag. Sci. 59:1118 –1124. http://dx.doi.org/10.1002/ps.739.
24. Vital M, Füchslin HP, Hammes F, Egli T. 2007. Growth of Vibriocholerae O1 Ogawa Eltor in freshwater. Microbiology 153:1993–2001.http://dx.doi.org/10.1099/mic.0.2006/005173-0.
25. Vital M, Hammes F, Egli T. 2012. Competition of Escherichia coli O157with a drinking water bacterial community at low nutrient concentra-tions. Water Res. 46:6279 – 6290. http://dx.doi.org/10.1016/j.watres.2012.08.043.
26. Hammes F, Berney M, Wang Y, Vital M, Köster O, Egli T. 2008.Flow-cytometric total bacterial cell counts as a descriptive microbiological
parameter for drinking water treatment processes. Water Res. 42:269 –277. http://dx.doi.org/10.1016/j.watres.2007.07.009.
27. Helbling DE, Hollender J, Kohler HPE, Singer H, Fenner K. 2010.High-throughput identification of microbial transformation products oforganic micropollutants. Environ. Sci. Technol. 44:6621– 6627. http://dx.doi.org/10.1021/es100970m.
28. Helbling DE, Hollender J, Kohler HPE, Fenner K. 2010. Structure-basedinterpretation of biotransformation pathways of amide-containing com-pounds in sludge-seeded bioreactors. Environ. Sci. Technol. 44:6628 –6635. http://dx.doi.org/10.1021/es101035b.
29. Monod J. 1949. The growth of bacterial cultures. Annu. Rev. Microbiol.3:371–394. http://dx.doi.org/10.1146/annurev.mi.03.100149.002103.
30. McCarty PL. 1965. Thermodynamics of biological synthesis and growth.Air Water Pollut. 9:621– 639.
31. McCarty PL. 2007. Thermodynamic electron equivalents model for bac-terial yield prediction: modifications and comparative evaluations. Bio-technol. Bioeng. 97:377–388. http://dx.doi.org/10.1002/bit.21250.
32. Rittmann BE, McCarty PL. 2001. Environmental biotechnology: princi-ples and applications. McGraw-Hill, New York, NY.
33. VanBriesen JM. 2001. Thermodynamic yield predictions for biodegrada-tion through oxygenase activation reactions. Biodegradation 12:265–281.http://dx.doi.org/10.1023/A:1013179315518.
34. R Development Core Team. 2013. R: a language and environment forstatistical computing. R Foundation for Statistical Computing, Vienna,Austria.
35. Soetaert K, Petzoldt T. 2010. Inverse modelling, sensitivity and MonteCarlo analysis in R using package FME. J. Stat. Softw. 33:1–28.
36. Haario H, Laine M, Mira A, Saksman E. 2006. DRAM: efficient adaptiveMCMC. Stat. Comput. 16:339 –354. http://dx.doi.org/10.1007/s11222-006-9438-0.
37. Christensen DR, McCarty PL. 1975. Multiprocess biological treatmentmodel. J. Water Pollut. Control Fed. 47:2652–2664.
38. Lawrence AW, McCarty PL. 1970. Unified basis for biological treatmentdesign and operation. J. Sanit. Eng. Div. 96:757–778.
39. McCarty PL. 1975. Stoichiometry of biological reactions. Prog. WaterTechnol. 7:157–172.
40. Sørensen SR, Simonsen A, Aamand J. 2009. Constitutive mineralizationof low concentrations of the herbicide linuron by a Variovorax sp. strain.FEMS Microbiol. Lett. 292:291–296. http://dx.doi.org/10.1111/j.1574-6968.2009.01501.x.
41. Robinson JA, Tiedje JM. 1983. Nonlinear estimation of monod growthkinetic parameters from a single substrate depletion curve. Appl. Environ.Microbiol. 45:1453–1458.
42. Cappuyns AM, Bernaerts K, Smets IY, Ona O, Prinsen E, VanderleydenJ, Van Impe JF. 2007. Optimal fed batch experiment design for estimationof monod kinetics of Azospirillum brasilense: from theory to practice. Bio-technol. Prog. 23:1074 –1081.
43. Liu C, Zachara JM. 2001. Uncertainties of Monod kinetic parametersnonlinearly estimated from batch experiments. Environ. Sci. Technol. 35:133–141. http://dx.doi.org/10.1021/es001261b.
44. Lendenmann U, Snozzi M, Egli T. 2000. Growth kinetics of Esche-richia coli with galactose and several other sugars in carbon-limited che-mostat culture. Can. J. Microbiol. 46:72– 80. http://dx.doi.org/10.1139/cjm-46-1-72.
45. Schaechter M, Maaloe O, Kjeldgaard NO. 1958. Dependency on me-dium and temperature of cell size and chemical composition during bal-anced growth of Salmonella typhimurium. J. Gen. Microbiol. 19:592– 606.http://dx.doi.org/10.1099/00221287-19-3-592.
46. U.S. Environmental Protection Agency. 2012. Estimation Programs In-terface (EPI) suite for Microsoft Windows, v4.11. United States Environ-mental Protection Agency, Washington, DC. http://www.epa.gov/oppt/exposure/pubs/episuite.htm.
47. Mavrovouniotis ML. 1990. Group contributions for estimating standardGibbs energies of formation of biochemical compounds in aqueous solu-tion. Biotechnol. Bioeng. 36:1070 –1082. http://dx.doi.org/10.1002/bit.260361013.
48. Tang A, Wang L, Zhou R. 2010. Gibbs energies of formation ofchlorinated benzoic acids and benzoates and application to their re-ductive dechlorination. Theochem 960:31–39. http://dx.doi.org/10.1016/j.theochem.2010.08.021.
Micropollutant Biodegradation at Low Concentrations
February 2014 Volume 80 Number 4 aem.asm.org 1313
on May 14, 2018 by guest
http://aem.asm
.org/D
ownloaded from