Kinetic study of self-assembly Ni(II)-doped TiO2 ...
8
Kinetic study of self-assembly Ni(II)-doped TiO2 nanocatalysts for the photodegradation of azo pollutants Journal: RSC Advances Manuscript ID RA-ART-08-2015-016172.R1 Article Type: Paper Date Submitted by the Author: 29-Sep-2015 Complete List of Authors: Chen, Chia-Yun; National Chi Nan University, Department of Applied Materials and Optoelectronic Engineering Hsu, Li-Jen; National Chi Nan University, Department of Applied Materials and Optoelectronic Engineering Subject area & keyword: RSC Advances
Transcript of Kinetic study of self-assembly Ni(II)-doped TiO2 ...

Kinetic study of self-assembly Ni(II)-doped TiO2 nanocatalysts for the photodegradation of azo pollutants
Journal: RSC Advances
Manuscript ID RA-ART-08-2015-016172.R1
Article Type: Paper
Date Submitted by the Author: 29-Sep-2015
Complete List of Authors: Chen, Chia-Yun; National Chi Nan University, Department of Applied Materials and Optoelectronic Engineering Hsu, Li-Jen; National Chi Nan University, Department of Applied Materials and Optoelectronic Engineering
Subject area & keyword:
RSC Advances

Journal Name
ARTICLE
This journal is © The Royal Society of Chemistry 20xx J. Name., 2013, 00, 1-3 | 1
Please do not adjust margins
Please do not adjust margins
Received 00th January 20xx,
Accepted 00th January 20xx
DOI: 10.1039/x0xx00000x
www.rsc.org/
Kinetic study of self-assembly Ni(II)-doped TiO2 nanocatalysts for
the photodegradation of azo pollutants
Chia-Yun Chen* and Li-Jen Hsu
Ni(II)-doped TiO2 nanoparticles were fabricated by a simple and reliable hydrothermal method. Morphology,
crystallographic structure and light-absorption property of the formed photocatalysts were characterized. In addition,
both the adsorption phenomena and photodegradation of two types of azo dyes in the presence of Ni(II)-doped TiO2 were
investigated. The experimental results showed that the dye adsorption follows the Langmuir adsorption pathway, and the
dye degradation was significantly enhanced by doping of Ni ions into TiO2 photocatalysts. The optimal doping of Ni ions for
the removal of RB5 and 3R dyes was found to be 1 %, giving the degradation efficiency of 3 times for RB5 dyes and 3.5
times for 3R dyes higher than those of un-doped TiO2. Furthermore, the underlying kinetic mechanism was systematically
studied, in which the second-order kinetic model was found to be the explicit mechanism for dye degradation on TiO2 with
Ni(II) doping.
Introduction
Azo dyes, primarily from the effluent discharge of textile
industry, are regarded as one of the most hazardous sources of
environmental contamination.1 Unfortunately, these noxious
materials released with water effluents, are remarkably stable
and non-biodegradable.1,2 Therefore, once they are discharged
inappropriately or under careless effluent treatments, the
resulting wastewater may cause serious destruction to the
living environment. Apart from that, the by-products are often
toxic, mutagenic, and carcinogenic, which are harmful to
aquatic animals, microorganisms, human beings and even to
the entire ecosystem.3 It is therefore essential to well treat
these effluents prior to discharging them into various water
bodies. During the last decade, Titanium dioxide (TiO2) has
been widely investigated for the efficient degradation of such
water pollutants, mainly because of their excellent
photocatalytic activity, low production cost, non-toxicity and
robust chemical stability.4
To further improve their performances on dye degradation,
recent studies are extensively focused on the incorporation of
metal ions with TiO2 photocatalysts,5-7 or the formation of
heterostructured photocatalysts,8, 9 the promising pathways
for both giving the visible-light photocatalytic response and
enhancing the effective charge transfer of photo-generated
carriers upon photocatalysis process. So far, many methods
have been made to prepare metal-ion doped TiO2, such as sol-
gel process,10 ion impregnation11 and hydrothermal method12
and others. Nevertheless, the low photocatalytic efficiency of
doped TiO2 catalysts prepared with sol-gel method was usually
encountered, mainly resulting from the uneven formation or
segregation of metal ions on TiO2 lattices. On the other hand,
ion impregnation method also suffered the non-uniform
doping process since substitution of metal ions preferentially
occurs at TiO2 surfaces instead of entire TiO2 crystals. Among
them, hydrothermal method seems to be a prevailing process
for the preparation of uniform doped TiO2 with various metal
ions involved, including Ag+,13 Cd2+,14 Mn2+ and Fe3+.15,16
However, there have been relatively few studies reported for
the Ni-ion doped TiO2 catalysts, while their photocatalytic
activity is believed to be improved substantially once the
optimal incorporation of Ni ions with TiO2 matrix was
achieved. 17 In particular, the lack of systematic investigations
on Ni2+-doped TiO2 also impedes their practical applications for
the removal of dye pollutants. Therefore, in this study, we
explored the synthesis, characterization, and photocatalytic
activity of TiO2 with various contents of doped Ni2+ ions,
prepared using an inexpensive, facile and reliable
hydrothermal method. Two dominant azo dyes in wastewater
from textile effluents, including Remazol Black 5 (RB5) and
Remazol Brilliant Orange 3R (3R) dyes, were the targets for
evaluating the photocatalytic performance of Ni2+-doped TiO2.
Furthermore, extensive investigations of dominant factors
effecting on the recycling utilization of these catalyst materials
for the dye removal were also performed.
Experimental
Synthesis of Ni2+
-doped TiO2
Page 1 of 7 RSC Advances

ARTICLE Journal Name
2 | J. Name., 2012, 00, 1-3 This journal is © The Royal Society of Chemistry 20xx
Please do not adjust margins
Please do not adjust margins
In a hydrothermal process, 0.01 mol of titanium(IV)
isopropoxide was first dissolved in absolute ethanol (10 ml).
Next, 0.01 mol of 1-Tetradecylamine and three various amount
of NiSO4 were added and gently stirred at 50°C for 10 min.
Subsequently, the mixed solution was slowly dropped into 100
ml of distilled water under mechanical stirring with speed of
400 rpm and white TiO2-based precipitates were grown
hydrothermally. The mixtures were then stirred with
mechanical stirring (800 rpm) for 1 h and followed by aging
process at room temperature for 2 d in the dark. After cooling
down, the mixtures were filtrated and rinsed with deionized
(DI) water several times. Finally, the crystallization of Ni-doped
TiO2 was achieved by annealing process at 450 °C for 3 h. Here,
three types of doped TiO2 photocatalysts, including 0.5%, 1%
and 5%-Ni2+ doped TiO2,were prepared, respectively, where
the contents of Ni ions were determined by the relative molar
ratio (ρ) as bellow, ρ= nNi/(nNi+nTi))x100%.
Characterizations
The crystalline structures of photocatalysts were characterized
by a Rigaku Multiflex X-ray diffractometer using Cu-Kα
radiation (λ = 1.5406 Å, 40 kV, and 40 mA). The morphologies
and chemical compositions were investigated using scanning
electron microscopy (SEM, Hitachi JSM-6390) and energy-
dispersive X-ray (EDX) spectrometer (Oxford INCA 350),
respectively. Prior to performing SEM observations, a thin
layer of Au was deposited on sample surfaces to improving the
imaging process. The absorption spectra of the photocatalysts
were measured with a Jasco V-570 UV/VIS/NIR
spectrophotometer equipped with an integrating sphere.
Adsorption isotherms of azo dyes
The adsorption equilibrium experiment was conducted by
dispersing 10 mg of Ni2+-doped TiO2 nanoparticles into 10 ml
DI water with various concentrations (0.05-0.40 mM) of target
dyes. In each test, the pH value of mixed solution was
controlled to be 2.0, and then stirred in the dark for 5 h at 30
°C. After that, the concentrations of dyes at each time interval
were determined by the intensity of absorption peak at 597
nm (RB5 dye) and 494 nm (3R dye), respectively, using a
UV/visible spectrophotometer (Shimadzu UV-2401 PC). The
amount of adsorption (Q, mmol/g) was calculated by the
equation as below,
Q = (Ci-Ct)V/W (1)
where Ci and Ct represent the concentration of dyes measured
at initial (t= 0) and certain reaction time (t= t). V is denoted as
the volume of dye solution, and W is the weight of the
photocatalysts.
Photocatalytic measurements
Evaluation of pohotcatalytic activity of Ni2+-doped TiO2
nanoparticles was conducted using a PanChum multilamp
photoreactor (PR-2000) with switchable light sources. In each
test, 10 mg of Ni2+-doped TiO2 photocatalysts were dispersed
in 10 ml aqueous solution containing 0.2 mM of tested dyes in
a 20 ml cylindrical quartz tube. The suspension was
magnetically stirred in the dark for 1 hr before the light
irradiation to establish the adsorption equilibrium. The
photoreactor utilized in the photocatalytic experiments
consists of eight sets of low-pressure quartz mercury lamps
with monochromatic wavelengths of 254 nm, 306 nm, 365 nm
and 580 nm, respectively. After the photocatalytic
experiments, an aliquot of the solution (0.1 ml) at given time
intervals (10min) was withdrawn from the reactor and diluted
with 5 ml distilled water. The aqueous mixture was then
analyzed using UV/visible spectrophotometer (Shimadzu UV-
2401 PC). In general, the dye concentration was evaluated at
wavelength of 597 nm for RB5 dye and at wavelength of 494
nm for 3R dyes, corresponding to the maximum absorption
wavelength of RB5 and 3R dyes, respectively.
Results and discussion
Morphology, crystalline structure and optical property of
Ni2+
-doped TiO2
Fig. 1 presents the schematic illustration of process flow for
the formation of Ni2+-doped TiO2 photocatalysts. Specifically,
the hydrothermal process involves with four dominant steps:
(i) Substitution of 1-Tetradecylamine and titanium(IV)
isopropoxide; (ii) Hydrolysis reaction and followed by
condensation process; (iii) Incorporations of Ni ions with TiO2
lattice; (iv) Crystallization process through calcination of the
samples. To characterize the as-prepared photocatalysts,
morphology, crystallographic structure and light-absorption
property were investigated. First, the morphologies of as-
prepared Ni2+-doped TiO2 were examined through SEM
observations, as shown in Fig. 2. All three synthesized Ni2+-
doped TiO2, including 0.5%, 1% and 5% of Ni2+ doping, exhibit
the sphere shapes with consistent distributions of diameter
ranging from 200 to 400 nm. Notice that these round
morphologies of formed nanoparticles are driven by the well
incorporation of Ni ions with TiO2 crystalline matrix [Fig. 1]. In
fact, the uniform sphere-like nanoparticles can be only formed
by the optimal introduction of 1-Tetradecylamine as
surfactants during the hydrothermal process, whereas the
insufficient amount of surfactants added to the reaction leads
to the formation of arbitrary shape of TiO2-based
nanoparticles.
Fig. 1 Schematic illustrations of the procedures for the
synthesis of Ni2+-doped TiO2 photocatalysts using a simple
hydrothermal method.
On the other hand, while the shapes of doped TiO2 are
maintained, the surfaces of formed nanoparticles turn to be
Page 2 of 7RSC Advances

Journal Name ARTICLE
This journal is © The Royal Society of Chemistry 20xx J. Name., 2013, 00, 1-3 | 3
Please do not adjust margins
Please do not adjust margins
rougher as the amount of introduced Ni ions increases, as
shown in Figs. 2(a)-(c). These findings can be attributed to the
incomplete hydrolysis and condensation process with Ni ions
and TiO2 lattice due to the excess amount of Ni ions involved.
This is particularly apparent in the case of 5%-Ni2+ doped TiO2,
as shown in Fig. 2(c). In addition, the chemical composition of
Ni ions in doped TiO2 nanoparticles was also evaluated using
EDS analysis, where the contents of Ni2+ doping, including 0.41
% (Fig. 2(a)), 0.89 % (Fig. 2(b)) and 5.35 % (Fig. 2(c)), match
well with the designed values, 0.5 %, 1 % and 5 % of Ni2+
doping, respectively. Next, the crystalline phases of Ni2+-doped
samples, along with non-doped TiO2, referred as pure TiO2,
were characterized with XRD analysis, as shown in Fig. 3(a).
The similar diffraction patterns and corresponded crystal
planes in these four cases can be observed, showing that the
perfect anatase crystallographic phases are preserved
regardless of the contents of Ni2+ doping. Fig. 3(b) further
demonstrates the absorption characteristics of these four
samples. Compared with pure TiO2 which can only absorb light
within UV region, the absorption edges of three Ni2+-doped
TiO2 are extended toward near-IR region. In fact, the
absorption bands are gradually enlarged with edge of 410 nm
for 0.5% doping and 450 nm for 1% doping (insert of Fig. 3(b)),
but substantially extended over 1400 nm for 5% doping, as
shown in Fig. 3(b). The band gap energies of pure TiO2, 0.5%
Ni2+-doped TiO2 and 1% Ni2+-doped TiO2 are found to be 3.32
eV, 3.26 eV and 3.20 eV, respectively. Notice that the
significant extension of absorption range in 5%-doped TiO2
may be attributed to the occurrence of excess Ni ions or Ni
clusters mixed with doped TiO2, which therefore degrades
their photocatalyitc activity. These issues will be further
discussed later.
Fig. 2 Representative SEM images and corresponding EDS
analysis of Ni2+-doped TiO2 with doping concentration of (a)
0.5%-Ni2+, (b) 1%-Ni2+ and (c) 5%-Ni2+. The EDS results
confirmed that the Ni compositions of synthesized TiO2
nanoparticles are well corresponded to the concentrations of
Ni precursors used for catalyst preparation.
Fig. 3 (a) XRD patterns of four various TiO2-based
photocatalysts. (b) UV/Vis absorption spectra of non-doped
TiO2, 0.5%-Ni2+ doped TiO2, 1%-Ni2+ doped TiO2 and 5%-Ni2+
doped TiO2, respectively.
Adsorption phenomena of dyes
Prior to testing the photocatalytic performance of prepared
Ni2+-doped TiO2, it is pivotal to unveil the adsorption
phenomena of dyes on the tested photocatalysts. To perform
these experiments, two dominant and intensively used azo
dyes, RB5 and 3R, were separately tested. The resulting
adsorption isotherms, in terms of Ce versus Qe are presented in
Fig. 4(a), where Ce and Qe represent the equilibrium
concentration of dyes and equilibrium adsorption capacity of
dyes, respectively. To further model the adsorption behaviors
of these two kinds of dyes on Ni2+-doped TiO2, we extracted
the measured data from Fig. 4(a) and re-plotted them with the
relationship of Ce and Ce/Qe, as presented in Fig. 4(b). Here,
Langmuir isotherm model was employed for describing the dye
adsorption on the Ni2+-doped TiO2, represented as below, 18,19
Ce/Qe = Ce/Qm + 1/(Qm KL) (2)
where Qm is the maximum adsorption capacity of dyes. KL
represents the Langmuir adsorption equilibrium constant. As
evidenced in Fig. 4(b), the clear linear fittings with correlation
coefficient (R2) in both RB5 (R2= 0.99) and 3R dyes (R2= 0.99)
Page 3 of 7 RSC Advances
ARTICLE Journal Name
4 | J. Name., 2012, 00, 1-3 This journal is © The Royal Society of Chemistry 20xx
Please do not adjust margins
Please do not adjust margins
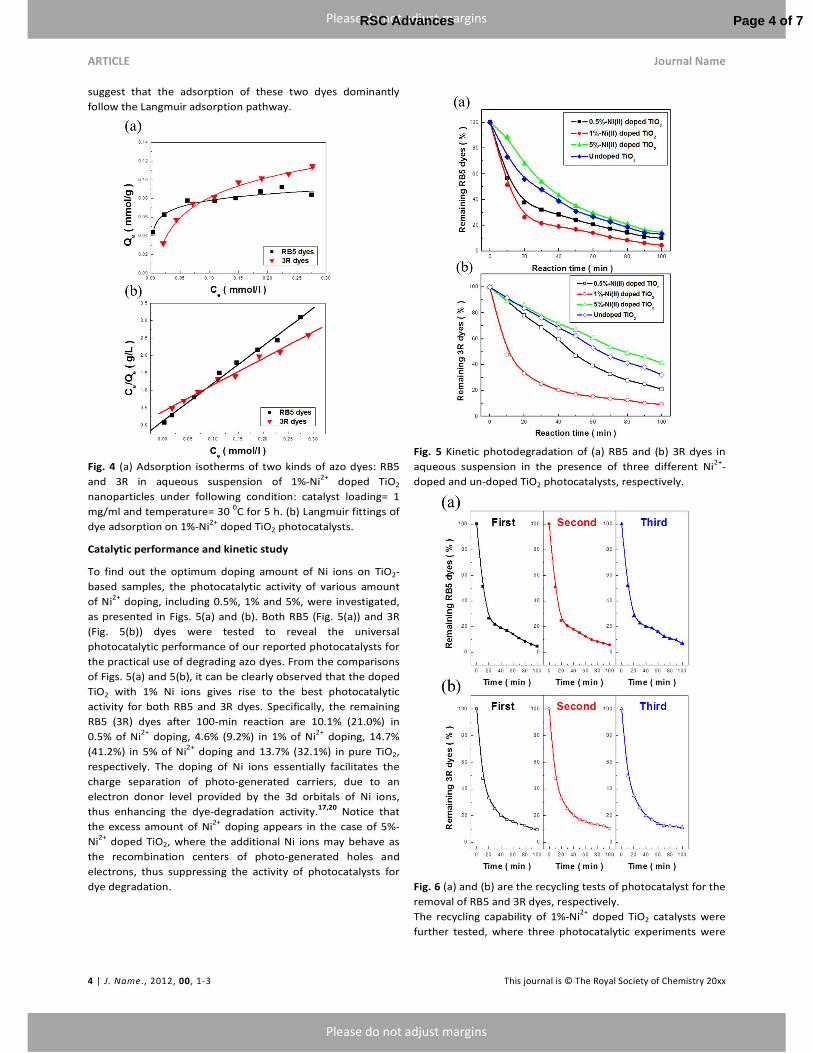
suggest that the adsorption of these two dyes dominantly
follow the Langmuir adsorption pathway.
Fig. 4 (a) Adsorption isotherms of two kinds of azo dyes: RB5
and 3R in aqueous suspension of 1%-Ni2+ doped TiO2
nanoparticles under following condition: catalyst loading= 1
mg/ml and temperature= 30 0C for 5 h. (b) Langmuir fittings of
dye adsorption on 1%-Ni2+ doped TiO2 photocatalysts.
Catalytic performance and kinetic study
To find out the optimum doping amount of Ni ions on TiO2-
based samples, the photocatalytic activity of various amount
of Ni2+ doping, including 0.5%, 1% and 5%, were investigated,
as presented in Figs. 5(a) and (b). Both RB5 (Fig. 5(a)) and 3R
(Fig. 5(b)) dyes were tested to reveal the universal
photocatalytic performance of our reported photocatalysts for
the practical use of degrading azo dyes. From the comparisons
of Figs. 5(a) and 5(b), it can be clearly observed that the doped
TiO2 with 1% Ni ions gives rise to the best photocatalytic
activity for both RB5 and 3R dyes. Specifically, the remaining
RB5 (3R) dyes after 100-min reaction are 10.1% (21.0%) in
0.5% of Ni2+ doping, 4.6% (9.2%) in 1% of Ni2+ doping, 14.7%
(41.2%) in 5% of Ni2+ doping and 13.7% (32.1%) in pure TiO2,
respectively. The doping of Ni ions essentially facilitates the
charge separation of photo-generated carriers, due to an
electron donor level provided by the 3d orbitals of Ni ions,
thus enhancing the dye-degradation activity.17,20 Notice that
the excess amount of Ni2+ doping appears in the case of 5%-
Ni2+ doped TiO2, where the additional Ni ions may behave as
the recombination centers of photo-generated holes and
electrons, thus suppressing the activity of photocatalysts for
dye degradation.
Fig. 5 Kinetic photodegradation of (a) RB5 and (b) 3R dyes in
aqueous suspension in the presence of three different Ni2+-
doped and un-doped TiO2 photocatalysts, respectively.
Fig. 6 (a) and (b) are the recycling tests of photocatalyst for the
removal of RB5 and 3R dyes, respectively.
The recycling capability of 1%-Ni2+ doped TiO2 catalysts were
further tested, where three photocatalytic experiments were
Page 4 of 7RSC Advances
Journal Name ARTICLE
This journal is © The Royal Society of Chemistry 20xx J. Name., 2013, 00, 1-3 | 5
Please do not adjust margins
Please do not adjust margins
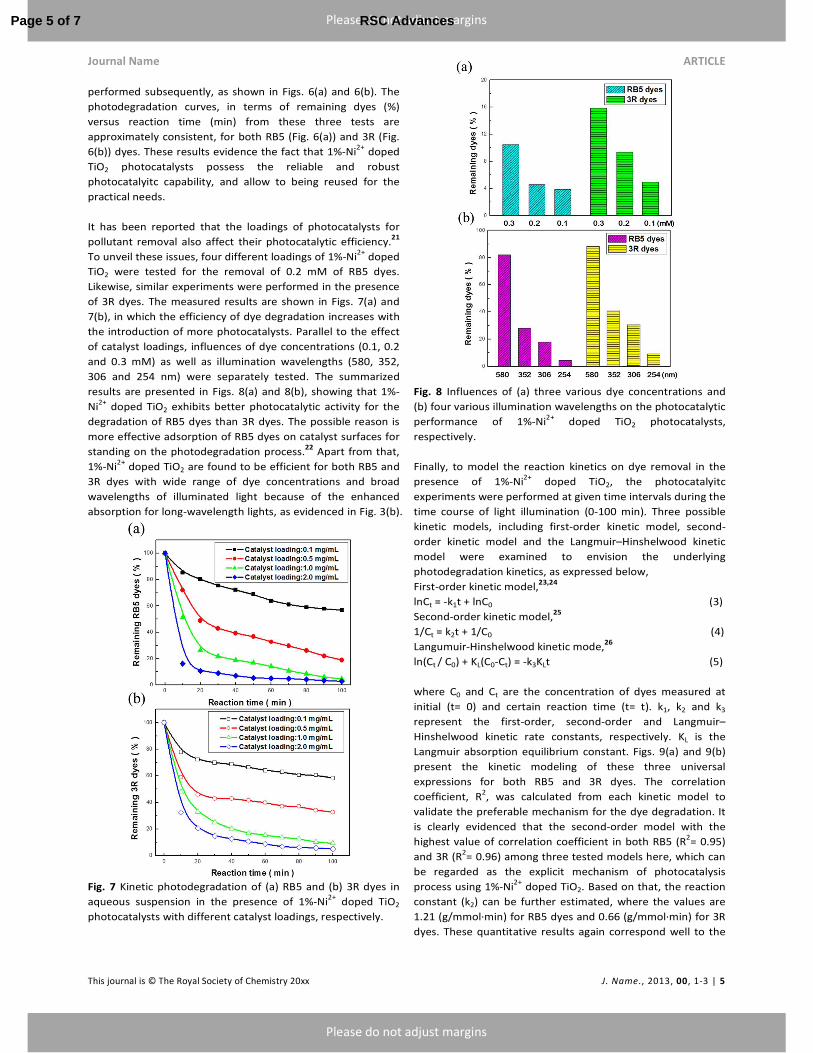
performed subsequently, as shown in Figs. 6(a) and 6(b). The
photodegradation curves, in terms of remaining dyes (%)
versus reaction time (min) from these three tests are
approximately consistent, for both RB5 (Fig. 6(a)) and 3R (Fig.
6(b)) dyes. These results evidence the fact that 1%-Ni2+ doped
TiO2 photocatalysts possess the reliable and robust
photocatalyitc capability, and allow to being reused for the
practical needs.
It has been reported that the loadings of photocatalysts for
pollutant removal also affect their photocatalytic efficiency.21
To unveil these issues, four different loadings of 1%-Ni2+ doped
TiO2 were tested for the removal of 0.2 mM of RB5 dyes.
Likewise, similar experiments were performed in the presence
of 3R dyes. The measured results are shown in Figs. 7(a) and
7(b), in which the efficiency of dye degradation increases with
the introduction of more photocatalysts. Parallel to the effect
of catalyst loadings, influences of dye concentrations (0.1, 0.2
and 0.3 mM) as well as illumination wavelengths (580, 352,
306 and 254 nm) were separately tested. The summarized
results are presented in Figs. 8(a) and 8(b), showing that 1%-
Ni2+ doped TiO2 exhibits better photocatalytic activity for the
degradation of RB5 dyes than 3R dyes. The possible reason is
more effective adsorption of RB5 dyes on catalyst surfaces for
standing on the photodegradation process.22 Apart from that,
1%-Ni2+ doped TiO2 are found to be efficient for both RB5 and
3R dyes with wide range of dye concentrations and broad
wavelengths of illuminated light because of the enhanced
absorption for long-wavelength lights, as evidenced in Fig. 3(b).
Fig. 7 Kinetic photodegradation of (a) RB5 and (b) 3R dyes in
aqueous suspension in the presence of 1%-Ni2+ doped TiO2
photocatalysts with different catalyst loadings, respectively.
Fig. 8 Influences of (a) three various dye concentrations and
(b) four various illumination wavelengths on the photocatalytic
performance of 1%-Ni2+ doped TiO2 photocatalysts,
respectively.
Finally, to model the reaction kinetics on dye removal in the
presence of 1%-Ni2+ doped TiO2, the photocatalyitc
experiments were performed at given time intervals during the
time course of light illumination (0-100 min). Three possible
kinetic models, including first-order kinetic model, second-
order kinetic model and the Langmuir–Hinshelwood kinetic
model were examined to envision the underlying
photodegradation kinetics, as expressed below,
First-order kinetic model,23,24
lnCt = -k1t + lnC0 (3)
Second-order kinetic model,25
1/Ct = k2t + 1/C0 (4)
Langumuir-Hinshelwood kinetic mode,26
ln(Ct / C0) + KL(C0-Ct) = -k3KLt (5)
where C0 and Ct are the concentration of dyes measured at
initial (t= 0) and certain reaction time (t= t). k1, k2 and k3
represent the first-order, second-order and Langmuir–
Hinshelwood kinetic rate constants, respectively. KL is the
Langmuir absorption equilibrium constant. Figs. 9(a) and 9(b)
present the kinetic modeling of these three universal
expressions for both RB5 and 3R dyes. The correlation
coefficient, R2, was calculated from each kinetic model to
validate the preferable mechanism for the dye degradation. It
is clearly evidenced that the second-order model with the
highest value of correlation coefficient in both RB5 (R2= 0.95)
and 3R (R2= 0.96) among three tested models here, which can
be regarded as the explicit mechanism of photocatalysis
process using 1%-Ni2+ doped TiO2. Based on that, the reaction
constant (k2) can be further estimated, where the values are
1.21 (g/mmol∙min) for RB5 dyes and 0.66 (g/mmol∙min) for 3R
dyes. These quantitative results again correspond well to the
Page 5 of 7 RSC Advances

ARTICLE Journal Name
6 | J. Name., 2012, 00, 1-3 This journal is © The Royal Society of Chemistry 20xx
Please do not adjust margins
Please do not adjust margins
experimental data shown in Figs. 5 and 7, indicating that the
degradation of RB5 dyes are kinetically favorable than that of
3R in the presence of 1%-Ni2+ doped TiO2.
Fig. 9 Kinetic modeling of photocatalytic process on the
degradation of (a) RB5 and (b) 3R dyes using 1%-Ni2+ doped
TiO2 photocatalysts.
Conclusionss
In conclusion, a simple and reliable hydrothermal method was
reported to synthesize the Ni2+-doped TiO2. We explored the
synthesis, characterization, adsorption behavior and
photocatalytic activity of doped TiO2 with various contents of
doped Ni2+ ions. It is found that 1%-Ni2+ doped TiO2 possess
the degradation efficiency of 3 times for RB5 dyes and 3.5
times for 3R dyes higher than those of un-doped TiO2.
Furthermore, systematic investigations of several factors,
including catalyst loadings, dye concentrations and
illumination wavelengths were conducted, indicating the fact
that the 1%-Ni2+ doped TiO2 benefit both the superior
photocatalyitc performance and robust recycling capability,
and allow to being reused for the practical needs.
Acknowledgements
This study was financially supported by Ministry of Science and
Technology of Taiwan under Contracts No. MOST 104-2628-E-
260-001-MY2 and No. MOST 104-2623-E-260-001-D.
Notes and references
1 E. Forgacs, T. Cserhati and G. Oros, Environ. Int., 2004, 30, 953.
2 G. de Aragao Umbuzeiro, H. S. Freeman, S. H. Warren, D. P. de Oliveira, Y. Terao, T. Watanabe and L. D. Claxton, Chemosphere, 2005, 60, 55.
3 I. K. Konstantinou and T. A. Albanis, Appl. Catal. B, 2004, 49, 1.
4 A. Fujishima and K. Honda, Nature, 1972, 238, 37. 5 M. A. Rauf, M. A. Meetani and S. Hisaindee, Desalination,
2011, 276, 13. 6 K. Wilke and H. D. Breuer, J. Photochem. Photobiol. A, 1999,
121, 49. 7 V. Subramanian, E. E. Wolf and P. V. Kamat, Langmuir, 2003,
19, 469. 8 X. Xiang, L. Xie, Z. Li and F. Li, Chem. Eng. J., 2013, 221, 222. 9 W. He, Y. Yang, L. Wang, J. Yang, X. Xiang, D. Yan and F. Li,
ChemSusChem, 2015, 8, 1568. 10 Y. Zhu, L. Zhang, C. Gao, L. Cao, J. Mater. Sci., 2000, 35, 4049. 11 R. J. Tayade, R. G. Kulkarni and R. V. Jasra, Ind. Eng. Chem.
Res., 2006, 45, 5231. 12 E. Hosono, S. Fujihara, K. Kakiuchi and H. Imai, J. Am. Chem.
Soc., 2004, 126, 7790. 13 Y. Li, M. Ma, W. Chen, L. Li and M. Zen, Mater. Chem. Phys.,
2011, 129, 501. 14 L. Andronic, A. Enesca, C. Vladuta and A. Duta, Chem. Eng. J.,
2009, 152, 64. 15 L. G. Devi, N. Kottam, B. N. Murthy and S. G. Kumar, J. Mol.
Catal., 2010, A328, 44. 16 Z. Ambrus, N. Balazs, T. Alapi, G. Wittmann and P. Sipos,
Appl. Catal. B, 2008, 81, 27. 17 Z. Zou, J. Ye, K. Sayama and H. Arakawa, Nature, 2001, 414,
625. 18 I. Langumuir, J. Am. Chem. Soc., 1918, 40, 1361. 19 K. Y. Foo and B. H. Hameed, Chem. Eng. J., 2010, 156, 2. 20 J. Choi, H. Park and M.R. Hoffmann, J. Mater. Res., 2010,
25,149. 21 R. L. Narayana, M. Matheswaran, A. A. Aziz and P. Saravanan,
Desalination, 2011, 269, 249. 22 E. Forgacs, T. Cserhatia and G. Oros, Environ. Int., 2004, 30,
953. 23 S. H. Kim, H. H. Ngo, H. K. Shon and S. Vigneswaran, Sep.
Purif. Technol., 2008, 58, 335. 24 C. Y. Chen and Y. R. Liu, Sci. Adv. Mater., 2015, 7, 1053. 25 K. V. Kumara, K. Porkodib and A. Selvaganapathi, Dyes
Pigments, 2007, 75, 246. 26 J. M. Kesselman, N. S. Lewis and M. R. Hoffmann, Environ.
Sci. Technol., 1997, 31, 2298.
Page 6 of 7RSC Advances

Graphical abstract
Kinetic study of self-assembly Ni(II)-doped TiO2 nanocatalysts for the
photodegradation of azo pollutants
Chia-Yun Chen* and Li-Jen Hsu
Department of Applied Materials and Optoelectronic Engineering, National Chi Nan
University, Nantou 545, Taiwan
Page 7 of 7 RSC Advances