Kimberly A. Klock • ppl o - Pennsylvania · Kimberly A. Klock • Senior Counsel Two North Ninth...
35
» 1 1 1 * v 0 0 o * .000, Kimberly A. Klock • Senior Counsel Two North Ninth Street Allentown, PA 16101-1179 Tel. 610.774.5696 Fax 610.774.6726 KKIock@pplweb. com ppl o 0 * PPL • • O • • - April 15,2016 FEDERAL EXPRESS RECEIVED Rosemary Chiavetta, Secretary Pennsylvania Public Utility Commission Commonwealth Keystone Building APR 1 6 2016 400 North Street Harrisburg, Pennsylvania 17120 PA PUBLIC UTILITY COMMISSION b J SECRETARY'S BUREAU Re: Quarterly Process Evaluation Report for the Period December 2015 through February 2016, Program Year Seven (7), Quarter Three (3) of PPL Electric Utilities Corporation's Act 129 Plan Docket No. M-2012-2334388 Dear Ms. Chiavetta: Enclosed on behalf of PPL Electric Utilities Corporation ("PPL Electric") is the Quarterly Process Evaluation Report for Program Year Seven (7), Quarter Three (3) of PPL Electric's Act 129 Plan. Pursuant to 52 Pa. Code § 1.11, the enclosed document is to be deemed filed on April 15, 2016, which is the date it was deposited with an overnight express delivery service as shown on the delivery receipt attached to the mailing envelope. In addition, please date and time-stamp the enclosed extra copy of this letter and return it to me in the envelope provided. Respectfully submitted, Kimberly A. Enclosure cc: Richard F. Spellman (GDS Associates, Inc. Act 129 Statewide Evaluator Kimberly A. KlocR
Transcript of Kimberly A. Klock • ppl o - Pennsylvania · Kimberly A. Klock • Senior Counsel Two North Ninth...
» 1 1 1 * v 0 0 o *
. 0 0 0 ,
Kimberly A. Klock • Senior Counsel
Two North Ninth Street Allentown, PA 16101-1179
Tel. 610.774.5696 Fax 610.774.6726 KKIock@pplweb. com
ppl o 0 * PPL • • O
• • -
April 15,2016
FEDERAL EXPRESS
RECEIVED Rosemary Chiavetta, Secretary Pennsylvania Public Utility Commission Commonwealth Keystone Building APR 1 6 2016 400 North Street Harrisburg, Pennsylvania 17120 PA PUBLIC UTILITY COMMISSION
b J SECRETARY'S BUREAU
Re: Quarterly Process Evaluation Report for the Period December 2015 through February 2016, Program Year Seven (7), Quarter Three (3) of PPL Electric Utilities Corporation's Act 129 Plan Docket No. M-2012-2334388
Dear Ms. Chiavetta:
Enclosed on behalf of PPL Electric Utilities Corporation ("PPL Electric") is the Quarterly Process Evaluation Report for Program Year Seven (7), Quarter Three (3) of PPL Electric's Act 129 Plan.
Pursuant to 52 Pa. Code § 1.11, the enclosed document is to be deemed filed on April 15, 2016, which is the date it was deposited with an overnight express delivery service as shown on the delivery receipt attached to the mailing envelope.
In addition, please date and time-stamp the enclosed extra copy of this letter and return it to me in the envelope provided.
Respectfully submitted,
Kimberly A.
Enclosure
cc: Richard F. Spellman (GDS Associates, Inc. Act 129 Statewide Evaluator
Kimberly A. KlocR

Quarterly Report to the Pennsylvania Public Utility Commission
For the Period December 2015 through February 2016
Program Year 7, Quarter 3
RECEIVED APR 1 5 2016
PA PUBUC UTILITY COMMISSION SECRETARY'S BUREAU
For Pennsylvania Act 129 of 2008
Energy Efficiency and Conservation Plan
Prepared by The Cadmus Group, Inc.
For
PPL Electric
April 15,2016

April 15, 2016 | Quarterly Report to the PA PUC - Program Year 7 Quarter 3
Table of Contents TABLE OF CONTENTS I
ACRONYMS II
1 OVERVIEW OF PORTFOLIO 3
1.1 SUMMARY OF ACHIEVEMENTS 4
1.2 PROGRAM UPDATES AND FINDINGS 8
1.3 EVALUATION UPDATES AND FINDINGS 9
2 SUMMARY OF ENERGY IMPACTS BY PROGRAM 10
3 SUMMARY OF DEMAND IMPACTS BY PROGRAM 12
4 SUMMARY OF FINANCES 16
4.1 PORTFOLIO LEVEL EXPENDITURES 16
4.2 PROGRAM LEVEL EXPENDITURES 18
PPL Electric | Page i

April 15, 2016 | Quarterly Report to the PA PUC - Program Year 7 Quarter 3
Acronyms C&l Commercial and Industrial
CFL Compact Fluorescent Lamp
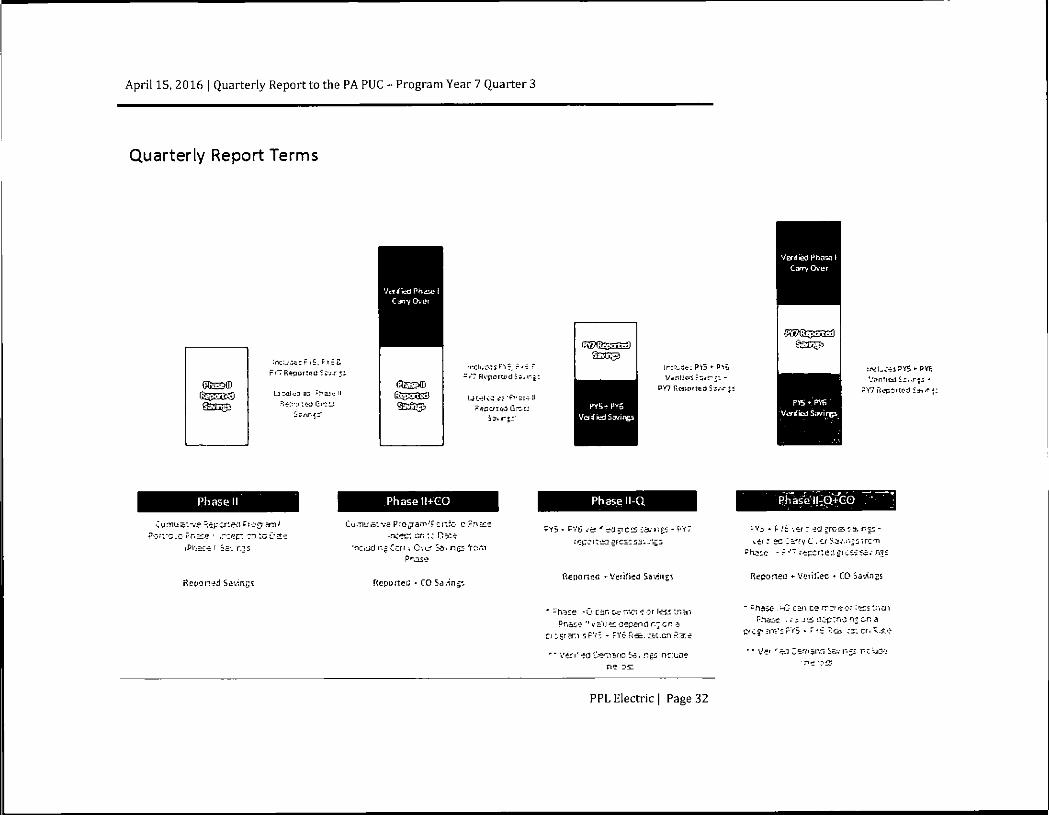
Phase M Cumulative Program/Portfolio Phase II Inception to Date (Phase ll Savings)
Phase ll+CO Cumulative Program/Portfolio Phase II Inception to Date including Carry
Over Savings from Phase I
Phase ll-Q Phase II verified gross savings from the beginning of Phase II + PYTD
reported gross savings.
Phase ll-Q+CO Phase II verified gross savings from the beginning of Phase II + verified
Carry Over Savings from Phase I + PYTD reported gross savings
CSP Conservation Service Provider or Curtailment Service Provider
EDC Electric Distribution Company
EE&C Energy Efficiency and Conservation
EM&V Evaluation, Measurement, and Verification
GNI Government, Non-Profit, Institutional
HVAC Heating, Ventilating, and Air Conditioning
IQ Incremental Quarter
MW Megawatt
MWh Megawatt-hour
NTG Net-to-Gross
PA PUC Pennsylvania Public Utility Commission
PY5 Program Year 2013, from June 1, 2013 to May 31, 2014
PY6 Program Year 2014, from June 1, 2010 to May 31, 2015
PY7 Program Year 2015, from June 1, 2011 to May 31, 2016
PYX QX Program Year X, Quarter X
PYTD Program Year to Date
SWE Statewide Evaluator
TRC Total Resource Cost
TRM Technical Reference Manual
PPL Electric | Page ii
April 15, 2016 | Quarterly Report to the PA PUC - Program Year 7 Quarter 3
1 Overview of Portfolio Pennsylvania Act 129 of 2008 signed on October 15, 2008, mandated energy savings and demand reduction goals for the largest electric distribution companies (EDCs) in Pennsylvania for Phase I (2008 through 2013). In 2009, each EDC submitted energy efficiency and conservation (EE&C) plans—which were approved by the Pennsylvania Public Utility Commission (PUC)—pursuant to these goals. Each EDC filed new EE&C plans with the PA PUC in early 2013 for Phase II (June 2013 through May 2016) of the Act 129 programs. These plans were subsequently approved by the PUC in 2013.
Implementation of Phase II of the Act 129 programs began on June 1, 2013. This report documents the progress and effectiveness of the Phase II EE&C accomplishments for PPL Electric in the thiurd quarter of Program Year 7 (PY7), defined as December 1, 2015 through February 28, 2016, as well as the cumulative accomplishments of the programs since inception of Phase II. This report additionally documents the energy savings carried over from Phase I. The Phase I carry over savings count towards EDC savings compliance targets for Phase II.
The Cadmus Group, Inc. is evaluating the programs, which includes measurement and verification of the savings. The verified savings for PY6 were reported in the annual report, filed November 15, 2015.
In the third quarter of PY7, PPL Electric's portfolio included 13 programs:
1. The Appliance Recycling Program (ARP) offers customers incentives to have their outdated refrigerators, freezers, and air conditioners recycled.
2. The Continuous Energy Improvement Program provides technical support for schools to develop and implement a Strategic Energy Management Plan.
3. The Custom Incentive Program offers custom incentives to nonresidential customers per kilowatt hour (kWh) saved during the first year of participation. Beginning in PY6 Q I , the methodology for counting participants for this program changed. The participant count is now the number of projects contributing to reported savings for the specified period (as opposed to the number of projects created in that period).
4. The E-Power Wise Program provides low-income customers with information about energy use, along with home energy kits.
5. The Low-Income Energy-Efficiency Behavior & Education Program provides qualified low-income customers with a series of home energy reports showing their energy use, comparing their usage to similar customers, and providing energy savings tips. The participant count for this program was corrected in the PY6 annual report. It includes customers who received at least one Home Energy Report and is not adjusted for opt-outs or those whose accounts became inactive.
6. The Winter Relief Assistance Program (WRAP) provides weatherization to low-income customers using Act 129 funding to expand PPL Electric's existing Low-Income Usage Reduction Program.
7. The Prescriptive Equipment Program offers nonresidential customers rebates and incentives from a list of specific energy-efficiency measures and services. The program also offers a Direct Discount component. This program has a wait list in PY7 and PPL Electric is not accepting new applications.
8. The Master Metered Multifamily Housing Program targets energy efficiency improvements in master metered multifamily low-income housing buildings.
PPL Electric | Page 3
April 15, 2016 | Quarterly Report to the PA PUC - Program Year 7 Quarter 3
9. The Residential Energy-Efficiency Behavior & Education Program provides high-usage residential customers with a series of home energy reports showing their energy use, comparing their usage to similar customers, and providing energy savings tips. The participant count for this program was corrected in the PY6 annual report. It includes customers who received at least one Home Energy Report and is not adjusted for opt-outs or those whose accounts became inactive.
10. The Residential Home Comfort Program offers energy-saving measures and rebates for new construction and existing homes.
11. The Residential Retail Program offers rebates and upstream incentives for energy-efficiency products found in retail stores. Exact participation in the upstream lighting component is not known. The EM&V CSP estimates the number of participants in this component of the program by dividing the total number of bulbs discounted or given away by a bulb-per-participant value derived from the most recent residential and commercial customer telephone survey data. The total participant count for this program is comprised of equipment-rebate participants, midstream equipment-incentive participants (midstream incentives were discontinued during PY5), and estimated lighting participants.
12. The School Benchmarking Program works with school administrators to evaluate total building energy use using the Environmental Protection Agency's Portfolio Manager tool.
13. The Student and Parent Energy-Efficiency Education Program provides school-based energy-efficiency education through in-classroom workshops for students in various grade levels, training for teachers, and community workshops for parents in low-income neighborhoods. Beginning in PY6 Q3, the methodology for counting participants for this program changed. The participant count is now the number of kits distributed, instead of the previously-reported number of classrooms. This change was applied to data for all of Phase II.
1.1 Summary of Achievements
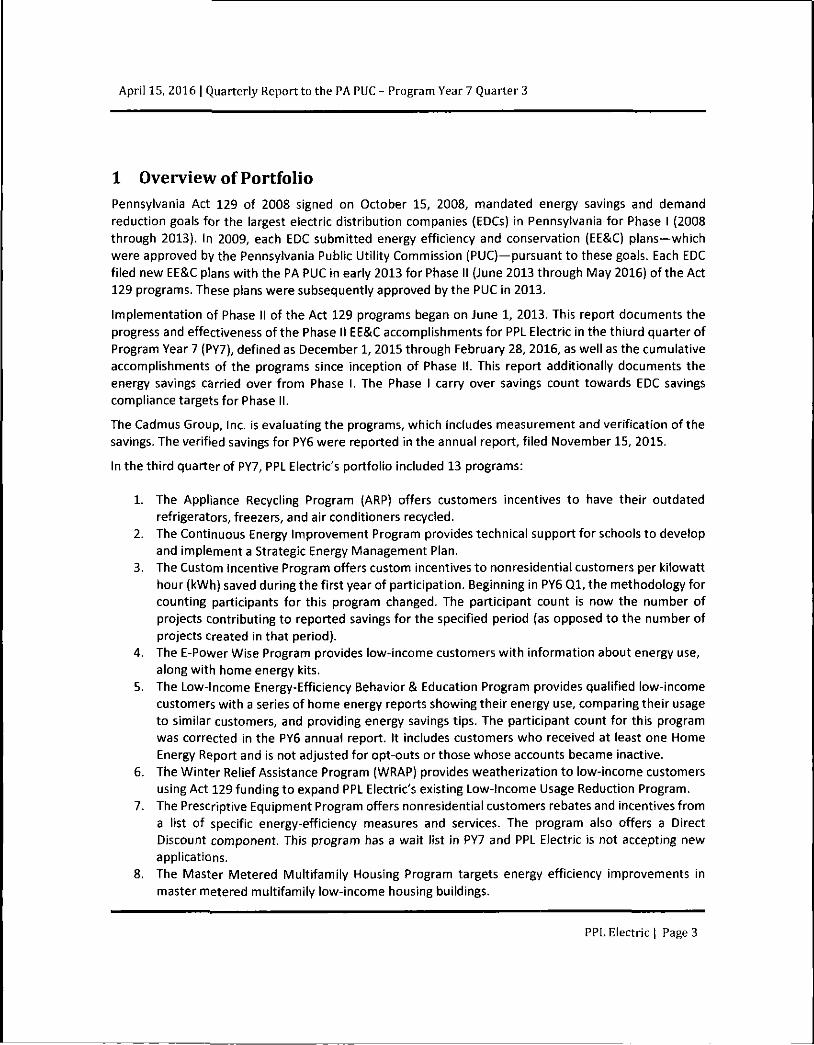
PPL Electric has achieved approximately 134.7 percent o f t he May 31, 2016 energy savings compliance
target, including Phase 1 Carry Over. Phase ll-Q+CO1 gross energy savings achieved through Quarter 3 are
shown in Figure 1-1. Phase II and Phase ll-Q 2 are shown as components of Figure 1-1.
1 Phase ll-Q+CO = Phase II verified gross savings from the beginning of Phase II including verified Carry Over Savings from Phase I + PYTD reported gross savings. See the 'Quarterly Report Terms' graphic and the end of this report for more information.
2 Phase ll-Q = Verified Gross Savings from the beginning of Phase II + PYTD Reported Gross Savings. This excludes Phase I carry over savings. All savings reported as Phase ll-Q gross savings are computed this way. Phase II Verified Gross Savings will be reported in the annual report. See the 'Quarterly Report Terms' graphic and the end of this report for more information.
PPL Electric | Page 4

April 15, 2016 | Quarterly Report to the PA PUC - Program Year 7 Quarter 3
Figure 1-1: Cumulative Portfolio Phase 2 Inception to Date (Phase II) Energy Impacts
180%-
160%-
140%-
120%-
4 100%-
1 80%-
60%-
40%-
20%-
0%
1,225,856 MWh/yr
mm
Phase II
234.725* 2,206,287 MWh/vr
Phase 11-3 +CO
200 H 821,072
VtoySI. 2016 Comp ba nee Target
Verified Phase I Carry Over I 1 Phase II Reparted GrossSavings Phase 11 Verified Savings
PPL Electric achieved 128.38 MW of demand reduction as of PY7 Q3. 3
3 Unlike Phase I, there is no compliance target for demand reduction in Phase II.
PPL Electric | PageS

April 15, 2016 | Quarterly Report to the PA PUC - Program Year 7 Quarter 3
Figure 1-2: Phase II Portfolio Demand Reduction
Phase II
i i Phase II Reported Gross Savings
150- 223.S9 228.3S MW
100- um
50-50-se.da
0-Phase ll-Q
Phase II Verified Savings
There are 61 measures available to the low-income sector at no cost to the customer. These measures offered to the low-income sector comprise 47 percent of the total measures offered during Phase II. As required by the Phase II goal, this exceeds the fraction of the electric consumption of the utility's low-income households divided by the total electricity consumption in the PPL Electric territory (9.95 percent).1 The Phase ll-Q reported gross energy savings achieved in the low-income sector is 20,034 MWh/yr. The verified savings from low-income participation in general residential programs during PY5 and PY6 was 19,903 MWh/yr. These savings total approximately 108 percent o f the May 31, 2016 Phase II Low-Income compliance target (36,948 MWh/yr for PPL Electric) based on Phase ll-Q savings, as shown in Figure 1-3. Please note that carryover savings do not apply since there was no low-income savings compliance target in Phase 1.
A Act 129 includes a provision requiring electric distribution companies to offer a number of energy efficiency measures to low-income households that are "proportionate to those households' share of the total energy usage in the service territory." 66 Pa.C.S. §2806.1{b)(i) (G). The Phase II Evaluation Framework updated percentages of total energy use by low income households based on 2010 Census data. Section 1-2, Table 1-9.
PPL Electric | Page 6

April 15, 2016 | Quarterly Report to the PA PUC - Program Year 7 Quarter 3
Figure 1-3: Low-Income Sector 5 6
140% -.
120%-
100%-
80%-
60%-
40%-
20%-
Q%-
109.24% 40,360 MWh/yr
1
Fuse II
108.09% 39,937 MWh/yr
Phase ll-C
100% 36,948 MWh/yr
Hay 2 : . 2 ; i e Ll CoTiptarce Targ*!
Phase 11 Veri f ied Grass Energy Savings far LlPsrt ic ipet ion
in General Residential Prosrams
Phase II Reported Grass Savings
far Ll Programs
Phase II Ver i f ied Savings
PPL Electric achieved approximately 202 percent o f the May 31,2016 energy reduction compliance target for government, nonprofit and institutional sector, based on Phase ll-Q+CO gross energy savings achieved through Quarter 3, as shown in
5 Phase II = Cumulative Program/Portfolio Phase II Inception to Date (Phase II Savings). See the 'Quarterly Report Terms' graphic and the end of this report for more information.
6 Phase ll-Q = Phase II verified gross savings from the beginning of Phase II + PYTD reported gross savings. See the 'Quarterly Report Terms' graphic and the end of this report for more information.
PPL Electric | Page 7

April 15, 2016 | Quarterly Report to the PA PUC - Program Year 7 Quarter 3
Figure 1-4.
PPL Electric | Page 8

April 15, 2016 | Quarterly Report to the PA PUC - Program Year 7 Quarter 3
Figure 1-4: Government, Nonprofit, and Institutional Sectors
Frase
201.5SK 165,492 MWh/yr
100 SS B2,107
M»y 3'r. 2?;6 SMI Compharce Tarss:
BBS Verified Phase I Carry CXer [ | Phase II Reported GrnssSavings Phase 11 Verified Ssi/ings
1.2 Program Updates and Findings
• Appliance Recycling Program: In PY7 Q3, PPL Electric provided final PY7 data for units that had been scheduled for pick up prior to the implementation CSP, JACO Environmental, ceasing operations. No further pick ups are planned for PY7.
• Continuous Energy Improvement: In PY7, the eight participating school districts expanded CEI to include a total of forty-five schools within the eight districts.
• Custom Incentive: New applications are processed, but incentives are no longer being reserved. Instead, they are added to a waitlist. Projects deemed eligible are expected to be moved off of the waitlist and incentives will be reserved if/when additional program funds become available.
• E-Power Wise: No program changes or updates in PY7 Q3.
• Low-Income Energy-Efficiency Behavior & Education: The program continued delivering home energy reports as scheduled, with two modules added at the end of PY7 Q2 through PY7 Q3. The program added the "Winter of 68" and LIHEAP modules to target a specific energy-saving behavior and program participation, respectively.
• Low-Income WRAP: No program changes or updates in PY7 Q3. • Master Metered Multifamily Housing: No program changes occurred in PY7 Q3.
• Prescriptive Equipment: No program changes in PY7 Q3.
• Residential Energy-Efficiency Behavior & Education: The program ceased delivery o f the home energy reports to all participants (treatment group customers) at the end of PY7 Q2. No home energy reports will be delivered for the remainder of the program year due to the program's very strong savings in PY6 and forecasted savings for PY7.
• Residential Home Comfort: No program changes in PY7 Q3.
PPL Electric | Page 9

April 15, 2016 | Quarterly Report to the PA PUC - Program Year 7 Quarter 3
• Residential Retail: In PY7 Q3, the program reported savings from 45,000 bulbs mailed to participants in the Low-Income Energy-Efficiency Behavior & Education program. These 1,375 MWh of savings were assigned to the low-income sector.
• School Benchmarking: No program updates in PY7 Q3.
• Student and Parent Energy-Efficiency Education: No changes to planned program delivery in PY7 Q3.
1.3 Evaluation Updates and Findings
This section summarizes evaluation activities occurring within each program during PY7 Q3:
• Appliance Recycling Program: The EM&V CSP reviewed final PY7 progran tracking data.
• Continuous Energy Improvement: No evaluation activities for PY7 occurred during Q3.
• Custom Incentive: The EM&V CSP worked with the Implementation CSP to refine baselines and SSMVPs for large projects. Conducted pre- and post-installation site visits when possible. Verified five large projects.
• E-Power Wise: Sample verification concluded for PY7 Q I and Q2.
• Low-Income Energy-Efficiency Behavior & Education: The EM&V CSP conducted stakeholder interviews with PPL Electric's PM and the ICSP in PY7 Q3. Near the end of PY7 Q3, the EM&V CSP began fielding the customer surveys.
• Low-Income WRAP: The EM&V CSP selected a sample of baseload, low cost, full cost, and HPWH records for verification.
• Master Metered Multifamily Housing: The EM&V CSP performed verification activities on a sample of projects completed during PY7 Q I and PY7 Q2. The EM&V CSP is currently preparing verification reports and conducting analysis on the savings verified through PY7 Q2.
• Prescriptive Equipment: The EM&V CSP conducted records review for the sample of PY7 Q I and Q2 equipment records. The EM&V CSP selected the Q I impact evaluation sample of 12 lighting projects, and began reviewing the sample file records and scheduling site visits.
• Residential Energy-Efficiency Behavior & Education: The EM&V CSP conducted stakeholder interviews with PPL Electric's PM and the ICSP in PY7 Q3.
• Residential Home Comfort: Conducted records review of PY7 Q2 audit, weatherization, and efficient equipment records for quality control and verification purposes and calculated preliminary, unweighted realization rates for Q2. Selected samples for Q3 review. Reviewed new construction rebates to ensure UDRH file captured baseline conditions correctly.
• Residential Retail: The EM&V CSP selected a sample of PY7 Q2 equipment records for review, and conducted an audit of PY7 Q2 upstream lighting records.
• School Benchmarking: The School Benchmarking program does not claim energy or demand savings. The EM&V CSP and PPL determined that no additional process evaluation activities would be conducted in PY6 or PY7.
• Student and Parent Energy-Efficiency Education: The EM&V CSP received impact and process data from the program implementer and conducted records review.
PPL Electric | Page 10

April 15, 2016 | Quarterly Report to the PA PUC - Program Year 7 Quarter 3
2 Summary of Energy Impacts by Program A summary o f the reported energy savings by program for Phase II is presented in Figure 2-1 and Figure 2-2.
Figure 2-1: Phase II Reported Gross Energy Savings by Program
2
jooao-i 25C.CO:-250.'330-243.003-2220X1-2X000-isaox-1500X-IZO.OOC-123.000-1X.D0O-S0IX»-M . 0 » -tO.ODO-
275.217
25,&S8 46.280
1.390 5.804 1i681 1 1 - 5 9 7 5.011
189.111
30.424 14.943 16.095
r — i
y / ^ ^ > ^ ^ ^ # ># ̂ o ^ J y
PPL Electric | Page 11
April 15, 2016 | Quarterly Report to the PA PUC - Program Year 7 Quarter 3
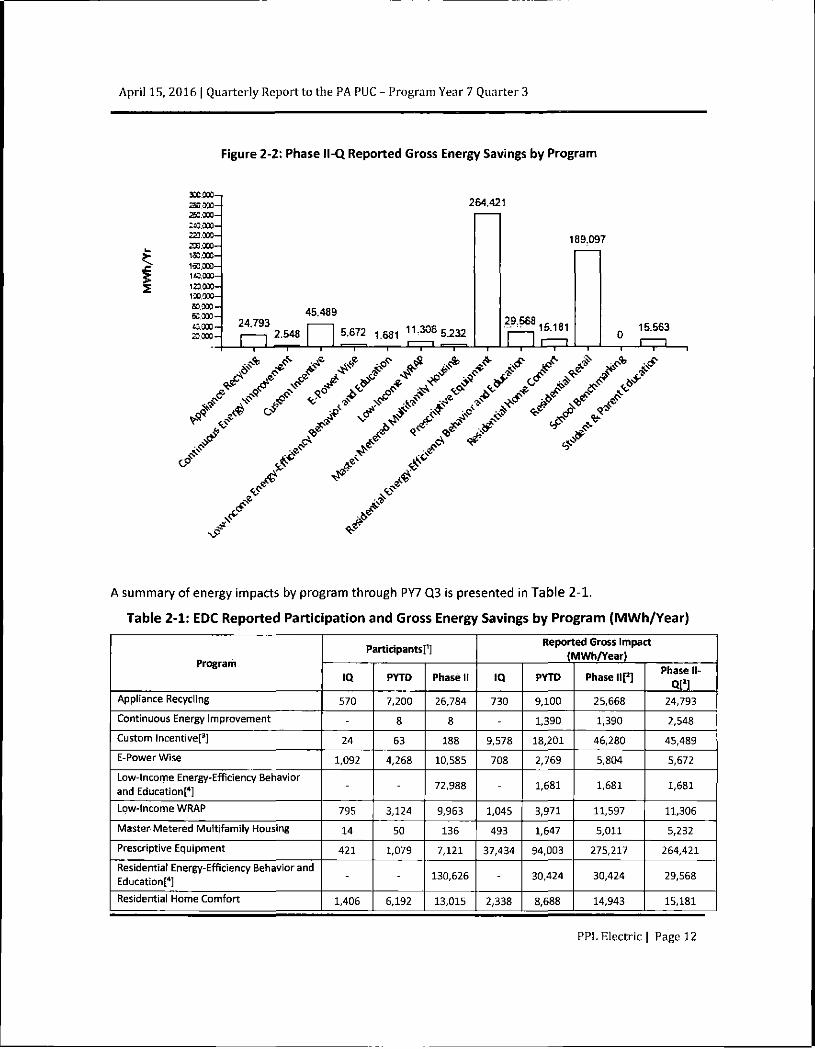
Figure 2-2: Phase ll-Q Reported Gross Energy Savings by Program
XC.0CO-, Z3COX-250.000-liCOOD-233000-
an.ooo-loCXC-150,003-143,033-123,CO0-IM.000-5 2 X C -60:XC-W.00C-23.000-
264.421
24.793 45.489
2.548 5-672 1 i 6 e i 11:306 5 232
189.097
29.568 15.181 r
15.563
- i — , - , — i — ' — i — — r
x?*5 ^ <f J1 J> if ^ af ^
^ / ^ / ^ y / y y y x y
4t &
A summary of energy impacts by program through PY7 Q3 is presented in Table 2 -1 .
Table 2-1: EDC Reported Participation and Gross Energy Savings by Program (MWh/Year)
Program Partidpantsp]
Reported Gross Impact (MWh/Year)
Program PYTD Phase II IQ PYTD Phase HE1]
Phase II-
Qt1] Appliance Recycling 570 7,200 26,784 730 9,100 25,668 24,793
Continuous Energy Improvement - 8 8 - 1,390 1,390 2,548
Custom Incentive!3] 24 63 188 9,578 18,201 46,280 45,489
E-Power Wise 1,092 4,268 10,585 708 2,769 5,804 5,672
Low-Income Energy-Efficiency Behavior and Education[4] - - 72,988 - 1,681 1,681 1,681
Low-Income WRAP 795 3,124 9,963 1,045 3,971 11,597 11,306
Master Metered Multifamily Housing 14 50 136 493 1,647 5,011 5,232
Prescriptive Equipment 421 1,079 7,121 37,434 94,003 275,217 264,421
Residential Energy-Efficiency Behavior and Educationt*] - - 130,626 - 30,424 30,424 29,568
Residential Home Comfort 1,406 6,192 13,015 2,338 8,688 14,943 15,181
PPL Electric | Page 12
April 15, 2016 | Quarterly Report to the PA PUC - Program Year 7 Quarter 3
Program Participants!1]
Reported Gross Impact (MWhAear)
Program IQ PYTD Phase II IQ PYTD Phase ll[ 2]
Phase II-
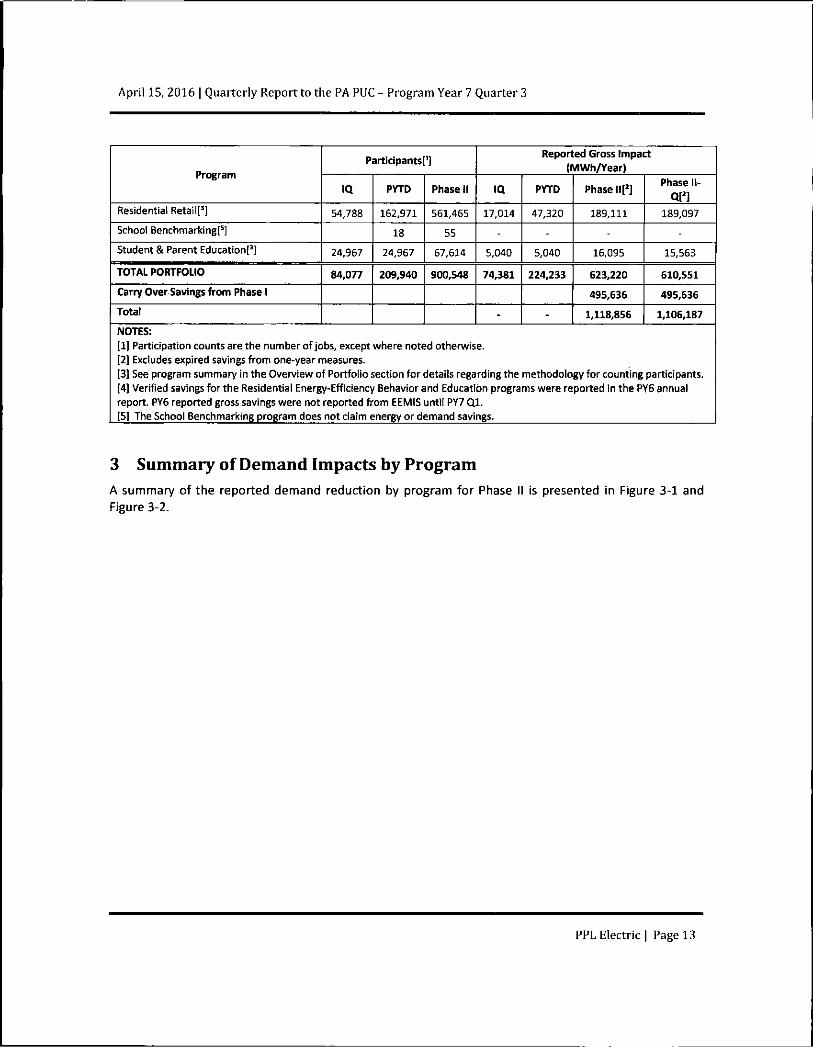
Q[ 2] Residential Retail[3] 54,788 162,971 561,465 17,014 47,320 189,111 189,097
School Benchmarking!5] 18 55 - - - -Student & Parent Education[3] 24,967 24,967 67,614 5,040 5,040 16,095 15,563
TOTAL PORTFOLIO 84,077 209,940 900,548 74,381 224,233 623,220 610,551
Carry Over Savings from Phase 1 495,636 495,636
Total - - 1,118,856 1,106,187
NOTES: (1] Participation counts are the number of jobs, except where noted otherwise. [2] Excludes expired savings from one-year measures. [3] See program summary in the Overview of Portfolio section for details regarding the methodology for counting participants. [4] Verified savings for the Residential Energy-Efficiency Behavior and Education programs were reported in the PY6 annual report. PY6 reported gross savings were not reported from EEMIS until PY7 QI . [5] The School Benchmarking program does not claim energy or demand savings.
3 Summary of Demand Impacts by Program A summary of the reported demand reduction by program for Phase II is presented in Figure 3-1 and Figure 3-2.
PPL Electric | Page 13

April 15, 2016 | Quarterly Report to the PA PUC - Program Year 7 Quarter 3
Figure 3-1: Phase II Demand Reduction by Program
50-1
40-
30-
20-
10-
41.91 37.42
4.19 5.80 0.16 0.87 2 3 1 1.22 0.49
T—'—r ' ' T' —r i 1 1
23.42
4.46 0.00 1.64
i— — i — • 1 •—r
^' <p
PPL Electric | Page 14

April 15, 2016 | Quarterly Report to the PA PUC - Program Year 7 Quarter 3
Figure 3-2: Phase ll-Q Demand Reduction by Program
501
40-
30-
20-
10-
40.65 41-91
4 34 5.76 0.88 , 1 1 04 2.31 1 34 0 5 0
^ — r — i , ,
23.41
4.76 0.00 1.48
y y / y y ^ y y y y / y / # ^ ^ ^ ^ ^ ^ ^ ^ ^ ^
PPL Electric | Page 15

April 15, 2016 | Quarterly Report to the PA PUC - Program Year 7 Quarter 3
A summary of total demand reduction impacts by program through PY7 Q3 is presented in Table 3-1.
Table 3-1: EDC Reported Participation and Gross Demand Reduction by Program
Program Participants
Reported Gross Impact (MW) Program
IQ PYTD Phase II IQ PYTD Phase ll[s] Phase ll-Q[s]
Appliance Recycling 570 7,200 26,784 0.09 1.19 4.19 4.34
Continuous Energy Improvement - 8 8 • 0.16 0.16 0.88
Custom Incentive!*] 24 63 188 1.5S 2.70 5.80 5.76
E-Power Wise 1,092 4,268 10,585 0.14 0.55 0.87 1.04
Low-Income Energy-Efficiency Behavior and Education!4] - - 72,988 - 2.31 2.31 2.31
Low-Income WRAP 795 3,124 9,963 0.12 0.45 1.22 1.34
Master Metered Multifamily Housing 14 50 136 0.06 0.18 0.49 0.50
Prescriptive Equipment 421 1,079 7,121 5.06 13.07 37.42 40.65
Residential Energy-Efficiency Behavior and Education!4] - - 130,626 - 41.91 41.91 41.91
Residential Home Comfort 1,406 6,192 13,015 0.40 2.02 4.46 4.76
Residential Retail!3] 54,788 162,971 561,465 2.38 6.73 23.42 23.41
School Benchmarking!5] 18 55 - - - -Student & Parent Education!3] 24,967 24,967 67,614 0.66 0.66 1.64 1.48
TOTAL PORTFOLIO 84,077 209,940 900,548 10.46 71.94 123.89 128.38
NOTES: [1] Participation counts are the number of jobs, except where noted otherwise. [2] Excludes expired savings from one-year measures. [3] See program summary in the Overview of Portfolio section for details regarding the methodology for counting participants. [4] Verified savings for the Residential Energy-Efficiency Behavior and Education programs were reported in the PY6 annual report. PY6 reported gross savings were not reported from EEMIS until PY7 QI . [5] The School Benchmarking program does not claim energy or demand savings.
PPL Electric | Page 16

April 15, 2016 | Quarterly Report to the PA PUC - Program Year 7 Quarter 3
4 Summary of Finances
4.1 Portfolio Level Expenditures
A breakdown of the portfolio finances is presented in Table 4-1.
Table 4-1: Summary of Portfolio Finances1
Quarter 3 ($000)
PYTD ($000)
Phase II ($000)
EDC Incentives to Participants or
Trade Allies $6,774 $22,766 $58,208
Subtotal EDC Incentive Costs $6,774 $22,766 $58,208
Administration, Management and
Technical Assistance2 $7,136 $22,194 $67,398
Design & Development $2 $39 $1,490
Marketing $276 $742 $7,911
Subtotal EDC Implementation Costs $7,413 $22,975 $76,799
EDC Evaluation Costs $625 $2,360 $8,010
SWE Audit Costs $225 $1,900
Total EDC Costs3 $14,813 $48,326 $144,917
Participant Costs 4 N/A N/A N/A
Total TRC Costs 5 N/A N/A N/A
NOTES: Per PUC direction, TRC inputs and calculations are required in the Annual Report only and should comply with the 2023 Total Resource Cost Test Order approved August 30,2012.
' Includes portfoiio indirect (common) costs are not assigned to a particular program. See Table 4-la for a breakdown ofthe indirect costs for each reporting category. 1 Includes administrative CSP (rebate processing), tracking system, general administration and clerical costs, EDC program management, CSP program management, general management oversight, major accounts, and technical assistance. J Per the 2013 Total Resource Cost Test Order - Total EDC Costs, here, refer to EDC Incurred expenses only. Total EDC Costs = Subtotal EDC Incentive Costs + Subtotal EDC Implementation Costs + EDC Evaluation Costs + SWE Audit Costs. 1 Per the 2013 Total Resource Cost Test Order -Net participant costs; in PA, the costs of the end-use customer. 5 Total TRC Costs = Total EDC Costs + Participant Costs. TRC Costs will be calculated for the PY6 Final Annual Report.
PPL Electric | Page 17
April 15, 2016 | Quarterly Report to the PA PUC - Program Year 7 Quarter 3
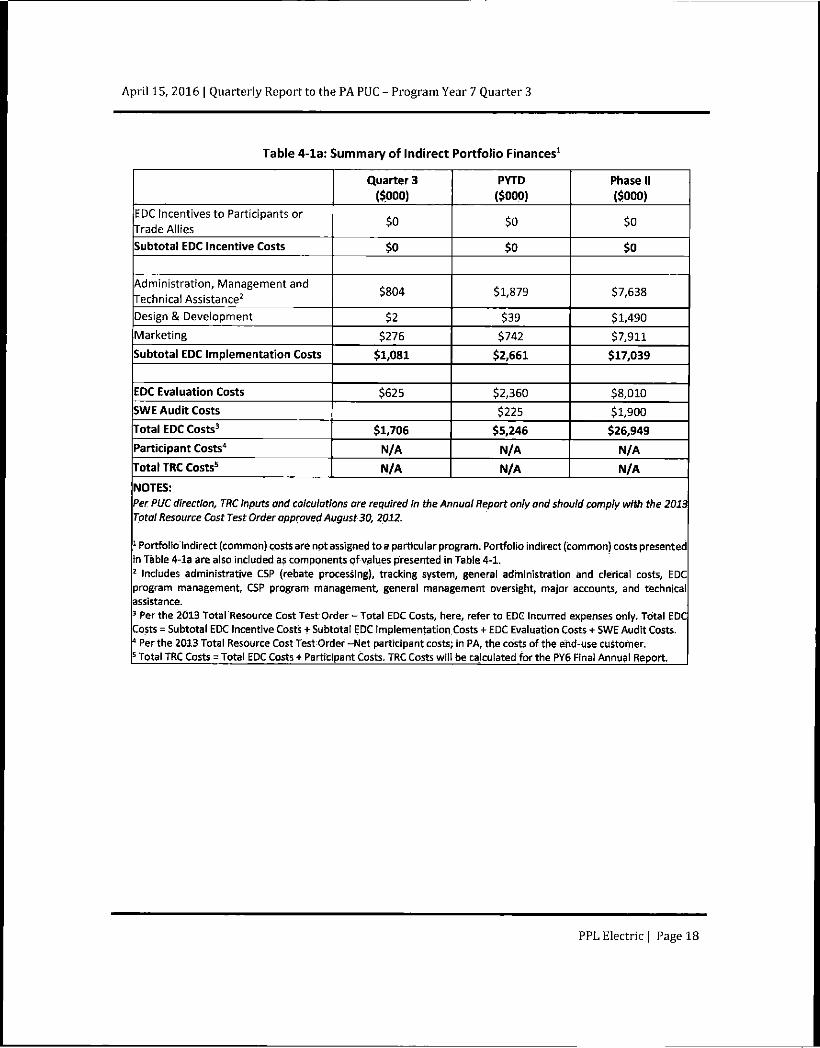
Table 4-la: Summary of Indirect Portfolio Finances1
Quarter 3 ($000)
PYTD ($000)
Phase II ($000)
EDC Incentives to Participants or Trade Allies
$0 $0 $0
Subtotal EDC Incentive Costs $0 $0 $0
Administration, Management and
Technical Assistance2 $804 $1,879 $7,638
Design & Development $2 $39 $1,490
Marketing $276 $742 $7,911
Subtotal EDC Implementation Costs $1,081 $2,661 $17,039
EDC Evaluation Costs $625 $2,360 $8,010
SWE Audit Costs $225 $1,900
Total EDC Costs 3
$1,706 $5,246 $26,949
Participant Costs 4
N/A N/A N/A
Total TRC Costs 5
N/A N/A N/A
NOTES: Per PUC direction, TRC inputs and calculations are required in the Annuai Report only and should comply with the 2013 Total Resource Cost Test Order approved August 30, 2012.
1 Portfolio indirect (common) costs are not assigned to a particular program. Portfolio indirect (common) costs presented in Table 4-la are also included as components pf values presented in Table 4-1. 2 Includes administrative CSP (rebate processing), tracking system, general administration and clerical costs, EDC program management, CSP program management, general management oversight, major accounts, and technical assistance. 3 Per the 2013 TotalResource Cost Test Order-Total EDC Costs, here, refer to EDG incurred expenses only. Total EDC Costs = Subtotal,EDC Incentive Costs + Subtotal EDC Implementation Costs + EDC Evaluation Costs + SWE Audit Costs. 4 Per the 2013 Total Resource Cost Test Order -Net participant costs; in PA, the costs of the end-use customer. 5 Total TRC Costs = Total EDC Costs + Participant Costs. TRC Costs will be calculated for the PY6 Final Annual Report.
PPL Electric | Page 18
April 15, 2016 | Quarterly Report to the PA PUC - Program Year 7 Quarter 3
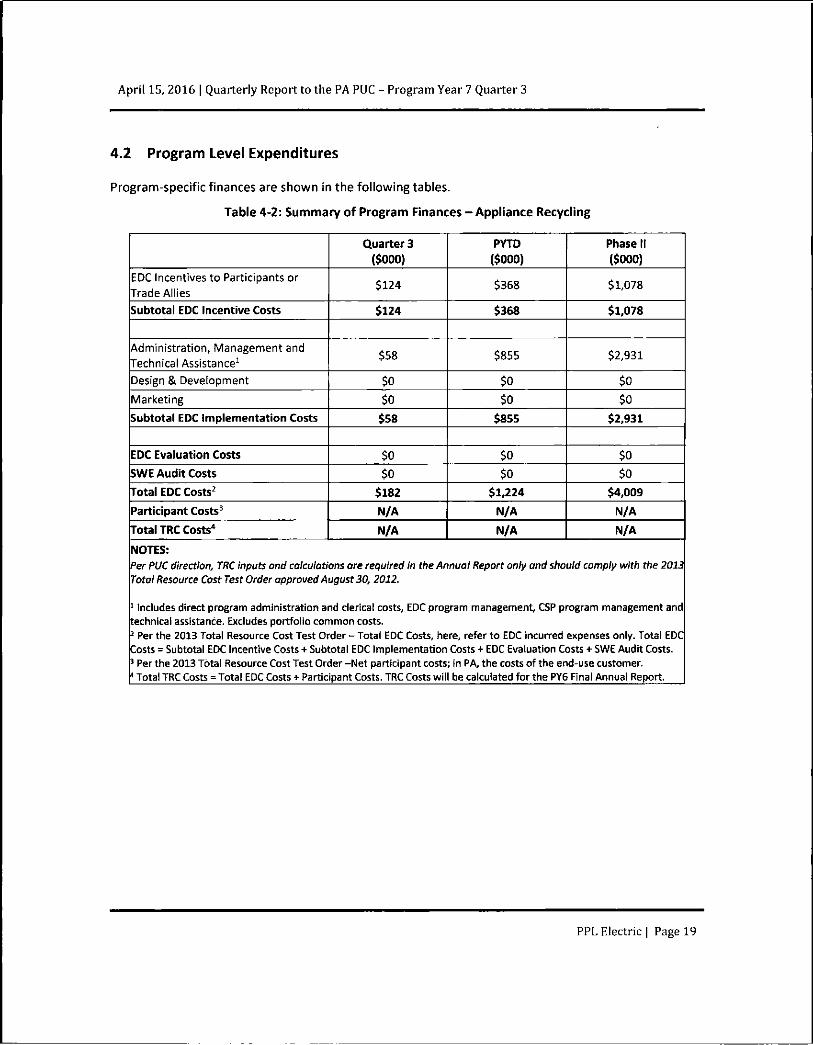
4.2 Program Level Expenditures
Program-specific finances are shown in the following tables.
Table 4-2: Summary of Program Finances - Appliance Recycling
Quarter 3 ($000)
PYTD ($000)
Phase 11 ($000)
EDC Incentives to Participants or Trade Allies
$124 $368 $1,078
Subtotal EDC Incentive Costs $124 $368 $1,078
Administration, Management and
Technical Assistance1 $58 $855 $2,931
Design & Development $0 $0 $0
Marketing $0 $0 $0
Subtotal EDC Implementation Costs $58 $855 $2,931
EDC Evaluation Costs $0 $0 $0
SWE Audit Costs $0 $0 $0
Total EDC Costs 2 $182 $1,224 $4,009
Participant Costs 3 N/A N/A N/A
Total TRC Costs 4 N/A N/A N/A
NOTES: Per PUC direction, TRC inputs and calculations are required in tbe Annual Report only and should comply with the 2013 Total Resource Cost Test Order approved August 30, 2012.
1 Includes direct program administration and clerical costs, EDC program management, CSP program management and technical assistance. Excludes portfoiio common costs. 2 Per the 2013 Total Resource Cost Test Order - Total EDC Costs, here, refer to EDC incurred expenses only. Total EDC Costs = Subtotal EDC Incentive Costs + Subtotal EDC Implementation Costs + EDC Evaluation Costs + SWE Audit Costs. J Per the 2013 Total Resource Cost Test Order -Net participant costs; In PA, the costs of the end-use customer. 4 Total TRC Costs = Total EDC Costs + Participant Costs. TRC Costs will be calculated for the PY6 Final Annual Report.
PPL Electric | Page 19

April 15, 2016 | Quarterly Report to the PA PUC - Program Year 7 Quarter 3
Table 4-3: Summary of Program Finances - Continuous Energy Improvement
Quarter 3 (SOOO)
PYTD ($000)
Phase II ($000)
EDC incentives to Participants or
Trade Allies SO So $0
Subtotal EDC Incentive Costs So So $0
Administration, Management and technical Assistance1
$61 $144 $776
Design & Development $0 $0 $0
Marketing $0 $0 $0
Subtotal EDC Implementation Costs $61 $144 $776
EDC Evaluation Costs $0 $0 So SWE Audit Costs $0 $0 $0
Total EDC Costs 2 $61 $144 $776
Participant Costs 3 N/A N/A N/A
Total TRC Costs 4 N/A N/A N/A
NOTES: Per PUC direction, TRC inputs and calculations are required in the Annual Report only and should comply with the 2013 Total Resource Cost Test Order approved August 30, 2012.
' Includes direct program administration and clerical costs, EDC program management, CSP program management and technical assistance. Excludes portfolio common costs. 2 Per the 2013 Total Resource Cost Test Order - Total EDC Costs, here, refer to EDC incurred expenses only. Total EDC Costs = Subtotal EDC Incentive Costs + Subtotal EDC Implementation Costs + EDC Evaluation Costs + SWE Audit Costs. 3 Per the 2013 Total Resource Cost Test Order -Net participant costs; in PA, the costs of the end-use customer. These will be calculated for the PY5 Final Annual Report. 1 Total TRC Costs = Total EDC Costs + Participant Costs. TRC Costs will be calculated for the PY6 Final Annual Report.
PPL Electric | Page 20

April 15, 2016 | Quarterly Report to the PA PUC - Program Year 7 Quarter 3
Table 4-4: Summary of Program Finances - Custom Incentive
Quarter 3
($000)
PYTD ($000)
Phase II ($000)
EDC Incentives to Participants or Trade Allies
$920 $1,640 $3,253
Subtotal EDC Incentive Costs $920 $1,640 $3,253
Administration, Management and
Technical Assistance1 $243 $667 $2,800
Design & Development $0 $0 $0
Marketing $0 $0 $0
Subtotal EDC Implementation Costs $243 $667 $2,800
EDC Evaluation Costs $0 $0 $0
SWE Audit Costs $0 $0 $0
Total EDC Costs 2 $1,163 $2,306 $6,053
Participant Costs 3 N/A N/A N/A
Total TRC Costs 4 N/A N/A N/A
NOTES: Per PUC direction, TRC inputs and calculations are required in the Annual Report only.and should comply with the 2013 Total Resource Cost Test Order approved August 30, 2012.
1 Includes direct program administration and cierical costs, EDC.program management, GSP program management and technical assistarice. Excludes portfolio common costs. 1 Per the 2013 Total Resource Cost Test Order-Total EDC Costs, here, refer to EDC incurred expenses only. Total EDC Costs = Subtotal EDC Incentive Costs + Subtotal EDC implementation Costs + EDC Evaluation Costs + SWE Audit Costs.. s Per the 2013 Total Resource Cost Test Order -Net participant costs; in PA, the costs of the end-use customer These will be calculated for the PY5 Final Annual Report. 5 Total TRC Costs = Total EDC Costs + Participant Costs. TRC Costs will be calculated for the PY6 Final Annuai Report.
PPL Electric | Page 21
April 15, 2016 | Quarterly Report to the PA PUC - Program Year 7 Quarter 3
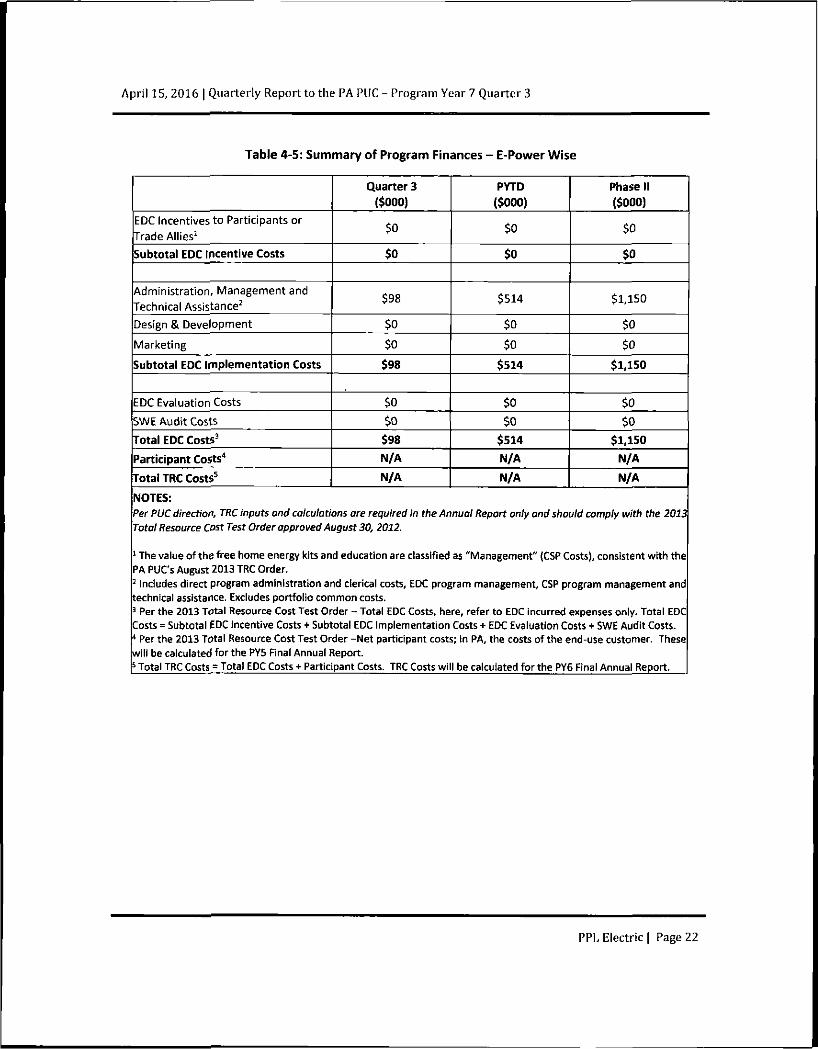
Table 4-5: Summary of Program Finances - E-Power Wise
Quarter 3 ($000)
PYTD
($000)
Phase II ($000)
EDC Incentives to Participants or
Trade Allies1 $0 $0 $0
Subtotal EDC incentive Costs $0 $0 $0
Administration, Management and Technical Assistance2
$98 $514 $1,150
Design & Development $0 $0 $0
Marketing $0 $0 $0
Subtotal EDC Implementation Costs $98 $514 $1,150
EDC Evaluation Costs $0 $0 $0
SWE Audit Costs $0 $0 $0
Total EDC Costs 3 $98 $514 $1,150
Participant Costs 4 N/A N/A N/A
Total TRC Costs 5 N/A N/A N/A
NOTES: Per PUC direction, TRC inputs and calculations ore required in the Annual Report only and should comply with the 2013 Total Resource Cost Test Order approved August 30, 2012.
1 The value ofthe free home energy kits and education are classified as "Management" (CSP Costs), consistent with the PA PUC's August 2013 TRC Order. 2 includes direct program administration and clerical costs, EDC program management, CSP program management and technical assistance. Excludes portfolio common costs. 3 Per the 2013 Total Resource Cost Test Order - Total EDC Costs, here, refer to EDC incurred expenses only. Total EDC Costs = Subtotal EDC Incentive Costs + Subtotal EDC Implementation Costs + EDC Evaluation Costs + SWE Audit Costs. 1 Per the 2013 Total Resource Cost Test Order -Net participant costs; in PA, the costs of the end-use customer. These will be calculated for the PY5 Final Annual Report. 5 Total TRC Costs = Total EDC Costs + Participant Costs. TRC Costs will be calculated for the PY6 Final Annual Report.
PPL Electric | Page 22

April 15, 2016 | Quarterly Report to the PA PUC - Program Year 7 Quarter 3
Table 4-6: Summary of Program Finances - Low-Income Energy-Efficiency Behavior and Education
Quarter 3 ($000)
PYTD ($000)
Phase II ($000)
EDC Incentives to Participants or Trade Allies
$0 $0 $0
Subtotal EDC Incentive Costs $0 $0 $0
Administration, Management and
Technical Assistance1 $2 $259 $1,397
Design & Development $0 $0 $0
Marketing $0 $0 $0
Subtotal EDC Implementation Costs $2 $259 $1,397
EDC Evaluation Costs $0 $0 $0
SWE Audit Costs $0 $0 $0
Total EDC Costs 2 $2 $259 $1,397
Participant Costs 3 N/A N/A N/A
Total TRC Costs 4 N/A N/A N/A
NOTES: Per PUC direction, TRC inputs and calculations ore required in the Annual Report only and should comply with the 2013 Total Resource Cost Test Order approved August 30,2012.
1 Includes direct program administration and clerical costs, EDC program management, CSP program management and technical assistance. Excludes portfolio common costs. 7 Per the 2013 Total Resource Cost Test Order - Total EDC Costs, here, refer to EDC incurred expenses only. Total EDC Costs = Subtotal EDC Incentive Costs + Subtotal EDC Implementation Costs + EDC Evaluation Costs + SWE Audit Costs. 3 Per the 2013 Total Resource Cost Test Order -Net participant costs; in PA, the costs of the end-use customer. These will be calculated for the PY5 Final Annual Report. * Total TRC Costs = Total EDC Costs + Participant Costs. TRC Costs will be calculated for the PY6 Final Annual Report.
PPL Electric | Page 23

April 15, 2016 | Quarterly Report to the PA PUC - Program Year 7 Quarter 3
Table 4-7: Summary of Program Finances - Low-Income WRAP
Quarter 3 ($000)
PYTD ($000)
Phase II ($000)
EDC Incentives to Participants or Trade Allies 1 $0 $0 $0
Subtotal EDC Incentive Costs $o $0 $0
Administration, Management and Technical Assistance3
$1,342 $6,167 $16,038
Design & Development $0 $0 $0
Marketing $0 $0 $0
Subtotal EDC Implementation Costs $1,342 $6,167 $16,038
EDC Evaluation Costs $0 $0 $0
SWE Audit Costs $0 $0 $0
Total EDC Costs 3 $1,342 $6,167 $16,038
Participant Costs'1 N/A N/A N/A
Total TRC Costs 5 N/A N/A N/A
NOTES: Per PUC direction, TRC inputs and calculations are required in the Annual Report only and should comply with the 2013 Total Resource Cost Test Order approved August 30, 2012.
1 The cost of the weatherization measures provided to participants for free is classified as "Management" (CSP costs), consistent with the PA PUC's August 2013 TRC Order. 2 Includes direct program administration and cferical costs, EDC program management, CSP program management and technical assistance. Excludes portfolio common costs. 3 Per the 2013 Total Resource Cost Test Order - Total EDC Costs, here, refer to EDC incurred expenses only. Total EDC Costs = Subtotal EDC Incentive Costs + Subtotal EDC Implementation Costs + EDC Evaluation Costs + SWE Audit Costs. 4 Per the 2013 Total Resource Cost Test Order -Net participant costs; in PA, the costs of the end-use customer. These will be calculated for the PY5 Final Annual Report. 5 Total TRC Costs = Total EDC Costs + Participant Costs. TRC Costs will be calculated for the PY6 Final Annual Report.
PPL Electric | Page 24

April 15, 2016 | Quarterly Report to the PA PUC - Program Year 7 Quarter 3
Table 4-8: Summary of Program Finances - Master Metered Multifamily Housing
Quarter 3 ($000)
PYTD ($000)
Phase II ($000)
EDC Incentives to Participants or Trade Allies
$120 $272 $732
Subtotal EDC Incentive Costs $120 $272 $732
Administration, Management and
Technical Assistance1 $91 $253 $1,194
Design & Development $0 $0 $0
Marketing $0 $0 $0
Subtotal EDC Implementation Costs $91 $253 $1,194
EDC Evaluation Costs $0 $0 $0
SWE Audit Costs $0 $0 $0
Total EDC Costs2 $211 $525 $1,927
Participant Costs3 N/A N/A N/A
Total TRC Costs 4 N/A N/A N/A
NOTES: Per PUC direction^ TRC inputs and calculations are required in the Annual Report only and should comply with the 2013 Total Resource Cost Test Order approved August 30, 2012.
1 Includes direct program administration and clerical costs, EDC program management, CSP program management and technical assistance. Excludes portfolio common costs. 7 Per the 2013 Total Resource Cost Test Order - Total EDC Costs, here, refer to EDC incurred expenses only. Total EDC Costs = Subtotal EDC Incentive Costs + Subtotal EDC Implementation Costs + EDC Evaluation Costs + SWE Audit Costs. 3 Per the 2013 Total Resource Cost Test Order -Net participant costs; in PA, the costs of the end-use customer. These will be calculated for the PY5 Final Annual Report. 1 Total TRC Costs = Total EDC Costs + Participant Costs. TRC Costs will be calculated for the PY6 Final Annual Report.
PPL Electric | Page 25
April 15, 2016 | Quarterly Report to the PA PUC - Program Year 7 Quarter 3
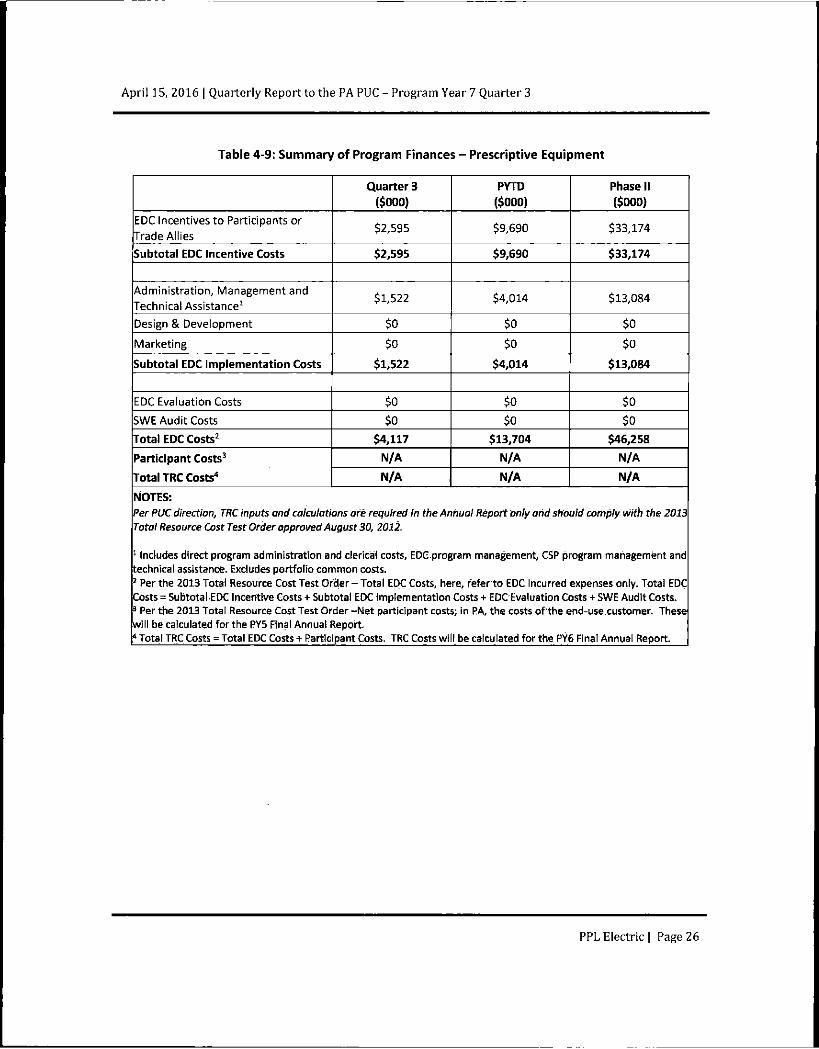
Table 4-9: Summary of Program Finances - Prescriptive Equipment
Quarter 3 ($000)
PYTD ($000)
Phase II ($000)
EDC Incentives to Participants or
Trade Allies $2,595 $9,690 $33,174
Subtotal EDC Incentive Costs $2,595 $9,690 $33,174
Administration, Management and Technical Assistance1
$1,522 $4,014 $13,084
Design & Development $0 $0 $0
Marketing $0 $0 $0
Subtotal EDC Implementation Costs $1,522 $4,014 $13,084
EDC Evaluation Costs $0 $0 $0
SWE Audit Costs $0 $o $0
Total EDC Costs 2 $4,117 $13,704 $46,258
Participant Costs 3 N/A N/A N/A
Total TRC Costs 4 N/A N/A N/A
NOTES: Per PUC direction, TRC inputs and calculations are required in the Annual Report only arid should comply with the 2013 Total Resource Cost Test Order approved August 30, 2012.
1 Includes direct program administration and clerical costs, EDC.program management, CSP program management and technical assistance. Excludes portfolio common costs. 1 Per the 2013 Total Resource Cost Test Order - Total EDC Costs, herie, refer to EDC incurred expenses only. Total EDC Costs = Subtotal EDC Incentive Costs + Subtotal EDC Implementation Costs + EDC Evaluation Costs + SWE Audit Costs. 3 Per the 2013 Total Resource Cost Test Order -Net participant costs; in RA, the costs of the end-use.customer. These will be calculated forthe PY5 Final Annual Report. 1 Total TRC Costs = Total EDC Costs + Participant Costs. TRC Costs will be calculated for the PY6 Final Annual Report.
PPL Electric | Page 26

April 15, 2016 | Quarterly Report to the PA PUC - Program Year 7 Quarter 3
Table 4-10: Summary of Program Finances - Residential Energy-Efficiency Behavior and Education
Quarter 3 (SOOO)
PYTD ($000)
Phase II ($000)
EDC Incentives to Participants or Trade Allies
So $0 $0
Subtotal EDC Incentive Costs So $0 $o
Administration, Management and
Technical Assistance1 $2 $382 $2,341
Design & Development So SO SO
Marketing So SO So Subtotal EDC Implementation Costs $2 $382 $2,341
EDC Evaluation Costs $0 $0 $0
SWE Audit Costs $0 $0 $0
Total EDC Costs2 $2 $382 $2,341
Participant Costs 3 N/A N/A N/A
Total TRC Costs 4 N/A N/A N/A
NOTES: Per PUC direction, TRC inputs and calculations are required in the Annual Report only and should comply with the 2013 Total Resource Cost Test Order approved August 30, 2012.
1 Includes direct program administration and clerical costs, EDC program management, CSP program management and technical assistance. Excludes portfolio common costs. 2 Per the 2013 Total Resource Cost Test Order - Total EDC Costs, here, refer to EDC incurred expenses only. Total EDC Costs = Subtotal EDC Incentive Costs + Subtotal EDC Implementation Costs + EDC Evaluation Costs + SWE Audit Costs. 3 Per the 2013 Total Resource Cost Test Order -Net participant costs; in PA, the costs of the end-use customer. These will be calculated for the PY5 Final Annual Report. ' Total TRC Costs = Total EDC Costs + Participant Costs. TRC Costs will be calculated for the PY6 Final Annual Report.
PPL Electric | Page 27
April 15, 2016 | Quarterly Report to the PA PUC - Program Year 7 Quarter 3
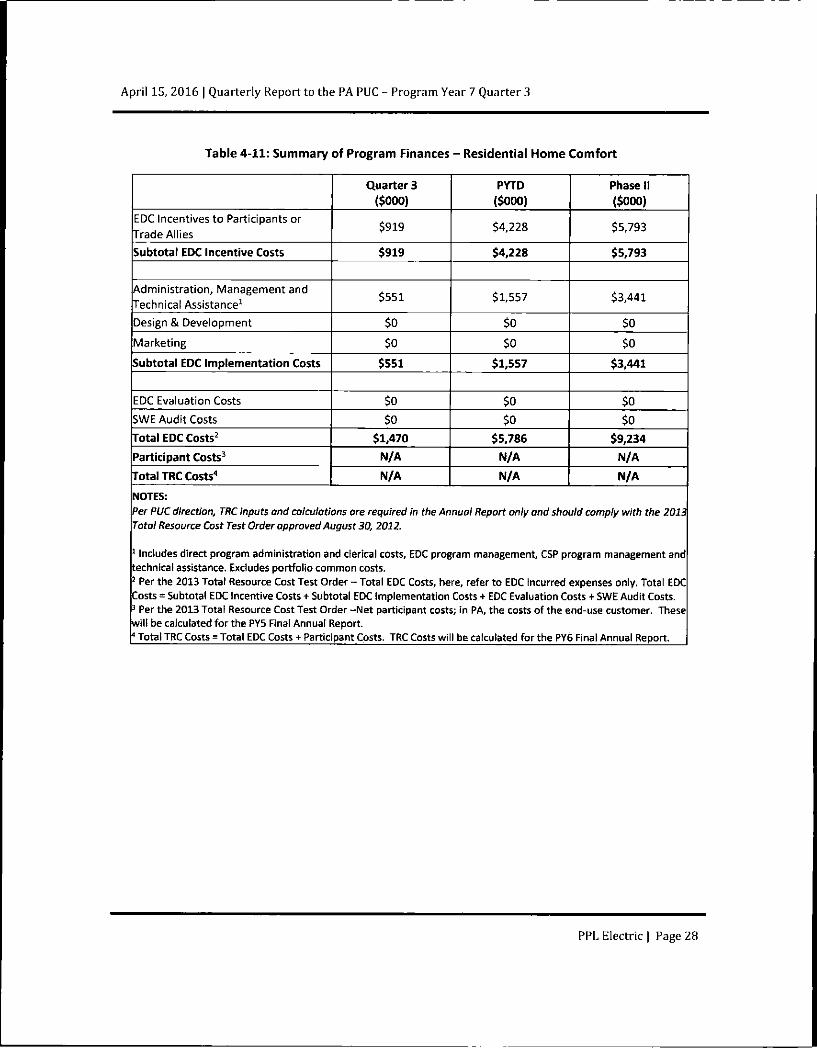
Table 4-11: Summary of Program Finances - Residential Home Comfort
Quarter 3 ($000)
PYTD ($000)
Phase II ($000)
EDC Incentives to Participants or Trade Allies
$919 $4,228 $5,793
Subtotal EDC Incentive Costs $919 $4,228 $5,793
Administration, Management and Technical Assistance1
$551 $1,557 $3,441
Design & Development $0 $0 $0
Marketing $0 $0 $0
Subtotal EDC Implementation Costs $551 $1,557 $3,441
EDC Evaluation Costs $0 $0 $0
SWE Audit Costs $0 $0 $0
Total EDC Costs 2 $1,470 $5,786 $9,234
Participant Costs 3 N/A N/A N/A
Total TRC Costs 4 N/A N/A N/A
NOTES: Per PUC direction, TRC inputs and calculations are required in the Annual Report only and should comply with the 2013 Total Resource Cost Test Order approved August 30, 2012.
1 Includes direct program administration and clerical costs, EDC program management, CSP program management and technical assistance. Excludes portfolio common costs. } Per the 2013 Total Resource Cost Test Order - Total EDC Costs, here, refer to EDC incurred expenses only. Total EDC Costs = Subtotal EDC Incentive Costs + Subtotal EDC Implementation Costs + EDC Evaluation Costs + SWE Audit Costs. 3 Per the 2013 Total Resource Cost Test Order -Net participant costs; in PA, the costs of the end-use customer. These will be calculated for the PY5 Final Annual Report. 4 Total TRC Costs = Total EDC Costs + Participant Costs. TRC Costs will be calculated for the PY6 Final Annual Report.
PPL Electric | Page 28

April 15, 2016 | Quarterly Report to the PA PUC - Program Year 7 Quarter 3
Table 4-12: Summary of Program Finances - Residential Retail
Quarter 3
($000) PYTD
($000) Phase II ($000)
EDC Incentives to Participants or Trade Allies
$2,097 $6,567 $14,177
Subtotal EDC Incentive Costs $2,097 $6,567 $14,177
Administration, Management and Technical Assistance1
$844 $3,336 $9,034
Design & Development $0 $0 $0
Marketing $0 $0 $0
Subtotal EDC Implementation Costs $844 $3,336 $9,034
EDC Evaluation Costs $0 $0 $0
SWE Audit Costs $0 $0 $0
Total EDC Costs2 $2,941 $9,903 $23,211
Participant Costs 3 N/A N/A N/A
Total TRC Costs 4 N/A N/A N/A
NOTES: Per PUC direction, TRC inputs and calculations are required in the Annuai Report only and should comply with the 2013 Total Resource Cost Test Order approved August 30, 2012.
1 Includes direct program administration and clerical costs, EDC program management, CSP program management and technical assistance. Excludes portfolio common costs. 1 Per the 2013 Total Resource Cost Test Order - Total EDC Costs, here, refer to EDC incurred expenses only. Total EDC Costs = Subtotal EDC Incentive Costs + Subtotal EDC Implementation Costs + EDC Evaluation Costs + SWE Audit Costs. 3 Per the 2013 Total Resource Cost Test Order -Net participant costs; in PA, the costs of the end-use customer. These wilt be calculated for the PY5 Final Annual Report. a Total TRC Costs = Total EDC Costs + Participant Costs. TRC Costs will be calculated for the PY6 Final Annual Report.
PPL Electric | Page 29

April 15, 2016 | Quarterly Report to the PA PUC - Program Year 7 Quarter 3
Table 4-13: Summary of Program Finances - School Benchmarking
Quarter 3 ($000)
PYTD ($000)
Phase II ($000)
EDC Incentives to Participants or
Trade Allies $o $0 $0
Subtotal EDC Incentive Costs $0 $o $0
Administration, Management and
Technical Assistance1 $14 $75 $353
Design & Development $0 $0 $0
Marketing $0 $0 $0
Subtotal EDC Implementation Costs $14 $75 $353
EDC Evaluation Costs $0 $0 $0
SWE Audit Costs $0 $0 $0
Total EDC Costs 2 $14 $75 $353
Participant Costs 3 N/A N/A N/A
Total TRC Costs 4 N/A N/A N/A
NOTES: Per PUC direction, TRC inputs ond calculations are required fn the Annual Report only and should comply with the 2013 Total Resource Cost Test Order approved August 30, 2012;
1 Includes direct program administration and clerical costs, EDC program management, CSP program management and technical assistance. Excludes portfoiio common costs. 2 Per the 2013 Total Resource Cost Test Order - Total EDC Costs, here, refer to EDC incurred expenses only. Total EDC Costs = Subtotal EDC Incentive Costs + Subtotal EDC Implementation Costs* EDC Evaluation Costs + SWE Audit.Costs, 3 Per the 2013 Total Resource Cost Test Order -Net participant costs; in PA, the costs of the end-use customer. These will be calculated forthe PY5 Final Annual Report. 1 Total TRC Costs = Total EDC Costs + Participant Costs, TRC Costswll be calculated forthe PY6 Final Annual Report.
PPL Electric | Page 30
April 15, 2016 | Quarterly Report to the PA PUC - Program Year 7 Quarter 3
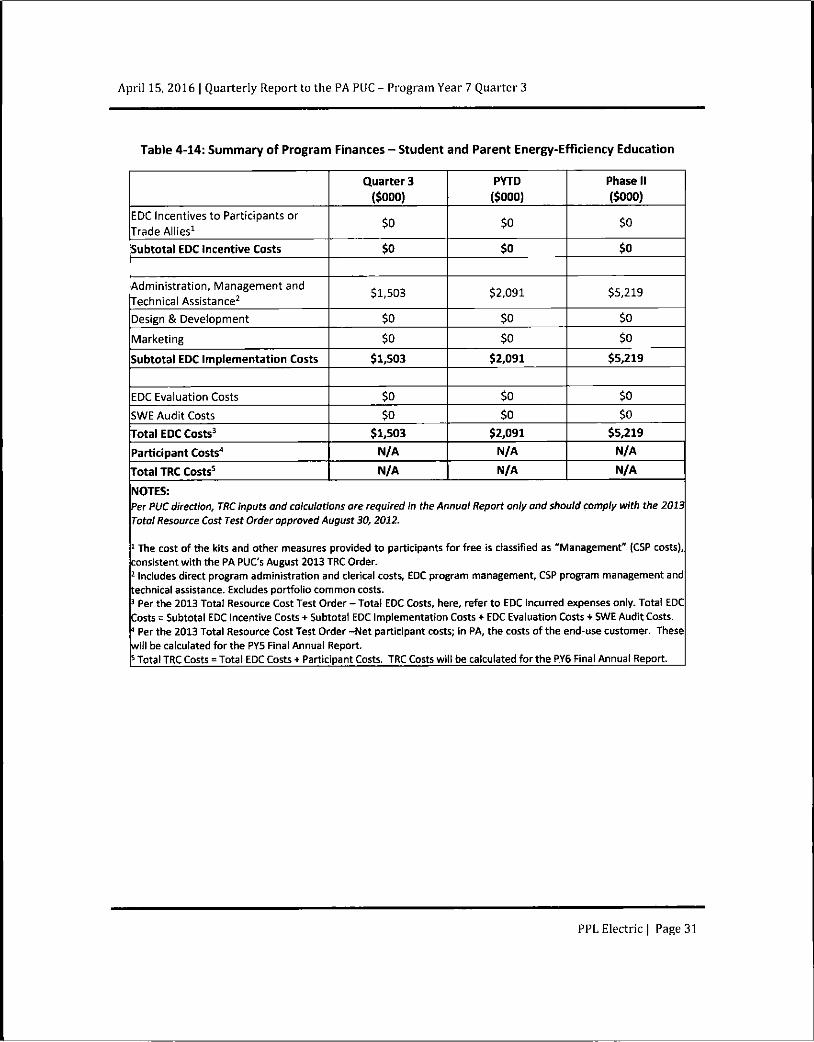
Table 4-14: Summary of Program Finances - Student and Parent Energy-Efficiency Education
Quarter 3 ($000)
PYTD ($000)
Phase II ($000)
EDC Incentives to Participants or
Trade Allies1 $0 $0 $0
Subtotal EDC Incentive Costs $0 $o $0
Administration, Management and Technical Assistance2
$1,503 $2,091 $5,219
Design & Development $0 $0 $0
Marketing $0 $0 $0
Subtotal EDC Implementation Costs $1,503 $2,091 $5,219
EDC Evaluation Costs $0 $0 $0
SWE Audit Costs $0 $0 $0
Total EDC Costs 3 $1,503 $2,091 $5,219
Participant Costs 4 N/A N/A N/A
Total TRC Costs 5 N/A N/A N/A
NOTES: Per PUC direction, TRC inputs and calculations are required in the Annual Report only and should comply with the 2013 Total Resource Cost Test Order approved August 30, 2012.
1 The cost of the kits and other measures provided to participants for free is classified as "Management" (CSP costs), consistent with the PA PUC's August 2013 TRC Order. 1 Includes direct program administration and clerical costs, EDC program management, CSP program management and technical assistance. Excludes portfolio common costs. 3 Per the 2013 Total Resource Cost Test Order - Total EDC Costs, here, refer to EDC incurred expenses only. Total EDC Costs = Subtotal EDC Incentive Costs + Subtotal EDC Implementation Costs + EDC Evaluation Costs + SWE Audit Costs. a Per the 2013 Total Resource Cost Test Order -Net participant costs; in PA, the costs of the end-use customer. These wiil be calculated for the PY5 Final Annual Report. 5 Total TRC Costs = Total EDC Costs + Participant Costs. TRC Costs will be calculated for the PY6 Final Annual Report.
PPL Electric | Page 31
April 15, 2016 | Quarterly Report to the PA PUC - Program Year 7 Quarter 3
Quarterly Report Terms
Verrfied Phase I CanyQvet
CatryOvur
PY5- PY6 Vad ied Savirgj
PY7 R«>0(K ! ) i 3VJ - iS
a-.-i'.i ^
FYS' PVE
P>7 P.i !pOrW!)i3,.P»*
Phase ll+CO Phase ll-a
Reirart'jrf Savings
'nc.Jd ng C-f f •. C.tjf Sa-. n g ; 'r::.-.i
F<epo(tcu • CO Sj-.ingt
: ed Zh't f C.-ir S-^.M^-i ircn
Rejioaeo * Veiit ieo • CO Savincs
Pr.a^e '' V = IJ*S aspen fl r - -cn 5 COEra-.i sFV£ - FVc Fis.'i&i.Gn
• " vei l ' M C^ i i t f i n ngs nciLcie • • C ^ n s M Ssvr.jjr nc'uO"
PPL Electric I Page 32

ORIGIN ID:ASEA PAUL E RUSSELL PPL CORPORATION 2 N9TH STREET
(610) 774-4254
ALLENTOWN, PA 18101 UNITED STAf ES US
SHIP DATE: 15APR16 ACTWGT. 1.00 LB CAD: 104308816/INET3730
BILL SENDER
TO ROSEMARY CHIAVETTA, SECRETARY PA PUBLIC UTILITY COMMISSION 400 NORTH ST COMMONWEALTH KEYSTONE BUILDING HARRISBURG PA 17120
(717) 772-7777 INV PO
REF.KM2058061CM-000
DEPT:
TRK# I 0201 7761 2017 7540
MON-18 APR10:30A PRIORITY OVERNIGHT
SH MDTA PA-US
17120 MDT
B
a.
a co JS D O >. q
"a a c c ra o O) •a c CO •a co 03
CD JD C CO
u ai x> iS
c g r a
u
2 ai o ° £ ~ — o c ™
•| Q. O X — i - (0
QJ? -D « o ™ o, XI c « c ra o £> a. — P- Q-^ c O © CO
5; « o ^ 3 u. a
4)
s
3 l2
2 E
in
T3 o O
s.« 5 2.w * r
3 ° i as.« CO >
n CO L-
S o ^ iS o =
s s\sii
£ 1 « gZ-o g
. ^ * i * ; r a a ) a ) ^
, - » ; »v w w «;
3 * ^ aj - n fl i _ T3
^ " o S J , J 5 > o o - ! 5 £
U- o ^ E 0) « raw
TR = 0)
y> „- s: o o rj =;
E s & * 8 ft w-* Z 5 fli € E - ra u ^ ra © a,
ojo s te" ra-c cn -B
.9 w ro o
03 —
o 3 x a-O 0 "
o £ ^ t H-- + - o -
"O O O ^ - n
-° 03 *= •§ C
O <D — -
P j i ra « m" S ^ E
^ -O O tn ra o ra F in H .!=
E ra _ - -
rsi n S c 5 ' 5 E £ o - l £ o c : — i > C O * t ; t 5 - 7 E