Kim Shannon Visit at Ivey Business School at Western ... · Ivey Business School at Western...
35
March 4, 2015 Kim Shannon Visit at Ivey Business School at Western University
Transcript of Kim Shannon Visit at Ivey Business School at Western ... · Ivey Business School at Western...

Presented by:
March 4, 2015
Kim Shannon Visit at Ivey Business School at Western University

We Have a Tendency to Excess
Source: Baltimore Sun, October 7, 1989Provided for illustrative purposes only.

Investing can be Emotional…
Source: LCM Perspectives, September 15, 1997Provided for illustrative purposes only.

Market Action is Typically More Volatile than Underlying Economic Activity
Real S&P price vs. perfect foresight fair value:*1882–2005
*Schiller Model as of 12/31/05Source: GMO, Standard & Poor’s, Federal Reserve. The above returns do not represent the performance of any product or security managed by Sionna and are provided for illustrative purposes only. The performance presented represents historical performance of an unmanaged index. Returns would have been lower if they were subject to management fees and trading expenses. Past performance is not an indicator of future results. The indices are unmanaged and have no fees. One cannot invest directly in an Index.
S&P Real Price
GDP
Fair Value
Year

Stock market is not highly correlated to earnings
Source: Robert Shiller

Stock Market Modestly Correlated to Interest Rates
Source: Robert Shiller
Historical correlation between earnings growth & interest rates is 43%

The Stock Market has not been Highly Correlated to Economic Growth
No Strong Correlation Between Long-Term GDP Growth and Equity Returns
Source: The Bank Credit Analyst as at November 2012. Provided for illustrative purposes only.

Investment Returns have been more about Dividends than Capital Gains
Source : Arnott & Bernstein, FAJ, March/April 2002. The above returns do not represent the performance of any product or security managed by Sionna and are provided for illustrative purposes only. The performance presented represents historical performance of an unmanaged index. Returns would have been lower if they were subject to management fees and trading expenses. Past performance is not an indicator of future results. The indices are unmanaged and have no fees. One cannot invest directly in an Index.
700,000,000
37,000,000
2,099
U.S.Dollars(logscale)
Year

Source: Plexus Asset Management (based on data from Prof Robert Shiller and I-Net Bridge). As at September 30, 2012. The above returns do not represent the performance of any product or security managed by Sionna and are provided for illustrative purposes only. The performance presented represents historical performance of an unmanaged index. Returns would have been lower if they were subject to management fees and trading expenses. Past performance is not an indicator of future results. The indices are unmanaged and have no fees. One cannot invest directly in an Index.
The Price of Entry Determines Returns
10-Yr Forward Real Returns Based on S&P 500 P/E Ratios from 1871–2012

High Prices Lead to Lower Long-Term Returns
Real Cumulative Annual Total Rate of Return if Invested in 1966
-9.6
%
0.7%
2.4%
-1.9
% -1.1
% 0.7%
2.5%
-1.2
%
-4.8
%
-1.8
%
-1.1
%
-2.4
%
-1.7
%
-1.4
% -0.5
%
-1.4
% 0.0% 1.
0% 1.9%
3.1%
2.6% 3.
1% 3.6%
3.2% 4.
1%
4.1% 4.3%
4.1% 4.
9% 5.4% 6.
0% 6.7% 6.8%
6.4%
5.7%
4.8% 5.
4%
5.3%
5.3%
0.8%
-12.0%
-10.0%
-8.0%
-6.0%
-4.0%
-2.0%
0.0%
2.0%
4.0%
6.0%
8.0%
1966
1967
1968
1969
1970
1971
1972
1973
1974
1975
1976
1977
1978
1979
1980
1981
1982
1983
1984
1985
1986
1987
1988
1989
1990
1991
1992
1993
1994
1995
1996
1997
1998
1999
2000
2001
2002
2003
2004
2005
2006
Year
Source: Vitaliy N. Katsenelson “Active Value Investing – Making Money in Range Bound Markets”, 2007

Advantage of Relative Value

• Intrinsic Value Model
700-750Stock
Universe
Book ValueHistorical ROERelative P/E
IntrinsicValue
ExpectedReturn
70 − 140Stock
ResearchUniverse
• Screen on multiple metrics• Cash flow, NAV, ROIC
• Industry conferences• Management meetings• Bi-monthly portfolio review meetings
Idea Generation

Decision-Making Process

In-Depth Analysis
Assessing the Quality of a Business
For illustrative purposes only.
• Fundamental Analysis
• Corporate Interviews
• Structured ResearchReports
Quantitative
40Stock
Portfolio
70−140StockResearchUniverse

Research Questionnaire: Internal Research and Management Interviews
Idea Evaluation
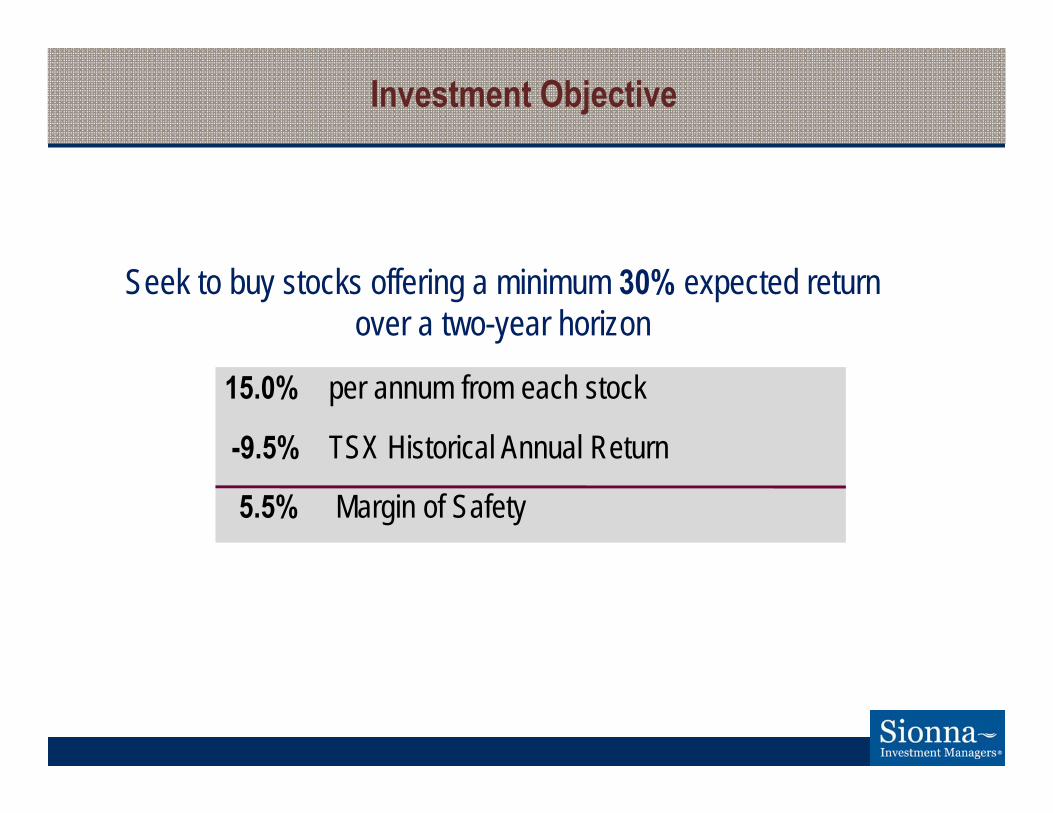
Investment Objective
Seek to buy stocks offering a minimum 30% expected return over a two-year horizon
15.0% per annum from each stock
-9.5% TSX Historical Annual Return
5.5% Margin of Safety

M T W T F M T W T F M T W T F M T W T F
Morning MeetingsResearch MeetingsPortfolio Reviews
Working Together to Manage the Portfolio

Most Decisions are Made Through Consensus
Investment decisions are made by the respective portfolio manager with input from the team
Benefits:
• Leverages team’s depth and experience• Provides an effective training tool as all team members form an opinion, present their idea, and receive feedback
Ow
ners
hip
of D
ecis
ion

Fundamental Risk ManagementGood fundamental analysis decreases security risk
Bottom-up selection of solid businesses:– Favour consistent, predictable earnings– Avoid stocks with financial risk and aggressive accounting
Ensure stocks have attractive valuation: – Strong fundamentals: low P/E, P/B, P/CF, P/S– Prefer above-average dividends
Focus on portfolio construction: – Broadly diversified, 35-55 names, sector neutral– Incremental trading limits emotion
Portfolio impact:– Below market standard deviation– Consistent down-market protection

World’s largest dealer of Caterpillar equipment, with exclusive dealership territories in oil and mining regions such as Alberta and Chile. Generates revenue from new equipment sales, used equipment sales, parts and service, and equipment rental.
Investment Thesis• Stable and recurring parts and service represents almost 50% of revenue• Historically has had poor capital allocation and operational management – this creates
large potential for improvement • New CEO has articulated a clear strategy to improve return on invested capital, which
should increase free cash flow generation• Currently out of favour due to recent capital expenditure reductions in the mining industry
Attractive Valuation
• Price-to-earnings (12-month trailing) 14.3x• Price-to-earnings (10-year average) 19x• Price-to-cash flow 6.6x
As at December 31, 2014
Example: Finning International

An overlooked, high-quality real estate investment company
Company’s Strengths• Attractive portfolio of assets• Management is conservative and value-oriented
Overlooked Stock
• Small float (CEO owns 52% of the company) • Real estate company with a modest yield (0.5%)• Its value comes from three different sources – therefore challenging to analyze• Ignored stock - covered by few sell-side analysts
Attractive Financials
• Stock is trading at a significant discount to intrinsic value• Price-to-book 0.7x• Price-to-NAV 0.6x• Price-to-cash flow 14x
As at December 31, 2014
Example: Morguard Corporation

Canada’s largest diversified mining company and the largest producer of metallurgical coal, copper and zinc.
Investment Thesis• Current valuation implies significant discount to intrinsic value• Metallurgical coal prices at marginal cost, while copper and zinc prices trading near
marginal cost• Commodity prices likely to be weak in short term, but long term fundamentals are attractive
Attractive Valuation
• Price-to-book 0.5x• Dividend yield 5.7%• Debt-to-capital 29.0%
As at December 31, 2014
Teck Resources

0.0
0.5
1.0
1.5
2.0
2.5
3.0
3.5
4.0
4.5
5.0
5.5
6.0
1979 1981 1983 1985 1987 1989 1991 1993 1995 1997 1999 2001 2003 2005 2007 2009 2011 2013 2015
S&P/TSX Energy Sector ‐ Price‐to‐Book
Source: TD Securities
Energy Sector Trading Near Historic Lows

Oil Prices Trading Well Below Long-Term Marginal Cost of Production

Range-Bound Markets are Typical
U.S. Stock Market
Source: Wells Capital Management
• Markets have been range-bound 109 of the last 144 years
• Secular bull runs are a rarity; not the norm
• After major bull markets, markets trend sideways for a minimum of 15 years

0
10
20
30
40
50
60
70
80
90
100
1.5
2
2.5
3
3.5
4
4.5
1950 1955 1960 1965 1970 1975 1980 1985 1990 1995 2000 2005
Dow Jo
nes Ind
ustrial Ind
ex (P
E)
CRB Spot In
dex & Dow
Jone
s Ind
ustrial Ind
ex
(Log
Inde
x)
CRB Spot IndexDow Jones Industrial IndexDow Jones Industrial Index PE Ratio
• Sideways Markets end with single digit P/Es
• S&P/TSX at 19.2 P/E Trailing*
• S&P 500 at 16.8 P/E Trailing*
Source: Rathbones’ Investment Strategy, February 2008As at December 31, 2014. Indices are unmanaged and cannot be directly invested into.
Commodities & Resource Heavy Indices

As at December 31, 2014
4000
6000
8000
10000
12000
14000
16000
18000
Dec‐99 Dec‐00 Dec‐01 Dec‐02 Dec‐03 Dec‐04 Dec‐05 Dec‐06 Dec‐07 Dec‐08 Dec‐09 Dec‐10 Dec‐11 Dec‐12 Dec‐13 Dec‐14
+164.7% ‐49.8%
+87.8%
+6.2% ‐13.9% ‐14.0% +12.5% +21.9 +14.5% ‐35.0% +30.7%
‐50.0%
+24.3% +7.2% +14.4% ‐11.1%
‐20.6%
+4.0% +8.6%
+38.8%
‐6.5%
+7.4%
Date Index P/E (x) P/B (x) P/S (x) Yield (%)Sep-00 11,388 33.7 3.2 2.0 0.8Jan-06 11,388 19.1 2.7 1.6 1.9Jul-10 11,388 17.6 1.8 1.6 2.8
May-12 11,388 13.2 1.7 1.5 3.0Dect-14 14,632 19.4 1.9 1.7 2.9
Source: Bloomberg as at December 31, 2014. The above returns do not represent the performance of any product or security managed by Sionna and are provided for illustrative purposes only. The performance presented represents historical performance of an unmanaged index. Returns would have been lower if they were subject to management fees and trading expenses. Past performance is not an indicator of future results. The indices are unmanaged and have no fees. One cannot invest directly in an Index.
Range-bound TSX Progress

Learn to Love 6%
3 Sources of Total Equity Returns
Source: Vitaliy N. Katsenelson “Active Value Investing – Making Money in Range Bound Markets”, 2007. For illustrative purposes only
Earnings Growth + Change in P/E Multiple + Dividend Yield Bear Market1929–1932
Range-Bound Markets*
AverageBull Markets†
AverageEarnings Growth -28.1 5.6 5.6+/- P/E Growth -12.5 -4.6 7.0= Stock Return -37.1 0.7 13.0+ Dividend 7.1 5.3 3.7Total Return -32.6 5.9 17.1Inflation/Deflation -8.4 4.9 2.5Total Real Return -26.4 1.0 14.2
*Range-Bound Markets: 1906–1924, 1937–1950, 1966–1982†Bull Markets: 1950–1966, 1982–2000Dividends have constituted 90% of total returns in range-bound marketsValues in chart shown in percent

January 1, 2000 – December 31, 2014
IndexTotal Annualized Returns
C$ US$
S&P/TSX Composite Index (Index peak—current)* 4.22% 5.96%
S&P 500 Index (Index peak—current)** 3.11% 4.67%
Source: Bloomberg*S&P/TSX Composite Index (September 1, 2000–December 31, 2014)**S&P 500 Index (March 24, 2000–December 31, 2014)Indices are unmanaged and cannot be directly invested into.
Canada Has Outperformed U.S. During Sideways Market

Asset Classes & Secular Trends
Monthly Data 1900-01-31 to 2013-11-30 (Log Scale)Source: Ned Davis Research Group
Interest Rate Changes Will Signal Equity Bull Market

Debt Induced Panic Years and Long –Term Government Bond Yields
1. Average low level of interest rates after panic
2.0%
2. Average number of years after panic to lowest level of interest rates
13.7 yrs
3. Average level of interest rates after panic 2.5%
4. Change from low level of interest rates to 20th year
0.5%
After excessive debt panic years:• Reduces GDP Growth, slows inflation and lowers long term interest rates
Excessive Debt Leads to Extended Periods of Low Interest Rates

“Divide your fortune into four equal parts: stocks, real estate, bonds and gold coins. Be prepared to lose on one of them most of the time. During inflation, you will lose on bonds and win on gold and real estate : during deflation, you lose on real estate and win on bonds, while your stocks will see you through both periods, though in a mixed fashion. Whenever performance differences cause a major imbalance, rebalance your fortunes back to the four equal parts.”
Jacob Fugger the Rich1459-1525
The Original Value Investor…500 year old advice

Source: Chief Investment Officer – The Missing Women of Asset Management, June 20, 2014
The Percentage of Females in Senior Roles Across Professions

Discovering Your Intrinsic Value
1. Early Career– Building Technical Expertise, Becoming an Expert– Educate, Passion, Work, Network, Volunteer, Save Money $$
2. Mid Career– Manager, Build Industry Strategic View, Know Where the Industry is Heading and Have Advice on
How Best to Navigate That Future– Aim to Be in Top 20%, Volunteer in Leadership Roles, Develop Personal Brand
3. Mature Career– Leadership – Focus on “Best In Class” Globally and What Does It Take To Get There– Financial Independence– Help Others Succeed– Leave a Legacy

To Participate:The contest is open to all undergraduate students across Canada (excluding Quebec).
To learn more please visit: http://www.sionna.ca/the-2015-sionna-investment-research-competition/
The 2015 Sionna Investment Research Competition