Kiefner & Associates, Inc. · unless the pipeline is caused to move longitudinally or laterally by...
70
Kiefner & Associates, Inc. 585 Scherers Court Phone (614) 888-8220 Worthington, Ohio 43085 www.kiefner.com Fax (614) 888-7323 May 1, 2007 Mr. Zach Barrett 4600 NE 88 th Street Oklahoma City, OK 73131 Dear Mr. Barrett, Enclosed are five copies of our final report “EVALUATING THE STABILITY OF MANUFACTURING AND CONSTRUCTION DEFECTS IN NATURAL GAS PIPELINES.” If you need anything further, please call. Sincerely, Dr. John F. Kiefner, P.E. Senior Advisor JFK:ts Enclosures
Transcript of Kiefner & Associates, Inc. · unless the pipeline is caused to move longitudinally or laterally by...

Kiefner & Associates, Inc.
585 Scherers Court Phone (614) 888-8220 Worthington, Ohio 43085 www.kiefner.com Fax (614) 888-7323
May 1, 2007 Mr. Zach Barrett 4600 NE 88th Street Oklahoma City, OK 73131 Dear Mr. Barrett, Enclosed are five copies of our final report “EVALUATING THE STABILITY OF MANUFACTURING AND CONSTRUCTION DEFECTS IN NATURAL GAS PIPELINES.” If you need anything further, please call. Sincerely, Dr. John F. Kiefner, P.E. Senior Advisor JFK:ts Enclosures

05-12R
EVALUATING THE STABILITY OF
MANUFACTURING AND CONSTRUCTION DEFECTS IN NATURAL GAS PIPELINES

Final Report No. 05-12R
FINAL REPORT
on
EVALUATING THE STABILITY OF MANUFACTURING AND CONSTRUCTION DEFECTS IN NATURAL GAS PIPELINES
to
U.S. DEPARTMENT OF TRANSPORTATION OFFICE OF PIPELINE SAFETY (Contract No. DTFAAC05P02120)
April 26, 2007
by
John F. Kiefner With the Assistance of the Interstate Natural Gas Association of America (INGAA)
KIEFNER AND ASSOCIATES, INC.
585 Scherers Court Worthington, Ohio 43085
0339-0501 0279-0501

ACKNOWLEDGEMENT
The author is grateful for the advice and assistance provided by Mark Hereth, David
Johnson, and other reviewers on behalf of the Interstate Natural Gas Association of America
(INGAA) in reviewing and enhancing this document to assure consistency with industry codes
and standards. While the scope of preparing the document initially was covered by funding
under U.S. DOT Contract No. DTFAAC05P02120 to provide integrity management training for
federal and state pipeline safety inspectors, the additional work required to align the document
with industry codes and standards was funded by the INGAA Foundation.
i

TABLE OF CONTENTS Page
INTRODUCTION ...........................................................................................................................1 WHAT ARE MANUFACTURING AND CONSTRUCTION DEFECTS?...................................2 Terminology.....................................................................................................................................2 Defects that Arise During the Making of Steel and/or the Manufacture of Line Pipe ....................4 Defects that Arise During Handling and Transporting of Pipe........................................................8 Defects that Arise During Fabrication and Construction of a Pipeline and Pipeline Attributes that Require Special Consideration..................................................................................................8 PUTTING MANUFACTURING AND CONSTRUCTION DEFECTS INTO PERSPECTIVE.12 Reportable Incidents Attributed to Manufacturing Defects...........................................................14 Reportable Incidents Attributed to Construction Defects..............................................................16 Perspective on Manufacturing and Construction Defects..............................................................17 WHAT IS DEFECT STABILITY? ...............................................................................................17 FACTORS THAT AFFECT THE STABILITY OF MANUFACTURING AND CONSTRUC- TION DEFECTS............................................................................................................................21 QUASI-STABLE DUCTILE TEARING ......................................................................................22 PRESSURE-CYCLE-INDUCED FATIGUE................................................................................24 PRESSURE REVERSALS............................................................................................................29 SUMMARY OF STABILITY CONSIDERATIONS ...................................................................36 CRITERIA FOR EVALUATING ASSURANCE OF STABILITY OF MANUFACTURING AND CONSTRUCTION DEFECTS.............................................................................................37 M Charts for Determining Stability of Manufacturing Defects.....................................................37 C Charts for Determining Stability of Construction Defects.........................................................42 EXAMPLES ..................................................................................................................................43
ii

Table of Contents (Continued) Page
REFERENCES ..............................................................................................................................47 APPENDIX A. Typical Manufacturing and Construction Defects ........................................... A-1 APPENDIX B. M and C Charts..................................................................................................B-1
Tables
Table 1. Manufacturers’ Minimum Hydrostatic Tests for API 5L Line Pipe Manufactured Prior to 1942 .....................................................................................................................5 Table 2. Manufacturers’ Minimum Hydrostatic Tests for API 5L Line Pipe Manufactured after 1941 .........................................................................................................................6 Table 3. Threats that Might Interact with Manufacturing Defects .................................................7 Table 4. Threats that Might Interact with Construction Defects or Specific Pipeline Features Such as Wrinkle Bends or Mechanical Couplings..........................................................12 Table 5. Reportable Incidents by Cause .......................................................................................14
Table 6. Comparison of Times to Failure from Pressure-Cycle-Induced Fatigue for Various Proof Test Levels ............................................................................................................28 Table 7. Likelihood of a Service Failure from a Pressure Reversal when Pressurizing from Zero after Various Levels of Proof Test..................................................................................34
Figures
Figure 1. The Concept of Defect Stability ....................................................................................19 Figure 2. Frequency Distribution of Pressure Reversals ..............................................................31
iii
1
EVALUATING THE STABILITY OF MANUFACTURING AND CONSTRUCTION DEFECTS IN NATURAL GAS PIPELINES
by
John F. Kiefner
INTRODUCTION
This report presents guidelines for evaluating integrity-management plans of natural gas
pipeline operators with respect to managing the risk posed by pipe manufacturing and pipeline
construction threats. These threats may arise from defects created during manufacturing of line
pipe or the construction of pipelines. Generally, such defects are not a threat to pipeline safety as
long as they remain stable and do not grow larger in service.
Service operating environments, particularly fluctuating operating pressures and/or
pressurizations beyond a long-standing actual MOP*, could adversely affect the stability of
manufacturing defects causing them to grow to failure. One factor that assures the stability of
such defects is the performance of a pre-service hydrostatic test to a sufficiently high margin
above the maximum operating pressure followed by operation of the pipeline in a manner such
that the maximum operating pressure is never exceeded. Experience shows that a test-pressure-
to-operating-pressure ratio of 1.25 provides adequate assurance of stability(1,2)†. Additionally, as
shown in this document, the assurance of stability demonstrated by a test-pressure-to-operating-
pressure ratio of 1.25 or more is valid for the conceivable life of most gas pipelines. For
pipelines that have not been tested to such levels or for pipelines that have been tested to such
levels but have experienced subsequent in-service pressure excursions exceeding the MAOP
established by the test, assurance of stability may still exist, but the circumstances of each
* MOP, is the maximum operating pressure experienced by the pipeline based on historical experience. For managing manufacturing and construction threats, ASME B31.8S recommends that an operator establish an MOP based on the highest pressure observed during the 5 years of operation prior to identification of the segment as a high-consequence area. The period was adopted by the standard writers as it was analogous to the 5-year period established as an option for establishing a Maximum Allowable Operating Pressure (MAOP) in 49 CFR 619. The MOP may be equivalent to the MAOP. The term MOP was adopted to address circumstances where the pipeline had been operated below the MAOP. † Numbers in parentheses refer to references in the section entitled “REFERENCES”.

2
individual case need to be taken into account in judging whether or not confidence in the stability
of manufacturing defects is justified.
The stability of construction defects is largely controlled by longitudinal stress (or strain)
rather than by hoop stress (i.e., internal pressure). Accordingly, construction defects seldom
cause failures in pipelines buried in stable soils where little or no longitudinal or lateral
movement can take place. In addition, the application of a hydrostatic test to a pipeline has little
or no beneficial effect on the stability of construction defects because the hydrostatic test may
cause no increase in strain on the defects. Construction defects tend to remain stable in service
unless the pipeline is caused to move longitudinally or laterally by settlement, landslides,
earthquakes, or other soil-movement phenomena.
Appropriate guidelines are presented herein to assist inspectors in judging whether or not
stability of manufacturing and construction defects is adequately assured in a given specific set
of circumstances. Because of the relatively more aggressive pressure cycles that typically occur
in liquid petroleum pipelines as compared to natural gas pipelines, these guidelines should only
be applied to natural gas pipelines and not to liquid petroleum pipelines.
WHAT ARE MANUFACTURING AND CONSTRUCTION DEFECTS?
Terminology
The scope of this document is to provide guidelines for determining whether or not an
operator’s integrity management plan adequately addresses the likelihood and consequences (i.e.,
risk) of failure from manufacturing and construction defects. In this context, some definitions of
the term “defect” are appropriate and some are not. In particular, the definitions given in some
industry standards do not by themselves work well in the context of this document. Consider the
following:
• ASME B31.8S-2004
Defect: “Imperfection of a type and magnitude exceeding acceptable criteria”.
• API Specification 5L, 43rd Edition, March 2004.
Defect: “An imperfection of sufficient magnitude to warrant rejection of the product based on the stipulations of this specification”.

3
Imperfection: “A discontinuity or irregularity in the product detected by methods
outlined in this specification”.
• API Standard on Imperfection Technology, Tenth Edition, November 1996.
Imperfection: “Metallurgical and other features of steel pipe products, which may or may not be injurious to the use of the product”.
• Integrity Characteristics of Vintage Pipelines (Reference 3).
Anomaly: “Any deviation in the properties of the engineered product, typically found by nondestructive inspection. (The term indication is sometimes used in place of anomaly)”. Flaw: “A deviation in the properties of the engineered product that is outside of the engineering specifications for the type of service anticipated”.
Imperfection: “A flaw that an analysis shows does not lower the failure pressure below the specified minimum yield pressure or limit functionality of the engineered product”. Defect: “A flaw that an analysis shows could reduce the failure pressure to below the specified yield pressure or limit the functionality of the engineered product”.
• 49 CFR Part 192, Paragraph 192.917(e)(3) Manufacturing and construction defects. “An operator may consider manufacturing and construction defects to be stable defects if the operating pressure on the covered segment has not increased over the maximum operating pressure experienced during the five years preceding identification of the high consequence area”.
It should be reasonably clear that the terminology relevant to this document must consider
stability of manufacturing and construction defects. Therefore, throughout this document the
terms manufacturing defect and construction defect will be meant to encompass anomalies,
indications, imperfections, flaws, or defects as defined by any of the above documents to the
extent that the anomalies, indications, imperfections, flaws, or defects are known to be of
manufacturing or construction origin. Moreover, the term “stable defect” will be taken to mean
one that never threatens the integrity of a pipeline within a predictable time period. The essential
characteristic of a stable manufacturing defect is that its failure stress level will always exceed
the maximum hoop stress level applied to the pipeline at any time during the predictable time
period. Similarly the essential characteristic of a stable construction defect is that its failure
strain level will always exceed the maximum longitudinal strain level applied to the pipeline at

4
any time during the predictable time period. With these definitions one can expect that an
integrity assessment for manufacturing and construction defects will not be necessary within the
time period for which stability has been demonstrated, and conversely, that an integrity
assessment will be necessary at the end of the period of demonstrated stability. OPS personnel
auditing an operator’s integrity-management plan need to focus on the time periods for which
stability of manufacturing and construction defects has been demonstrated, recognizing that for
the vast majority of natural gas pipelines in the U.S., the time period may be for the conceivable
useful life of the pipeline. In other words, it is entirely possible in most circumstances to
demonstrate that manufacturing and construction defects are stable and will remain so
indefinitely. Typical circumstances for which stability is essentially assured for the conceivable
useful life of the pipeline are described herein, and it should be reasonably clear that only
infrequently will this not be the case.
Defects that Arise During the Making of Steel and/or the Manufacture of Line Pipe
Defects that arise during the making of steel and/or the manufacture of line pipe fall into
certain well-recognized categories that are defined in widely recognized line-pipe standards such
as API Specification 5L and API Standard 5T1. The most important and most significant of
these are listed in Table A1 of Appendix A. These include the typical seam defects in pipes
made with furnace lapwelded seams, ERW seams, flash-welded seams, or DSAW seams,
although experience indicates that most of the problems have been with the older materials,
particularly with low-frequency-welded ERW seams and furnace lapwelded seams. One may
also wish to consult other documents such as References 3 and 4, but the types and descriptions
of manufacturing defects in these latter documents do not differ significantly for those shown in
Table A1.
Typically, the worst manufacturing defects are screened out by the mill hydrostatic test
up to pressure levels approaching that of the particular mill test pressure employed. Even though
the mill test is of short duration (5 or 10 seconds in most cases), it is an effective screening tool
to the level of pressure employed. Seamless pipe and the pipe body of seam-welded pipe may
also contain defects, though instances of failures from such defects are far less frequent than the
failures from seam defects in the older pipe materials. As in the case of seam defects, the mill

5
test can be an effective screening technique for pipe-body defects. With the advent of better
materials and the application of nondestructive inspection techniques by manufacturers in the
period after about 1970, the incidences of failures in pre-service hydrostatic tests have all but
disappeared(5). For the purpose of supporting criteria to evaluate the assurance of stability of
manufacturing defects, particularly in pipelines comprised of older (pre-1970) materials, the
following tables show the minimum API Specification 5L mill test pressures required for various
sizes, types, and grades of line pipe at various points in time.
Table 1. Manufacturers' Minimum Hydrostatic Tests for API 5L
Line Pipe Manufactured Prior to 1942
Type and Grade of
Pipe
Year of Manufacture
Yield
Strength, psi
MinimumMill Test Pressure, % SMYS
Seamless, Grade A 1928, 1931 30,000 46.6 Seamless, Grade B 1928, 1929 40,000 45 Seamless, Grade C 1928, 1931 45,000 40
Lap-welded 1928 - 1941 25,000 56 Lap-welded 1928 - 1941 28,000 50 Lap-welded 1928 - 1941 30,000 46.6
Seamless, Grade B 1930, 1931 38,000 47.4 Seamless or Electric Welded, Grade A 1932 - 1941 30,000 46.6 Seamless or Electric Welded, Grade B 1932 - 1941 35,000 45.7 Seamless or Electric Welded Grade C 1932 - 1941 45,000 40

6
Table 2. Manufacturers' Minimum Hydrostatic Tests for API 5L Line Pipe Manufactured After 1941
One thing that must be remembered is that the stability of manufacturing defects could be
affected by interacting risks. Those that stand out in this regard are summarized in Table 3, and
they included ERW or flash-weld bondline cold welds that may be aggravated by selective seam
corrosion or movement of the pipeline leading to buckling, laminations in the body of the pipe,
hard spots in the body of the pipe, and hard heat-affected zones of certain older ERW-seam
materials. As will be discussed in the section of this report entitled Putting Manufacturing and
Construction Defects Into Perspective, manufacturing defects do not account for a large portion
of “reportable” pipeline incidents. Moreover, of the cases where manufacturing defects were
involved, some were associated with interacting threats. Four of the 18 cases of failures
attributed to defects in the body of the pipe, for example, involved hydrogen-embrittlement
cracking of hard spots. These and other hypothetical interaction situations (none of which
appeared to have caused reportable incidents during the 16-year period addressed in Reference 6)
are discussed in detail below.
Type and Grade of
Pipe
Diameter, inches
Year of Manufacture
Standard Mill Test Pressure, % SMYS
Lap-welded Steel Pipe all 1942 -1962 60 Grades A and B all - 1982 60 Grades A and B 2⅜ and larger 1983-present 60
Grade C (45,000 psi) all 1942 - 1954 60 X Grades, all types all 1949-1952 85 X Grades, all types < 8⅝ 1953-1961 75
X Grades, all types 4½ 1962-1969 60 X Grades, all types 4½ and smaller 1969-1982 60 X Grades, all types 59/16 and smaller 1983-present 60 X Grades, all types 6⅝ - 8⅝ 1962-1999 75 X Grades, all types 10¾ and larger 1953-1955 85 X Grades, all types 10¾ - 18 1956-1999 85 X Grades, all types 8⅝ - 18 2000 to present 85 X Grades, all types 20 and larger 1956 to present 90
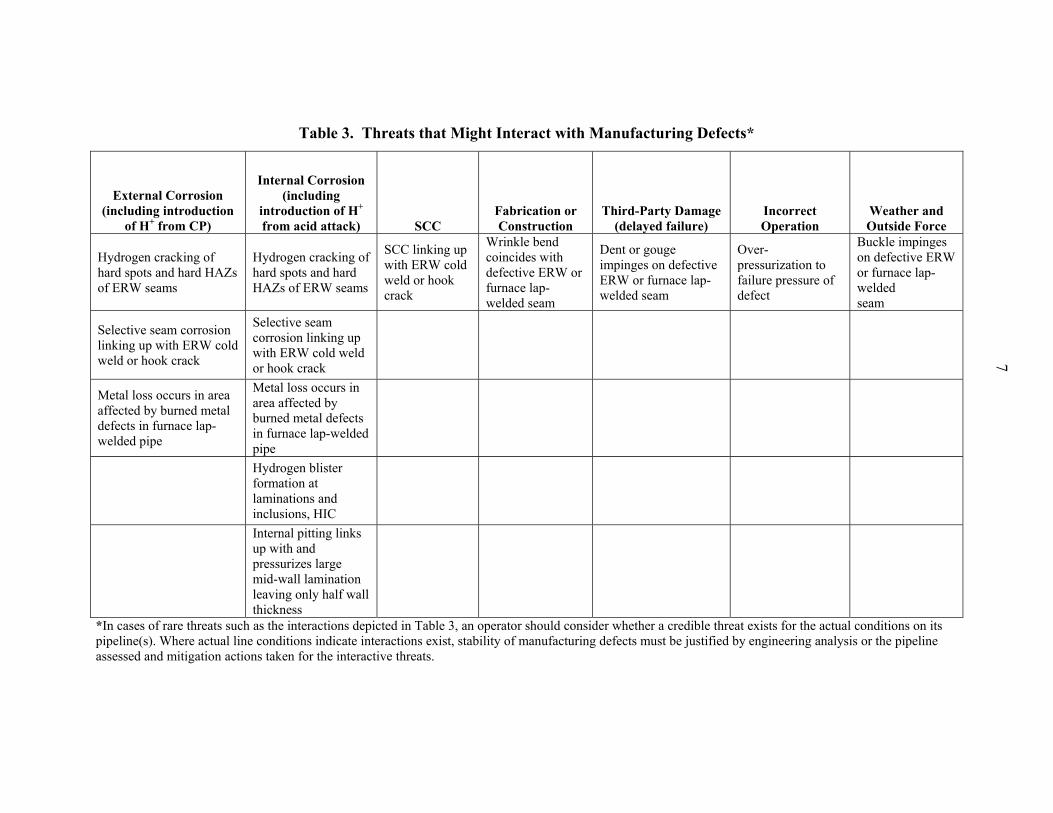
Table 3. Threats that Might Interact with Manufacturing Defects*
External Corrosion (including introduction
of H+ from CP)
Internal Corrosion (including
introduction of H+ from acid attack) SCC
Fabrication or Construction
Third-Party Damage (delayed failure)
Incorrect Operation
Weather and Outside Force
Hydrogen cracking of hard spots and hard HAZs of ERW seams
Hydrogen cracking of hard spots and hard HAZs of ERW seams
SCC linking up with ERW cold weld or hook crack
Wrinkle bend coincides with defective ERW or furnace lap-welded seam
Dent or gouge impinges on defective ERW or furnace lap-welded seam
Over-pressurization to failure pressure of defect
Buckle impinges on defective ERW or furnace lap-welded seam
Selective seam corrosion linking up with ERW cold weld or hook crack
Selective seam corrosion linking up with ERW cold weld or hook crack
Metal loss occurs in area affected by burned metal defects in furnace lap-welded pipe
Metal loss occurs in area affected by burned metal defects in furnace lap-welded pipe
Hydrogen blister formation at laminations and inclusions, HIC
Internal pitting links up with and pressurizes large mid-wall lamination leaving only half wall thickness
*In cases of rare threats such as the interactions depicted in Table 3, an operator should consider whether a credible threat exists for the actual conditions on its pipeline(s). Where actual line conditions indicate interactions exist, stability of manufacturing defects must be justified by engineering analysis or the pipeline assessed and mitigation actions taken for the interactive threats.
7

8
Defects that Arise During Handling and Transporting of Pipe
Once the pipe leaves the pipe mill, it is subject to damage during transportation and
handling before it is finally placed along side the ditch on a pipeline construction spread.
Defects that have been known to arise during this period include "railroad fatigue" and gouges
and dents from improper handling. One can safely assume that a prudent operator would reject
any mechanically damaged material upon receipt, because the associated gouges and dents could
be easily spotted by a competent inspector. By contrast, railroad fatigue is characterized by
fatigue cracks invisible to the naked eye. Fortunately, no known service failure has occurred in a
gas pipeline in the U.S. as the result of railroad fatigue. The known instances of service failures
from railroad fatigue as a root cause are associated solely with liquid petroleum pipelines, and in
all such cases, the initial railroad fatigue cracks were too small to fail in the initial pre-service
hydrostatic test. The service failures that have occurred resulted from substantial enlargement of
the initial railroad fatigue cracks by aggressive service pressure cycles associated with the liquid
pipeline operations. A good description of one such failure is given is Reference 7. In that
particular case as in most such instances, the initial railroad fatigue crack was created by
improper loading of relatively high-D/t, DSAW pipe on a rail car. (The known cases of this type
of failure have involved D/t ratios in excess of 100. The D/t of the pipe involved in the case
documented in Reference 8 was 109, for example.) These types of cracks appear to form only
when the crown of a DSAW seam rests on a support on the rail car. Placing a DSAW pipe in
such a position on a support is prohibited by API Recommended Practice 5L1, Recommend
Practice for Railroad Transportation of Line Pipe.
Given the likelihood that no prudent operator would install obviously dented or gouged
pipe and the fact that no railroad fatigue cracks have caused service failures in gas pipelines, it
seems reasonable to conclude that defects arising during the transportation and handling of the
pipe are not likely to cause failures during the life of the pipeline.
Defects that Arise During Fabrication and Construction of a Pipeline and Pipeline Attributes that Require Special Consideration
Gouges and dents can be introduced during construction and if a pipeline containing such
defects is not subjected to a pre-service proof test, they cannot be considered stable defects.
Such defects could have failure pressures within the range of operating pressures, and only those
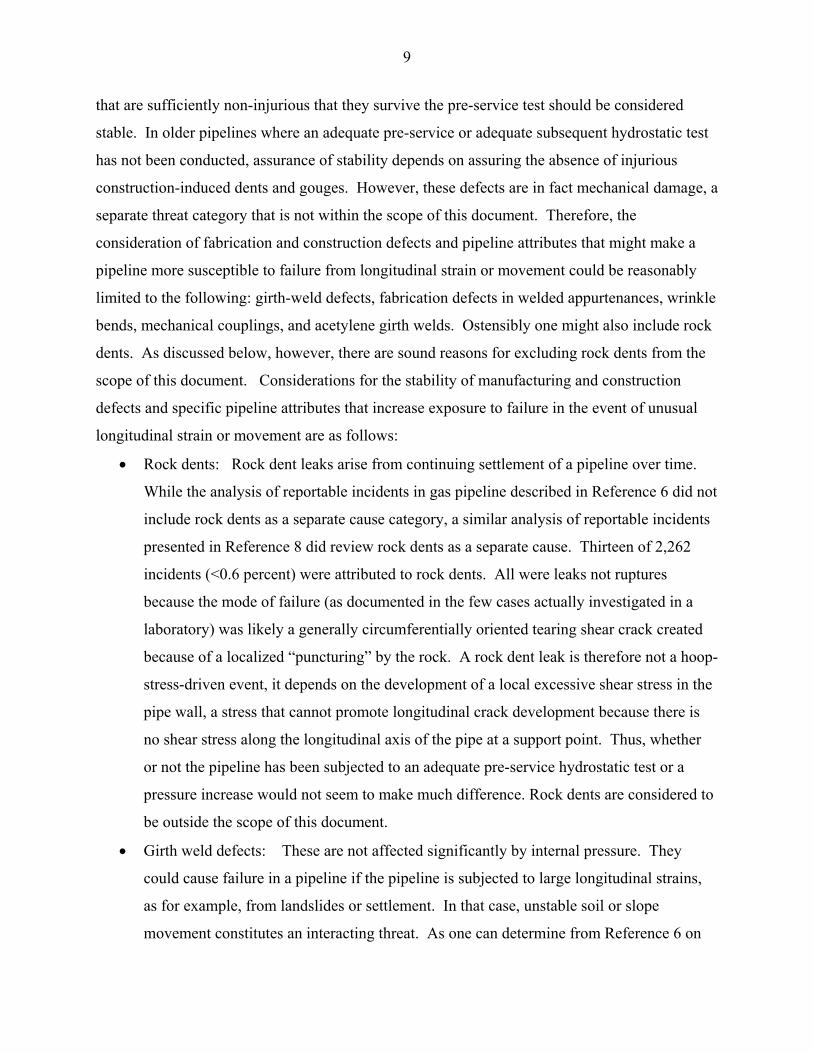
9
that are sufficiently non-injurious that they survive the pre-service test should be considered
stable. In older pipelines where an adequate pre-service or adequate subsequent hydrostatic test
has not been conducted, assurance of stability depends on assuring the absence of injurious
construction-induced dents and gouges. However, these defects are in fact mechanical damage, a
separate threat category that is not within the scope of this document. Therefore, the
consideration of fabrication and construction defects and pipeline attributes that might make a
pipeline more susceptible to failure from longitudinal strain or movement could be reasonably
limited to the following: girth-weld defects, fabrication defects in welded appurtenances, wrinkle
bends, mechanical couplings, and acetylene girth welds. Ostensibly one might also include rock
dents. As discussed below, however, there are sound reasons for excluding rock dents from the
scope of this document. Considerations for the stability of manufacturing and construction
defects and specific pipeline attributes that increase exposure to failure in the event of unusual
longitudinal strain or movement are as follows:
• Rock dents: Rock dent leaks arise from continuing settlement of a pipeline over time.
While the analysis of reportable incidents in gas pipeline described in Reference 6 did not
include rock dents as a separate cause category, a similar analysis of reportable incidents
presented in Reference 8 did review rock dents as a separate cause. Thirteen of 2,262
incidents (<0.6 percent) were attributed to rock dents. All were leaks not ruptures
because the mode of failure (as documented in the few cases actually investigated in a
laboratory) was likely a generally circumferentially oriented tearing shear crack created
because of a localized “puncturing” by the rock. A rock dent leak is therefore not a hoop-
stress-driven event, it depends on the development of a local excessive shear stress in the
pipe wall, a stress that cannot promote longitudinal crack development because there is
no shear stress along the longitudinal axis of the pipe at a support point. Thus, whether
or not the pipeline has been subjected to an adequate pre-service hydrostatic test or a
pressure increase would not seem to make much difference. Rock dents are considered to
be outside the scope of this document.
• Girth weld defects: These are not affected significantly by internal pressure. They
could cause failure in a pipeline if the pipeline is subjected to large longitudinal strains,
as for example, from landslides or settlement. In that case, unstable soil or slope
movement constitutes an interacting threat. As one can determine from Reference 6 on
10
DOT reportable incidents, 30 incidents (2.3 percent of the incidents) were attributed to
defective girth welds.
• Welded appurtenances: Welded appurtenances that are poorly fabricated could contain
defects that might lead to failure with a pressure increase, and the risk is greater if the
pipeline has not been subjected to an adequate pre-service hydrostatic test. However, the
ASA B31.1 Code for Pressure Piping – 1942 contained the same area-replacement
criteria that are embodied in ASME B31.8 today and welding procedure qualification
requirements similar to those embodied in Welding of Pipelines and Related Facilities,
API Standard 1104, 19th Edition, September 1999. Therefore, fabricated appurtenances
in older pipelines likely would be of satisfactory quality if the operator followed the ASA
code at the time. If an operator can document the fact that ASA code requirements
governed the design of the pipeline, it is reasonable to assume that welded appurtenances
will not cause failures unless acted upon by an interacting threat such as earth movement.
• Wrinkle bends: Wrinkle bends arise from an obsolete practice of bending generally used
prior to the advent of smooth bending technology. They consist of circumferentially
oriented ripples at the intrados of the bend. The ripples entail the introduction of fairly
large, local plastic strains that reduce the ductility of the pipe and create points of strain
concentration in the presence of imposed longitudinal or lateral load on the pipeline.
Part 192, Paragraph 192.315 of the federal regulations does not allow the use of wrinkle
bends in pipelines operating at hoop stress levels equal to or greater than 30 percent of
SMYS, although wrinkle bends may exist in pipelines operated at higher stress levels
under Paragraph 192.619(c). Wrinkle bends have been known to fail from movement of
the bend in response to temperature changes. Reference 6 indicates that only about 0.7
percent of the incidents were attributed to either a buckle or a wrinkle bend, so the
incidents of wrinkle bend failures are apparently rare. When they are involved in a
failure, it is usually because either the bend has been over-strained by longitudinally or
laterally imposed deformation or some other mechanism such as corrosion or SCC has
reduced the pressure-carry capacity to the operating pressure level. Whether or not the
pipeline has been subjected to an adequate pre-service hydrostatic test would not seem to
make much difference.
11
• Mechanical couplings: Mechanical couplings are a now-obsolete means of joining one
piece of pipe to the next during the construction of a pipeline. They offer almost no
resistance to longitudinal forces imposed on the pipeline, so a mechanically coupled
pipeline can be safely pressurized only if longitudinal movement is restrained by the soil
or by anchor blocks. Mechanical couplings have been known to separate when a pipeline
is improperly exposed or when a significant change in soil restraint has taken place.
Reference 6 indicates that only 12 reportable incidents (out of 1,318) were attributable to
“Dresser” couplings, the most commonly used style of mechanical couplings. The only
significance of mechanical couplings to pressure-carrying capacity is to prevent leakage
at the point where two pieces of steel pipe are joined by the coupling. Thus, whether or
not the pipeline has been subjected to an adequate pre-service hydrostatic test or a
pressure increase would not seem to make much difference.
• Acetylene girth welds: Acetylene girth welds were generally used prior to the advent of
electric-arc girth welding. Such welds likely were not used to construct high-pressure
pipelines after World War II. These welds are inherently brittle and sensitive to
longitudinal strain imposed on the pipeline. As noted in Reference 6, three of 30 girth-
weld-related reportable incidents were attributed to acetylene girth welds. This ratio is
likely proportionally much higher than the proportion of the gas pipeline mileage still in
service with pipes joined by acetylene girth welds. As is the case with girth welds in
general, the defects or inherent weaknesses associated with acetylene welds would likely
contribute to failure only when the pipeline is subjected to unusual longitudinal strain.
The contribution of internal pressure to such failures would likely be insignificant. Thus,
whether or not the pipeline has been subjected to an adequate pre-service hydrostatic test
or a pressure increase would not seem to make much difference.
The evidence supplied by reviews of the reportable incident data such as References 6
and 8 suggests that failures from fabrication and construction defects and failures involving the
obsolete pipeline attributes discussed above arise only when an unusual strain or movement is
imposed on the pipeline, when an abnormal operation condition exists, or when another type of
threat to pipeline integrity arises or exists in conjunction with a particular fabrication or
construction defect or an obsolete pipeline attribute. These situations are summarized in Table 4.
12
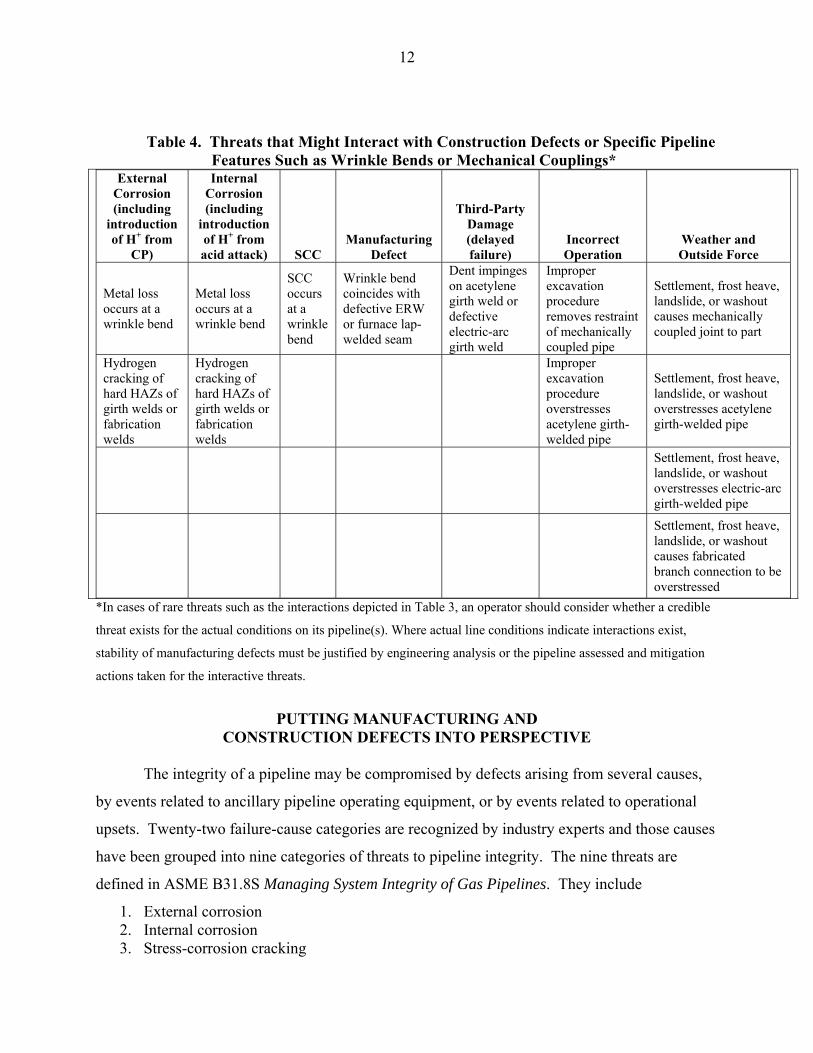
Table 4. Threats that Might Interact with Construction Defects or Specific Pipeline Features Such as Wrinkle Bends or Mechanical Couplings*
External Corrosion (including
introduction of H+ from
CP)
Internal Corrosion (including
introduction of H+ from acid attack) SCC
Manufacturing Defect
Third-Party Damage (delayed failure)
Incorrect Operation
Weather and Outside Force
Metal loss occurs at a wrinkle bend
Metal loss occurs at a wrinkle bend
SCC occurs at a wrinkle bend
Wrinkle bend coincides with defective ERW or furnace lap-welded seam
Dent impinges on acetylene girth weld or defective electric-arc girth weld
Improper excavation procedure removes restraint of mechanically coupled pipe
Settlement, frost heave, landslide, or washout causes mechanically coupled joint to part
Hydrogen cracking of hard HAZs of girth welds or fabrication welds
Hydrogen cracking of hard HAZs of girth welds or fabrication welds
Improper excavation procedure overstresses acetylene girth-welded pipe
Settlement, frost heave, landslide, or washout overstresses acetylene girth-welded pipe
Settlement, frost heave, landslide, or washout overstresses electric-arc girth-welded pipe
Settlement, frost heave, landslide, or washout causes fabricated branch connection to be overstressed
*In cases of rare threats such as the interactions depicted in Table 3, an operator should consider whether a credible
threat exists for the actual conditions on its pipeline(s). Where actual line conditions indicate interactions exist,
stability of manufacturing defects must be justified by engineering analysis or the pipeline assessed and mitigation
actions taken for the interactive threats.
PUTTING MANUFACTURING AND CONSTRUCTION DEFECTS INTO PERSPECTIVE
The integrity of a pipeline may be compromised by defects arising from several causes,
by events related to ancillary pipeline operating equipment, or by events related to operational
upsets. Twenty-two failure-cause categories are recognized by industry experts and those causes
have been grouped into nine categories of threats to pipeline integrity. The nine threats are
defined in ASME B31.8S Managing System Integrity of Gas Pipelines. They include
1. External corrosion 2. Internal corrosion 3. Stress-corrosion cracking

13
4. Manufacturing defects (manufacturing-related defects) 5. Construction defects (welding/fabrication defects) 6. Equipment 7. Third-party mechanical damage (immediate and delayed failures) 8. Incorrect operational procedure 9. Weather and outside force.
Operators of natural gas pipelines are required by federal regulations (Code of Federal
Regulations, Title 49, Part 192) to identify and evaluate threats to pipeline integrity for pipeline
segments located in high-consequence areas (HCAs). Threats from manufacturing and
construction defects are two of nine threats that must be considered. To help put the threats from
manufacturing defects and construction defects in perspective, it is useful to compare the relative
numbers of “reportable” incidents that arise on gas pipelines as a result of all categories of
threats. A reportable incident is one that meets the following criteria stated in the Code of
Federal Regulations, Title 49, Transportation, Part 191, Paragraph 191.3.
1) An event that involves a release of gas from a pipeline or of liquefied natural gas or gas from an LNG facility and
(i) A death, or personal injury necessitating in-patient hospitalization; or
(ii) Estimated property damage, including cost of gas lost, of the operator or others, or both, of $50,000 or more.
2) An event that results in an emergency shutdown of an LNG facility. 3) An event that is significant, in the judgment of the operator, even though it did not
meet the criteria of Paragraphs (1) and (2).
Such a comparison is presented in the following table (Table 5). These data are taken from
Reference 6. The incidents are grouped both by the nine threats mentioned previously and by the
22 failure-cause categories recognized by the gas pipeline industry.

14
Table 5. Reportable Incidents by Cause
Reportable Incidents Attributed to Manufacturing Defects
As can be seen in Table 5, manufacturing defects (defective pipe and defective seams)
accounted for only 3.3 percent of the reportable incidents. Moreover, when one examines the
circumstances of individual incidents, one tends to suspect that the number of failures
attributable to unstable manufacturing defects in pipelines that have been subjected to an
adequate pre-service hydrostatic test is much smaller than the numbers in Table 5 imply. Four
Classification by Cause
ASME B31.8S Threat
Category Number
Number of
Incidents
Percent of
Total TIME DEPENDENT
External corrosion 1 131 9.9% Internal corrosion 2 169 12.8%
Stress \-corrosion cracking 3 14 1.1% STABLE (manufacturing)
Defective pipe 4 18 1.4% Defective pipe seam 4 25 1.9%
STABLE (construction) Defective girth weld 5 30 2.3%
Defective fabrication weld 5 27 2.0% Wrinkle bend or buckle 5 9 0.7%
Stripped threads/coupling 5 40 3.0% STABLE (equipment)
Gasket or O-ring failure 6 20 1.5% Control/relief equipment 6 29 2.2%
Seal/pump packing 6 4 0.3% Miscellaneous 6 89 6.8%
TIME INDEPENDENT Third-party damage 7 364 27.6%
Previously damaged pipe 7 43 3.3% Vandalism 7 6 0.5%
Incorrect operations 8 92 7.0% WEATHER AND OUTSIDE FORCE
Cold weather 9 11 0.8% Lightning 9 22 1.7%
Heavy rains or floods 9 63 4.8% Earth movements 9 35 2.7%
TOTAL 1318

15
of the 18 defective pipe failures initiated at hard spots in the skelp. A hard spot is a
manufacturing defect that can become cracked in service as the result of hydrogen embrittlement
(hydrogen-stress cracking). Hard-spot failures typically occur only in certain vintages of pipe
especially pipe made by one particular manufacturer. Moreover, a hard spot will not become
cracked unless or until a failure of the pipe coating allows atomic hydrogen from a cathodic
reaction to be generated at the surface where the hard spot is present. Absent the exposure to
atomic hydrogen, a hard spot will not fail, so a pre-service hydrostatic test does not protect a
pipeline containing hard spots from subsequent failure if the hard spots are exposed to atomic
hydrogen. The four hard-spot incidents listed in Reference 6 undoubtedly involved coating
failure and the external electrochemical environment to which the pipelines were being
subjected.
Six other incidents (out of 18) involved leakage as opposed to rupture. Without further
information one cannot be sure that these leaks were associated with the failures of
manufacturing defects because leaks can develop at otherwise stable defects for a variety of
reasons not directly related to hoop stress. For example, foreign material pressed into the inside
surface of a seamless pipe during piercing may penetrate the wall thickness and yet serve as a
barrier to leakage initially. If the material later becomes dislodged, a leak may be created.
Another form of leakage can occur in conjunction with a lamination in rolled skelp where the
lamination extends to the end of the pipe. Occasionally, a leakage path will develop because the
lamination prevented the deposition of a sound girth weld. These kinds of manufacturing defects
may or may not account for the six “leaks” reported.
An additional three incidents occurred on pipelines with MAOPs based on
Section 192.619(c) of the federal regulations. If that is the case because the MAOPs are
established by the “grandfather clause” in the absence of an adequate pre-service hydrostatic test,
then manufacturing defects in those pipelines may not be stable.
From the standpoint of the 25 incidents attributed to defective seams, 13 were associated
with leaks rather than ruptures. These leaks may or may not have been associated with areas of
lack of fusion in ERW seams with very short axial lengths. Such defects may extend entirely
through the wall thickness at the time the seam is fabricated and not exhibit leakage if they are
plugged with mill scale. Occasionally, the mill scale in such a defect will give way to leakage
over time. For leaks from short manufacturing defects initially plugged with mill scale, the

16
important points are that their occurrence is not strongly dependent on hoop stress and that,
typically, they do not lead to ruptures. From these standpoints incidents associated with such
defects usually do not have significant consequences.
Seven other incidents (out of 25) occurred on pipelines with MAOPs based on
Section 192.619(c) of the federal regulations, and as noted above, in the absence of an adequate
pre-service hydrostatic test, the manufacturing defects in these pipelines may not have been
stable.
The point is that it is possible that only about five of the 18 defective pipe incidents and
five out of 25 defective seam incidents occurred under circumstances where one is forced to
assume that manufacturing defects did indeed become unstable in spite of the pipeline apparently
having received an adequate pre-service hydrostatic test. If that is the case, the percentage of
incidents attributable to unstable manufacturing defects would drop from 3.3 percent of the
incidents to 0.8 percent of the incidents. Moreover, because the reportable- incident forms are
not intended to present a full root-cause failure analysis, one cannot really be sure that any of the
incidents actually represent a manufacturing defect failing at the MOP after being tested of 1.25
times MAOP in the absence of some interacting circumstance.
Reportable Incidents Attributed to Construction Defects
As seen in Table 5, construction defects including defective girth welds (30 incidents),
defective fabrication welds (27 incidents), wrinkle bends or buckles (9 incidents), and stripped
threads or coupling failures (40 incidents) accounted for 106 incidents or 8.0 percent of the total
number of reportable incidents during the period covered by Reference 6. The data provided in
Reference 6 for these incidents are insufficient to reveal whether or not they occurred in
conjunction with outside forces acting on the pipeline. Usually, construction defects do not fail
solely from the effects of internal pressure. Typically, they remain stable unless acted upon by
unusual longitudinally oriented stresses or strains being imposed on a pipeline. The primary
reason why this is so is that the majority of construction-related defects and weaknesses are
circumferentially oriented. For example, defects in girth welds tend to be circumferentially
oriented because the welds are deposited in the circumferential direction. The development of
cracks and failures in wrinkle bends and buckles usually occurs in the circumferential direction.
Threads are circumferentially oriented and are stripped by longitudinal forces. While

17
mechanical couplings may occasionally exhibit small leaks resulting from inadequate seals, the
only catastrophic mode of coupling failure is associated with a pipe being pulled out of a
coupling. Such an occurrence implies that a large longitudinal movement has occurred. In
stable soils (i.e., those where no settlement or movement is taking place), a buried pipeline is
fully restrained against longitudinal movement. In such cases it is difficult to imagine a pipeline
pulling out of a coupling or stripping the threads at a threaded connection. It is also difficult to
imagine a girth-weld defect or an intentional wrinkle bend or a buckle formed by mishandling
during construction failing. It should be noted, of course, that a buckle formed because of soil
movement is, by definition, subject to an unstable soil situation.
The point is that incidents that arise from construction defects are usually associated with
soil movement, and as such, many construction-related defects such as girth-weld defects and
construction-related features such as wrinkle bends, couplings, and threaded connections are
stable as long as the soil in which the pipeline is buried remains stable. The implication is that
the construction-defects threat alluded to by ASME B31.8S is small in relation to many of the
other threats if the pipeline is buried in stable soil.
Perspective on Manufacturing and Construction Defects
In summary, the relative significance of the threats from manufacturing and construction
defects is small compared to that of many of the other threats recognized by ASME B31.8S.
Overall, defects associated with these two threats have accounted for less that 12 percent of the
reportable incidents in natural gas pipelines in the United States over the period from 1985
through 2000. In addition, factors such as an adequate pre-service hydrostatic test and stable soil
conditions tend to render both manufacturing and construction defects stable. Therefore, in the
report that follows, it is useful to bear in mind that the issues discussed relate to pipeline-
integrity threats that are not among those that cause the vast majority of pipeline failures.
WHAT IS DEFECT STABILITY?
One definition of a stable pipeline defect could be a defect that never threatens the
integrity of a pipeline at any time during the useful life of the pipeline. Basically, such a defect
would have one essential characteristic: its failure stress level would always be higher than the
maximum stress level (considering both hoop stress and longitudinal stress) experienced by the

18
pipeline during its useful life. Therefore, it would never cause the pipeline to fail. A
longitudinally oriented defect can become unstable if the pipeline operating pressure is raised
above historical operating levels or a circumferentially oriented defect can become unstable if it
is acted upon by increasing external loadings such as those imposed by soil movement.
Any manufacturing defect or imperfection that survives a pre-service hydrostatic test to
1.25 times the maximum allowable operating pressure (MAOP) is stable immediately after the
test. The reason is that by virtue of having survived the test, it is too small to fail at the MAOP
that is only 80 percent of the test pressure. The reason is that longitudinally oriented defects in
pressurized pipe have unique failure pressures related to their size. If exposed to single loadings
at levels substantially below their failure pressures, one would not expect them to fail because
they are too small to fail. The logic of this can be understood in the context of Figure 1
discussed below. Aside from logical considerations, experience with gas pipelines tested to
levels of 1.25 times their operating pressures validates the effectiveness of a test-pressure-to-
operating-pressure ratio of 1.25(1,2). Reference 1 describes a survey involving the experiences of
31 gas pipeline operators on 37,000 miles of pipelines tested to levels of 1.25 times the MOP or
more. The survey revealed that within this group of pipelines, none had experienced a rupture
associated with an original manufacturing defect after such a test. Reference 2 describes an
exhaustive study of defect behavior during and after a hydrostatic test. It shows why defects that
survive a hydrostatic test are stable at operating pressure levels less than or equal to 80 percent of
the test pressure.

19
0.1
0.2
0.3
0.4
0.5
0.6
0.7
0.8
0.9
0
200
400
600
800
1,000
1,200
1,400
1,600
1,800
0.0 5.0 10.0 15.0 20.0 25.0Total Length, inches
Pres
sure
, psi
D =30.000, t = 0.3750, SMYS = 52,000, CVN = 40.00, CVN Area = 0.124
Ruptures
Leaks
d/t
MOP, 936 psig, 72% of SMYS
Subpart J Test,, 1170 psig, 90% of SMYS
No in-service failure will occur as long as there is no mechanism by which the defects can grow through the margin established by the Subpart J test
A defect that is 15 inches long with d/t = 0.18 could barely survive the test of 1.25 times MOP
The 15-inch-long defect would have to grow to a d/t of 0.38 to fail at MOP
Definition of Stable M & C Defects in a 30-inch-OD, 0.375-inch-wall, X52 Gas Pipeline
The 5-inch-long defect would have to grow to a d/t of 0.64 to fail at MOP
A defect that is 5 inches long with d/t = 0.48 could barely survive the test of 1.25 times MOP
Figure 1. The Concept of Defect Stability
A longitudinally oriented defect remains stable as long as it has not been brought to a
near-failure condition by a hydrostatic test itself, as long as it cannot become appreciably larger
during the life of the pipeline (e.g., by pressure-cycle-induced fatigue), and as long as no
accidental over-pressurization to a level approaching its failure pressure occurs. This definition
of stability can be illustrated graphically as shown in Figure 1. Figure 1 is based on the "log-
secant" equation for predicting the failure stress levels for longitudinally oriented defects in
pressurized pipe(9).
No construction defect (except possibly a longitudinally oriented defective fabrication
weld) would be expected to fail unless the portion of the pipeline containing the defect is
subjected to movement. Movement of a buried pipeline can take place only if the restraint from
soil friction is compromised or if the soil itself moves as the result of settlement, landslides,
washouts, aseismic fault movements, or seismic events.

20
Manufacturing and construction defects are already present in a new pipeline at the time
it is subjected to the required pre-service hydrostatic test. Any such defect that survives the test
would not be expected to fail in service as long as there is no interacting risk associated with any
other threats to pipeline integrity.
The most common and most significant types of manufacturing defects that can be
expected to exist in pipelines are listed in Table A1 of Appendix A. Both seam defects and pipe
body defects are listed. Any one of the listed defects has the potential to affect the pressure-
carrying capacity of a piece of pipe. It is noted that every piece of pipe made in accordance with
API Specification 5L, 5LX, or 5LS has been subjected to a hydrostatic test by the manufacturer.
While these "mill" tests are of short duration (5 to 10 seconds) at hoop stress levels ranging from
as low as 40 percent of SMYS to as high as 90 percent of SMYS, they constitute a rough lower
bound on the sizes of manufacturing defects (and their failure pressure levels). So even if a
pipeline has not been subjected to a test to 1.25 times its MAOP, there exists a lower bound for
failure pressures based on the mill test pressure applied to any particular order of API line pipe in
question. This factor can be taken into account when one is considering the stability of
manufacturing defects in any particular segment of a pipeline (typical mill test pressures are
provided in Tables 1 and 2 herein). It is necessary to note that the stability of manufacturing
defects conferred by virtue of a hydrostatic test (whether done by the manufacturer or by the
operator after construction of a pipeline) extends only to the rupture mode of failure. Pressure
testing can be used to assess leak-tightness as well as margin of safety against rupture, but
ultimately, it is possible for some small leak to escape detection. Moreover, as one can see by
examining Table A1, some types of manufacturing defects are through wall at the outset. The
latter types of defects may or may not ever leak depending on whether or not the leakage path is
blocked and remains blocked by nonmetallic material. So, in the following discussions of
stability, it should be remembered that stability implies the absence of opportunity for a rupture;
stability does not imply that there can never be a small leak. The presumption that stability
exists irrespective of the risk of a small leak must be justified on the basis that no significant
consequences are anticipated in conjunction with a small leak.
The common types of construction defects and construction features that might create
integrity concerns are listed in Table A2 of Appendix A. The stability of these types of defects
and features tends not to be affected much if at all by internal pressure. Hence, stability in the

21
context of integrity management means the absence of external loads or forces that could
adversely affect a construction defect or a construction feature that has certain inherent
vulnerabilities.
FACTORS THAT AFFECT THE STABILITY OF
MANUFACTURING AND CONSTRUCTION DEFECTS Pressure-affected defects that survive a particular pressure level may fail at a lower
pressure level if they grow larger after surviving the initial pressure level. Absent their
interaction with defects originating from other causes and except for hard spots and laminations,
manufacturing defects are known to become larger and therefore to have lower failure pressures
only through one of three mechanisms.
1. Quasi-stable ductile tearing at pressure levels closely approaching the failure pressure of
the defect
2. Pressure-cycle-induced fatigue
3. Pressure reversals(10).
Therefore, stability of manufacturing defects depends on the absence of significant influence of
any one of these three phenomena (described in greater detail below). A pre-service hydrostatic
test of a natural gas pipeline to a level of 1.25 times its MAOP removes the threat of subsequent
failure at the MAOP from these three phenomena. For ratios of test pressure to operating
pressure less than 1.25, the risks of failure at the MAOP from all of these phenomena increase
exponentially as the ratio approaches 1.00. The rapid (exponential-like) increase in strains and
crack-opening displacement in the vicinity of a defect as the level of applied pressure approaches
the failure pressure of the defect has been experimentally verified as illustrated in Figures 10 and
11 of Reference 11. However, the probability of a failure still depends on the presence of
manufacturing defects large enough to cause failure at or near the MOP. Defects large enough to
fail at the MOP or a pressure level closely approaching it may not exist, and smaller defects, if
they exist, may remain stable. The challenge is to identify the conditions under which
manufacturing defects that exist in a pipeline that has not been subjected to a hydrostatic test to
1.25 times its MAOP may become unstable and grow to failure in service.
Construction defects (that is, primarily girth-weld defects and circumferentially oriented
fabrication-weld defects) are most likely to be at risk of failure from unusual or newly arising

22
external forces that would tend to produce increasing levels of longitudinally oriented strains on
a pipeline. In most cases, the strains that could be potentially harmful would be those that arise
if and when the pipeline is subject to movement. As long as a pipeline remains restrained by
stable soil backfill, it cannot move. The only things that will allow it to move or make it move
are loss of the restraint provided by soil friction, settlement, landslides, washouts, movement of
aseismic faults, or seismic events. Therefore, one can view stability in the context of
construction defects in terms of the absence of locations or events that would be conducive to
movement of the pipeline. One exception might be a longitudinally oriented fabrication weld
such as the side seam on a pressure-containing sleeve. In that case, a defect in such a weld
would be subject to failure from internal pressure, and it should be considered in terms of
stability the way one would consider a manufacturing defect.
QUASI-STABLE DUCTILE TEARING
Quasi-stable ductile tearing is the phenomenon that occurs when the remaining ligament
of wall thickness beneath a longitudinally oriented part-through defect in a pipe is subjected to a
pressure level approaching its failure pressure. Several pipeline industry studies(11-13) have
documented this phenomenon. If the pressurization is stopped (i.e., held constant) at a level high
enough for some tearing to occur, but at a level sufficiently below the straight-away failure
pressure of the defect, the tearing is likely to stop after a period of time and resume only if the
pressure is further increased. A point is reached in this process, however, at which the pressure
level is sufficiently close to failure that the failure will occur even if the pressurization is
stopped. In one of the studies mentioned above(11), these "critical" levels were determined for
specific materials. While it is necessary to note that the specific critical levels so determined
apply only to the specific materials tested, one can reasonably infer that in principle, similar
critical levels exist for all conventional line-pipe materials. The studies alluded to showed that
ductile tearing could begin at pressure levels as low as 91 percent of the failure pressure that
would result from straight-away pressurization to failure with no delay. These studies further
showed that once a pressure level within five percent of the straight-away-to-failure level was
attained and held constant, the defect would grow to failure eventually by continued ductile
tearing.
23
Natural gas pipeline operators, in their responses to the rule making on pipeline-integrity
management, have taken the position that even where pipelines have never been subjected to a
pre-service hydrostatic test, long years of service without a failure from a manufacturing or
construction defect demonstrate that any such defects in a pipeline are stable. It is likely that the
industry's position is based on the premise that any unstable defect would have grown to failure
over a long period of time through ductile tearing, and that, therefore, any surviving
manufacturing defects are stable. The nature of the ductile-tearing phenomenon would seem to
lend credence to this premise. There is a problem with this premise, however. One might be
able to visualize the existence of stability under a condition where the operating pressure was
always the same (which is seldom, if ever, the case in an operating pipeline). It would be
reasonable under the assumption that the operating pressure never changes to believe that if
failures did not occur early in the life of the pipeline, that all remaining manufacturing defects
have failure pressures high enough to assure that they will not fail. If they had been at near-
failure pressures, one would expect that strains in the ligaments of wall thickness below the
defects to continue to increase, and that failures would occur. In the absence of such failures
over a long period of constant pressure operation, one might reasonably conclude that any
defects on the verge of failure should have failed and that any that remain are stable because
their failure pressure levels exceed the operating pressure level by a significant margin. The
problem with this scenario is that when the operating pressure does not remain constant, but
fluctuates with time, the effect on near-failure defects is that the changing strain levels cause
ductile tearing to re-initiate and/or continue when the highest pressure is restored. Particularly
damaging in this respect are cycles of pressure down to zero as indicated by the experiments
described in Reference 11. It is apparent from the results of crack-opening displacement
measurements of the type made in those experiments, that damage to a near-failure crack
continues to occur even as the pressure is lowered. Part of the damage arises from the fact that
compressive plastic strain is introduced during an unloading cycle, and the closer the load comes
to zero, the more plastic strain occurs. Upon reloading as the crack begins to reopen, the tensile
strain capacity that was lost as the result of the unloading-induced plastic compressive strain may
cause the defect to fail at pressure level below that reached on the previous loading cycle. Even
one such cycle can cause the failure pressure level of a near-failure defect to be lowered as will
be discussed in terms of "pressure reversals" below. Thus, long service at a particular MOP,

24
where that MOP is not a constant value but only an upper bound, does not assure stability of a
manufacturing defect.
At this point it is appropriate to discuss how an excursion, short or long, of pressure
above the historically established MOP could affect stability in terms of what a long period of
constant pressure has demonstrated. From the description of defect behavior discussed above, it
should be clear that a defect on the verge of failure at some long-standing level will be caused to
fail by a pressure excursion above the long-standing level. On the other hand, if no failure
occurred during the excursion, the long service with no failure in effect did demonstrate that no
defect could have been on the verge of failure. If it had, the excursion, no matter how small or
how short, would have caused it to fail. After the excursion, if the long-standing level is restored
and held constant without depressurization below that level, stability is assured as long as the
pressure level remains constant. However, a pressure excursion above the MOP that does not
result in a failure is not necessarily a positive event. The effect of the excursion is to reduce the
fatigue life and to increase the susceptibility to pressure reversals if the pressure level fluctuates
significantly.
PRESSURE-CYCLE-INDUCED FATIGUE
As has been demonstrated in a few instances in liquid petroleum pipelines(7, 14,) , defects
initially having survived a pre-service hydrostatic test have been caused to fail as the result of
pressure-cycle-induced fatigue crack growth. Liquid petroleum pipelines in some cases are
subjected to frequent and significant variations in pressure due to the combined effects of the
relative incompressibility of the fluids transported and the frequently changing through-put
requirements imposed by shippers. Gas pipelines, largely because of the compressible nature of
the product, experience nowhere near the pressure-cycle variations that liquid petroleum
pipelines experience. In a recent study(15), the relative pressure-cycle conditions of three typical
gas pipelines were directly compared to those of a typical aggressively cycled liquid petroleum
pipeline, and the fatigue lives of the gas pipelines were estimated as well. In each case the
largest possible defects assumed to be present in each of the pipelines were postulated to be those
that would just barely have survived the respective pre-service hydrostatic tests to 1.39 times the
respective MOPs. The minimum predicted time to failure for the worst-case defect in the liquid
petroleum pipeline was 5 years. In contrast, the minimum predicted times to failure for the

25
worst-case defects in the natural gas pipelines ranged from 171 to 414 years. Two things should
be noted about these calculations. First, the times to failure are based on the pre-service test
being 1.39 times the MOP (in fact, the tests were conducted at a minimum test pressure of 100
percent of SMYS). The times to failure would be shorter if the test-pressure-to-operating-
pressure ratio had been only 1.25. Second, it is assumed that the gas pipeline with the shortest
time to failure is a worst-case situation. A pipeline with a less aggressive operating pressure
spectrum would have a longer time to failure. Since it is relatively easy to calculate the relative
aggressiveness of a given pressure spectrum, an operator should be readily able to establish the
expected minimum time to failure for a given segment.
It is important to note that the above-described times to failure should be regarded in
relative terms rather than absolute terms. The history of liquid pipeline fatigue failures suggests
that no pipeline actually exhibited such a failure within 5 years of construction even if it was
tested only to a level of 1.1 times its MOP. The earliest fatigue failures occurred no sooner than
7 years after installation and not in pipelines tested to pressures as high as 1.39 times MOP. (One
such case is alluded to on Page 8 of Reference 7. A pipeline installed in 1967 exhibited a failure
from a pressure-cycle-induced fatigue crack in 1974.) The reason that the model used in
Reference 15 predicted times to failure as short a time as 5 years in the liquid pipeline is that the
defect that failed in 5 years was 80 percent of the way through the wall after it survived the
hypothetical hydrostatic test to 1.39 times MOP.
From the physical circumstances of the pipe-seam manufacturing processes (both ERW
and DSAW), it is almost impossible to have an initial defect deeper than 50 percent of the wall
thickness that is also long enough to cause a fatigue failure within 5 years. While it is true that
cold-weld defects in ERW pipe can be 100 percent through upon manufacturing, such defects are
quite short and, to the author’s knowledge, have never been implicated in a fatigue failure. In
contrast, defects like hook cracks and mismatched plate edges, the typical initiators of fatigue
cracks in liquid pipelines comprised of ERW pipe, cannot be initially greater than 50 percent of
the wall thickness because of the way they are formed. In DSAW pipe seams, newly formed
manufacturing defects are also unlikely to be greater than half-way through the wall because of
the fact that the seam is comprised of two independently formed weld deposits. The point is that
the minimum time to failure of a new pipeline is very likely to be determined by a 40 to 50-
percent-through defect, not an 80-percent-through defect. Therefore, as will be shown below, the

26
times to failure for different test-pressure-to-MOP levels are calculated on the basis of 50-
percent-through defects.
For the most severely cycled of the three gas pipelines described in Reference 15, it was
found that for a hydrostatic test to 1.25 times its MOP, the minimum time to failure for a 50-
percent-through defect of a length that would have barely survived the test was 111 years. If the
defect were only 40 percent through and of length that would have barely survived the test, its
time to failure would be 184 years. Therefore, it is reasonable to believe that manufacturing
defects in a natural gas pipeline that have been subjected to a hydrostatic test to 1.25 times its
MAOP would not be expected to grow the failure within its conceivable useful life. The above-
described calculations also happen to square with actual operating experience. To this author's
knowledge, no manufacturing defect in a natural gas pipeline tested to a minimum of 1.25 times
its MAOP has ever exhibited an in-service failure as the result of pressure-cycle-induced fatigue.
While it is impossible to prove that no such incident has taken place, one can put the likelihood
of the event having occurred in perspective by considering a typical occurrence of failure from
pressure-cycle-induced fatigue in a liquid pipeline.(7) In this case the failure discussed and others
like it occurred between 7 and 35 years after the pipeline was placed in crude-oil service. From
the relative comparisons between the times to failure for gas and liquid pipelines shown above,
one might reasonably expect that it would take 34 times as long for the same series of failures to
unfold in a comparable-size gas pipeline where the only difference is the time over which the
pressure cycles are accumulated. With that assumption one would conclude that the same
sequence of failures in a gas pipeline would begin 238 years after commissioning and extend to
1,190 years after construction.
The above-described calculations and the very unlikely possibility of near-term natural
gas pipeline failures from pressure-cycle-induced fatigue justify the assumption of stability of
manufacturing defects in pipelines tested to levels of at least 1.25 times MAOP. However, it is
necessary to examine whether or not an adequate level of assurance of stability can be associated
with any pipeline that has experienced a "proof test" to a level perhaps not as high as 1.25 times
its MAOP. In this respect it is useful to consider a broad definition of a proof test to include the
manufacturer's hydrostatic test of each piece at the pipe mill, a "gas" test of the pipeline, a
previous high operating pressure level that can be documented, and a pressure reduction from an
existing operating pressure level. It is important to note that the manufacturer's test would only
27
be applicable to manufacturing defects because it is conducted prior to shipment of the pipe to
the job site. This means that the manufacturer’s test offers no protection from a fatigue crack
arising from rail shipment of the pipe. An operator with pipe shipped by rail that did not perform
an adequate pre-service (or adequate subsequent) hydrostatic test or an in-line inspection with a
tool capable of detecting sharp cracks would not be able to prove that the pipeline could not fail
from such a crack.
To demonstrate the relative effectiveness of proof tests, the following calculations were
made using the pressure cycles from the shortest-life case of the three natural gas pipelines
examined in Reference 15. The proof-test-to-MOP levels examined are: 1.39, 1.25
(demonstrated to be an adequate level by the pipeline operating experience on 37,000 miles of
gas pipelines as outlined in Reference 1), 1.18 (equal to a pipe mill test to 85 percent of SMYS
for a pipeline operated at 72 percent of SMYS), 1.10 (equal to a gas test to 1.1 times MAOP for a
pipeline operated at 72 percent of SMYS), and 1.04 (equal to a pipe mill test to 75 percent of
SMYS for a pipeline operated at 72 percent of SMYS). The minimum predicted times to failure
for an initial 50-percent-through defect for each of these cases are presented in Table 6. One
other case is included, namely, the case in which the operating pressure has been reduced to 80
percent of the highest actual prior operating pressure. Because this case could represent a
pipeline that has been in service for a long time without having had an initial test to 1.25 times
MOP, it is possible that a fatigue crack could have already developed at a defect that had a
failure pressure only slightly higher than the MOP. Therefore, in the fatigue assessment of this
case, the times to failure have been calculated for a range of defect depth ratios (defect depth
ratio is the ratio of defect depth to nominal wall thickness) from d/t of 0.9 to d/t of 0.1. The
minimum time to failure generally turns out to be based on the deeper defects (d/t = 0.9 to d/t =
0.7). Note that it is not always the case that the deepest defect fails earliest at least based on the
type of analysis used(16). The reason is that the crack driving force is calculated as a function of
both defect length and defect depth. Since the starting sizes are all based on a single pressure
level (the test pressure), there will be both long, shallow defects and short, deep defects. The
effect of length may dominate in some cases but not in others. Therefore, the calculated time to
failure will be based on the depth of defect that produces the minimum time to failure whatever
its depth. In the case where a pipeline has been in service and a pressure reduction is used to
demonstrate stability, the depth may be greater that 50 percent of the wall thickness. In contrast,

28
for reasons stated above, the maximum credible depth of a manufacturing defect in a new piece
of pipe will be taken as 50 percent of the wall thickness.
Table 6. Comparisons of Times to Failure from Pressure-Cycle-Induced- Fatigue for Various Proof Test Levels (Pipeline is 24-inch-OD, 0.289-inch-wall, X52 with toughness equivalent to 25 ft-lb Charpy V-notch upper-shelf energy. C = 8.6E-19 for ∆K in units of psi inch , n = 3)
Description
Proof-Test-
Pressure-to-MOP
Ratio
Length of Defect, inches
Initial
Depth-to-Thickness
Ratio
Time to Failure,
years
Time to Failure,years
if one 5% over-pressure per year occurs
Pre-service test to 1.39 x MOP (MOP = 72%
SMYS)
1.39 3.09 0.5 217 203
Pre-service test to 1.25 x MOP (MOP = 72%
SMYS)
1.25 4.5 0.5 111 96
Mill Test to 85% of SMYS
for MOP of 72% SMYS
1.18 5.36 0.5 77 60
Gas Test to 1.1 x MOP
(MOP = 72% SMYS)
1.1 6.53 0.5 45 24
Mill Test to 75% of SMYS
for MOP of 72% SMYS
1.04 7.59 0.5 23 Fails when over-pressure occurs
Pressure Reduction to
80% of highest previous pressure
assumed to be 72% of SMYS
1.25 4.06 0.7 61 50
It is clear that the assurance of stability in terms of time to failure from pressure-cycle-
induced fatigue is highly dependent on the proof-test-pressure-to-MOP ratio. Whereas the
minimum time to failure is 111 years for a test to 1.25 times MOP, a commonly used and time-

29
tested test pressure ratio, the times to failure decrease substantially with decreasing proof-test-
pressure-to-MOP ratio. The time to failure associated with the 1.18 ratio (85 percent of SMYS
mill test), 77 years, is only two-thirds as long. The time to failure associated with the 1.10 ratio
(79.2 percent of SMYS gas test), 45 years, is less than one-half as long. And, the time to failure
associated with the 1.04 ratio (75 percent of SMYS mill test), 23 years, is less than one-quarter
as long. Note that the time to failure associated with a 20-percent pressure reduction, 61 years, is
55 percent as long as that associated with a test of a new pipeline to 1.25 times MOP. It is noted
that the time to failure following a test to 1.39 times MOP, a ratio higher than 1.25 times MOP,
but one that is often applied today, is about twice as long as that associated with the 1.25-times-
MOP test.
The last column in Table 6 shows how a once-per-year pressure excursion of five percent
above the benchmark MOP (to a level of 946 psig for the pipeline considered in Table 6) would
affect stability in terms of fatigue life. From the description of pressure-cycle effects described
above, it should be clear that the excursion is part of a larger pressure cycle. Its effect was
calculated by including it in the cycle count. One can see that the effect of one excursion per
year of five percent depends on the effective proof-test-pressure-to-MOP ratio. The times to
failure when the credible-size excursion is included change as follows. The time to failure
following a test to 1.25 times MOP changes from 111 to 96 years. The time to failure for the 1.18
test-pressure-to-MOP ratio changes from 77 to 60 years. The time to failure for the 1.10 test-
pressure-to-MOP ratio changes from 45 to 24 years. The excursion itself is larger than the 1.04
test-pressure-to-MOP ratio, and therefore it would cause a defect that had barely survived the test
to fail. Lastly, the time to failure following a pressure reduction of 20 percent changes from 61
to 50 years.
PRESSURE REVERSALS
Pressure reversal is a term used to describe a situation in which a defect fails at a pressure
level below one that it had recently survived. Since the term pressure reversal is almost
exclusively used in conjunction with a sequence of hydrostatic test failures of pipelines(10), it is
assumed herein that between the initial level of pressure experienced and the subsequent (lower)
pressure at failure, the pipeline has been completely depressurized (to zero) at least once. The

30
qualification that separates a pressure reversal from a situation in which the failure pressure of a
defect is lowered by fatigue has to do with the number of pressure cycles. Pressure-cycle-
induced fatigue failures of the types described in References 7 and 14 clearly occurred only after
many hundreds, perhaps thousands of relatively large pressure cycles within the MOP range.
Pressure reversals sometimes occur with only one prior cycle of pressurization. They were first
recognized in early hydrostatic tests of pipelines(10). As described in Reference 10, a pressure
reversal was typically observed as a failure at a pressure level below that reached on a previous
cycle occurring during pressurization of a hydrostatic test section from zero pressure to the
failure pressure of the defect.. The drop in pressure on the subsequent cycle was often observed
to be one or two percent with five-percent reversals occasionally occurring. The studies
described in Reference 11 showed that pressure reversals result from quasi-stable ductile tearing
of a defect as its failure pressure is closely approached. If the test is terminated before the defect
can fail because another defect fails, the surviving defect is often damaged additionally during
depressurization to zero and repressurization and will fail by the resumption of ductile tearing
before the pressure level reaches the level of the previous pressurization.
The question that typically arises with respect to pressure reversals is: How large could a
pressure reversal be? One or two-percent pressure reversals are fairly common when an older
pipeline containing a family of defects having similar failure pressures is tested, and five-percent
reversals are not unknown. As shown in Reference 11, there is an inverse relationship between
pressure reversal size and the frequency of occurrence. In fact, it is shown in Reference 11 that
the distribution of pressure reversals within a given family of defects follows a normal
distribution. That makes it possible to estimate the probability of occurrence of a given size
pressure reversal. Of particular interest in the case of a pipeline being tested is the probability
that a pressure reversal equal to the margin between test pressure and operating pressure could
occur. If that were to occur, the defect would fail when the pipeline is placed in service at the
MOP. For a hydrostatic test to 1.25 times MOP, the critical pressure reversal would be a 20-
percent reversal. Actual test data can be used to show that the chance of such a reversal is so
small that the risk is far lower than the levels of risk associated with other pipeline integrity
threats, and thus, it not something one needs to worry about.
A comparison of pressure-reversal sizes to a normal distribution having the same mean
value and standard deviation for an actual pipeline test is shown in Figure 2. The points on the
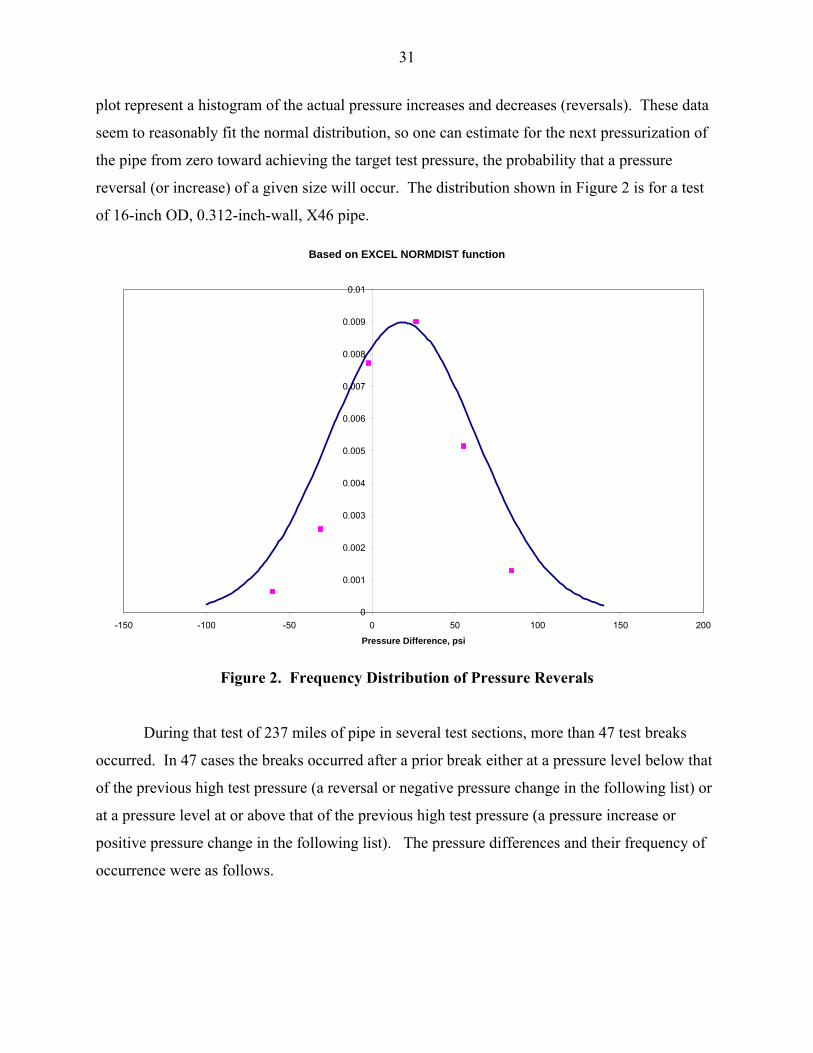
31
plot represent a histogram of the actual pressure increases and decreases (reversals). These data
seem to reasonably fit the normal distribution, so one can estimate for the next pressurization of
the pipe from zero toward achieving the target test pressure, the probability that a pressure
reversal (or increase) of a given size will occur. The distribution shown in Figure 2 is for a test
of 16-inch OD, 0.312-inch-wall, X46 pipe.
Based on EXCEL NORMDIST function
0
0.001
0.002
0.003
0.004
0.005
0.006
0.007
0.008
0.009
0.01
-150 -100 -50 0 50 100 150 200
Pressure Difference, psi
Figure 2. Frequency Distribution of Pressure Reverals
During that test of 237 miles of pipe in several test sections, more than 47 test breaks
occurred. In 47 cases the breaks occurred after a prior break either at a pressure level below that
of the previous high test pressure (a reversal or negative pressure change in the following list) or
at a pressure level at or above that of the previous high test pressure (a pressure increase or
positive pressure change in the following list). The pressure differences and their frequency of
occurrence were as follows.

32
Pressure Difference, psi Number of Occurrences -60 1 -45 1 -36 2 -34 1 -29 1 -27 1 -14 1 -12 1 -11 1 -9 1 -8 3 -7 1 -5 1 -4 1 -2 1 -1 1 0 2 1 3 5 2
10 1 11 1 16 1 21 1 25 1 39 1 40 1 41 1 42 1 43 1 47 1 51 1 54 1 57 1 75 1 100 2 107 2 113 2
The target test pressure was 1,794 psig with the intent of validating an MOP of 1,435 psig. Note
that the test pressure corresponds to 100 percent of SMYS for the pipe. The situation described
here involved a pipeline not covered by U.S. federal regulations on pipeline safety. The average
change in pressure between test pressure cycles was +18.49 psig, and one standard deviation is
44.417 psig. From Figure 2 one can infer that on any given pressurization from zero, one can
expect an even chance that a pressure 18.49 psig above the previous maximum test pressure will
be reached before a failure occurs. One can also infer that a 39-psi pressure reversal can be
expected on one out of every ten pressurizations and that a 60-psi pressure reversal can be

33
expected on one out of every 26 pressurizations. As can be seen it is impossible on the basis of
Figure 2 to extrapolate probabilities of larger pressure reversals. One can use the Microsoft
Excel function, NORMDIST, to calculate probabilities for a considerable range of pressure
reversals sizes (at least up to -287 psig). At reversal sizes somewhat larger than this, the
NORMDIST function is incapable of producing an answer. At that point the process becomes
tedious because one must rely on approximate solutions. One such solution is found on Page
120 of Reference 17. The probability of occurrence of low-probability event (more than six
standard deviations from the mean) can be calculated as 1-I/2 using four or five terms of the
following expression for I:
( ) ( ) xx
xxxxeI
x
⎥⎥⎦
⎤
⎢⎢⎣
⎡
⎟⎟⎠
⎞⎜⎜⎝
⎛+
⋅⋅−
⋅+−−=
−
L32222 2531
231
2111
2
π
where
σµ
2−
=zx
interest of difference Pressure zMean
deviation standard One
===
µσ
Bearing in mind that the test pressure in this example was 1,794 psig for validating an MOP of
1,435 psig (80 percent of the test pressure), one can calculate that a pressure reversal of 359 psi
would be required to cause a failure at the MOP. Letting “z” above be 359, one can calculate
that the probability of such an occurrence is a 1 in 109,000,000,000,000 event. This calculated
probability of a 20-percent reversal along with those associated with less-large reversals
calculated using the NORMDIST function in Excel is shown in Table 7.

34
Table 7. Likelihood of a Service Failure from a Pressure Reversal when Pressurizing from Zero after Various Levels of Proof Test (16-inch-OD, 0.312-inch-wall, X46 where MOP is either 72% or 80% of SMYS)
Description
Proof-Test-
Pressure-to-MOP
Ratio
Test Pressure,
psig
Operating Pressure,
psig
Margin, Between
Test Pressure and
Operating Pressure,
psig
Chance of
Failure at MOP from a
Pressure Reversal
Pre-service test to
1.25 x MOP (MOP = 80%
SMYS)
1.25 1794 1435 359 I in 109,000,000,000,000
Mill Test to 85% of SMYS
for MOP of 72% SMYS
1.18 1525 1290 235 1 in 170,000,000
Gas Test to 1.1 x MOP
(MOP = 72% SMYS)
1.1 1420 1290 129 1 in 2,200
Mill Test to 75% of SMYS
for MOP of 72% SMYS
1.04 1343 1290 52 1 in 18
Pressure Reduction to
80% of highest previous pressure
assumed to be 72% of SMYS
1.25 1290 1032 258 1 in 4,000,000,000
The first case shown in Table 7 corresponds to the actual situation, namely, that a test to 1,794
psig (100 percent of SMYS) was conducted to validate an operating pressure of ,1435 psig (80
percent of SMYS). The other cases in Table 7 correspond to hypothetical situations that are
presented for comparison to demonstrate the extremely low likelihood of a failure of a
manufacturing defect on the next application of any pressure significantly below a“proof-test”
pressure, which it has survived. It is important to note that for each level of “proof test” the
same statistical distribution of test failure pressures is assumed to exist. With that assumption it

35
is possible to compare the probabilities of pressure reversals causing a failure at the operation
pressure in each case. These other cases represent
• Failure at a hoop stress level of 72 percent of SMYS following a mill test of 85 percent of SMYS.
• Failure at a hoop stress level of 72 percent of SMYS following a gas test of 79.8 percent of SMYS (1.1 times MOP).
• Failure at a hoop stress level of 72 percent of SMYS following a mill test of 75 percent of SMYS.
• Failure at a hoop stress level of 57.2 percent of SMYS following a period of operation at 72 percent of SMYS.
The probability associated with a test to 1.25 times MOP is negligibly small. The probability
associated with a 20-percent pressure reduction (the last case in Table 7) is negligibly small as
well. The probability associated with the 1.18 ratio (85 percent of SMYS mill test) is about one
in 170,000,000, the probability associated with the 1.10 ratio (79.2 percent of SMYS gas test is
one in 2,200, and the probability associated with the 1.04 ratio (75 percent of SMYS mill test) is
one in 18.
At this point it is appropriate to discuss how an excursion of pressure above the
benchmark MOP would affect stability in terms of the likelihood of failure from a pressure
reversal. From the description of pressure-reversal effects described above, it should be clear
that an excursion changes the margin between test pressure and operating pressure, and that a
calculable chance of failure is associated with each resulting margin. The five-percent increases
in operating pressure have the following effects on the probability of pressure reversals.
• For the first case in Table 7, an increase in operating pressure from 1,435 psig to 1,507 psig reduces the margin between test pressure and operating pressure from 359 psig to 287 psig and increases the probability of a pressure reversal from 1 in 109,000,000,000,000 to 1 in 300,000,000,000.
• For the second case in Table 7, an increase in operating pressure from 1,290 psig to 1,355 psig reduces the margin between test pressure and operating pressure from 235 psig to 168 psig and increases the probability of a pressure reversal from 1 in 170,000,000 to 1 in 74,000.
• For the third case in Table 7, an increase in operating pressure from 1,290 psig to 1,355 psig reduces the margin between test pressure and operating pressure from 129 psig to 62 psig and increases the probability of a pressure reversal from 1 in 2,200 to 1 in 29.
• For the fifth case in Table 7, an increase in operating pressure from 1,032 psig to 1,084 psig reduces the margin between test pressure and operating pressure from

36
258 psig to 206 psig and increases the probability of a pressure reversal from 1 in 4,000,000,000 to 1 in 4,600,000.
For the fourth case in Table 7 where the test-to-MOP ratio was 1.04, the excursion
exceeds the margin, and hence the excursion would cause a just-surviving defect to fail.
SUMMARY OF STABILITY CONSIDERATIONS
It is assumed that a pipeline operator who can make the case that manufacturing or
construction defects within a segment identified as being in an HCA are stable will not have to
perform integrity assessments aimed at finding and eliminating such defects. The foregoing
discussions were intended to show when and if the stability of manufacturing or construction
defects in pipelines might be compromised, necessitating proactive integrity assessment on the
part of a pipeline operator.
One conclusion is that in a segment of pipe that has been subjected to a hydrostatic test to
1.25 times MAOP, there is no need for integrity assessments, either baseline or periodic, solely
for the purpose of addressing the threat of manufacturing defects in the absence of any
interacting threat. The calculations of times to failure and the pressure-reversal probabilities for
such defects suggest that they are not likely to cause failures within the conceivable useful life of
a natural gas pipeline. Even if annual five-percent pressure excursions above the validated
MAOP occur, the conclusion remains valid. As the calculations show, the clock would
eventually run out on the allowable useful life. Pipelines that remain in service for periods
approaching the end of their predicted fatigue life may need reconsideration, but that need can be
assessed if and when it occurs. For the average gas pipeline, the end of its calculated fatigue life
can be estimated on the basis of its monitored pressure history. The worst-case pipeline histories
examined in Reference 15 suggested that the average pipeline is still over 100 years from failure
due to pressure-cycle-induced fatigue because the initial hydrostatic test was well in excess of
the minimum level required for a Subpart J test. To summarize, experience and scientific
analysis indicates that manufacturing defects in gas pipelines that have been subjected to a
hydrostatic test to 1.25 times MAOP should be considered stable. No integrity assessment is
necessary to address that particular threat in such pipelines.

37
The principal challenge for deciding whether or not to consider manufacturing defects to
be stable is associated with those gas pipelines that have never been subjected to a hydrostatic
test to a minimum of 1.25 times MAOP. It should be clear that a judgment regarding stability of
manufacturing defects in such a pipeline must consider the particular circumstances surrounding
that pipeline. This means considering certain essential information consisting of physical
attributes of the pipeline, the age and manufacturing characteristics of the pipe, the historical
record of operation of the pipeline, the safety record of the pipeline, and the supervisory controls
in place to assure continued safe operation.
With respect to construction defects, it would seem that stability considerations are
practically independent of internal pressure and whether or not a pressure test has been
conducted. Girth-weld defects and the most common types of fabrication defects in
appurtenances would likely be caused to fail only under circumstances involving longitudinal
straining or movement of the pipeline. Pressure does introduce some longitudinal tensile stress,
however, so there are times when a pressure reduction could be useful, as for example, when one
is excavating or moving a pipeline where a construction defect is suspected. For the most part,
however, it would seem that the most worrisome aspect of construction defects is the effect of
soil movement on them.
To provide guidance to inspectors who may be examining integrity-management plans of
gas pipeline operators, two types of process flow diagrams have been created. These are
presented in Appendix B, and they are discussed below.
CRITERIA FOR EVALUATING ASSURANCE OF STABILITY OF MANUFACTURING AND CONSTRUCTION DEFECTS
M CHARTS for Determining Stability of Manufacturing Defects
Flow diagrams labeled M CHART 1 through M CHART 4 are shown in Appendix B, and
they are intended to assist a reviewer of integrity-management plans regarding the considerations
for stability of manufacturing defects. M CHART 1 summarizes the essential data for making an
assessment of a plan. First, the occurrence or non-occurrence of an incident at the MOP solely
caused by a manufacturing defect is considered. If an incident not related to hydrogen cracking
or hydrogen blistering has occurred, then the prudent operator would either perform a baseline
assessment (hydrostatic test or in-line seam inspection) or reduce the MOP to 80 percent of the
38
highest pressure experienced in the five years prior to the identification of the HCA (the 5-year
high MOP) unless the first-ever test to 1.25 times MAOP was performed after the occurrence of
the last M-defect-related failure. If the incident is related to hydrogen cracking or hydrogen
blistering, then the reviewer is directed to M CHART 4.
If no incident has occurred and the segment has been subjected to a Subpart J test to a
minimum of 1.25 times MAOP, then the M defects are considered stable if no interacting threats
are present. The reviewer is directed to M CHART 2 to check for interacting threats. If no
incident has occurred and the segment has not been subjected to a test to 1.25 times MAOP, then
the reviewer is directed to M CHART 3.
M CHART 2 guides the consideration of interacting threats. The interacting threats of
wet, sour gas, SCC, selective seam corrosion, and soil instability are considered. Absent these
threats, the M defects are considered stable at an MOP ≤ 80 percent of the test pressure. If one
or more interacting threat exists, the operator should consider the mitigative responses indicated.
M CHART 3 guides the consideration of stability of M defects in segments where no test
to 1.25 times MAOP has been performed. Basically, stability depends on the relationship of the
MOP to the pressure level employed by the manufacturer on each piece of pipe if there are no
interacting threats. The reviewer can refer to Tables 1 and 2 herein to find mill test pressures for
various types and vintages of API line pipe. In the absence of interacting threats, defects in the
seams of lap-welded pipe may be considered stable if the MOP does not exceed 80 percent of the
5-year high MOP, 80 percent of the pressure level of a prior Subpart J test, or 72 percent of the
mill test pressure, whichever is higher. If at least one of these conditions is not satisfied, the
operator should conduct a Subpart J test to 1.25 times MAOP.
In the absence of interacting threats, defects in the seams of LF-ERW (or dc-ERW, or
flash-welded) pipe may be considered stable if the MOP does not exceed 80 percent of the mill
test pressure. Alternatively, defects in the seams of LF-ERW (or dc-ERW, or flash-welded) pipe
may be considered stable if the MOP does not exceed 85 percent of the mill test pressure and an
analysis of pressure cycles applied to segment shows that the remaining life of the segment
exceeds 40 years. If neither of these conditions is satisfied, the defects in the seams of LF-ERW
(or dc-ERW, or flash-welded) pipe may be considered stable if the MOP does not exceed 80
percent of the 5-year high MOP or 80 percent of the pressure level of a prior Subpart J test,

39
whichever is higher. If at least one of these conditions is not satisfied, the operator should
conduct a Subpart J test to 1.25 times MAOP.
If there are no interacting threats, M defects in seamless, HF-ERW, and DSAW materials
can be considered stable if the MOP is ≤ 90 percent of the pressure employed in a gas test. If
this condition is not satisfied, the MOP should not exceed the five-year high MOP or 85 percent
of the mill test pressure, whichever is higher or the operator must conduct a baseline seam-
integrity assessment such as a hydrostatic test to a pressure level at least 1.25 times MAOP. In
every case the possibility of interacting threats must be considered also, and the reviewer is
directed to M CHART 2.
M CHART 4 is intended to assist the reviewer in considering the threats posed by
hydrogen cracking and hydrogen blistering. These phenomena are explained in Reference 18.
Hard spots and hard HAZs are susceptible to failure if subjected to atomic hydrogen
embrittlement, and laminations are susceptible to failure from hydrogen blistering. A pre-service
hydrostatic testing is of no value in preventing failures from these phenomena, because hard
spots, hard HAZs, and laminations are non-injurious at the time the pipe is installed. It is only
after some period of exposure that the hydrogen damage takes place.
In the cases of past failures of hard spots and hard HAZs, the source of hydrogen appears
to have been the cathodic protection imposed on the pipe. Atomic hydrogen is created at a
cathode (i.e., an exposed pipe surface under cathodic protection), and the more negative the
potential with respect to a reference voltage, the more aggressively hydrogen is created.
Groeneveld(19) developed test data that showed a sharp increase in the level of atomic hydrogen
generated at an exposed pipe surface as the pipe-to-soil potential level became increasingly more
negative than -1200 mV relative to a Cu-CuSO2 reference half cell. Operators who have
encountered the hard-spot problem have generally been able to locate the hard spots by means of
a special configuration of an MFL tool. Once the hard spots are located, they can be
permanently repaired by means of full-encirclement steel sleeves. These sleeves shield the pipe
from cathodic protection and prevent cracking from developing. Operators who have
encountered the hard HAZ problem have as yet no reliable means of locating the joints of pipe
with the susceptible seams. However, they generally are able to mitigate the problem by limiting
the pipe-to-soil potential levels to the range below -1200 mV while still maintaining sufficient
40
potential to mitigate corrosion. The phenomenon is so unpredictable in terms of when it may take
place that period hydrostatic testing is of no value in controlling it.
In the case of failures from hydrogen blistering, it has generally been found that the
source of the problem is wet, sour gas or some other intense internal-corrosion mechanism that
generates atomic hydrogen at the ID surface of the pipe. As the atomic hydrogen migrates
through the steel and encounters a lamination, hydrogen gas, a molecule of two hydrogen atoms
is formed. The hydrogen gas cannot readily diffuse through the steel in the manner the atomic
hydrogen does, so the gas builds up continually until the two segments of wall thickness over the
entire lamination begin to bulge outward and inward. Eventually, in most cases, a crack will
form at one longitudinal edge of the blister. The crack typically propagates to the ID surface
allowing internal pipeline pressure to communicate with the lamination. This causes the outer
half of the wall thickness to have to carry the entire hoop stress. A failure sometimes results. A
similar phenomenon called hydrogen-induced, step-wise cracking (HIC) may occur when large
numbers of non-metallic inclusions are arrayed within the wall thickness of a line-pipe material.
Many older line pipe materials contain both laminations and inclusions of various sizes. In the
absence of the blistering phenomenon, they are usually non-injurious. Blisters and blister
failures tend to be associated with pipelines carrying wet, sour gas or are otherwise subjected to
severe internal corrosion. Blisters can be prevented by either not carrying corrosive gas or by
adequately inhibiting a corrosive gas so that no acid reaction occurs at the ID surface of the pipe.
Hydrostatic testing is of little or no value in controlling the phenomenon because the rate of
blister formation and the numbers and sizes of laminations present are difficult to predict.
Pipeline operators have had some success finding blisters with in-line inspection tools. In a gas
pipeline the only types of tools that are generally suitable are MFL tools. These tools have been
known to find blisters, but their reliability with respect to finding the precursor laminations is
questionable.
Two things should be noted about pressure reductions as a means of assuring the stability
of manufacturing defects. First, to be a legitimate demonstration of stability, the 20-percent
reduction must be taken from the actual 5-year high operating pressures at all points along the
segment. It may not be enough to just reduce the discharge pressure by 20 percent. The entire
gradient must be reduced by that amount. Second, the analyses presented above show that a 20-
percent reduction is almost as good as a test to 1.25 times MAOP. Therefore, for M defects, it is

41
a permanent demonstration of stability. Since this applies only to M defects and only if there are
no interacting threats, the author believes that where the regulations state that a pressure
reduction is good for a year only, they are unnecessarily restrictive. The author believes this
latter limit is meant to be applied to time-dependent defects only. Certainly, one cannot expect
the margin demonstrated by a pressure reduction not to be eroded as time passes and corrosion or
SCC continues. Thus, if an operator were to opt for a pressure reduction to address M defects,
that operator would still have to address other threats by appropriate integrity assessments after 1
year. The integrity assessment for corrosion and possibly for SCC as well could be done by in-
line inspection, so the one-time pressure reduction could stand indefinitely for the demonstration
of stability of M defects.
The remaining issue regarding M defects concerns pressure excursions above a
benchmark MOP established during the 5 years preceding identification of the HCA. As the
previously presented fatigue analysis suggests, an occasional five-percent over-pressure would
be acceptable for segments subjected to a test to 1.25 times MAOP. Having established a 5-year
high MOP, there also would seem to be no reason why the operator could not go back to it. If a
rolling 5-year period is not to be used, there is no reason for an operator to do so, but if an
operator does go back to it, the analyses shown herein suggest that it would not create an
integrity-threatening situation. In no case however, should an operator intentionally raise the
MAOP without conducting some sort of integrity test, ideally a test to 1.25 times MAOP.
The non-tested or inadequately tested pipelines do not inspire the same degree of
confidence. If an over-pressure does occur accidentally in such a pipeline and no failure occurs,
it seems reasonable that an operator ought to conduct an engineering critical assessment such as
by attempting to calculate the effect on fatigue life. A big enough excursion without a failure
could actually be viewed as a "proof" test, though it definitely should not be encouraged because
no one can tell in advance whether or not a failure would occur. If the engineering critical
assessment shows that the fatigue life may be significantly shortened, then an integrity
assessment would be in order. In any case, the decision should be made on the basis of analysis
of the particular circumstances rather than on the basis of an arbitrary criterion.
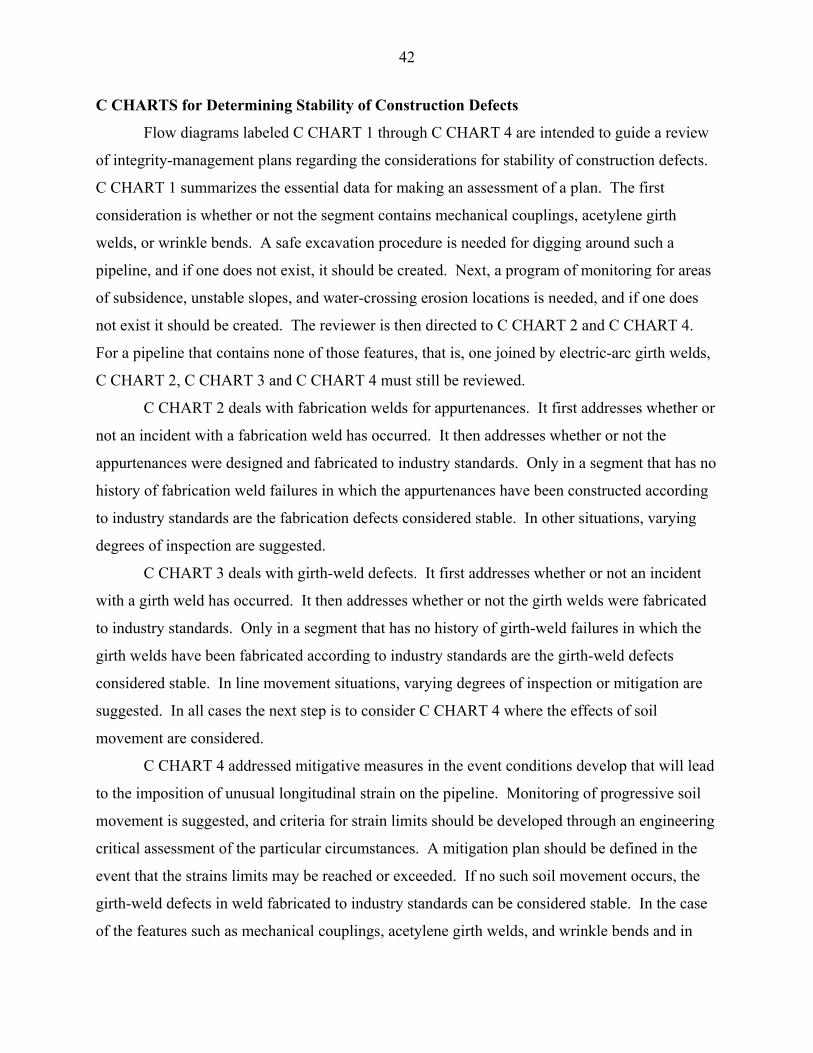
42
C CHARTS for Determining Stability of Construction Defects
Flow diagrams labeled C CHART 1 through C CHART 4 are intended to guide a review
of integrity-management plans regarding the considerations for stability of construction defects.
C CHART 1 summarizes the essential data for making an assessment of a plan. The first
consideration is whether or not the segment contains mechanical couplings, acetylene girth
welds, or wrinkle bends. A safe excavation procedure is needed for digging around such a
pipeline, and if one does not exist, it should be created. Next, a program of monitoring for areas
of subsidence, unstable slopes, and water-crossing erosion locations is needed, and if one does
not exist it should be created. The reviewer is then directed to C CHART 2 and C CHART 4.
For a pipeline that contains none of those features, that is, one joined by electric-arc girth welds,
C CHART 2, C CHART 3 and C CHART 4 must still be reviewed.
C CHART 2 deals with fabrication welds for appurtenances. It first addresses whether or
not an incident with a fabrication weld has occurred. It then addresses whether or not the
appurtenances were designed and fabricated to industry standards. Only in a segment that has no
history of fabrication weld failures in which the appurtenances have been constructed according
to industry standards are the fabrication defects considered stable. In other situations, varying
degrees of inspection are suggested.
C CHART 3 deals with girth-weld defects. It first addresses whether or not an incident
with a girth weld has occurred. It then addresses whether or not the girth welds were fabricated
to industry standards. Only in a segment that has no history of girth-weld failures in which the
girth welds have been fabricated according to industry standards are the girth-weld defects
considered stable. In line movement situations, varying degrees of inspection or mitigation are
suggested. In all cases the next step is to consider C CHART 4 where the effects of soil
movement are considered.
C CHART 4 addressed mitigative measures in the event conditions develop that will lead
to the imposition of unusual longitudinal strain on the pipeline. Monitoring of progressive soil
movement is suggested, and criteria for strain limits should be developed through an engineering
critical assessment of the particular circumstances. A mitigation plan should be defined in the
event that the strains limits may be reached or exceeded. If no such soil movement occurs, the
girth-weld defects in weld fabricated to industry standards can be considered stable. In the case
of the features such as mechanical couplings, acetylene girth welds, and wrinkle bends and in

43
cases of girth welds of questionable quality, a program of monitoring for soil movement is
recommended.
EXAMPLES
Example 1
A segment comprised of 30-inch-OD, by 0.375-inch-wall, API 5L Grade X52 DSAW
line pipe manufactured in 1950 is being operated at an MAOP of 936 psig. The pipeline was
designed in accord with the ASA code at the time. During the past 5 years the actual operating
pressure has reached but never exceeded the MAOP. The pipe was shipped by rail from the pipe
mill to the job site. Whether or not restrictions on rail car loading were imposed is not known.
The pipeline was constructed with shielded-metal-arc girth welds. It contains no wrinkle bends,
no mechanical couplings, and no acetylene girth welds. The construction records show that all
appurtenances were designed according to ASA B31.1 standards and installed by qualified
welders. The pipeline was subjected to a pre-service hydrostatic test with the minimum test
pressure being 1,170 psig. The duration of the test was 24 hours. The test records that document
the test are available. From the history of hydrostatic test failures, it is determined that none
initiated a railroad fatigue crack, and single test failure that did occur initiated at an off-seam
weld. No service failure from a manufacturing or construction defect has ever occurred.
Nothing but sweet, dry natural gas has been transported throughout the history of the segment.
No areas of soil movement or unstable soil conditions are known to exit along the segment.
Assessment: M CHART 1 steers the reviewer from "no" incidents to "yes" on the
Subpart J test to 1.25 times MAOP. On M CHART 2 the reviewer is steered to "no" on wet-sour
gas. The segment is comprised of DSAW pipe so there is no need to consider the interacting
risks associated with LF-ERW, dc-ERW, or flash-welded pipe. The M defects in the segment
are stable at an MAOP of 80 percent of the Subpart J test pressure.
Because there are no mechanical couplings, no acetylene girth welds, and no wrinkle
bends in the pipeline, C CHART 1 steers the reviewer to C CHART 2, C CHART 3 and
C CHART 4. Because there have been no appurtenance-related failures and because the
appurtenances were designed and fabricated according to industry standards C CHART 2 shows
that the fabrication welds are stable. Because there have been no girth-weld-related failures and

44
because the girth welds were fabricated according to industry standards, C CHART 3 shows that
the girth welds are stable unless mitigation is required for soil movement.
On C CHART 4 the reviewer is steered by "no" unusual strain and "no" mechanical
sleeves, acetylene girth welds, wrinkle bends, or girth welds of questionable quality to a finding
that the girth weld defects are stable.
Example 2
A segment comprised of 16-inch-OD, by 0.250-inch-wall, API 5L Grade X52 ERW line
pipe manufactured in 1950 by The Youngtown Sheet and Tube Company is being operated at an
MAOP of 1,170 psig. During the past 5 years the actual operating pressure has reached but
never exceeded the MAOP. The pipeline was constructed with shielded-metal-arc girth welds. It
contains no wrinkle bends, no mechanical couplings, and no acetylene girth welds. The
construction records show that all appurtenances were designed according to ASA B31 standards
and installed by qualified welders. The pipeline was subjected to a pre-service gas test to 1.1
times MAOP. No subsequent pressure test has ever been performed. More importantly from the
standpoint of manufacturing defects, however, is the fact that Table 2 indicates that each piece of
pipe in this pipeline was tested by the manufacturer to 1.18 times the MAOP. Nothing but sweet,
dry natural gas has been transported throughout the history of the segment. The operator has
benchmarked a recent 1-year operating pressure spectrum against the most-aggressive gas
pipeline pressure spectrum contained in Reference 15, and the spectrum of the subject pipeline
was found to be only half as aggressive as the most-aggressive spectrum. This means that the
time to failure for this pipeline would be 154 years after 1950 or twice as long as the 77-year
time to failure predicted in Table 6 for pipe subjected to the most aggressive pressure spectrum
that has been mill-tested to 85 percent of SMYS. Therefore, in 2006 one can expect the
remaining life of the pipeline to be at least 98 years. No areas of soil movement or unstable soil
conditions are known to exit along the segment.
Assessment: M CHART 1 steers the reviewer for "no" incidents to "no" on the Subpart J
test to 1.25 times MAOP. The reviewer next considers M CHART 3. The pipe is not lap-welded
but it is dc-welded Youngtown pipe. The MOP of the pipeline is 85 percent of the mill test
pressure, but the operator has conducted a pressure-cycle-aggressiveness analysis using the

45
benchmark data of Table 1. The analysis indicates a remaining life of more than 40 years, so the
M defects may be considered stable depending on the outcome of the examination of M
CHART 2. On M CHART 2 the reviewer is steered to "no" on wet-sour gas. The segment is
comprised of dc-ERW pipe so there is a need to consider the associated interacting risks. No
service failure from SCC has ever occurred, and no SCC has ever been identified on the pipeline.
The gas temperature in the past has never exceeded 100ºF. Therefore on the basis of a threat
evaluation as outlined in Paragraph A3 of ASME B31.8S there is no need to address the risk of
SCC.
The pipeline was coated with coal-tar enamel, cathodic protection has been applied from
the outset, and the latest MFL tool run shows that the line has sustained little corrosion.
Excavations have not revealed any evidence of significant selective seam corrosion, and there
has been no service failure caused by selective seam corrosion. There are no areas of unstable
soils or washouts. Therefore, M defects in the segment can be considered stable at the current
MOP.
One factor that should not be overlooked is the fact that the pipe falls into the grade range
and vintage of pipe manufactured by Youngtown that occasionally exhibited excessively hard
HAZs along the seams. M Chart 4 can be used to evaluate the possible need for mitigative
actions. No failure has occurred in the segment from this phenomenon, so one cannot say that
the pipeline is at risk. On the other hand, the prudent operator might consider limiting the pipe-
to-soil OFF-potential levels to values no more negative than -1,200mV. Also, if material is
removed for any reason, a metallographic section across the seam would reveal what hardness
levels might be expected in the HAZs.
Because there are no mechanical couplings, no acetylene girth welds, and no wrinkle
bends in the pipeline, C CHART 1 steers the reviewer to C CHART 2, C CHART 3, and C
CHART 4. Because there have been no appurtenance-related failures and because the
appurtenances were designed and fabricated according to industry standards, C CHART 2 shows
that the fabrication welds are stable. Because there have been no girth-weld-related failures and
because the girth welds were fabricated according to industry standards, C CHART 3 shows that
the girth welds are stable unless mitigation is required for soil movement

46
On C CHART 4 the reviewer is steered by "no" unusual strain and "no" mechanical
sleeves, acetylene girth welds, wrinkle bends, or girth welds of questionable quality to a finding
that the girth-weld defects are stable.
Example 3
This case is the same as Example 2 except that the pipeline has been operated for the last
5 years at a maximum pressure level of only 1,000 psig and the operator now wishes to utilize
the full 1,170 psig MAOP going forward. The operator has done the analysis as noted in
Example 2 to show that the pressure cycles during the previous operation with an MOP of 1,170
psig were only half as aggressive as the benchmark cycles of Table 6. Thus, it would appear that
the time to failure for the worst-case manufacturing defect is still at least 93 years into the future.
Assessment: The situation of this pipeline is hardly different from that of the pipeline in
Example 2. The dip in pressure over a period of time does not significantly alter the situation.
Therefore, it would seem reasonable to consider the manufacturing and construction defects
stable on the same basis as in Example 2. The point of this example is to show that when the
test-pressure-to-operating-pressure ratio and its effect on fatigue life and pressure reversals are
adequately taken into account, the maximum established operating pressure need not be lowered
in the absence of some interacting threat.

47
REFERENCES
(1) Bergman, S. A., “Why Not Higher Operating Pressures for Lines Tested to 90% SMYS?”,
Pipeline and Gas Journal (December 1974). (2) Duffy, A.R., McClure, G.M., Maxey, W.A., and Atterbury, T.J., “Study of Feasibility of
Basing Natural Gas Pipeline Operating Pressure on Hydrostatic Test Pressure”, American Gas Association, Inc., Catalog No. L30050 (February 1968).
(3) Kiefner, J.F., and Clark, E.B., History of Line Pipe Manufacturing in North America,
ASME, CRTD-Vol.43 (1996). (4) Clark, E.B., Leis, B.N., and Eiber, R.J., “Integrity Characteristics of Vintage Pipelines”, The
INGAA Foundation, Inc. (2005). (5) Kiefner, J. F., “Dealing with Low-Frequency-Welded ERW Pipe and Flash-Welded Pipe
with Respect to HCA-Related Integrity Assessments”, Proceedings of Engineering Technology Conference on Energy, Houston, Texas (February 2002).
(6) Zelenak, P.A., Haines, H., and Kiefner, J.F., “Analysis of DOT Reportable Incidents for Gas
Transmission and Gathering System Pipelines 1985 Through 2000”, Pipeline Research Council International, Inc., Catalog No. L51885 (January 2004).
(7) Pipeline Accident Report: Rupture of Enbridge Pipeline and Release of Crude Oil near
Cohasset, Minnesota, July 4, 2002, NTSB Report Number: PAR-04-01, adopted on 6/23/2004.
(8) Kiefner, J.F., Kiefner, B.A., and Vieth, P.H., “Analysis of DOT Reportable Incidents for
Hazardous Liquid Pipelines, 1986 Through 1996”, API Publication 1158 (January 7, 1999).
(9) Kiefner, J.F., Maxey, W.A., Eiber, R.J., and Duffy, A.R., "Failure Stress Levels of Flaws in Pressurized Cylinders", Progress in Flaw Growth and Toughness Testing, ASTM STP 536, American Society for Testing and Materials, pp 461-481 (1973).
(10) Brooks, L.E., "High-Pressure Testing – Pipeline Defect Behavior and Pressure Reversals",
ASME, 68-PET-24 (1968). (11) Kiefner, J. F., Maxey, W.A., and Eiber, R.J., "A Study of Causes of Failure of Defects That
Have Survived a Prior Hydrostatic Test", Pipeline Research Committee, American Gas Association, NG-18 Report No. 111, (November 3, 1980).
(12) Fearnehough, G.D., Hopkins, P., and Jones, D.G., "The Effect of Hydrostatic Test Hold
Period on Defect Behavior and Surviving Defect Population", EPRG/NG-18, 8th Biennial Joint Technical Meeting on Line Pipe Research (May 14-17, 1991).

48
(13) Leis, B.N. and Brust, F.W., "Hydrotest Strategies for Gas Transmission Pipelines Based on Ductile-Flaw-Growth Considerations", American Gas Association, Pipeline Research Committee, NG-18 Report No. 194 (July 27, 1992).
(14) Hazardous Liquid Pipe Failure and Leak, Explorer Pipeline Company, Greenville, Texas,
March 9, 2000, NTSB Report Number: PAB-01-03, adopted on 7/6/2001. (15) Kiefner, J. F., and Rosenfeld, M.J., "Effects of Pressure Cycles on Gas Pipelines", Gas
Research Institute Contract No. 8749, Report No. GRI-04/0178 (September 17, 2004). (16) Kiefner, J.F., Kolovich, C.E., Zelenak, P.A., and Wahjudi, T., “Estimating Fatigue Life for
Pipeline Integrity Management”, IPC04-0167, Proceedings of IPC 2004 International Pipeline Conference, Calgary, Alberta, Canada (October 4-8, 2004).
(17) Peirce, B.O., A Short Table of Integrals, Third Revised Edition, Ginn and Company (1929). (18) Kim, C.D., "Hydrogen-Damage Failures", Metals Handbook, Ninth Edition, Volume 11,
Failure Analysis and Prevention, American Society for Metals (1986). (19) Groeneveld, T.P., "Hydrogen Stress Cracking", Fifth Symposium on Line Pipe Research,
American Gas Association, Inc., Catalog No. L30174 (November 20-22, 1974). (20) Masamura, K. and Masushima, I., “Grooving and Corrosion of Electric Resistance Welded
Steel Pipe in Water, Case Histories and Effects of Alloying Elements”, CORROSION/81, NACE (1981).

APPENDIX A
Typical Manufacturing and Construction Defects

A-1

A-2

A-3

A-4

A-5

A-6

APPENDIX B
M and C Charts

M CHART 1 BASIC DETERMINATION OF WHETHER OR NOT MANUFACTURING DEFECTS ARE STABLE
Segment has had an in-service incident caused solely by an M defect
Segment has been subjected to Subpart J
Test to 1.25 times MAOPGo to M CHART 2 THREATS
INTERACTING WITH MANUFACTURING DEFECTS
Conduct Subpart J Test to 1.25 times MAOP or reduce MOP to 80% of 5-year high MOP unless the segment was subjected for
the first time to a Subpart J Test to 1.25 times MAOP after the
occurrence of the incident
Go to M CHART 3DETERMINING STABILITY FOR M
DEFECTS IN PIPELINES THAT HAVE HAD NO IN-SERVICE
INCIDENT CAUSED SOLELY BY AN M DEFECT AND HAVE HAD NO SUBPART J TEST TO 1.25 TIMES
MAOP
yes
yes
no
no
Incident involved blister, hard spot,
or hard HAZ
Go To M CHART 4STABILITY OF M
DEFECTS THAT MAY BE SUSEPTIBLE TO
HYDROGEN CRACKING AND HYDROGEN
BLISTERS
yes
no
Start
M defects are stable at
MAOP≤80% of Subpart J test
pressure absent
interacting threats
Essential DataDiameterWall ThicknessAPI 5L GradeSeam TypeDesign standards Year of ManufactureDocumentation for Subpart J TestMOP for the five years preceding HCA identification Pressure excursions above the MOPIncidents arising solely from M Defects
Segment was subjected to Subpart J test to 1.25 times MOP
prior to incident (NOTE: If more than one such incident has occurred do the following
for each incident)
Incident involved blister, hard spot,
or hard HAZ
M defects are stable at
MAOP≤80% of Subpart J test
pressure or 80 % of 5-year-
high MOP absent interacting threats
yes
no
yes no
B-1
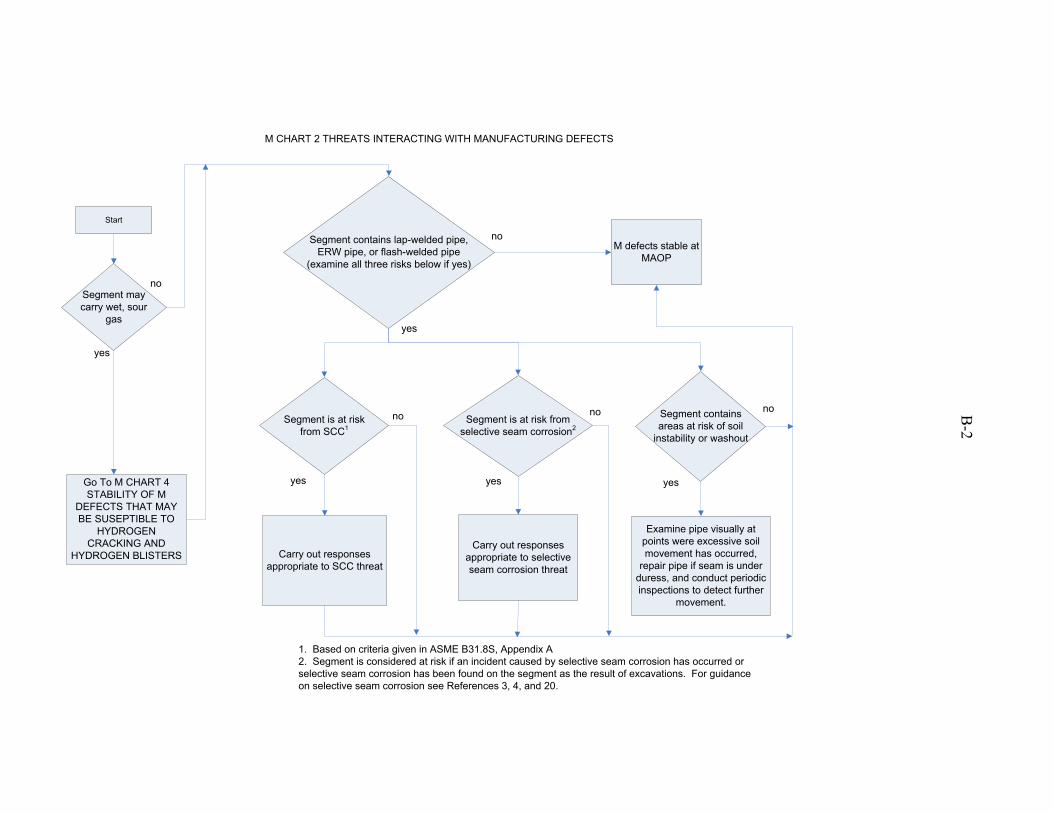
M CHART 2 THREATS INTERACTING WITH MANUFACTURING DEFECTS
Segment contains lap-welded pipe, ERW pipe, or flash-welded pipe
(examine all three risks below if yes)
Carry out responses appropriate to selective seam corrosion threat
yes
no
Start
Carry out responses appropriate to SCC threat
M defects stable at MAOP
Examine pipe visually at points were excessive soil movement has occurred,
repair pipe if seam is under duress, and conduct periodic inspections to detect further
movement.
Segment is at risk from SCC1
Segment is at risk from selective seam corrosion2
Segment contains areas at risk of soil
instability or washout
Go To M CHART 4STABILITY OF M
DEFECTS THAT MAY BE SUSEPTIBLE TO
HYDROGEN CRACKING AND
HYDROGEN BLISTERS
Segment may carry wet, sour
gas
no
yes
yes yes yes
no nono
1. Based on criteria given in ASME B31.8S, Appendix A2. Segment is considered at risk if an incident caused by selective seam corrosion has occurred or selective seam corrosion has been found on the segment as the result of excavations. For guidance on selective seam corrosion see References 3, 4, and 20.
B-2

M CHART 3 DETERMINING STABILITY FOR M DEFECTS IN SEGMENTS THAT HAVE HAD NO IN-SERVICE INCIDENT CAUSED SOLELY BY AN M DEFECT AND HAS HAD NO
SUBPART J TEST TO 1.25 TIMES MAOP
Start
Segment contains lap-welded pipe
Segment contains LF-ERW, dc-ERW, or flash-
welded pipe
MOP not to exceed 80% of 5-year high MOP, 80% of
pressure attained in previous Subpart J Test, or 72% of mill test pressure
whichever is higher or conduct Subpart J Test to
1.25 times MAOP
MOP not to exceed 80% of 5-year high MOP, 80% of pressure attained in a
previous Subpart J Test or 80% of mill test pressure
whichever is higher or conduct Subpart J Test to
1.25 times MAOP
Tested with gas to 1.1 times MOP
MOP not to exceed 5-year high MOP or 85% of
mill test pressure whichever is higher or
conduct Subpart J Test to 1.25 times MAOP
MOP ≤ 80% of mill test pressure
M Defects Stable at MOP absent
interacting threats
MOP ≤ 85% of mill test pressure
Analysis of pressure cycles shows remaining life exceeding 40 years
yes
no
yes
no
yes
no
yesyes
yes
no
no
no
Go to M CHART 2THREATS
INTERACTING WITH MANUFACTURING
DEFECTS
M Defects Stable at MOP absent
interacting threats
B-3

M CHART 4 STABILITY OF M DEFECTS THAT MAY BE SUSCEPTIBLE TO HYDROGEN CRACKING AND HYDROGEN BLISTERING
HARD SPOTS HYDROGEN BLISTERS HARD HAZs
Segment contains A.O. Smith Grade X52
pipe with diameter of 26-inch or greater and pipe was manufactured
prior to 1960Wet sour gas is
transported
Segment contains X46 or X52 YS&T ERW pipe material
manufactured prior to 1960
Low risk of hard spots
Hard spot failure has occurred
Conduct ILI to locate and repair
all pipe affected by hard spots
Threat eliminated
Blister failure has occurred
Mitigate with dehydration,
piggiing, and/or inhibitors
Conduct ILI to locate and repair
blistered pipe
Segment not at risk from blister
failure
Hard HAZ failure has occurred
Segment can be considered to have low risk from hard
HAZs
Examine HAZ hardnesses of any
pipe that is removed for any
purpose
HAZ hardness < 33 Rc
Conduct CIS and mitigate areas where P/S potentials are more negative than -1.2
volts w/r Cu-CuSO4 reference half cell
Examine pipe for flat spots any time pipe is
exposed. Examine suspicious geometric
anomalies revealed by ILI
Hard spot located
yes
yes
yes
yes
yes
yes
no
no
no
no
no
no
yes
no
no
B-4
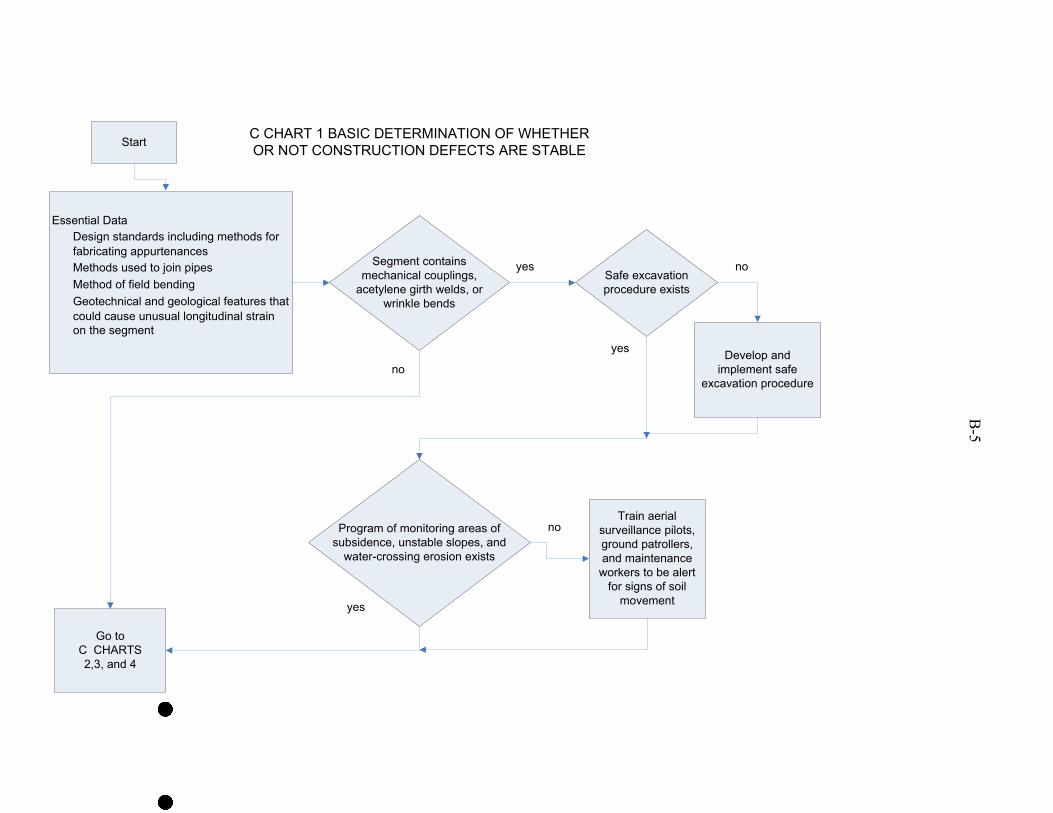
C CHART 1 BASIC DETERMINATION OF WHETHER OR NOT CONSTRUCTION DEFECTS ARE STABLEStart
Safe excavation procedure exists
Segment contains mechanical couplings,
acetylene girth welds, or wrinkle bends
Program of monitoring areas of subsidence, unstable slopes, and
water-crossing erosion exists
Develop and implement safe
excavation procedure
Go to C CHARTS 2,3, and 4
yes
no
yes
no
yes
no
Develop program for monitoring
Train aerial surveillance pilots, ground patrollers, and maintenance
workers to be alert for signs of soil
movement
Essential DataDesign standards including methods for fabricating appurtenancesMethods used to join pipesMethod of field bending Geotechnical and geological features that could cause unusual longitudinal strain on the segment
B-5

C CHART 2 DETERMINATION OF WHETHER OR NOT FABRICATION DEFECTS ARE STABLE
Start
Fabrication defects are found to exit
Appurtnances designed and fabricated as per ASA or
ASME standards
Carry out inspections of like and similar appurtenances
Segment has had and C incident caused by an improperly fabricated
appurtenance
Conduct non-destructive examinations of selected
appurtenances as opportunities arise
no
Appurtenances can be considered free from unstable fabrication defects
but assess for mitigation as per C CHART 4
yes
noyes
yes
noFabrication defects are found
to exit
Repair defective appurtenances
yesno
Repair defective appurtenances and carry out inspections of like and
similar appurtenances
B-6

C CHART 3 DETERMINATION OF WHETHER OR NOT GIRTH WELD DEFECTS ARE STABLE
Start
Girth weld defects are found to exist
Segment constructed of girth welds that met API Std 1104 or ASME Section IX at the time of
construction
Conduct non-destructive examinations of girth welds within any segment where the alignment is being intentionally changed by
lowering or moving the pipe.
Segment has had and C incident caused by an improperly
fabricated girth weld
no
Girth welds can be considered free of
unstable defects but assess need for
mitigation as per C CHART 4
yes
noyes
yes
no
Repair defects or reinforce affected girth
welds
B-7

C CHART 4 MITIGATION OF EFFECTS OF SOIL MOVEMENT
Start
Segment contains mechanical couplings, acetylene girth welds, wrinkle bends or girth welds of
questionable quality
Train aerial surveillance pilots, ground patrollers, and maintenance workers to be alert
for signs of soil movement
Develop site-specific mitigation plan for each such situation identified
through periodic monitoring
Segment is affected by conditions that may impose
unusual longitudinal strain on the pipeline
Girth welds can be considered free of unstable construction
and fabrication defects. Couplings, acetylene girth
welds and wrinkle bends can be considered not at risk
Develop and implement plan to monitor progressive soil
movement or erosion at suspect sites. Develop strain level criteria for intervention
as per ASME B31.8
yes
no
yesno
Remediate or mitigate all such situations
B-8