KHALID IBRAHIM AHMED - Cardiff Universityorca.cf.ac.uk/58191/1/2014AhmedKIPhD.pdf · KHALID IBRAHIM...
302
EFFECT OF GYPSUM ON THE HYDRO-MECHANICAL CHARACTERISTICS OF PARTIALLY SATURATED SANDY SOIL KHALID IBRAHIM AHMED Geoenvironmental Research Centre Cardiff School of Engineering Cardiff University Thesis submitted in candidature for the degree of Doctor of Philosophy at Cardiff University September 2013
Transcript of KHALID IBRAHIM AHMED - Cardiff Universityorca.cf.ac.uk/58191/1/2014AhmedKIPhD.pdf · KHALID IBRAHIM...

EFFECT OF GYPSUM ON THE HYDRO-MECHANICAL
CHARACTERISTICS OF PARTIALLY SATURATED
SANDY SOIL
KHALID IBRAHIM AHMED
Geoenvironmental Research Centre
Cardiff School of Engineering
Cardiff University
Thesis submitted in candidature for the degree of Doctor of Philosophy
at
Cardiff University
September 2013

ii
DECLARATION
This work has not been submitted in substance for any other degree or award at this
or any other university or place of learning, nor is being submitted concurrently in
candidature for any degree or other award.
Signed ………………………. (Khalid Ibrahim Ahmed)
Date …… 04 / 09/2013
STATEMENT 1
This thesis is being submitted in partial fulfilment of the requirements for the degree
of Doctor of Philosophy (PhD).
Signed ………………………. (Khalid Ibrahim Ahmed)
Date …… 04 / 09/2013
STATEMENT 2
This thesis is the result of my own independent work/investigation, except where
otherwise stated. Other sources are acknowledged by explicit references. The views
expressed are my own.
Signed ………………………. (Khalid Ibrahim Ahmed)
Date …… 04 / 09/2013
STATEMENT 3
I hereby give consent for my thesis, if accepted, to be available for photocopying and
for inter-library and for the title and summary to be made available to outside
organisations.
Signed ………………………. (Khalid Ibrahim Ahmed)
Date …… 04 / 09/2013

iii
ABSTRACT
Gypsum rich soils are of wide occurrence in the Middle East. They cover large
areas of Iraq. Gypsum is one of the moderately soluble salts that can have significant
effect on the engineering properties of soils. The effect of gypsum content and the
stress state on the main hydraulic functions, volume change, shear strength and
deformation characteristics of unsaturated silty clayey sand were experimentally
examined. Statically compacted specimens of synthetic sand-gypsum mixtures were
used. A new stress controllable pressure plate device was developed. The modified
device was used to establish simultaneously both the stress-dependent soil-water
characteristic curves (SD-SWCCs) and the stress-dependent hydraulic conductivity
functions (SD-HCFs) during drying and wetting paths.
The test results revealed that the parameters of the drying SWCC such as the
water holding capacity, the air-entry suction, the air-entry water content, and the
residual suction are clearly increased with increasing gypsum content. Same effect of
gypsum was noticed on the wetting SWCC parameters. A clear decrease in saturated
water content, desorption rate, absorption rate, and water holding capacity with
increasing the applied net normal stress was noticed. Transient outflow methods
were used to measure the SD-HCFs. An increase in the SD-HCFs with increasing
gypsum content was found. Clear hysteresis effects on k(ψ) and minor hysteresis on
k(w) were noticed. It was found that the outflow methods can be applicable between
the air-entry suction and residual suction only.
Direct shear tests were carried out on saturated and unsaturated specimens. The
unsaturated specimens were air-dried and tested under constant water content
conditions. Matric suction values were evaluated by incorporating the SD-SWCC test
results. The friction angle related to matric suction (b), the effective stress parameter
(χ), and the suction stress (s′) were found clearly decrease with increasing gypsum
content and with increasing the net normal stress level. However, test results of
saturated specimens revealed that the effective shear strength parameters (′, c′) are
noticeably increased with increasing gypsum content in the soil mixture.

iv
ACKNOWLEDGMENTS
In the Name of Allah, the All- Merciful, the All-Compassionate.
The praise is due to Allah, the All-Powerful, the All-Knowing, the All-Wise and the
Compassionate for giving me the strength, health, patience and perseverance to
complete this work in its best.
I would like to express my sincere gratitude to my senior supervisor Prof. Hywel
Thomas and the co-supervisors Dr. Snehasis Tripathy and Dr. Talib Mahdi for all
continuous support, motivation and invaluable academic guidance. Special thanks are
extended to the examination panel, Prof. Chris Clayton, Prof. David Barrow, and Dr.
Steve Rees for their worth comments, guidance and careful review of this thesis.
I would like to especially thank the Embassy of the Republic of Iraq / Cultural
attaché for financial support during my study. My gratitude is also extended to all
Professors of the University of Baghdad / College of Engineering for teaching me the
principles of engineering through (1978-1986).
Great thanks also to the Geotechnical technician Mr. Len Czekaj and all the technical
staff in Cardiff School of Engineering for their assistance in the lab. My special
thanks also extended to all academic staff especially Dr. Michael Harbottle for his
annual reviews of my research. I would like to express my gratitude also to all admin
staff in the research office and the Geoenvironmental research centre especially Mrs
Pauline Welsh, Mrs Chris Lee, Mrs Jeanette Whyte, Mrs Aderyn Reid. My sincere
thanks also extended to my colleagues and friends in the Geoenvironmental Research
Centre and other School Departments for their friendship and kindness.
Finally, and most of all, I would like to express my deepest gratitude and
appreciation to my wife and my children Dhuha, Ibrahim and Ahmed for their help,
sacrifices, and patience during my studies.

v
TABLE OF CONTENTS
DECLARATION ii
ABSTRACT iii
ACKNOWLEDGMENTS iv
TABLE OF CONTENTS v
LIST OF TABLES xi
LIST OF FIGURES xiii
1: INTRODUCTION 1
1.1. General background 1
1.2. Objectives and scope of the research 4
1.3. Thesis organization 7
2: LITERATURE REVIEW 9
2.1. Introduction 9
2.2. Gypsiferous soils 10
2.2.1. Gypsum properties 11
2.2.2. Effect of gypsum on soil behaviour 13
2.2.3. Effect of soaking on mechanical properties of gypsiferous soils 15
2.3. Unsaturated soil state 16
2.3.1. State variables and material variables 16
2.3.2. Stress state variables 17
2.3.2.1. The variable effective stress state single approach 18
2.3.2.2. The two independent stress state variable approach 19
2.3.2.3. The true effective stress state variable approach 20
2.3.3. Total head as a state variable 22
2.4. Soil suction and soil-water characteristic curve 23
2.4.1. Soil suction and potential energy 23
2.4.2. Components of soil suction 25
2.4.3. Overview of soil suction measurement techniques 26
2.4.4. Chilled mirror hygrometer 28
2.4.5. Suction controlling techniques 29
2.4.6. Axis translation techniques 31
2.4.6.1. Pressure plate extractor 32

vi
2.4.6.2. Tempe pressure cells 34
2.4.6.3. Volumetric pressure plate extractor 36
2.4.6.4. Stress-controllable volumetric pressure plate 38
2.4.7. Soil-water characteristic curve 41
2.4.8. Hysteresis of soil-water characteristic curve 44
2.4.9. Influence of stress state on SWCCs 47
2.4.10. Influence of compaction water content on soil structure 50
2.5. Unsaturated hydraulic conductivity 51
2.5.1. Basic definitions 51
2.5.2. Overview of measuring methods of unsaturated conductivity 51
2.5.3. One-dimensional transient flow governing equation 53
2.5.4. Outflow methods 54
2.5.4.1. The multistep method 55
2.5.4.2. The one-step method 56
2.5.5. Ceramic disc impedance 58
2.6. Shear strength and failure criteria 59
2.6.1. The extended Mohr-Coulomb criterion 60
2.6.2. Single stress state Mohr-Coulomb criterion 62
2.6.3. True effective stress failure criterion 64
2.6.4. Shear strength prediction using constitutive models 66
3: MATERIALS, EQUIPMENT AND METHODOLOGY 68
3.1. Introduction 68
3.2. Materials and samples preparation 69
3.3. Soil classification parameters 70
3.4. Experimental programme 73
3.4.1. Compaction tests 73
3.4.2. Consolidation tests 74
3.4.3. Soil-water characteristic tests 76
3.4.3.1. Testing device 77
3.4.3.2. Specimen preparation 77
3.4.3.3. Testing procedure and calculations 78
3.4.4. Chilled mirror hygrometer tests 81
3.4.4.1. Testing device 81

vii
3.4.4.2. Specimen preparation and testing procedure 82
3.4.4.3. Representation of test results 83
3.4.5. Soil shrinkage characteristic tests 83
3.4.5.1. Testing procedure for SCCs 84
3.4.5.2. Calculations of CLOD tests 86
3.4.5.3. Mathematical modelling of SCCs 87
3.4.6. Stress-dependent soil-water characteristic tests 88
3.4.7. Stress dependent-unsaturated hydraulic conductivity function tests 89
3.4.8. Direct shear tests on saturated specimens 90
3.4.8.1. Overview 90
3.4.8.2. Direct shear testing device 91
3.4.8.3. Device calibration 92
3.4.8.4. Specimens preparation 94
3.4.8.5. Testing procedure and calculations 95
3.4.8.6. Stresses and strains 96
3.4.9. Direct shear tests on unsaturated specimens 98
3.4.9.1. Overview 98
3.4.9.2. Experimental programme 99
3.4.9.3. Specimens preparation 101
3.4.9.4. Device adjustment 102
3.4.9.5. Testing procedure for unsaturated soil specimens 105
3.4.9.6. Calculations of unsaturated shear strength functions 106
4: MODIFIED DEVICE FOR MEASURING TWO STRESS DEPENDENT-
UNSATURATED HYDRAULIC FUNCTIONS 109
4.1. Introduction 109
4.2. The modified stress controllable pressure plate device 110
4.2.1. Background 110
4.2.2. Uses and features of the modified device 110
4.2.3. Design and construction details 111
4.2.3.1. The base plate of the cell 113
4.2.3.2. The cell ring 114
4.2.3.3. The dual grooved spacers 115
4.2.3.4. The pneumatic compartment cap 117

viii
4.2.3.5. The cell assemblage 118
4.2.3.6. The pressurized air panel 118
4.2.4. Specimen preparation and testing procedures 120
4.2.4.1. Specimen compaction and saturation 120
4.2.4.2. Testing procedure for SD-SWCCs determination 121
4.2.4.3. Testing procedure for SD-HCF determination 122
4.2.4.4. Diffused air removal 123
4.3. Testing programme 124
4.3.1. SD-SWCCs tests 125
4.3.2. SD-HCFs tests 126
4.4. Calculations 126
4.4.1. Calculations of SD-SWCCs 126
4.4.2. Calculations of SD-HCFs 128
4.5. Summary 132
5: RESULTS AND DISCUSSION OF BASIC TESTS 134
5.1. Introduction 134
5.2. Effect of gypsum content on compaction characteristics 134
5.3. Effect of gypsum content on compressibility characteristics 139
5.4. Soil-water characteristics 143
5.4.1. Same specimen approach-SWCC tests 144
5.4.2. Separate specimens approach-SWCC tests 145
5.4.3. Effect of gypsum content on SWCC parameters 146
5.4.4. Matric suction-volumetric water content relationships 148
5.4.5. Applied suction and volume change 149
5.5. Water content-total suction relationships 152
5.6. Shrinkage characteristics 155
5.7. Concluding remarks 158
6: STRESS-DEPENDENT SOIL-WATER CHARACTERISTICS 160
6.1. Introduction 160
6.2. Test results preview 161
6.3. Effects of gypsum content on the SD-SWCCs parameters 169
6.3.1. Effects of gypsum content on SD-SWCCs-water content parameters 169

ix
6.3.2. Effects of gypsum content on the SD-SWCCs-suction parameters 170
6.3.3. Effects of gypsum content on the slope of the SD-SWCC 171
6.3.4. Effects of gypsum content on hysteresis phenomenon 172
6.3.5. Effect of gypsum content on suction-water content equalization time 173
6.4. Effects of net normal stress on SD-SWCCs parameters 174
6.4.1. Effect of net normal stress on initial water content of SD-SWCC 174
6.4.2. Effect of net normal stress on characteristic zones of SD-SWCC 175
6.4.3. Effects of net normal stress on SD-SWCCs characteristic points 176
6.4.4. Effect of net normal stress on the slope of SD-SWCCs 176
6.4.5. Effect of net normal stress on hysteresis phenomenon 176
6.5. Mathematical modelling of SD-SWCCs 177
6.6. Comparison of SWCCs obtained from different equipment 180
6.7. Combined SWCCs of different sand-gypsum mixtures 184
6.8. Summary and concluding remarks 188
7: STRESS DEPENDENT-UNSATURATED HYRAULIC CONDUCTIVITY
FUNCTIONS 189
7.1. Introduction 189
7.2. Effect of gypsum content on SD-HCFs 189
7.2.1. Hydraulic conductivity-matric suction relationships 190
7.2.2. Hydraulic conductivity-gravimetric water content relationships 196
7.3. Comparison of Doering's approach with Gardner's approach 201
7.4. Effect of net normal stress on SD-HCFs 204
7.4.1. Hydraulic conductivity-matric suction relationships 204
7.4.2. Hydraulic conductivity-gravimetric water content relationships 208
7.5. Summary and concluding remarks 211
8: SHEAR STRENGHTH AND DEFORMATION CHARACTERISTICS 213
8.1. Introduction 213
8.2. Results of direct shear tests on saturated specimens 213
8.2.1. Stress-strain characteristics 214
8.2.2. Effect of gypsum content on saturated shear strength 220
8.2.3. Mohr-Coulomb failure envelopes and shear strength parameters 221
8.3. Results of direct shear tests on unsaturated specimens 223

x
8.3.1. Shear strength-water content relationships 224
8.3.2. Failure envelopes in plane of net normal stress-shear stress 226
8.3.3. Apparent cohesion and friction angle versus water content 230
8.3.4. Failure envelopes in plane of matric suction-shear stress 231
8.3.5. Effect of gypsum content on and χ 236
8.3.6. Prediction of unsaturated failure envelopes 239
8.3.7. Suction stress characteristic curves 242
8.3.8. Shear strength failure envelopes in terms of intergranular effective stress 247
8.4. Concluding remarks 249
9: CONCLUSIONS AND RECOMMENDATIONS 251
9.1. Conclusions from conventional, standard tests 252
9.2. Conclusions from developed-stress dependent-hydraulic tests 254
9.3. Conclusions from shear strength tests 257
9.4. Recommendations for future works 259
REFERENCES 262
APPENDIX: A 278
APPENDIX: B 279

xi
LIST OF TABLES
Table 2.1. Summary of common laboratory and field techniques for measuring soil
suction (modified from Lu and Likos, 2004). 27
Table 2.2. Summary of common laboratory techniques of controlling soil suction. 30
Table 3.1. Index properties of the prepared samples. 71
Table 3.2. The framework of direct shear tests on unsaturated specimens. 100
Table 3.3. Normal loads result from different degrees of head screw tightness. 103
Table 4.1. Initial conditions for specimens statically compacted from different sand-
gypsum mixtures. 126
Table 5.1. Compaction characteristics of the sandy soil with different gypsum
additives (standard Proctor tests). 135
Table 5.2. Fittings parameters and statistical indices of SWCCs of different sand-
gypsum mixtures, carried out via commercial pressure plate by using
separate approach. 146
Table 5.3. SWCC parameters for different sand-gypsum mixtures. 147
Table 5.4. Fitting parameters of the SCCs of different sand-gypsum mixtures found
from separate specimens-SWCC tests, implemented by using the
commercial pressure plate. 151
Table 5.5. Fitting parameters of the SCCs of different sand-gypsum mixtures
determined from CLOD tests. 157
Table 6.1. SWCCs parameters for specimens having different gypsum contents tested
under different loading conditions. 168
Table 6.2. Initial gravimetric water contents of the SD-SWCCs of different sand-
gypsum mixtures. 175
Table 6.3. The fitting parameters and the coefficient of determination (R2) for
specimens having five different gypsum contents, tested under four
different net normal stress levels. 178
Table 6.4. Comparison of SWCCs parameters obtained by using the modified stress
controllable pressure plate device and those obtained from the commercial
pressure plate. 182
Table 6.5. Residual suction and residual water content for different sand-gypsum
mixtures defined from the combined SWCCs in comparison to those
found from the single SWCCs. 188
Table 8.1. Lateral displacement corresponding to maximum shear stress under
different normal stress levels for different sand-gypsum mixtures. 217
Table A.1. Fitting parameters and statistical indices of different SWCCs found by
using the commercial pressure plate (using the same specimens
throughout the whole tests). 278
Table A. 2. Fitting parameters and statistical indices of different combined SWCCs
after the joining of the dew point potentiameter results with that of the

xii
modified stress controllable pressure plate device for specimens tested
under 0 kPa net normal stress. 278
Table B.1. Peak shear strength of saturated sand-gypsum mixtures having different
gypsum contents by weight. 284
Table B.2. Peak shear strength parameters of saturated sand-gypsum mixtures having
different gypsum contents by weight. 284

xiii
LIST OF FIGURES
Figure 2.1. Chilled-mirror dew point hygrometer, (A) a photograph of WP4-C model
device and (B) schematic diagram of the chilled mirror technique (Lu and
Likos, 2004). 29
Figure 2.2. Pressure plate extractor, (a) photograph and (b) cross-sectional drawing
(Soilmoisture Equipment Corp, 2008). 33
Figure 2.3. Tempe pressure cell, (a) photograph of disassembled cell, (b) cross
sectional view of the cell (Soilmoisture Equipment Corp., 2008). 35
Figure 2.4. Schematic drawing showing the setup of the volumetric pressure plate
extractor with hysteresis attachments (Soilmoisture Equipment Corp.,
2008). 37
Figure 2.5. Stress-controllable volumetric pressure plate extractor developed by Ng
and Pang (2000), (a) a photograph of different components and the cell
assemblage, (b) schematic drawing of the experimental setup. 40
Figure 2.6. A photograph showing Fredlund SWCC device (GCTS Testing Systems). 41
Figure 2.7. Typical soil-water characteristic curve (modified from Perez-Ruiz, 2009). 42
Figure 2.8. Typical presentation of soil-water characteristic curves showing initial
drying curve, main drying curve, main wetting curve and scanning
curves (modified from Pham et al., 2003). 45
Figure 2.9. Effect of stress state on soil-water characteristic curves for, (a) specimens
compacted dry of optimum water contents, (b) specimens compacted wet
of optimum water contents (Vanapalli et al., 1998). 48
Figure 2.10. Effect of stress state on soil-water characteristic curves (Ng and Ping,
2000). 49
Figure 3.1. Grain-size distribution of gypsum at different soaking periods
(Hydrometer tests). 72
Figure 3.2. Particle size distribution curves of sandy soil, gypsum, and the synthetic
samples. 73
Figure 3.3. Schematic drawing of static compaction mould for specimens used for
consolidation tests. 75
Figure 3.4. Photographs showing (a) compaction mould components, (b) compaction
setup for specimens used for SWCC tests. 78
Figure 3.5. Photograph of the general set-up of the direct shear device. 92
Figure 3.6. Calibration lines of horizontal displacement transducer during forward,
backward, and second forward movement. 93
Figure 3.7. Shear box component with the compaction ram used in static compaction. 94
Figure 3.8. A schematic diagram showing the corrected cross-sectional sheared area
in a circular shear box. 97
Figure 3.9. A schematic diagram showing the normal pressure pneumatic system of
the direct shear device. 102

xiv
Figure 4.1. A photograph of experimental setup of the modified device. 112
Figure 4.2. A photograph of disassembled modified cell. 112
Figure 4.3. Mechanical drawings of the base plate of the modified cell. 113
Figure 4.4. A photograph showing the base plate of the modified cell, (A) with the
ceramic disc, (B) before installing the ceramic disc. 114
Figure 4.5. The mechanical drawings of the grooved spacers used with the modified
stress controllable pressure plate cell. 116
Figure 4.6. Isometric assemblage of the basic components of the modified cell. 116
Figure 4.7. Mechanical drawings of the pneumatic compartment cap of the modified
cell. 117
Figure 4.8. Schematic section of modified stress controllable pressure plate cell. 118
Figure 4.9. A photograph of disassembled and assembled manometer cell. 119
Figure 4.10. The mechanical drawings of compaction mould compatible with
specimen ring of the modified device. 120
Figure 4.11. A photograph showing; (a) the compaction mould components, (b) the
compaction setup. 121
Figure 4.12. Elapsed time versus ln ((Vf-Vt)/Vf) for calculating the hydraulic
diffusivity according to Gardner (1956)'s approach. 132
Figure 5.1. Standard compaction curves for different sand-gypsum mixtures. 135
Figure 5.2. Maximum dry density and optimum water content for the soil with
different percentages of gypsum. 136
Figure 5.3. Void ratio-water content curves for different sand-gypsum mixtures. 138
Figure 5.4. Minimum void ratio, minimum porosity, and the corresponding degree of
saturation for different sand-gypsum mixtures. 138
Figure 5.5. Loading and unloading void ratio-log effective stress curves for different
sand-gypsum mixtures. 140
Figure 5.6. Compression index (Cc) versus mean effective stress curves for different
sand-gypsum mixtures. 141
Figure 5.7. Rebound index (Cr) versus mean effective stress for different sand-
gypsum mixtures. 141
Figure 5.8. Compression index vs. initial void ratio for different sand-gypsum
mixtures. 143
Figure 5.9. SWCCs of different sand-gypsum mixtures carried out by using
commercial pressure plate according to ASTM D 6836-02 (same
specimen approach). 144
Figure 5.10. The drying SWCCs of different sand-gypsum mixtures carried out by
using commercial pressure plate according to ASTM D 6836-02
(separate specimen approach). 146
Figure 5.11. Matric suction-volumetric water content curves of different sand-
gypsum mixtures found from the pressure plate tests on separate
specimens by using the wax method. 149

xv
Figure 5.12. Void ratio-matric suction curves of different sand-gypsum mixtures
based on pressure plate tests on separate specimens with volume
measurements by using the wax method. 149
Figure 5.13. Void ratio-gravimetric water content curves of different sand-gypsum
mixtures found from the pressure plate tests on separate specimens in
conjunction with volume determination using the wax method. 150
Figure 5.14. Gravimetric water content-total suction relationships of different sand-
gypsum mixtures determined by using chilled mirror hygrometer. 152
Figure 5.15. Effect of gypsum content on osmotic suction of the sandy soil used. 154
Figure 5.16. Parameters of total suction SWCCs for different sand-gypsum mixtures
(based on Figure 5.14). 154
Figure 5.17. Shrinkage characteristic curves for different sand-gypsum mixtures
determined from CLOD tests. 156
Figure 6.1. Effect of gypsum content on the drying and the wetting SWCCs of
specimens tested under 0 kPa by using the modified stress controllable
pressure plate device. 161
Figure 6.2. The drying and the wetting SD-SWCCs of the sandy soil having 0%
gypsum content. 162
Figure 6.3. The drying and the wetting SD-SWCCs of the sandy soil having 20%
gypsum content. 162
Figure 6.4. The drying and the wetting SD-SWCCs of the sandy soil having 40%
gypsum content. 163
Figure 6.5. The drying and the wetting SD-SWCCs of the sandy soil having 65%
gypsum content. 163
Figure 6.6. The drying and the wetting SD-SWCCs of the sandy soil having 80%
gypsum content. 164
Figure 6.7. Air-entry, air-expulsion, water-entry, and residual suction values of
different sand-gypsum mixtures, tested under different net normal stress
levels. 166
Figure 6.8. Air-entry, air-expulsion, water-entry, and residual water contents of
different sand-gypsum mixtures tested under different net normal stress
levels. 167
Figure 6.9. Effect of gypsum content on the water holding capacity of the sandy soil
under different net normal stress levels. 170
Figure 6.10. Effect of gypsum content on the slope of SD-SWCC of the sandy soil
under different loading condition. 172
Figure 6.11. Time required for matric suction-water content equalization versus
applied matric suction during the drying and the wetting processes for
different sand-gypsum mixtures tested under 0 kPa net normal stress
level. 174
Figure 6.12. The relationship between the fitting parameter "a", Fredlund and Xing
(1994)'s model, and the air-entry/air-expulsion suction values for

xvi
various sand-gypsum mixtures that tested under different net normal
stress levels. 179
Figure 6.13. The relationship between the fitting parameter "m", Fredlund and Xing
(1994)'s model, and the residual suction value for various sand-gypsum
mixtures that tested under different net normal stress levels. 180
Figure 6.14. Comparison of the SWCCs established from the modified stress
controllable pressure plate device with that established by using the
commercial pressure plate. 181
Figure 6.15. Comparison of the drying SD-SWCCs established from the modified
stress controllable pressure plate device for the silty clayey sand with
published matric suction measurements on poorly graded silty sand
using null-type technique (Tripathy et al., 2012). 183
Figure 6.16. Combined SWCCs for different sand-gypsum mixtures, (A) 0%, (B)
20%, (C) 40%, (D) 65%, and (E) 80% gypsum content. 186
Figure 7.1. The drying and the wetting hydraulic conductivity functions in terms of
matric suction, according to Doering's approach, for different sand-
gypsum mixtures, tested under net normal stress levels of (A) 0, (B) 100,
(C) 200, and (D) 400 kPa. 192
Figure 7.2. Measured drying and wetting stress dependent k(ψ)s at (a) 4 kPa, (b) 39
kPa, (c) 78 kPa net normal stress levels for a compacted decomposed
silty clay using the instantaneous profile method (Ng and Leung, 2012). 195
Figure 7.3. The drying and the wetting hydraulic conductivity functions in terms of
gravimetric water content, according to Doering's approach, for different
sand-gypsum mixtures, tested under net normal stress of (A) 0, (B) 100,
(C) 200, and (D) 400 kPa. 198
Figure 7.4. The hydraulic conductivity functions in terms of volumetric water
content, at average net normal stresses of 4 kPa, 39 kPa, and 78 kPa for
a compacted decomposed silty clay using the instantaneous profile
method (Ng and Leung, 2012). 199
Figure 7.5. A comparison between hydraulic conductivity functions found according
to Doering's approach and that found according to Gardner's approach for
different sand-gypsum mixtures tested under 100 kPa net normal stress,
(A) during drying process, (B) during wetting process. 202
Figure 7.6. The drying and the wetting hydraulic conductivity functions in terms of
matric suction, according to Gardner's approach, tested under different
levels of net normal stress for sand-gypsum mixtures having (A) 0% , (B)
20%, (C) 40%, (D) 65%, and (E) 80% gypsum content by weight. 206
Figure 7.7. The drying and the wetting stress dependent-hydraulic conductivity
functions in terms of gravimetric water content, according to Gardner's
approach for sand-gypsum mixtures having (A) 0% , (B) 20%, (C) 40%,
(D) 65%, and (E) 80% gypsum content by weight. 211
Figure 8.1. Stress-deformation characteristic curves for different sand-gypsum
mixtures tested under normal stress of 100 kPa, (A) Shear stress versus
lateral displacement, and (B) Vertical deformation versus lateral
displacement. 215

xvii
Figure 8.2. Stress-deformation characteristic curves for different sand-gypsum
mixtures tested under normal stress of 400 kPa, (A) Shear stress versus
lateral displacement, and (B) Vertical deformation versus lateral
displacement. 216
Figure 8.3. Effect of gypsum content on initial shear stiffness of specimens tested
under different normal stress levels. 219
Figure 8.4. Effect of gypsum content on peak/maximum shear stress for specimens
tested under different normal stress levels. 220
Figure 8. 5. Mohr-Coulomb failure envelopes of different sand-gypsum mixtures. 222
Figure 8.6. Effect of gypsum content on saturated shear strength parameters. 223
Figure 8.7. Peak or maximum shear stress vs. water content at four levels of net
normal stress for sand-gypsum mixtures having (A) 20%, (B) 40%, (C)
80% gypsum content by weight. 225
Figure 8.8. Shear strength failure envelopes at different water contents (different
matric suctions) for sand-gypsum mixtures having (A) 0%, (B) 20%, (C)
40%, (D) 65%, and (E) 80% gypsum content by weight. 229
Figure 8.9. Apparent cohesion and apparent friction angle versus gravimetric water
content for different sand-gypsum mixtures. 230
Figure 8.10. Shear strength failure envelopes with respect to matric suction under
four constant net normal stress levels for sand-gypsum mixtures having
(A) 0%, (B) 20%, (C) 40%, (D) 65%, and (E) 80% gypsum content by
weight. 234
Figure 8.11. Effect of gypsum content on matric suction friction angle ( under
four levels of net normal stress, (A) For matric suction range of 0 to
130 kPa, (B) Matric suction at residual zone. 238
Figure 8.12. Effect of gypsum content on effective stress parameter (χ), under four
levels of net normal stress, for matric suction range of 0 to 130 kPa. 239
Figure 8.13. Comparison of Rassam and Cook (2002)'s predictive function with the
experimental shear strength envelopes, at different levels of net normal
stress, for unsaturated sand-gypsum specimens having (A) 0%, (B)
40%, and (C) 65% gypsum content by weight. 241
Figure 8.14. SSCCs in terms of water content (According to the approach of Lu and
Likos, 2006) for sand-gypsum mixtures having (A) 0%, and (B) 80%
gypsum content by weight, at different levels of net normal stress. 243
Figure 8. 15. SSCCs in terms of matric suction (According to the approach of Lu and
Likos, 2006) for sand-gypsum mixtures having (A) 0%, and (B) 80%
gypsum content by weight, at different levels of net normal stress. 245
Figure 8.16. SSCCs in terms of water content (According to the approach of Ning
Lu, 2006) for different sand-gypsum mixtures at net normal stress level
of (A) 200 kPa, and (B) 400 kPa. 247
Figure 8.17. Shear strength failure envelopes in terms of intergranular effective stress
for different sand-gypsum mixtures. 249

xviii
Figure B.1. Stress-deformation characteristic curves for different sand-gypsum
mixtures tested under normal stress of 200 kPa, (A) Shear stress versus
lateral displacement, (B) Vertical deformation versus lateral
displacement. 279
Figure B.2. Peak or maximum shear stress vs. water content under four levels of net
normal stress for sand-gypsum mixtures having (A) 0%, and (B) 65%
gypsum content by weight. 280
Figure B.3. Comparison of Rassam and Cook (2002)'s predictive function with the
experimental shear strength envelopes, at different levels of net normal
stress, for unsaturated sand-gypsum specimens having (A) 20%, and (B)
80% gypsum content by weight. 281
Figure B.4. SSCCs in terms of water content (According to the approach of Lu and
Likos, 2006) for sand-gypsum mixtures having (A) 20%, (B) 40%, and
(C) 65% gypsum content by weight, at different levels of net normal
stress. 283
Figure B.5. SSCCs in terms of matric suction (According to the approach of Ning
Lu, 2006) for different sand-gypsum mixtures at net normal stress level
of (A) 200 kPa, and (B) 400 kPa. 284

1
CHAPTER ONE
1: INTRODUCTION
1.1. General background
Gypsum (calcium sulphate dehydrate) is one of the moderately soluble salts that
can have a detrimental effect on pavements, buildings and earth structures. Gypsum
dissolves with water and produces caverns and/or progressive settlements,
accelerating seepage flows and the accompanying deterioration of foundations
(Subhi 1987; Razouki et al. 1994). Furthermore, the presence of gypsum salts as a
part of soil solid phase or dissolved within the pore fluid may cause significant effect
on the engineering properties of the soil. This effect depends essentially on the
amount and type of gypsum, and on the environmental circumstances under which
the soil is used.
Gypsiferous soils are widespread in the Middle East especially in regions
peripheral to the Red sea and Arabian Gulf. They cover large areas of Iraq which
may be extended to 20% of the total Iraq's area (FAO, 1990). The province of Al-
Anbar, the largest province in Iraq, contains large areas of gypsiferous soils. Gypsum
could be found there at various depths or at ground surface depending on the
environmental conditions and the geological history of the region. As in the other
regions of Iraq, there are three main forms of gypsum deposit in Al-Anbar province;
mixed through soil layers, small lumps or patches distributed in soil layers, and
gypsum crystals at or near ground surface as a result of ground water evaporation
(Barzanji,1973). In such hot dry regions, evaporation exceeds precipitation so that,
natural soils and aggregates may contain varying quantities of soluble salts especially
at superficial layers. The area under investigation in this study is the district of Al-
Fallujah in Al-Anbar province. This district receives an average precipitation of 200

2
mm between November and May while the annual potential evaporation exceeds
2000 mm. During the last 10 years, the maximum temperature reached 51°C and the
minimum went down to - 5 °C. Temperatures above 47 °C in summers and below 0
°C in winters are common.
Gypsiferous soils have been studied in the past within the classical framework
of soil mechanics that is related to saturated condition. As such, they are
characterised as collapsible, problematic soils that suffer large settlement and have
significant loss of strength under long term flooding. However, in arid and semi-arid
areas where gypsiferous soils are found, the top soil layers are mostly in unsaturated
state (Fredlund & Rahardjo, 1993; Murray & Sivakumar, 2010). Studies on
gypsiferous soils within unsaturated zone, where the impact of gypsum presence on
the soil characteristics and usability of such soils may be largely different, are quite
rare. Thus, in hot desserts, when gypsiferous soils are mostly dry or unsaturated,
gypsum may acts as a cementing agent between soil particles leading to a clear
increase in soil cohesion. On the other hand, in wet regions, the dissolution of
gypsum due to rainwater percolation or the fluctuation of water table may result in
softening of these soils and serious damage to the structures founded on such soils
may occur.
Nevertheless, it may be rare to find an integrated study in literature where both
the mechanical and hydraulic characteristics were examined together to understand
the interaction of these characteristics on each other and to realize comprehensively
the behaviour of unsaturated gypsiferous soils.
Classical soil mechanics has developed in temperate areas of the world, and as
such has concentrated on the fully saturated soils, whereas in many situations
engineering problems are related to soil layers that lie at or near the surface which
may be partly saturated, with a pore water suction (Fredlund & Rahardjo, 1993;
Murray & Sivakumar, 2010). The case of unsaturated soil represents the general
encountered case for many geotechnical problems. However, comparing with
saturated condition, the behaviour of unsaturated soil is more difficult to investigate
due to the complex thermodynamics correlations for soil phases, but it is often less
critical.

3
Two key functions are usually used to characterize the hydraulic behaviour of
unsaturated soils; the soil-water characteristic curve (SWCC) and the unsaturated
hydraulic conductivity function (HCF). The relationship between water content and
soil suction is referred to as the SWCC, which quantifies the energy required to
remove water from soil pores during a drying or a wetting process. The HCF
quantifies the soil's change in impedance to water flow as it becomes unsaturated.
The hydraulic conductivity of an unsaturated soil is mostly related to the volume of
water in the pore spaces because the presence of air restricts the available pathways
for water flow. Knowledge of the SWCC and HCF is essential in analysing
numerous geotechnical problems, such as transient and steady seepage in unsaturated
embankment, contaminant transport and remediation in unsaturated zone, water
balance at the interface of soil and atmosphere, and the net recharge rate to the
ground water.
Water flow and retention characteristics may be directly affected by the average
pore size distribution in the soil matrix, which in turn could be influenced by the
physical state and the state of stress in the soil. Thus, it is essential to mimic the
physical and stress conditions of the field when the hydraulic functions, SWCC and
HCF, have to be evaluated for a particular soil at the laboratory. From this point of
view, special attention in this study has been given to study the stress-dependent soil-
water characteristic curves (SD-SWCCs) and the stress-dependent hydraulic
conductivity functions (SD-HCFs) for unsaturated gypsum rich sandy soils.
The mechanical behaviour of a particular soil is intrinsically linked to the
hydraulic characteristics of that soil. Volume change, shear strength and shear
deformation characteristics are directly affected by the changes in the pore-air and
pore-water pressures which can be associated with the flow of water through soil, or
that generated from the application of an external load, such as an engineering
structure. More specifically, matric suction variations associated with environmental
changes can have significant effects on the strength and deformation characteristics
of unsaturated soils. These characteristics are influenced by drying and wetting
cycles, loading and unloading, as well as the time.

4
Many geotechnical problems, such as bearing capacity for shallow foundations,
slope stability and land sliding under changing climatic conditions, lateral earth
pressure and stability of retaining structures, excavation and borehole stability are
related to the unsaturated shear strength evaluation of the particular soil. Problems
such as consolidation and settlement, collapsing soil, swelling and shrinkage of soil
can be related to the deformation characteristics of the soil. Thus, predicting shear
strength and shear deformations of unsaturated soil represents the cornerstone in
analysis numerous engineering problems.
Shear strength can be defined as the maximum shear stress the soil is capable to
sustain along a failure plane under a given external and/or internal stress state. Shear
strength of unsaturated soils can be directly quantified through unsaturated shear
strength tests, in which matric suction is mostly controlled by axis-translation
technique. These tests are time consuming and require extensive laboratory facilities,
which are costly.
The shear strength of unsaturated soil can be described in terms of different
combinations of stress state variables. Thus, there are three main criteria to describe
the shear strength. These are the single stress-state variable criterion (Bishop, 1959),
the two stress-state variable criterion (Fredlund and Morgenstern, 1977), and the true
effective stress concept introduced by Lu and Likos (2006). In this research, the
experimental results were analysed according to each of these criteria and an
evaluation for different shear strength parameters, for different sand-gypsum
mixtures under various loading conditions, were carried out.
In fact, a better understanding of the hydraulic and mechanical behaviour with
the associated environmental circumstances leads to use a gypsiferous soil in a
reasonable way and this makes the cost to be minimum. Hence, a more adequate use
of gypsiferous soils could have major impact on the economy and development
potential of the countries where these soils are spread.
1.2. Objectives and scope of the research
The primary objective of this research was to experimentally examine the
behaviour and characteristics of a sandy soil taken from Al-Fallujah district / Iraq
5
with different gypsum additives, under various loading conditions, toward
understanding the impact of gypsum content on the main hydraulic functions,
volume change, shear strength and deformation characteristics of unsaturated sandy
soils. This was accomplished by conducting an extensive laboratory testing
programme using the sandy soil with different gypsum additives. These mixtures
were prepared artificially since it is quite seldom in nature to find exactly the same
soil with different gypsum contents. Furthermore, natural gypsiferous soils usually
contain some other salts which may affect the behaviour of gypsum salts. Thus, to
eliminate the effect of such salts and to control any interaction on soil properties,
synthetic soil samples were considered in this work.
The experimental programme includes three main parts. The first part comprises
of some conventional standard tests. The effect of gypsum content on the specific
gravity, liquid limit, plastic limit, shrinkage limit, grain-size distribution curve,
compaction behaviour, consolidation characteristics, soil-water characteristic curve,
and the shrinkage characteristic curve have been investigated in the first part.
The second and the third parts of the experimental programme represent the core
of this research. A detailed investigation of the drying and the wetting stress-
dependent soil-water characteristic curves (SD-SWCCs) and the stress dependent-
unsaturated hydraulic conductivity functions (SD-HCFs) for different sand-gypsum
mixtures were included in the second part. The first aim behind this investigation
was to evaluate the effect of net normal stress level on these hydraulic functions. To
achieve this aim, a new stress controllable pressure plate device has been developed.
The new device is used to measure simultaneously both the SD-SWCC and the SD-
HCF during drying and wetting processes with high efficiency and repeatability. A
single soil specimen is used to obtain these functions with any number of data points
without dismantling the device.
A further aim of the second experimental part was the promotion of using
experimentally-derived hydraulic characteristics in geotechnical applications.
Accordingly, the goals behind the development of the new stress controllable
pressure plate device were to facilitate the measuring of the two fundamental
hydraulic functions, under different loading conditions, within a reasonable time, and

6
to present plain procedures allowing simple interpretation of the measured
experimental data.
Shear strength and deformation characteristics of saturated and unsaturated
sand-gypsum mixtures having different gypsum contents were included in the third
part of the experimental programme. The common experimental procedures for
determining the shear strength of unsaturated soils are time consuming and costly.
Thus, one of the main objectives of the third experimental part was to develop a
simple procedure to determine the shear strength of unsaturated soils by using
conventional direct shear device that is used for determining the shear strength of
saturated soils. Constant water content direct shear tests on initially air-dried
specimens were carried out. The matric suctions of the tested specimens were
correlated by using the SD-SWCC test results. The possibility of measuring the soil-
water characteristic curve under net normal stress levels identical to those used in
direct shear tests enhances the reliability in estimating the matric suction to be
incorporated with the direct shear test results of air-dried specimens. This facility
makes the direct shear testing approach that uses moisture controlled specimens
instead of matric suction controlled specimens to be more reliable and applicable.
Considering the main criteria of describing the shear strength of unsaturated
soils, the second main objective of the shear strength tests was to find the effect of
gypsum content, and the effect of the applied net normal stress level on each of the
following:
(1) The contribution of matric suction to shear strength ( ).
(2) Matric suction failure envelopes.
(3) The internal friction angle related to matric suction ( ).
(4) The effective stress parameter (χ).
(5) The suction stress function.
(6) The shear stress-shear displacement behaviour.
(7) The vertical deformation-shear displacement behaviour.
(8) The initial shear stiffness.
(9) The saturated shear strength parameters (c' and ').

7
As a third objective of the shear strength tests was to verify the validity of
Rassam and Cook (2002)'s semi-empirical predictive model by using the obtained
shear strength test results. This model was originally proposed to predict the failure
envelopes of unsaturated silty sand soil.
1.3. Thesis organization
This work includes eight chapters; the literature review chapter, two chapters
introduce the applied methodology, three chapters present the results and discussion,
in addition to the introduction and conclusion chapters.
Chapter 2 begins with a brief review of the basic properties of gypsum and some
of relevant studies on saturated gypsiferous soils. The core of this chapter is focused
on the basic topics of unsaturated soil mechanics. The concepts of water retention
and flow characteristics in addition to the relevant stress state and volumetric state
variables that used for unsaturated soil behaviour representation are reviewed.
Special attention is given to the common techniques of measuring and controlling
soil suction with a detailed discussion of the axis translation technique. The outflow
transient techniques for measuring the unsaturated hydraulic conductivity are
reviewed, as well. Finally, the most common criteria for describing the shear strength
of unsaturated soils and their limitations are discussed.
Chapter 3 explains the importance and significance of materials selection to suit
the research objectives, and the classification properties of the used materials
(gypsum and the sandy soil). The preparation of sand-gypsum mixtures and their
resulting index properties are presented. Different parts of the experimental
programme are addressed with particular details for different series of tests including
the details of the used devices, calibrations and adjustments, specimen preparation,
test procedures and calculations.
Chapter 4 introduces a newly modified stress controllable pressure plate device
for measuring simultaneously the stress-dependent soil-water characteristic curves
(SD-SWCCs) and the stress-dependent hydraulic conductivity functions (SD-HCFs).
The significant device features, design and construction details, specimen
preparation, testing procedures and calculations are described in detail. This chapter

8
presents also the experimental programme which has been carried out on various
sand-gypsum mixtures under different loading conditions.
Chapter 5 presents results analysis and discussion for six series of standard
conventional tests. These tests include a series of standard compaction tests, a series
of one-dimensional consolidation tests, a series of shrinkage characteristics tests
(CLOD tests), and three series of soil-water characteristic curve tests. The effect of
gypsum content on some important parameters related to these tests are discussed
and defined.
Chapter 6 and Chapter 7 include analysis and discussion of test results of the
SD-SWCC and SD-HCF during both drying and wetting processes, under the
influence of different net normal stress levels, for five sand-gypsum mixtures by
using the modified stress controllable pressure plate device. The effect of gypsum
content and the influence of net normal stress level on the relevant hydraulic
parameters are addressed.
Chapter 8 presents the shear strength and deformation characteristics for various
sand-gypsum mixtures at saturated and unsaturated conditions. In total, results of 32
tests on saturated specimens and 120 tests on unsaturated specimens are presented.
The influence of gypsum content and the effect of water content on the saturated and
unsaturated shear strength parameters are brought out. The stress-deformation
behaviour that includes the shear stress-horizontal shear displacement and vertical
displacement-horizontal displacement relationships are presented, as well.
Chapter 9 summarizes the conclusions and recommendations derived from this
work and the recommendations for future works.

9
CHAPTER TWO
2: LITERATURE REVIEW
2.1. Introduction
Numerous studies can be found in literature on gypsiferous soils within the
classical approach that is related to the saturated condition. Studies on gypsiferous
soils in an unsaturated state approach are quite rare. In addition, there are a very few
studies available in the literature where both the mechanical and flow characteristics
were examined in an integrated manner to better understand the engineering
behaviour of unsaturated soils.
This chapter begins with a brief review of the basic properties of gypsum and
some of relevant studies on saturated gypsiferous soils. The core topics in this
chapter are focused on describing the fundamental concepts of unsaturated soils, the
most important unsaturated characteristic functions, and the common techniques of
measuring and controlling soil suction with a detailed discussion of the axis
translation techniques which are more related to the present study. These topics are
intended to provide a suitable background to develop a new device for establishing
two important characteristic functions for unsaturated soils, such as the soil-water
characteristic curve and the unsaturated hydraulic conductivity function.
Furthermore, the outflow transient techniques for measuring the unsaturated
hydraulic conductivity are reviewed. In the last section, the most common modelling
and prediction methods for shear strength of unsaturated soils and their limitations
are discussed.

10
2.2. Gypsiferous soils
Gypsiferous soils are known as problematic soils from engineering point of
view. The problems may be related to the collapsibility of such soils, progressive
settlements, accelerating seepage of water through soil, and strength reduction.
Gypsum (CaSO4·2H2O) is considered as one of the fairly soluble salts that can have
a detrimental effect on pavements, buildings and earth structures.
Gypsiferous soils cover approximately one million km2 worldwide (Verheye and
Boyadgiev, 1997). These soils are of wide occurrence in the Middle East, especially
in areas peripheral to the Arabian Gulf and Red Sea (Blight, 1976; Fookes, 1976,
1978; Fookes and French, 1977; Tomlinson, 1978). They cover large parts of the
national territory of Iraq which may be extended up to 20% of the total area of Iraq,
i.e., 9% of the World's gypsiferous soils are found in Iraq (FAO, 1990). The main
characteristic of Iraqi soils in the vicinity of Baghdad is gypsum content of 0-80%.
For that reason a special attention was given to study the behaviour of such soils.
Gypsum is commonly encountered in soil formations of semi-arid and arid
regions where precipitation is not enough to leach it from the soil profile. Gypsum
accumulations usually occur either by evaporation of mineralized fluctuated
groundwater or by the precipitation within the groundwater itself, and it is mostly
found interbedded with limestone and dolomite (Blight, 1976).
The presence of gypsum in a soil largely influences the physical and mechanical
properties of the soil. This influence depends mainly on the amount and type of
gypsum present in the soil, the environmental circumstances under which the soil is
used, and the type of engineering problem under consideration (Razouki and El-
Janabi, 1999; Razouki and Kuttah, 2004; Fattah et al., 2008). The noticeable amount
of gypsum that causes serious change in soil properties can be one of the interesting
points for many researchers. The Iraqi Standard Specification published by the State
Corporation of Roads and Bridges (SCRB, 2003) considers salty or gypsiferous soil
containing more than 10% of total soluble salts to be unsuitable when used in the top
50 cm of embankments. This value of 10% may be increased up to 20% in areas of
low rainfall (less than 100 mm/year).

11
Gypsiferous soils are usually characterized as collapsible soils, decreasing
strength upon wetting, and dissolving in flowing water. However, such soils are
reliable for construction under dry weather and even under short term inundation, but
become problematic, collapsible, and suffer large settlement under long term
flooding with water (Al-Saoudi et al., 2001; Al-Mufty, 1997).
In natural depositions, gypsiferous soils are found in relatively low density, low
water content, and mostly possess high apparent cohesion. Upon wetting, gypsiferous
soils show large reduction in void ratio under low level of stress that may be close to
the usual overburden pressure (Al-Nouri and Saleam, 1994). In contrast to the
consolidation settlement where the reduction in void ratio results from time
dependent pore-water drainage, the collapse settlement in such soils takes short time
and it may coincide with intake of water.
Collapse is defined as the decrease in the height of a confined soil following
wetting at a constant applied vertical stress (ASTM D 5333-03). A collapsible soil
may withstand relatively large applied vertical stress with small settlement at low
water content, but this soil will exhibit large settlement after wetting with no
additional increase in stress. According to the ASTM D 5333-03, collapse is
quantified by two terms, the first term is referred to as "collapse potential" which
represents the magnitude of collapse at any level of normal stress and it can be
determined by following the double oedometer approach. The second term is so
called "collapse index" which represents the magnitude of collapse under 200 kPa
normal stress, and this can be evaluated by doing a single collapse test. The addition
of water to gypsiferous soils causes a significant reduction in the bonding stresses at
the intergranular contacts that contribute in the shear strength, and thus leading to
volume reduction in the soil mass.
2.2.1. Gypsum properties
The word gypsum is derived from the Greek word gypsos. Gypsum is calcium
sulphate dihydrate (CaSO4.2H2O). Gypsum contains 32.6% calcium oxide (CaO),
46.5% sulphur trioxide (SO3) and 20.9% combined water (H2O), Klein and Hurlbut
(1985). Upon heating gypsum can be transformed into Bassanite (CaSO4.½H2O) and

12
then to anhydrite (CaSO4). The dehydration starts at 40°C and reaches a level
corresponding to the semi-hydrate (Bassanite) at 70°C. At about 95°C the remaining
½H2O molecule in bassanite is lost, and the structure transforms to that of anhydrite
(CaSO4).
Dehydration of gypsum is associated with a volume decrease of up to 38%
(Zanbak and Arthur, 1986), which may lead to excessive settlement of the overlaying
structures. Conversely, upon wetting the transformation of anhydrite to gypsum is
accompanied with a volume increase up to 62% (Blatt et al., 1980) and this creates a
swell pressure and floor heave in tunnels and massive rock uplift in dams (Brune,
1965).
Azam et al. (1998) examined the swell pressure of the three different phases of
calcium sulphate. The results show that the swell pressure for gypsum, bassanite,
anhydrite are 330, 1400, and 1660 kPa respectively, compared to 3200 kPa for a
highly expansive clay tested in the same investigation. The initial void ratios for
gypsum, bassanite, and anhydrite were 0.28, 0.50 and 0.61 respectively, compared to
0.79 for the expansive clay.
In its typical form, gypsum is colourless or white but if impurities are present
then it may be red, brown or orange. Gypsum is a soft crystal with hardness, on
Mohs scale, rating of 2 and particle density of approximately 2.3 (Blyth, 1971).
Anhydride is relatively hard crystal with a hardness rating of 3.5 and particle density
of approximately 2.9 (Blyth, 1971).
Gypsum particles have no negative charges and consequently have no cation
exchange capacity. This property causes the cohesive forces between gypsum
particles to be low, and this in turn reflects on the overall gypsiferous soil cohesion
with a degree depends on gypsum percentage.
Gypsum is considered a moderately soluble salt (Shihab et al., 2002). It
dissolves in water into calcium ions and sulphate ions. Its solubility is 2.6 g/l in pure
water at 25°C and a pressure of 1 atmosphere (Barazanji, 1973). As a comparison,
sodium chloride has a solubility of 360 g/l in the same conditions. Beside the

13
temperature and the pressure, there are many other factors affect the degree of
solubility of gypsum. Among these are: the kinds and concentrations of other existent
salts, the velocity of the flowing water, and the specific surface of gypsum particles
(Barazanji, 1973).
The presence of salts such as calcium bicarbonate (Ca (HCO3)2) and sodium
sulphate (Na2SO4) in soil decreases the solubility of gypsum, while the presence of
other salts such as sodium chloride (NaCl) and magnesium chloride (MgCl2)
increases the solubility. However, the existence of some less soluble salts in soil such
as barium chloride (BaCl2), potassium oxalate (K2C2O4), ammonium oxalate
(C2H8N2O4), ammonium carbonate ((NH4)2CO3), and ammonium phosphate
((NH4)3PO4) may greatly reduce the gypsum solubility by coating gypsum molecules
and isolate them from water (Al-Kaissy and Naji, 1985; Younan, 1986; Al-Janabi,
1990).
2.2.2. Effect of gypsum on soil behaviour
Through the classical framework of soil mechanics, some studies on the
behaviour of saturated gypsiferous soils may be found in literature. The majority of
those studies were conducted using samples from natural gypsiferous soil depositions
which mostly contain some other soluble salts beside gypsum which may interfere
the effect of gypsum on soil behaviour. Investigations carried out on silty clay
gypsiferous soil from Baghdad show that the increase of gypsum content decreases
both the liquid limit and the plasticity index of that soil (Subhi, 1987; Al-Heeti,
1990). Tests on highly expansive clay, from Eastern province of Saudi Arabia, show
that the liquid limit and the plastic limit decrease, whereas the shrinkage limit
increases with an increase in the amount of both gypsum and anhydrite in clay
(Azam et al., 1998).
The effect of gypsum on compaction characteristics of granular gypsiferous soil
was examined by Kattab (1986). The results show that the increase of gypsum up to
15% by weight causes a gradual increase in the maximum dry density associated
with a decrease in the optimum water content. Conversely, when the gypsum content
increases more than 15% by weight, the maximum dry density starts to decrease

14
associated with an increase in the optimum water content. Similar trend can be
noticed from results of Al-Dilaimy (1989) on clayey gypsiferous soils but the defined
percentage of gypsum was 5% instead of 15%. This variation can be attributed to the
difference in the pore-size distribution of the granular soil from that of the clayey
soil.
Laboratory tests carried out by Razouki et al. (2008) to study the compaction
behaviour of fine-grained gypsiferous soil show that the compaction curve of the
tested soil has double peaks showing two maximum dry densities and two optimum
water content. They referred to the maximum dry density at the lower optimum water
content (OWC) as the "dry maximum dry density" and to that at the high OWC as
the "wet maximum dry density".
The compressibility characteristics of gypsiferous silty soil were examined using
conventional oedometer (Al-Aithawi, 1990; Al-Heeti, 1990). The results show that
the soil tested exhibits low compressibility and the primary consolidation ended in a
relatively short duration and a secondary consolidation was noticed.
The influence of gypsum on shear strength parameters of a sandy soil and a
clayey soil were examined by Seleam (1988) and Al-Qaissy (1989), respectively.
Results illustrate that the increase of gypsum in sandy soil causes both the angle of
internal friction and the effective cohesion to increase for a gypsum content of 25%
up to 80%. However, for cohesive soil, the cohesion decreases and the angle of
internal friction increases as the gypsum content increases. This behaviour may be
attributed to the fact that the cohesion between gypsum particles and clay particles is
less than that between the particles of cohesive soil itself, whereas the increase in the
angle of internal friction is because the friction between gypsum and soil particles is
greater than that between soil particles itself.
Barzanji (1984) investigated the infiltration rate characteristics of gypsiferous
soils in north of Iraq. It was reported that for the same soil texture and the same
initial water content, the infiltration rate increases as the gypsum content increases.

15
2.2.3. Effect of soaking on mechanical properties of gypsiferous soils
Some investigations have been carried out to study the effect of long-term
soaking on the California Bearing Ratio (CBR) and on the shear strength parameters
of some Iraqi gypsiferous soils that have different textures and different gypsum
contents. Razouki and El-Janabi (1999) used well graded silty sand gypsiferous soil
containing 64% gypsum. The results reveal a sharp decrease in CBR with the
increasing of soaking period, especially within the first week. Thereafter, the loss in
CBR took place at a smaller rate and it approaches a constant value after about six
months. The decrease in CBR may be attributed to the leaching of gypsum with
increasing soaking period. Similar behaviour are shown for gypsiferous silty sand
containing 28% gypsum (Razouki and Ibrahim, 2007), high plasticity clay containing
34% gypsum (Razouki and Kuttah, 2006), and low plasticity clay soil containing
33% gypsum (Razouki et al., 2007).
To investigate the effect of soaking period on shear strength parameters, a series
of unconsolidated undrained triaxial tests were carried out on low plasticity clay soil
with a gypsum content of 33 % (Razouki et al., 2007), and another series of direct
shear test on sandy lean clay containing 33% gypsum (Razouki et al., 2008). Both
studies showed a significant drop in cohesion and angle of internal friction with an
increase in soaking period. The reduction in shear strength parameters upon soaking
is similar to the reduction of CBR with soaking, and this may be attributed to the
effect of water on the bonding forces between particles and the dissolution of
gypsum particles from the contact areas between particles.
To improve the strength characteristics of gypsiferous soils, the CBR test results
of Razouki and Ibrahim (2007) show a significant improvement on CBR value can
be achieved by increasing the compaction effort. Soil specimens made under low
compaction effort were affected more by soaking than those made under high
compaction effort. Similar to that, results of Razouki et al. (2007) reveal that the
increase of compaction effort from standard to modified Proctor causes a significant
increase in the shear strength parameters of the soil tested and this phenomenon is
more pronounced for soaked conditions. This behaviour may be attributed to the
effect of compaction on the permeability of soil specimens. As the compaction effort
increases, the permeability of the specimens decreases, owing to an increase in

16
density and corresponding decrease in void spaces. Thus, the increase in compaction
effort causes a reduction in the dissolution process of gypsum.
2.3. Unsaturated soil state
The general field of soil mechanics can be categorized into that part dealing with
saturated soils and another part dealing with unsaturated soils. An unsaturated soil
has more than two phases, and the pore-water pressure is always negative as
compared to the pore-air pressure. Unsaturated soils have commonly been viewed as
a three-phase system (Lambe and Whitman, 1979). However a fourth independent
phase has been introduced by Fredlund and Morgenstern (1977). This phase is the
air-water interface or what is called the contractile skin. Therefore, dealing with
unsaturated soils requires not only the principles of mechanics and hydraulics as
stated by Terzaghi (1943) in his definition to the classical soil mechanics, but it
needs also the application of thermodynamics principles that describe the equilibrium
among gas-liquid-solid phases, the transition of matter from one phase to another,
and the desorption or adsorption of one phase of matter onto or from an adjacent
phase of different matter (Fredlund and Rahardjo, 1993; Lu and Likos, 2004).
2.3.1. State variables and material variables
To describe different soil phenomena and to predict their occurrences and
behaviour, a number of state variables, material variables, and governing laws are
required. State variables are those that are required to describe the state of the system
for the phenomenon at hand and they do not have to have the same physical units
(Lu, 2008). Material variables (soil parameters) are those properties that depend on
the soil type, and they are usually varied from one soil to another soil and/or from
one state to another state.
It may be convenient in soil mechanics to differentiate between stress state
variables, deformation state variables, and flow state variables. Common stress state
variables are the total stress, pore pressure, effective stress, net stress, suction stress,
shear stress, and the principle stresses (Lu and Likos, 2004). Commonly used
deformation state variables are the strain and the void ratio. Widely used flow state

17
variables are the degree of saturation, gravimetric or volumetric water content, and
the total hydraulic head (Lu and Likos, 2004).
Material variables may be also categorized as classification parameters,
mechanical parameters, and hydraulic parameters. Widely known classification
parameters of a soil are the grain-size distribution, the consistency limits, and the
specific gravity of soil solids. The most pronounced mechanical parameters of a soil
are the angle of internal friction, the soil cohesion, and the compressibility indices.
The two key hydraulic properties for an unsaturated soil are the soil-water
characteristic function which shows the soil water content as a function to the soil
suction, and the unsaturated hydraulic conductivity function which is the
permeability of soil as a function to the water content or matric suction (Fredlund
and Rahardjo, 1993; Benson and Gribb, 1997).
2.3.2. Stress state variables
Stress state variables are the constitutive variables used in describing the
mechanical behaviour of a soil mass. The volume change and the shear strength
behaviour can be formulated in terms of the state of stress in the soil. The number of
stress state variables required to describe the state of stress in a soil mass depends
primarily upon the number of phases of the soil under consideration (Fredlund and
Rahardjo, 1993). In consequence, the state of stress in unsaturated soil is
fundamentally different from that in saturated soil.
The effective stress, which was defined by Terzaghi (1923) as the difference
between the total stress and the pore-water pressure, is considered a fundamental
state variable for describing the state of stress in saturated soil (Clyton et al., 1995).
Terzaghi's effective stress equation, which is shown below, forms the fundamental
basis for studying the saturated soil mechanics.
′ = - uw
2. 1
where ′ is the effective stress, is the total stress, and is the pore-water pressure.
All mechanical aspects of a saturated soil, the volume change and the shear strength
characteristics are governed by the single-valued effective stress. Physically,

18
effective stress describes the stress acting on the soil skeleton and propagating
through it, i.e., the stress acting at the partical-partical contacts.
For unsaturated soil, the physical meaning of the effective stress remains the
same. However, when the soil is saturated and the pore-water pressure is positive, the
effect of the water pressure is to reduce the effective stress (Terzaghi, 1943), whereas
in case of unsaturated soil, the pore-water pressure is negative, and thus creating
tensile forces acting to increase the effective stress and pull the soil grains together.
Furthermore, pore pressure in saturated soil is a neutral stress, meaning it is
isotropic and invariant in direction, and acting on the entire surface of the soil grains,
and thus having no shear component (Noor et al., 2008; Lu and Likos, 2004).
Therefore, the state of stresses that control the engineering behaviour may be well
defined from a boundary level perspective (Terzaghi, 1943; Clayton et al., 1995).
However, pore pressure is no longer be a neutral stress in unsaturated soil medium,
and it is disintegrating to three forms: air pressure acting on the dry or hydrated
portions of the soil grain surfaces; water pressure acting on the wetted portions of the
soil grain surfaces through a menisci formed near the grain contacts; and surface
tension acting along the air-water interfaces (Lu and Likos, 2006). Therefore, the
system is no longer being an equivalent continuum medium and difficulties arise in
describing the state of stress. There are three main approaches used to describe the
state of stress in unsaturated soils, these approaches are discussed in the following
subsections.
2.3.2.1. The variable effective stress state single approach
The resultant interparticle stress in unsaturated soil was described in variety of
extended forms of Terzaghi (1923)'s effective stress equation. Those forms were
modified to take into account the effect of the negative pore-water pressure (Croney
et al., 1958; Bishop, 1959; Aitchison, 1961; Jennings, 1961; Richards, 1966). Among
those, Bishop's single-valued effective stress equation which has gained widespread
reference:
′ = ( - ua) + (ua – uw)
2. 2

19
where ′ is the effective interparticle stress, is the total stress, is the pore-air
pressure, is the pore-water pressure, and χ is a soil parameter that vary with the
degree of saturation or matric suction and it is referred to as the "effective stress
parameter" . The term ( represents the net normal stress applied to the soil
mass, the term ( is called "matric suction", and the product χ( is
referred to as the "suction stress" which represents the part of interparticle stress due
to the suction. The magnitude of χ parameter is unity for a saturated soil and zero for
a dry soil. In both these extreme cases, Bishop's effective stress equation reduces to
the classical Terzaghi's effective stress equation.
The nature of χ, its determination by experimental techniques, and its
mathematical representation will be discussed later in Section 2.6. The χ parameter
appears to be difficult to evaluate and seems to have different magnitudes for
different problems and different magnitudes for different types of soil (Bishop and
Blight, 1963; Burland, 1965; Blight, 1965; Lu and William, 2006). Morgenstern
(1979) found that the χ parameter when determined for volume change process has
different value from that determined for shear strength, and that is also true for all
other proposed extended forms of the effective stress equation which use a soil
parameter to describe the stress state. For that reason and due to difficulties
associated with the experimental or theoretical determination of the effective stress
parameter, the general applicability of the effective stress approach for unsaturated
soil mechanics have been limited in practice and continues to be a subject of debate
(Lu and Likos, 2004).
2.3.2.2. The two independent stress state variable approach
Coleman (1962) suggested the use of net normal stress ( and matric
suction ( as independent stress state variables to describe stress-strain
relations for unsaturated soil. Bishop and Blight (1963) mentioned some advantages
of using net normal stress and matric suction as stress state variables. In other words,
there has been a tendency to separate Bishop's effective stress equation into two
independent stress state variables and the need of incorporation a soil parameter in
the stress state description no longer exists.
20
Fredlund and Morgenstern (1977) concluded that any two of three possible
normal stress variables: ( , ( , ( , may be used to describe the
stress state of unsaturated soil. These combinations are: net normal stress and matric
suction, effective stress and matric suction, net normal stress and effective stress.
These stress state variables were used then to formulate constitutive equations that
describe the mechanical behaviour, volume change and shear strength of unsaturated
soil.
Like the single variable effective stress state approach, the use of two
independent stress state variables needs to associate some material variables that
reflect the effect of desaturation on mechanical properties (such as which reflects
the increase in shear strength with respect to matric suction). As with the χ
parameter, experimental and conceptual difficulties exist with determining these
material variables and there are uncertainties in their uniqueness over a wide range of
saturation. These reasons have limited the practical applicability of the two
independent stress state variable approach as well (Khalili and Khabbaz, 1998; Nuth
and Laloui, 2008; Lu et al., 2010).
Moreover, Lu (2008) clarified that matric suction is not a stress variable but it
can be considered as a stress state variable, and then the direct usage of it in any
stress-based model is mechanically erroneous. In other words, matric suction is by
nature a variable controlled by state variables such as temperature and soil water
content and it would be inconsistent to consider it as an independent state variable.
Also he pointed out that there is an interdependency or coupling between matric
suction and the net normal stress if both of them are concurrently used to describe the
state of stress.
2.3.2.3. The true effective stress state variable approach
Based on a micromechanical interparticle force consideration and following the
classical concept of effective stress, Lu and Likos (2006) introduced the concept of
"suction stress" as a characteristic function of the soil-water system. Suction stress
characteristic curve (SSCC) is defined as the function of suction stress to degree of
saturation, water content, or matric suction. In this regard, they distinguished three

21
types of intergranular forces which are: (1) active skeletal forces transmitted through
the soil grains; (2) active local forces concentrated at or near the interparticle
contacts; (3) passive local forces at or near the interparticle contacts to
counterbalance the active skeletal and local forces. The first and third types of forces
are often sufficient to be considered in saturated soils, while considering the three
types of forces becomes necessary in unsaturated soil condition.
From a microscopic view, the second type of force may disintegrate to several
intergranular forces acting within the vicinity of the grain contacts which are: (1)
physicochemical forces that include van der Waals attractive forces (resulting from
electromagnetic field interaction between adjacent atoms of approaching surfaces),
and electrical double-layer repulsive forces which are due to charge deficiency
within the soil solid crystalline lattice; (2) cementation forces between particles result
from covalent or ionic bonds formed between the cementing agent and soil particles;
(3) surface tension forces at the air-water interfaces; (4) the forces arising from
negative pore-water pressure. It was proposed that these four types of forces can be
conceptually lumped into a macroscopic stress referred to as suction stress (Lu and
Likos, 2006; Oh et al., 2012).
Together with net normal stress, suction stress is considered completely defines
the effective stress (intergranular stress) in unsaturated soil or what is herein referred
to as "the true effective stress" as shown:
′′ = ( - ua) - ′s +co
2. 3
where ′′ is the true effective stress, ( is the net normal stress, ′ is the
suction stress which is a characteristic function of the soil-water system that referred
to as suction stress characteristic curve, is the apparent tensile stress at the
saturated state which can be estimated as ( = ′/tan ′) with ′ being the effective
saturated cohesion and ′ the effective friction angle. Lu and Likos (2006)
considered the suction stress as a positive term and its representation in the effective
stress equation was with a positive sign. Later on some researchers considered a
negative sign to the suction stress and its representation in the effective stress
equation was a negative term also (Oh et al., 2012).

22
The suction stress characteristic curve (SSCC) can be found directly through the
modified shear strength tests that employ the axis translation technique to control
matric suction. The SSCC, however, may be described as a function to the water
content or degree of saturation and then it can be determined by means of
conventional shear strength tests using water controlled specimens rather than
suction-controlled specimens. The conventional tests are significantly simpler than
the modified tests, beside that, the describing of SSCC as a function to the water
content facilitates the strength monitoring of the unsaturated soils in the field since
measuring the field water content is much faster and easier than measuring matric
suction.
2.3.3. Total head as a state variable
The driving potential for the flow of water may be described by using the total
hydraulic head as a flow state variable, which represents the total energy per unit
weight of water at a certain point. The hydraulic head has primary three components
of energy, namely the gravitational head or elevation head, the pressure head, and the
velocity head as shown by Bernoulli's equation below.
2. 4
where is the total hydraulic head, z is the elevation above an arbitrarily chosen
datum, is the pore-water pressure,
is the weight density of water, is the
water flow velocity, and g is the gravitational acceleration.
The velocity head in a soil is negligible and the total head can be sufficiently
represented by the summation of the elevation head and the pressure head.
2. 5
The total head concept is generally applicable to both saturated and unsaturated
soil conditions (Fredlund and Rahardjo1993; Lu and Likos, 2004). However, the
major difference is that the pressure head governed by the pore-water pressure is
positive in saturated soil and negative in unsaturated soil. The negative pore-water
pressure is mostly expressed in terms of matric suction ( which has a
positive sign in an unsaturated soil. Thus the total head can be expressed as:

23
2. 6
where is the gravitational head ( , and is the matric suction head which
can be expressed as:
2. 7
In isothermal flow systems, water flows from a point of high total head to a
point of low total head, regardless of whether the pore-water pressures are positive or
negative, i.e. water flows in the direction of a decreasing hydraulic head or what is
called "the hydraulic head gradient". In some applications, water may flows under
the influence of an osmotic gradient and then the osmotic suction has sometimes
been included as a component in the total head equation for flow. However, it is
superior to deal with the osmotic suction gradient as the driving potential for the
osmotic diffusion process and to analyze the bulk flow of water separately from the
diffusion process since two different and independent mechanisms are involved
(Corey and Klute, 1985; Corey and Kemper, 1961).
2.4. Soil suction and soil-water characteristic curve
Water retention in unsaturated soil zones is of fundamental importance to
geotechnical engineers and soil scientists, and this is primarily characterised through
the soil-water characteristic curve (SWCC) which represents the soil suction (matric
or total) as a function to the water content (gravimetric or volumetric) or degree of
saturation. The soil-water characteristic curve is also referred to as the soil-water
retention curve, the soil-water release curve, and the capillary pressure curve (ASTM
D 6836-02). The SWCC is an essential tool in evaluating the shear strength and the
volume change characteristics of unsaturated soils. Furthermore, the hydraulic
conductivity of unsaturated soils is usually estimated by using the SWCC and the
saturated hydraulic conductivity (Fredlund and Rahardjo, 1993; Lu and Likos, 2004).
2.4.1. Soil suction and potential energy
The concept of soil suction was developed in the early 1900s in relation to the
soil-water-plant system (Buckingham, 1907; Gardner and Widtsoe, 1921; Richards,
1928). In the middle of the last century, soil suction was introduced in explaining the

24
mechanical behaviour of unsaturated soils and some other engineering problems
(Croney et al., 1950).
From a thermodynamic view, soil suction quantifies the drop in the potential
energy of soil pore-water (the free energy state of soil water) relative to a reference
potential of free pure water (Richards, 1965) through the following relationship:
(
(
2. 8
where E is the free energy per unit mass of soil pore-water comparing to that of free
pure water (J/kg), R is the universal gas constant (J/mol.K), T is the absolute
temperature in Kelvin (K), is the molecular mass of water vapour (kg/mol), is
the vapour pressure in equilibrium with soil pore-water (kPa), is the saturated
vapour pressure in equilibrium with free pure water at the same temperature (kPa),
and is the relative humidity which can be defined as the ratio of the absolute
humidity in equilibrium with soil solution to the absolute humidity in equilibrium
with free pure water at the same temperature (Pan et al., 2010; Lu and Likos, 2004;
ASTM D 6836-02; Fredlund and Rahardjo, 1993).
The potential of soil pore-water in Equation 2.8 is expressed as energy per unit
mass (J/kg). In addition, the potential of soil pore-water can be expressed as an
energy per unit volume, a pressure potential (i.e., J / = N.m/ = N/ = Pa), or as
energy per unit weight, a head energy (i.e., J/N = N.m/N = m). Conversation from
energy per unit mass to pressure potential or head potential may be achieved by
considering the following relations:
ψ
2. 9
2. 10
ψ
2. 11
25
where ψ is the soil suction (Pa),
is water density (kg/ ), E is the potential (J/kg),
is matric suction head potential (m), and g is gravitational acceleration (m/ ).
As mentioned above the reference potential is the free pure water, and thus the
energy potential or the matric suction head potential will have a negative sign in
reference to the free pure water.
2.4.2. Components of soil suction
The free energy state of soil pore-water is defined in Equation 2.8 considering
the change from a reference condition of free pure water, and thus will be a negative
value. The physical and physicochemical mechanisms responsible for decreasing the
potential of the pore-water relative to this reference state include capillary effects,
short-range adsorption effects, and osmotic effects (Pan et al., 2010; Lu and Likos,
2004; Fredlund and Rahardjo, 1993).
Capillary effects, which include the curvature of the air-water interface and the
associated negative pore-water pressure, are the dominant mechanisms at relatively
high values of water content which are corresponding to low values of suction. The
capillary effects are governed primarily by the particle and pore structure and pore-
size distribution (Lu and Likos, 2006).
Short-range adsorption effects, which result mainly from electrical and van der
Waals force fields, are the dominant mechanisms at relatively low values of water
content which are corresponding to high values of suction, where pore-water is
primarily in the form of adsorbed films on particle surfaces. The short-range
adsorption effects are governed by surface area of the soil particles and the surface
charge intensity of the soil mineral (Bolt 1956; Lambe 1960).
Osmotic effects result from dissolved solutes in the pore-water which reduce the
potential of the pore-water to a degree depends on the type and concentration of the
solute (Murray & Sivakumar, 2010; Lu and Likos, 2004; Fredlund and Rahardjo,
1993). Suction arising from the combined effects of capillary and short-range
adsorption is usually grouped under the general term "matric suction" while suction
arising from the effects of dissolved solutes is known as "osmotic suction". The

26
algebraic sum of the matric and osmotic component is referred to as "total suction"
(Fredlund and Rahardjo, 1993). Suction components are usually altered with
environmental changes. In most geotechnical problems the osmotic suction changes
are generally less significant than matric suction changes (Fredlund & Rahardjo,
1993; Murray & Sivakumar, 2010).
Considering the definition of soil suction in Equation 2.8, matric suction can be
defined by considering the vapour pressure in equilibrium with soil pore-water,
relative to vapour pressure in equilibrium with a free solution identical in
composition to the soil water. Similarly, osmotic suction can be defined by
considering the vapour pressure in equilibrium with free solution identical in
composition with the soil water, relative to the vapour pressure in equilibrium with
free pure water (Fredlund and Rahardjo, 1993; ASTM D 6836-02).
2.4.3. Overview of soil suction measurement techniques
Conventional techniques for measuring soil suction and corresponding soil-
water characteristic curves include tensiometers, null-type pressure plates,
psychrometers, and porous sensors techniques. In general these techniques can be
categorized as field or laboratory methods. Laboratory methods can be categorized
by the measured component of suction (matric or total), and differentiated as either a
direct or indirect measurement. In direct techniques, the equilibrium state of soil-
water system is measured directly without involving an external medium as an
absorbent for moisture equalization such as filter papers, gypsum block conductivity
sensors, and other porous materials.
Tensiometers and null-type pressure plates are used for direct measurement of
matric suction, whereas the psychrometers and porous sensors (filter papers and
electrical/thermal conductivity sensors) fall in the category of indirect measurements.
Standard tensiometers are used to measure suction values limited by the capacity of
water to sustain high negative pressure without cavitation. Theoretically, this value is
100 kPa, but due to presence of some impurities, dissolved gases, and air bubbles in
water, the practical limit is about 70 to 80 kPa. Later on some improvements have
been made to the tensiometer technique to measure matric suction up to 1500 kPa

27
(Ridley & Burland, 1993; Guan and Fredlund, 1997; Tarantino and Mongiovi, 2003;
Toker, 2002). Null-type pressure plate method utilizes the axis translation technique
to extend the range of direct measurement of matric suction up to 1500 kPa without
the problem of water cavitation (Fredlund, 1989; Tripathy et al., 2005; Tripathy et
al., 2012; Vanapalli et al., 2008; Leong et al., 2009). These techniques were well
reviewed by many researchers such as Ridley & Wray (1995), Pan et al. (2010),
Rahardjo and Leong (2006), Lu and Likos (2004), Guan (1996), Fredlund and
Rahardjo (1993). Table 2.1 summarizes several common suction measurement
techniques in terms of direct or indirect, suction component, approximate
measurement range, and the applicability in laboratory or field.
Table 2.1. Summary of common laboratory and field techniques for measuring soil
suction (modified from Lu and Likos, 2004).
Suction
component
measured
Technique Measurement
range (kPa) Laboratory / Field
Direct /
Indirect
measuring
Matric suction Tensiometers 0 - 100 Laboratory and field Direct
Null-type axis translation apparatus 0 - 1500 Laboratory Direct
Contact filter paper Entire range Laboratory and field Indirect
Electrical / thermal conductivity sensors 0 - 400 Laboratory and field Indirect
Total suction Psychrometers 100 - 8000 Laboratory and field Indirect
Chilled-mirror hygrometers 500 - 450,000 Laboratory Indirect
Noncontact filter paper 1000 - 500,000 Laboratory and field Indirect
The measurement of total suction is usually carried out by placing a soil
specimen in a closed isothermal chamber, then the relative humidity in the head
space of the chamber is measured by means of psychrometer after the temperature
and vapour pressure between the specimen and the head space are allowed to come
to equilibrium. The relative humidity of the head space is related to the soil suction
by using Kelvin's law, which applies here to the total suction because all of the
mechanisms (dissolved solutes, hydration effects, and capillary effects) that act to
reduce the potential of the pore-water are accounted for.
There are several types of psychrometers used to measure the relative humidity
such as thermocouple psychrometers, hygrometers, thermistor psychrometers, and
transistor psychrometers (Harrison & Blight, 2000; Sivakumar, 2005).The common
types of hygrometers include dew-point hygrometers and water-vapour adsorptive
type hygrometers. A chilled-mirror dew-point hygrometer was used in this study to
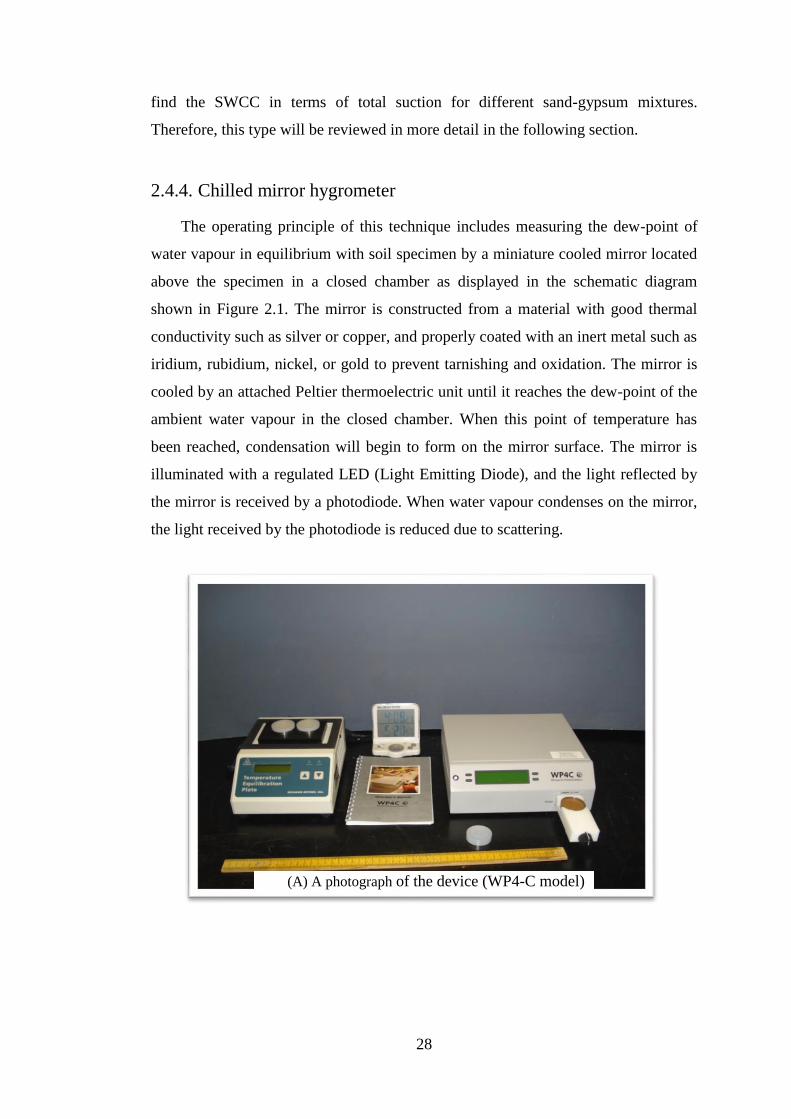
28
find the SWCC in terms of total suction for different sand-gypsum mixtures.
Therefore, this type will be reviewed in more detail in the following section.
2.4.4. Chilled mirror hygrometer
The operating principle of this technique includes measuring the dew-point of
water vapour in equilibrium with soil specimen by a miniature cooled mirror located
above the specimen in a closed chamber as displayed in the schematic diagram
shown in Figure 2.1. The mirror is constructed from a material with good thermal
conductivity such as silver or copper, and properly coated with an inert metal such as
iridium, rubidium, nickel, or gold to prevent tarnishing and oxidation. The mirror is
cooled by an attached Peltier thermoelectric unit until it reaches the dew-point of the
ambient water vapour in the closed chamber. When this point of temperature has
been reached, condensation will begin to form on the mirror surface. The mirror is
illuminated with a regulated LED (Light Emitting Diode), and the light reflected by
the mirror is received by a photodiode. When water vapour condenses on the mirror,
the light received by the photodiode is reduced due to scattering.
(A) A photograph of the device (WP4-C model)

29
Figure 2.1. Chilled-mirror dew point hygrometer, (A) a photograph of WP4-C model
device and (B) schematic diagram of the chilled mirror technique (Lu and
Likos, 2004).
The cooling power applied to the Peltier thermoelectric unit is adjusted by a
microprocessor circuit, so that the rate of condensation and evaporation of water
molecules and the mass of water on the mirror is kept constant. In this condition the
temperature of the mirror which is measured usually by a platinum resistance
thermometer is equal to the dew point temperature of the ambient water vapour in
equilibrium with the soil specimen. The dew-point temperature can then be related to
the ambient relative humidity and corresponding total suction through Kelvin's law
(Yankee Environmental Systems, 2006; Lu and Likos, 2004; Gee et al., 1992).
The measuring rang of this technique is relatively wide, ranging from around
3% relative humidity (about 450 MPa suction) to 99.9 % relative humidity (0.10
MPa suction). This technique is commonly employed to find the soil suction
corresponding to relatively low water content, i.e., suction values greater than 1000
kPa. Under such conditions of dryness, the osmotic component of the total suction is
generally small, and the matric suction and total suction are comparable. Thus, this
technique can be used in conjunction with an axis-translation technique to establish
the entire SWCC (ASTM D 6836-02).
2.4.5. Suction controlling techniques
Unlike suction measurement techniques that rely on measurements of suction
for specimens of controlled water content, suction controlling techniques rely on
(B) Schematic diagram

30
measurement of water content for specimens of controlled suction in a temperature
and humidity controlled laboratory environment. Suction controlling techniques were
primarily developed for determining the soil-water characteristic curves. As well as,
suction controlling could be considered as the corner stone in implementation of
unsaturated shear strength, compressibility, and hydraulic conductivity tests.
Suction controlling techniques may be categorized as those that control matric
suction and those that control total suction which are also referred to as humidity
control techniques. Isopiestic humidity control is one of the traditional methods for
controlling total suction, while the hanging column, the centrifuge, and the axis
translation techniques are the most well-known methods for controlling matric
suction (Lu and Likos, 2004; ASTM D 6836-02; Fredlund and Rahardjo, 1993), see
Table 2.2.
Table 2.2. Summary of common laboratory techniques of controlling soil suction.
Suction component Technique Controlling range
(kPa)
Matric suction
Hanging column 0 - 80
Centrifuge 0 - 120
Axis translation techniques 0 - 1500
Total suction Isopiestic humidity control 0 - 400
The hanging column technique is one of the standard methods for determining
the soil-water characteristic curve (SWCC) in terms of matric suction (ASTM D
6836-02). Due to water cavitation, the matric suction application range in this
method is limited from 0 to 80 kPa, so it is suitable to define the SWCC for coarse
grained soils. This method may be used also for other soils to provide a detailed
description of the initial part of SWCCs near saturation and to define accurately the
suction required to introduce air into the pores of a saturated soil that is referred to as
the air-entry suction (ψ .
To control the matric suction over a range far greater than the cavitation limit of
water under negative pressure, axis translation techniques are the most popular
standard methods for determining the SWCC at matric suction levels up to 1500 kPa
where almost all of the soil moisture movement takes place especially in sandy and
silty soils (Lins et al., 2009; Chen et al., 2007; Wildenschild et al., 2001; Fredlund et

31
al., 2011). In addition, the axis-translation technique is commonly used to apply the
required matric suction in volume change, shear strength, hydraulic conductivity
testing of an unsaturated soils (Gan and Fredlund, 1988; Wheeler and Sivakumar,
1995). Unlike the hanging column method, in axis translation techniques the pore-
water pressure is maintained mostly at atmospheric pressure and the pore-air pressure
is raised to apply the suction via the axis translation principle. Different types of
pressure plates using the axis translation principle are discussed in the following
section.
2.4.6. Axis translation techniques
Axis translation is the application of matric suction to a soil by controlling the
pore-air pressure, , and the pore-water pressure, , so that the difference
between the pore-air pressure and the pore-water pressure equals to the desired
matric suction (ASTM D 6836-02). This can be achieved by using a high air-entry
ceramic plate or cellulose membrane that separates the air phase from the water
phase while maintaining a good continuity between both these phases and the soil-
water-air system (Murray & Sivakumar, 2010).
The axis translation technique simply translates the origin of reference for the
pore-water pressure from atmospheric value to a positive value equal to the air
pressure in the chamber, and accordingly the water pressure in the measuring system
does not be highly negative, and then the problem of cavitation is avoided. This
technique was first proposed by Hilf (1956) and then applied by many researchers in
developing different types of pressure plates for controlling matric suction and
establishing the SWCCs. In the present study, this technique has been used to
develop a new stress controllable pressure plate device.
There are different types of pressure plate devices having different features,
specifications, and arrangements. In all these types, mostly saturated soil specimens
are placed in contact with a water saturated ceramic plate placed in a closed chamber.
Matric suction is applied by raising incrementally the air pressure in the chamber
while maintaining water pressure at the soil plate interface at atmospheric pressure.
Pore-water pressure in the soil core will be raised with the same magnitude of the air

32
pressure increment, and this causes water to flow from the specimen until the
equilibrium water content corresponding to the applied suction is reached.
Depending on the type of the pressure plate, the equilibrium water content is
then determined either by considering the initial water content of the specimen and
measuring the volume/weight of the expelled water, or by measuring the water
content gravimetrically by weighing the specimen after removal from the chamber.
Several increments of matric suction are applied, and several equilibrium water
contents are measured to construct the SWCC (ASTM D 6836-02; Lins et al., 2009;
Lins, 2009; Lu and Likos, 2004; Fredlund and Rahardjo, 1993; Fredlund et al.,
2011).
In general, the pressure plate technique is suitable to control/measure matric
suction corresponding to intermediate water content values. Uncertainties in the
continuity of the air phase have arisen near saturated conditions, and some
uncertainties in the continuity of the water phase may take place near dry conditions
(Bocking and Fredlund, 1980). Bittelli and Flury (2009) also showed that at low
water potentials, when matric suction is greater than 200 kPa in case of a silty loam
soil, the SWCC determined by using pressure plates has water content values higher
than those obtaining by using the dew point meter method at the same water
potentials.
Standard pressure plate devices and some non standard ones, which are relevant
in some features to the new developed device, will be discussed in detailed in the
following subsections.
2.4.6.1. Pressure plate extractor
The pressure plate extractor is one of the standard methods used widely in
determining the SWCC, in terms of matric suction, in the range of 0 to 1500 kPa
(ASTM D 6836-02). The primary components of the system are a steel pressure
chamber and a saturated high air-entry ceramic porous plate as shown in Figure 2.2.
The ceramic plate is covered on one side by a neoprene diaphragm sealed to the
edges of the plate. An internal screen between the plate the diaphragm provides a
passage for the flow of water. This passage is vented to the atmosphere through an

33
outflow tube located on the top of the plate. Thus, the water pressure in this reservoir
is separated from the air pressure in the chamber via the air-water interfaces that arch
the saturated pores of the ceramic plate. Ceramic plates are commercially available
with air-entry values of 1, 3, 5, and 15 bars.
Figure 2.2. Pressure plate extractor, (a) photograph and (b) cross-sectional drawing
(Soilmoisture Equipment Corp, 2008).
Soil specimens are prepared inside retaining rings of appropriate dimensions
according to the ASTM D 6836-02 and then placed on the top of the saturated
ceramic plate. Specimens are initially saturated by inundation while they are in
contact with the ceramic plate. As in all types of axis translation pressure plates, air
pressure in the chamber is raised to some level to apply the desired suction while
pore-water is allowed to flow from the specimen until the equilibrium water content
corresponding to the applied suction is reached.
Water content of one or more of the specimens is measured gravimetrically by
weighing the specimens after removal from the extractor, and thus generating one
point on the soil-water characteristic curve. Several equilibriums are established at
successive increments of matric suction to generate additional points on the SWCC
using the other specimens. Alternatively, the same specimens may be used
throughout the test for different levels of matric suction. In this case, the specimens
must be removed quickly from the pressure plate and weighed and then placed back
on the ceramic plate as soon as possible (ASTM D 6836-02).
(a) Photograph of pressure
plate extractor
(b) Schematic of pressure plate extractor

34
In fact, re-establishing hydraulic contact between the specimen and the ceramic
plate may be difficult when the specimen has been desaturated. For this reason, the
use of separate specimens for each suction increment is preferable and those
specimens should be prepared so that they are as identical as possible.
The weakness point of this type of pressure plate is the accumulation of the
diffused air through and below the ceramic plate especially when the test runs for a
relatively long time, and this problem greatly affects the continuity of the water
phase. On the other hand, this type of pressure plates does not have a flushing system
to remove the air bubbles throughout the test.
2.4.6.2. Tempe pressure cells
Tempe pressure cells provide a simple method to determine soil-water
characteristic curve over a range of matric suction from 0 to 100 kPa. Figure 2.3
shows a photograph of a standard disassembled cell and a cross sectional view. The
cell consists primarily of a top and a base plexiglass cap, a brass cylinder, and a
porous ceramic disc. A single soil specimen is prepared inside the brass cylinder and
then the specimen is placed on the top of the saturated ceramic disc. After saturating
the soil specimen while it is in contact with the ceramic disc, the cell is assembled
and the air pressure inside the cell is raised to apply the desired increment of matric
suction.
When the equilibrium water content of the soil specimen is reached, the air
bubbles below the ceramic disc has to be removed first and then the entire apparatus
is weighed to find the amount of water mass lost due to pore-water drainage. The
weighing process may then be repeated at successive water content equilibrium
points corresponding to successive increments of matric suction and the differences
in weight from one soil suction value to another are found. Once the highest desired
level of matric suction is attained, the cell is disassembled and the final water content
of the specimen is determined gravimetrically. Water content values corresponding
to the preceding increments of matric suction may be back-calculated by considering
the final water content in conjunction with the incremental differences in the weight.
From these pairs of data, the soil characteristic curve can be constructed (Fredlund
and Rahardjo, 1993; Lu and Likos, 2004; SoilMoisture Corp., 2008).
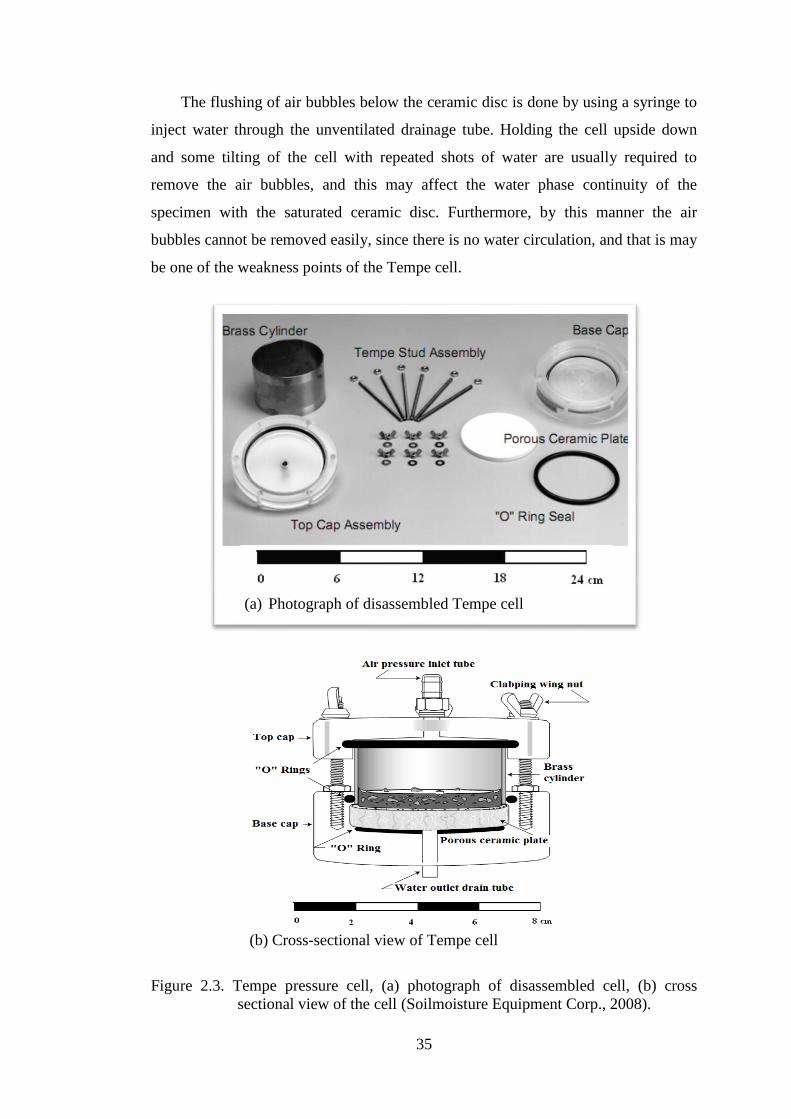
35
The flushing of air bubbles below the ceramic disc is done by using a syringe to
inject water through the unventilated drainage tube. Holding the cell upside down
and some tilting of the cell with repeated shots of water are usually required to
remove the air bubbles, and this may affect the water phase continuity of the
specimen with the saturated ceramic disc. Furthermore, by this manner the air
bubbles cannot be removed easily, since there is no water circulation, and that is may
be one of the weakness points of the Tempe cell.
Figure 2.3. Tempe pressure cell, (a) photograph of disassembled cell, (b) cross
sectional view of the cell (Soilmoisture Equipment Corp., 2008).
(b) Cross-sectional view of Tempe cell
(a) Photograph of disassembled Tempe cell

36
2.4.6.3. Volumetric pressure plate extractor
The volumetric pressure plate extractor can be applied to measure the SWCCs
associated with both drying and wetting processes in a range of matric suction from 0
to 200 kPa. For this purpose some hysteresis attachments are connected with the
extractor. When the hysteresis attachments are used, the volume of water expelled at
each increasing increment in matric suction can be retained and measured. When the
applied matric suction values are subsequently reduced, the volume of water returns
to the soil specimen can also be measured. Knowing the final water content of the
soil specimen corresponding to the last matric suction and the water volume changes
between successive matric suctions, water contents corresponding to each value of
matric suction can be back calculated and then both the drying and the wetting
SWCCs are constructed.
The device consists primarily of a base plate equipped with a 200 kPa air-entry
ceramic disc, a cylinder, and a top plate. The base has five machined symmetrical
grooves, for inflow/outflow of water, connected to two outlet tubes on opposite sides
of the base plate. The design of the grooves in such away provides a good manner for
circulating water and removing the diffused air bubbles.
Figure 2.4 shows the setup of the extractor with its hysteresis attachments. The
hysteresis attachments consist of a heater block, vapour saturator, air trap, ballast
tube, and burette. The heater block is mounted on the top plate to prevent moisture
from condensing on the inside walls of the extractor by rising slightly the wall's
temperature in comparing to the ambient environment. However, this condensation
can be avoided by conducting the test in a temperature-controlled room without the
need of this heater. The vapour saturator is used to completely saturate incoming air
to the extractor so that there will be no drying effect to the specimen tested and no
error is introduced to the water volume measurement. The air trap is attached to
collect air that may diffuse through the high air-entry disc. The ballast glass tube
serves as a horizontal storage for water flowing in or out of the soil specimen and to
maintain the same hydraulic water head during extraction or imbibition processes.
The burette is used to store or supply water and to indicate the volume of water
removed or added to the soil specimen (Soilmoisture Equipment Corp., 2008;
Fredlund and Rahardjo, 2003; ASTM D 6836-02; Ng and Menzies, 2007).

37
The test procedure is started, as with the other pressure plate methods, by
preparing the soil specimen inside a retaining ring, then placing and saturating it
above the saturated ceramic disc. Connections are made to the various hysteresis
attachments and then water is added through the burette to fill various connecting
tubes and the air trap up to the level marks. Air bubbles underneath the ceramic disc
should be flushed before starting the test and before taking each reading to the
volume of water in the burette, and this is accomplished by running a roller over the
connecting tube as shown in Figure 2.4. Running the roller forces the water to
circulate from the air trap through the grooves in the base of the extractor to the air
trap again, and thus pumping action forces out air bubbles to accumulate in the air
trap.
Figure 2.4. Schematic drawing showing the setup of the volumetric pressure plate
extractor with hysteresis attachments (Soilmoisture Equipment Corp.,
2008).
When the flushing is completed, water is adjusted again to the level mark of the
air trap by opening the stopcock at the top of the air trap and applying a small
vacuum to the outlet stem of the air trap. Water level in the horizontal ballast tube
should be adjusted also up to its level mark, and this is achieved by slightly opening
the stopcock at the end of the burette until the water level reaches the mark.
However, the level of the horizontal ballast tube must be at the same level with the
ceramic disc-soil specimen interface.

38
On the completion of the above adjustments, the reading of the water volume in
the burette is taken, and then the first increment of matric suction is applied and
hence the pore-water starts to flow to the ballast tube. At equilibrium when the flow
is ceased, the flushing process is repeated and the water levels in the air trap and in
the ballast tube have to be adjusted again to the level marks before taking the reading
of the accumulated water volume in the burette. These procedures are repeated for
successive increments in matric suction to complete the drying SWCC.
Upon completion the drying process, the test can be continued with the wetting
process by successive decrements in matric suction, and this causes water to flow
back from the ballast tube to the soil specimen. Water required for the backflow is
supplied to the ballast tube by opening the burette's stopcock. At the end of the run
after the latest equilibrium value has been established, the water content of the whole
specimen is determined gravimetrically, and the water content values corresponding
to different equilibrium points are back calculated by considering the changes in the
burette readings between successive values of matric suction. Therefore, the drying
and the wetting SWCCs can be constructed.
The weakness of the volumetric pressure plate technique may be the evaporation
of water from the open ends of the burette and the ballast tube especially in long run
tests. This evaporation affects significantly the accuracy of water content
determination at different equalization points if it is not taken into consideration. The
second point is the water circulation from and to the air trap, to remove air bubbles,
by rolling on the connecting tube. This process needs the tube to be soft enough,
whereas on the other hand, this tube has to be rigid enough and has a constant section
so that the system may be considered stable dimensionally. Even though these
conflicting requirements are satisfied, the rolling process and the adjustment of water
up to level marks is not straight forward and needs many trials to be accurately
satisfied.
2.4.6.4. Stress-controllable volumetric pressure plate
Ng and Pang (2000) modified the commercial volumetric pressure plate by
adding a loading piston through the top plate. The desired net normal stress may be

39
applied to the soil specimen and the stress-dependent soil-water characteristic curves
(SD-SWCCs) in both drying and wetting processes can be measured.
Figure 2.5 shows the components and the experimental setup of the modified
volumetric pressure plate extractor. Dead weights via the loading piston are used to
apply the desired net normal stress to the soil specimen prepared inside an oedometer
ring. O-rings are used around the loading piston at the top plate opening to keep the
air tightness inside the cell. To eliminate the error of the frictional forces between the
piston and the O-rings, a load cell is provided near the end of the piston to measure
the actual applied load on the soil specimen.
The test procedure and the calculations are similar to that associated with the use
of the commercial volumetric pressure plate that explained in the previous section
except the application of the desired net normal stress. The matric suction range that
can be applied in this modified cell is the same as for the commercial volumetric
pressure plate extractor which is up to 200 kPa. However, the problem of evaporation
from the burette and the ballast tube, and the impracticability of air bubbles flushing
which are emerged with the use of the traditional pressure plate are still outstanding
here in the modified cell.
(a) A photograph of the modified volumetric pressure plate

40
Figure 2.5. Stress-controllable volumetric pressure plate extractor developed by Ng
and Pang (2000), (a) a photograph of different components and the cell
assemblage, (b) schematic drawing of the experimental setup.
To extend the range of the applied matric suction, and to ease the flushing of the
air bubbles, another modified cell was suggested by Padilla et al. (2005) and
commercially produced by GCTS Testing Systems. It was referred to as Fredlund
SWCC Device. The cell is made from stainless steel and the matric suction can be
applied up to 1500 kPa. Vertical loads up to 10 kN can be applied using a loading
frame. Figure 2.6 shows a photograph of the commercially produced device which in
fact has slight differences from that modified by Ng and Ping (2000).
In Fredlund SWCC device, water released or absorbed from the specimen is
measured using two graduated burettes. By using these burettes, air bubbles can be
flushed by applying a slight air pressure on the top end of one burette and force water
to flow through the grooves underneath the ceramic disc to the other burette. The
flow of water is then alternated from the second burette to the first one, and so on,
until all the air bubbles are removed. This method of flushing is easier than that
followed in the traditional volumetric pressure plate extractor, but the height of water
in the burettes have to be taken into consideration when matric suction has to be
calculated.
(b) Schematic drawing of the experimental setup

41
Figure 2.6. A photograph showing Fredlund SWCC device (GCTS Testing Systems).
2.4.7. Soil-water characteristic curve
The soil-water characteristic curve (SWCC) is a fundamental relationship in
unsaturated soil mechanics. The SWCC reflects the engineering behaviour of
unsaturated soils such as the hydraulic conductivity, the shear strength, and the
volume change. In general terms, the SWCC describes the relationship between soil
suction (matric or total) and soil gravimetric water content or volumetric water
content or degree of saturation (ASTM D 6836-02).
The SWCC describes the thermodynamic potential of the soil pore-water
relative to that of free pure water as a function to the soil water content (Fredlund
and Rahardjo, 1993; Lu and Likos, 2004). At relatively low water contents, the pore-
water potential is relatively low compared with free pure water and the pore-water
here is mainly in the form of thin films on the particle surfaces. This state is referred
to as adsorption regime where suction is governed by an adsorption property which is
related to the surface area of the soil particles, the surface charge density of the soil
mineral, and the type and valency of any adsorbed exchangeable cations (Lu and
Likos, 2004).

42
At relatively high water contents, the potential of pore-water is relatively high
and its difference from the potential of free pure water decreases, thus the soil
suction is relatively low. Here, the capillary mechanism starts to govern the retention
of pore-water which is controlled by the particle and pore structure and pore size
distribution. This stage is designated as a capillary regime (McQueen and Miller,
1974). Eventually, when the potential of the pore-water is equal to the potential of
free pure water, the soil suction is equal to zero and the degree of saturation
approaches unity. A typical SWCC is shown in Figure 2.7. The curve adopts an S-
shape when the soil suction is plotted on logarithmic scale.
Figure 2.7. Typical soil-water characteristic curve (modified from Perez-Ruiz, 2009).
One parameter of interest on the SWCC is the "air-entry value". This value
represents the suction value needed to cause water to be drawn from the largest pore
space within the soil system and air starts to occupy these voids (Brooks and Corey,
1964; Fredlund and Rahardjo, 1993; Vanapalli et al., 1999; ASTM D 6836-02; Lins,
2009; Lins et al., 2009; Fredlund et al., 2011). Referring to Figure 2.7, the air-entry
value can be defined graphically by extending the constant slope segment, which

43
passes through the inflection point, of the SWCC to intersect the extending line of
the saturation segment (Vanapalli et al., 1999; Fredlund et al., 2011). The
corresponding value of suction for the intersection point is taken as the air-entry
suction for that soil. In general, the value of air-entry suction depends on the size of
the largest pores, and thus the grain-size and grain-size distribution of the particle
matrix. The finer the grain-size, the finer the pore-size, and the higher the air-entry
suction is.
Based on the S-shape of the SWCC (Figure 2.7), Vanapalli (1994) identified
three zones of desaturation: the boundary effect zone, the transition zone, and the
residual zone. In the boundary effect zone, soil pores are filled in water with the
possibility of some isolated air pockets in existence or the presence of air in a
dissolved form in that pore-water. As the applied suction increases, water sustains
more tension and starts to release slightly until the air-entry value is reached. The air-
entry point indicates the beginning of the so called transition zone.
In the transition zone, the pore-water remains in a continuous phase governed by
the capillary mechanism, and the air pockets start to form a continuous air phase.
With the increasing of the applied suction, water is drained quicker causing soil to
dry rapidly and producing a reduction in the continuity of the water phase.
Ultimately, at the end of the transition zone, the increasing in suction causes
relatively small decrease in soil water content, and this indicates the beginning of the
so called residual zone. At the residual zone, the water phase starts to be
discontinuous due to the low soil water content and water removing become more
difficult with the increasing of soil suction, however, the air phase is continuous in
this phase (Vanapalli et al., 1999).
The point at which the residual zone is started is referred to as the "residual
point". This point may be obtained on the intersection of the tangent line to the
SWCC at the inflection point and the extended line of the final segment of the curve,
which is governed by the highly adsorption mechanism, as shown in Figure 2.7
(Vanapalli et al., 1999). The values of water content and suction corresponding to the
residual point are designated as "residual water content" and "residual suction",

44
respectively. However, when the residual point is not clearly defined, a residual
suction of 1500 kPa may be taken as a recommended value (van Genuchten, 1980).
The general shape of the SWCC usually reflects the influence of material
properties including pore size distribution, grain-size distribution, density, clay
content, mineralogy, and organic material content (Fredlund and Rahardjo, 1993;
Vanapalli et al., 1999; Lu and Likos, 2004; Ng and Menzies, 2007; Lins, 2009). For
sandy soils, the residual segment of the SWCC is mostly has an asymptotic trend to
the suction axis since the amount of water adsorbed under surface hydration
mechanism (adsorption mechanism) is very little, and this is due to the relatively
very small specific surface and surface charge properties. The capillary mechanism
dominates over the majority of the unsaturated water content range of sandy soils.
The mean slope of SWCC at the capillary regime is governed mainly by the
pore size distribution of the material. Soils with a relatively narrow pore size
distribution have relatively wide water content domain corresponding to narrow
range of suction, i.e. steep SWCC slope (Yang et al., 2004). Due to a relatively large
pore throats formed between and among sand particles, relatively low air-entry
suction is encountered in sandy soils.
In contrast to sandy soils, a greater amount of pore-water is required for surface
hydration with the high suction regime in fine-grained soils such as clays. Clay
particles mostly have charged surfaces and relatively very high specific surface area.
Expansive clayey soils may sustain extremely high suction over a wide range of
water content, i.e., the residual part of SWCC is extended over a relatively wide
range in water content. As well as, the air-entry suction of clayey soils is much
greater than that of sandy soils since it is controlled by relatively very small pores.
Silty soils have an intermediate trend between sand and clay trends (Lu and Likos,
2004; Ng and Menzies, 2007).
2.4.8. Hysteresis of soil-water characteristic curve
There is no unique relationship between soil suction and water content for a
given soil. Soil undergoing drying process such as evaporation or gravity drainage
usually tends to retain a greater amount of water than that under wetting process such

45
as infiltration or capillary rise for the same magnitude of suction (Maqsoud et al.,
2004; Tami et al., 2004). Since the soil-water characteristic curve (SWCC) depends
largely on the hydraulic loading path, the differentiation between wetting
characteristic curves and drying characteristic curves is normally required to account
for the significant hysteresis impact on the flow characteristic, the strength
characteristic, and the deformation behaviour of unsaturated soil systems (Fredlund
and Rahardjo, 1993; Lu and Likos, 2004; Ng and Pang, 2000).
The relationship between water content and suction is typically presented by the
existence of an initial drying (desorption) curve, main drying curve, and main
wetting (adsorption) curve as well as an infinite number of scanning curves laying
inside the main drying-wetting loop (Pham et al., 2003; Lins et al., 2009; Fredlund et
al., 2011) as shown in Figure 2.8. The initial drying curve results from the drying
process of an initially saturated soil specimen. The wetting of an initially dry
specimen results the main wetting curve. When the specimen is dried again, the
resulting curve is the main drying curve. The main hysteresis loop defined by the
main drying curve and the main wetting curve, both of these curves are reversible
which can occur in numerous cycles while the initial drying curve is irreversible.
Figure 2.8. Typical presentation of soil-water characteristic curves showing initial
drying curve, main drying curve, main wetting curve and scanning
curves (modified from Pham et al., 2003).

46
It can be noticed from Figure 2.8 that the breadth of the hysteresis loop across
the entire SWCC is most pronounced in the transition zone when water retention is
governed by the capillary mechanism, while it is less pronounced at the residual zone
when pore-water retention falls under the adsorption mechanism. Figure 2.8 also
shows that full saturation on the wetting path may not be possible due to the
entrapment of occluded air bubbles (Yang et al., 2004). Furthermore, there is a
probable redistribution of the pore system and the closed pores during the drying and
wetting cycle (Lins, 2009).
The phenomenon of hysteresis was first noticed by Haines (1930) and then
reported and analysed by many researchers such as Topp and Miller (1966), Topp
(1969), Topp (1971a), Poulovassilis (1970), Pavlakis and Barden (1972), Mualem
(1984b), Simunek et al. (1999), Ebrahimi-Birang et al. (2007), Lins et al. (2009) Lins
(2009), Bonder and Miguel (2011), and Fredlund et al. (2011). Hysteretic behaviour
has been attributed to several mechanisms. The most important of these mechanisms
are:
(1) The non-homogenous pore-size distribution often referred to as the ink-bottle
effect (Haines 1930; Miller and Miller, 1988). The drainage of water during a
drying process is controlled by the small interconnecting pore throats, while the
imbibition of water during a wetting process is governed by the comparatively
large pore bodies.
(2) The contact angle hysteresis also referred to as the rain drop effect (Bear, 1972).
This angle is visualized as the angle between the tangent of the air-water interface
and the tangent of the water-solid interface. This angle is relatively large during
the wetting phase and comparatively small during the drying phase.
(3) Entrapped air, which refers to the formation of occluded air bubbles in dead-end
pores during wetting.
(4) Different alteration of pore fabric during drying and wetting processes for fine
grained soils.
The first and second mechanisms are likely to be the most important for relatively
coarse grained soil, such as the sandy soil under consideration in this research.

47
2.4.9. Influence of stress state on SWCCs
It is theoretically recognized that the stress state can influence the average pore
size distribution in the soil specimen and then influence the SWCC (Fredlund and
Rahardjo, 1993). Thus, it is so important to simulate the physical state and the stress
state conditions of the field when the SWCC has to be determined for a certain soil in
the laboratory.
A few experimental studies have been carried out to examine the effect of stress
state on the SWCC. Among those, Vanapalli et al. (1998) who studied the influence
of the total stress state on the SWCC of a compacted fine-grained soil at three
different compaction water contents representing dry of optimum, optimum, and wet
of optimum conditions. The concept of equivalent pressure had been used to
represent different stress state. The soil specimens were first loaded and then
unloaded using a conventional consolidation apparatus to create a known stress
history or stress state in the specimens. In other words, specimens were prepared at
different initial void ratios to simulate the effects of different normal stress levels
which were proposed to be encountered. To estimate the amount of stress equivalent
to a prepared void ratio, both the loading and the unloading void ratio versus stress
relationships, determined by using conventional oedometer, had been required.
Subsequently, the SWCCs of the preloaded specimens were determined using a
traditional pressure plate apparatus, in which the change of degree of saturation due
to the variation of soil suction was measured under almost zero-applied net normal
stress.
Vanapalli et al. (1998) noted that at any particular value of suction, specimens
subjected to higher equivalent pressures had higher degrees of saturation, higher air-
entry values, and lower desorption rate. In addition, he noted that the effect of stress
state on SWCC was more pronounced for specimens compacted with initial water
contents dry of optimum while it was not significant for specimens compacted at
initial water contents wet of optimum, see Figure 2.9.

48
Figure 2.9. Effect of stress state on soil-water characteristic curves for, (a) specimens
compacted dry of optimum water contents, (b) specimens compacted wet
of optimum water contents (Vanapalli et al., 1998).
To examine the effect of net normal stress directly by applying the desired
pressure, Ng and Pang (2000) modified a stress-controllable volumetric pressure
plate extractor. They studied the influence of net normal stress level on the SWCC of
an undisturbed completely decomposed volcanic soil (CDV). The results are shown
in Figure 2.10 which reveal good agreement to that found by Vanapalli et al., 1998
(Figure 2.9). It was concluded that soil specimens loaded to higher net normal stress
exhibit lower initial volumetric water contents. With the increasing of matric suction,

49
the volumetric water content of all specimens showed decrease but at different rates.
The higher the applied net normal stress on the specimen, the lower the rate of
reduction in volumetric water content.
Figure 2.10. Effect of stress state on soil-water characteristic curves (Ng and Ping,
2000).
Ng and Pang (2000) also noticed a consistent trend for all soil specimens to have
larger air-entry value when they were subjected to a higher stress. This is probably
related to the presence of a smaller average pore sizes distribution in soil specimens
under higher load. Furthermore, it was noticed that during the wetting process, the
volumetric water content increased more rapidly for specimens subjected to smaller
net normal stresses and returned back to a position lower than the original one for all
the three tested specimens. The size of the hysteresis loops seemed to be independent
of the range of the net normal stresses considered. This hysteresis was attributed
mainly to the smaller contact angles at the receding soil-water interface during
drying as compared to the advancing soil-water interface during wetting. However,
other researchers indicated that higher net normal stress causes the size of the
hysteresis loop becomes smaller while the shape of SWCC is not strongly influenced
(Zhou, 2008; Sharma, 1998).
Confining stress and deviator stress have also a noticeable effect on the SWCC.
Similar to net normal stress, Thu et al. (2007) showed that the air-entry value
increased with increasing net confining stress for compacted silt specimens, while
the slopes of the drying and the wetting SWCCs do not appear to depend on the net

50
confining stress. On the other hand, Tse (2007) pointed out that the increasing in
stress level causes a reduction in desorption rate, absorption rate, hysteresis loop size
and amount of air entrapment. Tse (2007) also reported that under the same net mean
stress but at a higher stress ratio, specimens tend to show higher water retention
ability and lesser hysteretic responses.
In fact, the increasing of any type of external pressure on a soil specimen causes
the void ratio to be smaller. Direct examination of the effect of initial void ratio on
SWCC demonstrated that the smaller the initial void ratio (i.e. the denser the soil)
leads to higher air-entry value, higher residual degree of saturation, and the
hysteresis loops tend to move to higher suctions on the degree of saturation -suction
plot (Kawai et al., 2000; Jotisankasa, 2005; Lins et al., 2009).
Alonso et al. (1987) and Sivakumar et al. (2006) showed that unsaturated soil
may either swell or collapse upon wetting, as a function of the applied stress. If the
confining stress is sufficiently low the soil will swell due to wetting, and if it is high,
the soil will collapse. Nevertheless, the soil may experience a reversal volumetric
behaviour upon wetting, i.e., initial swelling followed by collapse. Matyas and
Radharkrishna (1968) have pointed out that a reduction in interparticle stress and a
reduction in the rigidity of the soil mass can be happened upon soil wetting and the
decrease in suction associated with.
2.4.10. Influence of compaction water content on soil structure
Soil specimens compacted at water content representing the dry and the wet of
the optimum water content will have different soil structure and pore-size
distribution (Gens et al., 1995; Vanapalli et al., 1999). Compaction of soil specimens
at the dry side of optimum water content produces a flocculated structure with
relatively large connected pore spaces. In contrast, the compaction of the specimens
at the wet of optimum produces a dispersed structure with mostly small disconnected
pore spaces (Cui and Delage, 1996). The boundary between these two conditions
(dry and wet of optimum) is the optimum water content (Tarantino and Tombolato,
2005).

51
2.5. Unsaturated hydraulic conductivity
The unsaturated hydraulic conductivity is one of the primary soil parameters
required when performing seepage analysis for unsaturated soil systems, such as the
analysis of landslides due to rainfall infiltration, modelling contaminant migration,
and the modelling of flow and volume change in collapsing soils, compacted soils,
and expansive clays (Paul Simms, 2003; Benson and Gribb, 1997).
2.5.1. Basic definitions
The unsaturated hydraulic conductivity function of soil ( ( , also termed as
unsaturated water coefficient of permeability, is defined as the relationship between
the hydraulic conductivity and the water content or the soil suction (Lu and Likos,
2004; Fredlund et al., 1994; Leong and Rahardjo, 1997). The hydraulic conductivity
is defined as the discharge velocity of fluid through a porous medium under
influence of a hydraulic gradient equal to unity (Fredlund et al., 1994). The
unsaturated hydraulic conductivity depends on soil variables describing the pore
structure (e.g., void ratio or porosity), the pore fluid properties (e.g., density and
viscosity), and the relative amount of pore fluid in the system (e.g., degree of
saturation or gravimetric/volumetric water content), Lu and Likos (2004), Fredlund
et al. (1994). The unsteady state flow of water in porous media may be described in
terms of hydraulic diffusivity, D( ), which is defined as the ratio of the hydraulic
conductivity to the specific moisture capacity and it is usually written as a function
of volumetric water content as follows (Lu and Likos, 2004):
( (
(
2. 12
where the specific moisture capacity C( ) is the slope of the relation between matric
suction head ( and the volumetric water content ( :
(
2. 13
2.5.2. Overview of measuring methods of unsaturated conductivity
Methods for measuring unsaturated hydraulic conductivity may be categorized
to field or laboratory methods and both of these may be classified as steady or

52
unsteady state with time. These methods differ in accuracy, complicity, cost, and
time required to complete the test. However, there are many indirect methods to
calculate the unsaturated hydraulic conductivity from other characteristics such as
the soil-water characteristic curve, particle-size distribution curve, saturated
hydraulic conductivity, and the volume-mass parameters (Brooks and Corey, 1964;
Mualem, 1976; van Genuchten, 1980; Fredlund et al., 1994; Leong and Rahardjo,
1997).
Field methods are typically much more expensive than laboratory methods, but
field measurements should be more representative of the field condition, and are
recommended when the best possible estimate of the unsaturated hydraulic
conductivity is needed. The common field methods for measuring unsaturated
hydraulic conductivity are the infiltration tests and the instantaneous profile methods
which are used for surficial soil applications (Hillel et al., 1972; Hillel and Gardner,
1970), while the cone penetrometer methods can be applied for deeper soil layers
(Gribb, 1996: Leonard et al., 1996).
There are a number of laboratory methods available for measuring the hydraulic
conductivity of unsaturated soil. Good reviews of these methods have been published
by Klute (1972), Dirksen (1991), Stephens (1994), and Benson and Gribb (1997).
Among the laboratory methods are the steady state methods that yield more accurate
measurements of hydraulic conductivity comparing with the unsteady state methods.
In the steady state methods, the flux, gradient, and the water content of the soil are
constant with time, while each of these parameters are varies with time for unsteady-
state or transient techniques (Fredlund and Rahardjo 1993; Klute, 1972; Lu and
Likos, 2004; Benson and Gribb 1997; Vanapalli et al., 2007).
The steady-state methods are performed by applying constant boundary
conditions to a soil specimen. Assuming the validity of Darcy's law, the hydraulic
conductivity corresponding to the applied matric suction is computed after the
steady-state conditions are achieved (i.e. the hydraulic gradient, the flow rate, and the
water content reach constant values).
Most of the steady state methods are similar to those used to measure saturated
hydraulic conductivity. Thus, they can be classified to constant head methods

53
(constant suction gradient) or constant flow rate methods. In constant flow rate
methods, measurements are made for matric suction, while the measurements are
made for the flow rate in the constant suction gradient tests. The constant head
technique is more common because a variable head results variations in pore-water
pressure that produce changes in water content and correspondingly the hydraulic
conductivity of the soil specimen.
The steady state methods have few ambiguities and the state of stress (net
normal stress and matric suction) can be carefully controlled or varied to reflect the
field condition and to simulate the overburden pressure. Besides that, the analysis
used to calculate the hydraulic conductivity is simple and directly follows Darcy's
law without any assumptions. However, steady state methods are costly, tedious,
need long time to be conducted, and require careful attention because low flow rates
need to be measured accurately. Thus, alternative laboratory methods may be
necessary. The common alternative methods are the unsteady state tests such as the
instantaneous profile methods and the transient outflow methods.
Unsteady methods are generally less tedious to conduct and need less time for
testing. However, the analysis of unsteady data is often more complicated and has
more problems than the analysis of steady methods. In transient methods, water
content, matric suction, and the flow rate are variant with time. The calculation of
hydraulic conductivity always depends on some analytical solutions of the transient
flow governing equation (Richard's equation). Otherwise, Darcy's law may be
applied over time steps during which conditions are assumed to be approximately
steady.
2.5.3. One-dimensional transient flow governing equation
In unsaturated soils, water is held in pore spaces by adhesive and cohesive
forces which are the result of adsorption and surface tension (Fleming, J. B., 2001;
Fredlund and Rahardjo, 1993; Lu and Likos, 2004). The potential energy, which
represents the stored energy gained from position or internal condition, is the primary
important quantum that controls the direction and magnitude of water flow in soils. It
is mostly described in terms of total suction or total head as illustrated in Section
2.3.3.

54
According to the principles of energy conservation, water flows from a point of
higher potential to a point of lower potential. In unsaturated soils those potential
differences are usually results from wetting or drying processes and then both the
water content and the matric potential at any point within the flow system may be a
function of time. This flow regime is called transient or time dependent which is
different from the steady state flow systems where water flows at a constant rate with
respect to time and both matric potential and water content are invariant.
The governing equation for one dimensional transient flow (unsteady flow) in
soil can be derived by applying the continuity equation, or what is called the
principle of mass conservation, and considering Darcy's equation (Richards, 1931).
This can be written as:
[ ( (
)]
2. 14
where z is the vertical spatial variable, ( is the unsaturated hydraulic
conductivity as a function to matric suction, is the matric suction head, is the
volumetric water content, and t is the time.
2.5.4. Outflow methods
Outflow methods are unsteady methods using transient laboratory techniques
that mostly allow simultaneous determination of the hydraulic conductivity and the
soil-water characteristic curve. They need less time as compared to the steady-state
methods and provide better control on mass than other unsteady methods. An
important advantage of the outflow methods is that they are conducted using
conventional axis-translation equipment which are used for determining the soil-
water characteristic curve such as hanging column, pressure plate extractors, or
Tempe cell systems. These methods consist of monitoring the time-dependent flow
rate of pore-water from specimens subjected to an applied increment or series of
applied increments in matric suction.
The outflow methods may be classified into four types: the multistep method,
the one-step method, the multistep direct method, and the multistep continuous
outflow method. The first two methods are conducted using conventional axis-

55
translation equipment, while the multistep direct method and the multistep
continuous method are conducted using axis translation equipment provided with
some tensiometers. The tensiometers are used to find the hydraulic gradient profile
through the specimen tested, and then the hydraulic conductivity function is
calculated directly by assuming the validity of Darcy's law over a small time steps.
The multistep method and the one step method were applied in the current study and
therefore they are discussed in detail in the flowing sections.
2.5.4.1.The multistep method
The original outflow method is the multistep method which was first developed
by Gardner (1956). This method involves subjecting a soil specimen to a series of
incremental steps in matric suction and measuring the time-dependent outflow rate
and the total outflow volume for each step. In the original method the specimens
were placed on a traditional pressure plate extractor during the soil-water
characteristic curve determination test. The outflow water was measured by attaching
a burette to the outflow port at the bottom of the pressure plate.
To linearize the general form of the governing transient flow equation, Gardner
made the following six assumptions:
1. The hydraulic conductivity or the hydraulic diffusivity of the specimen remains
constant over the applied suction increment.
2. Suction is linearly related to water content over the suction increment.
3. The high air-entry ceramic disc has no impedance to the pore-water outflow.
4. Flow is one-dimensional.
5. The gravitational head is negligible.
6. The specimen is homogenous and rigid.
Considering these assumption, the governing diffusion equation may be transformed
to:
ψ
ψ
2. 15
where ψ is the soil suction, z is the spatial variable in the direction of the flow which
is equal to zero at the bottom of the specimen and equal to L at the top of the

56
specimen (Binson and Gribb 1997). Applying the top and the bottom boundary
conditions, the pore-water pressure equal to the atmospheric at the bottom and the
hydraulic head gradient ( ⁄ equal to zero at the top of the specimen, Gardner
(1956) solved the above transient diffusion equation by using Fourier series.
Neglecting all terms of the series except the first, the following expression for
cumulative outflow has been formed:
(
) (
) (
) 2. 16
where is the total volume of water accumulated for the applied suction increment
and is the outflow volume during elapsed time t. A plot of ln ( versus t
has an intercept ln (8/ ) and a slope of - ( . The hydraulic diffusivity is
determined by knowing the slope and then the hydraulic conductivity is calculated by
using Equation 2.12. The calculated ( value is considered to be corresponding to
the average water content during the specified matric suction increment, which is
taken as ψ + ψ . Where ψ
is the matric suction before the applying of suction
increment ψ (Benson and Gribb, 1997).
The main advantages of the multistep method are (i) the tests yield the
unsaturated hydraulic conductivity function as well as the soil-water characteristic
curve, (ii) the tests are conducted with less time and less complicated equipment, as
compared to the steady-state methods (Benson and Gribb, 1997), and (iii) the mass is
accounted carefully than the other unsteady methods.
On the other hand, the primary disadvantages of the multistep method are (i) the
plate impedance may be significant especially for soils have high hydraulic
conductivity, (ii) the outflow volume rate is often small and difficult to measure
accurately, (iii) the air bubbles beneath the ceramic disc and in the outflow line can
cause remarkable error, and (iv) the evaporation from the burette causes an under
estimation to the outflow volume.
2.5.4.2.The one-step method
This method consists of applying one large step in matric suction and monitors
the outflow rate for a broad range in water content. Gardner (1962) has shown that

57
for certain boundary conditions, diffusivity can be calculated from instantaneous
outflow rate, water content, and the geometry of the tested soil specimen.
Contributions to the development of the one-step outflow method have included
those of Doering (1965), Gupta et al. (1974), Passioura (1976), Valiatzas et al.
(1988), and others. The experimental procedures used by the above researchers were
approximately the same but the methods used to analyse the outflow data were
different depending on the assumptions used to solve the general diffusion equation
and the initial and boundary conditions which had been considered.
The time required to complete a one-step outflow test is much less than that
required when conducting the multistep outflow method. However, the one-step
method does not yield the soil-water characteristic curve simultaneously. Therefore,
to establish the unsaturated hydraulic conductivity function, the SWCC has to be
determined independently. Moreover, when the applied step in matric suction is too
large, the initial hydraulic gradient is large and varies dramatically throughout the
test and consequently the state of stress will change significantly during the test
which can cause notable error in results especially in compressible soils.
Among the common approaches for analysis the one-step outflow data is the
solution of Doering (1965) which is distinguished by its simplicity and that was led
to its widespread popularity. Doering uses Gardner's solution, Equation 2.16, without
the need of assuming a constant diffusivity throughout the whole matric suction step
and then the solution reduces to:
(
(
2. 17
where ( is the hydraulic diffusivity as a function of water content, is the
volumetric water content at time t, is the volumetric water content at equilibrium,
and L is the thickness of the specimen. The derivative ( is approximated by
considering a series of time steps and computed as (∆ /∆t) for each step, then the
diffusivity is computed according to the average water content of each step.

58
The implicit assumptions of Doering's method are that the impedance of the
high air-entry ceramic disc is neglected and the diffusivity is constant throughout the
whole specimen thickness at any given time.
As a comparison between the unsaturated hydraulic conductivity measured with
the one-step and the other methods, Stephens (1989) found a good agreement
between Doering's one-step method and the field instantaneous profile method when
he conducted a series of tests on fluvial sand. As well as, Doering (1965) reported
that the results obtained from the one-step method is nearly similar to those obtained
from the multi-step method and the constant flux steady-state method when he
conducted tests on five soils ranging from clay to silty sand.
2.5.5. Ceramic disc impedance
One of the key differences of the saturated hydraulic conductivity tests and the
unsaturated hydraulic conductivity tests is the high air-entry ceramic disc which is
used when testing unsaturated soils. Not only in hydraulic conductivity tests but in
most tests related to unsaturated soils, the ceramic discs play the main role in
conducting the tests precisely. Ceramic discs are much less permeable than porous
stones used in saturated hydraulic conductivity testing, and this impedance can be
important and should be taken into consideration especially when a relatively high
permeable soil has to be tested.
Benson and Gribb (1997) recommended that the head loss through the ceramic
disc should be accounted for if the saturated hydraulic conductivity of the ceramic
disc is less than an order of magnitude higher than the hydraulic conductivity of the
soil at water content at which it is tested.
The flow of water in the transient outflow methods may be categorized into
three stages (Green et al., 1998). The first stage starts with the beginning of the test
where the saturated permeability of the ceramic disc controls the flow, so that the
cumulative outflow volume is linearly proportional to the time. The second stage
starts when the water content of the bottom layer, which is in contact with the
ceramic disc, reaches to equalization according to the applied matric suction after a
short time from the start of the test. At this stage, the flow rate decreases as the soil

59
permeability starts to control the flow and the ceramic disc impedance becomes
negligible as the test progresses. During the second stage, the core soil specimen
behaves as a semi-infinite column, and the accumulated outflow volume is a linear
function of the second root of elapsed time (√t). When this linear relation ceases,
stage three of the outflow starts and the boundary condition at the top end of the soil
specimen begins to influence the flow. At this stage, the water content over most of
the soil column may be assumed uniform.
The main conclusion which can be drawn from Green et al. (1998)'s
classification is that the ceramic disc impedance has to be taken into consideration
when analysing the outflow data. Especially when the multistep outflow method
(Gardner, 1956) and the one-step outflow method (Doering, 1965) are followed in
the analysis. That is because both these methods were derived by including the first
and the second stages of the transient flow.
To avoid the influence of ceramic disc impedance, Klute and Dirksen (1986)
suggested the direct measurement of the hydraulic gradient within the specimen by
using two tensiometers provided that the pore-water pressure is greater than minus
80 kPa. However, the head loss through the ceramic disc can be calculated directly
by applying Darcy's law as follows:
∆ =
2. 18
where ∆ is the head loss through the ceramic disc, is the flow rate through the
system, is thickness of the ceramic disc, is saturated coefficient of
permeability of the ceramic disc, A is the cross sectional area of the ceramic disc.
2.6. Shear strength and failure criteria
Measuring, modelling, and predicting the shear strength of soil represent the
corner stone in analysing numerous engineering problems such as bearing capacity,
slope stability, lateral earth pressure, pavement design, and foundation design. The
shear strength of soil, whether saturated or unsaturated, may be defined as the
maximum shear stress the soil is capable of sustaining along the failure plane under a
given external and/or internal stress state. There are three main approaches to

60
evaluate the stress state in unsaturated soil; the single stress-state variable approach
proposed by Bishop (1959), the two stress-state variable approach proposed by
Fredlund and Morgenstern (1977), and the true effective stress concept introduced by
Lu and Likos (2006). Referring to these approaches, different failure criteria and
different models have been formulated to describe the shear strength behaviour of
unsaturated soil (Bishop, 1960; Graecen, 1960; Fredlund et al., 1978; Lamborn,
1986; Peterson 1988; Peterson,1990: Fredlund et al., 1996; Vanapalli et al., 1996;
Rassam and Williams, 1999; Sun et al., 2000; Rassam and Freeman, 2002; Toll and
Ong 2003; Khalili et al., 2004; Tarantino 2007; Sheng et al., 2008). The shear
strength criteria relevant to the current study are reviewed in this section.
In saturated soil, shear strength is commonly described using Mohr-Coulomb
failure criterion as follows:
′ ( ′ 2. 19
where is the shear stress on the failure plane at failure, ′is the effective cohesion,
( is the effective normal stress on the failure plane at failure, and ′ is the
effective angle of internal friction.
In unsaturated soil, however, there is an internal stress acting locally on soil
grains that results specifically from partial saturation of the soil and it is independent
of external loading or overburden pressure. This stress originates from the combined
effects of negative pore-water pressure and surface tension (Lu and Likos, 2006).
The effect of this additional internal loading on the shear strength may be captured
by incorporating the matric suction into the Mohr-Coulomb failure criterion in one of
the following approaches.
2.6.1. The extended Mohr-Coulomb criterion
Considering the two stress-state variable approach, which was explained in
Section 2.3.2.2, Fredlund et al. (1978) formulated an extended M-C criterion to
describe the shear strength behaviour of unsaturated soil by introducing an additional
parameter, to capture the increase in shear strength with increasing matric

61
suction. The resulting failure envelope is a plane in the space of net normal stress,
matric suction, and shear stress and may be written as:
′ ( ′ ( 2. 20
where is the shear stress on the failure plane at failure, ′is the effective cohesion,
( is the net normal stress on the failure plane at failure, ′ is the angle of
internal friction related to the net normal stress, ( is the matric suction at
failure, and is an internal friction angle related to matric suction which shows the
rate of increase in shear strength relative to matric suction. This friction angle, ,
was originally assumed to be constant and this leads to describe a planer surface
envelope in a three dimensional space. It was later demonstrated from increased
experimental evidence that is a highly nonlinear function with respect to matric
suction and the failure envelope becomes a curved surface (Escario and Saez, 1986;
Fredlund et al., 1987; Gan et al., 1988; Drumright, 1989; Escario et al., 1989;
Vanapalli et al., 1996).
There is a clear relationship between the nonlinear nature of the shear strength
envelope with respect to the increasing of matric suction and the soil-water
characteristic curve. Within the capillary saturated zone of the SWCC and prior to
the air-entry suction, the soil pores remain essentially saturated, the shear strength
envelope is approximately linear, and is effectively equal to the angle of internal
friction ′. Beyond the air-entry suction within the transition zone, a clear
nonlinearity in starts and increases towards the residual regime. As drainage of
pore-water continues, changes in the geometries of interparticle pore-water menisci
take place. These changes reduce the resultant interparticle forces that contribute to
the effective stress on the soil skeleton and ultimately contribute to the shear strength
(Fredlund and Rahardjo, 1993; Fredlund et al., 1987). In other words, the reduction
in the volume of pore-water within this zone effectively reduces the contribution of
matric suction in increasing the shear strength. Referring to the strong
correspondence of this nonlinearity with the SWCC, Fredlund et al. (1987) suggest
that the problem may be handled by dividing the failure envelope into several linear
segments with varying angles by imitating the approximated linear segments of
the SWCC.

62
It can be concluded that it is more logical to conceptualize the reduction in the
rate of contribution of matric suction to the shear strength as a result to the reduction
in the mobilization of matric suction to the effective interparticle stress, rather than a
reduction in friction coefficient which is represented by . Physically, it may be
inconsistent to visualize the friction angle as a variable related to the soil water
content. On the other hand, it is more logical to have one friction angle with respect
to different kinds of stress whether it is an internal or external.
2.6.2. Single stress state Mohr-Coulomb criterion
The single stress state variable approach proposed by Bishop (1959) may be
useful to highlight the influence of degree of saturation on the contribution of matric
suction to the shear strength. In this approach, Terzaghi's effective stress was
extended to join both two independent state variables, net normal stress and matric
suction, by introducing one material variable referred to as "effective stress
parameter χ ". Using his extended effective stress concept and applying the
conventional Mohr-Coulomb criterion, Bishop (1960) suggested the following failure
envelope equation:
′ [( χ ( ] ′ 2. 21
where is shear strength and ′ and ′are the effective cohesion and effective
friction angle, respectively. The effective stress parameter χ is a function to the
degree of saturation or matric suction. This parameter reflects the contribution of
matric suction to the effective stress. The parameter χ equals to 1.0 when the
condition is saturated and zero when dry. This parameter can be evaluated directly
from typical direct shear tests (Lu and Likos, 2004). When the net normal stress is
controlled, matric suction is measured or controlled, effective cohesion and friction
angle are predetermined from saturated tests, the unsaturated shear strength is
measured, the effective stress parameter can be calculated by rearranging Equation
2.21 as follows:
χ ′ ( ′
( ′ 2. 22

63
Based on best fit to experimental results, many mathematical representations of
χ have been proposed. Bishop (1959) proposed a nonlinear form of χ as a function to
degree of saturation:
χ (
2. 23
where S is the degree of saturation, is the volumetric water content, is the
saturated volumetric water content, and is a fitting parameter.
Later on, Khalili and Khabbaz (1998) formalized χ as a function to the
normalized matric suction:
χ ( ( (
( (
( ( ) 2. 24
where ( is the air-entry suction for drying process and it is the air-
expulsion suction for wetting process.
Vanapalli et al. (1996) proposed another form to predict χ and its validity was
examined later (Vanapalli and Fredlund, 2000) and showed good fit with the
experimental shear strength results of Escario et al. (1989). This form can be written
as:
χ
2. 25
where is the residual degree of saturation, and is the residual volumetric water
content.
Comparing the extended Mohr-Coulomb criterion (Equation 2.20) with Bishop's
effective stress concept (Equation 2. 21), it can be noticed that both these approaches
are physically different but mathematically the same. Subtraction one equation from
another lead to:
χ
′ 2. 26

64
Accordingly, the extended Mohr-Coulomb criterion may be written in terms of χ and
the saturated angle of friction. Until now, the effectiveness, validity, and practicality
of the preceding two different approaches for describing the shear strength of
unsaturated soil remain a matter of debate in literature.
2.6.3. True effective stress failure criterion
To avoid the uncertainties and ambiguities in the theoretical formulation and
experimental determination of , Lu and Likos (2004) suggested the use of
suction stress concept without considering independently the variables that define it
(the matric suction and χ ). Mohr-Coulomb criterion incorporating Bishops effective
stress can be re-written as:
′ ( ′ χ ( ′ 2. 27
′ ( ′ ′ ′ 2. 28
′ χ
( 2. 29
where ′ is the suction stress which is physically resulting from local interparticle
forces. These forces are the resultant of three components which are: the increase in
physicochemical forces due to desaturation in reference to the saturated condition;
attractive forces arising from surface tension at air–water interfaces; and attractive
forces arising from typically negative pore-water pressure. In saturated soils the
effects of physicochemical forces, which indeed exist, have conventionally been
captured by the saturated effective cohesion term, ′ in Mohr-Coulomb criterion.
The representation of Equation 2. 28 in three dimensional space of shear stress,
net normal stress, and suction stress shows that the failure surface remains planner
regardless to the desaturation process. This feature makes it possible to represent the
complete failure surface in the net normal stress-shear stress plane by plotting
constant matric suction lines, leading to a series of parallel lines with different values
of matric suction.

65
Hence, experimentally, if a series of conventional direct shear tests is carried out
for specimens prepared at different water contents, a series of parallel failure
envelopes corresponding to different water contents can be constructed by drawing
lines parallel to the saturated failure envelope and passing through the state of stress
at failure for each test (Lu and Likos, 2004). Therefore, the suction stress as a
function to water content can be determined. In other words, suction stress for a
specimen at given water content can be back calculated using Equation 2. 28. Thus,
the suction stress characteristic curve (SSCC) can be found by conducting shear
strength tests for water-controlled specimens rather than suction-controlled
specimens. Using this approach, it can be circumvented about the necessity to
determine the matric suction or the effective stress parameter χ since the most
relevance variable is neither matric suction nor χ but the product of the two which is
identified as suction stress.
Furthermore, Lu and Likos (2006) introduced the use of "true effective stress"
concept to represent the failure envelope. True effective stress includes three
components which are: intergranular bonding stress that provides cohesion in
saturated soil, net normal stress, and suction stress. The representation of failure
envelope for saturated or unsaturated soil in the true effective stress-shear stress
plane results a unique line passing through the origin regardless the degree of
saturation. Applying the classical Mohr-Coulomb failure criterion in conjunction
with true effective stress concept results:
′′ ′ 2. 30
′′ ( ′ 2. 31
′ ′ 2. 32
where is the shear stress on failure plane at failure, ′′ is the true effective stress,
( is the net normal stress, ′ is the suction stress, is the tensile strength of
soil at saturation, ′ and ′ are the saturated cohesion and friction angle, respectively.

66
2.6.4. Shear strength prediction using constitutive models
Different formulations have been proposed in recent years to predict the
unsaturated shear strength based on some parameters that obtained from common
tests. The majority of those methods use the soil-water characteristic curve and the
saturated shear strength parameters to evaluate the unsaturated shear strength. As
described in Section 2.6.2, most of these formulations are for evaluating the
parameter χ in Bishop's failure envelope equation.
Rassam and Williams (1999) used a three-dimensional, nonlinear regression
analysis and proposed a power-additive function to describe the shear strength of
unsaturated soils. The proposed function incorporates the effect of normal stress on
the contribution of matric suction to the shear strength as shown below:
′ ′ [ ψ ′ (ψ ψ ) ( ] 2. 33
where is the shear strength, is the net normal stress, ′and ′ are the saturated
shear strength parameters, ψ is the matric suction, ψ is the air-entry suction, and ,
, are fitting parameters. It may be noticed from Equation 2.33 that the fourth term
represents the decrease in the contribution of matric suction to the shear strength due
to the desaturation, which is coupled to the net normal stress. It is of interest here to
notice that Equation 2.33 expresses the effect of increasing net normal stress on
decreasing the contribution of matric suction to the shear strength of soil.
Later on, Rassam and Cook (2002) considered constant values of net normal
stress in two-dimensional plane of shear strength versus matric suction and
rearranged Equation 2.33 as follows:
( ′ ′ ψ ′ (ψ ψ ) 2. 34
where is the contribution of matric suction to the shear strength, is the total shear
strength, ( ′ ′ is the saturated shear strength, and replaces the expression
( for Equation 2.33. Since the net normal stress is considered a constant, then
it is important to notice that the fitting parameters and in Equation 2.34 will be
relevant to the net normal stress under which the unsaturated shear strength is
evaluated.

67
To quantify the fitting parameters and , Rassam and Cook (2002) considered
two boundary conditions. The first is = 0 at residual suction, and the second is the
contribution of matric suction to the shear strength at residual suction is equal to ,
which should be experimentally evaluated. Solving Equation 2.34 by considering
these boundary conditions results:
′(ψ
ψ
ψ ′
2. 35
ψ
′
(ψ ψ
2. 36
The values of residual suction ψ and air-entry suction ψ
are evaluated from a
predetermined soil-water characteristic curve. Rassam and Cook (2002)
recommended that the SWCC has to be carried out on specimen which is pre-
consolidated under the same value of net normal stress used to evaluate the
unsaturated shear strength. Also the saturated angle of internal friction has to be
known, and then the only unsaturated test which is needed to be carried out is the
shear strength at residual suction in order to find .

68
CHAPTER THREE
3: MATERIALS, EQUIPMENT AND METHODOLOGY
3.1. Introduction
To evaluate the influence of gypsum content on the engineering properties of a
sandy soil, which has been taken from Al-Fallujah district / Iraq, an extensive
laboratory programme was designed. Synthetic soil mixtures from the sandy soil
with different gypsum additives were considered. The classification properties of the
sandy soil and hydrated gypsum are presented in this chapter. The preparation of
sand-gypsum mixtures and their resulting index properties are presented. These
properties include the particle density, grain-size distribution, and the consistency
limits.
The experimental programme contains both hydraulic and mechanical tests.
These tests are, compaction tests, consolidation tests, soil-water characteristic curve
tests, soil shrinkage characteristic tests, stress-dependent soil-water characteristic
curve (SD-SWCC) tests, stress dependent-hydraulic conductivity function (SD-HCF)
tests, and shear strength tests on both saturated and unsaturated soil specimens.
These tests were carried out in an environment controlled room, since most of
unsaturated soil characteristics are clearly sensitive to the temperature and humidity
variations. The room temperature was controlled at 20-22°C and the humidity at 40-
50%.
The details of the devices used, the preparation of the specimens, test procedures
and calculations, and the testing programme for each test series are presented in this
chapter. The calibrations and adjustment of the direct shear device used for testing
stiff unsaturated soil specimens are presented. The details of the modified device

69
used for establishing the SD-SWCCs and the SD-HCFs, the related testing
procedures, and the experimental programme are presented in detail in Chapter 4.
3.2. Materials and samples preparation
To study the effect of gypsum content on the hydro-mechanical properties of
gypsiferous sandy soils, a sandy soil from Al-Fallujah district / Al-Anbar province /
Iraq was taken. Synthetic soil samples were prepared from the sandy soil with
different additives of hydrated gypsum since it could not be possible to find natural
soil samples having the same host soil with different gypsum contents. Furthermore,
natural gypsiferous soil depositions predominantly contain some other soluble salts
beside gypsum which may alter the effect of gypsum on soil behaviour. Eight
synthetic soil samples were considered by adding eight different percentages of
gypsum to the sandy soil. These percentages are 0%, 10%, 20%, 30%, 40%, 50%,
65%, and 80% by dry weight.
As in the most regions, soils at the district of Al-Fallujah have inherently spatial
variability in both horizontal and vertical directions, in addition to time variability of
the solutes distribution within soil profile during precipitation or evaporation. Thus,
the soils vary from coarse-grained soil to fine-grained soil, but in general the
predominant soil might be silty sands (SM) to sandy clay (CL). To obtain a
reprehensive soil sample with low cost, the composite sampling method (Mason,
1992) was adopted. Thus, relatively homogenized sample made up of a number of
increments or subsamples was collected. The subsamples were taken by considering
the concept of random or probabilistic selection. In this concept, each subsample
point within the area had an equal probability of being selected, and every particle
within the subsample had an equal chance of being selected. To increase the
homogeneity and reduce the variability in each subsample, stratified sampling
manner was used. Each subsample was taken from a single stratum, where the
stratum is expected to be uniform in character.
At the laboratory, the shipped soil sample was mixed thoroughly to reduce the
variance of distribution and segregation which might be occurred during shipping.
To control the segregation and grouping error occur during implementation of the

70
experimental programme, the shipped sample was divided to many parts (nearly 1kg
weight each) and each part was stored in a small plastic container. For each
individual test, the sand-gypsum mixture required to prepare the test specimen was
mixed separately by mixing predefined weights of the sandy soil and the hydrated
gypsum in small can. A special care was given to this process to ensure a good
distribution of gypsum particles through the mixture with minimum segregation
effects.
Gypsum, dihydrate calcium sulphate CaSO42H2O, was prepared by using
gypsum plaster or as widely known as plaster of Paris, CaSO4·½H2O. Plaster
particles were completely dispersed in water to produce uniform, homogenous slurry.
A soaking period of five minutes enabled gypsum particles to be completely wetted.
Further mixing of plaster slurry was continued throughout the setting stage until the
casting strength was completely lost. Additional water was added to the slurry to
avoid any possible bonds and to ensure a complete hydration to gypsum particles.
The mixture was then air dried for three days before being used to prepare the
required mixtures.
3.3. Soil classification parameters
The index properties of the soil used, gypsum, and the soil-gypsum mixtures
were determined following the British Standard (BS 1377-2, 1990). These tests
include determination of the particle density, the particle size distribution including
wet sieving and hydrometer tests, the liquid limit, and the plastic limit. The shrinkage
limit tests were carried out by using the wax method (ASTM D 4943-08). The
properties of the sandy soil, gypsum, and seven sand-gypsum mixtures are presented
in Table 3.1.
The particle density tests were carried out by using the small pycnometer
method which is the preferable method for soils consisting of clay, silt and sand-
sized particles. For the sandy soil the specimens were oven dried at 105 ºC before the
test as stated in BS Standard, while gypsum specimens were oven dried at 45 ºC to
avoid any change in particle density due to loss of water of hydration. Instead of

71
distilled water, white spirit was used in the determination of gypsum particle density
to avoid the dissolution of gypsum particles (BS 1377-2, 1990).
Table 3.1. Index properties of the prepared samples.
Properties
Values
Gypsum content (%)
0 10 20 30 40 50 65 80
Particle density (Mg/m3) 2.65 2.62 2.59 2.56 2.52 2.49 2.44 2.39
D60 ( mm) 0.092 0.087 0.082 0.076 0.070 0.056 0.040 0.027
D30 ( mm) 0.050 0.036 0.021 0.018 0.015 0.015 0.016 0.015
D10 (mm) 0.000
8
0.001
0
0.001
2
0.002
5
0.003
8
0.008
4
0.013
0
0.013
0 Coefficient of uniformity, Cu 114 87 70 30 18 7 3 2
Coefficient of curvature, Cc 33.5 14.9 4.7 1.7 0.8 0.5 0.5 0.6
Liquid Limit (%) 22.4 21.7 20.9 20.6 23.5 29.0 30.2 37.1
Plastic Limit (%) 16.5 15.5 14.8 14.5 16.0 20.0 21.0 27.1
Shrinkage Limit (%) 13.0 11.5 10.7 10.5 12.5 16.0 17.6 22.5
As an alternative method for determining gypsum particle density, saturated
water with gypsum salt was suggested, in this study, to be used instead of white
spirit. When the water is pre-saturated with gypsum salt, it will be unable to dissolve
gypsum any more during the particle density test. Following this method, gypsum
particle density were determined and then compared to that found by using white
spirit. Very good agreement was found with a difference not exceeding 0.005 Mg/m3.
The particle density was found to be 2.65 Mg/m3 for the sandy soil and 2.33
Mg/m3 for gypsum. Based on these densities, the mean particle density for samples
having different gypsum contents was calculated.
Combined wet sieving and hydrometer tests were carried out on both the sandy
soil and the hydrated gypsum. To account for any heterogeneity in the sandy soil and
reduce the distribution and segregation error that may be induced by gravity during
storage or handling, the sieve and hydrometer analysis were carried out twice during
the experimental programme and the average grain-size distribution curve was taken.
The hydrometer test on gypsum was repeated four times at different soaking period
in water with the presence of the dispersant agent in order to examine if there is any
change in particle size due to gypsum dissolution. Soaking periods of 1, 4, 7, and 14
days were considered. Figure 3.1 shows the hydrometer grain-size distribution curves

72
of gypsum at different soaking periods. These curves demonstrate that gypsum
particle sizes can be considered stable with different soaking periods as long as the
same suspension was examined. That is related to the fact that gypsum has limited
solubility in water which is around 2.6 g/l only (Barazanji, 1973), and this number
can be considered insignificant comparing with the mass of gypsum solids used in a
sedimentation test which is around 50 g in one litre suspension.
The combined grain-size distribution curves (wet sieving and hydrometer
analysis) for the sandy soil and the gypsum are presented in Figure 3.2. The grain-
size distribution curves of different sand-gypsum mixtures were calculated
depending on the distribution curves of their constituents and the mixing
percentages. These curves are presented between the grain-size curves of the sand
and gypsum that form the boundary curves.
Figure 3.1. Grain-size distribution of gypsum at different soaking periods
(Hydrometer tests).
0
10
20
30
40
50
60
70
80
90
100
0.01 0.10
Per
centa
ge
finner
Partical size (mm)
1 day soaking period
4 days soaking period
7 days soaking period
14 days soaking period

73
Figure 3.2. Particle size distribution curves of sandy soil, gypsum, and the synthetic
samples.
The sandy soil contains 64% fine sand of particles size between 0.150 and 0.063
mm, 22% silt, and 12% clay. It is classified as silty clayey sand according to Unified
Classification System and designated as SC-SM (ASTM D 2487-06). On the other
hand, gypsum has a very uniform particles size with 60% between 0.010 and 0.020
mm. This uniformity has a clear effect on the grain-size distribution parameters of
the prepared samples with a degree depends on the added gypsum percentage as
shown in Table 3.1.
3.4. Experimental programme
This section describes the details of the implemented experimental programme.
The details of the equipment used, the preparation of soil specimens, the testing
procedure and calculations, and the testing programme for each test series are
presented.
3.4.1. Compaction tests
Soil compaction is the process by which soil particles are forced to pack more
closely together through a reduction in the air voids by using mechanical means
0
10
20
30
40
50
60
70
80
90
100
0.000 0.001 0.010 0.100 1.000
Per
cen
tage
fin
ner
by w
eigh
t %
Partical size (mm)
Average - Silty Clayey Sandy Soil
Sample 1 - Silty Clayey Sandy Soil
Sample 2 - Silty Clayey Sandy soil
Gypsum
20% Gypsum + Sandy Soil
40% Gypsum + Sandy Soil
65% Gypsum + Sandy Soil
80% Gypsum + Sandy Soil

74
(Terzaghi and Peck, 1960; BS 1377-4-1990). The compaction characteristics of eight
sand-gypsum mixtures were determined following the procedures described in clause
3 of the British Standard (BS 1377-4-1990). These mixtures had 0, 10, 20, 30, 40,
50, 65, and 80% gypsum content by weight. The objective of these tests is to
evaluate the effect of gypsum content on the optimum water content and the
corresponding maximum dry density of the tested soil. Standard Proctor effort of 600
kN.m/m3 was considered, in which 27 blows were applied from a 2.5 kg rammer
falling through a height of 300 mm to compact the soil in three layers into a one litre
compaction mould. A motorized apparatus was used with a metal rammer having 50
mm diameter circular face.
Gypsum is considered susceptible to crushing during compaction since gypsum
particle is a soft crystal with a hardness rating of 2 (Blyth, 1971). This causing
gypsum particles to reduce in size by the action of the 2.5 kg rammer. Therefore, the
characteristics of the material may progressively change after each compaction
attempt. To overcome that, separate batches of soil mixture at different moisture
contents, each for compacting once only, were prepared to perform the compaction
test. Water content increments of 1% were considered with smaller increments of
water around the expected optimum water content to increase the accuracy of the
test. The determination of water contents was carried out by following the British
Standard (BS 1377-1-1990) with drying in a fan-assisted oven maintained at a
temperature not exceeding 50 ºC to keep gypsum hydrated water and prevent phase
transform. The porosity and void ratio corresponding to the maximum dry density for
different sand-gypsum mixtures were determined by using the volume-mass
relationships.
3.4.2. Consolidation tests
One-dimensional consolidation tests were carried out on five saturated sand-
gypsum mixtures in accordance with clause 3 of BS 1377-5:1990. These mixtures
had gypsum contents of 0, 20, 40, 65, and 80% by weight. The primary objective of
these tests was to find the effect of gypsum content on compressibility parameters
such as the compression index (Cc) and the rebound index (Cr). As a secondary
objective, the determined compression index could be used in conjunction with the

75
stress-dependent soil-water characteristic curve tests to evaluate the volume changes
resulting from the application of net normal stress.
Consolidation apparatus of fixed ring type was used. The inside diameter and
height of the ring were 70 and 20mm, respectively. Specimens were prepared inside
the cell ring by static compaction to specified thickness of 8.41 mm, predetermined
dry density, and predetermined compaction water content using a compaction mould
designed specially to be compatible with the cell ring. A schematic drawing showing
the components of the compaction mould and their assembling is shown in Figure
3.3. The inner surface of the ring was coated with silicone grease to minimize wall
friction with the soil specimen. A loading frame machine was used to apply the
required static load with a constant displacement rate of 0.2 mm/min. The specimens
were compacted at their optimum water content to reach a dry density equal to 90%
of the maximum dry density obtained from the standard Proctor test for the particular
soil sample.
Figure 3.3. Schematic drawing of static compaction mould for specimens used for
consolidation tests.
As usual the test starts by loading the soil specimen axially in consequent
increments of applied stress (Clayton et al., 1995). Each increment was kept constant
until the primary consolidation has ceased. During loading the decrease in height of
the specimen was monitored at suitable intervals. When the desired maximum

76
loading has been reached, the load was released from the specimen through a
successive decrements and the increase in height of the specimen was monitored
periodically. A loading range of 8 kPa to 800 kPa with a load increment ratio equal
to one, and load increment duration of 24 hours were considered. The loading was
removed in decrements similar in values and durations to that of the applied
increments.
By knowing the initial parameters (dry mass, specific gravity, volume,
thickness) of the specimens and considering the changes in specimen thickness
through successive pressure increments or decrements, the compressibility
parameters for the tested specimens were determined by using the basic definitions
as follows:
(
3. 1
(
3. 2
where is the compression index, is the recompression index, is the change
in void ratio due to the applied pressure increment or decrement, and are the
applied pressures. The consolidation tests results are presented and discussed in
detail in Chapter 5.
3.4.3. Soil-water characteristic tests
The soil-water characteristic curve (SWCC) describes the relationship between
soil suction (matric or total) and soil water content (gravimetric, volumetric, or
degree of saturation). In this section, determination of the drying SWCC in terms of
matric suction and gravimetric water content is described. Six sand-gypsum mixtures
with a gypsum content of 0, 10, 20, 30, 40, and 50% by weight were tested. The
experimental programme was included two series of tests. In the first series, each
specimen was used throughout the complete test under different applied suction
increments to establish many points on the SWCC, whereas in the second series,
separate specimens were used for each suction increment. The details of the
experimental procedure for these tests are described in the following sections.

77
3.4.3.1. Testing device
Pressure plate extractor produced by Soil Moisture Equipment Corporation was
used to determine the SWCCs for various sand-gypsum mixtures by following the
ASTM D 6836-02. In this method, different suctions are applied to soil specimen and
the corresponding water contents are measured gravimetrically. Suctions were
applied via the axis-translation principle, in which the pore water pressure is
maintained at nearly atmospheric, and the pore air pressure is raised to apply the
suction.
A laboratory compressed air supply line was used. The regulation of the applied
air pressure has remarkable effect on the accuracy of the equilibrium water content
value of the soil specimen tested. To provide high accuracy on the applied air
pressure, double pressure regulation was utilized. Low pressure regulator in series
with a "Nullmatic" type regulator were used. The Nullmatic regulator continuously
exhausts a certain amount of air, but it provides a good accuracy on pressure
regulation. Bourdon gage was used to measure the applied air pressure, as well as,
water manometer was connected in series with the bourdon gage to measure the
small air pressure values.
3.4.3.2. Specimen preparation
To establish the SWCCs for any sand-gypsum mixture, a predefined weight of
the mixture with a predefined amount of water were mixed and kept in a small air-
tight container in a temperature controlled room to allow for water to distribute
uniformly for at least one day. Stainless-steel specimen rings, 45 mm inside diameter
and 10 mm height, were used to retain the test specimens. The inner surfaces of the
specimen rings were lubricated with technical grade silicon grease. The specimens
were statically compacted to a specified thickness of 7.6 mm, predetermined dry
density, and predetermined compaction water content by using a compaction mould
designed specially to fit with the specimen rings used. The components of the
compaction mould and their assembly are shown in Figure 3.4. A loading frame was
used to apply the required static load with a constant displacement rate of 0.2
mm/min.

78
Figure 3.4. Photographs showing (a) compaction mould components, (b) compaction
setup for specimens used for SWCC tests.
3.4.3.3. Testing procedure and calculations
The prepared soil specimens with their retaining rings were placed over filter
papers on pre-saturated porous ceramic disc for saturation. Duplicate soil specimens
were used. This was done by allowing an excess of water to stand on the surface of
the ceramic disc for 24 hours. Non-cohesive specimens generally required to be
within the retaining rings during the saturation process in order to avoid dislodging
from the retaining ring. After the completion of the saturation, the gravimetric water
contents for these specimens were measured by using the duplicate ones. Then, the
specimens were surcharged each by 500 g weight to ensure good hydraulic contact,
and the air pressure was raised to apply the first increment of matric suction, which
was 4 kPa. This increment caused water to flow from the specimens until the
equilibrium water contents corresponding to the applied suction were reached.
By considering the transient outflow methods, reviewed in Chapter 2, it can be
concluded that the time required to reach equilibrium varies according to the square
of the specimen height. Thus, in this study, small specimen height was used so that
the time required to reach equilibrium was reasonable. After the equilibrium was
established, the specimens with their retaining rings were removed quickly from the
extractor and weighed immediately and then kept in an air-tight container.
Compaction
mould
Load cell
Loading frame

79
Meanwhile, the ceramic disc was re-saturated with water by leaving an excess water
to stand on its surface for approximately 2 hours under an applied air pressure of 100
kPa. This process allows the air bubbles beneath the ceramic disc to be flushed out
due to the continuous saturated water flow throughout the ceramic disc.
Upon completion of the re-saturation process, a thin film of water was left on
the ceramic plate surface and then the specimens were placed back and twisted
approximately 45o to ensure good hydraulic contact. Successive matric suctions were
applied and several equilibrium points were established to construct the soil-water
characteristic curve for each of the specimens tested. Matric suction values of 4, 10,
20, 50, 100, 200, and 400 kPa were applied. In this method, each soil specimen was
used throughout the complete test and subjected to all suction increments to establish
the SWCC. However, there were some concerns about the possibility of re-
establishing hydraulic contact between the soil specimens and the ceramic disc after
applying pre-defined matric suction increments and the corresponding dryness of the
specimens.
Alternatively, second series of tests were carried out, in which separate
specimens were used for each suction step, i.e., each specimen was subjected to one
suction step only as per the ASTM D 6836-02. Thus, to establish SWCC of eight
water content-matric suction points, sixteen identical specimens were prepared when
duplicate specimens were used to establish each point of the SWCC. The duplicate
specimens were placed once in the pressure plate extractor for saturation and then the
pre-defined matric suction step was applied. When the equalization was reached, the
duplicate specimens were removed from the pressure plate and weighed to determine
the gravimetric water contents by considering their initial dry weights. Once the
weights of the specimens were measured, the specimens were waxed and the total
volume of each one was measured by using the wax method (ASTM D 4943-08). To
establish another point on the SWCC, other duplicate specimens were used and the
above procedures were repeated. The SWCC for each sand-gypsum mixture was
established by considering the mean values of the duplicate specimens
measurements. All specimens that used to define a soil-water characteristic curve for
a certain soil mixture were prepared to be identical as far as possible.

80
The SWCCs for different sand-gypsum mixtures were determined by following
the two different approaches mentioned above. In the first approach, the same
specimens were used under different increments of matric suctions, while in the
second approach new specimens were used for each step of suction. The use of
separate specimens for each step of matric suction enabled measuring the total
volume for each specimen after the equilibrium of water content and matric suction
was reached. Knowing the specimen volume, the dry mass of the specimen, the
gravimetric water content, therefore, the volumetric water content and the specimen
void ratio corresponding to the equilibrium matric suction were calculated by using
the mass-volume relationships. Consequently, the SWCCs in terms of the
gravimetric water content, the SWCCs in terms of the volumetric water content, the
void ratio-matric suction relationship, and the void ratio-gravimetric water content
were established for each sand-gypsum mixture.
The SWCCs in terms of both gravimetric and volumetric water contents were
best-fitted by using the mathematical model suggested by Fredlund and Xing (1994).
This model takes the following form for representing the gravimetric water content
as a function to the soil suction:
(ψ (ψ
(ψ
3. 3
where (ψ is the gravimetric/volumetric water content at any soil suction, (ψ is a
correction function that extends the range of suctions beyond residual suction to zero
water content condition, is the saturated water content, and a, n, and m are fitting
parameters related to the SWCC under consideration. The variable e is the base of
the natural logarithm. The correction function, (ψ , can be written as follows:
(ψ
( ψψ
(
ψ
3. 4
where ψ is any soil suction and ψ is the residual soil suction. However, the
correction function (ψ may be taken equal to one at low suction values (Fredlund,
et al., 2011).

81
The soil fitting parameters for all measured SWCCs and the corresponding
coefficient of determination (R2) were determined. However, each of air-entry
suction ( ψ , air-entry gravimetric water content ( , residual suction (ψ
, and
residual gravimetric water content ( for each of the SWCCs were determined by
using the graphical approach suggested by Vanapalli et al. (1994). The results of the
first and second series of tests and all the corresponding parameters of SWCCs
related to different sand-gypsum mixtures are presented and discussed in detail in
Chapter 5.
3.4.4. Chilled mirror hygrometer tests
In this section, the determination of the SWCCs in terms of total suction is
described. The entire SWCCs, from near saturation suction to around 300 MPa
suction, were determined for five sand-gypsum mixtures of 0, 20, 40, 65, and 80%
gypsum contents by weight. The main objective of these tests was to find the effect
of gypsum content on the SWCC throughout the residual zone, more specifically in
the range of suction values start beyond the maximum value achieved by using the
axis-translation pressure plate to about 300 MPa. As a second objective, readings of
total suction near saturation give an idea about osmotic suction values for different
sand-gypsum mixtures. At saturation or at slightly above saturation, matric suction
values were taken equal zero and the total suctions were considered as the osmotic
suctions only.
3.4.4.1. Testing device
WP4C Dewpoint PotentiaMeter produced by Decagon Devices, Inc. was used to
determine the entire SWCCs for different sand-gypsum mixtures following the
procedure laid out in the ASTM D 6836-02. The measured suction range of the
device is from 0 to 300 MPa with an accuracy of ±0.05MPa at suction range from 0
to 5 MPa, and an accuracy of 1% at suction range from 5 to 300 MPa. The measuring
time is about 10 to 15 min. for most soil specimens in precise mode. The device is
calibrated before each use by using 0.5 molal potassium chloride (KCl) solution that
has water potential = 2.22, ±0.05 MPa.
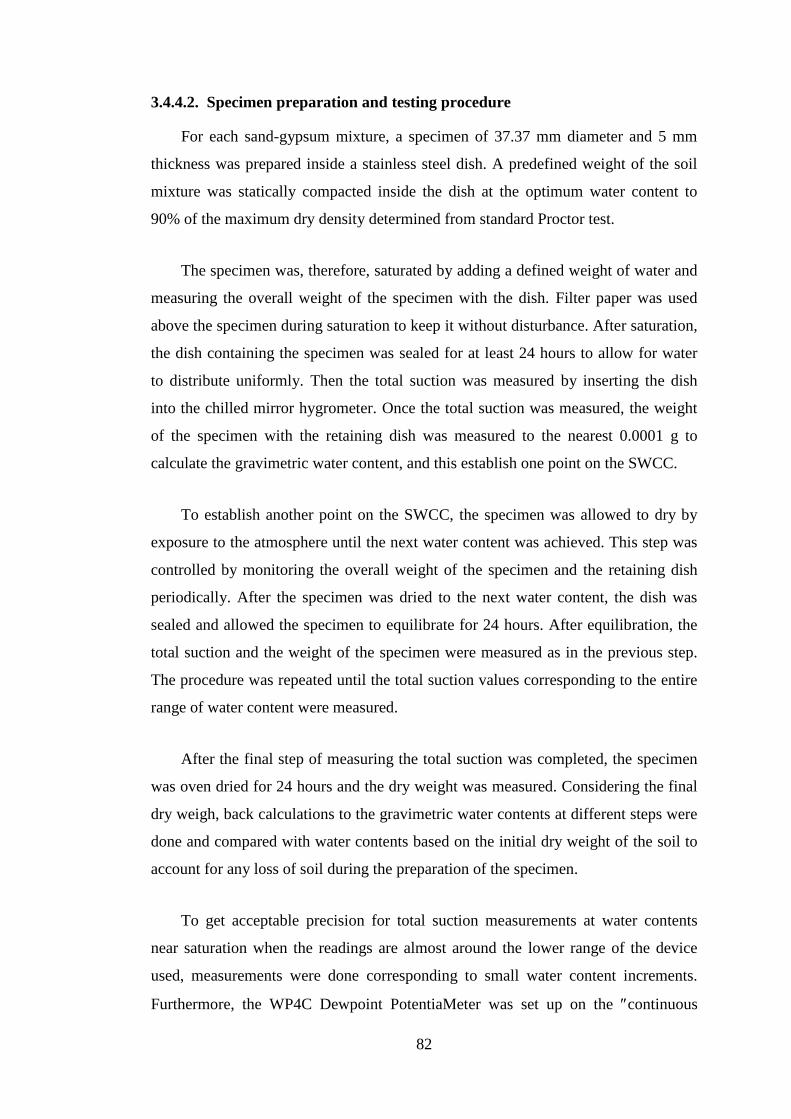
82
3.4.4.2. Specimen preparation and testing procedure
For each sand-gypsum mixture, a specimen of 37.37 mm diameter and 5 mm
thickness was prepared inside a stainless steel dish. A predefined weight of the soil
mixture was statically compacted inside the dish at the optimum water content to
90% of the maximum dry density determined from standard Proctor test.
The specimen was, therefore, saturated by adding a defined weight of water and
measuring the overall weight of the specimen with the dish. Filter paper was used
above the specimen during saturation to keep it without disturbance. After saturation,
the dish containing the specimen was sealed for at least 24 hours to allow for water
to distribute uniformly. Then the total suction was measured by inserting the dish
into the chilled mirror hygrometer. Once the total suction was measured, the weight
of the specimen with the retaining dish was measured to the nearest 0.0001 g to
calculate the gravimetric water content, and this establish one point on the SWCC.
To establish another point on the SWCC, the specimen was allowed to dry by
exposure to the atmosphere until the next water content was achieved. This step was
controlled by monitoring the overall weight of the specimen and the retaining dish
periodically. After the specimen was dried to the next water content, the dish was
sealed and allowed the specimen to equilibrate for 24 hours. After equilibration, the
total suction and the weight of the specimen were measured as in the previous step.
The procedure was repeated until the total suction values corresponding to the entire
range of water content were measured.
After the final step of measuring the total suction was completed, the specimen
was oven dried for 24 hours and the dry weight was measured. Considering the final
dry weigh, back calculations to the gravimetric water contents at different steps were
done and compared with water contents based on the initial dry weight of the soil to
account for any loss of soil during the preparation of the specimen.
To get acceptable precision for total suction measurements at water contents
near saturation when the readings are almost around the lower range of the device
used, measurements were done corresponding to small water content increments.
Furthermore, the WP4C Dewpoint PotentiaMeter was set up on the continuous

83
mode for suction readings corresponding to high water content values, as
recommended in the user's manual. In such mode, the total suction of the specimen
was measured continuously and the best representative suction readings were chosen.
3.4.4.3. Representation of test results
In chilled mirror hygrometer technique, the water content is controlled and the
corresponding suction is measured. In other words, the independent variable is the
water content, while the depended variable is the total suction. Thus, the water
content was represented on the x-axis, and the total suction was represented on the y-
axis. However, when the SWCC determined from pressure plates (low suction
values) was combined with that determined from chilled mirror hygrometer (high
suction values), the water content was represented as usual on the y-axis as a
function to the soil suction which was represented on the x-axis. This representation
mimics the presentations of other soil functions like the unsaturated hydraulic
conductivity and the grain-size distribution curve.
3.4.5. Soil shrinkage characteristic tests
The changes in volume of a soil associated with changes in the water content are
usually described by the soil shrinkage characteristic curve (SCC), McGarry and
Malafant (1987). The shrinkage characteristic curve can be represented as either the
void ratio versus water content or the specific volume (the inverse of dry density of a
soil) versus water content (Haines, 1923). This curve is an important part of the
constitutive behaviour of the soil and can be used in the determination of volume-
mass property functions of unsaturated soils. The shrinkage curve can be used in
conjunction with the soil-water characteristic curve to establish the relationship of
void ratio versus soil suction.
As reviewed by many researchers, typical shrinkage curve may have an S-shape
with two curvilinear parts at the ends and a linear portion at the middle (Tripathy et
al., 2002; Bensallam et al., 2012). These three parts are corresponding to three stages
of shrinkage which are the structural shrinkage, normal shrinkage, and the residual
shrinkage, respectively (Haines, 1923). During the normal shrinkage, the reduction in
the bulk volume of the soil is equal to the volume of water lost, while at the first and

84
third stages the decrease in bulk volume of the soil is less than the volume of the lost
water. However, the structural shrinkage stage may not exist in many soil conditions
and then the SSC will comprise the normal shrinkage stage represented by a
saturated line and the residual stage represented by curvilinear segment (Fredlund et
al., 2002).
CLOD test has been used to measure the SCC. The test has been first developed
at the New Mexico Engineering Research Institute to predict heave under air field
pavements (McKeen, 1981; McKeen and Hamberg, 1981). The procedure of this test
is a modification of the coefficient of linear extensibility (COLE) test procedure
which had been used by the Soil Survey Laboratory, U.S.D.A., since 1959 (Brasher
et al., 1966).
To establish a shrinkage curve, unconfined soil clod is coated with a waterproof
plastic resin and measurements of volume and weight are taken periodically while
the clod is in the process of drying under laboratory humidity. The coating resin is
permeable to water vapour, permitting a coated clod to gain or lose water, but
practically impermeable to liquid water, as such permitting volume measurements by
displacement of water. At the same time, the resin is flexible and that is mean the
coating adheres to a cold and contracts or expands as the clod shrinks or swells. In
this study the SCCs of different sand-gypsum mixtures were determined with the
objective of determining the effect of gypsum content on the shrinkage
characteristics of gypsiferous soils. As well as, the SCCs can be used to evaluate the
volume changes associated with the applying of different levels of matric suction
during the stress-dependent soil-water characteristic curve tests.
3.4.5.1. Testing procedure for SCCs
The test procedure for establishing the SCCs starts by preparing clods having
gypsum contents of 0, 10, 20, 30, 40, 65, and 80% by dry weight. The clods were
prepared by static compaction to form cylindrical specimen shape of 45 mm diameter
and 7.6 mm height. The compaction mould shown in Figure 3.3 was used to compact
the specimens at their optimum water content to 90% of the maximum dry density
obtained from the standard compaction tests.

85
The compacted specimens with their rings were placed over a saturated ceramic
plate for the saturation process. The saturation was done by allowing an excess of
water to stand on the surface of the ceramic plate for 24 hours. Upon completion of
the saturation process, the specimens were subjected to a matric suction ranging from
10 to 30 kPa in pressure plate device to bring them to a water content and then a
consistency suitable to handle without dislodging or disturbing. The water content in
which the soil specimen can be handled in an appropriate manner depends on the soil
texture. Soil-mixtures with high gypsum content exhibited good consistency to deal
with at relatively high water contents.
Therefore, the specimens were extracted from the retaining rings and their water
contents were measured using duplicate specimens. Then, each clod was held by a
thread, weighed, and briefly immersed in the resin without delay. The immersed
clods were weighed again and then suspended from the thread and allowed to dry for
10 to 20 minutes. The type of resin used in this study was Polyvinyl Acetate glue
emulsion, and its commercial mark was "UniBond WETERPROOF PVA". This type
of resin was first suggested and used by Tadza (2011).
To measure the changes of the resin density during drying, an analogous of
known weight and volume made up from plastic was immersed in the resin and
suspended beside the coated soil clods. This analogous plastic piece was left to dry at
the same time, same environment. Volume changes and weight changes for the soil
clods and the coated plastic piece were measured periodically while clods were
allowed to dry slowly under ambient laboratory conditions. Measurements were
continued until the clods reached constant weights after about seven days. Then, the
clods were dried in a fan-assisted oven maintained at a temperature not exceeding 50
ºC, and the final volumes and weights were measured. Volumes of the clods were
found by weighing each clod twice, once while it was suspended in air and another
while it was suspended in water. By applying Archimedes rule, the difference
between each of these pairs of weights is equal to the bulk volume of the coated clod
times the mass density of water at laboratory temperature.
The volume and mass of the resin that coated the soil clod at any time were
found by considering the following: (a) the initial resin mass of the soil clod which is

86
equal to the difference in the initial weight of the clod before and immediately after
immersing in the resin. (b) the changes in resin density and mass with time, i.e., the
volume and mass measurements of the coated plastic piece.
3.4.5.2. Calculations of CLOD tests
The water content-void ratio points of a shrinkage characteristic curve can be
calculated by following the steps listed below:
(1) The dry weight of the soil clod ( ) can be calculated as follows:
3. 5
where:
: The initial water content of the soil clod determined from a duplicate soil
specimen.
: The initial weight of the wet soil clod before coating with resin.
(2) From the weight readings of the plastic specimen, the density of the resin ( ) at
elapsed time, t, from the beginning of drying is:
(
( (
3. 6
where:
: The weight density of water at laboratory temperature.
: The weight of the plastic specimen, suspended in air.
: The weight of the plastic specimen, immersed in water.
: The weight of the resin coated-plastic specimen at elapsed time t, suspended in
air.
: The weight of the resin coated-plastic specimen at elapsed time t, immersed in
water.
(3) The weight of the resin which is coated the soil clod ( ) at elapsed time t is
calculated as follows:
( (
(
3. 7

87
where:
W2: The initial weight of the resin coated-soil clod, suspended in air.
W5: The initial weight of the resin coated-plastic specimen, suspended in air.
(4) The volume of the resin which is coated the soil clod ( ) at elapsed time t is:
3. 8
(5) The net weight of soil clod ( ) at elapsed time t is:
3. 9
(6) The net volume of soil clod ( ) at elapsed time t is:
3. 10
where:
: The weight of the resin coated-soil clod at elapsed time t, suspended in air.
: The weight of the resin coated-soil clod at elapsed time t, immersed in water.
(7) The water content ( of the soil clod at elapsed time t is:
3. 11
(8) The void ratio ( ) of the soil clod at elapsed time t is:
3. 12
where is the specific gravity of soil solids. Equations 3.6 to 3.12 are applied
repeatedly for all periodic sets of weight readings that cover the full range of the
measured shrinkage characteristic curve.
3.4.5.3. Mathematical modelling of SCCs
One of significant advantages of the CLOD test is that the volume changes are
monitored along a gradually varying moisture change path, and this produces a
smooth shrinkage curve for each sample. These data provide void ratio and water
content at various points. To quantify the behaviour of soil shrinkage with different

88
gypsum content, the shrinkage curves were represented mathematically by using
Fredlund et al. (2002)'s model. The mathematical representation of the SCCs and the
corresponding SWCCs facilitates greatly the conjunction of these two functions
when the void ratio versus soil suction relationships or the SWCCs in terms of
volumetric water content were determined. Fredlund et al. (2002)'s equation could be
written as follows:
(
3. 13
where ( is the void ratio as a function to the water content, , a is a fitting
parameter represents the minimum void ratio obtained from the shrinkage of the soil,
c is a fitting parameter represents the curvature of the shrinkage curve, b is a fitting
parameter related to the slope of the tangent of the shrinkage curve. The slope of the
line between void ratio and water content is equal to (a/b) and it is related to the
initial volume-mass properties of the soil as follows:
3. 14
where is the specific gravity of the soil solids, and S is the initial degree of
saturation of the tested specimen. On the other hand, the slope of the void ratio
versus water content curve at the normal phase of shrinkage is referred to as CLOD
index, Cw, which expresses the volume compressibility with respect to water content.
3. 15
where is the incremental change in void ratio corresponding to the incremental
change in water content, .
3.4.6. Stress-dependent soil-water characteristic tests
It has been well recognized that factors such as void ratio, soil structure, and
stress state can influence the average pore size distribution in the soil specimen and
then influence the SWCC (Fredlund and Rahardjo, 1993). Thus, it is preferable to
simulate the stress state of the field when the SWCC has to be determined for a
certain soil at the laboratory. Few experimental studies have been carried out to
examine the effect of stress state on the SWCC. In this study, stress-dependent soil-
water characteristic curves (SD-SWCCs) of silty clayey sand with different

89
percentages of gypsum were investigated under both drying and wetting paths. A
new stress controllable pressure plate device was developed for this purpose.
The modified device was used to measure conveniently and efficiently the
drying and the wetting SD-SWCCs. Continuous determination of specimen water
content during the tests was accurately determined without dismantling the device by
weighing the overall cell. This feature makes the device suitable to measure the
unsaturated hydraulic conductivity function of the tested specimen simultaneously
with the determination of the SD-SWCCs.
The testing programme was undertaken to establish the SD-SWCCs of five
different sand-gypsum mixtures tested under five different levels of net normal
stress, which were 0, 100, 200, 300, and 400 kPa. The design and construction details
of the modified stress controllable pressure plate device, the detailed experimental
programme, the preparation of the specimens, the testing procedure, and the
calculations of these test results are presented in Chapter 4.
3.4.7. Stress dependent-unsaturated hydraulic conductivity function tests
The laboratory methods used for determining unsaturated hydraulic conductivity
may be classified into steady-state and unsteady-state methods as reviewed in chapter
two. In the steady state methods, the flux, the hydraulic gradient, and the water
content of the soil are constant with time, while each of these parameters are varying
with time for unsteady-state or transient techniques. Among the unsteady-state
methods are the transient outflow methods that mostly depend on some analytical
solutions to Richard (1931)'s equation which is the governing equation for the one-
dimensional transient flow in homogenous soils (no change in hydraulic conductivity
in the direction of flow).
The transient outflow methods may be categorized into four types, among those
are the multistep method and the one step method. These methods are usually
conducted on specimens under drying conditions using conventional axis-translation
equipment without applying any surcharge loads. In these methods, the transient
diffusion equation is usually solved for determining the hydraulic diffusivity
function. Then, the hydraulic conductivity function is calculated by knowing the

90
specific moisture capacity which is defined from the soil-water characteristic curve
when it is represented as a function of volumetric water content versus matric suction
as a head.
In this study, the original multistep analysis approach by Gardner (1956) was
used to analyse the results of the tests which were carried out by using the newly
modified stress controllable pressure plate device. Furthermore, the one step
approach by Doering (1965) was used as an alternative approach for the analysis of
the results and a comparison between these two approaches was done. The tests were
implemented in conjunction with the tests of SD-SWCCs determination in both the
drying and the wetting processes under different applied net normal stress levels.
Five extensive series of stress dependent-hydraulic conductivity functions (SD-
HCFs) were carried out on five sand-gypsum mixtures having gypsum contents of
10, 20, 40, 65, and 80%. These mixtures were tested at four different net normal
stress levels (0, 100, 200, and 400 kPa). The unsaturated hydraulic conductivity
functions were determined by monitoring the time-dependent decrease in weight of
specimens subjected to series of applied increments of matric suction. Similarly,
during the wetting process, the time-dependent increases in weight of specimens
subjected to series of applied decrements of matric suction were monitored. The
details of the experimental programme, preparation of specimens, testing device,
testing procedures, and calculations are presented in Chapter 4.
As a reference value, the saturated hydraulic conductivity of the silty clayey
sandy soil without gypsum additives was found by using a falling head permeameter
according to BS 1377-5 (1990). The specimen was placed in the permeameter at its
optimum water content and dry density of 1.8 Mg/m3. An average value of 4×10
-9 m/s
was found to represents the saturated hydraulic conductivity of the sandy soil without
gypsum.
3.4.8. Direct shear tests on saturated specimens
3.4.8.1. Overview
The direct shear test is one of several methods available for measuring the shear
strength of soils. In this test a soil specimen of square or circular cross section is

91
laterally restrained and sheared along a mechanically induced horizontal plane while
subjected to a pressure applied normal to that plane. The shearing force can be
applied either by increasing the force at a given rate and measuring the resulting
displacement, or by applying displacement at a given rate and measuring the
resulting force. The first method is called stress-controlled method while the second
one is called strain-controlled method. As the strain is gradually increased the
shearing resistance builds up until the peak stress is reached and failure begins. As
the strain is further increased the resistance falls to a steady value known as steady
state strength, and the arrangement of the soil particles comes up to a loose state
(Lambe, 1951). The strain-controlled method was adopted in this study and the
shearing resistance was measured at regular intervals of displacement. The peak
shear strength was considered in calculating the shear strength parameters by using
Mohr-Coulomb failure criterion.
The experimental programme was designed to examine the effect of gypsum
content on the saturated shear strength parameters of the sandy soil. These
parameters are the effective angle of shearing resistance and the effective cohesion.
Eight sand-gypsum mixtures were tested having gypsum percentages of 0, 10, 20, 30,
40, 50, 65, and 80% by dry weight. Three identical specimens for each of the eight
soil mixtures were tested under three different normal pressures (100, 200, 400 kPa).
In total, more than 30 tests were carried out, from them 24 tests were adopted. Some
tests were repeated due to experimental uncertainties or for test results conformation.
All tests were performed under saturation condition.
3.4.8.2. Direct shear testing device
The designed experimental programme was performed using a Wykeham-
Farrance, 27-WF2180, Automatic digital direct/residual shear machine. The machine
is equipped with a microprocessor system that records and processes the
measurements of shear force, axial pressure, vertical deformation, and horizontal
displacement. The device incorporates a pneumatic closed loop system for the
automatic application of the axial pressure by a high performance pressure regulator.
An automatic management of the test was achieved by connecting the device to a PC
through a serial port using ASCII protocol, HyperTerminal software. Three modes

92
for data acquisition (linear, exponential, and polynomial mode versus time) through
different test stages were available. These modes are related to the pre-set time
intervals for recording the test measurements, either for consolidation or shearing
stage. Exponential mode was selected for recording consolidation data, and linear
recording mode for shearing data. Figure 3.5 shows the general set-up of the direct
shear device.
Figure 3.5. Photograph of the general set-up of the direct shear device.
Small shear box was used in this study with a circular cross section of 60 mm in
diameter. The initial specimen height was 23.4 mm for all tests.
3.4.8.3. Device calibration
The machine is equipped with two displacement transducers (horizontal
displacement and vertical deformation transducers) and two strain gauge transducers
(load cell for lateral shear force measurement and pressure transducer measuring the
axial pressure acting on the sample). Each of these transducers was calibrated by
using reference micrometer for displacement calibration, and reference load cell for
force calibration. It was possible for each transducer to make linear calibration with a
single factor or polynomial calibration with several factors. The polynomial
calibration is usually used to get high accuracy along the full range of the strain
gauges measurements, especially in the range below 10% of full scale.

93
Each transducer was calibrated by applying a series of increments of
displacement (or force) to it and these increments were measured by using well
calibrated reference instrument. Two readings were obtained corresponding to each
increment, a digital signal reading from the transducer under calibration and a
physical reading from the reference instrument with physical units. These pairs of
readings were taken to cover the full scale of the transducer under consideration.
Upon completion that, a series of decrements of displacement (or force) were applied
and another set of pairs of readings was gathered from the other direction of
movement or loading. For each pair of readings, the calibration factor was calculated
as the ratio of the physical reading to the digital signal reading. By comparing these
factors, very slight differences were found between loading unloading paths or
forward backward displacements. However, simple evaluation concerning the
linearity of each transducer and the range in which the best calibration should be
performed was done by plotting these pairs of data. Figure 3.6 shows an example for
the calibration readings of the horizontal displacement transducer during forward,
backward, and a second forward movement. It can be noticed from Figure 3.6 that
the difference between the calibration factors during forward movements (average of
1.0903) and that during backward movement (1.0921) is only 0.165%, which can be
considered insignificant.
Figure 3.6. Calibration lines of horizontal displacement transducer during forward,
backward, and second forward movement.
y = 1.0904x
R² = 0.9995
y = 1.0921x
R² = 0.9995
y = 1.0901x
R² = 0.9996 0
4
8
12
16
20
0 2 4 6 8 10 12 14 16 18 20 22
Mic
rom
eter
rea
din
g (
mm
)
Digital signal reading of the transiducer
Forward Direction
Backward Direction
Forward Direction 2

94
3.4.8.4. Specimens preparation
Three similar specimens were prepared for each sand-gypsum mixture to be
tested under three different normal pressures of 100, 200, and 400 kPa. Firstly, the
soil mixture was prepared by mixing predefined weights of dry sand and gypsum in a
small plastic can. The mixture was mixed dry, then with water to be at the optimum
water content, and kept for at least one day in air-tight container in a temperature
controlled room to allow for water to distribute uniformly. Silicone grease was
applied to the inside faces of the shear box and to the surfaces of contact between the
two halves of the box. Then, the parts of the shear box were assembled and the entire
soil mixture was poured from the container into the shear box. The soil specimen was
compacted directly inside the shear box via static compaction method at the optimum
water content to achieve a dry density equal to 90% of the maximum dry density
obtained from the standard Proctor test. A compaction ram was machined to fit the
shear box and to control the compacted specimen thickness to 23.4 mm for all tests
performed. By this manner, the initial specimen parameters such as the bulk density
and the void ratio could be defined by considering the volume-mass relationships. A
loading frame machine was used to apply the required static load with a constant
displacement rate of 0.2 mm/min. The components of the shear box and the
compaction ram are shown in Figure 3.7.
Figure 3.7. Shear box component with the compaction ram used in static compaction.
Compaction ram
Perforated spacer plate
Spacer plate
Porous plate
Shear box halves

95
For curing and cohesive forces equalization, the compacted specimen with the
shear box was warped by stretch polyethylene film and stored in a temperature and
humidity controlled room for 48 hours prior to shearing. This period enables any
excess pore pressures to dissipate as well.
3.4.8.5. Testing procedure and calculations
After preparing the soil specimens inside the shear box as described in the
previous section, the specimens were tested in accordance with clause 4 of BS 1377-
7:1990. In each test, the specimen was first saturated by flooding the direct shear
carriage with de-aired distilled water. The soil specimen in the direct shear box was
allowed to intake water for 24 hours under a nominal surcharge (loading cap,
grooved perforated spacer, and porous plate). The specimen then was consolidated
under the pre-decided vertical normal load until the primary consolidation was
completed. Eight hours of consolidation were found to be satisfactory for all tested
specimens.
On completion the consolidation stage and before starting the shearing process,
the rate of shearing displacement had to be decided adequately. Rapid shear of a
saturated soil may cause positive or negative pore water pressure to be built up
depending on the density of the sheared soil. Loose soil tends to contract during
shearing while dense soil tends to expands during shearing. Soil contraction is
associated with an increase in pore water pressure if the soil is sheared more rapidly
than its pore water can flow out. In contrary, soil expansion is associated with
negative pore water pressure if the rate of shear is too rapid to permit the free inflow
of water. Negative pore water pressure causes an increase in the effective
intergranular stress while positive pore pressure reduces that. Therefore, rapid shear
of a saturated soil may cause a decrease in the strength of a loose soil or an increase
in the strength of a dense soil. Thus, the adequate rate of shearing displacement was
very important to decide before starting the shearing process.
By using the consolidation readings, the square-root time versus vertical
deformation was plotted, and the time required to reach 100% consolidation, ,

96
was found. The minimum time to failure (tf) was calculated in accordance with
clause 4 of BS 1377-7:1990 as follows:
tf = 12.7 t100 3. 16
The horizontal shear displacement of the specimen at failure was estimated to be
10 mm. This value was divided by the calculated value of tf to find the maximum rate
of displacement to be applied during the shearing process. A rate of shearing
displacement of 0.02 mm/min was adopted. This value was found to be satisfactory
for all eight tested sand-gypsum mixtures. The adopted rate of shear displacement
was slow enough to prevent development of pore pressures.
During the shearing process, the microprocessor of the device was set to record
the shearing force, the horizontal displacement, the vertical deformation, and the
elapsed time at regular intervals of horizontal displacement of 0.20 mm and continue
to a full travel. A total horizontal displacement of 14 mm was decided to be the end
of travel for the shear box. This value was found to be extended beyond the
maximum shear point (peak shear stress) by appropriate distance for all tested
specimens.
Upon completion the shearing process, the water was siphoned off from around
the specimen and the specimen was allowed to stand for about 10 min to enable the
free water to drain off. The vertical force was released then, and the specimen was
extruded to measure the water content gravimetrically. Considering the final
saturated water content and knowing the particle density of the tested soil, the final
void ratio of the specimen at failure was calculated. By back calculation using the
vertical deformation readings, the values of void ratio at all the test stages could be
calculated and compared with the calculated values based on the initial specimen
condition. The detailed results and discussion of the direct shear test on saturated
specimens are presented in Chapter 7.
3.4.8.6. Stresses and strains
For each set of readings obtained corresponding to an increment in horizontal
displacement during a shear test, the shear stress ( ) on the failure surface was

97
calculated by dividing the measured shear force by the corrected cross sectional area
of the sheared specimen. The sheared area between the two specimen halves reduces
with the progress of shearing process as shown in Figure 3.8.
Figure 3.8. A schematic diagram showing the corrected cross-sectional sheared area
in a circular shear box.
The corrected cross sectional area ( ) could be calculated as follows:
3. 17
(
)
3. 18
The stress distribution across the specimen is complex, and thus the calculated
value of shear stress represents an approximate mean value. The calculated shear
stress as ordinates was plotted against horizontal displacement as abscissa, and then
the value of the maximum or the peak shear stress and the corresponding horizontal
displacement were defined.
To determine the effective angle of shearing resistance ( ) and the effective
cohesion ( ) for each sand-gypsum mixture, the maximum or the peak shear stress
value was adopted as a failure criterion and then represented as ordinates against the
corresponding normal stresses and best fitted by straight line. The angle of shearing

98
resistance was determined from the slope of the line and the apparent cohesion was
determined from the intercept, both in terms of effective stress.
To determine the volume changes of the specimen during the shearing process, a
graph of vertical deformation of the specimen as ordinates against horizontal
displacement as abscissa was plotted for each tested specimen. Dense specimen
usually dilates until failure occurs, however, when the shearing resistance drops, and
after that a slight decrease in volume may occur. Loose specimen, on the other hand,
compresses under the shearing action.
3.4.9. Direct shear tests on unsaturated specimens
3.4.9.1. Overview
In saturated soil, shear strength is commonly resulted from two components, the
cohesion component and the frictional component that results from external loading
(skeletal forces). The resultant shear strength could be described through Mohr-
Coulomb failure criterion. In unsaturated soils, however, the shear strength has a
third component beside the two components of the saturated soil. The third
component results from an internal stress acting locally on soil grains that arises
particularly from desaturation of the soil and it is independent of the external
loading. This component can be captured by incorporating the soil matric suction in
conjunction with a soil parameter (i.e., the effective stress parameter, , or the angle
of shearing resistance related to matric suction, ) as presented in Section 2.3.2.
The modified direct shear or triaxial shear equipment, which have the facilities
to control the matric suction, are usually used to measure the shear strength of
unsaturated soils (Escario, 1980; Ho et al., 1982; Gan et al., 1988; Vanapalli et al.,
1996). These equipment are costly, time consuming, and need high skill and
laboratory expertise. For those reasons, during the last decade, many researchers
trended to use the conventional direct shear device to find the shear strength of
unsaturated soil specimens through water content controlled conditions instead of
suction controlled conditions (Lane et al., 2001; Vanapalli and Lane, 2002;
Feuerharmel et al., 2006; Lu and Likos, 2006; Casini et al., 2011).

99
Conventional tests of water-controlled specimens are much easier and faster
than suction-controlled specimens. Furthermore, the describing of shear strength as a
function of water content makes it more preferable in practical applications, because
the measuring of field water content is easier and faster than measuring soil suction.
Water-controlled specimen technique was adopted in this study to examine the
effect of gypsum content and the effect of de-saturation on the shear strength of
gypsiferous soils. To examine the reliability of this technique, the results of the direct
shear tests, on unsaturated soil specimens with different initial degrees of saturation,
were used in conjunction with the data obtained from the stress-dependent soil-water
characteristic curve (SD-SWCC) tests. This enables the evaluation of shear strength
as a function to the matric suction. The SD-SWCC data was represented as a
mathematical equation in the shear strength function by using the reverse form of
Fredlund and Xing (1994)'s mathematical model.
As an additional approach, the concept of suction stress (Lu and Likos, 2006)
was adopted without considering independently the variables that define it (i.e.,
matric suction and ). By using this concept, it was circumvented about the necessity
of determining the matric suction or the effective stress parameter , since the most
relevant variable to the shear strength is neither the matric suction nor but the
product of the two which is identified as suction stress. This could be noticed clearly
from the failure envelope equation suggested by Bishop (1960), Equation 2. 21.
Furthermore, the suction stress characteristic curves (SSCCs) in terms of water
content were determined for different sand-gypsum mixtures by using the results of
the direct shear tests. As well as, it is possible to find the SSCCs in terms of matric
suction by incorporating the results of the stress-dependent soil-water characteristic
curve tests.
3.4.9.2. Experimental programme
One of the primary objectives of this study was to determine the effect of
gypsum content on the unsaturated shear strength function of gypsiferous soils. This
objective was achieved by carrying out an extensive laboratory programme includes
more than 150 direct shear tests on different unsaturated sand-gypsum mixtures.

100
These tests were carried out in conventional direct shear apparatus on soil specimens
that were saturated and air-dried to pre-defined water contents. The specimens were
consolidated and sheared under undrained conditions for the water phase while the
air phase was allowed to be under atmospheric condition, i.e., the tests were carried
out under constant water content conditions.
The experimental programme was designed to examine five different sand-
gypsum mixtures having 0, 20, 40, 65, and 80% gypsum content by weight. Each soil
mixture was tested at about six different water contents under four different net
normal stresses (100, 200, 300, and 400 kPa). Thus, each series of tests on each sand-
gypsum mixture was comprised about 24 tests. Some tests were repeated due to
experimental uncertainties or for test results conformation. In total, more than 150
direct shear tests of statically compacted unsaturated specimens were carried out on
the silty clayey sand with different percentages of gypsum content. Table 3.2 shows
the framework of the experimental programme.
Table 3.2. The framework of direct shear tests on unsaturated specimens.
First series: Gypsum content = 0%
Net normal stress (kPa) Gravimetric water contents of tested specimens (%)
100 15.2 9.8 7.7 6.9 6.1
200 15.1 9.8 7.7 7.0 6.0
300 15.5 9.9 7.7 7.0 6.0
400 16.0 9.7 8.0 7.0 6.1
Second series: Gypsum content = 20%
100 15.5 10.9 9.3 8.2 7.4 6.7
200 16.2 10.9 9.1 8.2 7.5 6.7
300 16.4 10.9 9.1 8.1 7.5 6.7
400 16.6 10.9 9.2 8.1 7.6 6.7
Third series: Gypsum content = 40%
100 16.5 12.7 10.8 9.4 7.8 6.7
200 16.2 12.8 10.9 9.5 7.6 6.5
300 16.3 12.7 10.8 9.6 7.7 6.6
400 16.4 12.7 11.0 9.3 7.8 6.5
Fourth series: Gypsum content = 65%
100 19.3 13.4 9.0 8.2 7.4 6.7 5.6
200 19.3 13.3 9.1 8.2 7.2 6.7 5.8
300 19.0 13.4 9.0 8.2 7.2 6.6 5.8
400 18.6 13.2 9.1 8.2 7.2 6.5 5.5
Fifth series: Gypsum content = 80%
100 23.6 11.8 8.9 7.5 6.6 5.6
200 23.4 12.1 8.9 7.5 6.4 5.5
300 23.1 11.7 8.8 7.5 6.5 5.6
400 22.8 12.1 9.0 7.5 6.4 5.5

101
The matric suction values of the air-dried specimens were determined by
knowing the water content values and using the soil-water characteristic curve of the
sand-gypsum mixture under consideration. For any test, the initial condition and the
equalized matric suction of the water-controlled specimen are expected to alter
during the consolidation stage firstly and then during the shearing stage. The
alteration of matric suction during the consolidation stage, due to the effect of net
normal stress, was defined accurately in this study by conducting a series of stress-
dependent soil-water characteristic curve (SD-SWCC) tests for each sand-gypsum
mixture. These tests were carried out under the same levels of net normal stress that
used in the shearing tests. Furthermore, the same hydraulic loading path was
considered, i.e., the water-controlled specimens for the direct shear tests were
prepared under drying path which were analogous to those tested under the drying
SD-SWCC. As well as, the compaction parameters of the prepared specimens for the
direct shear tests were made identical as far as possible to those prepared for the SD-
SWCCs tests.
The second alteration of matric suction may be happened during the shearing
process. In this study, the results of the shear strength tests were analysed based on
assumption that there were no changes in matric suction during the shearing process
as long as the specimens were sheared under constant water content conditions at
reasonably short period, not exceeding 28 min. However, the volume changes of the
specimens during the shearing process were measured, and those measurements
usually give an indication of the possible associated changes in the matric suction
during the shearing process. The dilation of specimen during shearing process may
be associated with an increase in matric suction, while the reduction in volume
results a possible decrease in matric suction.
3.4.9.3. Specimens preparation
The soil specimens were statically compacted inside the shear box directly by
following the same procedure adopted in compaction the specimens for the saturated
tests (Section 3.4.8.4). All specimens were compacted to constant volume, constant
thickness of 23.38 mm, at the optimum water content, to achieve a dry density equal
to 90% of the maximum dry density obtained from the standard proctor test. The

102
specimens were saturated by placing them in a shallow pan flooded with distilled
water while they were subjected to a vacuum of 20 kPa. A saturation period of 4
hours was found to be suitable. The saturated specimens were then subjected to
different periods of air-drying to produce variation in water content from specimen to
another and correspondingly variation in matric suction. The air dried soil specimens
were then wrapped by stretch polyethylene film and stored in a temperature and
humidity controlled environment for a minimum of 48 hours to attain equilibrium
conditions with respect to water content and suction throughout the specimens. After
that the specimens were consolidated and sheared as described below in Section
3.4.9.5.
3.4.9.4. Device adjustment
Like other conventional direct shear devices, the used device has been designed
primarily to test saturated specimens or granular dry specimens, i.e., specimens at
plastic state or low stiffness state. Figure 3.9 shows a schematic drawing of the
pneumatic system which is integrated in the Wykeham-Farrance, 27-WF2180, direct
shear machine to apply and control the desired normal pressure on the specimen
automatically.
Figure 3.9. A schematic diagram showing the normal pressure pneumatic system of
the direct shear device.

103
In typical tests, the loading head screw is gently turned to achieve good contact
with the loading cap of the shear box. At this step, the piston inside the air pressure
cylinder is at the top end of the cylinder, and any tightness in the head screw will
result by an amount of normal load applied manually on the specimen, i.e., the
system will act as a manual vice. This manual loading was evaluated by placing a
load cell beneath the head screw and tightened it to different degrees as described in
Table 3.3.
Table 3.3. Normal loads result from different degrees of head screw tightness.
Head screw status Manual normal load (N)
Very loose 8
Loose 19
Lightly screwed 60
Gently screwed by two finger tips 90
Relatively tightened by two finger tips 316
Tightened by two finger tips 541
When a desired normal pressure is set up to a certain value and the test started,
the compressed air will flow inside the air cylinder under the control of the automatic
pressure regulator to match the preset pressure value. Thus, the piston will move
downward to transfer the pressure to the specimen via the attached loading yoke. The
vertical displacement of the piston is equal to the amount of the vertical
consolidation of the specimen under the applied normal pressure, and this depends on
the coefficient of compressibility of the specimen.
Upon completion of the consolidation stage and starting the shearing process,
the specimen exhibits vertical dilation when the initial void ratio of the specimen is
smaller than the critical void ratio. Consequently, the piston of the air pressure
cylinder will move back upward with an amount equal to the vertical dilation of the
specimen. Meanwhile, the applied normal pressure still has the same presetting value
as long as the piston is not restricted and the air pressure inside the pneumatic
cylinder is controlled by the automatic pressure regulator.
When the value of vertical dilation approaches the amount of consolidation of
the specimen, which occurred through the first stage, the piston will return back to
the top end of the pressure cylinder. Hence, the pneumatic loading yoke of the device

104
cannot move freely upward and some restriction on vertical dilation will be started.
Consequently, any further dilation will be restricted and the automatic pressure
regulator no longer be able to control the normal pressure at the desired value. In
such a case, the loading yoke will act as a vice and this restriction will be associated
with a built up of normal pressure which is proportional to the stiffness of the
specimen.
In this study, most of the unsaturated gypsiferous specimens exhibited high
stiffness especially when they were air dried to relatively low water contents. Most
of these specimens showed dilation during shearing process with an amount
proportional inversely with the applied net normal stress. Specimens sheared under
100 kPa net normal stress exhibited dilation more than those sheared under higher
values of net normal stress, and this amount of dilation was mostly greater than the
amount of compression during the consolidation stage. Thus, a remarkable restriction
from the loading yoke was noticed on the dilation of these specimens during the
shearing stage. Consequently, the built up normal pressure, conjugated to that
restriction, was noticed mostly greater than the pneumatic pressure which is recorded
and displayed by the microprocessor of the device. This matter was experimentally
evaluated by installing a small load cell between the loading cap of the shear box and
the loading head screw. Through this load cell, the actual normal force applied on the
top of the specimen was measured and compared with the pneumatic system reading
to evaluate the system reliability.
To overcome the restriction problem of the loading yoke in testing unsaturated
stiff specimens, it was suggested in this study to leave a small gap between the
loading head screw and the loading cap of the shear box. This gap was suggested to
be equal or more than the anticipated dilation through the shearing stage. By
following this adjustment, the readings of the inserted load cell were found to be
exactly matching the readings of the pressure transducer which is originally installed
into the device.
The introduced gap between the loading head screw and the loading cap causes
an initial vertical transducer settlement which should be accounted for when the

105
vertical displacements have to be evaluated. To circumvent this, the following simple
procedures were suggested:
(i) The loading head screw is gently turned to ensure good contact with the loading
cap.
(ii) The vertical transducer is installed and adjusted to zero reading.
(iii) After the setting of the vertical transducer, the head screw is turned counter
clockwise to set the desired gap.
(iv) The introduced gap is measured accurately by notice the readings of the vertical
displacement transducer which will be in negative sign that indicates upward
movement.
(v) Once the consolidation stage is started, the initial transducer settlement will be
counterbalanced by the negative reading of the transducer and the vertical
displacement readings will start from zero and going on in positive.
The above steps ensure that the piston of the pneumatic air cylinder has enough
space to move upward and downward throughout the test without restriction, since
the piston starts movement from a midpoint neither from the top end of the cylinder.
3.4.9.5. Testing procedure for unsaturated soil specimens
After preparing the soil specimens inside the shear box at predetermined water
contents as described in Sections 3.4.8.4 and 3.4.9.3, the specimens were tested in
accordance with clause 4 of BS 1377-7:1990. Unlike the saturated specimens,
unsaturated soil specimens were subjected to consolidation under the desired net
normal stress for a period of 2 hours only. This period was found to be satisfactory
for all unsaturated specimens tested, since longer period may alters the water content
of the tested specimens significantly. The specimens were then sheared at a strain
rate of 0.50 mm/min. This rate was adopted after some pilot tests had been carried
out at different strain rates. The adopted rate of shear displacement was fast enough
to keep the changes in matric suction during shearing process to a minimum and to
consider that the soil specimens were sheared under undrained conditions. The
assumption that there was no significant change in suction of the soil specimen
during the shearing stage may be a reasonable assumption because the shearing of
the specimen was completed over a short period (i.e., 28 minutes). Vanapalli et al.

106
(2000) used similar assumption for analysis of shear strength test results on a silty
soil. However, the dilation of specimen during shearing may cause an increase in
matric suction and vice versa the contraction of specimen may result in suction
decrease.
Like the shearing tests of saturated specimens, a total horizontal displacement of
14 mm was decided to be the end of travel of the shear box for the unsaturated
specimen tests. This value was found to be adequate to mobilize the maximum shear
stress. During the shearing process, the shearing force, the horizontal displacement,
the vertical deformation, and the elapsed time were recorded at regular intervals of
horizontal displacement of 0.20 mm and continued to a full travel of 14 mm. Once
the shearing process was completed, the net normal stress was released and the
specimen was extruded to measure its water content. Furthermore, after preparing
and air-drying the soil specimens inside the shear box, the water content of each
specimen was monitored before testing and after that by weighing the whole
specimen and the shear box. The changes in water contents of the specimens during
preparing and testing stages were found very small and could be neglected.
3.4.9.6. Calculations of unsaturated shear strength functions
Similar to the saturated tests, the mean value of the shear stress on the shearing
plane corresponding to each increment in lateral displacement was calculated by
dividing the measured value of the shear force by the corresponding corrected cross
sectional area of the shear box. Therefore, the shear stress versus horizontal
displacement curve was plotted for each test and the shear strength was defined as
the peak or maximum shear stress. For each test, a graph showing the vertical
deformation of the specimen against the horizontal displacement was plotted, and the
values of deformation and displacement corresponding to the peak shear stress were
defined. The void ratio of the specimen at failure, the volumetric water content, and
the degree of saturation can be calculated based on the initial condition of the
specimen (total volume, dry mass, particles density), the measured water content at
failure, and the vertical deformation at failure.
The matric suction values of the sheared soil specimens corresponding to
different values of water content were evaluated from the stress-dependent soil-water

107
characteristic curves (SD-SWCCs) data. The SD-SWCCs were found for specimens
identical to those used for shear strength tests. The SD-SWCCs were represented
mathematically by using Fredlund and Xing (1994)'s model. The reverse form of this
model, which describes the matric suction as a function to the gravimetric water
content, was incorporated with the shear strength date to describe the shear strength
as a function to matric suction. Fredlund and Xing (1994)'s reverse model can be
written as follows:
( [ (
)
]
3. 19
where ( is the specimen matric suction as a function to gravimetric water
content; is the gravimetric water content; is the saturated water content; and a,
n, and m are fitting parameters related to the SD-SWCC under consideration. The
character e is the base of the natural logarithm. However, the correction function
(ψ in Fredlund and Xing (1994)'s model was taken equal to one since the values of
matric suction were relatively low.
The contribution of matric suction to the shear strength, , was calculated for
each test as the peak shear stress at failure minus the saturated shear strength of that
specimen. The values of the saturated shear strength for different sand-gypsum
mixtures were measured and the values of the effective shear parameters( ) were
determined as stated in Section 3.4.8 .
As reviewed in Section 2.3.2, there are three main approaches to evaluate the
stress state and then the shear strength in unsaturated soils. These approaches are the
single stress-state variable approach proposed by Bishop (1959), the two stress-state
variable approach proposed by Fredlund and Morgenstern (1977), and the true
effective stress concept introduced by Lu and Likos (2006). Referring to these three
approaches and considering the values of the estimated matric suction (ψ and its
contribution to shear strength ( ), the internal friction angle related to matric suction
( ), the effective stress parameter (χ), the suction stress ( ), and the true effective
stress ( ) were calculated as follows:

108
ψ 3. 20
χ
′
3. 21
′
′ = - χ ψ 3. 22
′′
′ ′′ (
′
3. 23
3. 24
where is the bulk shear strength on failure plane at failure; ( is the net
normal stress; is the tensile strength of soil at saturation; and are the
saturated cohesion and friction angle, respectively.
Consequently, for each sand gypsum mixture, the following series of plots were
constructed:
(i) The failure envelopes in the plane of shear stress-net normal stress
corresponding to different water contents or different matric suctions.
(ii) The failure envelopes in the plane of shear stress-matric suction corresponding
to different levels of applied net normal stress.
(iii) The failure envelopes in the plane of shear stress-water content corresponding
to different levels of applied net normal stress.
(iv) The suction stress characteristic curves as a function to water content
corresponding to different levels of applied net normal stress.
The detailed results of the shear strength tests carried out on unsaturated specimens
and their discussion are presented in Chapter 8.

109
CHAPTER FOUR
4: MODIFIED DEVICE FOR MEASURING TWO STRESS
DEPENDENT-UNSATURATED HYDRAULIC
FUNCTIONS
4.1. Introduction
Water flow and retention in unsaturated soil zones is of fundamental importance
to analyse many engineering problems. This is primarily characterised through the
soil-water characteristic curve (SWCC) and the hydraulic conductivity function
(HCF). Among the state parameters that influence these two key functions is the
surcharge load. Thus, it is necessary to simulate the stress state of the field when the
hydraulic characteristics have to be determined for a certain soil in the laboratory.
The primary objective of this chapter is to introduce a newly modified device for
establishing the drying and the wetting stress-dependent soil-water characteristic
curves (SD-SWCCs) simultaneously with the stress dependent-hydraulic
conductivity functions (SD-HCFs), as well as, the scanning curves. This chapter also
presents the experimental programme which was carried out by using the newly
modified device. Laboratory tests were carried out on the silty clayey sand with
different gypsum additives to examine the effect of gypsum content on the hydraulic
characteristics under different loading conditions (different net normal stress levels
and different matric suctions). As a second objective of these tests was to
demonstrate the reliability and precision of the modified device in measuring the
main hydraulic functions of unsaturated soils.

110
4.2. The modified stress controllable pressure plate device
4.2.1. Background
There are different types of pressure plate devices having different features,
specifications, and arrangements. Among those that have some relevant features to
the newly developed device are: (1) Tempe pressure cells which are used to
determine the drying SWCC only, under zero net normal stress, over a range of
matric suction from 0 to 100 kPa (Fredlund and Rahardjo, 1993; Lu and Likos, 2004;
Yang et al., 2004; Soil Moisture Corp., 2008), (2) the volumetric pressure plate
extractor which can be applied to establish the SWCCs associated with both drying
and wetting processes in a range of matric suction from 0 to 200 kPa, without
applying net normal stress (Soilmoisture Equipment Corp., 2008; Fredlund and
Rahardjo, 1993; ASTM D 6836-02; Ng and Menzies, 2007), (3) the stress-
controllable volumetric pressure plate which was developed by Ng and Pang (2000)
to establish the stress-dependent soil-water characteristic curves (SD-SWCCs) in
both drying and wetting processes over a range of matric suction from 0 to 200 kPa,
and (4) Fredlund SWCC device that is used to measure the SD-SWCCs under both
drying and wetting processes in a range of matric suction from 0 to 1500 kPa (Padilla
et al., 2005).
The procedure adopted with the using of the above mentioned devices is to
measure the water contents of the soil specimen at different matric suctions by
monitoring the volume of expelled water/intake water from/into the soil specimen by
using some hysteresis attachments. As an exception of that are the Tempe cells
where the water content of the soil specimen is monitored periodically by weighing
the entire apparatus to find the amount of water mass lost due to pore water drainage.
4.2.2. Uses and features of the modified device
The newly modified device consists primarily from stress controllable pressure
plate cells connected to a pressurized air panel to apply the desired net normal stress
and matric suction values. The device can be used to measure conveniently and
efficiently the drying and the wetting hydraulic characteristic functions that include
the SD-SWCCs and SD-HCFs at various vertical stress levels under Ko condition.
Thus, the field overburden pressure can be simulated to some extent. The desired

111
vertical stress is applied pneumatically inside the cell without the need to a loading
frame machine, and this reduces greatly both the cost and the laboratory space
required. Furthermore, the use of an internal pneumatic system to apply the required
normal stress skips over the need of using O-rings around a loading shaft and the
problems associated with that, like friction and possible leakage of pressurized air.
Single soil specimen is used to obtain the drying and the wetting SD-SWCCs with
any number of data points. The volume of diffused air can be measured and removed
simply, quickly, and efficiently. A periodic determination of specimen water content
during the test is readily and very accurately determined with an accuracy of 0.01%
without dismantling the device during testing. The released or absorbed water from
the specimen is measured by weighing the overall cell and monitoring the differences
in consequent weights. Thus, there is no need to use volume indicator burettes to
monitor the inflow or outflow volumes of water. Consequently, there is no
evaporation problem from the retained water in the attached outflow/inflow system,
such as that usually associated with the use of volumetric pressure plates, especially
during long term tests.
The high accuracy with which water removal and uptake from or into the
specimen can be measured make the device suitable to measure the unsaturated
hydraulic conductivity function (HCF) of soils, in both drying and wetting paths,
under different levels of net normal stress by following the transient multistep
methods. The measurements of HCFs can be carried out in conjunction with the
determination of SWCCs. Furthermore, the device has the flexibility to be used also
to measure the matric suction of a soil specimen at certain water content by using
null type technique. Water level in a simple outlet tube is monitored to detect and
prevent water content change by varying the applied matric suction until approaching
the soil matric suction.
4.2.3. Design and construction details
The device set up of a number of identical modified pressure plate cells
connected to one air pressure panel. Thus, several soil specimens may be tested at the
same time within a small laboratory space. A photograph of the device experimental

112
setup is shown in Figure 4.1 and a photograph of disassembled cell is shown in
Figure 4.2.
Figure 4.1. A photograph of experimental setup of the modified device.
Figure 4.2. A photograph of disassembled modified cell.
Base plate
Pneumatic
compartment cap
Grooved spacers
Rubber diaphragm
Cell ring

113
The primary components of the modified cell are base plate with porous ceramic
disc, cell ring, dual grooved spacers, and pneumatic compartment cap. All these
components were machined from 7075 Aluminium alloy, that posses adequate
strength and light weight, except the cell ring which was machined from stainless
steel. The details of each of the primary components of the cell, the cell assemblage,
and the pressurized air panel are presented in the following subsections.
4.2.3.1. The base plate of the cell
The base plate has an outer diameter of 127 mm and an overall thickness of 40
mm as shown through the mechanical drawings presented in Figure 4.3. It contains a
recess of 10.9 mm in depth and a spiral grooved water reservoir in a circular area of
66.2 mm in diameter, see Figure 4.4.
Figure 4.3. Mechanical drawings of the base plate of the modified cell.
The spiral groove has a semi-circular section of 3 mm wide and 2 mm in depth.
A 5-bar ceramic disc, 66 mm in diameter and 11 mm in thickness, has been carefully
ground and fitted into the recess so that there is a minimum space for entrapment of
air. The fine space between the peripheral edge of the ceramic disc and the wall of
the recess was filled carefully by epoxy with an attention to avoid any air voids

114
which may be formed while placing the epoxy as such voids would weaken the bond.
The top surface of the ceramic disc was finished above the inner surrounded surface
of the base plate by 0.1 mm.
Figure 4.4. A photograph showing the base plate of the modified cell, (A) with the
ceramic disc, (B) before installing the ceramic disc.
The spiral water channel makes the flushing of air bubbles so efficient since the
flow of water is forced to move in one direction during flushing starting from the
edge of the spiral and ending at the centre of the spiral and vice versa. The spiral
design avoids the dead end water channels and this minimises the possibility of air
bubbles entrapment. This spiral grooves provide a channel for the outflow/inflow of
water from the extractor to two outlet tubes located on opposite sides of the base
plate, or vice versa.
4.2.3.2. The cell ring
The cell ring has been designed to be the cell body as well as the soil specimen
ring concurrently. It is firstly used as a part of a compaction mould to prepare the soil
specimen inside it by static compaction, and then it is brought with the specimen to
form the cell body. It has an inside diameter of 68 mm, wall thickness of 10 mm, and
a height of 30 mm, see Figures 4.2 and 4.6. The height of the ring was designed to
contain a soil specimen of 14 mm thickness and two grooved spacer discs of 8.5 mm
(A) Assembled base plate with ceramic disc (B) The spiral groove of the base plate

115
thickness each, so that the top surface of the spacers is finished above the edge of the
ring by 1 mm. The ring has a side air inlet fitting to provide the soil specimen with
the desired regulated air pressure. The base plate was designed in such a way that the
specimen ring fits snugly into a recess of 3 mm depth and 88 mm in diameter. The
specimen ring is sealed to the base plate by an "O" ring sits in a groove at the bottom
of the recess, and it is sealed to the top cap when assembled by a flat rubber
diaphragm that is primarily used for the purpose of applying the required normal
stress pneumatically. The seals assure a reliable pressure seal requiring only gentle
screwing of the clamping bolts.
In this design, the soil specimen covers the whole surface area of the ceramic
disc, i.e., there is no exposed area of ceramic disc in contact directly to the
pressurized air of the cell, which may have some effect on water phase continuity as
indicated recently by some researches such as Leong et al.(2011) and Power et al.
(2011). As well as, the soil specimen occupies the whole inside volume of the cell,
and then there is no need to additional attachments such as vapour saturator to
saturate the inflow air with the aim of preventing the soil from drying by
evaporation.
4.2.3.3. The dual grooved spacers
The dual grooved spacers have been designed to provide two important
functions. These functions are: to pass on and distribute the air pressure over the
whole specimen surface area; and to transmit the total normal pressure from the
pneumatic compartment to the soil specimen. These spacer discs were machined with
a diameter of 67.5 mm and a thickness of 8.5 mm as shown through the mechanical
drawings presented in Figure 4.5. They have rectangular section grooves of 3 x 3
mm, spaced on each other by 3 mm.
The spacers are placed above the soil specimen with the grooved surfaces face
each other to form together a grid of air flow channels. The air inlet was positioned
on the cell ring to be in front of the cross section of these channels. In such a way,
the pressurized air could enter from the side inlet, distributed through the air
channels, and percolated to the voids of the specimen through numerous openings (2

116
mm in diameter) dispersed on the bottom spacer which is in contact to the soil
specimen. An isometric assemblage of the cell component is shown in Figure 4.6.
Figure 4.5. The mechanical drawings of the grooved spacers used with the modified
stress controllable pressure plate cell.
Figure 4.6. Isometric assemblage of the basic components of the modified cell.
3.0
6.0 3.0 6.0
8.0 6.0
66.0
2.0

117
4.2.3.4. The pneumatic compartment cap
The pneumatic compartment cap was designed to serve as the top cap for the
pressure plate cell as well as to provide the desired normal pressure to the top of the
dual spacers. It consists of two parts, a cap containing a small air compartment and a
flexible rubber diaphragm. The outer diameter of the cap is 127 mm and the
thickness is 18 mm as shown through the mechanical drawings in Figure 4.7. It has
two concentric recesses of 3 mm depth each. The diameter of the outer recess is 88
mm while the inner one is 68 mm. The cap has an air inlet fitting in its centre to
supply the pressurized air to the inner compartment, and then the pressure transfers
through the flexible rubber diaphragm to the dual spacers, which in turn transfer the
pressure to the soil specimen.
Figure 4.7. Mechanical drawings of the pneumatic compartment cap of the modified
cell.
To ensure the acting of air pressure on the total area of the dual spacers and to
ensure also that there is no any resistance to the transmission of air pressure through
the rubber diaphragm, the dual spacers were designed to be finished above the edge
of the cell ring by one millimetre so that the rubber diaphragm is placed to be
concaved upward by one millimetre. A schematic section of assembled cell is shown
in Figure 4.8.
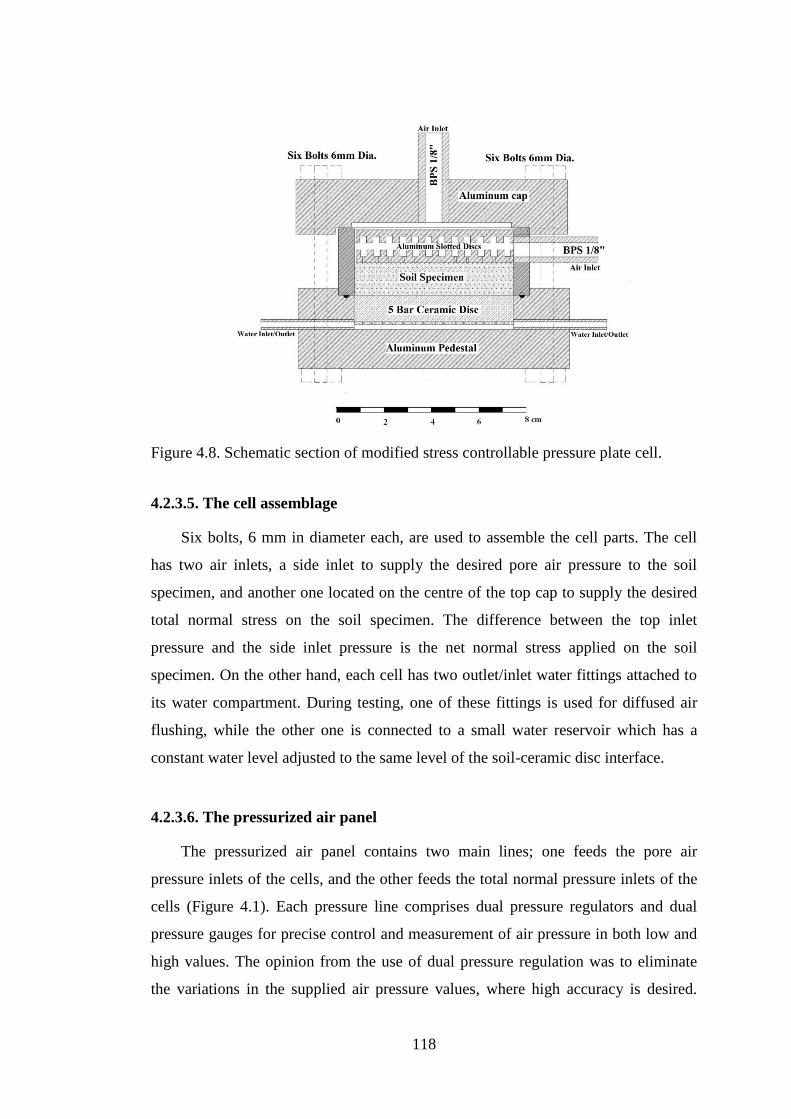
118
Figure 4.8. Schematic section of modified stress controllable pressure plate cell.
4.2.3.5. The cell assemblage
Six bolts, 6 mm in diameter each, are used to assemble the cell parts. The cell
has two air inlets, a side inlet to supply the desired pore air pressure to the soil
specimen, and another one located on the centre of the top cap to supply the desired
total normal stress on the soil specimen. The difference between the top inlet
pressure and the side inlet pressure is the net normal stress applied on the soil
specimen. On the other hand, each cell has two outlet/inlet water fittings attached to
its water compartment. During testing, one of these fittings is used for diffused air
flushing, while the other one is connected to a small water reservoir which has a
constant water level adjusted to the same level of the soil-ceramic disc interface.
4.2.3.6. The pressurized air panel
The pressurized air panel contains two main lines; one feeds the pore air
pressure inlets of the cells, and the other feeds the total normal pressure inlets of the
cells (Figure 4.1). Each pressure line comprises dual pressure regulators and dual
pressure gauges for precise control and measurement of air pressure in both low and
high values. The opinion from the use of dual pressure regulation was to eliminate
the variations in the supplied air pressure values, where high accuracy is desired.

119
This was achieved simply by using two regulators in series. The first regulator is set
at a fairly higher pressure than the second one in order to provide reasonably
constant pressure to the second regulator. Pressure from the second regulator in turn
could be very constant with source pressure variations greatly diminished. The
pressurized air is supplied to the device through a laboratory supply line which
delivers pressure up to 700 kPa. If higher air pressure is needed, a bottled nitrogen
gas may be used to apply pressures up to 1500 kPa.
For measuring air pressure values less than 10 kPa, a simple water manometer
was modified and connected in parallel with the pressure gauges for fine readings.
The manometer consists from a cell and a stand pipe fixed on gradual board for water
head measurements. The cell includes a base plate, water compartment, flexible
diaphragm, air compartment, and top cap. Figure 4.9 shows a photograph of
disassembled and assembled cell.
Figure 4.9. A photograph of disassembled and assembled manometer cell.
Stainless steel cylinders, 51 mm internal diameter and 46 mm height, were used
as water and air compartments. A funnel shape flexible diaphragm was used to
separate these compartments. The water compartment is sealed to the base plate by
means of "O" ring sits in a groove in the base plate. The base plate has an outlet
water fitting connected to the stand pipe. The air compartment is also sealed to the

120
top plate by an "O" ring. The top plate is connected to the air pressure manifold
through a plastic tube as shown in Figure 4.1.
4.2.4. Specimen preparation and testing procedures
4.2.4.1. Specimen compaction and saturation
The test procedure starts as with the other pressure plate methods, by preparing
the specimen inside the cell ring. The specimen is statically compacted to the
specified volume, predefined dry density, and predefined compaction water content
by using a compaction mould designed specially to be compatible with the newly
modified stress controllable pressure plate device.
The mechanical drawings of the compaction mould are presented in Figure 4.10.
The components of the compaction mould and their assembly are shown in Figure
4.11. A loading frame machine is used to apply the required static load with a
constant displacement rate of 0.2 mm/min.
Figure 4.10. The mechanical drawings of compaction mould compatible with
specimen ring of the modified device.

121
The cell ring containing the prepared specimen is placed subsequently on the top
of the saturated ceramic disc for saturation. The cell is assembled whereas one of the
water inlet tubes is attached to the water reservoir for water intake. The level of
water in the reservoir is adjusted to be at the same level of the soil-ceramic disc
interface. During the saturation process, the entire cell is weighed periodically until
reaches a constant weight at the completion of saturation. Before any weighing
process, all the inlet/outlet tubes of the cell are disconnected and the water level in
the stand pipes is adjusted to a certain level mark. This is usually done by adding
some drops of water to one of the stand pipes using a syringe.
Figure 4.11. A photograph showing; (a) the compaction mould components, (b) the
compaction setup.
4.2.4.2. Testing procedure for SD-SWCCs determination
After saturating the soil specimen, the desired normal stress ( ) is applied
pneumatically so that the pore water starts to drain under consolidation process and
the entire cell weight reduces until reaches a constant value at the end of
consolidation. Subsequently, the air pressure inside the cell ( is raised to apply the
desired increment of matric suction. Simultaneously, the normal stress should be
increased to keep the difference ( - ) constant, which is equal to the applied net
normal stress. When the equilibrium water content of the soil specimen is reached,
air bubbles below the ceramic plate is removed first and then the entire cell is
weighed to find the amount of water mass lost due to pore water drainage. The
equilibrium water content can be calculated by considering the saturated cell weight,

122
the prepared dry weight of soil specimen, and the entire weight of the cell at
equilibrium point. The weight process may then be repeated at successive water
content equilibrium points corresponding to successive increments of matric suction.
The differences in weight from one soil suction value to another are measured, and
then the corresponding water contents are calculated.
Upon completion of the drying process, the test can be continued with the
wetting process by successive decrements in matric suction, and this causes water to
flow back from the water reservoir to the soil specimen. At the end of the run after
the last equilibrium value has been established, the water content of the whole
specimen is determined gravimetrically. Depending on the final water content, water
contents corresponding to different equilibrium points can be back-calculated by
considering the changes in the entire weight readings between successive values of
matric suction reversibly.
The drying and the wetting SD-SWCCs can be constructed depending on the
equilibrium water content values calculated from the initial water content or final
water content. Slight differences between these two sets of water contents may be
found when there are some water drops condense on the spacers placed above the
soil specimen. This condensation usually makes values calculated from initial water
content seem greater than those calculated from final water content. To eliminate the
condensation on the inside cell parts, the test is conducted in a temperature-
controlled laboratory room.
4.2.4.3. Testing procedure for SD-HCF determination
The measuring of unsaturated hydraulic conductivity function can be carried out
simultaneously with the determination of the soil-water characteristic curve in both
the drying and the wetting processes under different applied net normal stress levels.
During the application of each increment in matric suction, the time-dependent
decrease in weight of the specimen is monitored, and then the accumulative outflow
volume of water from the specimen with time can be found. Similarly, during the
wetting process, the time-dependent increase in weight of the specimen during each
decrement in matric suction is monitored and, therefore, the accumulative inflow
volume of water with time is determined.

123
As introduced in Section 3.4.7, two of the transient outflow methods are suitable
to be applied in measuring the unsaturated SD-HCF by using the newly modified
stress controllable pressure plate device. These methods are the multistep method
(Gardner, 1956) and the one step method (Doering, 1965). The multistep method
needs periodic monitoring of the specimen weight throughout the whole matric
suction step. Time steps of 2, 4, 8, 24, 48, 96 hours, and the final reading at
equalization time were found to be appropriate for the tested specimens.
Doering's one step method was modified in this study to be applied in
successive increments, or decrements, in matric suction and considering each of
these increments as a one small step. In other words, a series of steps in matric
suction were applied instead of applying one large step throughout the whole test as
specified in the original method. Following this modified approach, only once the
weight of the specimen has to be taken during each matric suction increment, or
decrement, beside the final specimen weight at equalization. This reading was
suggested to be taken after 4 hours from the applying of suction increment or
decrement. This time was chosen to be at the second stage of the flow stages, i.e.,
when the soil permeability is controlling the flow, not the saturated permeability of
the ceramic plate, see Section 2.5.5.
Unlike the original Doering's one step approach, the use of one step method with
the above modification yields the soil-water characteristic curve simultaneously,
while in the original method the SWCC has to be determined independently.
Moreover, one of the disadvantages of the original one step method is the large initial
hydraulic gradient associated with applying one large step in matric suction. This
large gradient varies considerably throughout the test and may causes significant
changes in the state of stress of soil specimen during the test. This disadvantage is
avoided in the modified approach when series of small suction steps are applied
successively instead of one large step.
4.2.4.4. Diffused air removal
Unlike the standard and modified volumetric pressure plate devices, the remove
of air bubbles here is carried out in a very simple, swift, and efficient manner. A
syringe of de-aired water is injected from one of the outlet/inlet tubes, and this lets

124
water to circulate through the spiral groove beneath the ceramic disc, carries the air
bubbles in its advance, and seeps out from the other outlet tube toward the attached
water reservoir. The difference in weight of the entire cell before and after flushing
of air bubbles represents the weight of water that replaces the volume which is
occupied by air bubbles. Thus, the volume of diffused air through the ceramic disc
could be evaluated readily.
The simplicity and reliability of this flushing technique results from the fact that
the measurements of water content differences, at successive equilibrium points, are
related directly to the differences into the weight of water inside the soil specimen
not to the volume or weight of water in an outside measuring system. In other words,
in this device, the weight or volume of water in the water compartment and the stand
pipes is kept constant throughout the entire test. The water level in the stand pipes
has to be adjusted simply to a certain level mark at each weight reading. Thus, there
are no any constraints arise from the necessity to retain accurately and measure the
weight or volume of water expelled from the soil specimen during each increment in
matric suction or the returned water during each decrement in matric suction.
Moreover, there is no concern about the amount of evaporation from the outside
water system whatever the testing duration is, since that does not affect the water
content measurements. On the contrary, in all volumetric pressure plate devices, the
evaporation of water from the open ends of the burettes and the ballast tube
especially in long run tests affects significantly the determination of water content at
different equalization points if it is not estimated and taken into consideration.
4.3. Testing programme
The testing programme was undertaken primarily to study the effect of gypsum
content on the two key hydraulic characteristic functions, the soil-water characteristic
curve and the unsaturated hydraulic conductivity function of the sandy soil. These
two functions were studied during both drying and wetting processes under the
influence of different net normal stress levels by using the newly modified stress
controllable pressure plate device. The second objective was to use the SD-SWCCs
data in conjunction with the results of constant water content-direct shear tests which
were carried out on air-dried specimens. Thus, the matric suction values of the

125
unsaturated sheared specimens can be defined, and then the significant shear
parameters can be evaluated.
The third objective of the testing programme was to demonstrate the
repeatability and reliability of the newly modified device in measuring the SD-
SWCCs and the SD-HCFs during both drying and wetting processes. Thus, the
testing programme contains implicitly two parts, SD-SWCCs tests and SD-HCFs
tests. These two parts were carried out simultaneously on the same soil specimens,
under the same loading conditions.
4.3.1. SD-SWCCs tests
In total, fifty SWCCs were established for five sand-gypsum mixtures having 0,
20, 40, 65, and 80% gypsum content by weight. The drying and the wetting SWCCs
for each mixture were determined under five different net normal stress levels, which
were 0, 100, 200, 300, and 400 kPa. These values of net normal stress were taken to
be the same of those used in the direct shear tests. The increments of applied matric
suction were decided after the evaluation of different SWCCs parameters by using
the results of the conventional pressure plate. These parameters are the water content
and matric suction at the air-entry point and the residual point of the SWCCs. Matric
suction increments of 4, 10, 20, 50, 100, 200, and 400 kPa were found to be suitable
for all sand-gypsum mixtures tested. These matric suction steps were used with
different levels of net normal stress, except with 400 kPa net normal stress, the
maximum matric suction applied was 300 kPa since the maximum value of the air
pressure source was 700 kPa. A period of approximately one week for each suction
increment to reach equalization was found appropriate for all mixtures tested.
Five identical specimens from each sand-gypsum mixture were prepared by
statically compacting the soil at its optimum water content to reach 90% of its
maximum dry density determined from the standard compaction test. These
specimens were tested under five different net normal stress levels. The initial
conditions of the prepared specimens for different sand-gypsum mixtures are shown
in Table 4.1.

126
Table 4.1. Initial conditions for specimens statically compacted from different sand-
gypsum mixtures.
Term Values
Gypsum content % 0 20 40 65 80
Compaction water content % 9.8 9.4 9.4 11.6 14.6
Target dry density (Mg/m3) 1.809 1.812 1.775 1.660 1.506
Initial void ratio 0.47 0.43 0.42 0.47 0.59
4.3.2. SD-HCFs tests
The SD-HCFs tests were carried out simultaneously with the SD-SWCCs tests
on the same specimens under the same loading conditions. The unsaturated hydraulic
conductivity function was determined for each sand-gypsum mixture under four
different net normal stress levels (0, 100, 200, and 400 kPa), during both the drying
and the wetting processes. In total, forty SD-HCF tests were conducted on five sand-
gypsum mixtures.
4.4. Calculations
4.4.1. Calculations of SD-SWCCs
The gravimetric water content (w) at different equalization points was calculated
based on the total weight of the assembled cell (Wt) at equalization, the weight of
assembled saturated cell without soil specimen (Wo), and the dry weight of soil
specimen (Ws). The relationship is as follows:
(
4. 1
Furthermore, upon completion of test, the final water content of the specimen
was determined gravimetrically. Water content values at different equalization points
were back-calculated by considering the final water content in conjunction with the
incremental differences in the total weight of the cell. From these two sets of water
content data, the condensation of water vapour on the inside faces of the grooved
spacers was evaluated.

127
The volumetric water content ( at different equalization points was calculated
by considering the gravimetric water content (w), specific gravity (Gs), and the void
ratio of the specimen at successive equalization points (e) as follows:
4. 2
In general, the void ratio of soil specimen at different equalization points could
be evaluated by considering: (i) the initial void ratio of the specimen after saturation
and consolidation under the applied net normal stress, (ii) the decrease in void ratio
resulting from the drying process, and this can be evaluated from CLOD test results.
During the SD-SWCC tests of different sand-gypsum mixtures, it was noticed
that both the radial and vertical volume changes of the soil specimens due to the
application of matric suction steps were of negligible values. This behaviour can be
attributed to the reason that the initial void ratio of these specimens after
consolidation under the applied net normal stress levels was small enough that the
application of the matric suction steps could not decrease the void ratio noticeably.
Accordingly, the initial void ratio after consolidation was considered to be constant
under different applied matric suctions, for all sand-gypsum mixtures tested.
The initial void ratio of a statically compacted specimen may be calculated
using the mass-volume relationships. During specimen saturation some dilation to
the specimen is usually occurred, and the corresponding void ratio can be defined
based on the saturated water content of the specimen. After applying the desired net
normal stress, the void ratio decreases due to normal consolidation. This decrease
can be evaluated from the decreasing in the saturated water content which is
continuously monitored by taking the overall weight of the cell.
The results of SD-SWCCs in terms of gravimetric water content were
mathematically described by using Fredlund and Xing (1994)'s model, Equation 3.3.
Furthermore the matric suction was described as a function to the water content by
using the reversed form of Fredlund and Xing (1994)'s model as follows:

128
(
)
4.3
where is the matric suction, is the gravimetric water content at any soil
suction, is the saturated water content, e is the base of the natural logarithm,
whereas a, n, and m are fitting parameters related to the SD-SWCC under
consideration. The reversed form of the SD-SWCC was very useful when it has been
used in conjunction with the direct shear tests to describe many shear strength
functions.
4.4.2. Calculations of SD-HCFs
The transient outflow/inflow data of the SD-HCF tests were analysed by
following two different methods. These methods are the original multistep method
(Gardner, 1956) and the one step method (Doering, 1965). To establish the SD-HCF,
seven incremental matric steps were applied during the drying process and seven
decrements during the wetting process. The hydraulic conductivity (k) was calculated
for each suction increment or decrement to define one point on the SD-HCF under
consideration. The calculated hydraulic conductivity was considered to be
corresponding to the mean value of matric suction or water content over the applied
suction increment or decrement. The relationship between matric suction and water
content was assumed linear throughout small suction steps in both the multistep and
the one step methods (Gardner, 1956; Doering, 1965).
During each suction step, the time-dependent weight of the specimen was
monitored, and the corresponding gravimetric water contents were simply calculated
by using Equation 4.1. Then, the volumetric water contents were calculated by
applying Equation 4.2. Consequently, the specific moisture capacity (C), which is
defined as the change in volumetric water content relative to the change in matric
suction as a head (Lu and Likos, 2004), over the incremental suction step, was
calculated as follows:
C = ∆ /∆h 4. 4

129
The accumulative outflow/inflow volume of water from the specimen with time
was found from the incremental differences in total weight of the cell. Therefore,
Gardner's expression for cumulative outflow was applied as follows:
(
) (
) (
) 4. 5
where is the total volume of water accumulated for the applied suction increment
and is the outflow volume during a time t, D is the hydraulic diffusivity, and L is
the specimen thickness.
To calculate the hydraulic conductivity by following Gardner (1956)'s approach,
a linear relationship between ln (( and the elapsed time (t) was drawn.
According to Equation 4.5, the slope of this linear relationship is equal to (
. Therefore, the hydraulic diffusivity was determined and the hydraulic
conductivity was calculated by using the following expression:
4. 6
where is the specific moisture capacity over the incremental matric step and is
the hydraulic diffusivity. The calculated value was considered to be corresponding
to the average water content during the specified matric suction increment, or
corresponding to the mean matric suction of that increment, which was taken as
ψ + ψ where ψ
is the matric suction before the applying of suction
increment ψ.
Furthermore, the hydraulic conductivity was calculated by following Doering
(1965)'s approach. Only one reading of the weight of the specimen cell during the
suction step was used here. This value was taken usually after 3 to 5 hours from the
beginning of applying the incremental suction step. From this reading, the
gravimetric water content and then the volumetric water content were calculated by
using Equations 4.1 and 4.2. Therefore, the hydraulic diffusivity ( was calculated
by using Doering's solution as follows:
(
4. 7

130
where L is the thickness of the specimen, is the volumetric water content at time t,
is the volumetric water content at equilibrium, and ( is the change in
volumetric water content during the elapsed time t. After calculating the hydraulic
diffusivity, the hydraulic conductivity was calculated by using Equation 4.6. This
value was considered to be corresponding to the average water content during the
elapsed time.
To clarify and compare the calculation procedures for the above two approaches
a numerical example for an incremental suction step is presented below:
Numerical Example:
A series of SD-HCF tests were carried out on silty clayey sand has 40% gypsum
content. When the specimen was under 400 kPa net normal stress at Ko condition, the
applied matric suction was increased from 20 to 50 kPa and the time-dependent
weights of the specimen cell were taken. These readings and the basic data of the
tested specimen are listed below:
Elapsed time (days) 0.00 0.17 3.06 5.05 6.01
Overall weight of the cell (g) 2764.33 2763.86 2762.21 2761.88 2761.73
Basic data of the tested specimen Value
Specimen thickness at compaction, L (cm) 1.393
Specimen's ring diameter (cm) 6.810
Specimen's dry weight, Ws (g) 90.02
Assembled cell weight, Wo (g) 2660.71
Gypsum content (%) 40
Compacted dry density, dry (Mg/m3) 1.775
Void ratio of the compacted specimen, eo 0.42
Net normal stress (kPa) 400
Overall weight of the cell at saturation under applied net normal stress, Wt (g) 2764.39
It is required to calculate the hydraulic conductivity for this incremental suction step
by following the multistep and the one step methods.
Calculations:
Considering the overall weight of the cell at saturation under 400 kPa net normal
stress, the assembled cell weight, the dry weight of the specimen, and the specimen

131
specific gravity, the saturated water content of the specimen and the corresponding
void ratio are calculated to be 15.17% and 0.38, respectively. Therefore, by using the
volume mass relationships and considering the time-dependent weight, the following
parameters are calculated as shown:
Soil matric suction (kPa) 20 50
Elapsed time (days) 0.00 0.17 3.06 5.05 6.01
Gravimetric water content, w % 15.10 14.58 12.75 12.38 12.21
Volumetric water content, % 27.54 26.59 23.24 22.58 22.27
Outflow volume (cm3) 0.00 0.47 2.12 2.45 2.60
ln ((Vf-Vt)/Vf) -0.20 -1.69 -2.85
The specific moisture capacity (C) can be calculated by considering the
volumetric water contents and the corresponding matric suction heads at the
beginning and the end of the incremental step as follows:
=
(
= (
To find the hydraulic diffusivity by following Gardner (1956)'s approach, the
elapsed time versus ln ((Vf – Vt)/Vf) is plotted on Figure 4.12 and the line slope is
defined to be (-0.54). Therefore, the hydraulic diffusivity (D) could be calculated as
follows:
0.54 =
D = 0.54 4 1.3932/ = 0.43 cm
2/day
Accordingly, the hydraulic conductivity could be calculated as:
k = C . D = 1.7 10-4
0.43 = 7.25 10-5
cm/day = 8.39 10-12
m/sec.
This value of hydraulic conductivity is corresponding to the average values of
water content of ((15.10+12.21)/2= 13.66 %) and average value of matric suction of
((20+50)/2 = 35 kPa) over the suction step.

132
Figure 4.12. Elapsed time versus ln ((Vf-Vt)/Vf) for calculating the hydraulic
diffusivity according to Gardner (1956)'s approach.
Following Doering (1965)'s approach, the hydraulic diffusivity could be
calculated as follows:
(
(
(
( /day
and then the hydraulic conductivity is:
k = C. D = = 1.64 10-4
cm/day = 1.9 10-11
m/sec.
This value of hydraulic conductivity is corresponding to the average values of water
content and matric suction over the period between elapsed time 0 and 0.17 day. The
matric suction at the elapsed time 0.17 can be calculated by interpolation as follows:
ψ
( (
(
The average values of water content and matric suction corresponding to (k =1.9
10-11
m/sec) are (15.10+14.58)/2 = 14.84 %) and (20+25.4)/2 = 22.7 kPa),
respectively.
4.5. Summary
The design and construction details of a modified stress controllable pressure
plate device are presented in this chapter. The device is used to determine
R² = 0.9988
-4.0
-3.5
-3.0
-2.5
-2.0
-1.5
-1.0
-0.5
0.0
0.0 2.0 4.0 6.0 8.0
ln (
(Vf-
Vt)
/Vf)
Elapsed time, t (days)
[ln ((Vf - Vt)/Vf)] = - 0.5411 t - 0.0881

133
conveniently and efficiently two important stress dependent-hydraulic characteristic
functions during both drying and wetting processes. These functions are the stress-
dependent soil-water characteristic curve (SD-SWCC) and the stress dependent-
unsaturated hydraulic conductivity function (SD-HCF). The device has the flexibility
to be used also to measure the matric suction for a given soil specimen by applying
the null type technique. Several improvements have been done in the design of this
device. Among these are:
(1) The desired normal stress is applied pneumatically inside the cell without the
need to a loading frame machine, and this reduces greatly both the cost and the
laboratory space required.
(2) The changes in the water content of the soil specimen corresponding to
successive increments/decrements in the applied matric suction are monitored
continuously by weighing precisely the whole cell without dismantling it during
testing. Therefore, there is no need to an external measuring system to monitor the
inflow or outflow into or from the specimen, and consequently there is no
evaporation problem during long term tests.
(3) The volume of diffused air could be measured and removed simply, quickly, and
efficiently. This feature results from the use of spiral groove below the ceramic disc
which forces the water to move in one direction, and this minimises the possibility of
air bubbles entrapment. Furthermore, there is no any necessity to retain accurately
and measure the volume of expelled or intake water in the outside water system, and
this greatly simplify the flushing process.
An extensive experimental programme was designed and implemented by using
the newly modified device. The SD-SWCCs and the SD-HCFs for five sand-gypsum
mixtures were established at five different net normal stress levels in both the drying
and the wetting processes. The testing procedures and tests calculations are presented
in this chapter. The detailed results and discussion of these tests are presented in
Chapters 6 and 7.

134
CHAPTER FIVE
5: RESULTS AND DISCUSSION OF BASIC TESTS
5.1. Introduction
In this chapter, the test results for standard compaction tests, one-dimensional
consolidation tests, shrinkage characteristics (CLOD) tests, and three series of
standard soil-water characteristic curve tests are presented. Laboratory tests were
carried out on several sand-gypsum mixtures using statically compacted specimens
prepared at the optimum water content to 90% of the maximum dry density obtained
from the standard compaction tests. The first objective of these tests was to study the
effect of gypsum content on some basic characteristics of the sandy soil by following
standard approaches. The second objective was to prepare a database that includes
the water retention characteristics and the volume change characteristics of several
sand-gypsum mixtures. The prepared database was intended to be used in evaluating
and comparing the hydraulic test results obtained from the modified stress
controllable pressure plate device.
5.2. Effect of gypsum content on compaction characteristics
Eight sand-gypsum mixtures were tested using standard Proctor effort to
evaluate the effect of gypsum content on the compaction characteristics of the soil
used in this investigation. These mixtures had 0, 10, 20, 30, 40, 50, 65, and 80%
gypsum content by weight. The compaction test results for the tested mixtures are
shown in Figure 5.1. The values of optimum water content and the corresponding
maximum dry density, minimum void ratio, minimum porosity, and the degree of
saturation are presented in Table 5.1 for these eight mixtures.

135
Figure 5.1. Standard compaction curves for different sand-gypsum mixtures.
Table 5.1. Compaction characteristics of the sandy soil with different gypsum
additives (standard Proctor tests).
Gypsum content (%) 0 10 20 30 40 50 65 80
Max. dry density (Mg/m3) 2.01
0
2.01
8
2.01
3
2.00
2
1.95
3
1.89
9
1.83
0
1.68
5 Optimum water content (%) 9.8 9.6 9.4 9.3 10.5 11.1 11.9 14.6
Specific gravity, Gs 2.65 2.62 2.59 2.55 2.52 2.49 2.44 2.39
Minimum void ratio, e 0.32 0.30 0.28 0.28 0.29 0.31 0.33 0.42
Minimum porosity, n (%) 24 23 22 22 23 24 25 30
Degree of saturation, S (%) 82 85 85 86 91 89 87 83
The test results presented in Figure 5.1 and Table 5.1 show that at low gypsum
contents (i.e., gypsum content ranging from zero to about 30% by weight) the
changes in the compaction parameters are insignificant. The effects of gypsum
content on the maximum dry density and on the optimum water content are presented
in Figure 5.2. It can be noticed from Figure 5.2 that there is a slight increase in the
maximum dry density associated with a slight decrease in the optimum water content
when gypsum content increases up to 15%. On the contrary, when gypsum content
increases more than 30%, the maximum dry density starts to decrease noticeably
associated with a clear increase in the optimum water content.
1.500
1.600
1.700
1.800
1.900
2.000
2.100
4 6 8 10 12 14 16 18 20
Dry
den
sity
Mg/m
3
Water content (%)
Zero Gypsum
10% Gypsum
20% Gypsum
30% Gypsum
40% Gypsum
50% Gypsum
65% Gypsum
80% Gypsum
Sat. L. 0% Gy.
Sat. L. 10% Gy.
Sat. L. 20% Gy.
Sat. L. 30% Gy.
Sat. L. 40% Gy.
Sat. L. 50% Gy.
Sat. L. 65% Gy.
Sat. L. 80% Gy.
Exp
erim
enta
l d
ata
po
ints

136
Similar trends have been reported by Kattab (1986) on silty gypsiferous soils
and Al-Dilaimy (1989) on clayey gypsiferous soils, but the defined percentage of
gypsum that results with an improvement in compaction characteristics was 5% in
Al-Dilaimy's results and 15% in Kattab's results. This difference between Al-
Dilaimy's and Kattab's results can be attributed to the difference in the pore size
distribution of the silty soil from that of the clayey soil.
Figure 5.2. Maximum dry density and optimum water content for the soil with
different percentages of gypsum.
The effect of gypsum content on compaction characteristics can be explained by
visualizing the roles of gypsum in the soil matrix. Two influencing factors associated
with the presence of gypsum have to be considered here. The first factor is the role
of gypsum particles as a filling material to the intergranular voids of the soil matrix.
This is due to the fineness of gypsum particles as described through its particle size
distribution curve presented in Figure 3.1. An addition of gypsum to the sandy soil
leads to improve the gradation curve of the mixture in such a manner that allows the
particles to pack more closely, resulting in an increase in the maximum dry density.
Furthermore, gypsum is considered susceptible to crushing during compaction, since
gypsum particles are soft crystals (Section 2.2.1), and accordingly there is a
possibility for gypsum to fill different void shapes. The second factor is the decrease
in the overall specific gravity of the soil mixture associated with the increase in
gypsum content, since the specific gravity of the sandy soil used is 2.65 while it is
2.33 for gypsum.
8
9
10
11
12
13
14
15
16
1.3
1.4
1.5
1.6
1.7
1.8
1.9
2
2.1
0 10 20 30 40 50 60 70 80 90 100
Opti
mu
m w
ater
co
nte
nt (%
)
Max
. d
ry d
ensi
ty (
Mg/m
3)
Gypsum content (%)
Max.dry density
Optimum moisture content
Experimental data points
Best-fitted curves

137
At low gypsum percentages (0 - 30%), the predomination was for the first factor
(gypsum served as a filling material) which caused the dry density to increase with
increasing gypsum content. However, further increase in gypsum content, exceeding
about 30%, the second factor (effect of specific gravity) became dominant which in
turn caused a clear decrease in the maximum dry density. Correspondingly, the
optimum water content showed remarkable increase with increasing gypsum content.
This increase can be attributed in part to the need to release the excess in capillary
tension arises from the increasing of gypsum content. For particular water content,
the capillary forces are expected to increase with increasing gypsum content, and this
can be verified from comparing the soil-water characteristic curves of different sand-
gypsum mixtures.
The main purpose of soil compaction is to pack more closely the soil particles
and then reduces the air voids in order to improve the engineering properties of the
soil under consideration. Thus, to circumvent over the variation in the specific
gravity of the sand-gypsum mixtures with varying gypsum content, the standard
compaction curves can be expressed here in terms of void ratio instead of dry
density, as presented in Figure 5.3. In this representation the minimum void ratio is
the analogue to the maximum dry density.
It can be noticed from Figure 5.3 that there is a clear decrease in minimum void
ratio and a slight decrease in optimum water content associated with increasing
gypsum content up to 30% by weight. This trend is attributed to the role of gypsum
in filling the voids between sand particles. However, further increase in gypsum
content, exceeding about 30%, causes gypsum particles to begin separate adjacent
sand particles, resulting in an increase in the minimum void ratio. This behaviour can
be attributed to the fact that at a certain packing array, uniform fine particles like
gypsum have void ratio greater than a coarser graded particles like the sandy soil
used.
The minimum void ratio, minimum porosity, and the degree of saturation
corresponding to the maximum compaction for different sand-gypsum mixtures are
presented in Figure 5.4. This figure shows that the greatest compaction (min void
ratio or min porosity) results at 30% gypsum content, not 15% as it is corresponding
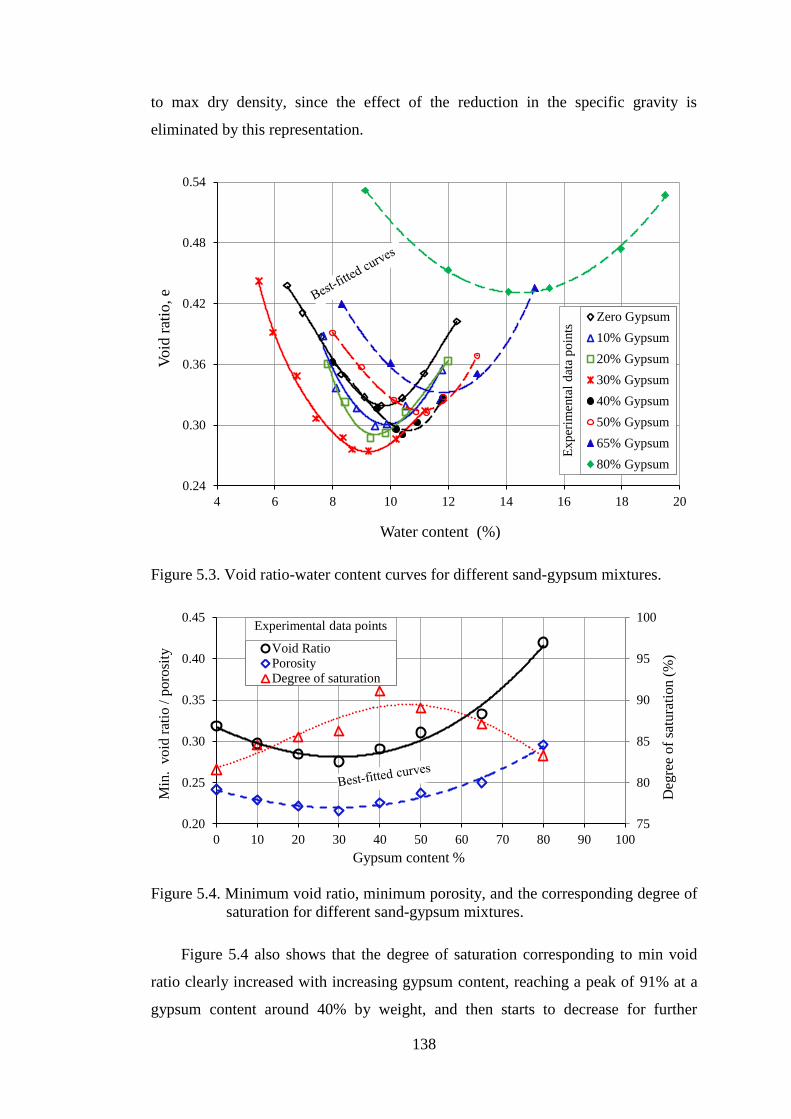
138
to max dry density, since the effect of the reduction in the specific gravity is
eliminated by this representation.
Figure 5.3. Void ratio-water content curves for different sand-gypsum mixtures.
Figure 5.4. Minimum void ratio, minimum porosity, and the corresponding degree of
saturation for different sand-gypsum mixtures.
Figure 5.4 also shows that the degree of saturation corresponding to min void
ratio clearly increased with increasing gypsum content, reaching a peak of 91% at a
gypsum content around 40% by weight, and then starts to decrease for further
0.24
0.30
0.36
0.42
0.48
0.54
4 6 8 10 12 14 16 18 20
Void
rat
io, e
Water content (%)
Zero Gypsum
10% Gypsum
20% Gypsum
30% Gypsum
40% Gypsum
50% Gypsum
65% Gypsum
80% Gypsum
Exp
erim
enta
l d
ata
po
ints
75
80
85
90
95
100
0.20
0.25
0.30
0.35
0.40
0.45
0 10 20 30 40 50 60 70 80 90 100
Deg
ree
of
satu
rati
on
(%
)
Min
. v
oid
rat
io /
poro
sity
Gypsum content %
Void RatioPorosityDegree of saturation
Experimental data points

139
increase in gypsum content. Thus, a minimum percentage of air voids of 9% is
achieved at 40% gypsum, where the void ratio is 0.29, and the water content is
11.1% as shown in Table 5.1. This trend can be explained by taking into
consideration that during compaction process there is an expulsion of air without
significant change in the amount of water in the soil mass. Thus, the degree of
saturation seems to be increased with increasing compaction.
Furthermore, a close inspection of the compaction curves in Figure 5.1 or in
Figure 5.3 reveals that the degree of curvature decreases remarkably with increasing
gypsum content. Soils having low gypsum contents react sharply to slight changes in
water content, producing sizable changes in dry density, whereas high gypsum
content soil specimens seem having smooth changes in dry density with water
content variations.
5.3. Effect of gypsum content on compressibility characteristics
A series of oedometer tests were carried out to investigate the effect of gypsum
content on one-dimensional compressibility parameters such as the compression
index (Cc) and the rebound index (Cr) of the sandy soil. Five sand-gypsum mixtures
were tested having gypsum contents of 0, 20, 40, 65, and 80% by weight. The initial
conditions of the prepared specimens were the same as those prepared for the other
tests. The soil specimens were prepared by static compaction to achieve 90% of the
maximum dry density obtained from standard compaction tests.
For each sand-gypsum mixture, the compression curve, which defines the void
ratio (e) as a function to the logarithm of applied effective stress (log '), was
obtained from oedometer tests during the loading course. Accordingly the
compression index (Cc) corresponding to each increment of the applied effective
stress was calculated as described in Section 3.4.2. Similarly, the rebound curve (e-
log ' relationship) was obtained during the unloading course for each sand-gypsum
mixture, and then the rebound index (Cr) was calculated for each decrement in the
applied effective stress.
The compression and rebound curves for the sandy soil with different gypsum
additives are presented in Figure 5.5. It can be noticed from Figure 5.5 that with

140
increasing gypsum content, the compression and rebound curves move upward with
higher initial void ratio (eo). The initial void ratios after saturation stage are 0.39,
0.46, 0.50, 0.52, and 0.62 corresponding to 0, 20, 40, 65, and 80% gypsum content,
respectively.
Figure 5.5. Loading and unloading void ratio-log effective stress curves for different
sand-gypsum mixtures.
The difference between the compression and the rebound curves exhibits a clear
increase with increasing gypsum content. This behaviour can be explained via a
purely mechanical approach, where the rebound represents the elastic part of
compression and the difference between the compression and rebound curves is the
inelastic part resulting from grain slippage and breakage. Gypsum particles are soft
crystal with a hardness, on Mohs scale, rating of 2 (Blyth, 1971). Accordingly, with
increasing gypsum content, the slippage of particles is anticipated to be easier and
the breakage is more. Thus, the increasing in distance between the compression and
the rebound curves (the plastic deformation) associated with increasing gypsum
content can be explained by considering the properties of gypsum.
The compressibility parameters, Cc and Cr, for different sand-gypsum mixtures
are presented against the mean effective stress of each applied increment or
0.28
0.32
0.36
0.40
0.44
0.48
0.52
0.56
0.60
0.64
1 10 100 1000
Void
rat
io, e
Effective stress, kPa
80% Gypsum
65% Gypsum
40% Gypsum
20% Gypsum
0% Gypsum
Bes
t-fi
tted
cu
rves
Experimental
data points
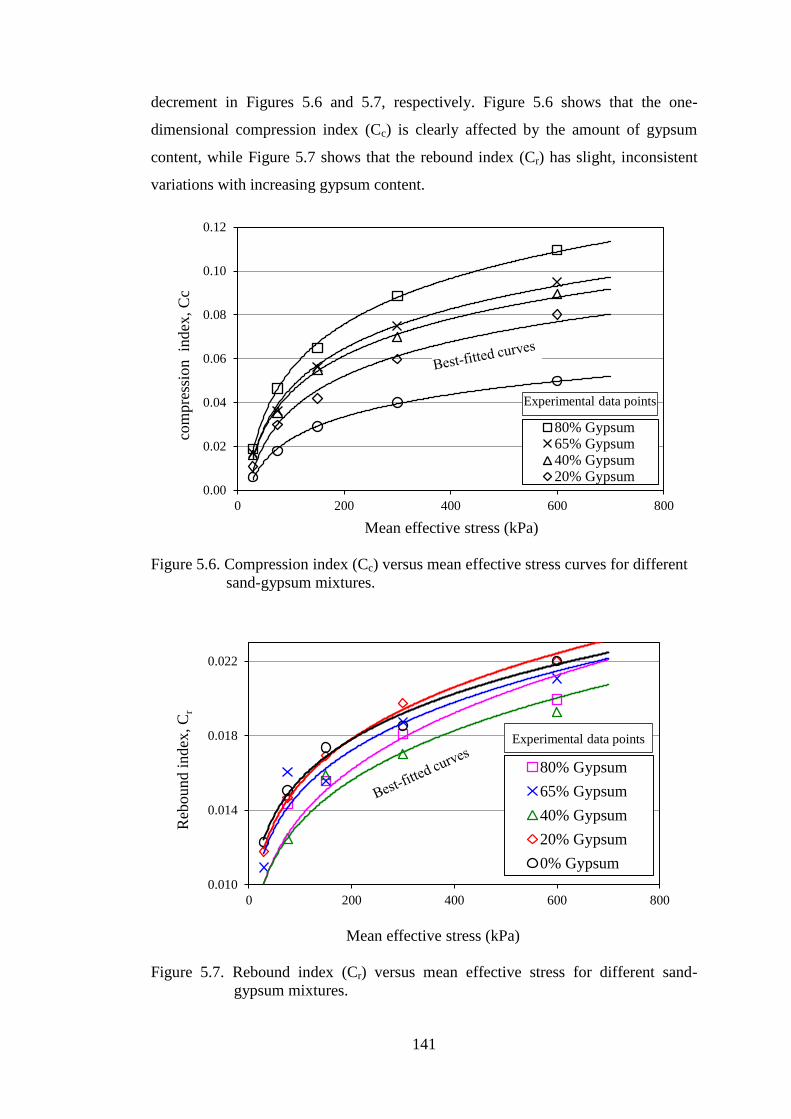
141
decrement in Figures 5.6 and 5.7, respectively. Figure 5.6 shows that the one-
dimensional compression index (Cc) is clearly affected by the amount of gypsum
content, while Figure 5.7 shows that the rebound index (Cr) has slight, inconsistent
variations with increasing gypsum content.
Figure 5.6. Compression index (Cc) versus mean effective stress curves for different
sand-gypsum mixtures.
Figure 5.7. Rebound index (Cr) versus mean effective stress for different sand-
gypsum mixtures.
0.00
0.02
0.04
0.06
0.08
0.10
0.12
0 200 400 600 800
com
pre
ssio
n in
dex
, C
c
Mean effective stress (kPa)
80% Gypsum65% Gypsum40% Gypsum20% Gypsum
Experimental data points
0.010
0.014
0.018
0.022
0 200 400 600 800
Reb
ound i
ndex
, C
r
Mean effective stress (kPa)
80% Gypsum
65% Gypsum
40% Gypsum
20% Gypsum
0% Gypsum
Experimental data points

142
Figure 5.6 shows also that there is a remarkable increase in compression index
with increasing the level of applied effective stress, and this trend is consistent for
different sand-gypsum mixtures. This behaviour can be attributed to the effect of the
static load used during compaction of the specimens which is analogous to the
influence of preconsolidation pressure in undisturbed specimens. In other words, at
low levels of the applied effective stress, the compression index is affected by the
previous compaction pressure, whereas at higher effective stress levels, the process is
likely to be virgin compression and the compression curve will principally be straight
line.
The compression index is defined practically as the slope of the linear portion of
the e- log ' curve. Referring to Figure 5.5, the linear portion of the plotted
compression curves is mostly started at effective stress greater than 200 kPa. For
comparison, the Cc values corresponding to effective stress increment between 400 to
800 kPa were considered in this investigation.
It is obvious from Figure 5.6 that the compression index increases noticeably
with increasing gypsum content. For a mean effective stress of 600 kPa, Cc varies
from 0.050 to 0.110 corresponding to 0 and 80% gypsum contents, respectively. This
behaviour may be referred in part to the increase in the void ratio with increasing
gypsum content, and that is reflected directly on increasing the compression index.
Within the framework of this study, a linear relationship between Cc and eo is
noticed. Figure 5.8 shows a plot between eo and Cc based on the test results of
different sand-gypsum mixtures. Two sets of Cc values are represented; the first set is
corresponding to effective stress increment from 400 to 800 kPa, while the second
set is corresponding to effective stress increment from 200 to 400 kPa. It is possible
to say that a linear relationship exists between eo and Cc, despite some slight
scattering. The obtained relationships are: {Cc = 0.25eo - 0.04} and {Cc = 0.21eo -
0.04} for the first and the second set, respectively. These relationships are agreed to
some degree to those found by (i) Azzouz et al. (1976) which was {Cc = 0.4eo - 0.01}
for all natural soils, (ii) Hough (1957) which was {Cc = 0.3eo - 0.08} for silty clays,
and (iii) Sowers (1970) which was {Cc = 0.75eo - 0.37} for very low plasticity soils.

143
Furthermore, an attempt was done to correlate the values of Cc with other soil
parameters such as the initial dry density or the consistency limits, but the obtained
statistical indices were less than that obtained from Cc - eo relationships.
Figure 5.8. Compression index vs. initial void ratio for different sand-gypsum
mixtures.
5.4. Soil-water characteristics
Two series of tests were carried out to establish the soil-water characteristic
curve for six sand-gypsum mixtures by using the commercial pressure plate
equipment (see Section 3.4.3). Two possible approaches according to the ASTM D
6836-02 were followed. In the first series, the same soil specimens were used under
different applied suction increments, whereas, in the second series, separate
specimens were used for each suction increment. The second approach allowed
measuring the volume changes of the specimens under different applied suction
increments by using the wax method (ASTM D 4943-08). The main objective of
these tests was to study the effect of gypsum content on soil-water retention
characteristics of the sandy soil. The second objective was to form a base through
which the reliability and accuracy of the modified stress controllable pressure plate
device could be compared and evaluated.
Cc = 0.25eo - 0.04
R² = 0.92 Cc = 0.21eo - 0.04
R² = 0.95
0.00
0.02
0.04
0.06
0.08
0.10
0.12
0.3 0.4 0.5 0.6 0.7
Com
pre
ssio
n i
ndex
(C
c)
Initial void ratio (eo)
400 - 800 kPa Stress increment
200 - 400 kPa Stress increment
Experimental data points

144
5.4.1. Same specimen approach-SWCC tests
The SWCCs for various sand-gypsum mixtures established by following the
same specimen approach are presented in Figure 5.9. These curves were best-fitted
by using the mathematical model suggested by Fredlund and Xing (1994), Equation
3.3. The fitting parameters and the corresponding statistical indices are listed in
Appendix A, Table A.1.
Figure 5.9. SWCCs of different sand-gypsum mixtures carried out by using
commercial pressure plate according to ASTM D 6836-02 (same
specimen approach).
A noticeable scattering of the experimental test data around the best-fitted
curves can be shown in Figure 5.9. Furthermore, comparing with a typical S-shape
SWCC, the three desaturation zones which are the boundary effect zone, the
transition zone, and the residual zone cannot be identified clearly from these tests.
Thus, the essential points describing the SWCC, the air-entry point and the residual
5
10
15
20
25
1 10 100 1000
Gra
vim
etri
c w
ater
co
nte
nt
(%)
Matric suction (kPa)
0% Gypsum
10% Gypsum
20% Gypsum
30% Gypsum
40% Gypsum
50% Gypsum
0% Gyp
10% Gyp
20% Gyp
30% Gyp
40% Gyp
50% Gyp
Exper
imen
tal
dat
a p
oin
ts
Bes
t-fi
tted
curv
es

145
point, are not distinguished with enough precision. In spite of that, it can be noticed
from Figure 5.9 that there is a clear increase in the saturated water content with
increasing gypsum content. The saturated water content increases from 15.2 % for
the sandy soil without gypsum to 26.5% for the sandy soil with 50% gypsum content.
This trend can be attributed to the increase of the initial void ratio with increasing
gypsum content. Furthermore, a general tendency of the SWCCs shown in Figure 5.9
to become higher with increasing gypsum content may be noticed, specifically for
matric suction values greater than the residual values.
In these tests, each soil specimen was used throughout the entire test and
subjected to different suction increments to find the SWCC. Thus, the uncertainty in
these test results arises from the concerns of the possibility of re-establishing
hydraulic contact between the soil specimen and the ceramic disc after the applying
of matric suction and the corresponding dryness of the specimen (ASTM D 6836-
02). For that reason, it is recommended to use separate specimen for each suction
increment.
5.4.2. Separate specimens approach-SWCC tests
In these tests, duplicated specimens were used for each suction increment as
described in Section 3.4.3.3. The soil-water characteristic curves of this test series
are presented in Figure 5.10. The test data were best-fitted using Fredlund and Xing
(1994)'s model as for the SWCCs presented in the previous subsection. The fitting
parameters and the statistical indices of SWCC of different sand-gypsum mixtures
are listed in Table 5.2.
The test results presented in Figure 5.10 demonstrate the possibility of getting
the same results with very slight differences when testing identical specimens. As a
comparison with the test results of the first series, Figure 5.10 shows that the results
of this series are more consistent, less scattered, closer to the typical S-shape trend,
the three desaturation parts on each of the SWCCs are more distinguishable, and then
the locating of the air-entry point and the residual point can be done in more
reliability.

146
Figure 5.10. The drying SWCCs of different sand-gypsum mixtures carried out by
using commercial pressure plate according to ASTM D 6836-02
(separate specimen approach).
Table 5.2. Fittings parameters and statistical indices of SWCCs of different sand-
gypsum mixtures, carried out via commercial pressure plate by using
separate approach.
Gypsum
content
(%)
Fitting parameters Saturated
water
content,
Ws (%)
R2
a n m 0 4.6428 1.5926 0.2275 13.5 0.9956
10 10.2063 1.1169 0.4155 13.6 0.9913
20 10.8349 1.4665 0.4719 15.3 0.9994
30 22.0820 1.3164 0.7959 18.7 0.9945
40 50.9847 1.0960 1.8134 23.2 0.9989
50 43.4977 1.3318 1.1989 24.5 0.9929
5.4.3. Effect of gypsum content on SWCC parameters
Figure 5.10 reveals clearly that with increasing gypsum content, the saturated
water content becomes greater, the air-entry and residual suctions show an increase,
while the residual water content exhibits moderate decrease. This behaviour can be
5
10
15
20
25
1 10 100
Gra
vim
etri
c w
ater
conte
nt
(%)
Matric suction (kPa)
0% Gypsum (1)
0% Gypsum (2)
10% Gypsum (1)
10%Gypsum (2)
20% Gypsum (1)
20% Gypsum (2)
30% Gypsum (1)
30% Gypsum (2)
40% Gypsum (1)
40% Gypsum (2)
50% Gypsum (1)
50% Gypsum (2)
0% Gyp.
10% Gyp.
20% Gyp.
30% Gyp.
40% Gyp.
50% Gyp.
Ex
per
imen
tal
dat
a p
oin
ts
Bes
t-fi
tted
cu
rves

147
attributed to the effect of gypsum content on the grain-size distribution and then on
the pore size distribution of these specimens. To evaluate quantitatively the effect of
gypsum content on the water retention characteristics, the SWCC parameters were
defined by using Vanapalli et al. (1994)'s graphical approach as described in Section
2.4.7. The air-entry suction ( ψ , air-entry gravimetric water content ( , residual
suction (ψ , and the residual gravimetric water content ( of SWCC for different
sand-gypsum mixtures are presented in Table 5.3.
Basically, the difference between residual water content and air-entry water
content for a specific soil defines the water holding capacity (WHC) for that soil. The
slope of the SWCC in the transition zone can be defined as [WHC/(log ψr – log ψa)].
The values of WHC and the corresponding SWCC slope values for different sand-
gypsum mixtures are calculated and presented also in Table 5.3.
Table 5.3. SWCC parameters for different sand-gypsum mixtures.
Gypsum
content (%) ψ a (kPa) wa (%) ψ r (kPa) wr (%)
WHC
(%)
SWCC
slope
0 10.0 11.8 72 9.5 2.3 0.03
10 10.0 12.0 120 8.3 3.7 0.03
20 11.0 13.6 150 7.6 6.0 0.05
30 12.0 17.0 180 7.0 10.0 0.09
40 14 20.7 210 6.5 14.2 0.12
50 18 22.8 300 7 15.8 0.13
The values of air-entry suction presented in Table 5.3 show slight increases with
increasing gypsum content. These values can be closely related to the values of
parameter "a" in Fredlund and Xing (1994)'s model as reported by Yang et al.
(2004). As such, the values of the measured air-entry suction are supposed to be
slightly smaller than the corresponding values of "a" parameter. Comparing the air-
entry values with the corresponding "a" values in Table 5.2 reveals some
inconsistency to a certain degree. Moreover, results of the SWCC tests implemented
by using the modified stress controllable pressure plate device, which are presented

148
in Chapter 6, demonstrate that the air-entry values, ψa, presented in Table 5.3 are
under estimated.
The water holding capacity seems to be greatly affected by the amount of
gypsum content as revealed in Table 5.3. It varies from 2.3% for the sandy soil
without gypsum to 15.8% for sandy soil having 50% gypsum content. This behaviour
makes gypsum as an improvement material to the hydraulic characteristics of sandy
soil for agricultural purposes. On the other hand, it was noticed from the
implemented tests that the time required to reach suction equalization, at any suction
level, was remarkably increased with increasing gypsum content. This behaviour
could results from the increasing in water holding capacity and consequently the
relatively large amount of water which has to leave the specimen before reaching
hydraulic equilibrium.
Table 5.3 also reveals that the slope of SWCC clearly increases with increasing
gypsum content in the soil mixture. These slope values seem to be consistent with the
corresponding uniformity coefficient values of these sand-gypsum mixtures which
are shown early in Table 3.1. Uniform soils that have relatively low uniformity
coefficient have relatively uniform pore-size and then relatively steep SWCC slope.
Thus, the values of SWCC slope are 0.03, 0.03, 0.05, 0.09, 0.12, 0.13 which are
corresponding to 114, 87, 70, 30, 18, 7 uniformity coefficient values (Table 3.1),
respectively.
5.4.4. Matric suction-volumetric water content relationships
As mentioned in Section 3.4.3, in the second series of SWCC tests, separate
specimens were used for each suction increment. Thus, when the equalization for
each suction increment was reached, the specimens were removed from the pressure
plate, weighed for determining the gravimetric water contents, and then waxed as
soon as possible for volume determination. By using the volume-mass relationships,
the volumetric water contents corresponding to different suction increments were
calculated. The SWCCs in terms of volumetric water content for different sand-
gypsum mixtures are presented in Figure 5.11.

149
Figure 5.11. Matric suction-volumetric water content curves of different sand-
gypsum mixtures found from the pressure plate tests on separate
specimens by using the wax method.
5.4.5. Applied suction and volume change
The volume of each soil specimen corresponding to different applied suctions
was determined using the wax method (ASTM D 4943-08). Then, the void ratio-
matric suction relationships for different sand-gypsum mixtures were found and
presented in Figure 5.12.
Figure 5.12. Void ratio-matric suction curves of different sand-gypsum mixtures
based on pressure plate tests on separate specimens with volume
measurements by using the wax method.
10
15
20
25
30
35
40
1 10 100
Volu
met
ric
wat
er c
onte
nt
(%)
Matric suction (kPa)
0% Gypsum
10% Gypsum
20% Gypsum
30% Gypsum
40% Gypsum
50% Gypsum
0% Gyp.
10% Gyp.
20% Gyp.
30% Gyp.
40% Gyp.
50% Gyp.
0.30
0.40
0.50
0.60
0.70
1 10 100
Void
rat
io, e
Matric Suction (kPa)
0% Gypsum
10% Gypsum
20% Gypsum
30% Gypsum
40% Gypsum
50% Gypsum
0% Gyp.
10% Gyp.
20% Gyps.
30% Gyp.
40% Gyp.
50% Gyp.
Ex
per
imen
tal
dat
a
po
ints
Bes
t-fi
tted
cu
rves
Ex
per
imen
tal
dat
a p
oin
ts
Bes
t-fi
tted
cu
rves

150
Figure 5.12 reveals that the changes in void ratio become greater with increasing
gypsum content. This trend is consistent with that of the compression index versus
gypsum content which was found from the conventional oedometer test results
(Figure 5.6). In conventional consolidation tests, the volume changes result from
mechanical external loading that causes skeletal forces propagated through soil
grains contacts, while during the drying process, there is a hydraulic loading that
causes local forces acts at or near the grains contacts. Both mechanical and hydraulic
loading result volume changes but in different magnitudes.
The shrinkage characteristic curve (SCC), which shows the void ratio as a
function to the gravimetric water content (McGarry and Malafant, 1987), was found
for different sand-gypsum mixtures using the data of the second series of SWCC
tests. Figure 5.13 shows the shrinkage characteristic curves for five sand-gypsum
mixtures for a range of water contents limited between the saturated water content
and nearly the residual water content. These curves are best-fitted using Fredlund et
al. (2002)'s mathematical model. The fitting parameters are presented in Table 5.4.
Figure 5.13. Void ratio-gravimetric water content curves of different sand-gypsum
mixtures found from the pressure plate tests on separate specimens in
conjunction with volume determination using the wax method.
0.30
0.35
0.40
0.45
0.50
0.55
0.60
0.65
0.70
4 6 8 10 12 14 16 18 20 22 24 26 28
Void
rat
io, e
Gravimetric water content (%)
0% Gypsum
10% Gypsum
20% Gypsum
30% Gypsum
40% Gypsum
50% Gypsum
Experimental data
points

151
The slope of the linear portion of a SCC (the normal stage of shrinkage)
expresses the volume compressibility with respect to water content. This slope is
referred to as CLOD index (Fredlund and Rahardjo, 1993), and is expressed as:
5. 1
where Cw is the CLOD index, e is the incremental change in void ratio
corresponding to the incremental change in water content w.
To evaluate quantitatively the effect of gypsum content on the shrinkage
characteristic curve, the fitting parameters a and b, as expressed by Fredlund et al.
(2002)'s mathematical model, were used to calculate the slope of the linear portion of
the SCCs as follows:
Cw = 100 (a / b) 5.2
The slope of the SCC for different sand-gypsum mixtures was calculated firstly
according to Equation 5.1 and secondly according to Equation 5.2. Both these values
are presented in Table 5.4 for comparison. It can be noticed from Table 5.4 that the
slope of the SCCs calculated according to Fredlund et al. (2002)'s mathematical
model (Equation 5.2) are higher than those calculated according to the basic
definition of the CLOD index (Equation 5.1).
Table 5.4. Fitting parameters of the SCCs of different sand-gypsum mixtures found
from separate specimens-SWCC tests, implemented by using the
commercial pressure plate.
Gypsum
content (%)
Fitting parameters SCC slope,
e/ w
SCC slope,
100 (a/b) a b c 0 0.37 10.13 8.54 2.27 3.65 10 0.41 11.50 6.35 1.40 3.56 20 0.44 15.67 3.94 1.33 2.81 30 0.46 15.79 4.87 1.68 2.91 40 0.46 18.90 3.69 1.08 2.43 50 0.49 20.15 3.79 1.05 2.43
Figure 5.13and Table 5.4 reveal that the slope of the linear portion of the SCC
decreases with increasing gypsum content. Likewise, the curvature of the SCC
becomes flatter with increasing gypsum content, and this could be evaluated
quantitatively from the values of "c" parameter. For the soil without gypsum, the
parameter "c" is equal to 8.54 and then decreases to 3.79 when the gypsum content
reaches 50%. The value of the minimum void ratio, the "a" parameter, shows a clear

152
increase with increasing gypsum content. Another set of SCCs for different sand-
gypsum mixtures were obtained from CLOD test series, and these curves will be
presented later in Section 5.6.
5.5. Water content-total suction relationships
As described in Section 3.4.4, a series of tests were carried out to establish the
water content-total suction relationship, or as it may called also the total suction
SWCC, for five specimens having gypsum contents of 0, 20, 40, 65, and 80% by
weight. These tests were carried out by using the chilled mirror hygrometer,
commercial brand "WP4C Dewpoint PotentiaMeter". The main objective of these
tests is to study the effect of gypsum content on the common parameters of the total
suction- SWCC of gypsiferous sandy soil. As a second objective, the osmotic suction
component could be evaluated for different sand-gypsum mixtures. The test results
are presented in Figure 5.14 for these five sand-gypsum mixtures. The experimental
data points were best-fitted by using Fredlund and Xing (1994)'s model.
Figure 5.14. Gravimetric water content-total suction relationships of different sand-
gypsum mixtures determined by using chilled mirror hygrometer.
0.01
0.10
1.00
10.00
100.00
1000.00
0 5 10 15 20 25 30
Tota
l su
ctio
n (
MP
a)
Gravimetric water content (%)
0% Gypsum
20% Gypsum
40% Gypsum
65% Gypsum
80% Gypsum
Experimental data
points
153
Figure 5.14 shows that the experimental results exhibit some scattering near
saturated water contents especially for specimens have low gypsum content, whereas
this scattering seems to be reduced for specimens have high gypsum contents. This
behaviour may be resulted from the small measured suction values for the specimens
that have 0 and 20% gypsum content. The suction values of those specimens are
smaller or close to the lower limit of the recommended measuring range of the
device used (0.10 to 300 MPa). However, with the progress of the specimens drying,
when the suction exceeding 0.10 MPa, the experimental results of different sand-
gypsum mixtures show consistent trends with minimum scattering.
Figure 5.14 reveals clearly that there is a remarkable increase in total suction
function with increasing gypsum content as long as the water content is greater than
the residual value. However, all these total suction characteristic curves are
intersecting at a suction value of about 1 MPa and their ordering are reversed.
Specimens that have higher trend near saturation get the lower position after the
intersection point, and eventually all curves approach to each other and then unify to
a single constant slope line at low water contents. This behaviour results from the
effect of gypsum content on the component of osmotic suction which is generated at
high values of water content and diminish gradually with decreasing water content,
since osmotic suction is attributed to the dissolved salt solutions in the soil pores.
This finding confirms with the conclusion of Fredlund and Xing (1994) who pointed
out that when the value of soil suction is greater than 1.5MPa, the total and matric
suctions refer nearly to the same meaning, i.e., the osmotic suction is eliminated.
Furthermore, Figure 5.14 reveals that there is a clear correlation between
gypsum content and the degree of curvature near residual point. Specimens with high
gypsum content have comparatively sharp corner near residual point and relatively
steeper curve at residual stage.
The measurements of total suction were started from saturated water contents or
slightly above that and continued through a multi-stages drying process to near zero
water contents. In such a case, the initial suction readings contain only one
component of suction which is the osmotic component, since the matric suction can
be considered zero at saturation. The initial suction readings which represent the

154
osmotic suction values are drawn in Figure 5.15 against gypsum content of the soil
specimens tested. Figure 5.15 reveals that the osmotic suction increases with
increasing gypsum content, and that is related to the increase of dissolved salts in the
soil pore water.
Figure 5.15. Effect of gypsum content on osmotic suction of the sandy soil used.
To determine the residual suction and the corresponding water content for
different sand-gypsum mixtures, Vanapalli et al. (1994)'s graphical approach have
been applied regardless of the reversed axis presentation of the measured SWCCs.
These residual values are presented in Figure 5.16 as functions to gypsum content.
Figure 5.16. Parameters of total suction SWCCs for different sand-gypsum mixtures
(based on Figure 5.14).
0
50
100
150
200
250
300
350
400
0 20 40 60 80 100
Osm
oti
c su
ctio
n (
kP
a)
Gypsum content (%)
Experimental data points
0
3
6
9
12
0
200
400
600
800
0 20 40 60 80 100
Res
idual
wat
er c
onte
nt
(%)
Res
idual
tota
l su
ctio
n (
kP
a)
Gypsum content (%)
Residual Total SuctionResidual Water Content
Experimental data points
Best-fitted curves

155
Figure 5.16 shows that there is a clear increase in residual suction with
increasing gypsum content. The residual suction increases from 68 kPa for specimen
has 0 % gypsum content to 750 kPa for 80% gypsum content. On the other hand, the
corresponding residual water content shows a clear decrease with increasing gypsum
content. It decreases from 10.5% for specimen without gypsum to 3.6% for specimen
has 80% gypsum content.
5.6. Shrinkage characteristics
A series of CLOD tests were carried out to establish the shrinkage characteristic
curve (SCC) for seven sand-gypsum mixtures having gypsum percentages of 0, 10,
20, 30, 40, 65, and 80% by weight. The objectives from these tests were (i) to
evaluate the effect of gypsum content on the behaviour of the soil shrinkage
characteristic curve of the sandy soil, and (ii) to compare the SCCs found from
CLOD tests with the corresponding ones found from the SWCC tests on separate
specimens with volume determination using the wax method. Moreover, it is possible
to combine the SCCs with the corresponding SWCCs to establish the relationships of
void ratio versus soil suction for different sand-gypsum mixtures.
The SCCs for different sand-gypsum mixtures are presented in Figure 5.17 in
terms of void ratio versus water content. These curves were best-fitted by using
Fredlund et al. (2002)'s model. The fitting parameters are presented in Table 5.5.
Figure 5.17 shows the entire shrinkage curves from initial high water content
conditions to completely dry conditions. The initial water content values were
corresponding to applied matric suction ranging from 10 kPa to 30 kPa. Specimens
with high gypsum content demonstrated good consistency to deal with at relatively
high water contents without dislodging or disturbing. Accordingly, the shrinkage
curves for those mixtures are extended from higher water content values.
As a comparison between the shrinkage curves presented in Figure 5.17 and the
analogous curves obtained from SWCC tests (Figure 5.13) a good agreement may be
noticed, even though, the former curves do not cover the entire range of water
contents. Nevertheless, the comparison between the fitting parameters of the
shrinkage curves under consideration (Table 5.5) and those presented in Table 5.4 for

156
the former curves can be quantitatively characterizes these curves. Referring to Table
5.4, the values of parameter "a", which represents the minimum void ratio, for
mixtures having 0, 10, 20, 30, and 40% gypsum content are 0.37, 0.41, 0.44, 0.46,
and 0.46, respectively. The corresponding ones from CLOD tests are 0.38, 0.40,
0.44, 0.47, and 0.47, respectively. Similarly, the values of the slope of the SCCs for
the above mentioned mixtures are 3.65, 3.65, 2.81, 2.91, and 2.43 from the SWCC
tests, while the analogous slopes from CLOD tests are 3.74, 3.11, 2.81, 2.93, and
2.47. These values show a good agreement between the two approaches of finding
the SCC.
Figure 5.17. Shrinkage characteristic curves for different sand-gypsum mixtures
determined from CLOD tests.
0.35
0.40
0.45
0.50
0.55
0.60
0.65
0.70
0.75
0 5 10 15 20 25 30 35 40
Void
rat
io, e
Gravimetric water content (%)
0%Gupsum
10% Gypsum
20% Gypsum
30% Gypsum
40% Gypsum
65% Gypsum
80% Gypsum
0% SL
10% SL
20% SL
30% SL
40% SL
65% SL
80% SL
Exp
erim
enta
l d
ata
po
ints
B
est-
fitt
ed c
urv
es

157
Table 5.5. Fitting parameters of the SCCs of different sand-gypsum mixtures
determined from CLOD tests.
Gypsum content (%) Fitting parameters
SCC Slope (a/b) a b c
0 0.38 10.12 5.73 3.74
10 0.40 12.87 3.53 3.11
20 0.44 15.80 3.49 2.81
30 0.47 15.88 4.64 2.93
40 0.47 19.16 3.47 2.47
65 0.52 23.36 3.89 2.22
80 0.60 30.02 3.50 1.98
The shrinkage limit of different sand-gypsum mixtures can be identified from
the shrinkage curves according to shrinkage limit definition (i.e., the water content at
which drying-shrinkage ceases). The values of the shrinkage limit identified from the
SCCs in Figure 5.17 are 8, 7, 8.5, 11, 11.3, 13.5, and 17 % for sand-gypsum mixtures
having 0, 10, 20, 30, 40, 65, and 80% gypsum content, respectively. On the other
hand, the values of shrinkage limits of these mixtures measured by using the standard
shrinkage limit determination method (Section3.3) are 13, 11.5, 10.7, 10.5, 12.5,
17.6, and 22.5%, respectively. It is clear that the values of shrinkage limit found from
CLOD tests are smaller than those found from the standard method. This behaviour
can be attributed to the difference in the preparation condition of the specimens in
these two different methods. In the standard shrinkage limit determination method
(ASTM D 4943-08), the specimens were prepared at slurry condition with values of
water content greater than the liquid limit values, and then they were placed in small
cans without any compaction and oven dried. In contrary, in the CLOD tests, the
specimens were statically compacted at the optimum water content to 90% of the
maximum dry density obtained from the standard compaction tests. Thus, there are
considerable variations in the microstructure and pore spaces of the specimens in this
method.
Results of the CLOD tests demonstrate that with increasing gypsum content, the
slope of the linear portion of the SCC reduces, the curvature of the SCC becomes
smaller (flatter curves), and the final void ratio at the dry condition becomes greater.
As well as, the results clearly show that it is important to measure the shrinkage
curve especially for high volume change soils when the volume-mass properties
versus soil suction have to be evaluated.

158
5.7. Concluding remarks
Standard laboratory tests of grain size distribution, compaction, one-dimensional
consolidation, shrinkage characteristics (CLOD), SWCC in terms of matric suction,
and SWCC in terms of total suction revealed that the water retention characteristics
and the volume change characteristics of the sandy soil are highly influenced by
gypsum content in the soil mixture.
The grain-size distribution parameters (coefficient of uniformity and coefficient
of curvature) of the prepared sand-gypsum mixtures were clearly affected by
gypsum, with a degree depends on the gypsum percentage added. That is resulting
from the very uniform size distribution of the gypsum used which has 60% by weight
between 0.010 and 0.020 mm equivalent particle diameter.
The standard compaction tests revealed that there is a slight increase in the
maximum dry density associated with a slight decrease in the optimum water content
with increasing gypsum content up to 15% by weight. On the contrary, when gypsum
content increases more than 30% by weight, the maximum dry density starts to
decrease noticeably associated with a clear increase in the optimum water content.
Gypsum influences compaction characteristics through two different roles. At
relatively low gypsum contents, gypsum acts as a filling material to the intergranular
voids of the soil matrix, and then increases the maximum dry density. At relatively
high gypsum contents, gypsum decreases the overall specific gravity of the soil
mixture, and then decreases the maximum dry density. That is because the specific
gravity of gypsum is smaller than that of the sandy soil used.
Results of the consolidation tests exhibited that the one-dimensional
compression index (Cc) of the sandy soil increases clearly with increasing gypsum
content in the soil mixture. This behaviour may be referred in part to the increase in
the void ratio with increasing gypsum content. As well as, there is a remarkable
increase in compression index with increasing the applied normal stress. The
difference between the compression and rebound curves exhibits clear increase with
increasing gypsum content as well. This difference represents the plastic part of
compression resulting from grain slippage and breakage.

159
Results of the CLOD tests demonstrated that with increasing gypsum content,
the slope of the linear portion of the shrinkage characteristic curve (SCC) reduces,
the curvature of the SCC becomes flatter, and the final void ratio at the dry condition
becomes greater. A good agreement has been noticed between the SCCs obtained
from the SWCC tests and the analogous curves obtained from CLOD tests.
The shrinkage limit values of different sand-gypsum mixtures found out from
CLOD tests were smaller than those determined from the standard shrinkage limit
tests (ASTM D 4943-08). This can be attributed to the difference in the specimens’
preparation condition. Where the specimens were prepared at slurry condition in the
standard shrinkage method, the specimens were statically compacted at the optimum
water content in the CLOD tests.
Clear increases in the SWCC parameters were noticed with increasing gypsum
content in the soil mixture. These parameters are; the saturated water content, the air-
entry and residual suctions, the water holding capacity, and the slope of SWCC.
Furthermore, the volumetric changes associated with desaturation (increasing matric
suction) were greater with increasing the gypsum content in the soil mixture. This
trend is consistent with increasing the compression index (Cc) when gypsum content
increases, as shown from the conventional oedometer tests.
Results of the chilled mirror hygrometer tests revealed clearly that there is a
remarkable increase in total suction function with increasing gypsum content in the
soil mixture as long as the water content is greater than the residual value. This
behaviour can be attributed primarily to the effect of gypsum content on increasing
the osmotic suction component. At suction value of about 1 MPa, all total suction
characteristic curves are approached an intersecting point and their ordering is
reversed. Soil mixtures that have higher trend near saturation get the lower position
after that intersection point. This can be attributed to the eliminating of osmotic
suction component at this level of suction. This interpretation agrees to some degree
with the conclusion of Fredlund and Xing (1994) who pointed out that the osmotic
suction is eliminated when the value of soil suction is greater than 1.5 MPa.
Furthermore, with increasing gypsum content, the residual total suction showed
remarkable increase, while the residual water content showed clear decrease.

160
CHAPTER SIX
6: STRESS-DEPENDENT SOIL-WATER
CHARACTERISTICS
6.1. Introduction
The experimental programme, described in Chapter 4, was suggested to study
the influence of gypsum content and stress state on two unsaturated hydraulic key
functions of gypsiferous sandy soils. These hydraulic functions are the soil-water
characteristic curve and the unsaturated hydraulic conductivity function. This chapter
presents the test results of the experimental programme related to the stress-
dependent soil-water characteristic curves (SD-SWCCs) during both the drying and
the wetting processes. The modified stress controllable pressure plate device was
used to establish the SD-SWCCs for five sand-gypsum mixtures. The room
temperature was controlled at 20-22°C and the relative humidity at 40-50%. The
influence of five different levels of net normal stress was considered. These levels
were 0, 100, 200, 300, and 400 kPa. For clarity purpose, the drying and the wetting
curves determined at 300 kPa are excluded from the following presentation since
they have consistent, in between trends of those found at 200 and 400 kPa. The
results of SWCCs tested at 300 kPa were used to confirm the experimental accuracy
of the adjacent curves that tested at 200 and 400 kPa.
The results of SD-SWCCs are presented in the following section, and then they
will be discussed in detail in the subsequent sections for the effect of gypsum content
firstly, and for the effect of net normal stress secondly.

161
6.2. Test results preview
The test results of the SD-SWCCs are previewed in Figures 6.1 to 6.6. These
results will be discussed in the subsequent sections for the effect of gypsum content
and the effect of net normal stress on each SWCC parameter. Figure 6.1 shows the
drying and the wetting SWCCs for five sand-gypsum mixtures tested at 0 kPa net
normal stress. The other SWCCs established at 100, 200, and 400 kPa net normal
stress levels are presented through Figures 6.2 to 6.6, in sets each have the same
gypsum content and various net normal stress levels. This presentation shows
primarily the influence of various net normal stress levels on the behaviour of the
SWCCs.
Figure 6.1. Effect of gypsum content on the drying and the wetting SWCCs of
specimens tested under 0 kPa by using the modified stress controllable
pressure plate device.
4
8
12
16
20
24
28
1 10 100
Wat
er c
onte
nt
(%)
Matric suction (kPa)
0% Gypsum - Drying
20% Gypsum - Drying
40% Gypsum- Drying
65% Gypsum - Drying
80% Gypsum - Drying
0%Gypsum - Wetting
20%Gypsum - Wetting
40%Gypsum - Wetting
65%Gypsum - Wetting
80%Gypsum - Wetting

162
Figure 6.2. The drying and the wetting SD-SWCCs of the sandy soil having 0%
gypsum content.
Figure 6.3. The drying and the wetting SD-SWCCs of the sandy soil having 20%
gypsum content.
4
8
12
16
20
24
28
1 10 100
Gra
vim
etri
c w
ater
conte
nt
(%)
Matric suction (kPa)
Drying Path - 0 kPa
Wetting Path - 0 kPa
Drying Path - 100 kPa
Wetting path - 100 kPa
Drying Path - 200 kPa
Wetting Path - 200 kPa
Drying Path - 400 kPa
Wetting Path - 400 kPa
4
8
12
16
20
24
28
1 10 100
Gra
vim
etri
c w
ater
conte
nt
(%)
Matric suction (kPa)
Drying Path - 0 kPa
Wetting Path - 0 kPa
Drying Path - 100 kPa
Wetting Path - 100 kPa
Drying Path - 200 kPa
Wetting Path - 200 kPa
Drying Path - 400 kPa
Wetting Path - 400 kPa

163
Figure 6.4. The drying and the wetting SD-SWCCs of the sandy soil having 40%
gypsum content.
Figure 6.5. The drying and the wetting SD-SWCCs of the sandy soil having 65%
gypsum content.
4
8
12
16
20
24
28
1 10 100
Gra
vim
etri
c w
ater
conte
nt
(%)
Matric suction (kPa)
Drying Path - 0 kPa
Wetting Path - 0 kPa
Drying Path - 100 kPa
Wetting Path - 100 kPa
Drying Path - 200 kPa
Wetting Path - 200 kPa
Drying Path - 400 kPa
Wetting Path - 400 kPa
4
8
12
16
20
24
28
1 10 100
Gra
vim
etri
c w
ater
conte
nt
(%)
Matric suction (kPa)
Drying Path - 0 kPa
Wetting Path - 0 kPa
Drying Path - 100 kPa
Wetting Path - 100 kPa
Drying Path - 200 kPa
Wetting Path - 200 kPa
Drying Path - 400 kPa
Wetting Path - 400 kPa

164
Figure 6.6. The drying and the wetting SD-SWCCs of the sandy soil having 80%
gypsum content.
In general, the SD-SWCCs shown in Figures 6.1 to 6.6 show harmonious trends
to each other when they are compared regarding to their gypsum content variations
or to the net normal stress variations. The water content-matric suction points of each
curve are directly linked by a curved line to form together a consistent "S" shape,
without the need to reconditioning them by a best fit curve. Unlike the SWCCs test
results of the commercial pressure plate which are presented in the preceding
chapter, the SD-SWCCs of the modified stress controllable pressure plate device are
presented here without curve fittings to show their reliability, consistency, and their
accuracy. However, these curves are characterized mathematically later on in this
chapter with an attempt to correlate the obtained fitting parameters with the
characteristic points of these curves.
It can be noticed from Figure 6.1 that the gypsum content greatly influences the
soil-water characteristics. However, both the drying and the wetting SWCCs still
adopt typical S-shapes for different sand-gypsum mixtures when the soil suction is
plotted on logarithmic scale. Based on the S-shape of a SWCC, Vanapalli et al.
(1994) identified three zones of desaturation which are the boundary effect zone, the
4
8
12
16
20
24
28
1 10 100
Gra
vim
etri
c w
ater
co
nte
nt
(%)
Matric suction (kPa)
Drying Path - 0 kPa
Wetting Path - 0 kPa
Drying Path - 100 kPa
Wetting Path - 100 kPa
Drying Path - 200 kPa
Wetting Path - 200 kPa
Drying Path - 400 kPa
Wetting Path - 400 kPa

165
transition zone, and the residual zone. These zones are separated by the "air-entry
point" and the "residual point" respectively. Similar to that identification of the
drying SWCC, the wetting SWCC could be also designated by three parts separated
by two points. These points may be referred to as "air-expulsion point" and "water-
entry point". The air-expulsion point is analogous to the air-entry point on drying
path but here it represents the point on the wetting SWCC where imbibition of water
and the corresponding expulsion of air nearly come to an end. The water-entry point,
which is analogous to the residual point, could be defined as the point on the wetting
SWCC where water starts to release air and enter specimen voids significantly.
Matric suction and water content corresponding to air-expulsion point are referred to
as "air-expulsion suction" and "air-expulsion water content", respectively. Similarly,
matric suction and water content related to water-entry point are referred to as
"water-entry suction" and "water-entry water content", respectively. Some of these
terms have been used also by other researchers such as Uchaipichat (2010), Yang et
al. (2004), and Stormont (1997).
To evaluate quantitatively the effects of both gypsum content and net normal
stress level on the SD-SWCCs, the air-entry suction ( ψ , the air-entry water content
( , the residual suction (ψ , and the residual water content ( were determined
for all the established drying SD-SWCCs (Figures 6.1 to 6.6 ) by using Vanapalli et
al. (1994)'s graphical method. Analogically, the air-expulsion suction(ψ
, the air-
expulsion water content( , the water-entry suction(ψ
, and water-entry water
content ( for the wetting SD-SWCCs were found as well.
The SD-SWCC-suction parameters ( ψ , ψ
ψ
, and ψ
for different applied
levels of net normal stress are presented in Figure 6.7 as functions to gypsum
content. Similarly, the SD-SWCC-water content parameters ( , , , and )
for different applied levels of net normal stress are presented in Figure 6.8 as
functions to gypsum content. Furthermore, the SD-SWCC-suction parameters, the
SD-SWCC-water content parameters, the corresponding water holding capacity
values, and the slope values of the transition segments of the SD-SWCCs are
presented in Table 6.1.

166
Figure 6.7. Air-entry, air-expulsion, water-entry, and residual suction values of
different sand-gypsum mixtures, tested under different net normal stress
levels.
0
20
40
60
80
100
120
0 20 40 60 80
ψa
/ ψ
ex / ψ
r / ψ
we
(kP
a)
Gypsum content (%)
Residua suction -
0 kPa
Residual suction
- 100 kPa
Residual suction
- 200 kPa
Residual suction-
400kPa
Water-entry
suction- 0 kPa
Water-entry
suction - 100 kPa
Water-entry
suction- 200 kPa
Water-entry
suction- 400kPa
Air-entry suction
- 0 kPa
Air-entry suction
- 100 kPa
Air-entry suction
- 200 kPa
Air-entry
suction-400 kPa
Air-expulsion
suction- 0 kPa
Air-expulsion
suction - 100 kPa
Air-expulsion
suction- 200 kPa
Air-expulsion
suction- 400 kPa
Air-expulsion suction

167
Figure 6.8. Air-entry, air-expulsion, water-entry, and residual water contents of
different sand-gypsum mixtures tested under different net normal stress
levels.
6.0
10.0
14.0
18.0
22.0
26.0
0 20 40 60 80
Wa,
Wex
, W
r, W
we
(%)
Gypsum content (%)
Air-entry water
content - 0 kPa
Air-entry water
content - 100 kPa
Air-entry water
content - 200 kPa
Air-entry water
content - 400 kPa
Air-expulsion water
content - 0 kPa
Air-expulsion water
content - 100 kPa
Air-expulsion water
content - 200 kPa
Air-expulsion water
content - 400 kPa
Residual water
content - 0 kPa
Residual water
content - 100 kPa
Residual water
content - 200 kPa
Residual water
content - 400 kPa
Water-entry water
content - 0 kPa
Water-entry water
content - 100 kPa
Water-entry water
content - 200 kPa
Water-entry water
content - 400 kPa
Residual water content
Water-entry water content

168
Table 6.1. SWCCs parameters for specimens having different gypsum contents tested
under different loading conditions.
Gypsum
content
(%)
ψ a
(kPa)
Wa
(%)
ψ r
(kPa)
Wr
(%)
WHC
(%)
Slope
of
SWCC
ψ ex
(kPa)
Wex
(%)
ψ we
(kPa)
Wwe
(%)
WHC
(%)
Slope
of SD-
SWCC
Drying path Wetting path
SWCCs parameters for specimens tested under 0 kPa net normal stress
0 4.1 17.6 20 10.2 7.4 0.11 4.1 16.6 11 7.9 8.7 0.20
20 10.8 16.9 68 8.8 8.1 0.10 14.0 12.4 66 7.3 5.1 0.08
40 36.0 17.8 104 8.2 9.6 0.21 17.0 16.3 90 7.2 9.1 0.13
65 51.0 21.5 112 8.0 13.5 0.40 18.0 19.6 102 7.3 12.3 0.16
80 50.0 25.6 112 7.6 18.0 0.51 19.0 24.5 110 6.9 17.6 0.23
SWCCs parameters for specimens tested under 100 kPa net normal stress
0 10.0 15.4 20 10.0 5.4 0.18 4.1 14.1 17 8.1 6.0 0.10
20 17.0 15.8 61 8.9 6.9 0.12 9.5 13.8 60 7.8 6.0 0.07
40 38.0 16.7 103 8.2 8.5 0.20 18.0 14.7 72 7.1 7.6 0.13
65 51.0 20.9 106 8.6 12.3 0.39 19.0 17.9 102 7.7 10.2 0.14
80 48.0 23.6 107 7.9 15.7 0.45 20.0 20.0 101 6.2 13.8 0.20
SWCCs parameters for specimens tested under 200 kPa net normal stress
0 10 15.0 20 10.0 5.0 0.17 4 13.9 19 8.0 5.9 0.09
20 15 15.6 55 9.0 6.6 0.12 10 13.1 60 7.5 5.6 0.07
40 41 16.0 102 8.0 8.0 0.20 20 14.0 70 7.1 6.9 0.13
65 47 18.1 105 8.0 10.1 0.29 21 16.5 100 7.5 9.0 0.13
80 48 23.3 108 8.3 15.0 0.43 21 19.6 95 8.0 11.6 0.18
SWCCs parameters for specimens tested under 400 kPa net normal stress
0 8 14.0 19 10.3 3.7 0.10 4.1 13.0 11 8.5 4.5 0.10
20 11 14.0 51 9.1 4.9 0.07 7.8 12.2 38 8.0 4.2 0.06
40 34.0 15.0 100 8.0 7.0 0.15 20 12.4 62 7.2 5.2 0.11
65 51 17.6 102 8.3 9.3 0.31 20 14.2 99 7.9 6.3 0.09
80 45 20.8 103 7.6 13.2 0.37 19.0 17.5 100 6.4 11.1 0.15

169
6.3. Effects of gypsum content on the SD-SWCCs parameters
6.3.1. Effects of gypsum content on SD-SWCCs-water content
parameters
The term SD-SWCCs-water content parameters is used to refer to the water
content at different characteristic points of the drying and the wetting SD-SWCCs.
These parameters include the saturated water content, air-entry water content,
residual water content, water-entry water content, and the air-expulsion water content
of the SD-SWCC under consideration.
The drying and the wetting SWCCs for specimens of different sand-gypsum
mixtures are presented in Figure 6.1. These specimens were tested under 0 kPa net
normal stress. One of the remarkable points, which could be noticed from Figure 6.1,
is the increase of saturated water content with increasing gypsum content. It
increases from 17.7 % for the sandy soil without gypsum to 26.6% for 80% gypsum
content, and this may be attributed in part to the increase of initial void ratio in the
specimens having high gypsum contents as described in Chapter 4 (Table 4.1). It is
obvious from Figure 6.1 that the SWCC becomes higher with increasing gypsum
content as long as matric suction is greater than the residual value. In contrary, at
residual zone, the higher gypsum content specimen the lower SWCC is. This trend
may be quantitatively evaluated by presenting the air-entry water contents and the
residual water contents as functions to gypsum content as shown in Figure 6.8. The
difference between these two values for a certain soil represents the water holding
capacity (WHC) for that soil. At any net normal stress level, the increase of gypsum
content causes a noticeable increase in the air-entry water content and a slight
decrease in the residual water content, i.e., there is a clear increase in the water
holding capacity with increasing gypsum content under different net normal stress
levels as shown in Figure 6.9. As well as, Figure 6.8 reveals that there is a clear
increase in the air-expulsion water content and a slight decrease in the water-entry
water content with increasing gypsum content.

170
Figure 6.9. Effect of gypsum content on the water holding capacity of the sandy soil
under different net normal stress levels.
6.3.2. Effects of gypsum content on the SD-SWCCs-suction parameters
The SD-SWCC-suction parameters are referred to matric suction values
corresponding to the four characteristic points of the drying and the wetting SD-
SWCCs. These parameters include the air-entry suction, residual suction, water-entry
suction, and the air-expulsion suction. Referring to Figures 6.1 and 6.7, it can be
noticed that there is a clear increase in both the air-entry suction and the residual
suction with increasing gypsum content, under different levels of net normal stress.
Figure 6.7 and Table 6.1 reveal that the influence of increasing gypsum content on
the air-entry suction and the residual suction is more pronounced when gypsum
content increases from 0% to about 40%. Then, further increasing in gypsum content
seems to be slightly affected these parameters. This behaviour could be directly
related to the effect of gypsum content on the grain-size distribution and then on the
pore-size distribution of these sand-gypsum specimens as described in Chapter 3
(Figure 3.1). Moreover, there is a significant effect of gypsum particles on the
geometry of pore spaces. This effect results from the brittle nature of gypsum
0
4
8
12
16
20
0 20 40 60 80 100
Wat
er h
old
ing c
apac
ity
(%)
Gypsum content (%)
0 NNS
100 NNS
200 NNS
400 NNS
NNS : Net normal stress
Experimental data
points

171
particles which can be shaped during compaction to take the shapes of the existent
pore spaces that formed between sand particles. At low gypsum contents, the
increase in gypsum percentage highly influences the pore spaces, but this influence
becomes insignificant when gypsum content increases over a certain percentage.
6.3.3. Effects of gypsum content on the slope of the SD-SWCC
The slope of the SD-SWCC at the transition zone reveals a clear increase with
increasing gypsum content as can be noticed from Figure 6.1 and Table 6.1. This
trend is consistent with the trend of the grain-size distribution curve with increasing
gypsum content as shown Figure 3.1. Soils of relatively narrow pore size distribution
have relatively wide water content domain corresponding to narrow range of suction,
i.e. steep SD-SWCC slope.
It is worth to mention here that the slope of SD-SWCC is normally used to
determine the specific moisture capacity, which is defined as the decrease in
volumetric water content corresponding to the increase in suction, where the suction
is expressed as a hydraulic head (Lu and Likos, 2004). This term, specific moisture
capacity, is usually used in conjunction with hydraulic diffusivity to describe the
unsteady flow of water in unsaturated porous media, where the hydraulic
conductivity is the product of hydraulic diffusivity by the specific moisture capacity
(Gardner, 1956; Binson and Gribb, 1997; Doering, 1965, Gupta et al., 1974; Lu and
Likos, 2004). Therefore, the increase of gypsum content causes a clear increase in
the unsaturated hydraulic conductivity through the increase in the slope of the SD-
SWCC. The slope of the SD-SWCC through the transition zone can be measured as
[(wa – wr)/(logψr − logψa)]. The slopes of different SD-SWCCs are presented in
Table 6.1. The effect of gypsum content on the slope of the drying and the wetting
SWCC under different levels of net normal stress is shown in Figure 6.10. It can be
noticed from Figure 6.10 that the drying SD-SWCCs are more pronounced to be
affected with the increasing of gypsum content than the wetting SD-SWCCs which
exhibit marginal effects.

172
Figure 6.10. Effect of gypsum content on the slope of SD-SWCC of the sandy soil
under different loading condition.
6.3.4. Effects of gypsum content on hysteresis phenomenon
There is a marked hysteresis between the drying and the wetting soil-water
characteristic curves for all soil specimens (see Figure 6.1). Specimens undergoing
drying processes usually tend to retain a greater amount of water than those under
wetting processes. This may be mainly attributed to the non-homogenous pore size
distribution (Haines, 1930; Miller and Miller, 1988), the contact angle hysteresis
(Bear, 1972), and the entrapped air effects. By estimating the area between the
drying and the wetting paths of SWCCs, the hysteresis can be evaluated (Yang et al.,
2004). Following this concept, Figure 6.1 shows that the hysteresis loop size seems
to increase with increasing gypsum content.
However, comparing the values of residual suction by the corresponding values
of water-entry suction and the values of air-entry suction by the corresponding values
of air-expulsion suction gives a better quantitative evaluation to the hysteresis
phenomenon. This concept has been proposed and adopted in this study. Figure 6.7
and Table 6.1 show that the difference in the residual suction and the corresponding
water-entry suction markedly increases with increasing gypsum content, reaches a
maximum difference at 40% gypsum content and then starts to decreases at higher
gypsum contents. This observable trend is more pronounced with increasing the
0.00
0.10
0.20
0.30
0.40
0.50
0.60
0 20 40 60 80 100
Slo
pe
of
SD
-SW
CC
Gypsum content (%)
0 kPa NNS- Drying
100 kPa NNS - Drying
200 kPa NNS-Drying
400 kPa NNS- Drying
0 kPa NNS-Wetting
100 kPa NNS - Wetting
200 kPa NNS-Wetting
400 kPa NNS-Wetting
NNS: Net normal stress
Experimental data points

173
applied net normal stress. Figure 6.7 and Table 6.1 also show that the difference
between the air-entry suction and the corresponding air-expulsion suction noticeably
increases with increasing gypsum content under all levels of applied net normal
stress. The comparison of these suction parameters provides the horizontal shifts
between the drying and the wetting SD-SWCCs, while the vertical shifts could be
evaluated by comparing the water content parameters of the SD-SWCCs.
Furthermore, it can be noticed from Figure 6.1 that the breadth of the hysteresis
loop is most pronounced in the transition zone when the water retention is governed
by capillary mechanism, while it is less pronounced at the residual zone when the
pore water retention falls under adsorption mechanism. Figure 6.8 also shows that
under any level of net normal stress there are clear differences between the air-entry
water contents and the corresponding air-expulsion water contents, which are mostly
due to air entrapment in some closed voids. These differences seem to be slightly
changed with increasing gypsum content.
6.3.5. Effect of gypsum content on suction-water content equalization
time
Figure 6.11 shows the elapsed time required for matric suction-water content
equalization. These values were determined during the establishing of the drying and
the wetting SD-SWCCs for different sand-gypsum mixtures, tested under 0 kPa net
normal stress. It can be noticed from Figure 6.11 that the elapsed time required for
equalization for a soil specimen depends on the amount of the applied suction
increment and the zone of SD-SWCC at which the specimen is. At boundary effect
zone, the time required to reach equalization was found to be short comparing with
that at transition zone. After passing the air-entry value, a, the time required for
equalization was found to be significantly increased for the drying path because large
pores start to drain and large amount of water is leaving the specimen. During the
wetting path the elapsed time needed to reach equalization was increased when
passing the water-entry suction value, we, where large pores start to soak up water
(see Figure 6.11).
Figure 6.11 reveals that at any level of matric suction, the elapsed time required
to reach equalization noticeably increases with increasing gypsum content. This may

174
be attributed to the increase in the water holding capacity with the increasing of
gypsum content and consequently there is a relatively large amount of water leaving
the specimen. Furthermore, the elapsed time required to reach equalization during the
wetting process is much greater than that during the drying process. On the other
hand, it was noticed from the inflow/outflow time dependent readings of specimens
tested under 100, 200, 300, and 400 kPa net normal stress that the equalization time
is affected also with the level of the applied net normal stress. As the applied net
normal stress increases, the time required to reach equalization decreases markedly.
Figure 6.11. Time required for matric suction-water content equalization versus
applied matric suction during the drying and the wetting processes for
different sand-gypsum mixtures tested under 0 kPa net normal stress
level.
6.4. Effects of net normal stress on SD-SWCCs parameters
6.4.1. Effect of net normal stress on initial water content of SD-SWCC
The stress-dependent soil-water characteristic curves for five sand-gypsum
mixtures tested under different levels of net normal stress are presented in Figures
6.2 to 6.6. These figures reveal that for all gypsum contents, at the beginning of the
test when the applied matric suction is zero, soil specimens subjected to a higher net
normal stress exhibit lower initial gravimetric water contents. This result is agreed
0
2
4
6
8
10
12
14
16
18
1 10 100 1000
Tim
e (d
ays)
Applied matric suction (kPa)
0% Gy-Drying
0% Gy-Wetting
20% Gy-Drying
20% Gy-Wetting
40% Gy-Drying
40% Gy-Wetting
65% Gy-Drying
65% Gy-Wetting
80% Gy-Drying
80% Gy-Wetting

175
with that found by Ng and Pang (2000b). The decrease in the initial water content
can be attributed to the decrease in the void ratio associated with the increasing of net
normal stress. This decrease depends on the compressibility characteristics of soil
specimens. Specimens contain high gypsum contents exhibit higher decrease in void
ratio under normal stress comparing with specimens having low gypsum content.
That is because the compressibility indices of these specimens are higher than those
having low gypsum contents, as discussed in Chapter 5 (Figures 5.5 and 5.6).The
initial gravimetric water contents of the SD-SWCCs of different sand-gypsum
mixtures are shown in Table 6.2. It can be noticed from Table 6.2, when the applied
net normal stress increases from 0 to 400 kPa, the initial gravimetric water content
varies from 17.2 to 14.5% for specimens having 20% gypsum content, and from 26.6
to 21.3% for 80% gypsum content.
Table 6.2. Initial gravimetric water contents of the SD-SWCCs of different sand-
gypsum mixtures.
Applied net
normal
stress (kPa)
Gypsum content (%)
0 20 40 65 80
Initial gravimetric water content (%)
0 17.7 17.2 18.5 22.4 26.6
100 15.3 15.8 16.6 20.8 23.8
200 14.9 15.6 16.2 18.6 23.4
300 14.4 15.2 15.5 18.2 21.5
400 14.1 14.5 15.2 18.0 21.3
6.4.2. Effect of net normal stress on characteristic zones of SD-SWCC
The test results of the SD-SWCCs presented in Figures 6.2 to 6.6 reveal that the
effect of the applied net normal stress on the SWCCs is more pronounced within the
boundary effect zone, and it is extended to some degree through the transition zone.
The effect of the applied net normal stress decreases with increasing matric suction
till reaches a slight effect at the beginning of the residual zone. This behaviour can be
attributed to the reason that at low matric suction values water is retained in pore
spaces under capillary mechanism, while at high matric suctions the predomination is
to the hydration mechanism (see Section 2.4.7). Capillary mechanism depends
mainly on particle and pore structure and pore-size distribution which are directly

176
influenced with the increasing of net normal stress. In contrary, the hydration
mechanism which is related mainly to the surface properties of soil particles does not
influenced by the value of the applied net normal stress.
6.4.3. Effects of net normal stress on SD-SWCCs characteristic points
The characteristic points of the SD-SWCCs include the air-entry and residual
points on the drying curve, and the water-entry and air expulsion points on the
wetting curve. It can be noticed from Figures 6.2 to 6.6 that for all gypsum contents,
the increasing of net normal stress causes remarkable decrease in the air-entry water
contents and slight increase in the air-entry suctions. Thus, the air-entry points shift
mostly vertically downwards with increasing net normal stress. Similar stress
dependency of the air-expulsion points can be noticed on the wetting paths. At
residual side, it may be shown that for all gypsum contents the increase of net normal
stress causes slight decrease in the residual suctions and slight increase in the
residual water contents. Thus, the net normal stress seems to be has limited effects on
the residual points. On the wetting paths, for any sand-gypsum mixture, the water-
entry suction reveals clear decrease with increasing the net normal stress, while the
variation in water-entry water content seems to be insignificant, i.e., the water-entry
points on the wetting paths move horizontally with increasing the net normal stress.
6.4.4. Effect of net normal stress on the slope of SD-SWCCs
The test results shown in Figures 6.2 to 6.6 indicate that with increasing the
applied net normal stress, the SD-SWCCs show reduction in desorption rate as well a
greater reduction in absorption rate, i.e., the SD-SWCCs become flatter. Thus, the
water holding capacity clearly decreases with increasing the net normal stress, and
this could be noticed also from Figure 6.9, Figure 6.10, and Table 6.1. Same
behaviour of SD-SWCCs was also noticed by other researchers like Tse (2007), see
Section 2.4.9.
6.4.5. Effect of net normal stress on hysteresis phenomenon
Comparisons between the residual suctions and the corresponding water-entry
suctions (Figure 6.7), and between the air-entry water contents and the corresponding

177
air-expulsion water contents (Figure 6.8), under different levels of net normal stress
show that there is a general tendency to the hysteresis loops to be moderately greater
with the increasing of net normal stress. This finding does not comply with the
results of Zhou (2008), Tse (2007), and Sharma (1998), see Section 2.4.9.
6.5. Mathematical modelling of SD-SWCCs
There are several mathematical models that have been proposed to describe
SWCCs. Fredlund and Xing (1994)'s model is one of the most commonly used
SWCC models in geotechnical engineering discipline (Equation 3.3). As
recommended by Fredlund and Xing (1994), for the range of suctions applied in this
study, the correction function (ψ may be taken equal to one and Equation 3.3 is
reduced to the following form for representing the gravimetric water content as a
function to the soil suction:
(ψ
(ψ
6. 1
where (ψ is the gravimetric water content at any soil suction, is the saturated
water content, e is the base of the natural logarithm, and a, n, m are fitting parameters
related to the SWCC under consideration.
To characterize the measured SD-SWCCs, Equation 6.1 was used to describe
mathematically each of the drying and the wetting SD-SWCC. The fitting parameters
and the corresponding statistical indices (coefficients of determination, R2), were
found. These parameters are listed in Table 6.3 for different sand-gypsum mixtures,
which were tested under different net normal stress levels.
Trials have been done to fit the experimental data using two other different
models, such as those proposed by van Genuchten (1980) and Pereira &Fredlund
(2000). Good representations were also found but with statistical indices marginally
less than those obtained by applying Fredlund and Xing (1994)'s model. The
applicability of different mathematical models to represent the experimental test
results reveals the laboratory reliability of SD-SWCCs measurements by using the
newly modified stress controllable pressure plate device. As well as, this could also
be shown from the consistency of the experimental results and the possibility of

178
getting the same results with very slight differences when testing identical
specimens.
Table 6.3. The fitting parameters and the coefficient of determination (R2) for
specimens having five different gypsum contents tested under four
different net normal stress levels.
Net
normal
stress
( kPa)
Gypsum
content
(%)
Drying curve Wetting curve
Fitting parameters Ws
(%) R
2
Fitting parameters Ws
(%) R
2
a n m a n m
0
0 4.8 4.3 0.30 17.7 0.98 3.9 24.9 0.19 17.2 0.99
20 15.3 2.6 0.43 17.2 0.98 5.5 1.3 0.55 16.7 0.97
40 42.2 5.2 0.46 18.5 0.98 18.7 2.6 0.55 17.8 0.97
65 57.8 6.2 0.53 22.4 0.98 21.7 2.1 0.77 21.8 0.96
80 56.1 5.7 0.69 26.6 0.97 31.3 2.5 0.91 25.8 0.96
100
0 10.2 11.9 0.18 15.3 0.99 4.5 6.6 0.20 14.3 0.99
20 22.1 5.2 0.30 15.8 0.98 13.5 4.5 0.27 13.9 0.98
40 43.6 8.2 0.34 16.6 0.98 22.0 5.1 0.33 14.7 0.98
65 55.7 8.8 0.41 20.8 0.98 27.0 4.0 0.44 18.0 0.98
80 53.2 6.3 0.61 23.8 0.97 29.7 4.8 0.56 20.0 0.97
200
0 10.6 13.9 0.16 14.9 0.99 4.5 6.0 0.20 14.0 0.99
20 20.0 5.3 0.29 15.6 0.98 16.8 20.7 0.16 13.2 0.99
40 45.4 8.2 0.33 16.2 0.98 22.8 5.4 0.32 14.4 0.98
65 51.1 5.7 0.50 18.6 0.97 32.3 5.5 0.41 16.5 0.97
80 57.5 6.8 0.58 23.4 0.98 32.3 5.2 0.50 19.6 0.97
400
0 7.7 4.9 0.19 14.1 0.99 3.8 23.9 0.12 13.6 0.99
20 14.0 3.1 0.29 14.5 0.98 8.0 4.3 0.19 12.4 0.98
40 40.9 7.1 0.33 15.2 0.98 21.8 6.2 0.25 12.7 0.98
65 56.7 8.8 0.38 18.0 0.98 29.0 4.1 0.36 14.5 0.97
80 52.1 5.8 0.61 21.3 0.97 26.9 4.3 0.53 17.5 0.97
As mentioned in Section 2.4.7, there are two distinctive changes in slope along
SWCC. These changes in slope define two essential points for describing the SWCC,
the air-entry point and the residual point. The parameter "a" in Fredlund and Xing
(1994)'s model is closely related to the air-entry suction as reported by Yang et al.
(2004). The parameter "n" governs the change in slope of the soil-water
characteristic curve near the air-entry point, and the parameter "m" governs the

179
change in slope near the residual point. Comparing the air-entry suction/air-expulsion
suction values which are presented in Table 6.1 with the corresponding "a" values in
Table 6.3 shows that the values of the parameter "a" are slightly higher than the air-
entry suction/air-expulsion suction values. A highly correlated linear relationship, a =
1.11 ψa + 1.93, was found by plotting the values of parameter "a" against those of
air-entry/air-expulsion values as shown in Figure 6.12. The coefficient of
determination, R2, for this relationship was found to be 0.96. This relationship
complies to some degree with that found by Yang et al. (2004) which was a = 1.40 ψa
- 0.08. Yang et al. (2004)'s relationship was found for five different sandy soils with
a coefficient of determination, R2, equal to 0.987.
Figure 6.12. The relationship between the fitting parameter "a", Fredlund and Xing
(1994)'s model, and the air-entry/air-expulsion suction values for
various sand-gypsum mixtures that tested under different net normal
stress levels.
As well as, the SD-SWCCs parameters in Table 6.1 and the fitting parameters
presented in Table 6.3 reveal that there is a clear correlation between the fitting
parameter "m" and the corresponding residual suction/water-entry suction values.
The larger the ψr value, the greater the "m" value as shown in Figure 6.13.
Furthermore, the parameter "m" may be expressed the degree of curvature near the
residual point. Large values of "m" reflect a sharp corner near the residual point and
a steeper curve at residual zone.
R² = 0.9587
0
10
20
30
40
50
60
70
0 10 20 30 40 50 60
Fit
ting p
aram
eter
"a"
Air-entry / Air-expulsion suction (kPa)
a = 1.11 ψa + 1.93

180
Figure 6.13. The relationship between the fitting parameter "m", Fredlund and Xing
(1994)'s model, and the residual suction value for various sand-gypsum
mixtures that tested under different net normal stress levels.
Referring to Figures 6.1 to 6.6, the slope of the SD-SWCCs at the transition
zone and the degree of curvature near the air-entry point can be evaluated by
considering the values of "n" parameter that shown in Table 6.3. Large value of n
reflects a steeper slope for SWCC and a sharp corner near air-entry point. For all
gypsum contents, there is a general tendency for the "n" value to increase with
increasing the net normal stress till reach a peak value corresponding to a net normal
stress around 200 kPa, then it shows some decrease with higher levels of net normal
stress. In other words, the increasing of net normal stress causes the desorption rate,
near the air-entry points, to increase reaching a peak under 200 kPa and then tends to
decrease under higher net normal stress levels.
6.6. Comparison of SWCCs obtained from different equipment
The consistency and reliability of the SWCCs established by using the modified
stress controllable pressure plate device and those established by using the
commercial pressure plate are compared in this section. For comparison, the SWCCs
of specimens having 0, 20, and 40% gypsum contents are considered and presented
in Figure 6.14.
0.0
0.1
0.2
0.3
0.4
0.5
0.6
0.7
0.8
0 20 40 60 80 100 120
Fit
tin
g p
aram
eter
"m
"
Residual suction (kPa)
0 kPa NNS - Drying
200 kPa NNS - Drying
400 kPa NNS - Drying
100 kPa NNS - Drying

181
Figure 6.14. Comparison of the SWCCs established from the modified stress
controllable pressure plate device with that established by using the
commercial pressure plate.
It can be noticed from Figure 6.14 that there are clear differences between these
two curve sets in the general shapes, saturated water contents, air-entry points,
residual points, water holding capacities, and the desaturation rates or the slope of the
SWCCs. For comparison, these parameters are listed in Table 6.4 for the two sets of
the SWCCs. The SWCCs obtained from the modified device have well defined "S"
shapes, well distinguishable desaturation zones, and accordingly well defined air-
entry and residual points. On contrary, the SWCCs established by using the
commercial pressure plate do not have well expressive "S" shapes and their
characteristic points (the air-entry and residual points) cannot be defined with enough
precision.
5
10
15
20
25
1 10 100
Gra
vim
etri
c w
ater
conte
nt
(%)
Matric suction (kPa)
0% Gypsum -Modified device
0% Gypsum- Commercial pressure plate
20% Gypsum -Modified device
20% Gypsum- Commercial pressure plate
40% Gypsum-Modified device
40%Gypsum- Commercial pressure plate

182
Table 6.4. Comparison of SWCCs parameters obtained by using the modified stress
controllable pressure plate device and those obtained from the
commercial pressure plate.
Parameters Modified device Commercial device
Gypsum content Gypsum content
0% 20% 40% 0% 20% 40%
wsat.(%) 17.7 17.2 18.5 13.5 15.3 23.2
ψa (kPa) 4.1 10.8 36.0 10.0 11.0 14.0
ψr (kPa) 20 68 104 72 150 210
wa (%) 17.6 16.9 17.8 11.8 13.6 20.7
wr (%) 10.2 8.8 8.2 9.5 7.6 6.5
WHC (%) 7.4 8.1 9.6 2.3 6.0 14.2
SWCC slope 0.11 0.10 0.21 0.03 0.05 0.12
The differences between the results of the commercial pressure plate and that of
the modified device may be resulted in part from the variation in the size of
specimens used. At the commercial pressure plate tests, the specimen size was 45
mm diameter and 7.6 mm thickness, while it was 68 mm diameter and 14 mm
thickness in the modified stress controllable pressure plate device tests.
The saturation process of soil specimens used with the modified device is
different from that used with the commercial pressure plate. This difference may be
the main reason causing the variations at the initial saturated water content of the two
sets of the SWCCs. At the commercial pressure plate, an excess of water is left on
the top of the ceramic disc to saturate the soil specimens while they are in contact
with the ceramic disc (see Section 3.4.3.3). At the modified device, there is no excess
of water standing on the top of the ceramic disc, and the water level in the outside
standing tubes is adjusted to be at the level of the soil-ceramic disc interface (see
Section 4.2.4.1).
At the modified device, the specimen covers the entire surface area of the
ceramic disc. Thus, there is no exposed area of ceramic disc in contact directly with
the pressurized air of the cell, which may have some effect on continuity of the water
phase as pointed out lately by some researches such as Leong et al. (2011), Power et
al. (2011). In contrary, the exposed area to air pressure in the commercial pressure
plate is mostly greater than the covered area by the soil specimens.

183
The soil specimen at the modified device occupies the entire volume of the cell,
and that is preventing the soil from drying by evaporation. On the other hand, the
volume of the commercial vessel is too large in compare with the volume of the soil
specimens tested, which may results in remarkable evaporation especially when the
attached vapour saturator that saturates the inflow air is disregarded.
Furthermore, as a comparison with published investigations on nearly similar
soils, the SD-SWCCs established in this study on the silty clayey sand without
gypsum additives are compared to matric suction measurements carried out by
Tripathy et al. (2012). The soil used in these measurements was a low-plastic , poorly
graded silty sand, taken from North-West Libya that contains 3.5% coarse sand,
12.8% medium sand, 71% fine sand, and 12.7% silt and clay fractions. Three groups
of Tripathy et al. (2012)'s data points related to statically compacted specimens under
three levels of load (high, intermediate, and light) are presented in Figure 6.15. In
these groups the matric suction values of as compacted water content specimens
were measured by using null-type axis-translation technique.
Figure 6.15. Comparison of the drying SD-SWCCs established from the modified
stress controllable pressure plate device for the silty clayey sand with
published matric suction measurements on poorly graded silty sand
using null-type technique (Tripathy et al., 2012).
6.0
8.0
10.0
12.0
14.0
16.0
18.0
1 10 100 1000
Wat
er c
onte
nt
(%)
Matric suction (kPa)
Heavy static compation
Intermediate static compaction
Light static compaction
Modified device (0 kPa NNS)
Modified device (200 kPa NNS)
Modified device (400 kPa NNS)
184
It can be noticed from Figure 6.15 that the variations between the established
SD-SWCCs and Tripathy et al. (2012)' measurements are acceptable to some extent.
These variations result mainly from the differences in the grain-size distribution of
the soils used, and the differences in the compaction dry densities and water contents
of the prepared specimens.
6.7. Combined SWCCs of different sand-gypsum mixtures
Results of the SWCCs found from the modified stress controllable pressure plate
device were combined with those obtained from the dew point potentiameter to
establish nearly the entire SWCCs for different sand-gypsum mixtures (ASTM D
6836-02). The resulting curves are referred to as the combined SWCCs. The drying
SWCCs tested at 0 kPa net normal stress which are presented earlier in Figure 6.1 are
employed to establish the segments of the combined SWCCs corresponding to high
water contents (wet segments). Results of the dew point potentiameter at low water
contents, typically corresponding to total suction values greater than 1 to 1.5 MPa,
are used to define the dry segments (dry ends) of the SWCCs. Under this condition,
the osmotic component of the total suction is generally small, and the matric and
total suctions are comparable (Fredlund and Xing, 1994; ASTM D 6836-02).
The combined SWCCs for different sand-gypsum mixtures are presented in
Figure 6.16. The experimental data points of the dew point potentiometer at
relatively high water contents are presented as well. The combined curves show the
gravimetric water content as a function to the matric suction, whereas the single data
points show the gravimetric water content as a function to the total suction (matric +
osmotic) and they are referred to as the " total suction-data points ". The combined
SWCCs points are designated by using open symbols, square for the wet portions
and circular ones for the dry ends. The total suction-data points are symbolized by
circular solid signs at wet portions and circular open ones at dry portions.

185
0
5
10
15
20
0.001 0.010 0.100 1.000 10.000 100.000 1000.000
Gra
vim
etri
c w
ater
co
nte
nt
(%)
Suction (MPa)
(A) 0% Gypsum Content
Matric suction
Total Suction - Wet portion
- Total suction - Dry portion
Experimental data points
0
5
10
15
20
0.001 0.010 0.100 1.000 10.000 100.000 1000.000
Gra
vim
etri
c w
ater
con
tent
(%)
Suction (MPa)
(B) 20% Gypsum Content
Matric suction
Total Suction - Wet portion
Total suction - Dry portion
To
tal
suct
ion
po
ints
Experimental data points
0
5
10
15
20
0.001 0.010 0.100 1.000 10.000 100.000 1000.000
Gra
vim
etri
c w
ater
co
nte
nt
(%)
Suction (MPa) (C) 40% Gypsum Content
Matric suction
Total Suction - Wet portion
Total suction - Dry portion
To
tal
suct
ion
po
ints
Experimental data points

186
Figure 6.16. Combined SWCCs for different sand-gypsum mixtures, (A) 0%, (B)
20%, (C) 40%, (D) 65%, and (E) 80% gypsum content.
The combined data points of wet and dry portions of the SWCCs were best
fitted by using Fredlund and Xing (1994)'s mathematical model. The fitting
parameters and the statistical indices for these curves are shown in Appendix A,
Table A. 2A.2. The coefficient of determination (R2) was greater than 0.997 for all
these fitted curves. Very good matching between the two portions of the combined
SWCC can be noticed for different sand-gypsum mixtures.
The wet portions of the combined curves exhibit remarkable consistency with
the corresponding total suction-data points with lateral shifting seems to be harmonic
for different gypsum contents as long as the suction values are represented on
logarithmic scale. Nevertheless, both the combined and total suction-data points shift
to the right, to a higher logarithm cycle, with increasing gypsum content, thus, the
0
5
10
15
20
25
0.001 0.010 0.100 1.000 10.000 100.000 1000.000
Gra
vim
etri
c w
ater
co
nte
nt
(%)
Suction (MPa) (D) 65% Gypsum Content
Matric suction
Total Suction - Wet portion
Total suction - Dry portion
To
tal
suct
ion
po
ints
Experimental data points
0
5
10
15
20
25
30
0.001 0.010 0.100 1.000 10.000 100.000 1000.000
Gra
vim
etri
c w
ater
co
nte
nt
(%)
Suction (MPa) (E) 80% Gypsum Content
Matric suction
Total Suction - Wet portion
Total suction - Dry portionT
ota
l su
ctio
n p
oin
ts
Experimental data points

187
numerical difference between these two curves which represent the osmotic suction
increases significantly with increasing gypsum content. On the other hand, the
combined and the total suction-data points converge from each other with increasing
suction till match at suction values around 2 MPa for different sand-gypsum
mixtures.
Examining Figure 6.16 closely, two distinguished constant slope segments
could be noticed at each of the combined SWCCs of different sand-gypsum mixtures.
The first segment dominates over the capillary mechanism zone (transition zone),
while the second segment extends over the hydration mechanism zone (residual
zone). A curvature part joints these two segments. The slope of the capillary segment
exhibits clear increase with increasing gypsum content, while the slope of the
hydration segments on the contrary shows obvious decrease with the increase of
gypsum content. The degree of curvature of the joining part between these two
segments seems to increase remarkably with increasing gypsum content, i.e.,
relatively sharp corner may be noticed at the SWCC of high gypsum content
specimens.
The effect of gypsum content on the slope of the capillary segment is attributed
directly to the effect of gypsum on the pore-size distribution, since gypsum has
highly uniform grain-size distribution. Soils of relatively narrow pore size
distribution have relatively steep SWCC slope at capillary zone. On the other hand,
the slope of the residual segment is related to the specific surface of soil particles and
surface charge properties.
The residual points of the SWCCs for different sand-gypsum mixtures can be
defined by using the combined SWCCs (Figure 6.16). These points have more
accuracy and reliability comparing with those defined by considering only the wet
parts of the SWCCs (Figure 6.1). This reliability results from the possibility of
defining the tangent line to the residual part of the SWCC precisely. The residual
suction and the corresponding water content for different sand-gypsum mixtures,
which were determined from the combined SWCCs, are presented in Table 6.5. For
comparison, the corresponding values defined from the single SWCCs shown in
Figure 6.1 are presented in the same table as well.

188
Table 6.5. Residual suction and residual water content for different sand-gypsum
mixtures defined from the combined SWCCs in comparison to those
found from the single SWCCs.
Gypsum content (%) Combined SWCCs Single SWCCs
ψr (kPa) wr (%) ψr (kPa) wr (%)
0 12 10.8 20 10.2
20 72 8.9 68 8.8
40 115 6.3 104 8.2
65 140 5.0 112 8.0
80 120 5.0 112 7.6
Table 6.5 reveals that the residual suction values defined from the combined and
the single SWCCs are comparable to each other, while the residual water contents
exhibit noticeable variations, especially for specimens have 40, 65, and 80% gypsum
content.
6.8. Summary and concluding remarks
An extensive laboratory programme has been designed to study the influences of
gypsum content, net normal stress, and drying-wetting cycle on the soil-water
characteristic curve (SWCC) of the sandy soil by using the modified stress
controllable pressure plate device. Results of the experimental programme revealed
that there is a remarkable dependency of the SWCC on the applied net normal stress.
This dependency becomes more pronounced with increasing gypsum content, and
this may be attributed in part to the changes of the compressibility characteristics
associated with increasing gypsum content in the soil specimen. There is a clear
decrease in each of saturated water content, desorption rate, absorption rate, and
water holding capacity with increasing net normal stress level for various sand-
gypsum mixtures. On contrary, all these parameters are increasing clearly with
increasing gypsum content in the soil specimen at different levels of net normal
stress. Furthermore, both the air-entry suction and the residual suction show
significant increase with increasing gypsum content in the soil mixture. The
consistency of the experimental results and the possibility of getting relatively
identical results for identical specimens demonstrate the reliability and accuracy of
the measurements of the SD-SWCC by using the newly modified device.

189
CHAPTER SEVEN
7: STRESS DEPENDENT-UNSATURATED HYRAULIC
CONDUCTIVITY FUNCTIONS
7.1. Introduction
Forty tests of stress dependent-hydraulic conductivity function (SD-HCF) were
carried out on five sand-gypsum mixtures by using the modified stress controllable
pressure plate device. The mixtures had gypsum contents of 0%, 20%, 40%, 65%,
and 80%. The specimens were tested during the drying and the wetting path
conditions under four different net normal stress levels of 0, 100, 200, and 400 kPa.
The room temperature was controlled at 20-22°C and the humidity at 40-50%. The
tests were carried out by considering two different approaches at the same time.
These approaches are the one step outflow method by Doering (1965) and the
multistep outflow method by Gardner (1956) as described in Chapter 4. Accordingly,
two groups of SD-HCFs were obtained, one calculated by following Doering's
approach and the other by following Gardner's approach. In each group, the
hydraulic conductivity was represented first as a function to the matric suction, and
second as a function to the gravimetric water content. The results of SD-HCFs
according to Doering's approach are presented in Section 7.2 in sets each under the
same level of net normal stress, while the results according to Gardner's approach are
presented in Section 7.4 in sets each has the same gypsum content.
7.2. Effect of gypsum content on SD-HCFs
In this section, the influences of gypsum content, soil suction, and drying-
wetting cycle on the hydraulic conductivity function under different levels of net

190
normal stress are presented and discussed. The stress dependent-hydraulic
conductivity functions (SD-HCFs) presented in this section were calculated
according to Doering's approach after some modification. This approach was applied
in each of the successive increments, or decrements, in matric suction instead of
applying it through only one large step as specified in the original method.
Accordingly, each suction increment or decrement was treated here as a one
independent step.
7.2.1. Hydraulic conductivity-matric suction relationships
Figures 7.1 A, B, C, and D show the drying and the wetting hydraulic
conductivity functions (HCFs) in terms of matric suction, k(ψ), for different sand-
gypsum mixtures under net normal stress levels of 0, 100, 200, and 400 kPa,
respectively. The measured k(ψ) for the five sand-gypsum mixtures are denoted by
using five different symbols and colours, while the drying and the wetting k(ψ) are
designated by using solid and open symbols, respectively.
1.E-12
1.E-11
1.E-10
1.E-09
1.E-08
0 100 200 300 400
Hydra
uli
c c
onduct
ivit
y (
m/s
)
Matric suction (kPa)
(A) HCFs under 0 kPa net normal stress
0%Gy. Drying
20% Gy. Drying
40% Gy. Drying
65% Gy. Drying
80% Gy. Drying
0% Gy. Wetting
20% Gy. Wetting
40% Gy. Wetting
65% Gy. Wetting
80% Gy. Wetting

191
1.E-12
1.E-11
1.E-10
1.E-09
1.E-08
0 100 200 300 400
Hyd
rau
lic
co
nd
uct
ivit
y (
m/s
)
Matric suction (kPa)
(B) HCFs under 100 kPa net normal stress
0%Gy. Drying
20% Gy. Drying
40% Gy. Drying
65% Gy. Drying
80% Gy. Drying
0% Gy. Wetting
20% Gy. Wetting
40% Gy. Wetting
65% Gy. Wetting
80% Gy. Wetting
1.E-12
1.E-11
1.E-10
1.E-09
1.E-08
0 100 200 300 400
Hydra
uli
c c
onduct
ivit
y (
m/s
)
Matric suction (kPa)
(C) HCFs under 200 kPa net normal stress.
0%Gy. Drying
20% Gy. Drying
40% Gy. Drying
65% Gy. Drying
80% Gy. Drying
0% Gy. Wetting
20% Gy. Wetting
40% Gy. Wetting
65% Gy. Wetting
80% Gy. Wetting

192
Figure 7.1. The drying and the wetting hydraulic conductivity functions in terms of
matric suction, according to Doering's approach, for different sand-
gypsum mixtures, tested under net normal stress levels of (A) 0, (B) 100,
(C) 200, and (D) 400 kPa.
In general, Figures 7.1 A, B, C, and D show that the unsaturated hydraulic
conductivity values of different sand-gypsum mixtures (corresponding to different
levels of net normal stress and matric suction) seem realistic comparing with a
saturated hydraulic conductivity of 4×10⁻⁹
m/s for the host sandy soil without
gypsum additives.
It can be noticed from Figures 7.1 A, B, C, and D that the general trend of these
functions shows a clear increase in hydraulic conductivity with increasing gypsum
content under different levels of net normal stress, for both the drying and the
wetting paths, at any value of matric suction. However, for the drying functions, this
increase is more pronounced throughout the transition zone, i.e., at matric suction
values located between the air-entry and the residual suction values of the sand-
gypsum mixtures tested. As matric suction increases more, the hydraulic
conductivity functions start to converge to each other reaching minimum differences
at the residual suction zones of the mixtures tested. This trend is harmonic with the
trend of SWCCs of these mixtures which are presented earlier in Section 6.2. Figures
1.E-12
1.E-11
1.E-10
1.E-09
1.E-08
0 100 200 300
Hydra
uli
c c
onduct
ivit
y (
m/s
)
Matric suction (kPa)
(D) HCFs under 400 kPa net normal stress.
0%Gy. Drying
20% Gy. Drying
40% Gy. Drying
65% Gy. Drying
80% Gy. Drying
0% Gy. Wetting
20% Gy. Wetting
40% Gy. Wetting
65% Gy. Wetting
80% Gy. Wetting

193
6.2 to 6.6 reveal that the SWCC becomes higher with increasing gypsum content as
long as matric suction is greater than the residual value. At residual zone, the
ordering is reversed, thus the higher gypsum content specimen becomes the lower
SWCC is. In other meaning, the water content of a specimen increases with
increasing gypsum content at any suction value below the residual value. Thus, the
flow paths and then the hydraulic conductivity increase with increasing gypsum
content. On the other hand, there is a clear increase in the initial void ratio of the
prepared specimens with increasing gypsum content as described in Chapter 4, Table
4.1, and consequently this causes the hydraulic conductivity to increase
proportionally as well.
Experimentally, it was noticed in this study that the outflow transient methods
are inapplicable at matric suction values below the air-entry value (boundary zone)
because there is no flow of water. On the other hand, at residual zone, the flow of
water is very little making the outflow methods inapplicable as well. Thus, the
applicability of the outflow transient methods may be limited to the transition zone
only. For this reason, values of hydraulic conductivity measured at suction values
below the air-entry points are omitted in this presentation.
Moreover, it can be noticed from Figures 7.1 A, B, C, and D that the general
shape of the drying hydraulic conductivity functions is convex upward for mixtures
having gypsum content more than 40%, while it has a concave shape for those
having 0% and 20% gypsum content. This behaviour may be attributed to the reason
that the values of air-entry suctions of the 65% and 80% gypsum content mixtures
are relatively high and the initial parts of their functions, k(ψ), are corresponding to
matric suction values very close to their air-entry points where the outflow is
restricted.
It is clear from Figures 7.1 A, B, C, and D that the drying hydraulic conductivity
decreases with increasing matric suction under different net normal stress values, but
at a decreasing rate has some dependency on gypsum content. As gypsum content
increases, the decreasing rate or the slope of the hydraulic conductivity function
shows a clear increase. This trend is consistent with the increasing in slope of the
SWCC, or the increasing in desorption rate with increasing gypsum content as

194
discussed in Section 6.3. Ultimately, this behaviour may be attributed directly to the
effect of gypsum content on the grain-size distribution and then on the pore-size
distribution.
Like the drying hydraulic conductivities, Figures 7.1 A, B, C, and D reveal that
the wetting conductivities show clear increases with decreasing matric suction but at
increasing rates depends on gypsum content as well. In contrary to the drying
functions, the wetting functions of specimens have higher gypsum content showing
lower increasing rate in hydraulic conductivity with decreasing matric suction. In
other words, at any specific suction, the slope of the wetting k(ψ) decreases with
increasing gypsum content.
The general trend of the wetting and the drying k(ψ), presented in Figures 7.1 A,
B, C, and D, shows that the slope of these functions seems to be steeper with high
curvature at low suction values and then becomes flatter and goes nearly asymptotic
to the suction-axis at high suction values. This trend is consistent with the slopes of
the wetting and the drying SWCCs presented in Figures 6.1 to 6.6, where these
slopes seem steeper at the transition zones and then become flatter at residual zones.
In other words, the rate at which the unsaturated hydraulic conductivity decreases
/increases is directly dependent on the water desorption/absorption rate of the soil
specimen.
In general, the wetting HCFs seem to be more consistent than the drying HCFs,
and could be found for suction values less than the air-entry point with the
application of the transient outflow methods. It is worthy to mention here that the
practical applicability of the transient outflow methods for a wetting path is extended
between the water-entry suction and the air-expulsion suction. These points are
analogous to the residual suction and the air-entry suction on the drying path,
respectively.
For all specimens that have different gypsum contents, tested under different net
normal stress levels, the wetting hydraulic conductivity function was always lower
than the corresponding drying function, as may be seen from Figures 7.1 A, B, C,
and D. The hysteresis of k(ψ) between the wetting and the drying is consistent with

195
the results published by Ng and Leung (2012), shown in Figure 7.2, on compacted
decomposed silty clay (36% sand, 42% silt, and 22% clay). They adopted the
instantaneous profile method using a stress-controllable soil column. The soil
specific gravity was 2.68 and placed at dry density of 1.552 Mg/m3.
Figure 7.2. Measured drying and wetting stress dependent k(ψ)s at (a) 4 kPa, (b) 39
kPa, (c) 78 kPa net normal stress levels for a compacted decomposed
silty clay using the instantaneous profile method (Ng and Leung, 2012).

196
The hysteresis of k(ψ) is likely because the soil-water characteristic curve
exhibits hysteresis, and because the hydraulic conductivity is directly related to the
soil-water content. In other words, the water content along the wetting path is always
less than that along the drying path at any given suction and this leads to lesser
hydraulic flow paths and hence lower wetting hydraulic conductivity. Thus, only
minor hysteresis is noticed when the hydraulic conductivity is plotted against the
gravimetric water content as discussed in the following section.
7.2.2. Hydraulic conductivity-gravimetric water content relationships
As discussed in the previous section, the increase in k(ψ) with increasing
gypsum content is related in part to the increase in water content of the specimen
associated with the increase of gypsum content at any specific matric suction. As
well as, the hysteresis of k(ψ) between the drying and the wetting paths is also
related to the variation in the water content between these two paths. For that reason,
the hydraulic conductivity function is represented in this section in terms of
gravimetric water content, and it is designated as k(w). Figures 7.3 A, B, C, and D
show the drying and the wetting k(w) for different sand-gypsum mixtures tested
under net normal stress of 0, 100, 200, and 400 kPa. These functions were calculated
according to Doering's approach after some modification as mention earlier. The
k(w) for different sand-gypsum mixtures are denoted by using different symbols with
different colours. Solid symbols with solid lines are used for the drying functions,
and open symbols with dashed lines are used for the wetting functions.
It can be noticed from Figures 7.3 A, B, C, and D that there is a minor effect to
the gypsum content on both the drying and the wetting k(w) at high water content
values (low suctions), while this effect becomes more pronounced at low water
content values (high suctions). This behaviour is noticed under different levels of net
normal stress. In general, k(w) exhibits a tendency to increase with increasing
gypsum content under various applied net normal stress levels. This trend is mainly
attributed to the increase in specific surface, initial void ratio, and the changes in the
pore-size distribution associated with increasing gypsum content.

197
1.E-12
1.E-11
1.E-10
1.E-09
1.E-08
4 6 8 10 12 14 16 18
Hydra
uli
c c
onduct
ivit
y (
m/s
)
Gravimetric water content (%)
(A) HCFs under 0 kPa net normal stress
0%Gy. Drying
20% Gy. Drying
40% Gy. Drying
65% Gy. Drying
80% Gy. Drying
0% Gy. Wetting
20% Gy. Wetting
40% Gy. Wetting
65% Gy. Wetting
80% Gy. Wetting
1.E-12
1.E-11
1.E-10
1.E-09
1.E-08
4 6 8 10 12 14 16 18 20 22
Hydra
uli
c c
onduct
ivit
y (
m/s
)
Gravimetric water content (%)
(B) HCFs under 100 kPa net normal strss.
0%Gy. Drying
20% Gy. Drying
40% Gy. Drying
65% Gy. Drying
80% Gy. Drying
0% Gy. Wetting
20% Gy. Wetting
40% Gy. Wetting
65% Gy. Wetting
80% Gy. Wetting

198
Figure 7.3. The drying and the wetting hydraulic conductivity functions in terms of
gravimetric water content, according to Doering's approach, for different
sand-gypsum mixtures, tested under net normal stress of (A) 0, (B) 100,
(C) 200, and (D) 400 kPa.
1.E-12
1.E-11
1.E-10
1.E-09
1.E-08
4 6 8 10 12 14 16 18
Hydra
uli
c c
onduct
ivit
y (
m/s
)
Gravimetric water content (%)
(C) HCFs under 200 kPa net normal stress.
0%Gy. Drying
20% Gy. Drying
40% Gy. Drying
65% Gy. Drying
80% Gy. Drying
0% Gy. Wetting
20% Gy. Wetting
40% Gy. Wetting
65% Gy. Wetting
80% Gy. Wetting
1.E-12
1.E-11
1.E-10
1.E-09
1.E-08
4 6 8 10 12 14 16 18
Hydra
uli
c co
nduct
ivit
y (
m/s
)
Gravimetric water content (%)
(D) HCFs under 400 kPa net normal stress.
0%Gy. Drying
20% Gy. Drying
40% Gy. Drying
65% Gy. Drying
80% Gy. Drying
0% Gy. Wetting
20% Gy. Wetting
40% Gy. Wetting
65% Gy. Wetting
80% Gy. Wetting

199
It is clear from Figure 7.3A, B, C, and D that the hysteresis effects on k(w) is
less than that on k(ψ) presented in Figures 7.1 A, B, C, and D. That is likely because
the water content hysteresis is eliminated when the hydraulic conductivity function is
represented in terms of water content. Ng and Leung (2012) have investigated the
effects of the drying-wetting cycle on k( ). They pointed out that these effects appear
to be less significant when compared with those observed on k( ), as shown in
Figure 7.4. Where k( ) is the unsaturated hydraulic conductivity function in terms of
volumetric water content.
Figure 7.4. The hydraulic conductivity functions in terms of volumetric water
content, at average net normal stresses of 4 kPa, 39 kPa, and 78 kPa for
a compacted decomposed silty clay using the instantaneous profile
method (Ng and Leung, 2012).
The general trend of k(w) for various sand-gypsum mixtures which were tested
under different levels of net normal stress shows that the slope of these functions
(i.e., the change in hydraulic conductivity corresponding to the change in water
content) is relatively flat at high water content (low suction) and gradually increases
to be steep at low water content (high suction). This trend conflicts with the trend of
k(ψ) where the slope seems steep at low suction values and then becomes flatter with
the increase in matric suction (Figures 7.1 A, B, C, and D).
Under different levels of net normal stress, the slope of the drying or the wetting
k(w) shows a clear decrease with increasing gypsum content at any specific suction.

200
In other words, specimens with high gypsum content have flatter curves than those of
low gypsum.
It is worthy to mention here that the water content has a direct effect on the
hydraulic conductivity, while matric suction affects the hydraulic conductivity
indirectly, i. e., through his effect on the water content. In other words, the slope of
k(ψ) of a particular specimen depends implicitly on the slope of the SWCC of that
specimen, while the slope of k(w) is not so.
When the soil specimen is nearly saturated, the decrease in hydraulic
conductivity associated with de-saturation is linearly proportional to the reduction in
cross sectional area of the water flow paths, and then to the reduction in the water
content as long as the water phase is continuous. In this stage, the slope or the
decreasing rate of k(w) seems relatively constant, especially when the change in void
ratio corresponding to the change in water content is slight near saturation.
As the desorption progresses beyond the residual point and the water phase
starts to be discontinuous, the slope of the k(w) or the decreasing rate in hydraulic
conductivity starts to increase dramatically and becomes steeper since the diffusion
mechanism starts to control the system in this stage. Furthermore, the soil shrinkage
and the corresponding reduction in void ratio is more pronounced in this stage of de-
saturation, as may be noticed from the SCCs presented in Figure 5.17.
In more details, the flow of water near the air-entry point is at liquid phase
where the water phase is continuous with the possibility of some isolated air pocket
existence. Thus, the slope of k(w) is mild and seems relatively constant. With
increasing matric suction, water is drained causing soil to dry and produce a
reduction in the continuity of the water phase. Ultimately, at the end of the transition
zone and the beginning of the residual zone, the water phase starts to be
discontinuous due to low soil water content while the air phase begins to be well
continuous. Thus, the flow of water transforms gradually to a vapour flow and the
diffusion will be the dominant mechanism at this zone. Due to this transformation,
dramatic decreases in k(w) can be noticed in this stage (Figures 7.3 A, B, C, and D).

201
7.3. Comparison of Doering's approach with Gardner's approach
The experimental programme of the stress dependent-hydraulic conductivity
tests was designed by considering two of the outflow methods, and consequently the
results were analysed twice by following these approaches for all the implemented
tests. These approaches are the multistep outflow method by Gardner (1956) and the
one step outflow method by Doering (1965). The experimental procedures adopted
by both these approaches were approximately the same but the methods used to
analyse the outflow data were different depending on the assumptions, and the initial
and boundary conditions which had been considered to solve Richard (1931)'s
equation. This equation is the governing equation for the one-dimensional transient
flow in homogenous soils.
For comparison, results of the drying and the wetting hydraulic conductivity
functions, for different sand-gypsum mixtures tested under 100 kPa net normal
stress, are selected among the complete results obtained. These results are presented
in Figures 7.5 A, and B.
1.E-12
1.E-11
1.E-10
1.E-09
0 100 200 300
Hydra
uli
c co
nduct
ivit
y (
m/s
)
Matric suction (kPa)
(A) Drying process.
0%Gy.Doering
20% Gy.Doering
40% Gy.Doering
65% Gy.Doering
80% Gy.Doering
0% Gy. Gardner
20% Gy. Gardner
40% Gy. Gardner
65% Gy. Gardner
80% Gy. Gardner

202
Figure 7.5. A comparison between hydraulic conductivity functions found according
to Doering's approach and that found according to Gardner's approach
for different sand-gypsum mixtures tested under 100 kPa net normal
stress, (A) during drying process, (B) during wetting process.
One of the remarkable points arises from Figures 7.5 A, and B is that the
hydraulic conductivity functions calculated according to Gardner's analytical solution
are always lower than the corresponding functions calculated according to Doering's
solution by one to one and half an order, for both the drying and the wetting paths,
for all specimens that have different gypsum contents. This result is due to the
assumptions which had been adopted in these two approaches. In Gardner's
approach, the hydraulic conductivity of the specimen is assumed constant over the
whole applied suction increment, while in Doering's approach, each suction
increment is divided to small time steps and the hydraulic conductivity could be
calculated for each of these steps. In other words, the hydraulic conductivity
according to Doering's approach is considered variable with time during the period of
each suction increment.
As mentioned in Section 4.2.4.3, a time step of 4 hours, from the applying of
each suction increment, was taken to measure the hydraulic conductivity according
1.E-13
1.E-12
1.E-11
1.E-10
1.E-09
0 100 200 300 400
Hydra
uli
c co
nduct
ivit
y (
m/s
)
Matric suction (kPa)
(B) Wetting process
0%Gy. Doering
20% Gy. Doering
40% Gy. Doering
65% Gy.Doering
80% Gy.Doering
0% Gy. Gardner
20% Gy. Gardner
40% Gy. Gardner
65% Gy. Gardner
80% Gy. gardner

203
to Doering's method, whereas periodic monitoring of the outflow/inflow throughout
the whole period (around one week) of suction increment/decrement was taken to
determine the hydraulic conductivity by using Gardner's approach. The calculated
hydraulic conductivity value was considered to be corresponding to the mean of
matric suction or water content over the applied suction increment or decrement.
This value is usually smaller than that taken during the first 4 hours of the suction
increment period, because the outflow rate and then the hydraulic conductivity is
relatively high once the suction increment is applied and then decreases with time till
reach the suction equalization after approximately 7 days, for the specimens tested.
According to Green et al. (1998), the outflow of water from the specimen could
be categorized into three stages. The first stage starts with the beginning of the test,
at which the cumulative outflow volume is linearly proportional to the elapsed time,
since the saturated permeability of the ceramic plate controls the flow through the
system. This stage takes a short time, thereafter, the second stage is started, at which
the accumulated outflow volume is linearly proportional to the second root of
elapsed time (√t). At this stage, the core soil specimen behaves as a semi-infinite
column, and the soil permeability controls the flow. This stage takes the most of
suction increment period and it is ceased by the beginning of the third stage when the
top layer of the soil specimen starts to influence the flow.
According to the above categorization, it is worthy to mention that both
approaches adopted, Gardner's and Doering's approaches include the first and the
second stages of flow. However, the hydraulic conductivity calculated according to
Doering's approach is more affected by the first stage flow regime than that found
according to Gardner's approach. This is because the time of the first stage could be
significant within a time step of 4 hours, but it is negligible within the whole period
of the suction increment, which is around 7 days.
The other interesting point which can be noticed from Figures 7.5 A, and B is
the hydraulic conductivity functions calculated by Gardner's method are more
comparable and more consistent with the corresponding soil-water characteristic
curves when the matric suction of the SWCCs are represented on an ordinary scale.

204
7.4. Effect of net normal stress on SD-HCFs
In this section, the effect of net normal stress on the drying and the wetting
hydraulic conductivity functions are presented and discussed for sand-gypsum
mixtures having 0, 20, 40, 65, and 80% gypsum content. The specimens were
examined under four levels of net normal stress which were 0, 100, 200, and 400
kPa. The stress dependent-hydraulic conductivity functions (SD-HCFs) were
calculated here according to Gardner's approach. These functions are presented and
discussed first in terms of matric suction and then in terms of gravimetric water
content.
7.4.1. Hydraulic conductivity-matric suction relationships
The drying and the wetting hydraulic conductivity functions (HCFs) in terms of
matric suction, k(ψ), under different net normal stress levels are presented in Figures
7.6 A, B, C, D, and E for different sand-gypsum mixtures. The measured k(ψ)
corresponding to different levels of net normal stress are denoted by using four
different symbols and colours, while the drying and the wetting k(ψ) are designated
by using solid and open symbols, respectively.
1.E-13
1.E-12
1.E-11
1.E-10
1.E-09
0 100 200 300
Hydra
uli
c co
nduct
ivit
y (
m/s
)
Matric suction (kPa)
(A) 0% Gypsum content.
Drying; NNS = 0 kPa
Drying; NNS = 100 kPa
Drying; NNS = 200 kPa
Drying; NNS = 400 kPa
Wetting; NNS = 0 kPa
Wetting; NNS = 100 kPa
Wetting; NNS = 200 kPa
Wetting; NNS = 400 kPa

205
1.E-13
1.E-12
1.E-11
1.E-10
1.E-09
0 100 200 300
Hydra
uli
c co
nduct
ivit
y (
m/s
)
Matric suction (kPa)
(B) 20% Gypsum content.
Drying; NNS = 0 kPa
Drying; NNS = 100 kPa
Drying; NNS = 200 kPa
Drying; NNS = 400 kPa
Wetting; NNS = 0 kPa
Wetting; NNS = 100 kPa
Wetting; NNS = 200 kPa
Wetting; NNS = 400 kPa
1.E-13
1.E-12
1.E-11
1.E-10
1.E-09
0 100 200 300
Hydra
uli
c co
nduct
ivit
y (
m/s
)
Matric suction (kPa)
(C) 40% Gypsum content.
Drying; NNS = 0 kPa
Drying; NNS = 100 kPa
Drying; NNS = 200 kPa
Drying; NNS = 400 kPa
Wetting; NNS = 0 kPa
Wetting; NNS = 100 kPa
Wetting; NNS = 200 kPa
Wetting; NNS = 400 kPa

206
Figure 7.6. The drying and the wetting hydraulic conductivity functions in terms of
matric suction, according to Gardner's approach, tested under different
levels of net normal stress for sand-gypsum mixtures having (A) 0% ,
(B) 20%, (C) 40%, (D) 65%, and (E) 80% gypsum content by weight.
1.E-13
1.E-12
1.E-11
1.E-10
1.E-09
0 100 200 300
Hydra
uli
c co
nduct
ivit
y (
m/s
)
Matric suction (kPa)
(D) 65% Gypsum content.
Drying; NNS = 0 kPa
Drying; NNS = 100 kPa
Drying; NNS = 200 kPa
Drying; NNS = 400 kPa
Wetting; NNS = 0 kPa
Wetting; NNS = 100 kPa
Wetting; NNS = 200 kPa
Wetting; NNS = 400 kPa
1.E-13
1.E-12
1.E-11
1.E-10
1.E-09
0 100 200 300
Hydra
uli
c co
nduct
ivit
y (
m/s
)
Matric suction (kPa)
(E) 80% Gypsum content.
Drying; NNS = 0 kPa
Drying; NNS = 100 kPa
Drying; NNS = 200 kPa
Drying; NNS = 400 kPa
Wetting; NNS = 0 kPa
Wetting; NNS = 100 kPa
Wetting; NNS = 200 kPa
Wetting; NNS = 400 kPa

207
Figures 7.6 A, B, C, D, and E appear that the trends of both the drying and the
wetting k(ψ) under the four levels of net normal stress, for different sand-gypsum
mixtures, are consistent to each other. In general, at any given suction the variation in
the measured hydraulic conductivities for the drying conductivities or the wetting
ones is within half an order of magnitude. Thus, the influence of net normal stress do
not appears to affect the hydraulic conductivity of the specimens tested significantly.
This behaviour may be attributed to the matter that the tested specimens were
compacted to 90% of their maximum dry densities, which are considered relatively
high densities. The static loads required to reach these densities were much greater
than the applied net normal stress levels during hydraulic conductivity testing. Thus,
the specimens could be considered as pre-consolidated under pressure much more
than the applied one during hydraulic conductivity determination. For that reason, the
effect of the applied net normal stresses on the void ratio of the specimens and then
on the pore-size distribution is limited. Particularly, the effect of the applied net
normal stress on the void ratio can be evaluated to some degree from the saturated
consolidation test results which are presented in Chapter 5 (Figures 5.5 and 5.6).
Nevertheless, soil compressibility is strongly influenced by the level of the applied
suction. As soil suction increases, the compression index reduces distinctly, Cui et al.
(2010). As such, the effect of applied net normal stress on soil-pore structure and
then on hydraulic conductivity appeared to be limited.
In general, it can be noticed from Figures 7.6 A, B, C, D and E that the trends of
k(ψ) seem more distinguished at residual zone, where it can be noticed that the
increase of net normal stress to a level between 100 and 200 kPa causes some
increase in the hydraulic conductivity. Thereafter, the hydraulic conductivity show
clear decrease with further increasing in the applied net normal stress, reaching
lowest values at 400 kPa. This behaviour can be interpreted by considering two
conflicting factors. The first factor can be the anticipated increase in the water phase
continuity with increasing net normal stress (squeezing action). Thus, the hydraulic
conductivity increases with increasing net normal stress to some extent. The second
factor can be the substantial decrease in pore spaces and then in the water flow paths
of the soil specimen associated with the increase in net normal stress level. The
second factor can be demonstrated by referring to the stress-dependent soil-water
characteristic curves presented through Figures 6.2 to 6.6 which reveal clear decrease

208
in gravimetric water content of soil specimen with increasing the applied net normal
stress at any specific suction level. Furthermore, highly gypsiferous specimens seem
to be more influenced with increasing net normal stress level. This can be attributed
to the increase in the compressibility indices of those specimens associated with the
increasing of gypsum content, see Figure 5.6. In brief, both the net normal stress and
the gypsum content have clear effect on specimen water content which in turn
reflects on the hydraulic conductivity of that specimen.
Like the effect of gypsum content on the slope of k(ψ), Figures 7.6 A, B, C, D
and E reveal that there is a general tendency of an increase in the slope of both the
drying and the wetting k(ψ) with increasing net normal stress level for different sand-
gypsum mixtures. This behaviour is likely related to the decrease in water holding
capacity with increasing the net normal stress level, as could be noticed from Figure
6.9. This trend disagrees with that found by Ng and Leung (2012) as shown in Figure
7.2, where the slope of k(ψ) decreases with increasing the applied net normal stress
in the range from 0 to 78 kPa. However, results of Ng and Leung (2012) shown in
Figure 7.4 reveal that the slope of k( ) increases with increasing the average net
normal stress from 0 kPa to 39 kPa or to 78 kPa, and that it agrees with the results
found in this study.
7.4.2. Hydraulic conductivity-gravimetric water content relationships
As indicated in the previous sections, the main factors that affect the unsaturated
hydraulic conductivity are the water content of the soil mass, pores structure and
pore-size distribution. To eliminate the changes in water content related to the
changes in the applied net normal stress, the hydraulic conductivity function is
represented in this section as a function to water content, k(w). Figures 7.7 A, B, C,
D, and E show the drying and the wetting k(w) under different net normal stress for
different sand-gypsum mixtures.
Figures 7.7 A, B, C, D, and E reveal that at any specific water content the effect
of net normal stress on the drying or the wetting k(w) is so limited for different sand-
gypsum mixtures under investigation. This diminution in the effect of net normal
stress could be attributed first to the elimination of the implicit effect of water

209
content changes, since the water content in this representation is taken as the
independent variable. As a second reason, the effect of net normal stress on pore size
distribution is mostly diminished as long as the specimens were statically compacted
under loads much greater than the applied net normal stress levels.
1.E-13
1.E-12
1.E-11
1.E-10
1.E-09
6 8 10 12 14
Hydra
uli
c co
nduct
ivit
y (
m/s
)
Gravimetric water content (%)
(A) 0% Gypsum content.
Drying; NNS = 0 kPa
Drying; NNS = 100 kPa
Drying; NNS = 200 kPa
Drying; NNS = 400 kPa
Wetting; NNS = 0 kPa
Wetting; NNS = 100 kPa
Wetting; NNS = 200 kPa
Wetting; NNS = 400 kPa
1.E-13
1.E-12
1.E-11
1.E-10
1.E-09
6 8 10 12 14
Hydra
uli
c co
nduct
ivit
y (
m/s
)
Gravimetric water content (%)
(B) 20% Gypsum content.
Drying; NNS = 0 kPa
Drying; NNS = 100 kPa
Drying; NNS = 200 kPa
Drying; NNS = 400 kPa
Wetting; NNS = 0 kPa
Wetting; NNS = 100 kPa
Wetting; NNS = 200 kPa
Wetting; NNS = 400 kPa

210
1.E-13
1.E-12
1.E-11
1.E-10
1.E-09
6 8 10 12 14
Hydra
uli
c co
nduct
ivit
y (
m/s
)
Gravimetric water content (%)
(C) 40% Gypsum content.
Drying; NNS = 0 kPa
Drying; NNS = 100 kPa
Drying; NNS = 200 kPa
Drying; NNS = 400 kPa
Wetting; NNS = 0 kPa
Wetting; NNS = 100 kPa
Wetting; NNS = 200 kPa
Wetting; NNS = 400 kPa
1.E-13
1.E-12
1.E-11
1.E-10
1.E-09
5 10 15 20
Hydra
uli
c co
nduct
ivit
y (
m/s
)
Gravimetric water content (%)
(D) 65% Gypsum content.
Drying; NNS = 0 kPa
Drying; NNS = 100 kPa
Drying; NNS = 200 kPa
Drying; NNS = 400 kPa
Wetting; NNS = 0 kPa
Wetting; NNS = 100
kPa
Wetting; NNS = 200
kPa
Wetting; NNS = 400
kPa

211
Figure 7.7. The drying and the wetting stress dependent-hydraulic conductivity
functions in terms of gravimetric water content, according to Gardner's
approach for sand-gypsum mixtures having (A) 0% , (B) 20%, (C) 40%,
(D) 65%, and (E) 80% gypsum content by weight.
The other point which can be noticed from Figures 7.7 A, B, C, D, and E is that
the slope of the wetting k(w) is greater than that for the drying functions, and that is
more pronounced in the low water content values. The change in hydraulic
conductivity between the highest and lowest water content values is about three
orders of magnitude for the wetting functions, while it is around one and a half order
for the drying functions. This trend is consistent under different levels of net normal
stress, for all sand-gypsum mixtures under investigation.
7.5. Summary and concluding remarks
The SD-HCFs testing programme was designed to study the influence of
gypsum content, net normal stress, and drying-wetting cycle on the unsaturated
hydraulic conductivity function by using the modified stress controllable pressure
plate device. The results were analysed by following two of the transient outflow
methods, the one step outflow method by Doering (1965) and the multistep outflow
method by Gardner (1956).
1.E-13
1.E-12
1.E-11
1.E-10
1.E-09
5 10 15 20
Hydra
uli
c co
nduct
ivit
y (
m/s
)
Gravimetric water content (%)
(E) 80% Gypsum content.
Drying; NNS = 0 kPa
Drying; NNS = 100 kPa
Drying; NNS = 200 kPa
Drying; NNS = 400 kPa
Wetting; NNS = 0 kPa
Wetting; NNS = 100 kPa
Wetting; NNS = 200 kPa
Wetting; NNS = 400 kPa

212
Doering's one step outflow method was modified in this study to be applied in
successive increments, or decrements, in matric suction instead of applying one large
step. Each of these increments/decrements was considered as a one small step. This
modification yields the SD-SWCCs simultaneously with the SD-HCFs.
The SD-HCFs calculated by Gardner's method are always lower than the
corresponding functions calculated according to Doering's method by more than one
order of magnitude. In spite of that, the test results show that there is a clear increase
in hydraulic conductivity function with increasing gypsum content under different
levels of net normal stress, for both the drying and the wetting paths. This can be
attributed to the increase of water content, void ratio, and then the water flow paths
with increasing gypsum content.
The influence of net normal stress on the hydraulic conductivity of compacted
specimens seems depend mainly on the initial conditions of the prepared specimens.
Specimens compacted to high densities appear slight effect with the level of applied
net normal stress. However, highly gypsiferous specimens seem to be more
influenced with the increasing of net normal stress level due to their compressibility
characteristics.
For all specimens that have different gypsum contents, tested under different net
normal stress levels, there is clear hysteresis effects on the k(ψ) with wetting function
always lower than the corresponding drying one. Nevertheless, only minor hysteresis
is noticed on k(w), and that is likely because the water content hysteresis is
eliminated. The k(w) is more representative to the physical state of the soil mass,
whereas k(ψ) is more mimic and consistent with the SWCC. On the other hand,
experimentally, it was noticed from this study that the applicability of the outflow
transient methods may be limited corresponding to matric suction values between the
air-entry point and the residual point (the transition zone) only.

213
CHAPTER EIGHT
8: SHEAR STRENGHTH AND DEFORMATION
CHARACTERISTICS
8.1. Introduction
This chapter presents the shear strength and shear deformation characteristics of
various sand-gypsum mixtures tested under different loading conditions. The first
part of this chapter presents the direct shear test results carried out on saturated
specimens. The effect of gypsum content on saturated shear strength parameters (c'
& '), and on shear deformation characteristics are presented. In the second part, the
results of direct shear tests carried out on air-dried specimens under water content
controlled conditions are presented. Three different common criteria for describing
the shear strength of unsaturated soils are considered. The effects of gypsum content,
desaturation, and net normal stress level on the unsaturated shear strength parameters
of different sand-gypsum mixtures are discussed in detail. The peak/maximum shear
stress was adopted as the failure criteria.
8.2. Results of direct shear tests on saturated specimens
As mentioned in Section 3.4.8, the experimental programme includes a series of
direct shear box tests on saturated specimens. These tests were conducted for two
reasons: (i) to evaluate the effect of gypsum content on the stress-deformation
characteristics, contraction-dilation behaviour, and the saturated shear strength
parameters of the sandy soil tested, and (ii) to use the values of the saturated shear
strength as a reference to find the excess in shear strength resulting from
desaturation. Thus, the contribution of matric suction to shear strength for different
soil mixtures can be evaluated.

214
Single stage direct shear tests were carried out on initially saturated specimens
having gypsum percentages of 0, 10, 20, 30, 40, 50, 65, and 80% by weight. The
specimens were statically compacted, saturated, consolidated, and then sheared under
drained conditions at constant strain rate of 0.02 mm/min. Each soil mixture was
tested under three different normal stress levels (100, 200, 400 kPa).The results are
presented and discussed in the following sections.
8.2.1. Stress-strain characteristics
Typical direct shear box test results are best illustrated through the graphs of
shear stress versus horizontal displacement and the related graphs of vertical
deformation versus horizontal displacement. Figures 8.1 and 8.2 show these
relationships for eight sand-gypsum mixtures tested under 100 and 400 kPa normal
stress levels, respectively. The stress-strain relationships for specimens tested under
200 kPa normal stress, which exhibit an intermediate behaviour comparing to that
tested under the lowest (100 kPa) and highest (400 kPa) normal stress levels, are
shown in Appendix B, Figure B.1.
Different symbols are used to designate specimens having different gypsum
contents. On the lateral displacement-vertical deformation graphs, negative vertical
displacement values indicate the occurrence of dilation (an increase in volume of the
sheared specimen), whereas the positive values indicate contraction (a decrease in
volume of the sheared specimen).
Test results presented in Figures 8.1 and 8.2 exhibit that the shear strength and
the volume change characteristics are clearly influenced by the amount of gypsum in
the soil mixture. In addition, it can be noticed that the dilation or contraction
properties of the soil mixtures are highly dependent on the applied normal stress
levels. This behaviour agrees with the review of Bolton (1986) who mentioned that
both effective stress and soil density affect the rate of dilatancy of soils and thereby
their strength parameters.

215
Figure 8.1. Stress-deformation characteristic curves for different sand-gypsum
mixtures tested under normal stress of 100 kPa, (A) Shear stress versus
lateral displacement, and (B) Vertical deformation versus lateral
displacement.
0
20
40
60
80
100
120
0 2 4 6 8 10 12
Shea
r st
ress
(kP
a)
Lateral displacement (mm)
(A) Lateral displacement-shear stress curves.
0% Gypsum
10% Gypsum
20% Gypsum
30% Gypsum
40% Gypsum
50% Gypsum
65% Gypsum
80% Gypsum
-0.20
-0.15
-0.10
-0.05
0.00
0.05
0.10
0 2 4 6 8 10 12
Ver
tica
l dis
pla
cem
ent
(mm
)
Lateral displacement (mm)
(B) Lateral displacement-vertical deformation curves .
0% Gypsum
10% Gypsum
20% Gypsum
30% Gypsum
40% Gypsum
50% Gypsum
65% Gypsum
80% Gypsum
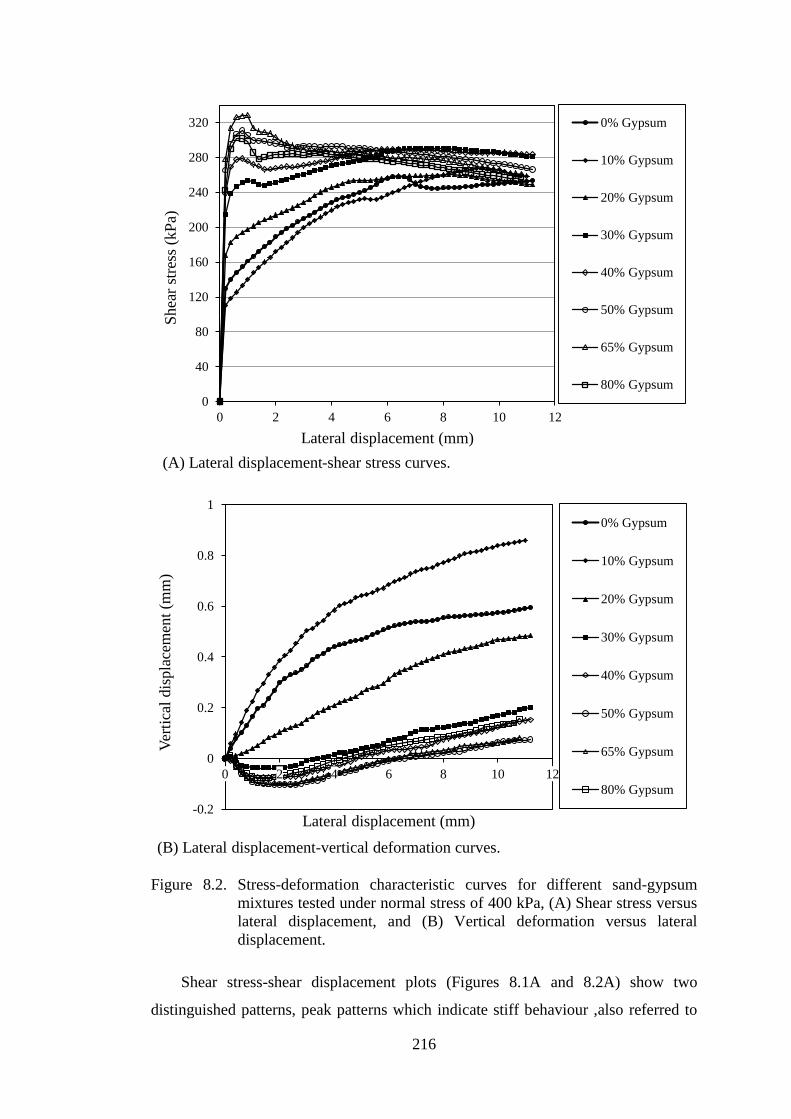
216
Figure 8.2. Stress-deformation characteristic curves for different sand-gypsum
mixtures tested under normal stress of 400 kPa, (A) Shear stress versus
lateral displacement, and (B) Vertical deformation versus lateral
displacement.
Shear stress-shear displacement plots (Figures 8.1A and 8.2A) show two
distinguished patterns, peak patterns which indicate stiff behaviour ,also referred to
0
40
80
120
160
200
240
280
320
0 2 4 6 8 10 12
Sh
ear
stre
ss (
kP
a)
Lateral displacement (mm)
(A) Lateral displacement-shear stress curves.
0% Gypsum
10% Gypsum
20% Gypsum
30% Gypsum
40% Gypsum
50% Gypsum
65% Gypsum
80% Gypsum
-0.2
0
0.2
0.4
0.6
0.8
1
0 2 4 6 8 10 12
Ver
tica
l dis
pla
cem
ent
(mm
)
Lateral displacement (mm)
(B) Lateral displacement-vertical deformation curves.
0% Gypsum
10% Gypsum
20% Gypsum
30% Gypsum
40% Gypsum
50% Gypsum
65% Gypsum
80% Gypsum

217
as strain softening behaviour (Mofiz et al., 2004), and non-peak patterns which
indicate ductile behaviour , also referred to as strain hardening behaviour (Mofiz et
al., 2004). Specimens with high gypsum content exhibit peak patterns, while those of
low gypsum content exhibit non-peak patterns.
More specifically, Figure 8.1A indicates that the shear displacement
corresponding to maximum/ peak shear stress shows a clear decrease with increasing
gypsum content. On the other hand, the comparison of lateral displacement-shear
stress plots of the specimens tested under 400 kPa normal stress (Figure 8.2A) with
those tested under 100 kPa (Figure 8.1A) demonstrates that the shear displacement
corresponding to peak shear stress exhibits an increase with increasing the applied
normal stress. In other words, the specimen ductility increases as the applied normal
stress is increased. The lateral displacement required to reach the maximum/peak
shear stress at different normal stress levels for the eight sand-gypsum mixtures
tested are presented in Table 8.1.
Table 8.1. Lateral displacement corresponding to maximum shear stress under
different normal stress levels for different sand-gypsum mixtures.
Gypsum
content (%)
Lateral displacement related to maximum/peak shear stress (mm) Applied normal stress (kPa)
100 200 400
0 7.4 9.4 6.6
10 6.4 7.6 9.2
20 0.4 7.8 8.0
30 1.0 7.6 8.2
40 0.6 6.6 6.8
50 0.8 0.6 0.8
65 0.6 0.6 1.0
80 0.4 0.6 0.6
As expected, highly gypsiferous specimens exhibit higher shear strength than
specimen with low gypsum content. However, significant changes in the stress
deformation characteristics can be noticed when gypsum content increases over 20%
by weight (Figures 8.1 and 8.2). Specimens having gypsum content more than 50%
exhibit stiff behaviour with peak shear stress achieved at low shear strain, mostly not
exceeded 1%. The shear stress of these specimens reveals reduction after the peak
value, reaching to a yield stress and then goes to relatively steady stress value at
higher shear displacements. Typically, similar strain softening trend could be noticed

218
as well with shearing of dense sand specimens. On the other hand, specimens without
gypsum or low gypsum contents show ductile behaviour or what is called also strain
hardening behaviour where the shear stress gradually increases to reach a maximum
value at relatively large shear displacements.
It can be concluded from Figures 8.1A and 8.2A that the gypsum content at
which the soil shearing behaviour is changed from ductile behaviour to stiff
behaviour is about 30 % for the sandy soil tested. This gypsum content is just enough
to fill the voids of the original sandy soil and yields the sand-gypsum mixture to be at
the minimum porosity or minimum void ratio (see Figure 5.4 and Table 5.1). At 30%
gypsum content and more, the structure of the soil mixture is governed by gypsum
portion, and then, gypsum characteristics will dominate the overall mixture
properties.
At relatively small shear displacement, stress patterns (shear stress-shear
displacement patterns) of different sand-gypsum mixtures show clear distinctions as
can be noticed from Figures 8.1A and 8.2A. However, at relatively large shear
displacements, all specimens tend to come to nearly the same steady or critical shear
stress value. The stress pattern of highly gypsiferous specimens show clear decrease
with increasing shear displacement, while the pattern of low gypsum content
specimens show an increase to approach the first pattern.
At initial shearing stage, relatively linear shear stress-shear displacement
relationship with well defined straight line segment can be noticed for all sand-
gypsum mixtures tested (Figures 8.1A and 8.2A). The slope of the initial straight-line
is referred to as "the initial shear stiffness (Ki)", and it has units of kPa/mm. This
terminology has been used by many researchers such as Lun (2005) and Vassallo et
al. (2007). In practical geomechanics, the initial shear stiffness is commonly used in
characterisation of soil stiffness. However, complete characterisation of an isotropic
elastic soil material requires the determination of two possible stiffness parameters,
Young's modulus E and Poisson's ratio ν, or shear modulus G and bulk modulus K
(Clayton, 2011). A sound evaluation of stiffness parameters at small strain is
essential, if realistic predictions of the soil movements that may affect adjacent
infrastructure are to be made (Clayton, 2011).

219
Figures 8.1A and 8.2A reveal that the initial shear stiffness has clear
dependency on both gypsum content and the applied normal stress level. The initial
shear stiffness for different sand-gypsum mixtures corresponding to different normal
stress levels are defined and presented in Figure 8.3. This figure shows clear increase
in the initial shear stiffness associated with the increase in gypsum content.
Furthermore, remarkable increase in the initial shear stiffness could be noticed with
increasing the applied normal stress level. Similar trends have been reported by
Clayton et al.(2010) after studying the cementation effect of methane hydrate
deposition on the very small strain stiffness moduli (shear modulus Go and Young's
modulus Eo) of a selection of sand-sized materials having different grain sizes,
shapes and gradings. They noticed clear increases in the stiffness moduli at very
small strain with increasing the proportion of methane hydrate deposited and/or with
increasing the mean effective confining stress.
Figure 8.3. Effect of gypsum content on initial shear stiffness of specimens tested
under different normal stress levels.
Best explanation and interpretation of the stress-strain behaviour needs to
consider closely the dilation/contraction behaviour associated with the shearing
process. The vertical displacement versus shear displacement plots (Figures 8.1B and
8.2B) reveal that most sand-gypsum mixtures exhibit dilation, especially at lower
normal stress level, with an amount shows a clear increase with increasing gypsum
content. This interprets the strain softening behaviour and the increase of the initial
0
200
400
600
800
1000
1200
1400
1600
0 20 40 60 80 100
Init
ial
shea
r st
iffn
ess
(kP
a /m
m)
Gypsum content (%)
400 kPa Normal Stress 200 kPa Normal Stress 100 kPa Normal Stress
Best-fitted curves
Experimental data points

220
shear stiffness with increasing gypsum content in the soil mixture. As well as,
Figures 8.1B and 8.2B indicate that the amount of dilation gradually decreases with
the increasing of the applied normal stress level. Thus, at 400 kPa normal stress
level, the contraction becomes more pronounced for most sand-gypsum mixtures,
even though, the initial volume change for most specimens tested were dilatant
behaviour. That is why soil mixtures exhibit relatively more ductility at higher
normal stress levels.
The shear stress-lateral displacement curves (Figures 8.1A and 8.2A) are
consistent with their corresponding vertical displacement-lateral displacement curves
(Figures 8.1B and 8.2B). Thus, the maximum rate of dilatancy is approximately
coincided with the peak shear stress point, whereas the dilatancy rate at the study
stage (critical state) is equal to zero.
8.2.2. Effect of gypsum content on saturated shear strength
The peak/maximum shear stress for different sand-gypsum mixtures tested
under 100, 200, and 400 kPa normal stress levels were defined from shear stress-
lateral displacement plots (Figures 8.1A, B.1A, and 8.2A). These values which were
adopted as the soil shear strength values are presented against gypsum content in
Figure 8.4.
Figure 8.4. Effect of gypsum content on peak/maximum shear stress for specimens
tested under different normal stress levels.
0
50
100
150
200
250
300
350
0 10 20 30 40 50 60 70 80 90 100
Pea
k /
max
imu
m s
hea
r st
ress
(kP
a)
Gypsum content (%)
N=400kPa
N=200kPa
N=100kPa
Best-fitted curves
Experimental
data points
N: Normal stress

221
Figure 8.4 shows a clear increase in the peak/maximum shear stress with
increasing gypsum content. Consistent trends corresponding to different normal
stress levels can be noticed. This behaviour agrees with that found by Seleam (1988)
and Al-Qaissy (1989) for gypsiferous sandy soil and gypsiferous clayey soil,
respectively (see Section 2.2.2).
Results of chilled mirror hygrometer tests which are presented in Section 5.5
show that there is a clear increase in osmotic suction of the sandy soil with increasing
gypsum content, and this may lead to an increase in the saturated shear strength.
Peterson (1990) has pointed out that the increasing of osmotic suction causes clear
increase to the cohesion term (the first term) in the modified Mohr-Coulomb shear
strength equation (Equation 2.20) and mild decrease to the contribution of matric
suction to the shear strength (the third term).
8.2.3. Mohr-Coulomb failure envelopes and shear strength parameters
The highest level of shear stress measured in the direct shear test under a given
normal stress is defined as the "peak strength". With continued shear displacement
there is typically a loss of strength. The shear stress at any given displacement past
the point of peak strength could be referred to as "post peak strength", and it is
usually differentiated by specifying the corresponding shear displacement, Thiel
(2001). The strength at which there is no further strength loss, no volume changes,
with continued displacement is called the "steady state strength or critical state
strength". In practical applications, the decision whether to use peak or study shear
strengths for a stability analysis depends on the potential relative shear displacement
for the specified problem under consideration. To study the effect of gypsum content
on the mechanical properties of the sandy soil used in this study, the peak shear
strength was adopted. The peak shear strength values for different sand-gypsum
mixtures are presented in Appendix B, Table B.1.
To define the peak friction and cohesion parameters, the peak shear stress is
plotted against the normal stress in Figure 8.5, for different sand-gypsum mixtures.
Linear shear strength envelopes are considered over the range of the applied normal
stress levels (100 to 400 kPa), and a best fit lines are drawn. The peak angle of

222
internal friction is defined from the slope of the envelope line and the cohesion is
defined from the y-axis intercept, for different sand-gypsum mixtures.
Figure 8. 5. Mohr-Coulomb failure envelopes of different sand-gypsum mixtures.
The peak shear strength parameters for different sand-gypsum mixtures obtained
from Figure 8.5 are presented in Figure 8.6, and their numerical values are shown in
Appendix B, Table B.2. Figure 8.6 reveals that the increase of gypsum causes a clear
increase in the effective cohesion up to 65% gypsum content by weight, and then the
cohesion shows a slight decrease at a gypsum content of 80%. Likewise, the general
tendency of the friction angle shows moderate increase with increasing gypsum
content up to 65%, and then a slight decrease could be noticed at higher gypsum
content. This trend highly agrees with results of Seleam (1988) on a gypsiferous
sandy soil, and agrees to some extent with results of Al-Qaissy (1989) on a
gypsiferous clayey soil (see Section 2.2.2). The trend of shear strength parameters
shown in Figure 8.6 may be attributed to the matter that the cohesion between
gypsum-gypsum particles is greater than gypsum-sand particles and this in turn is
greater than sand-sand particles. On the other hand, the initial increase in the angle of
0
100
200
300
400
0 100 200 300 400 500
Pea
k s
hea
r st
ress
( f
) kP
a
Normal stress ( n) kPa
0% Gypsum
20% Gypsum
40% Gypsum
50% Gypsum
65% Gypsum
80% Gypsum
Experimental
data points

223
internal friction with increasing gypsum content may be attributed in part to the
decrease in void ratio associated with the increase of gypsum content, as shown in
Figure 5.4. In other words, gypsum particles act as filling material to pore spaces of
the sandy soil up to 30% gypsum content when the void ratio reaches a minimum
value.
Figure 8.6. Effect of gypsum content on saturated shear strength parameters.
8.3. Results of direct shear tests on unsaturated specimens
The main objective of these tests is to examine the effect of gypsum content and
the effect of desaturation on the shear strength of the sandy soil. As described earlier
in Section 3.4.9, five extensive series of tests on five sand-gypsum mixtures having
gypsum contents of 0, 20, 40, 65, and 80% by weight were carried out. Each soil
mixture was tested at various water contents under four net normal stress levels (100,
200, 300, and 400 kPa). These tests were carried out in conventional shear box
device under water content controlled conditions instead of suction controlled
conditions. The room temperature was controlled at 20-22°C and the humidity at 40-
50%.The specimens were sheared at a rate of 0.50 mm/min under undrained
conditions for the water phase while the air phase was allowed to be under
atmospheric conditions (see Section 3.4.9.5 for detailed procedure). The peak shear
stress or the maximum shear stress was adopted as a failure criterion.
26
28
30
32
34
36
38
0
10
20
30
40
50
60
0 20 40 60 80 100
Angle
of
inte
rnal
fri
ctio
n (
Deg
.)
Cohes
ion (
kP
a)
Gypsum content (%)
Cohesion
Angle of internal friction
Best-fitted curves
Experimental data points

224
The test results were incorporated with the data obtained from the stress
dependent soil-water characteristic curve (SD-SWCC) tests to evaluate the shear
strength as a function to the matric suction (see Section 3.4.9.6). Three main
approaches were considered in analysing the test results which are the single stress-
state variable approach (Bishop, 1959), the two stress-state variables approach
(Fredlund and Morgenstern, 1977), and the true effective stress concept introduced
by Lu and Likos (2006). The contribution of matric suction to shear strength ( ), the
internal friction angle related to matric suction ( ), the effective stress parameter
(χ), the suction stress ( ), and the true effective stress ( ) were evaluated for
different sand-gypsum mixtures under different loading conditions. These parameters
are presented and discussed in the following sections.
8.3.1. Shear strength-water content relationships
Typical results of the variation of shear strength (peak or maximum shear stress)
with gravimetric water content at four levels of net normal stress are presented in
Figures 8.7 A, B and C. Three different sand-gypsum mixtures are considered. These
mixtures had gypsum contents of 20, 40, and 80% by dry weight. Results of other
two sand-gypsum mixtures (0 and 65% gypsum content) are presented in Figures B.2
A and B, Appendix B.
0
50
100
150
200
250
300
350
400
0 4 8 12 16 20 24
Pea
k o
r m
axim
um
shea
r st
ress
(kP
a)
Water content (%)
(A) 20% Gypsum content
NNS=400 kPa
NNS=300 kPa
NNS=200 kPa
NNS=100 kPa
NNS: Net normal stress
Experimental data
points
Best-fitted curves

225
Figure 8.7. Peak or maximum shear stress vs. water content at four levels of net
normal stress for sand-gypsum mixtures having (A) 20%, (B) 40%, (C)
80% gypsum content by weight.
0
50
100
150
200
250
300
350
400
0 4 8 12 16 20 24
Pea
k o
r m
axim
um
sh
ear
stre
ss (
kP
a)
Water content (%)
(B) 40% Gypsum content
NNS=400 kPa
NNS=300 kPa
NNS=200 kPa
NNS=100 kPa
NNS: Net normal stress
Experimental data
points
Best-fitted curves
0
50
100
150
200
250
300
350
400
0 4 8 12 16 20 24 28 32
Pea
k o
r m
axim
um
shea
r st
ress
(kP
a)
Water content (%)
(C) 80% Gypsum content
NNS=400 kPa
NNS=300 kPa
NNS=200 kPa
NNS=100 kPa
NNS: Net normal stress
Experimental data
points
Best-fitted curves

226
The relationship between peak shear stress and water content is curvilinear over
the range of water content tested, with a peak shear stress increasing as the water
content decreases (Figures 8.7 A, B and C). The degree of curvature seems to be
related to the gypsum content and to the level of the applied net normal stress. As
gypsum content increases, the peak shear stress-water content curve becomes flatter
showing low degree of curvature. Ultimately, at gypsum content of 80%, the peak
shear stress -water content relationship approaches linear pattern, especially at net
normal stress level of 400 kPa. As well as, for all gypsum contents, the increase of
the net normal stress causes the peak shear stress-water content curve to be flatter.
Test results presented in Figures 8.7 A, B and C show also that the slope of the
peak shear stress-water content curve, or the rate of increasing peak shear stress with
decreasing water content, seems to be affected by each of the gypsum content, net
normal stress, and the stage of desaturation. At any specified net normal stress and
water content, the slope of peak shear stress-water content curve reveals clear
decrease with increasing gypsum content. Thus, the effect of desaturation (increasing
of matric suction) in increasing the shear strength decreases with increasing gypsum
content in the soil mixture.
For all gypsum contents, the slope of peak shear stress-water content curve at
any specified water content shows apparent decrease with increasing the level of the
applied net normal stress (Figures 8.7 A, B and C). Thus, the contribution in the
shear strength resulting from desaturation exhibits some decrease with increasing the
applied net normal stress level. On the other hand, the general slope of peak shear
stress-water content curve has relatively small value near saturation and then
gradually increases with decreasing water content reaching a maximum constant
value near residual water content.
8.3.2. Failure envelopes in plane of net normal stress-shear stress
A series of nearly parallel failure envelopes in the plane of net normal stress-
shear stress were constructed corresponding to different water contents (different
matric suction) for five sand-gypsum mixtures. These envelopes are presented in
Figures 8.8 A, B, C, D and E. The matric suction values corresponding to different

227
water contents were estimated by using the SD-SWCC tests data as described in
Section 3.4.9.6.
0
50
100
150
200
250
300
350
400
0 100 200 300 400 500 600
Pea
k o
r m
axim
um
sh
ear
stre
ss (
kP
a)
Net normal Stress (kPa)
(A) 0% Gypsum content
WC =6.0 %
MS=920 kPa (WC=7.0%)
MS=315 kPa (WC=7.8%)
MS=32 kPa (WC=9.8%)
MS=0kPa (Saturated)
MS: Matric suction
WC: Water content
Experimental data points
0
50
100
150
200
250
300
350
400
0 100 200 300 400 500 600
Pea
k o
r m
axim
um
shea
r st
ress
(kP
a)
Net normal Stress (kPa)
(B) 20% Gypsum content
MS=591 kPa (WC=6.7%)
MS=247 kPa (WC=7.5%)
MS=128 kPa (WC=8.2%)
MS=66 kPa (WC=9.2%)
MS=36 kPa (WC=10.9%)
MS=0 kPa (Saturated)
MS: Matric suction
Experimental data points

228
0
50
100
150
200
250
300
350
400
0 100 200 300 400 500 600
Pea
k o
r m
axim
um
sh
ear
stre
ss (
kP
a)
Net normal Stress (kPa)
(C) 40% Gypsum content
MS=298 kPa (WC=6.6%)
MS=135 kPa (WC=7.7%)
MS=80 kPa (WC=9.5%)
MS=64 kPa (WC=10.9%)
MS=52 kPa (WC=12.7%)
MS=0 kPa (Saturated)
MS: Matric suction
WC: Water content
Experimental data points
0
50
100
150
200
250
300
350
400
0 50 100 150 200 250 300 350 400 450 500
Pea
k o
r m
axim
um
shea
r st
ress
(kP
a)
Net normal Stress (kPa)
(D) 65% Gypsum content
MS=503 kPa (WC=5.7%)
MS=268 kPa (WC=6.6%)
MS=195 kPa (WC=7.3%)
MS=143 kPa (WC=8.2%)
MS=116 kPa (WC=9.0%)
MS=70 kPa (WC=13.3%)
MS=0 kPa (Saturated)
MS: Matric suction
WC: Water content
Experimental data points

229
Figure 8.8. Shear strength failure envelopes at different water contents (different
matric suctions) for sand-gypsum mixtures having (A) 0%, (B) 20%,
(C) 40%, (D) 65%, and (E) 80% gypsum content by weight.
Like the saturated shear strength envelopes, the shear strength envelopes for
unsaturated specimens show good linearity over the normal stress range of 100 to
400 kPa. The linearity between peak shear stress and normal stress is an indication of
the existence of an apparent cohesion and friction angle in terms of total stresses. For
all tested sand-gypsum mixtures, failure envelopes of unsaturated specimens show
good consistency to each other at various water contents. Even though, results of
unsaturated specimens show relatively more scattering when compared to the
saturated test results that appear fairly unique.
It can be noticed from Figure 8.8E for 80% gypsum content mixture that the
shear strength envelopes at different water contents converge towards an intersecting
point when the net normal stress level approaches 400 kPa. This behaviour means
that at this level of net normal stress, there is no effect to desaturation or matric
suction in increasing the shear strength for the soil mixture have 80% gypsum
content.
0
50
100
150
200
250
300
350
400
0 100 200 300 400 500 600
Pea
k o
r m
axim
um
sh
ear
stre
ss (
kP
a)
Net normal Stress (kPa)
(E) 80% Gypsum content
MS=290 kPa (WC=5.6%)
MS=248 kPa (WC=6.5%)
MS=150 kPa (WC=7.5%)
MS=116 kPa (WC=8.9%)
MS=85 kPa (WC=11.9%)
MS=0 kPa (Saturated)
MS: Matric suction
WC: Water content
Experimental data points

230
Figures 8.8 A, B, C, D and E reveal also that the decrease of specimen water
content causes the apparent cohesion to increase noticeably and the friction angle to
decrease moderately. This behaviour makes the effect of desaturation in increasing
the shear strength is more pronounced at low levels of net normal stress. The effect
of desaturation on the apparent shear parameters is quantified and discussed in detail
in the following section.
8.3.3. Apparent cohesion and friction angle versus water content
The shear strength parameters in terms of apparent cohesion intercept and total
stress friction angle were determined for five sand-gypsum mixtures, at different
water contents, by using the best fitted-straight line failure envelopes presented in
Figures 8.8 A, B, C, D and E. These parameters are presented in Figure 8.9 as
functions to the gravimetric water content. It can be noticed that the apparent
cohesion of different sand-gypsum mixtures exhibits remarkable increase as water
content decreases, with an increasing rate dramatically increases at low water
contents. On the contrary, the apparent friction angle of those sand-gypsum mixtures
shows mild decrease with deceasing water content.
Figure 8.9. Apparent cohesion and apparent friction angle versus gravimetric water
content for different sand-gypsum mixtures.
5
10
15
20
25
30
35
0
50
100
150
200
250
300
4 6 8 10 12 14 16 18 20
Ap
par
ent
angle
of
inte
rnal
fr
icti
on (
Deg
.)
Ap
par
ent
coh
esio
n (
kP
a)
Gravimetric water content %
c - 80% Gypsum
c - 65% Gypsum
c - 40% Gypsum
c - 20% Gypsum
c - 0% Gypsum
ϕ - 0% Gypsum
ϕ - 20% Gypsum
ϕ - 40% Gypsum
ϕ - 65% Gypsum
ϕ - 80% Gypsum

231
As with the saturated cohesion, there is a general tendency to the apparent
cohesion function to increase with increasing gypsum content reaching a highest
level at 65% gypsum content. Then, the apparent cohesion function exhibits a
decrease with further increase in gypsum content. This behaviour can be attributed to
matter that the cementation bonds between gypsum-gypsum particles are greater than
the cementation bonds between gypsum-sand particles and these in turn are greater
than the bonds between sand-sand particles.
It is recognised from the stress-deformation characteristics of the compacted
saturated specimens presented in Section 8.2.1 that the contribution of cementation
bonds to the soil cohesion and then to the shear strength may be significant when the
shear stress-shear displacement curve has a peak corresponding to small lateral
displacement. On the other hand, the cementation cohesion of sand-gypsum mixtures
that have non-peak behaviour may be insignificant, especially when the shear
displacement required to mobilize the maximum shear stress is much more than the
shear displacement required to mobilize the cementation cohesion. When large shear
displacement is required to mobilize the maximum shear stress, the majority of
cementation bonds would have been destroyed. In other words, for sand-gypsum
mixtures of non-peak behaviour, the strength due to cohesion is mobilized at a faster
rate than the strength due to frictional component. As a conclusion, when the two
components of the shear strength are mobilized at nearly the same lateral
displacement, the cementation bonds would be significant, otherwise it would be not.
8.3.4. Failure envelopes in plane of matric suction-shear stress
Figures 8.10 A, B, C, D, and E present a summary of the results obtained from
about 150 direct shear tests on unsaturated specimens, at different controlled water
contents, of five sand-gypsum mixtures. The shear strength data of the unsaturated
specimens were incorporated with the results of stress-dependent soil-water
characteristic curve tests which were carried out on identical five sand-gypsum
mixtures, at identical levels of net normal stress. Thus the matric suction values
corresponding to the controlled water content values were estimated by using the
mathematical equation of the SD-SWCCs with the fitting parameters which are
presented in Table 6.2. Thus, the shear strength results are presented as plots of peak

232
or maximum shear stress versus the estimated matric suction at four constant net
normal stress levels, for five sand-gypsum mixtures.
0
50
100
150
200
250
300
350
400
0 200 400 600 800 1000
Pea
k o
r m
axim
um
sh
ear
stre
ss (
kP
a)
Matric suction (kPa)
(A) 0% Gypsum content
400 kPa NNS
300 kPa NNS
200 kPa NNS
100 kPa NNS
NNS: Net
normal stress
0
50
100
150
200
250
300
350
400
0 100 200 300 400 500 600
Pea
k o
r m
axim
um
shea
r st
ress
(kP
a)
Matric suction (kPa)
(B) 20% Gypsum content
400 kPa NNS
300 kPa NNS
200 kPa NNS
100 kPa NNS
NNS: Net
normal stress

233
0
50
100
150
200
250
300
350
400
0 50 100 150 200 250 300 350
Pea
k o
r m
axim
um
shea
r st
ress
(kP
a)
Matric suction (kPa)
(C) 40 % Gypsum content
400 kPa NNS
300 kPa NNS
200 kPa NNS
100 kPa NNS
NNS: Net
normal stress
0
50
100
150
200
250
300
350
400
0 100 200 300 400 500 600 700
Pea
k o
r m
axim
um
sh
ear
stre
ss (
kP
a)
Matric suction (kPa)
(D) 65% gypsum content
400 kPa NNS
300 kPa NNS
200 kPa NNS
100 kPa NNS
NNS: Net
normal stress

234
Figure 8.10. Shear strength failure envelopes with respect to matric suction under
four constant net normal stress levels for sand-gypsum mixtures having
(A) 0%, (B) 20%, (C) 40%, (D) 65%, and (E) 80% gypsum content by
weight.
As discussed earlier in Section 3.4.9.5, it is worthy to mention here that the
estimated values of matric suction are essentially very close to the real matric suction
values at the end of consolidation stage while some changes may be anticipated
during shearing process. However, it is assumed that a relatively fast rate of shearing
(which was adopted to be 0.5 mm/min.) results in a small change in matric suction
during the shearing stage. Similar assumption for analyses of shear strength test
results has been used by Vanapalli et al. (2000) and Vanapalli et al. (2002).
The shear strength envelopes shown in Figures 8.10 A, B, C, D, and E have
some nonlinearity with respect to the matric suction axis, especially when a relatively
large range of soil suction is considered. The general pattern of these curves
comprises of two curvilinear segments, an initial high curvature segment with
relatively high average slope followed by a second relatively low curvature segment
with smaller average slope. The transition from the high curvature to the low
curvature segment of the envelope appears to occur at an estimated matric suction of
0
50
100
150
200
250
300
350
400
0 100 200 300 400
Pea
k o
r m
axim
um
sh
ear
stre
ss (
kP
a)
Matric Suction (kPa)
(E) 80% Gypsum content
400 kPa NNS
300 kPa NNS
200 kPa NNS
100 kPa NNS
NNS:Net
normal stress

235
about 130 kPa for the five tested sand-gypsum mixtures. This transition point is close
to the residual matric suction values of those soil mixtures (see Figures 6.2 to 6.6).
The transition may be resulted from the diminishing contribution of matric suction to
the shear strength as the water content of the specimen approaches the residual water
content. At residual stage, the water phase starts to be discontinuous and the soil-
water system transforms from capillary mechanism to hydration mechanism (Lu and
Likos, 2004; Ng and Menzies, 2007). As a result, the cross-sectional area through
which the water phase acts is decreased, and as such, an increase in the matric
suction is not as effective in increasing the shear strength as in the capillary stage
(Fredlund and Rahardjo, 1993; Vanapalli et al., 1999). The nonlinearity of the failure
envelope with respect to matric suction has been addressed and discussed in detail by
Fredlund et al. (1987).
The other remarkable point which can be noticed from the failure envelopes in
Figures 8.10 A, B, C, D, and E is that the overall envelope curvature exhibits clear
decrease with increasing gypsum content in the sand-gypsum mixture. This
behaviour can be noticed at all levels of net normal stress. The matric suction failure
envelopes of soil mixtures having gypsum content of 65% and 80% appear good
linearity over the entire matric suction range of 0 to 400 kPa, at various levels of net
normal stress.
Furthermore, the overall slope of the failure envelopes presented in Figures 8.10
A, B, C, D, and E reveal slight increase with increasing gypsum content up to 40%
by weight, then the slope shows clear decrease with further increasing of gypsum
content in the soil mixture. This behaviour is quantitatively evaluated in the next
section. The effectiveness of the matric suction in contributing an increase in the
shear resistance seems highly dependent on the gypsum content. Matric suction
contribution in shear strength shows a noticeable decrease at gypsum content of 80%
by weight, especially at higher levels of net normal stress (Figure 8.10 E).
It is apparent from Figures 8.10 A, B, C, D, and E that consistent relationships
are existed at different net normal stress levels between the peak or maximum shear
stress and the matric suction which is estimated from the SD-SWCC tests. This
consistency confirms the reliability and the viability of the proposed approach of

236
testing and analysing the shear strength parameters of unsaturated compacted
specimens. The proposed procedures utilize standard laboratory direct shear
equipment and take a relatively short time to be completed. Thus, it offers an easy
and convenient alternative way for the determination of the unsaturated shear
strength parameters.
8.3.5. Effect of gypsum content on and χ
The shear strength of an unsaturated soil consists of an effective cohesion
component (c'), frictional component resulting from net normal stress ( - ua), and
the independent contribution to shear strength resulting from matric suction (ua – uw),
Fredlund and Rahardjo (1993), Ng and Menzies (2007). The first two components
are well defined through the saturated shear strength parameters, c' and . The
contribution of matric suction to the shear strength can be viewed in terms of being
either part of the frictional component or part of the cohesional component of the soil
shear strength (Lu and Likos, 2004). As mentioned in Sections 2.6 and 3.4.9.6, the
shear strength contribution from matric suction could be characterized by b which is
a friction angle with respect to matric suction (Fredlund and Morgenstern, 1977) or
by the effective stress parameter χ (Bishop, 1959) which represent the matric suction
contribution to the effective stress and then to the shear strength through the
saturated friction angle.
To evaluate b the shear strength failure envelopes with respect to matric
suction, which are presented earlier in Figures 8.10 A, B, C, D, and E, were best
fitted by to two linear segments. The first segment covers the range of matric suction
from 0 to 130 kPa, while the second segment starts from 130 kPa suction value and
extends to residual range. Thus, two values of b were defined from each matric
suction failure envelope, b at capillary zone and
b at residual zone. These values
which were defined for different sand-gypsum mixtures, at four levels of net normal
stress, are presented in Figures 8.11 A and B. Several procedures for handling the
nonlinearity of the shear stress versus matric suction failure envelope have been
proposed by Fredlund et al. (1987).One of these procedures is to discretize the failure
envelope into several linear segments if the envelope is highly nonlinear, and this
may agrees to some extend with the proposed procedure in this study.

237
It can be noticed from Figures 8.11 A and B that b at capillary zone shows
noticeable decrease with increasing gypsum content under various levels of net
normal stress. These b angles commence at values of 33.8, 36.9, 31.0, and 23.7,
corresponding to net normal stress levels of 100, 200, 300, and 400 kPa, for sandy
soil without gypsum and decrease with increasing gypsum content reaching values of
8.0, 4.6, 2.9, and 1.7, respectively for soil mixture has 80% gypsum content.
Comparing with saturated friction angle value of 32.1 for sandy soil without gypsum,
the values of b
at capillary zone for the same soil are 33.8 and 36.9 under 100 and
200 kPa net normal stress levels, respectively. As such, at this case, an increase in
matric suction is more effective in increasing the shear strength as is an increase in
the net normal stress.
On contrary to the capillary zone, Figure 8.11 B shows that the values of b
at
residual zone exhibit remarkable increase with increasing gypsum content, under
various levels of net normal stress, reaching maximum values at around 50% gypsum
content and then clear decrease can be noticed for further increase in gypsum
content.
Considering b values at capillary zone and using Equation 3.21, the values of
effective stress parameter χ at various net normal stress levels are evaluated and
presented in Figure 8.12 as functions to gypsum content. It is obvious from Figure
8.12 that χ functions are highly consistent with the corresponding b functions under
different levels of net normal stress. This behaviour is attributed to the fact that both
the single stress approach and the two independent stress-state approach are
mathematically the same but physically are different. Similar to b, the effective
stress parameter χ exhibits remarkable decrease with increasing gypsum content
under various net normal stress levels. Thus, regardless the approach adopted in the
analysis of shear strength data, it is clear that there is noticeable diminishing in the
contribution of matric suction in increasing the shear strength associated with the
increase in gypsum content.
However, a precise inspection to Figure 8.12 reveals that the values of χ are
greater than one for soil specimens without gypsum, tested at 100 and 200 kPa net
normal stress levels, and that is consistent with the corresponding values of b
which

238
are greater than the saturated friction angle . Similar results of
b values higher
than were reported by Vanapalli et al. (1999) on glacial till specimens tested at
confining pressure values of 100 and 200 kPa.
Figure 8.11. Effect of gypsum content on matric suction friction angle ( under
four levels of net normal stress, (A) For matric suction range of 0 to
130 kPa, (B) Matric suction at residual zone.
0
5
10
15
20
25
30
35
40
0 10 20 30 40 50 60 70 80 90
Mat
ric
suct
ion
fri
ctio
n a
ngle
,
b
Gypsum content (%)
(A) Matric suction range of 0 to 130 kPa
NNS = 100 kPa
NNS = 200 kPa
NNS = 300 kPa
NNS = 400 kPa
NNS: Net normal stress
Experimental data
points
0
5
10
15
20
0 10 20 30 40 50 60 70 80 90
Mat
ric
suct
ion f
rict
ion a
ngle
,
b
Gypsum content (%)
(B) Matric suction greater than 130 kPa
NNS = 100 kPa
NNS = 200 kPa
NNS = 300 kPa
NNS = 400 kPa
NNS: Net normal stress
Experimental data
points
Best-fitted curves

239
Figure 8.12. Effect of gypsum content on effective stress parameter (χ), under four
levels of net normal stress, for matric suction range of 0 to 130 kPa.
Figures 8.11 A and B and Figure 8.12 also show that for any gypsum content
there is a general tendency for b and χ to decrease with increasing the level of the
applied net normal stress. That is consistent with the mathematical approach for
predicting the unsaturated shear strength proposed by Rassam and Williams (1999),
as reviewed in Section 2.6.4.
8.3.6. Prediction of unsaturated failure envelopes
In recent years, several semi-empirical shear strength functions were proposed
to predict the shear strength of unsaturated soils. Among these was the semi-
empirical predictive model proposed by Rassam and Cook (2002) as reviewed in
Section 2.6.4. This model was used in this research to predicate the unsaturated shear
strength envelopes for various sand-gypsum mixtures. The saturated shear strength
parameters (i.e., c' and , the shear strength of air-dried specimen with water
content corresponding to the residual suction, along with the stress-dependent soil-
water characteristic curve data for various sand-gypsum mixtures were utilized.
Comparisons between the measured shear strength envelopes of unsaturated
specimens and the predicted shear strength envelopes, at different levels of net
normal stress, are presented in Figures 8.13 A, B and C for sand-gypsum mixtures
having 0%, 40%, and 65% gypsum content by weight. The reminder graphs that
0.00
0.20
0.40
0.60
0.80
1.00
1.20
0 10 20 30 40 50 60 70 80 90
Eff
ecti
ve
stre
ss p
aram
eter
, χ
Gypsum content
NNS = 100 kPa
NNS = 200 kPa
NNS = 300 kPa
NNS = 400 kPa
NNS: Net normal stress
Experimental data
points

240
related to 20% and 80% gypsum content mixtures are presented in Appendix B,
Figures B.3 A and B. In these figures, the experimental data are designated by
different symbols and the resulting envelopes are shown by curve fitted solid lines.
Different broken lines are used to show the predicted failure envelopes at different
levels of applied net normal stress.
0
50
100
150
200
250
300
350
400
0 200 400 600 800 1000
Pea
k o
r m
axim
um
sh
ear
stre
ss (
kP
a)
Matric suction (kPa)
(A) 0% Gypsum content
NNS= 400 kPa
NNS= 300 kPa
NNS= 200 kPa
NNS= 100 kPa
Rassam fun./400 kPa
Rassam fun./300 kPa
Rassam fun. /200 kPa
Rassam fun. /100 kPa
NNS: Net normal stress
Exp
erim
enta
l d
ata
po
ints
Best-fitted experimental failure
envelopes (solid lines)
0
50
100
150
200
250
300
350
400
0 100 200 300
Pea
k o
r m
axim
um
sh
ear
stre
ss (
kP
a)
Matric suction (kPa)
(B) 40% Gypsum content
NNS= 400 kPa
NNS= 300 kPa
NNS= 200 kPa
NNS= 100 kPa
Rassam fun./400 kPa
Rassam fun./300 kPa
Rassam fun./200 kPa
Rassam fun./100 kPa
NNS: Net normal stress
Best-fitted experimental failure
envelopes (solid lines)
Exp
erim
enta
l d
ata
po
ints

241
Figure 8.13. Comparison of Rassam and Cook (2002)'s predictive function with the
experimental shear strength envelopes, at different levels of net normal
stress, for unsaturated sand-gypsum specimens having (A) 0%, (B)
40%, and (C) 65% gypsum content by weight.
Good agreement is observed between the predicted and the measured shear
strength results for the sandy soil without gypsum additives as shown in Figure
8.13A. For sand-gypsum mixture of 40% gypsum content, accepted differences could
be noticed between the predicted and the measured envelopes as shown in Figure
8.13B. With further increasing of gypsum content, the amount of deviation increases
remarkably as shown in Figure 8.13C.
The predictive failure envelopes in matric suction-peak shear stress plane are
necessarily matched the experimental envelopes at the beginning points (zero suction
points) and at the end points (residual suction points). That is because the predictive
function is formulated basically by considering the experimental shear strength
values at saturation and residual water content conditions. Thus, the variation
between the predictive and the experimental envelopes can be characterized
sufficiently by evaluating the matching in the degree of curvature between these two
envelopes.
As discussed in the previous section, two factors could influence the degree of
curvature of the failure envelopes of the sand-gypsum mixtures, gypsum content
0
50
100
150
200
250
300
350
400
0 200 400 600
Pea
k o
r m
axim
um
sh
ear
stre
ss (
kP
a)
Matric suction (kPa)
(C) 65% Gypsum content
NNS= 400 kPa
NNS= 300 kPa
NNS= 200 kPa
NNS= 100 kPa
Rassam fun./400 kPa
Rassam fun./300 kPa
Rassam fun./200 kPa
Rassam fun./100 kPa
NNS: Net normal stress
Best-fitted experimental failure
envelopes (solid lines)
Exp
erim
enta
l d
ata
po
ints

242
mainly and the level of applied net normal stress secondly. The degree of curvature
reveals remarkable decrease with increasing gypsum content and moderate decrease
with increasing the level of net normal stress. Rassam and Cook (2002) have
considered the effect of net normal stress in developing their predictive model,
thereby, the remaining factor that influences the deviation between the predictive and
experimental envelopes and then the applicability of the proposed function could be
the percentage of gypsum content. Thus, with increasing gypsum content, the
experimental matric suction failure envelopes approaching linear pattern and then
high deviation from Rassam and Cook's predictive model can be noticed.
The other remarkable point which can be noticed from Figures 8.13 A, B and C
is the slope of the failure envelopes (b) at residual zone. The experimental results
reveal that this slope shows clear increase with increasing gypsum content, as
quantitatively evaluated also in Figure 8.11B. Rassam and Cook (2002)'s predictive
model based on the assumption that b is zero at residual matric suction, i.e., the
predictive failure envelopes become horizontal at residual matric suction. This
assumption seems reasonable for the sandy soil without gypsum additives (Figure
8.13A), but with increasing gypsum content, there are clear deviations between the
experimental and the corresponding predicted envelopes can be noticed under
various levels of net normal stress (see Figure 8.13C).
8.3.7. Suction stress characteristic curves
Suction stress refers to the net interparticle force generated within a matrix of
unsaturated soil particles due to the combined effects of negative pore water pressure
and surface tension (Lu and Likos, 2006). The function of suction stress to the water
content or matric suction is termed as the suction stress characteristic curve (SSCC).
The SSCC concept was recently proposed to more effectively express and evaluate
the influence of matric suction on the effective stress and then on the shear strength
of unsaturated soil. This concept is advantageous because it can represent the state of
stress for unsaturated soil using a single stress variable by expanding both Terzaghi
(1943)'s and Bishop (1959)'s effective stress principles, Oh et al. (2012).

243
The suction stress characteristic curves (SSCCs) for five sand-gypsum mixtures
at various net normal stress levels were found from direct shear strength tests on
unsaturated specimens, by following the approach of Lu and Likos (2006). The
SSCCs in terms of water content for sand-gypsum mixtures having 0% and 80%
gypsum content are presented in Figures 8.14 A and B. The SSCCs for mixtures
having 20%, 40%, and 65% are presented in Appendix B, Figure B.4 A, B, and C.
Figure 8.14. SSCCs in terms of water content (According to the approach of Lu and
Likos, 2006) for sand-gypsum mixtures having (A) 0%, and (B) 80%
gypsum content by weight, at different levels of net normal stress.
0
50
100
150
200
250
300
350
400
5 6 7 8 9 10 11 12 13 14 15 16 17
Suct
ion s
tres
s (-
kP
a)
Water content (%) (A) 0% Gypsum content
NNS = 0 kPa
NNS = 100 kPa
NNS = 200 kPa
NNS = 300 kPa
NNS = 400 kPa
NNS: Net normal stress
0
20
40
60
80
100
5 7 9 11 13 15 17 19 21 23 25
Suct
ion s
tres
s (-
kP
a)
Water content (%)
(B) 80% Gypsum content
NNS = 0 kPa
NNS = 100 kPa
NNS = 200 kPa
NNS = 300 kPa
NNS = 400 kPa
NNS: Net normal stress

244
Figures 8.14 A and B reveal that the SSCCs behaviour are significantly
depended on gypsum content of the sand-gypsum mixture under consideration. The
level of the applied net normal stress is clearly affected the pattern of the SSCC as
well. Three segments could be distinguished on each of the determined SSCC; two
linear segments with a curvilinear segment in the middle connected them. A precise
comparison between the SD-SWCCs presented in Figures 6.2 to 6.6 and the SSCCs
in Figures 8.14 A and B reveals that these three segments can be related to the
different water retention mechanisms within the matrix of unsaturated soil. These
mechanisms are (i) the capillary mechanism which extends from saturation to near
residual water content, (ii) the adsorption mechanism that extends behind the residual
stage of water retention, and (iii) a transition state between these two different
mechanisms (Section 2.4.7). The two linear segments of the SSCC may be related to
the capillary mechanism and the adsorption mechanism, respectively. The middle
curvilinear segment is related to the transition zone between these two mechanisms.
At relatively high water contents, when the matric suction is smaller than the
residual matric suction, the SSCC exhibits linear relationship with relatively small
inclination. When the matric suction approaching the residual value, the SSCC in
terms of water content shows nonlinear shape with a degree of curvature depends
significantly on the material properties, particularly pore size and pore size
distribution. As the matric suction exceeds the residual suction of the soil mixture,
the SSCC returns again showing a linear pattern but with relatively steep inclination.
Figures 8.14 A and B reveal that there is a clear decrease in suction stress
function with increasing the level of the applied net normal stress, and this decrease
becomes more pronounced at high gypsum content soil mixtures. Thus, the slope of
the linear segments of the SSCC seem to decrease with increasing net normal stress,
associated mostly with clear decrease in the degree of curvature of the transition
segment.
As discussed in Section 2.3.2, SSCC could be described as a function to water
content or to matric suction. Thus the SSCCs in terms of matric suction for different
sand-gypsum mixtures were established after estimating the matric suction values in
correspondence to the water content values. The mathematical representations of the

245
SD-SWCCs data were used. Figures 8.15 A and B present the SSCCs in terms of
matric suction, for sand-gypsum mixtures having 0% and 80% gypsum contents.
Figures 8.15 A and B show clearly that the general trend of the contribution of matric
suction to the suction stress decreases with increasing matric suction, i.e., the slope
of SSCC decreases with increasing matric suction. As well as, the suction stress
function in terms of matric suction exhibits remarkable decrease with increasing the
level of net normal stress.
Figure 8. 15. SSCCs in terms of matric suction (According to the approach of Lu and
Likos, 2006) for sand-gypsum mixtures having (A) 0%, and (B) 80%
gypsum content by weight, at different levels of net normal stress.
0
40
80
120
160
200
0 200 400 600 800 1000 1200
Suct
ion s
tres
s (-
kP
a)
Matric suction (kPa) (A) 0% Gypsum content
NNS = 100 kPa
NNS = 200 kPa
NNS = 300 kPa
NNS = 400 kPa
NNS: Net normal stress
0
20
40
60
80
100
0 50 100 150 200 250 300 350 400
Suct
ion s
tres
s (-
kP
a)
Matric suction (kPa)
(B) 80% Ggypsum content
NNS = 100 kPa
NNS = 200 kPa
NNS = 300 kPa
NNS = 400 kPa
NNS: Net normal stress

246
The SSCCs in terms of matric suction show high consistency with those in
terms of water content. This consistency indicates the validity and reliability of the
adopted approach in measuring the unsaturated shear strength by controlling the
water content, as well as, the accuracy and reliability in measuring the SD-SWCC by
using the modified stress controllable pressure plate device. However, the describing
of SSCC as a function to water content is more preferable in practical application,
because the measuring of field water content is easier and faster than measuring soil
suction.
To evaluate the effect of gypsum content on grain-size and pore-size distribution
and then on the behaviour of suction stress function, the SSCCs for five sand-
gypsum mixtures are presented in Figures 8.16 A and B under net normal stress level
of 200 and 400 kPa. Figures 8.16 A and B reveal that gypsum content has significant
effects on the behaviour of SSCC at different levels of net normal stress. The slope
of the linear segments, the degree of curvature of the middle segment, and then the
whole SSCC exhibit clear decrease with increasing gypsum content in the soil
mixture.
0
50
100
150
200
250
5 6 7 8 9 10 11 12 13 14 15 16 17
Suct
ion s
tres
s (-
kP
a)
Water content (%)
(A) At 200 kPa net normal stress
0% Gypsum
20% Gypsum
40% Gypsum
65% Gypsum
80% Gypsum

247
Figure 8.16. SSCCs in terms of water content (According to the approach of Ning
Lu, 2006) for different sand-gypsum mixtures at net normal stress level
of (A) 200 kPa, and (B) 400 kPa.
8.3.8. Shear strength failure envelopes in terms of intergranular effective
stress
Lu and Likos (2006) introduced the concept of "true effective stress" as
discussed in Section 2.3.2. True effective stress is defined as the interpartical stress
resulting from three components; bonding stress (apparent tensile stress) that
provides cohesion in saturated soil, net normal stress, and suction stress. The
combination of net normal stress and suction stress without joining bonding stress is
herein referred to as "intergranular effective stress". To present shear strength failure
envelopes of different soil mixtures in one graph for comparison, and since these
mixtures have different values of bonding stress, the "intergranular effective stress"
was used instead of "true effective stress" in this representation.
The excess in shear strength resulting from desaturation ( was considered
together with the applied net normal stress to define the intergranular effective stress
in the direct shear tests of different unsaturated specimens. This approach
circumvents about the necessity to determine the matric suction in shear strength
0
50
100
150
200
250
5 6 7 8 9 10 11 12 13 14 15 16 17
Suct
ion s
tres
s (-
kP
a)
Water content %
(B) At 400 kPa net normal stress
0% Gypsum
20% Gypsum
40% Gypsum
65% Gypsum
80% Gypsum

248
tests of unsaturated specimens, since the most relevance variable is not the matric
suction but the suction stress which could be defined here as ( / tan ').
The shear strength failure envelopes in terms of intergranular effective stress,
for saturated and unsaturated specimens, of five different sand-gypsum mixtures are
presented in Figure 8.17. It can be noticed from Figure 8.17 that the representation
of failure envelope for saturated or unsaturated soil in the intergranular effective
stress-shear stress plane results a unique line, having an intercept equal to the
saturated cohesion (c') , regardless the degree of saturation. Thus, the failure
envelope of each sand-gypsum mixture is best fitted using the data of about 24 direct
shear tests which were carried out at four different net normal stress levels on
specimens having different water contents.
As shown in Figure 8.17, the coefficients of determination of failure envelope
lines of different sand-gypsum mixtures are ranging between 0.9957 and 1.0000
which indicating very limited amount of scattering. That is of course can be referred
to the precise method adopted in preparing the test specimens and the well
controlling conditions during different tests.
The failure envelopes shown in Figure 8.17 are nearly parallel with an angle of
internal friction of about and cohesion intercepts increasing from 4.15 kPa for
0% gypsum mixture to 57.23 kPa for 65% gypsum mixture, and then decreasing to
46.06 kPa for further increasing in gypsum content up to 80%. The values of ' and c'
obtained from Figure 8.17 are similar to large degree to those obtained from
saturated shear strength tests in Figure 8. 5, since the current representation includes
both the saturated and unsaturated shear tests data. Thus, the suction stress
characteristic curves together with the saturated shear strength parameters could be
considered to be completely defined the shear strength for any particular field
problem.

249
Figure 8.17. Shear strength failure envelopes in terms of intergranular effective stress
for different sand-gypsum mixtures.
8.4. Concluding remarks
Results of direct shear tests carried out on saturated and unsaturated specimens
of various sand-gypsum mixtures revealed that gypsum content, applied net normal
stress, and desaturation have great influence on the shear strength and deformation
characteristics of the soil mixtures tested.
y = 0.6418x + 46.058
R² = 0.9997
y = 0.5869x + 57.233
R² = 0.9992
y = 0.6497x + 26.035
R² = 1
y = 0.6129x + 15.999
R² = 0.9997
y = 0.6252x + 4.1462
R² = 0.9957
0
50
100
150
200
250
300
350
400
0 100 200 300 400 500 600
Pea
k o
r m
axim
um
shea
r st
ress
(kP
a)
Intergranular effective stress (kPa)
80% Gypsum
65% Gypsum
40% Gypsum
20% Gypsum
0% Gypsum
y: Peak shear stress (kPa)
x: Intergranular effective stress (kPa)

250
There was an increase in the saturated shear strength parameters (c′ and ′) with
increasing gypsum content, reaching maximum values at 65% gypsum content.
Slight decreases in c′ and ′ were noticed for further increase in gypsum content.
There was a general tendency to the shear stress-shear displacement curves of
the sand-gypsum mixtures to have peak behaviour with increasing gypsum content.
At saturated conditions, under a normal stress of 400 kPa, sand-gypsum mixtures
exhibited non-peak behaviour (ductile behaviour) for gypsum contents less than 30%
and peak behaviour for gypsum contents greater than that. This limit (30%)
decreased to 20% when the applied normal stress was decreased to 100 kPa.
The peak behaviour can be attributed to the increase of effective cohesion with
increasing gypsum content. The cohesion component seems to be mobilized at small
shear displacement (0.8 to 1.2 mm) while the friction component needs around 12
mm to be mobilized for the specimens tested. Thus, specimens of high gypsum
content exhibited peak stress at shear displacement not exceeding 1.2 mm, and then
showed clear decrease in shear stress with the progress of shear displacement
(softening pattern). In contrast, specimens of low gypsum content (non peak
behaviour) showed clear increase in stress pattern with increasing shear
displacement, approaching the softening patterns at relatively large shear
displacement of about 12 mm. Thus, the increase in shear strength with increasing
gypsum content is more pronounced and significant when the peak shear stress is
adopted as a failure criterion, while it is less pronounced when the study shear
strength is considered.
The suction stress function and then the contribution of matric suction to the
shear strength revealed clear decrease with increasing gypsum content in the soil
mixture. Thus, there is clear decrease in each of the friction angle in terms of matric
suction ( , the effective stress parameter (χ), and the degree of curvature of the
shear strength-matric suction failure envelope with increasing gypsum content. As
well as, the increasing of applied net normal stress caused decrease in the
contribution of matric suction to shear strength by decreasing the suction stress
function.

251
CHAPTER NINE
9: CONCLUSIONS AND RECOMMENDATIONS
The major objectives of this study were to evaluate experimentally the effect of
gypsum content and the effect of stress state on the water flow and retention
characteristics, volume change, shear strength and deformation characteristics of
unsaturated sandy soils. A sandy soil from the district of Al-Fallujah / Al-Anbar
province / Iraq was considered. An extensive laboratory testing programme was
undertaken on synthetic sand-gypsum mixtures using compacted soil specimens. The
specimens were statically compacted at the optimum water content to 90% of the
maximum dry density obtained from the standard Proctor test.
The testing programme comprised of three main parts. The first part included
the classification tests and some conventional, standard tests. The effect of gypsum
content on the overall particle density, grain-size distribution, consistency limits,
compaction behaviour, consolidation characteristics, soil-water characteristic curve,
and the shrinkage characteristics of the soil mixtures were investigated in the first
part. The second part focused on the detailed investigation of the drying and the
wetting stress-dependent soil-water characteristic curves (SD-SWCCs) and the stress
dependent-unsaturated hydraulic conductivity functions (SD-HCFs) for different
sand-gypsum mixtures. A new stress controllable pressure plate device with test
procedures were developed to carry out these two key hydraulic functions. The shear
strength and deformation characteristics of saturated and unsaturated soil mixtures
were carried out in the third part of the testing programme.
The conclusions corresponding to each of the three testing parts are presented in
the following sections. These conclusions are directly related to the results provided

252
in the previous chapters. Finally, the recommendations for future works are presented
in the last section.
9.1. Conclusions from conventional, standard tests
The major conclusions obtained from the classification, compaction,
consolidation, soil-water characteristic curve, and the shrinkage characteristics tests
are as follows:
(1) An alternative method was suggested in this study for determining gypsum
particles density by using saturated water with gypsum salt instead of using white
spirit (BS 1377-2, 1990). When the water is pre-saturated with gypsum salt, it will be
unable to dissolve gypsum any more during the particle density test. The results
obtained were very close to that obtained from the standard method with differences
not exceeding 0.005 Mg/m3.
(2) There was a slight increase in the maximum dry density of the soil mixture
associated with a slight decrease in the optimum water content when gypsum content
is increased up to 15% by weight. Further increase in gypsum content caused
noticeable decrease in the maximum dry density associated with a clear increase in
the optimum water content. This conclusion agrees to that reported by Kattab (1986)
and Al-Dilaimy (1989).
(3) A better evaluation of compaction characteristics of gypsiferous soils can be
achieved by adopting the minimum void ratio rather than the maximum dry density.
This evaluation circumvents over the variations in the overall specific gravity of
different sand-gypsum mixtures, since the main purpose from compaction is to pack
more closely the soil particles and then reduces air voids. By adopting the minimum
void ratio, the defined percentage of gypsum that results maximum improvement in
compaction characteristics was 30% instead of 15% for the sandy soil tested.
(4) A mild decrease in each of the consistency limits (liquid limit, plastic limit, and
shrinkage limit) of the sand-gypsum mixtures was observed with increasing gypsum
content up to 30% by weight, then the consistency limits exhibited clear increase
with increasing gypsum content. This trend is consistent with the effect of gypsum
content on the void ratio of the compacted specimens.

253
(5) The one-dimensional compression index (Cc) of sand-gypsum mixtures
increased noticeably with increasing gypsum content. Also there was a remarkable
increase in (Cc) with increasing the level of applied effective stress. Greater
volumetric changes with desaturation were also noticed from the CLOD tests with
increasing gypsum content. This behaviour can be attributed to the soft nature of
gypsum particles, and the increase in void ratio of the soil specimen with increasing
gypsum content.
(6) A combined procedure was suggested in this study to find simultaneously the
gravimetric/ volumetric water content - matric suction - void ratio relationships using
the commercial pressure plate extractor. Two of ASTM Standard procedures were
incorporated, the SWCC determination using separate specimens (ASTM D 6836-
02), and the specimen volume determination using the wax method (ASTM D 4943-
08).
(7) The slope of the SWCC in the transition zone showed clear increase with
increasing gypsum content in the soil mixture. This trend can be directly related to
the uniformity coefficient decrease of the soil mixture with increasing gypsum
content. The water holding capacity of the soil mixtures revealed noticeable increase
with increasing gypsum content. Thus, gypsum is considered as an improvement
material to the hydraulic characteristics of sandy soils for agricultural purposes.
(8) Results of the shrinkage characteristic curves (SCCs) obtained from the CLOD
tests revealed high consistency with the analogous curves obtained from the SWCC
tests. Both results showed that the slope of the linear portion of the SCC decreases
with increasing gypsum content in the soil mixture. Likewise, the curvature of the
SCC becomes flatter and the value of the minimum void ratio at the dry condition
becomes greater with increasing gypsum content. The shrinkage limit values of
various soil mixtures determined from CLOD tests were found smaller than those
determined from the standard shrinkage limit tests (ASTM D 4943-08), and that is
may be attributed to the differences of the initial conditions and the preparation of
specimens tested in these two different approaches.

254
(9) There was a remarkable increase in water content-total suction function of the
soil mixture with increasing gypsum content as long as water content is greater than
the residual value, whereas these functions exhibited converging to each other at total
suction value of about 1 MPa. This behaviour can be attributed primarily to the effect
of gypsum content on increasing the osmotic suction component near saturation and
the eliminating of osmotic component at higher level of suction. Sand-gypsum
mixtures exhibited clear increase in residual total suction associated with clear
decrease in the corresponding residual water content with increasing gypsum content.
9.2. Conclusions from developed-stress dependent-hydraulic tests
The major conclusions obtained from the developed SD-SWCCs and SD-HCFs
tests are presented below.
(1) A newly modified stress controllable pressure plate device has been introduced
in this study. The modified device was applied to measure conveniently and
efficiently both the SD-SWCCs simultaneously with the SD-HCFs during both the
drying and the wetting processes under Ko condition. The device has the flexibility to
be used also to measure the matric suction for a given soil specimen by applying the
null type technique. Several improvements have been made in the design of this
device. Among these are:
(i) The volume of diffused air is evaluated and removed simply, quickly, and
efficiently. This feature is attributed to the use of spiral groove below the ceramic
disc, and to the manner adopted in monitoring the water content variations in the soil
specimen.
(ii) The desired vertical stress is applied pneumatically inside the cell without the
need to a loading frame machine, and this reduces greatly both the cost and the
laboratory space required.
(iii) Continuous determination of specimen water content during the test is
accurately done without dismantling the device by weighing the overall cell and
monitoring the differences in consequent weights. Therefore, there is no need to an
external measuring system, and there is no evaporation problem during long term
tests.

255
(iv) Single soil specimen is used to obtain the SD-SWCCs simultaneously with the
SD-HCFs with any number of data points during both the drying and the wetting
processes.
(v) Soil specimen covers the whole surface area of the ceramic disc, i.e., there is no
exposed area of ceramic disc in direct contact to the pressurized air of the cell, which
may have some effect on water phase continuity.
(vi) Soil specimen occupies the whole inside volume of the cell, thus there is no
need to additional attachments such as a vapour saturator to prevent the drying of the
specimen by evaporation.
(vii) The high accuracy with which water removal and uptake from or into the
specimen can be measured made the device suitable to measure the drying and the
wetting SD-HCFs with high reliability and accuracy.
(2) Results of the SD-SWCCs revealed that gypsum content greatly affects the
drying and the wetting SWCC parameters. At any level of net normal stress, the
increase of gypsum content in the soil mixture causes noticeable increase in the
saturated water content, air-entry water content, air-entry suction, residual suction,
desorption rate, absorption rate, air-expulsion water content, air-expulsion suction,
and the water-entry suction. Conversely, the residual water content and the water-
entry water content revealed slight decrease with increasing gypsum content. This
behaviour can be directly related to the effect of gypsum content on the grain-size
distribution and then on the pore-size distribution of the soil mixture.
(3) Clear hysteresis was noticed between the drying and the wetting SD-SWCCs of
the sand-gypsum mixtures with an amount increases with increasing gypsum content.
A quantitative evaluation to hysteresis phenomenon between the drying and the
wetting SD-SWCCs has been proposed in this study. The values of air-entry suction
and residual suction were compared to those of air-expulsion suction and water-entry
suction respectively to find the horizontal shift between the drying and the wetting
curves. Similarly, the water content parameters of the drying and the wetting curves
were compared to find the vertical shift.

256
(4) At any levels of net normal stress and matric suction, the elapsed time required
to reach equalization noticeably increased with increasing gypsum content in the soil
mixture. On the other hand, the elapsed time required to reach equalization during
the wetting process was much greater than that during the drying process. As the
applied net normal stress increased, the time required to reach equalization decreased
markedly.
(5) Obvious dependency of SWCC on the applied net normal stress level was
noticed. This dependency was more pronounced within the boundary effect zone,
extended to some degree through the transition zone, and eliminated at the residual
zone. This dependency is pronounced when water retention is governed by capillary
mechanism that depends mainly on particle and pore structure and pore-size
distribution. Soil specimens subjected to a higher net normal stress exhibited lower
initial gravimetric water content, clear decrease in the air-entry water content, slight
increase in the air-entry suction, clear decrease in the water holding capacity, and
reduction in desorption rate. Similar stress dependency to the wetting path with
increasing the applied net normal stress was noticed.
(6) The reliability and accuracy of the newly modified stress controllable pressure
plate device have been demonstrated through (i) the consistency of the SD-SWCCs
test results of different sand-gypsum mixtures at various levels of net normal stress,
(ii) the possibility of getting relatively identical results for identical specimens, and
(iii) the applicability of many mathematical models to best-fit the experimental test
results.
(7) The test results of SD-HCFs showed that the multistep and the one step transient
outflow methods are inapplicable at matric suction values below the air-entry value
because there is no flow of water. At residual zone, the flow of water is very little
making the outflow methods inapplicable as well. Thus, the applicability of these
methods is limited to the transition zone only. The SD-HCFs calculated by following
Gardner (1956)'s multistep outflow method were always lower than the
corresponding functions calculated according to Doering (1965)'s one step outflow
method by one to one and a half order, for both the drying and the wetting paths of
all sand-gypsum mixtures. This is due to the differences in assumptions, initial and
boundary conditions which had been considered in these analytical solutions.

257
(8) There was clear increase in the drying/wetting k(ψ) of the soil mixture with
increasing gypsum content. This can be attributed to the increases in void ratio and
water content of the specimen with increasing gypsum content. Smaller effect to the
gypsum content was noticed on k(w). There were clear hysteresis effects on k(ψ) of
the soil mixtures, with wetting function always lower than the corresponding drying
one. Only minor hysteresis was noticed on k(w), and that is because the water
content hysteresis was eliminated in this representation.
(9) The influence of the net normal stress on HCFs of the compacted specimens
tested was relatively small due to the initial conditions of the prepared specimens.
The influence of net normal stress was more pronounced with soil mixtures of high
gypsum contents, due to the increase in the compression index with increasing
gypsum content. It was noticed that the increase of net normal stress to some extent
causes the HCFs to have some increase due to the anticipated increase in the water
phase continuity (squeezing action). Further increase in net normal stress causes
decrease in HCFs due to substantial decrease in pore spaces and then in the water
flow paths.
9.3. Conclusions from shear strength tests
The main conclusions regarding the effects of gypsum content, desaturation, and
net normal stress level on the saturated and unsaturated shear strength parameters
and deformation characteristics of the soil mixtures are shown below.
(1) Saturated soil specimens of low gypsum content exhibited ductile behaviour
(non-peak stress-strain patterns), while those of high gypsum contents exhibited stiff
behaviour with peak shear stress achieved at low shear strain, mostly below 1%.
Gypsum content at which shearing behaviour is changed from ductile to stiff was
around 30% for the sandy soil tested. At this percentage, maximum compaction
improvement with minimum void ratio for the sandy soil was achieved.
(2) Shear displacement corresponding to maximum (Peak) shear stress showed clear
decrease with increasing gypsum content in the soil mixture, whereas this
displacement showed an increase with increasing the applied normal stress level.
Accordingly, the initial shear stiffness of the soil mixture revealed clear increase with

258
increasing gypsum content and/or decreasing the applied normal stress level. Most of
sand-gypsum mixtures, that compacted to 90% of the standard compaction, exhibited
dilation behaviour with an amount increases with increasing gypsum content and
decreases with increasing the applied net normal stress level.
(3) Saturated soil specimens exhibited clear increase in cohesion component and
slight increase in friction component with increasing gypsum content up to 65% by
weight. Further increase in gypsum content caused slight decrease in both shear
components. The increase in shear strength was more pronounced at relatively small
shear displacements when the peak shear stress is adopted. At relatively large shear
displacements, specimens of different gypsum contents exhibited a tendency to come
to nearly the same steady or critical shear stress value.
(4) The contribution of desaturation to the shear strength of the soil mixture
exhibited clear decrease with increasing gypsum content, and moderate decrease with
increasing the applied net normal stress level. Thus, the shear strength-water content
function of the soil mixture becomes flatter showing low degree of curvature with
increasing gypsum content. This function becomes more flat with increasing the net
normal stress level as well.
(5) The shear stress-matric suction failure envelopes of the soil mixtures showed
clear nonlinearity with a degree of curvature decreases with increasing gypsum
content and/or increasing the level of net normal stress. The parameters and χ
showed noticeable decrease at capillary stage with increasing gypsum content, while
at residual stage these parameters exhibited an increase with increasing gypsum
content, reaching maximum values at around 50% gypsum content and then clear
decrease was noticed for further increase in gypsum content. The suction stress
characteristic curve (SSCC) exhibited clear decrease with increasing gypsum content
in the soil mixture and/or increasing the level of the applied net normal stress.
(6) Consistent shear stress-matric suction failure envelopes were found for various
sand-gypsum mixtures by adopting the matric suction values estimated from SD-
SWCC tests. This consistency confirms the reliability and the viability of the
proposed approach of testing and analysing the shear strength parameters of
unsaturated compacted specimens. The proposed procedure utilizes standard

259
laboratory direct shear equipment and takes a relatively short time to be completed.
Thus, it offers an easy and convenient alternative way for the determination of the
unsaturated shear strength parameters.
(7) The apparent cohesion of different sand-gypsum mixtures exhibited clear
increase with decreasing water content, whereas the corresponding apparent friction
angle showed some decrease with decreasing water content. This behaviour makes
the effect of desaturation in increasing the shear strength is more pronounced at low
levels of net normal stress.
(8) As with the saturated cohesion, the apparent cohesion-water content function
revealed clear increase with increasing gypsum content in the soil mixture, reaching
a highest level at 65% gypsum content. This behaviour can be attributed to that the
cementation bonds between gypsum-gypsum particles are greater than the
cementation bonds between gypsum-sand particles and these in turn are greater than
the bonds between sand-sand particles.
(9) For any sand-gypsum mixture, representation of failure envelope in terms of
intergranular effective stress results a unique line regardless the degree of saturation
of soil specimens, i.e., both saturated and unsaturated specimens can be represented
together. This representation makes the suction stress characteristic curves together
with the saturated shear strength parameters can be considered to be completely
defines the shear strength for any particular field problem.
(10) Good agreement was observed between the measured matric suction-shear stress
envelopes and the predicted envelopes using Rassam and Cook (2002)'s semi-
empirical predictive model for the sandy soil without gypsum or that of low gypsum
content. With increasing gypsum content in the soil mixture, clear deviations
between the measured and the corresponding predicted envelopes were observed
making Rassam and Cook (2002)'s model inappropriate in shear strength prediction
of highly gypsiferous soils.
9.4. Recommendations for future works
This study provided significant information regarding the impact of gypsum
content and stress state on the classification parameters, volume changes, water flow

260
and retention characteristics, shear strength and deformation characteristics of
unsaturated sandy soils. Furthermore, this study highlighted the need for additional
works and future researches. Some of the recommendations of this study are:
(1) It is recommended to use the newly modified stress controllable pressure plate
device with the developed procedures in measuring the main hydraulic functions of
unsaturated soils. The precision, reliability, and simplicity of the device were
demonstrated through an extensive laboratory programme. However, some optional
attachments can be used with the device to extend its features and usage. Among
these attachments are:
(i) A small tensiometer can be inserted at the upper half of the soil specimen to
measure the pore water pressure and then the unsaturated hydraulic conductivity
can be calculated directly by applying Darcy's law, as described by the multistep
direct method (Eching et al., 1994).
(ii) A simple vertical shaft can be inserted through the top cap. Then, the vertical
volume change of the specimens can be measured using an attached vertical
deformation dial gauge.
(iii) Hanging column accessory which enables the application of low suctions to soil
specimens.
(iv) Use of interchangeable high air-entry ceramic discs, mounted on stainless steel
rings, and installed in the recess of the base plate by means of double "O" rings.
Thus, ceramic discs of different air-entry values can be used depending on the
soil type being tested, and this greatly reduces the time needed for equalization.
This option also facilitates the cleaning of the spiral groove of the base plate from
any anticipated depositions.
(2) Direct shear testing of unsaturated soils under controlling water content is
desirable since less time is required for test as compared to tests under matric suction
controlling where the time needed for equalization is relatively too long. However,
further tests should be performed on different soil types to assess the general
applicability of the proposed procedure.
(3) The influence of matric suction on the stress-deformation characteristics of the
gypsiferous soils is recommended to be investigated. While the increase of net

261
normal stress causes sand-gypsum specimens exhibit more ductility, pilot shearing
tests under controlling water content conditions revealed that the increase of matric
suction reduces the specimen ductility and causes the specimen to exhibit more stiff
behaviour.
(4) The contribution of matric suction to the soil shear strength of sand-gypsum
mixtures was well pronounced when the peak shear stress was adopted as a failure
criterion. It is recommended to examine the contribution of matric suction to the
steady shear strength of sand-gypsum mixtures. Some pilot tests carried out in this
study showed that the contribution of matric suction to the shear strength was
mobilized at small shear displacements and gradually reduced with the progress of
shear displacement.

262
REFERENCES
Aitchison, G.D., 1961. Relationship of moisture and effective stress function in
unsaturated soils, Conf. of Pore pressure and suction in soils, organized by
British Nat. Soc. of Int. Soc. Soil Mech. Found. Eng., Inst. Of Civil Eng.,
London: Butterworths, pp. 47-52.
Al-Aithawi, A.H., 1990. Time-dependent deformation of a gypseous silty soil,
M.Sc. thesis, Civil Engineering Department, University of Baghdad, Iraq.
Al-Dilaimy, F.K., 1989. The effect of gypsum content on the strength and
deformation of remolded clay, M.Sc. thesis, Civil Engineering Department,
University of Salah Al-Deen, Iraq, (in Arabic).
Al-Heeti, A.A.H., 1990. The engineering properties of compacted gypsified soil,
M.Sc. thesis, Civil Engineering Department, University of Baghdad, Iraq.
Al-Janabi, A. S., 1990. Using of ammonium phosphate and carbonate as
gypsiferous soil conditioners and their effect on growth and productivity of
corn, Ph.D. thesis, College of Agriculture, University of Baghdad, Baghdad,
Iraq. (In Arabic).
Al-Kaissy, A. A., and Naji, T., 1985.Influence of barium chloride addition on plant
growth and some properties of gypsiferous soil, Agri. Water Resources Res.,
Vol. 4, No. 3, pp. 107-119.
Al-Mufty, A.A., 1997. Effect of gypsum dissolution on the mechanical behavior of
gypseous soils, Ph.D. thesis, Civil Engineering Department, University of
Baghdad, Iraq.
Al-Nouri, I., and Saleam, S.,1994. Compressibility characteristics of gypseous
sandy soils, Geotechnical Testing Journal, Vol. 17, Issue 4.
Alonso, E.E., Gens, A., Hight, D.W., 1987. Special problem soils, general report,
Proc. 9th ECSMFE Vol. 3. Balkema, Dublin, pp. 1087–1146.
Al-Qaissy, F.F., 1989. Effect of gypsum content and its migration on
compressibility and shear strength of the soil, M.Sc. thesis, Building and
Construction Department, University of Technology, Baghdad, Iraq.
Al-Saoudi, N.K.S., AL-Nouri, I.M.A., and Sheikha, A.A.H, 2001.The collapsible
behaviour of gypseous soils, the 7th Jordanian Geological Conference,
Jordanian Geologists Association, Amman, Jordan.
American Society for Testing and Materials (ASTM), 1990. Standard test method
for direct shear tests of soils under consolidated drained conditions.
Designation ASTM D 3080-90.
American Society for Testing and Materials (ASTM), 2002.Standard test methods
for determination of the soil-water characteristic curve for desorption using a
hanging column, pressure extractor, chilled mirror hygrometer, and/or
centrifuge. Designation ASTM D 6836-02.
American Society for Testing and Materials (ASTM), 2003. Standard test method
for measurement of collapse potential of soils. Designation ASTM D 5333.
263
American Society for Testing and Materials (ASTM), 2006. Standard practice for
classification of soils for engineering purposes (Unified Soil Classification
System).
American Society for Testing and Materials (ASTM), 2008. Standard test methods
for shrinkage factors of soils by the wax method. Designation ASTM D 4943-
08.
Azam, S., Abduljawad, S. N., Al-Shayea, N. A., and Al-Amoudi, O. S. B., 1998.
Expansive characteristics of gypsiferous/ anhydritic soil formation,
Engineering Geology, Vol. 51, pp. 89-107.
Azzouz, A. S., Krizek, R. J., and Corotis, R. B., 1976. Regression analysis of soil
compressibility, Soils and Foundations, Vol. 16, No. 2, pp. 19–29.
Barazanji, A.F., 1973. Gypsiferous soils of Iraq, Ph.D. thesis, University of Ghent,
Belgium.
Barzanji, K.K.H., 1984. Infiltration rate characteristics of gypsiferous soils in
northern Iraq (Jazirah-Area), M.Sc. thesis, Irrigation and Drainage Engineering
Department, University of Mosul, Iraq.
Bear, J., 1972. Dynamics of fluids in porous media, American Elsevier Publishing
Company, Inc., New York.
Bensallam, S., Bahi, L., Ejjaaouani, H., Shakhirev, V., 2012. A new shrinkage
curve model, applied to Moroccan clayey soil, International Journal of
Geosciences, Vol. 3, pp. 507-514, doi:10.4236/ijg.2012.33053.
Benson, C. H., and Gribb, M., 1997. Measuring unsaturated hydraulic conductivity
in the laboratory and field. ASCE, Special Technical Publication No. 68,
Reston, VA, pp. 113-168.
Bishop, A. W. (1955, 1959). The principle of effective stress, Lecture delivered in
Oslo, Norway, printed in Teknisk Ukeblad, Vol. 106, No. 39, pp. 859-863.
Bishop, A. W., 1960. The measurement of pore pressure in triaxial test,
proceedings, conference on pore pressure and suction in soils, London:
Butterworths, pp. 38-46.
Bishop, A. W., and Blight, G. E., 1963. Some aspects of effective stress in saturated
and unsaturated soils, Geotechnique, Vol. 13, No. 3, pp. 177-197.
Bittelli, M., Flury, M., 2009. Errors in water retention curves determined with
pressure plates, Soil Physics, Soil Science Society of America Journal, Vol. 73,
No. 5.
Blight, G. E., 1965. A study of effective stresses for volume change, Symposium in
moisture equilibria and moisture changes in the soils beneath covered areas,
pp. 259-269, Australia:Butterworths.
Blight, G.E., 1976. Migration of subgrade salts damages thin pavements.
Proceeding of the American Society of Civil Engineers, ASCE, Transportation
Engineering Journal, 102(TE4), pp. 779–791.
Blyth, F.G.H., 1971. A Geology for Engineers, Fifth Edition, Edward Arnold Ltd.,
London.

264
Bock, K. A., and Fredlund, D. G., 1980. Limitation of the axis translation
technique, proceedings of the 4th International Conference on Expansive Soils,
Denver, CO, pp. 117-135.
Bolt, G. H., 1956. Physicochemical analysis of the compressibility of pure clays.
Geotechnique, Vol. 6, pp. 86–93.
Bolton, M. D., 1986. The strength and dilatancy of sands, Geotechnique, Vol. 36,
No. 1, pp. 65-78.
Bonder, B. H., and Miguel, M. G., 2011. Hysteresis phenomenon of a tropical soil
profile observed by means of soil-water characteristic curves obtained in
laboratory and field, Pan-Am CGS Geotechnical Conference.
Borcher, C., Skopp, J., and Schepers, J., 1987. Unsaturated hydraulic conductivity
determination by one-step outflow for fine-textured soils, Trans. Amer. Assoc.
of Agr. Engr., Vol. 30, No. 4, pp. 1038-1042.
Brasher, B. R., Franzmier, D. P., Valassis, V., and Davidson, S. E., 1966. Use of
Saran resin to coat natural soil clods for bulk density and water-retention
measurements. Soil Science, 101(2): 108.
Bridgwater, J., 1980. On the Width of Failure Zones, Geotechnique, Vol. 30, No. 4,
pp. 533–536.
Brooks, R. H., and Corey, A. T., 1964. Hydraulic properties of porous media,
Colorado State University Hydrology Paper, Vol. 3, pp. 27.
Brune, G., 1965. Anhydrite and gypsum problems in engineering geology,
Engineering Geology, Vol. 2, No. 1, pp. 26–38.
BS 1377-2, 1990. Soils for civil engineering purposes, Part 2: Classification tests,
British Standards Institution.
Buckingham, E., 1907. Studies of the movement of soil moisture, U.S.D.A. Bureau
of soils, No. 38.
Burland, J. B., 1965. Some aspects of the mechanical behaviour of partly saturated
soils, Symposium in moisture equilibria and moisture changes in the soils
beneath covered areas, pp. 270-278, Australia:Butterworths.
Casini, F., Minder, P., Springman, S. M., 2001. Shear strength of unsaturated silty
sand, Taylor & Francis Group, London, ISBN 978-0-415-60428-4.
Chen, L., Miller and Kibbey, T. C. G., 2007. Rapid pseudo-static measurements of
hysteretic capillary pressure-saturation relationship in unconsolidated porous
media, Geotechnical Testing Journal, Vol. 30, No. 6.
Clayton, C.R.I, Priest, J.A, and Rees, E.V.L, 2010. The effects of hydrate cement
on the stiffness of some sands, Geotechnique, Vol. 60, No. 6, pp. 435–445, doi:
10.1680/geot.2010.60.6.435
Clayton, C.R.I., 2011. Stiffness at small strain: research and practice. Geotechnique,
Vol. 61, No.1, pp. 5-37, doi:10.1680/geot.2011.61.1.5.
Clayton, C.R.I., Steinhagin, H.M., Powrie, W., 1995. Terzaghi's theory of
consolidation and the discovery of effective stress. (Compiled from the work of

265
K. Terzaghi and A.W. Skempton). Proceedings of the ICE - Geotechnical
Engineering, Vol. 113, No. 4, pp. 191-205, doi:10.1680/igeng.1995.28015.
Coleman, J. D., 1962. Stress/strain relations for partly saturated soils,
Geotechnique, Vol. 12, No. 4, pp. 348-350.
Collis-George, N., and Rosenthal, M., 1966. Proposed outflow method for the
determination of the hydraulic conductivity of unsaturated porous materials,
Aust. J. Soil Res., Vol. 4, No. 1, pp. 165-180.
Corey, A.T., and Kemper, W.D., 1961. Concept of total potential in water and its
limitations, Soil Sci., Vol. 91, No. 5, pp. 299-305.
Corey, A.T., and Klute, A., 1985. Application of the potential concept to soil water
equilibrium and transport, Soil Science Society of America Journal, Vol. 49,
pp. 3-11.
Croney, D., Coleman, J. D., and Lewis, W. A., 1950. Calculation of the moisture
distribution beneath structures, Cov. Eng. L., Vol. 45, pp. 524.
Croney, D., Coleman, J.D., and Black, W.P.M., 1958. Movement and distribution
of water in soil in relation to the highway design and performance, Highway
Res. Board, Washington, DC, No. 40, pp. 226-252.
Cui, Y. J., and Delage, P., 1996. Yielding and plastic behavior of unsaturated
compacted silt, Geotechnique, Vol. 46, pp. 291-311.
Cui, Y., Ta, A. N., Tang, A. M., and Lu, Y., 2010. Investigation of the hydro-
mechanical behaviour of compacted expansive clay, Frontiers of Architecture
and Civil Engineering in China, Vol. 4, No. 2, pp. 154-164, doi:
10.1007/S11709-010-0019-0.
Dirksen, C., 1991. Unsaturated hydraulic conductivity, Soil Analysis, Physical
methods, K. Smith and C. Mullins, eds., Marcel Dekker, New York, 209-269.
Doering, E., 1965. Soil-water diffusivity by the one-step method, Soil Sci., Vol. 99,
No. 5, pp. 322-326.
Drumright, E. E., 1989. The contribution of matric suction to the shear strength of
unsaturated soils, PhD thesis, Colorado State University, Colorado.
Ebrahimi-Birang, N., Fredlund, D. G., and Samarasekera, L., 2007. Hysteresis of
the soil-water characteristic curve in the high suction range, Ottawa Geo.
Eching, S., Hopmans, J., and Wendroth, O., 1994. Unsaturated hydraulic
conductivity from transient multi-step outflow and soil water pressure data,
Soil Science Society of America Journal, Vol. 58, pp. 687-695.
Escario, V., 1980. Suction controlled penetration and shear tests, Proceedings of the
Fourth International Conference on Expansive, ASCE, Vol. 2, pp. 781-797.
Escario, V., and Saez, J., 1986. The shear strength of partly saturated soils,
Geotechnique, Vol. 36, pp. 453 – 456.
Escario, V., Juca, J., and Coppe, M. S., 1989. Strength and deformation of partly
saturated soils, Proceedings of the 12th
international conference on soil
mechanics and foundation engineering, Rio de Janeiro, Vol. 3, pp. 43–46.

266
Escario, V., Juca, J., and Coppe, M. S., 1989. Strength and deformation of partly
saturated soils, Proceedings of the 12th
international conference on soil
mechanics and foundation engineering, Rio de Janeiro, Vol. 3, pp. 43–46.
FAO, 1990. Management of gypsiferous soils, Food and Agricultural Organization
of the United Nations, Rome.
Fattah, M., Y., Al-Shakarchi, Y., J., and Al-Numani, H., N., 2008. Long-term
deformation of some gypseous soils, Eng. & Tech. Vol. 26, No. 12.
Feuerharmel, C., Pereira, A., Gehling, W. Y. Y., and Bica, A. V. D., 2006.
Determination of the shear strength parameters of two unsaturated colluvium
soils using the direct shear test, ASCE Conference Proceedings, Unsaturated
Soils, pp. 1181-1190, doi: 10.1061/40802(189)96.
Fookes, P.C., 1976. Road geotechnics in hot deserts, Journal of the Institution of
Highway Engineers, Vol. 23, No. 10, pp. 11–23.
Fookes, P.C., 1978. Middle East-inherent ground problems, Quarterly Journal of
Engineering Geology, Vol. 11, No. 1, pp. 33–49.
Fookes, P.C., and French, W.J., 1977. Soluble salt damage to surfaced roads in the
Middle East, Journal of the Institution of Highway Engineers, Vol. 24, No. 11,
pp. 10–20.
Fourie, A., and Papageorgiou, G., 1995. A technique for the rapid determination of
the moisture retention relationship and hydraulic conductivity of unsaturated
soils, Proc. Of the first Int. Conf. on Unsaturated Soils, Balkema, Rotterdam,
pp. 485-490.
Fredlund, D. G., 1989. Soil suction monitoring for roads and airfields. Symposium
on the State-of the-Art of Pavement Response Monitoring Systems for Roads
and Airfields, Sponsored by the U.S. Army Corps of Engineers (Hanover, NH),
March 6–9.
Fredlund, D. G., and Morgenstern, N.R., 1977. Stress state variables for unsaturated
soils, ASCE J. Geotech. Eng. Div. GT5, Vol. 103, pp. 447-466.
Fredlund, D. G., Morgenstern, N. R., and Wider, R. A., 1978. Shear strength of
unsaturated soils, Canadian Geotecnical Journal, Vol. 15, No. 3, pp. 313-321.
Fredlund, D. G., and Rahardjo, H., 1993. Soil mechanics for unsaturated soils,
John-Wiley & Sons Inc, New York.
Fredlund, D. G., Rahardjo, H., and Gan, J. K-M., 1987. Nonlinearity of strength
envelope for unsaturated soils, Proceedings 6th international conference on
expansive soils, New Delhi, pp. 49-54.
Fredlund, D. G., Sheng, D., and Zhao, J., 2011. Estimation of soil suction from the
soil-water characteristic curve, Canadian Geotechnical Journal, Vol. 48, pp.
186–198, doi: 10.1139/T10-060.
Fredlund, D. G., Xing, A., Fredlund, M. D., and Barbour, S. L., 1996. The
relationship of the unsaturated soil shear strength to the soil–water
characteristic curve, Canadian Geotecnical Journal, Vol. 33, pp. 440–448.

267
Fredlund, D. G., Xing, A., and Huang, S., 1994. Predicting the permeability for
unsaturated soils using the soil-water characteristic curve, Canadian
Geotechnical Journal, Vol. 31, pp. 533-546.
Fredlund, D.G., and Xing, A., 1994. Equations for the soil-water characteristic
curve, Canadian Geotechnical Journal, Vol. 31, No. 4, pp. 521–532,
doi:10.1139/t94-061.
Fredlund, M. D., Wilson, G. W., and Fredlund, D. G., 2002. Representation and
estimation of the shrinkage curve, Third International Conference on
Unsaturated Soils, Recife, Brazil, pp. 145-149.
Gan, J. K., Fredlund, D. G., and Rahardjo, H., 1988. Determination of the shear
strength parameters of an unsaturated soil using the direct shear test, Canadian
Geotechnical Journal, Vol. 25, No. 3, pp. 500–510.
Gardner, W., 1956. Calculation of capillary conductivity from pressure plate
outflow data, Soil Sci. Amer. Proc., Vol. 20, pp. 317-320.
Gardner, W., 1962. Note on the separation and solution of diffusion equations, Soil
Sci. Amer. Proc., 26:404.
Gardner, W., and Widtsoe, J. A., 1921. The movement of soil moisture, Soil
Science, Vol. 11, pp. 215-232.
GCTS Testing Systems. Commercial Publication, Tempe, AZ, USA.
Gee, G., Campbell, M., Campbell, G., and Campbell, J., 1992. Rapid measurement
of low soil potentials using a water activity meter, Soil Science Society of
America Journal, Vol. 56, pp. 1068–1070.
Gens, A., Alonso, E. E., and Lloret, A., 1995. Effect of structure on the volumetric
behaviour of a compacted soil. Proceedings of the 1st International Conference
on Unsaturated Soils, E. E. Alonso and P. Delage, Eds., Paris, September 6–8,
Balkema, Rotterdam, The Netherlands, Vol. 1, pp. 83-88.
Graecen, E. L., 1960. Water content and soil strength, Jornal of Soil Science, Vol.
11, No. 2, pp. 313-333.
Green, T.W., Paydar, Z., Cresswell, H.P., and Drinkwater, R.j., 1998. Laboratory
outflow technique for measurement of soil water diffusivity and hydraulic
conductivity, CSIRO, Australia, Technical report No. 12/98.
Gribb, M., 1996. Parameter estimation for determining hydraulic properties of a
fine sand from transient flow measurements, Water Res. Res., Vol. 32, No. 7,
1965-1974.
Guan, Y., and Fredlund, D. G., 1997. Use of Tensile Strength of Water for the
Direct Measurement of High Soil Suction, Canadian Geotechnical Journal,
Vol. 34, No. 4, pp. 604–614.
Guan,Y., 1996. The measurement of soil suction, a PhD thesis, Dept. of Civil
Engineering, University of Saskatchewan, Saskatoon, Canada.
Gupta, S.C., Farrell, D.A., and Larson, W.E., 1974. Determining effective soil
water diffusivities from one-step outflow experiments. Soil Science Society of
America Proceedings, Vol. 38, pp. 701-716.

268
Haines, W. B., 1923. The volume-changes associated with variations of water
content in soil, Journal of Agricultural Science, Vol. 13, pp. 296-310.
Haines, W. B., 1930. The hysteresis effect in capillary properties and the modes of
moisture distribution associated therewith, Journal of Agriculture Science, Vol.
20, pp. 96-105.
Harrison, B. A., and Blight, G. E., 2000. A comparison of in situ soil suction
measurements. Unsaturated soils for Asia, Singapore , H. Rahardo, D. Toll, and
E. Leong, eds., Balkema, Rotterdam, The Netherlands, 281–285.
Hilf, J.W., 1956. Soil investigation of pore-water pressure in compacted cohesive
soils, PhD thesis, Technical Memorandum No. 654, United States Department
of the Interior, Bureau of Reclamation, Design and Construction Division,
Denver, CO.
Hillel, D. and Gardner, W., 1970. Measurement of unsaturated conductivity and
diffusivity by infiltration through an impending layer, Soil Sci., Vol. 109, No.
3, pp. 149-153.
Hillel, D., Krentos, V., and Stylianou, Y., 1972. Procedure and test of an internal
drainage method for measuring soil hydraulic characteristics in situ, Soil Sci.,
Vol. 114, No. 5, pp. 395-400.
Ho, D.Y.F., and Fredlund, D.G., 1982. Increase in shear strength due to suction for
two Hong Kong soils, Proceedings of the ASCE Geotechnical Conference,
Engineering and Construction on Tropical and Residual Soils, Honolulu,
Hawaii., U.S.A., January 11-15, pp. 263-295.
Hough, B.K., 1957. Basic soils engineering, The Ronald Press Company, New
York, pp. 114-115.
Jennings, J. E., 1961. A revised effective stress law for use in the prediction of the
behaviour of unsaturated soils, Conf. of Pore pressure and suction in soils,
organized by British Nat. Soc. of Int. Soc. Soil Mech. Found. Eng., Inst. Of
Civil Eng., London: Butterworths, pp. 26-30.
Jotisankasa, A., 2005. Collapse behaviour of a compacted silty clay. PhD thesis,
Imperial College, London.
Kattab, S.A., 1986. Effect of gypsum on the strength of granular soil treated and
untreated with cement, M.Sc. thesis, Civil Engineering Department, University
of Baghdad, Iraq.
Kawai, K., Karube, D., and Kato, S., 2000. The model of water retention curve
considering effects of void ratio. In: Rahardjo, H., Toll, D.G., and Leong, E.C.
(Eds.), Unsaturated Soils for Asia: 329–334. Rotterdam: Balkema.
Khalili, N., and Khabbaz, M. H., 1998. A unique relationship for χ for the
determination of shear strength of unsaturated soils, Geotechnique, Vol. 48, pp.
681-688, doi:10.1680/geot.1998.48.5.681.
Khalili, N., and Khabbaz, M. H., 1998. A unique relationship for the determination
of the shear strength of unsaturated soils, Geotechnique, Vol. 48, No. 5, pp.
681–687.

269
Khalili, N., Geiser, F., and Blight, G. E., 2004. Effective stress in unsaturated soils:
review with new evidence, Int. J. Geomech. ASCE, Vol. 4, No. 2, pp. 115-126.
Klein C., and Hurlbut, C. S., 1985. Manual of Mineralogy, 20th ed., Wiley, New
York.
Klute, A., 1972. The determination of the hydraulic conductivity and diffusivity of
unsaturated soils, Soil Sci., Vol. 113, No. 4, pp. 264-276.
Klute, A., and Dirksen, C., 1986. Hydraulic conductivity and diffusivity:
Laboratory methods, Methods of Soil Analysis, Part 1, Physical and
Mineralogical Methods, 2nd Ed., Soil Science Society of America, Madison,
WI, 687-729.
Lambe, T. W., 1960. A mechanistic picture of the shear strength of clay, Proc.,
Research Conf. on the shear strength of cohesive soils, ASCE, New York, 437.
Lambe, T.W., 1951. Soil testing for engineers, New York: Wiley.
Lambe, T.W., and Whitman, R.V., 1979. Soil mechanics, New York: Wiley.
Lamborn, M. J., 1986. A micromechanical approach to modeling partly saturated
soils, M.Sc. thesis, Texas A&M University, Texas.
Lane, J.J., Law, T.L., and Station, K.D., 2001. Determination of the shear strength
of an unsaturated clay till using conventional direct shear testing equipment.
Undergraduate Thesis, Department of Civil Engineering, Lakehead University.
Leonard, M., Singleton, J., and Gribb, M., 1996. Hydraulic conductivity
measurement in unsaturated soils with a modified cone penetrometer, Proc.
Third International Symposium and Exhibition on Environmental
Contamination in Central and Eastern Europe, Sept. 1996, Warsaw, Poland.
Leong, E. C., Lee, C. C., and Low, K. S., 2009. An active control system for matric
suction measurement, Soils and Foundations, Vol. 49, No. 5, pp 807-811.
Leong, E. C., Lee, C. C., and Low, K. S., 2011. Discussion of "Modified null
pressure plate apparatus for measurement of matric suction" by Power, K. C.
and Vanapalli, S. K., Geotechnical Testing Journal, Vol. 33, No. 4, Paper ID
GTJ102478, Geotechnical Testing Journal, Vol. 34, No. 3, Paper ID
GTJ103362.
Likos, W. J., and Lu, N., 2003. Automated humidity system for measuring total
suction characteristics of clay, ASTM, Geotechnical Testing Journal, Vol. 26,
No.2.
Lins, Y., 2009. Hydro-mechanical properties of partially saturated sand, PhD thesis,
University Bochum.
Lins, Y., Schanz, T., and Fredlund, D. G., 2009. Modified pressure plate apparatus
and column testing device for measuring SWCC of sand, Geotechnical Testing
Journal, Vol. 32, No.5.
Lu, N., 2008. Is matric suction a stress variable?, Journal of geotechnical and
Geoenvironmental Engineering, ASCE, Vol. 134, No. 7, pp. 899-905.

270
Lu, N., Godt, J. W., and Wu, D. T., 2010. A closed-form equation for effective
stress in unsaturated soil, Water Resource Research, Vol. 46, W05515, doi:
10.1029/2009WR008646.
Lu, N., Likos, W. J., 2006. Suction stress characteristic curve for unsaturated soil,
Journal of geotechnical and Geoenvironmental Engineering, ASCE, Vol. 132,
No. 2, pp. 131-142.
Lu, N., and Likos, W., 2004. Unsaturated soil mechanics, John Wiley & Sons Inc.,
New Jersey, USA.
Lun, M. C. H., 2005. Behaviour of unsaturated soils under direct shear and triaxial
compression, M.Sc. thesis, Civil Engineering Department, University of
Calgary, Alberta, Canada.
Mabirizi, D., and Bulut, R., 2011. Hysteresis between wetting and drying diffusivity
parameters, Unsaturated soils, Alonso& Gens (eds), Taylor & Francis Group,
London, ISBN 978-0-415-60428-4.
Maqsoud, A., Bussiere, B., Mbonimpa, M., and Aubertin, M., 2004. Hysteresis
effects on the water retention curve: a comparison between laboratory results
and predictive models, 57th Canadian Geotechnical Conference, 3A, 8 – 15,
Quebec, Canada.
Mason, J. B., 1992. Preparation of soil sampling protocols: Sampling techniques
and strategies, Environmental Research Centre, University of Nevada-Las
Vegas, Las Vegas, Nevada 89154.
Matyas E.L. and Radhakrishna H.S., 1968. Volume change characteristics of
partially saturated soil, Geotechnique, Vol. 18, pp. 432-448.
McGarry, D., and Malafant, K.W., 1987. The analysis of volume change in
unconfined units of soil, Soil Science Society of America Journal, Vol. 51, pp.
290-297.
McKeen, R. G., 1981. Design of airport pavements for expansive soils, U. S. Dept.
of Transportation, Federal Aviation Administration, Rep. No. DOT/FAA/RD-
81/25.
McKeen, R. G., and Hamberg, D. J., 1981. Characterization of expansive soils,
Transportation Research Record 790, pp. 73–78.
McQueen, I. S., and Miller, R. F., 1974. Approximating soil moisture
characteristics from limited data: Empirical evidence and tentative model,
Water Resources Research, Vol. 10, No. 3, pp. 521–527.
Md. Noor, M.J., Mat. Jidin, R., and Hafez, M.A., 2008. Effective stress and
complex soil settlement behaviour, Universiti Teknologi MARA, EJGE,
Malaysia.
Miller, E., and Miller, R., 1988. Physical theory for capillary flow phenomena,
Transport in porous media, 3, pp. 324-332.
Mofiz, S. A., Taha, M. R., Sharker, D. C., 2004. Mechanical stress-strain
characteristics and model behaviour of geosynthetic reinforced soil composites,
17th ASCE Engineering Mechanics Conference, University of Delaware,
Newark, DE.

271
Morgenstern, N. R., 1979. Properties of compacted soils, Proc. of the 6th pan-
american Conf. Soil Mech. Found. Eng., Vol. 3, pp. 349-354, Lima, Peru.
Mualem, Y., 1976. A new model for predicting the hydraulic conductivity of
unsaturated porous media, Water Resources Research, Vol. 12, pp. 593-622.
Mualem, Y., 1984b. Prediction of the soil boundary wetting curve, Soil Science
Vol. 137, No. 6, pp. 379-390.
Murray, E., and Sivakumar, V., 2010. Unsaturated soils - fundamental approach to
interpretation of soil behaviour. Wiley-Interscience Publications.
Nelson, J. D., Miller, D. J., 1992. Expansive soils, John Wiley & Sons, Inc.
Ng, C.W.W., and Pang, Y.W., 2000b. Influence of stress state on soil–water
characteristics and slope stability, Journal of geotechnical and
Geoenvironmental Engineering, ASCE, Vol. 26, No. 2, pp. 157–166.
Ng, C.W.W., and Leung, A. K., 2012. Measurements of drying and wetting
permeability functions using a new stress-controllable soil column, Journal of
Geotechnical and Geoenvironmental Engineering, ASCE, Vol. 138, No. 1,
ISSN 1090-0241.
Ng, C.W.W., and Menzies, B., 2007. Advanced unsaturated soil mechanics and
engineering, Taylor and Francis, London and New York.
Ng, C.W.W., and Pang, Y.W., 2000a. Experimental investigation of soil-water
characteristics of a volcanic soil. Canadian Geotechnical Journal, Vol. 37, No.
6, pp. 1252–1264.
Oh, S., Lu, N., Kim, Y., Lee, S., and Lee, S., 2012. Relationship between the soil-
water characteristic curve and the suction stress characteristic curve:
Experimental evidence from residual soils, Journal of geotechnical and
Geoenvironmental Engineering, ASCE, Vol. 138, No. 1, pp. 47–57.
Padilla, J.M., Perera, Y. Y., Houston, W. N., and Fredlund, D.G., 2005. A new soil-
water characteristic curve device, Proceedings of Advanced Experimental
Unsaturated Soil Mechanics- an International Symposium, EXPERUS 2005,
Trento, Italy, pp. 15-22.
Palmeira, E. M., and Milligan, G. W. E., 1989. Scale effects in direct shear tests on
sand, Proceedings of the 12th
International Conference on Soil Mechanics and
Foundation Engineering, Vol. 1, No. 1. pp. 739–742.
Pan, H., Qing, Y., and Pei-yong, L., 2010. Direct and indirect measurement of soil
suction in the laboratory, EJGE, Vol.15, Bund. A.
Passioura, J.B., 1976. Determining soil water diffusivities from one-step outflow
experiments, Australian Journal of Soil Research 15, 1-8.
Paul Simms, 2003. A fundamental study of unsaturated flow in compacted clayey
soil, a PhD thesis, University of Western Ontario, London, Ontario, Canada.
Pavlakis, G., and Barden, L., 1972. Hysteresis in the moisture characteristics of clay
soil, Journal of Soil Science, Vol. 23, pp. 350-361.
Pereira, J.H.F., and Fredlund, D.G., 2000. Volume change behavior of collapsible
compacted gneiss soil, Journal of Geotechnical and Geoenvironmental

272
Engineering, ASCE, Vol. 126, pp. 907–916, doi:10.1061/1090-
0241(2000)126:10(907).
Perez-Ruiz, D. D., 2009. A refined true triaxial apparatus for testing unsaturated
soils under suction-controlled stress paths, a PhD thesis, University of Texas at
Arlington, USA.
Peterson, R. F. W., 1988. Interpretation of triaxial compression test results on
partially saturated soils, Advanced Triaxial Testing of Soil and Rock, ASTM
STP 977, American Society for Testing and Materials, Philadelphia, pp. 512-
538.
Peterson, R. W., 1990. The influence of soil suction on the shear strength of
unsaturated soil, PhD thesis, Texas A&M University, Taxas.
Pham, H. Q., Fredlund, D. G., and Barbour, S. L., 2003. A practical hysteresis
model for the soil-water characteristic curve for soils with negligible volume
change, Geotechnique, Vol. 53, No. 2, pp. 293-298.
Poulovassilis, A., 1970. Hysteresis of pore water in granular porous bodies, Soil
Science, Vol. 109, No. 1, pp. 5-12.
Power, K. C., and Vanapalli, S. K., 2009. Modified null pressure plate apparatus for
measurement of matric suction, Geotechnical Testing Journal, Vol. 33, No. 4,
Paper ID GTJ102478.
Power, K. C., Vanapalli, S. K., Leong, E. C., Lee, C. C., and Low, K. S., 2011.
Response to Discussion of "Modified null pressure plate apparatus for
measurement of matric suction" by Power, K. C., and Vanapalli, S. K.,
Geotechnical Testing Journal, Vol. 33, No. 4, Paper ID GTJ102478,
Geotechnical Testing Journal, Vol. 34, No. 3, Paper ID GTJ103764.
Rahardjo, H., and Leong, E. C., 2006. Suction measurements, ASCE Conf.
Proceedings of the fourth international conference on unsaturated soils, doi:
10.1061/40802(189)3.
Rassam, D. W., and Cook, F., 2002. Predicting the shear strength envelope of
unsaturated soils, Geotechnical Testing Journal, Vol. 25, No. 2, pp. 215–220.
Rassam, D. W., Williams, D. J., 1999. A relationship describing the shear strength
of unsaturated soils, Canadian Geotechnical Journal, Vol. 36, pp 363-368.
Razouki, S. S., Al-Omeri, R.R., Nashat, I.H., Razouki, H.F., and Khalid, S., 1994.
The problem of gypsiferous soils in Iraq. Proceedings of the Symposium on
Gypsiferous Soils and their Effect on Structures. NCCL, Baghdad, 7–33.
Razouki, S. S., and El-Janabi, O. A., 1999. Decrease in the CBR of a gypsiferous
soil due to long term soaking, Quarterly Journal of Engineering Geology and
Hydrogeology, Vol. 32, pp. 87-89.
Razouki, S. S., and Ibrahim, A. N., 2007. Improves a gypsum sand roadbed soil by
increased compaction, Proceedings of the Institution of Civil Engineers,
Transport 160, pp. 27-31, Paper14742.
Razouki, S. S., and Kuttah, D. K., 2004. Effect of soaking period and surcharge
load on resilient modulus and California bearing ratio of gypsiferous soils,

273
Quarterly Journal of Engineering Geology and Hydrogeology , Vol. 37, pp.
155-164, doi:10.1144/1470-9236/04-002.
Razouki, S. S., and Kuttah, D. K., 2006. Predicting long-term soaked CBR of
gypsiferous subgrade soils, Proceedings of the Institution of Civil Engineers,
Transport 159, pp. 135-140, Paper14256.
Razouki, S. S., Kuttah, D. K., Al-Damlugi, O. A., and Nashat, I. H., 2007. Strength
erosion of a fine-grained gypsiferous soil during soaking, The Arabian Journal
for Science and Engineering, Volume 32, Number 1B.
Razouki, S. S., Kuttah, D. K., Al-Damlugi, O. A., and Nashat, I. H., 2008. Using
gypsiferous soil for embankments in hot desert areas, Proceedings of the
Institution of Civil Engineers, Transport 161, pp. 63-71, Paper 700042.
Richards, B. G., 1965. Measurement of the free energy of soil moisture by the
psychrometric technique using thermistors, in Moisture Equilibria and
Moisture Change in Soils Beneath Covered Areas, A symposium, Australia:
Butterworths, pp. 39-46.
Richards, B. G., 1966. The significance of moisture flow and equilibrium in
unsaturated soils in relation to the design of engineering structures built on
shallow foundations in Australia, Symposium on permeability and capillary,
Amer. Soc. Testing Materials, Atlantic City, New Jersey.
Richards, L. A., 1928. The usefulness of capillary potential to soil moisture and
plant investigators, J. Agric. Res., Vol. 37, pp. 719-742.
Richards, L. A., 1931. Capillary conduction of liquids through porous medium,
Journal of Physics, 318-333.
Ridley, A. M. and Burland, J. B. 1993. A new instrument for the measurement of
soil moisture suction. Geotechnique, Vol. 43, No. 2, pp. 321–324.
Ridley, A. M., and Wray, W. K. 1995. Suction measurements: A review of current
theory and practices, in E. E. Alonso and P. Delage (Eds.), Unsaturated Soils:
Proceedings of the First International Conference on Unsaturated Soils, Paris,
Balkema, Rotterdam, Presse des Ponts et Chaussees, pp. 1293–1322.
Rijtema, P., 1959. Calculation of capillary conductivity from pressure plate outflow
data with non-negligible membrane impedance, Netherlands J. Agr. Sci., Vol.
7, pp. 209-215.
Roscoe, K. H., 1970. Tenth Rankine Lecture: The influence of strains in soil
mechanics, Geotechnique, Vol. 20, No. 2, pp. 129–170.
Scotter, D., and Clothier, B., 1983. A transient method for measuring soil water
diffusivity and hydraulic conductivity, Soil Science Society of America
Journal, Vol. 47, pp. 1068-1072.
Seleam, S.N.M., 1988. Geotechnical characteristics of a gypseous sandy soil
including the effect of contamination with some oil products, M.Sc. thesis,
Building and Construction Department, University of Technology, Baghdad,
Iraq.
Sharma, R. S., 1998. Mechanical behaviour of unsaturated highly expansive clays.
http://ora.ox.ac.uk/objects/uuid:6ee59b08-357a-4d2d-96f1-c5987465f437.

274
Sheng, D., Fredlund, D. G., and Gens, A., 2008. A new modelling approach for
unsaturated soils using independent stress variables, Canadian Geotechnical
Journal, Vol. 45, pp. 511–534.
Shihab, R. M., Al-Ani, A. N., and Fahad, A. A., 2002. Dissolution and transport of
gypsum in gypsiferous soil treated with fuel oil and bentonite, Emir. J. Agric.
Sci., Vol. 14, pp. 01 – 07.
Simunek, J., Kodesova, R., Gribb, M. M., and Genuchten, M. T., 1999. Estimating
hysteresis in the soil water retention function from cone permeameter
experiments, Water Resources Research, Vol. 35, No. 5, pp. 1329-1345.
Sivakumar, R., 2005. Effects of Anisotropy on the Behaviour of Unsaturated
Compacted Clay, PhD thesis submitted to the Queen's University of Belfast.
Sivakumar, V., Tan, W.C., Murray, E.J., and McKinley, J.D., 2006. Wetting, drying
and compression characteristics of compacted clay, Geotechnique, Vol. 56, No.
1, pp. 57–62.
Soilmoisture Equipment Corporation, 2008. Commercial Publications, Santa
Barbara, CA.
Sowers, G.B., 1970. Introductory soil mechanics and foundations, The Macmillan
Company, Collier- Macmillan Limited, London, 3rd Edition, pp.102.
Stephens, D., 1989. A comparison of estimated and measured unsaturated hydraulic
conductivity of two uniform soils in New Mexico, Agricultural Res. Service,
Riverside, CA, pp. 249-261.
Stephens, D., 1994. Hydraulic conductivity assessment of unsaturated soil,
Hydraulic Conductivity and Waste Contaminant Transport in Soil, STP 1142,
ASTM, Philadelphia, D. Daniel and S. Trautwcin, eds., pp. 169-181.
Stormont, J.C., Henry, K.S., and Evans, T.M., 1997. Water retention functions of
four nonwoven polypropylene geotextiles, Geosynthetics International, Vol. 4,
No. 6, pp. 661-672.
Subhi, H.M., 1987. Properties of salt contaminated soils and their influence on the
performance of roads in Iraq, Ph.D. thesis, Queen Mary College, University of
London.
Sun, D. A., Matsuoka, H., Yao, Y. P., and Ichihara, W., 2000. An elastoplastic
model for unsaturated soil in three-dimensional stresses, Soils Found., Vol. 40,
No. 3, pp.17–28.
Tadza, M. Y. M., 2011. Soil-water characteristic curves and shrinkage behaviour of
highly plastic clays: An experimental investigation, PhD thesis,
Geoenvironmental Research centre, Cardiff University, UK.
Tami, D., Rahardjo, H., and Leong, E. C., 2004. Effects of hysteresis on steady-
state infiltration in unsaturated slopes, Journal of Geotechnical and
Geoenvirontal Engineering, ASCE, Vol. 130, No. 9, pp. 956 – 967.
Tarantino, A. and Mongiovì, L., 2003. Calibration of tensiometer for direct
measurement of matric suction. Geotechnique, Vol. 53, No. 1, pp. 137-14.
Tarantino, A., 2007. A possible critical state framework for unsaturated compacted
soils, Geotechnique, Vol. 57, No. 4, pp. 385–389.

275
Tarantino, A., and Tombolato, S., 2005. Coupling of hydraulic and mechanical
behaviour in unsaturated compacted clay. Geotechnique, Vol. 55, No. 4, pp.
307-317.
Terzaghi, K., 1943. Theoretical soil mechanics, New York: Wiley.
Terzaghi, K., and Peck, R. B., 1960. Soil mechanics in engineering practice, Wiley
& Sons Inc. New Jersey.
Thiel, R., 2001. Peak vs. residual shear strength for landfill bottom liner stability
analyses, Proceedings of the 15th Annual GRI Conference Hot Topics in
Geosynthetics, Geosynthetics Institute, Folsom, PA, pp. 40-70.
Thu, T. M., Rahardjo, H., and Leong, E., 2007. Soil-water characteristic curve and
consolidation behavior for a compacted silt, Canadian Geotechnical Journal,
Vol. 44, pp. 266-275.
Toker, N., 2002. Improvements and reliability of MIT tensiometers and studies on
soil moisture characteristic curves, PhD Thesis, Massachusetts Institute of
Technology.
Toll, D. G., and Ong, B. H., 2003. Critical state parameters for an unsaturated
residual sandy clay, Geotechnique, Vol. 53, No. 1, pp. 93–103.
Tomlinson, M.J., 1978. Middle East highway and airfield pavements, Quarterly
Journal of Engineering Geology, Vol. 11, No. 1, pp. 65–73.
Topp, G. C., and Miller, E. E., 1966. Hysteresis moisture characteristics and
hydraulic conductivities for glass-bead media, Soil Science Society of America
Journal, Vol. 30, pp. 156-162.
Topp, G. C., 1969. Soil water hysteresis measured in a sandy loam compared with
the hysteresis domain model, Soil Science Society of America Journal, Vol. 33,
pp. 645-651.
Topp, G. C., 1971a. Soil water hysteresis on silt loam and clay loam soils, Water
Resources Research, Vol. 7, No. 4, pp. 914-920.
Tripathy, S., Elgabu, H., and Thomas, HR., 2012. Matric suction measurement of
unsaturated soils with null-type axis-translation technique. Geotechnical
Testing Journal, Vol. 35, No. 1, pp. 1-12.
Tripathy, S., Leong, E. C., and Raharadjo, H., 2005. Suction of compacted residual
soils. Proceedings of International Conference "From Experimental Evidence
Towards Numerical Modelling of Unsaturated Soils", September 18–19, 2003,
Germany, Vol. 1, pp. 111–122.
Tripathy, S., Subba Rao, K.S., and Fredlund, D.G., 2002. Water content-void ratio
swell-shrink paths of compacted expansive soils, Canadian Geotechnical
Journal, Vol. 39, pp. 938-959.
Tse, M. K., 2007. Influence of stress states on soil-water characteristics,
conjunctive surface-subsurface flow modelling and stability analysis, M.Phil.
thesis, Hong Kong University of Science and Technology.
Uchaipichat, A., 2010. Hydraulic hysteresis effect on compressibility of unsaturated
soils, Arpn Journal of Engineering and Applied Sciences, Vol. 5, No. 10, pp.
92-97.

276
Valiantzas, J., 1989. A simple approximate equation to calculate diffusivity from
one-step outflow experiments, Soil Science Society of America Journal, Vol.
53, pp. 342-349.
Valiantzas, J.D., Kerkides, P.G., and Poulovassilis, A., 1988. An improvement to
the one-step outflow method for determination of soil water diffusivities.
Water Resources Research, Vol. 24, pp. 1911-1920.
Van Genuchten, M. T., 1980. A closed form equation for predicting the hydraulic
conductivity of unsaturated soils, Soil Science Society of America Journal,
Vol. 44, pp. 892-898.
Van Genuchten, M.T., 1980. A closed form equation for predicting the hydraulic
conductivity of unsaturated soils, Soil Science Society of America Journal,
Vol. 44, No. 5, pp. 892–898.
Vanapalli, S. K., 1994. Simple test procedures and their interpretation in evaluating
the shear strength of an unsaturated soil, PhD thesis, University of
Saskatchewan, Canada.
Vanapalli, S. K., and Fredlund, D. G., 2000. Comparison of empirical procedures to
predict the shear strength of unsaturated soils using the soil-water characteristic
curve, in Advances in Unsaturated Geotechnics, Shackelford, C. D., Houston,
S. L., and Chang, N. Y., eds., GSP No. 99, ASCE, Reston, VA, pp. 195–209.
Vanapalli, S. K., and Lane, J., 2002. A simple technique for determining the shear
strength of unsaturated soils using the conventional direct shear apparatus,
Proceedings of the Second Canadian Specialty Conference on Computer
Applications in Geotechnique, April, 2002, Winnipeg, pp. 245-253
Vanapalli, S. K., Fredlund, D. G., Pufahl, D. E., and Clifton, A. W., 1996. Model
for the prediction of shear strength with respect to soil suction, Canadian
Geotecnical Journal, Vol. 33, pp. 379–392.
Vanapalli, S. K., Fredlund, D. G., Pufahl, D. E., and Clifton, A. W., 1996. Model
for the prediction of shear strength with respect to soil suction, Canadian
Geotechnical Journal, Vol. 33, pp. 379–392.
Vanapalli, S. K., Garga, V. K., and Brisson, P., 2007. A modified permeameter for
determination of unsaturated coefficient of permeability, Geotech. Geol. Eng.,
Vol. 25, pp. 191-202.
Vanapalli, S. K., Pufahl, D. E., and Fredlund, D. G., 1998. The effect of stress state
on the soil-water characteristic behavior of a compacted sandy-clay till, Proc.
of 51st Canadian Geotechnical Conf., pp. 81–86.
Vanapalli, S. K., Sharma, R. S., and Nicotera, M. V., 2008. Axis-translation and
negative water column techniques for suction control, Geotech. Geologic. Eng.,
Vol. 26, pp. 645-660.
Vanapalli, S.K., Fredlund, D.G., and Pufahl, D.E., and Clifton, A.W., 1996. Model
for the prediction of shear strength with respect to soil suction. Canadian
Geotechnical Journal, Vol. 33, No. 3, pp. 379-392.
Vanapalli, S.K., Fredlund, D.G., and Pufahl, D.E., 1999. The influence of soil
structure and stress history on the soil-water characteristics of a compacted till,
Geotechnique, Vol. 49, No. 2, pp. 143 – 159.

277
Vanapalli, S.K., Pufahl, D.E., and Fredlund, D.G., 1999. Interpretation of the shear
strength of unsaturated soils in undrained loading conditions. Proceedings of
the 52nd Canadian Geotechnical Conference, Regina, October 25-27, pp. 643-
650.
Vassallo, R., Mancuso, C., and Vinale, F., 2007. Modelling the influence of stress-
strain history on the initial shear stiffness of an unsaturated compacted silt,
Canadian Geotechnical Journal, Vol. 44, pp. 463-472.
Verheye, W. H., and Boyadgiev, T. G., 1997. Evaluating the land use potential of
gypsiferous soils from field pedogenic characteristics, Soil Use and
Management, Vol. 13, pp. 97-103.
Wildenschild, D., Hopmans, J. W., and Simunek, J., 2001. Flow rate dependence of
soil hydraulic characteristics, Soil Science Society of America Journal, Vol. 65,
pp. 35–48.
Wood, D.M., 1990. Soil behaviour and critical state soil mechanics, Cambridge,
England, Cambridge University Press.
Yang, H., Rahardjo, H., Leong, E. C., and Fredlund, D.G., 2004. Factors affecting
drying and wetting soil-water characteristic curves of sandy soils, Canadian
Geotechnical Journal, Vol. 41, pp. 908–920, doi: 10.1139/T04-042.
Yankee Environmental Systems, 2006. Hygrometer: principle of operation chilled
mirror hygrometers, Airport Industrial park, 101 Industrial Blvd., Turners
Falls, MA 01376 USA.
Younan, T. F., 1986. Effect of potassium oxalate, ammonium carbonate and
oxalate, and barium chloride addition on solubility of gypsum in soil, M.Sc.
thesis, College of Agriculture, University of Baghdad, Baghdad, Iraq. (In
Arabic).
Zanbak, C., Arthur, R.C., 1986. Geochemical and engineering aspects of
anhydrite/gypsum phase transitions, Bulletin of the Association of Engineering
Geologists, Vol. 23, No. 4, pp. 419–433.
Zhou, J., 2008. A study of applied pressure on the soil-water characteristic curve,
Proceedings of the 1st European Conference, E-UNSAT 2008, Durham, United
Kingdom, doi: 10.1201/9780203884430.ch93.

278
APPENDIX: A
Table A.1. Fitting parameters and statistical indices of different SWCCs found by
using the commercial pressure plate (using the same specimens
throughout the whole tests).
Gypsum
content%
%
Fitting parameters Ws
*
Statistical parameters
a n m SSr* SSt
* R
2*
0 2.41 1.36 0.31 15.22 0.0330 42.51 0.9992
10 2.42 1.34 0.45 18.18 0.3830 100.04 0.9962
20 5.19 0.82 0.67 19.00 0.7390 98.80 0.9925
30 2.10 1.23 0.45 20.93 1.4940 123.26 0.9879
40 15.10 0.59 1.26 22.44 4.1290 155.88 0.9735
50 1.88 1.51 0.46 26.49 2.9110 243.84 0.9881 *SSr : Sum of squares of residuals
*SSt : Sum of squares
*R
2 : Coefficient of determination
*Ws : Saturated water content
Table A. 2. Fitting parameters and statistical indices of different combined SWCCs
after the joining of the dew point potentiameter results with that of the
modified stress controllable pressure plate device for specimens tested
under 0 kPa net normal stress.
Gypsum
content%
Fitting parameters Ws
*
Statistical parameters
a n m SSr* SSt
* R
2*
0 4.45 7.28 0.20 17.70 0.615 242.88 0.9975
20 13.18 2.47 0.38 17.60 0.813 313.85 0.9974
40 44.61 11.24 0.29 18.64 0.736 395.75 0.9981
65 65.12 10.50 0.40 22.40 0.211 677.27 0.9997
80 49.79 21.29 0.29 27.79 1.769 993.96 0.9982 *SSr : Sum of squares of residuals
*SSt : Sum of squares
*R
2 : Coefficient of determination
*Ws : Saturated water content

279
APPENDIX: B
Figure B.1. Stress-deformation characteristic curves for different sand-gypsum
mixtures tested under normal stress of 200 kPa, (A) Shear stress versus
lateral displacement, (B) Vertical deformation versus lateral
displacement.
0
20
40
60
80
100
120
140
160
180
200
0 2 4 6 8 10 12
Sh
ear
stre
ss (
kP
a)
Lateral displacement (mm)
(A) Lateral displacement-shear stress curves .
0% Gypsum
10% Gypsum
20% Gypsum
30% Gypsum
40% Gypsum
50% Gypsum
65% Gypsum
80% Gypsum
-0.20
-0.15
-0.10
-0.05
0.00
0.05
0.10
0.15
0.20
0.25
0.30
0 2 4 6 8 10 12
Ver
tica
l dis
pla
cem
ent
(mm
)
Lateral displacement (mm)
(B) Lateral displacement-Vertical deformation curves .
0% Gypsum
10% Gypsum
20% Gypsum
30% Gypsum
40% Gypsum
50% Gypsum
65% Gypsum
80% Gypsum

280
Figure B.2. Peak or maximum shear stress vs. water content under four levels of net
normal stress for sand-gypsum mixtures having (A) 0%, and (B) 65%
gypsum content by weight.
0
50
100
150
200
250
300
350
400
4 6 8 10 12 14 16 18 20 22
Pea
k o
r m
axim
um
sh
ear
stre
ss (
kP
a)
Water Content (%)
(A) 0% Gypsum content
NNS=100 kPa
NNS=200 kPa
NNS=300 kPa
NNS=400 kPa
0
50
100
150
200
250
300
350
400
0 2 4 6 8 10 12 14 16 18 20 22 24 26
Pea
k o
r m
axim
um
shea
r st
ress
(kP
a)
Water Content (%)
(B) 65% Gypsum content
NNS=300 kPa
NNS=200 kPa
NNS=400 kPa
NNS=100 kPa
NNS: Net normal

281
Figure B.3. Comparison of Rassam and Cook (2002)'s predictive function with the
experimental shear strength envelopes, at different levels of net normal
stress, for unsaturated sand-gypsum specimens having (A) 20%, and (B)
80% gypsum content by weight.
0
50
100
150
200
250
300
350
400
0 200 400 600
Pea
k o
r m
axim
um
sh
ear
stre
ss (
kP
a)
Matric suction (kPa)
(A) 20% Gypsum content
NNS= 400 kPa
NNS= 300 kPa
NNS= 200 kPa
NNS= 100 kPa
Rassam fun./400 kPa
Rassam fun./300 kPa
Rassam fun./200 kPa
Rassam fun./100 kPa
NNS: Net normal stress
0
50
100
150
200
250
300
350
0 100 200 300 400
Pea
k o
r m
axim
um
shea
r st
ress
(kP
a)
Matric suction (kPa)
(B) 80% Gypsum content
NNS= 400 kPa
NNS= 300 kPa
NNS= 200 kPa
NNS= 100 kPa
Rassam fun./400 kPa
Rassam fun./300 kPa
Rassam fun./200 kPa
Rassam fun./100 kPa
NNS: Net normal stress

282
0
40
80
120
160
200
5 6 7 8 9 10 11 12 13 14 15 16 17
Suct
ion s
tres
s (k
Pa)
Water content %
(A) 20% Gypsum content
NNS = 0 kPa
NNS = 100 kPa
NNS = 200 kPa
NNS = 300 kPa
NNS = 400 kPa
0
40
80
120
160
5 6 7 8 9 10 11 12 13 14 15 16 17
Suct
ion s
tres
s (k
Pa)
Water content %
(B) 40% Gypsum content
NNS = 0 kPa
NNS = 100 kPa
NNS = 200 kPa
NNS = 300 kPa
NNS = 400 kPa

283
Figure B.4. SSCCs in terms of water content (According to the approach of Lu and
Likos, 2006) for sand-gypsum mixtures having (A) 20%, (B) 40%, and
(C) 65% gypsum content by weight, at different levels of net normal
stress.
0
40
80
120
160
200
5 6 7 8 9 10 11 12 13 14 15 16 17 18 19 20
Suct
ion s
tres
s (-
kP
a)
Water content %
(C) 65% Gypsum content
NNS = 0 kPa
NNS = 100 kPa
NNS = 200 kPa
NNS = 300 kPa
NNS = 400 kPa
0
50
100
150
200
250
0 100 200 300 400 500
Suct
ion
str
ess
(- k
Pa)
matric suction (kPa)
(A) At 200 kPa net normal stress
0% Gypsum
20% Gypsum
40% Gypsum
65% Gypsum
80% Gypsum

284
Figure B.5. SSCCs in terms of matric suction (According to the approach of Ning
Lu, 2006) for different sand-gypsum mixtures at net normal stress level
of (A) 200 kPa, and (B) 400 kPa.
Table B.1. Peak shear strength of saturated sand-gypsum mixtures having different
gypsum contents by weight.
Normal
stress
(kPa)
Peak shear strength (kPa)
Gypsum content %
0 10 20 30 40 50 65 80
100 72 75 76 92 98 115 124 113
200 121 126 140 149 156 181 193 177
400 254 238 260 290 289 314 329 304
Table B.2. Peak shear strength parameters of saturated sand-gypsum mixtures having
different gypsum contents by weight.
Gypsum
content % 0 10 20 30 40 50 65 80
(Deg.) 32.1 30.2 31.4 33.8 33.0 33.6 34.7 32.5
c (kPa) 3 5 18 21 26 48 55 49
0
50
100
150
200
250
0 200 400 600
Suct
ion
str
ess
(- k
Pa)
Matric suction (kPa)
(B) At 400 kPa net normal stress
0% Gypsum
20% Gypsum
40% Gypsum
65% Gypsum
80% Gypsum