
Khaled Abduljalil 1,* 2 2,# 3 , Uwe...
24
1 MODELLING THE AUTO-INHIBITION OF CLARITHROMYCIN METABOLISM DURING REPEATED ORAL ADMINISTRATION Khaled Abduljalil 1,* , Martina Kinzig 2 , Jürgen Bulitta 2,# , Stefan Horkovic-Kovats 3 , Fritz Sörgel 2,4 , Uwe Fuhr 1 1 Department of Pharmacology, Clinical Pharmacology, University Hospital, University of Cologne, Germany; 2 IBMP - Institute for Biomedical and Pharmaceutical Research, Nürnberg-Heroldsberg; Germany 3 Sandoz GmbH, Kundl, Austria 4 Department of Pharmacology, University of Duisburg Î Essen, Universitätsklinikum Essen; Germany Corresponding author: Prof. Dr. phil. nat. Fritz Sörgel Institute for Biomedical and Pharmaceutical Research Paul-Ehrlich-Str. 19, 90562 Nürnberg-Heroldsberg, Germany Phone: +49 - 911 - 51 82 80, Fax: +49 - 911 - 51 82 828, E-mail: [email protected] Keywords: Clarithromycin, 14(R)-hydroxy-clarithromycin, Weibull absorption, auto-inhibition, population pharmacokinetics # present address: Ordway Research Institute, Albany, NY 12208, USA * present address: Simcyp Limited, Blades Enterprise Centre, John Street, Sheffield, S2 4SU, UK Copyright © 2009, American Society for Microbiology and/or the Listed Authors/Institutions. All Rights Reserved. Antimicrob. Agents Chemother. doi:10.1128/AAC.01193-08 AAC Accepts, published online ahead of print on 4 May 2009 on June 5, 2018 by guest http://aac.asm.org/ Downloaded from
Transcript of Khaled Abduljalil 1,* 2 2,# 3 , Uwe...

1
MODELLING THE AUTO-INHIBITION OF CLARITHROMYCIN METABOLISM DURING
REPEATED ORAL ADMINISTRATION
Khaled Abduljalil1,*, Martina Kinzig2, Jürgen Bulitta2,#, Stefan Horkovic-Kovats3, Fritz Sörgel2,4, Uwe Fuhr1 1Department of Pharmacology, Clinical Pharmacology, University Hospital, University of
Cologne, Germany; 2IBMP - Institute for Biomedical and Pharmaceutical Research, Nürnberg-Heroldsberg;
Germany 3Sandoz GmbH, Kundl, Austria 4Department of Pharmacology, University of Duisburg Î Essen, Universitätsklinikum
Essen; Germany
Corresponding author:
Prof. Dr. phil. nat. Fritz Sörgel
Institute for Biomedical and Pharmaceutical Research
Paul-Ehrlich-Str. 19, 90562 Nürnberg-Heroldsberg, Germany
Phone: +49 - 911 - 51 82 80, Fax: +49 - 911 - 51 82 828, E-mail: [email protected]
Keywords:
Clarithromycin, 14(R)-hydroxy-clarithromycin, Weibull absorption, auto-inhibition,
population pharmacokinetics # present address: Ordway Research Institute, Albany, NY 12208, USA * present address: Simcyp Limited, Blades Enterprise Centre, John Street, Sheffield, S2 4SU, UK
Copyright © 2009, American Society for Microbiology and/or the Listed Authors/Institutions. All Rights Reserved.Antimicrob. Agents Chemother. doi:10.1128/AAC.01193-08 AAC Accepts, published online ahead of print on 4 May 2009
on June 5, 2018 by guesthttp://aac.asm
.org/D
ownloaded from
2
Abstract
Clarithromycin decreases CYP3A4 activity and thus gradually inhibits its own metabolism
as well as that of co-administered drugs. This study aimed at understanding the time course
of these changes. Plasma concentration time profiles of clarithromycin and its active
metabolite, 14(R)-hydroxy-clarithromycin, from 12 young healthy volunteers after oral
administration of a clarithromycin suspension (500 mg bid for 7 doses) were modelled by
population pharmacokinetic analysis in NONMEM. Non-linearity of clarithromycin
metabolism was considered during model development and metabolite disposition kinetics
was assumed to be linear. The absorption kinetics of clarithromycin was best described by
a Weibull function model. Pharmacokinetics of clarithromycin and its 14(R)-hydroxyl
metabolite were adequately described by a one-compartment model each for
clarithromycin and its metabolite as well as an inhibition compartment that reflects auto-
inhibition of clarithromycin metabolism. Up to 90% of the apparent total clarithromycin
clearance (60 L/h) was susceptible to reversible auto-inhibition, depending on the
concentration in the inhibition compartment. The proposed semi-mechanistic population
pharmacokinetic model successfully described the auto-inhibition of clarithromycin
metabolism and may be used to adjust doses of other drugs metabolized by CYP3A4 that
are co-administered with clarithromycin. Simulations showed that for the 500 mg bid
standard dose no further increase of exposure occurs after approximately 48 h of treatment.
For a 1000 mg bid dose reaching steady state is expected to take several days and to
achieve a 3.6-fold higher clarithromycin exposure compared to 500mg bid. This evaluation
provides a rationale for a safer and more effective therapy with clarithromycin.
on June 5, 2018 by guesthttp://aac.asm
.org/D
ownloaded from

3
Introduction
Clarithromycin is a broad spectrum macrolide antibiotic and widely used for the treatment
of upper and lower respiratory tract and other infections (11, 19, 30). Clarithromycin
interacts with many drugs on the level of intestinal and hepatic metabolizing enzymes
CYP3A (15, 29). This may change efficacy and tolerability of other co-administered
CYP3A substrates.
Clarithromycin is rapidly and nearly complete absorbed from the gastrointestinal tract (17).
Due to notable first pass metabolism, approximately 50% to 55% of an oral dose is
bioavailable as clarithromycin in the systemic circulation (6, 13, 15). The free fraction of
clarithromycin in plasma is about 0.3 in healthy volunteers (7, 33). Clarithromycin is
widely distributed throughout the body with an apparent volume of distribution range from
126 to 306 litres (5, 29, 33). Approximately 22% of an oral dose is recovered as parent
compound, 18% in the urine and 4% in the faeces (10). The elimination half-life (t1/2) of
clarithromycin is dose- and time-dependent and ranges from 2.7 to 4.8 hours (5, 8, 12, 33).
In healthy subjects, the average total body clearance ranges from 29 to 58 L/h and renal
clearance from 6.7 to 12.8 L/h, depending on the amount and number of doses
administered (5, 29). After single and multiple (7 doses) administration of 500 mg
clarithromycin tablets, the apparent total body clearance was reported to decrease from
42.1 to 18.7 L/h (5, 33). As renal clearance does not change under these conditions, the
nonlinearity is attributed to non-renal elimination mediated by cytochrome P450
metabolism (5). Clarithromycin is extensively metabolized into at least eight metabolites
via three metabolic pathways; i.e. hydroxylation at the 14-position, N-demethylation and
hydrolysis of the cladinose sugar. Secondary biotransformation was also evident (10, 12,
35).
Clarithromycin hydroxylation at position 14 is stereospecific yielding the 14-hydroxy-(R)-
epimer as the main metabolite, which accounts for 20% of the parent drug metabolism (10,
12, 19). Indeed, this metabolite contributes significantly to the overall antimicrobial effect
of clarithromycin (20, 35). Formation of this main metabolite, is predominantly mediated
by CYP3A4 (2, 28, 31, 35) and was suggested to be capacity-limited, which may in part
account for the nonlinearity observed in clarithromycin pharmacokinetics (5).
Clarithromycin is also a potent inhibitor of intestinal and hepatic CYP3A4 activity (15) in
a dose-dependent manner (34). It has been classified as a mechanism-based inhibitor (36).
Clarithromycin inhibits the activity (15, 26) but not the expression level of intestinal wall
on June 5, 2018 by guesthttp://aac.asm
.org/D
ownloaded from
4
CYP3A (26). Based on in vitro models, clarithromycin was predicted to cause a reduction
in the steady-state concentration of liver CYP3A4 to approximately 39% of initial level
(21). The mechanism of this auto-inhibition was reported to be reversible (16, 26),
irreversible (2, 15, 25) and suicide inhibition mediated by formation of a metabolic
intermediate complex (21).
For clarithromycin the ratio of the area under free plasma concentration-time curve to the
minimum inhibitory concentration (fAUC/MIC) is considered as the most predictive
PK/PD index (9, 32) and used to link the pharmacokinetic parameters to the most
important antimicrobial pharmacodynamic parameter, i.e. minimum inhibitory
concentration (MIC). Based on animal infection models, a derived target value of fAUC0-24
plasma /MIC was assumed to be 35 for clarithromycin (9, 32). Actually, the adult dosage
regimens of clarithromycin 500mg twice daily achieves an average area under the
concentration-time curve of free drug fAUC0-24 of about 5.85 ±1.79 mg̋ h/litre in plasma
(33), which may provide sufficient efficacy as long as the MIC value does not exceed 0.25
to 1.0 µg/mL (29). However, this dosing regimen may be ineffective in the treatment of
infections caused by pathogens with a drug MIC higher than 1µg/mL in plasma, or higher
than 0.125 µg/mL in tissues where fAUC is lower, suggesting the need of administration of
higher dose (22, 33). Because of the nonlinear kinetics, it is difficult to predict fAUC
changes achieved by higher doses.
The aim of this study was to quantitatively describe the nonlinearity in the
pharmacokinetics of clarithromycin in the presence of its active metabolite, 14(R)-
hydroxy-clarithromycin and to better understand the time course of inhibition via
population pharmacokinetic modelling. These data are important for a better understanding
of the underlying processes and for the assessment of dose adjustments of clarithromycin
and co-administered CYP3A4 substrates.
MATERIALS AND METHODS
(i) Subjects and treatments. A total of twelve healthy Caucasian volunteers, 7 men and 5
women were enrolled into a single centre, open, randomized steady-state clinical study,
which had been approved by the Ethics Committee of the Ministry of Health Clinic
Hospital of the Republic of Moldavia, Chisinau, The Republic of Moldavia. The study was
conducted according to the revised version of the Declaration of Helsinki. All participants
gave their written informed consent. Volunteers were non-smokers or ex-smokers between
on June 5, 2018 by guesthttp://aac.asm
.org/D
ownloaded from

5
the age of 19 and 41 (mean and SD 28±8) years, their weight was between 45.1 and 86.1
kg (66.5 ± 11.8 kg), body height ranged between 150.0 to 186.0 cm (168.4 ± 9.7 cm).
Participants were judged to be healthy as based on medical history, vital signs, complete
physical examination, neurological assessment, and 12-lead electrocardiogram, clinical
chemistry, hematology, urinalysis, and virological tests.
Each subject took an oral dose of 500 mg clarithromycin every 12 h for four consecutive
days (a total of seven doses, each single dose was 500 mg per 10 mL of clarithromycin
suspension equivalent to 500 mg clarithromycin, Klacid, Abbott B.V., Hoofddorp,
Netherlands). Subjects took the drug in the fasting state with 240 mL low-carbonated
calcium-poor mineral water. After each study drug administration the subjects lay in bed
for at least 3 hours. Consumption of alcohol was prohibited starting at 2 days, beverages or
foods containing methylxanthines starting at 2 days, and grapefruit products starting at 7
days predose, respectively. From approximately 8 hours before until approximately 4 hour
after each morning dosing and from approximately 2.5 hours before until approximately 3
hours after each evening dose no food was allowed. Identical food was given on all study
days. No fatty food was given during the entire study. No fluid intake from 1 hour before
until 2 hours postdose (with exception of the fluid for study drug administration) was
allowed. Thereafter, 120 mL of low-carbonated calcium-poor mineral water (room
temperature) was given every hour until 11 hours after morning administration. No
extensive fluid intakes (>120 mL/hour) were allowed during nights.
(ii) Sampling and assay. Blood samples were collected for quantification of
clarithromycin and its 14(R)-hydroxyl metabolite immediately before administration and
0.33, 0.67, 1, 1.5, 2, 2.5, 3, 3.5, 4, 4.5, 5, 5.5, 6, 8, and 12 h after the first, third and seventh
dose. Additionally, one sample each was taken immediately prior to the fifth and sixth
dose. Plasma samples were analyzed by a validated LC-MS/MS assay.
Briefly, plasma samples (0.1 mL) were precipitated by addition of 200 µL of acetonitrile
containing the internal standard. After thorough mixing, the samples were centrifuged for 5
minutes at 3,280 g at approximately +4 °C, and the supernatant was diluted (1:1) with
buffer. 15 µL of each sample were chromatographed on a reversed-phase column (Waters
Symmetryø C-8), eluted with an isocratic solvent system consisting of ammonium acetate
buffer and acetonitrile (65/35,v/v, pH 4) and monitored by LC-MS/MS with a SRM
method as follows: Precursor › product ion for clarithromycin m/z 749 › m/z 158, m/z
on June 5, 2018 by guesthttp://aac.asm
.org/D
ownloaded from

6
765 › m/z 158 for 14(R)-hydroxy-clarithromycin and m/z 838 › m/z 679 for internal
standard, all analyses were in positive mode. Under these conditions clarithromycin,
14(R)-hydroxy-clarithromycin and the internal standard were eluted after approximately
1.8, 0.8 and 2.0 minutes, respectively. The MacQuan software (version 1.6, PE Sciex,
Thornhill, Ontario, Canada, 1991 - 1998) was used for evaluation of chromatograms.
Plasma samples were measured against a plasma calibration row prepared by adding the
defined amounts of standard solution to drug-free human plasma. Spiked quality controls
(SQC) were prepared for determination of interassay variation by the addition of defined
amounts of the stock solution or the spiked control of higher concentration to defined
amounts of tested drug-free human plasma. There was no interference observed in plasma,
for clarithromycin, 14(R)-hydroxy-clarithromycin or the internal standard. Weighted linear
regression (1/ concentration2) was performed for calibration. Linearity of the calibration
curve could be shown in human plasma between 0.00992 µg/mL and 3.98 µg/mL for
clarithromycin and between 0.0101 and 4.04 µg/mL for 14(R)-hydroxy-clarithromycin.
Lower limit of quantification were identical with the lowest calibration levels.
The inter-day precision and the analytical recovery of the spiked quality control standards
of clarithromycin in human plasma ranged from 3.0 to 4.4 % and were 99.9 % (3.07
µg/mL), 100.4 % (1.02 µg/mL), 100.3 % (0.0941 µg/mL) and 100.9 % (0.0267 µg/mL),
respectively. The inter-day precision and the analytical recovery of the spiked quality
control standards of 14(R)-hydroxy-clarithromycin in human plasma ranged from 6.3 to
6.8 % and were 100.1 % (3.04 µg/mL), 97.2 % (1.01 µg/mL), 95.5 % (0.0930 µg/mL) and
96.8 % (0.0264 µg/mL), respectively.
(iii) Population pharmacokinetic analysis
Model development: A total of 624 samples of clarithromycin and 624 samples of its 14-
(R) hydroxyl metabolite from 12 subjects were co-modelled using the nonlinear mixed-
effects approach implemented in NONMEM V (level 1.1, NONMEM Project Group,
University of California at San Francisco, 1998). First-order conditional estimation with
the interaction estimation option was used. The model was specified as a set of differential
equations using the ADVAN6 subroutine and parameterized by clearance and volume of
distribution parameters.
A one-compartment open model with first-order absorption with or without a lag time was
tested to describe clarithromycin plasma concentration profiles after the first dose with
on June 5, 2018 by guesthttp://aac.asm
.org/D
ownloaded from

7
first-order elimination. A compartment for the hydroxyl metabolite was included.
Absorption behaviour could not be described properly by first-order absorption; therefore a
single phase Weibull function (WB) was tested. This function was coded as:
WB = 1-exp(-(kw*Tw) そ) where, kw is the absorption rate constant, Tw is the time after the previous fqug"cpf"そ"ku"vjg
shape parameter (24). This model appropriately described the absorption phase while using
more complicated input models was not successful.
Distribution process of the parent and metabolite was assumed to fellow linear
pharmacokinetics. This model was selected as a base structural model. Clarithromycin
clearance was modelled with linear and/or nonlinear kinetics including a Michaelis-Menten
model. Elimination of the metabolite was assumed to follow linear pharmacokinetics.
Individual body weights were related to a standard weight, i.e. 70 kg, and used as covariate
for apparent volumes of distribution and total clearances parameters of clarithromycin and
its metabolite as:
)70/(
)70/( 75.0
kgBWVV
kgBWCLCL
i
i
©?
©?/
/
where CLi and Vi stand for individual apparent total clearance and distribution volume
respectively, BW is the individual body weight expressed in kg; /
CL and /
V represent mean
clearance and mean volume of distribution, respectively, of typical subjects weighing 70
kg (1).
Statistical model: An exponential-variability model was included to describe between
subject variability for all pharmacokinetic parameters, with stepwise cumulative inclusion
of respective error terms. The model was )exp(jpj sjss ©? , where しj
is the estimate for
a pharmacokinetic parameter in the jth individual, しp is the population mean of the
pharmacokinetic parameter, and js
j represents the random deviate of a random variable
with zero mean and variance の2 that distinguishes the jth individual pharmacokinetic
parameter from the population mean.
Two separate residual variability terms, one for clarithromycin and the second for its
hydroxyl metabolite, were modelled using proportional and/or additive errors models.
Model selection: C" xkuwcn" kpurgevkqp" qh" kpfkxkfwcn" ewtxg" hkvu." PQPOGOÓu" qdlgevkxg
function, and standard diagnostic plots were used to determine the best model.
on June 5, 2018 by guesthttp://aac.asm
.org/D
ownloaded from

8
Additionally, precision of pharmacokinetic parameter estimates and variability estimates
were considered during model development. The predictive performance was evaluated by
visual predictive checks to assess, whether a model described the central tendency and
variability of the observations adequately. The median, 5th and 95th percentiles of the
concentration time curves were calculated by validated Perl scripts (4) (Active Perl,
version 5.10.0; ActiveState, Vancouver, Canada).
Simulation: Based on the final parameter estimates of the selected population model,
simulations were performed using NONMEM V to predict the concentration profiles for
multiple doses of 250, 500, 750, or 1000 mg twice daily. The simulation was done for
periods sufficient for achieving theoretical steady-state. For these doses, areas under the
plasma curves of the free drug form (fAUC0-24), the fAUC0-24 / MIC ratio and the
probability of attainment the pharmacodynamic target fAUC0-24 / MIC > 35 (9, 32) across
various MIC values were calculated in steady-state, assuming no significant change in
protein binding (23, 33).
Results
The absorption profiles of clarithromycin were best described by a Weibull absorption
model that resulted in a marked improvement in the objective function value QHX"*〉QHX."
- 86) compared with first order absorption model. A plot of mean plasma concentrations of
clarithromycin versus time after the first dose is shown in Figure 1. This figure shows how
the Weibull model best described the absorption phase in comparison with a standard first-
order absorption model.
Based on the administered multiple doses regimen of 500 mg, the apparent total drug
clearance of clarithromycin (CLp) was found to decrease with time in a nonlinear fashion
as shown by non-compartmental methods (3). As expected, a linear two-compartment
model could not describe this nonlinearity. Addition of a nonlinear elimination pathway
with Michaelis-Menten kingvkeu" kortqxgf" oqfgn" hkvvkpi" eqpukfgtcdn{" *〉QHX." - 252),
however the overall nonlinearity was still not properly explained as this model was not
able to capture maximum plasma concentrations of clarithromycin. Finally, the inhibitory
effect of clarithromycin on its apparent total clearance was modelled ÐmechanisticallyÑ by
addition of a hypothetical inhibition compartment. The concentration of the parent drug
was used to derive the extent of (reversible) inhibition in this compartment. Here, the total
apparent clearance of clarithromycin (CLp) was split into two components. The first
on June 5, 2018 by guesthttp://aac.asm
.org/D
ownloaded from

9
component was inhibited by the hypothetical clarithromycin concentration in the inhibition
compartment (Cinhibt), whereas the second component was not affected by Cinhibt. The
fraction of CLp that was not inhibited by Cinhibt was described as FCLp and its estimate
allowed to range from zero (i.e. 100% inhibition) to unity (i.e. no clearance inhibition)
(27). A transfer rate constant between parent and inhibition compartments (ik ) in addition
to the concentration in this compartment yielding 50% inhibition of clarithromycin
clearance (IC50) was included to explain the inhibition of clearance over time. This model
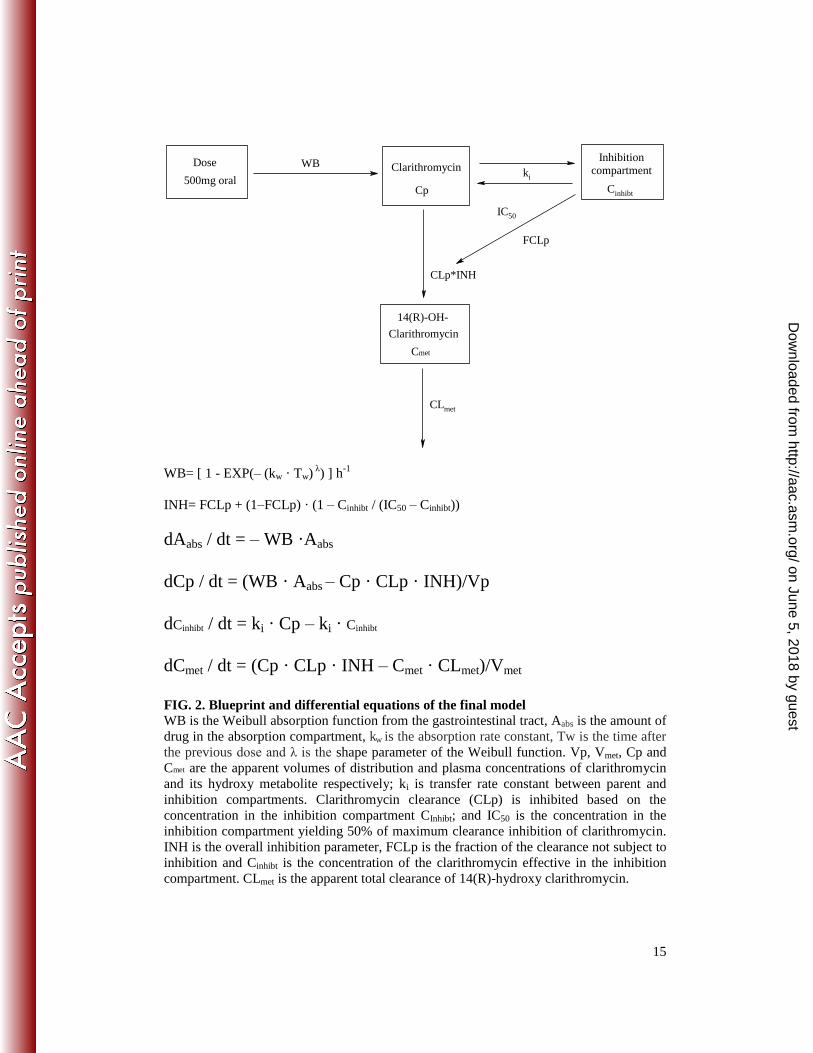
is blueprinted in Figure 2. Inclusion of the inhibition compartment side by side to the drug
model adequately described the nonlinear time-dependent auto-inhibition
pharmacokinetics of clarithromycin. This model led to a significant improvement in the
objective function compared to the Michaelis-Ogpvgp"gnkokpcvkqp"oqfgn"*〉QHX."- 752).
In the final model and for the available data, four between subject variability terms were
identified. In addition, residual additive error models resulted in the best model
convergence compared with proportional and or combined error models. Pharmacokinetic
parameter estimates of the final model are shown in Table 1. Standard goodness-of-fit plots
of the final model of clarithromycin and its 14-(R) hydroxy metabolite are given in Figure
3. These plots suggested that the selected autoinhibition model adequately described both
the plasma concentration time profiles of clarithromycin and its 14-(R) hydroxy metabolite
simultaneously.
The visual predictive check of clarithromycin and its metabolite indicated that the final
model could predict the observations including the maximum plasma concentrations
(Fig.4). The simulated 90% prediction interval closely reflected the observed plasma
concentrations of clarithromycin and 14-(R) hydroxy clarithromycin.
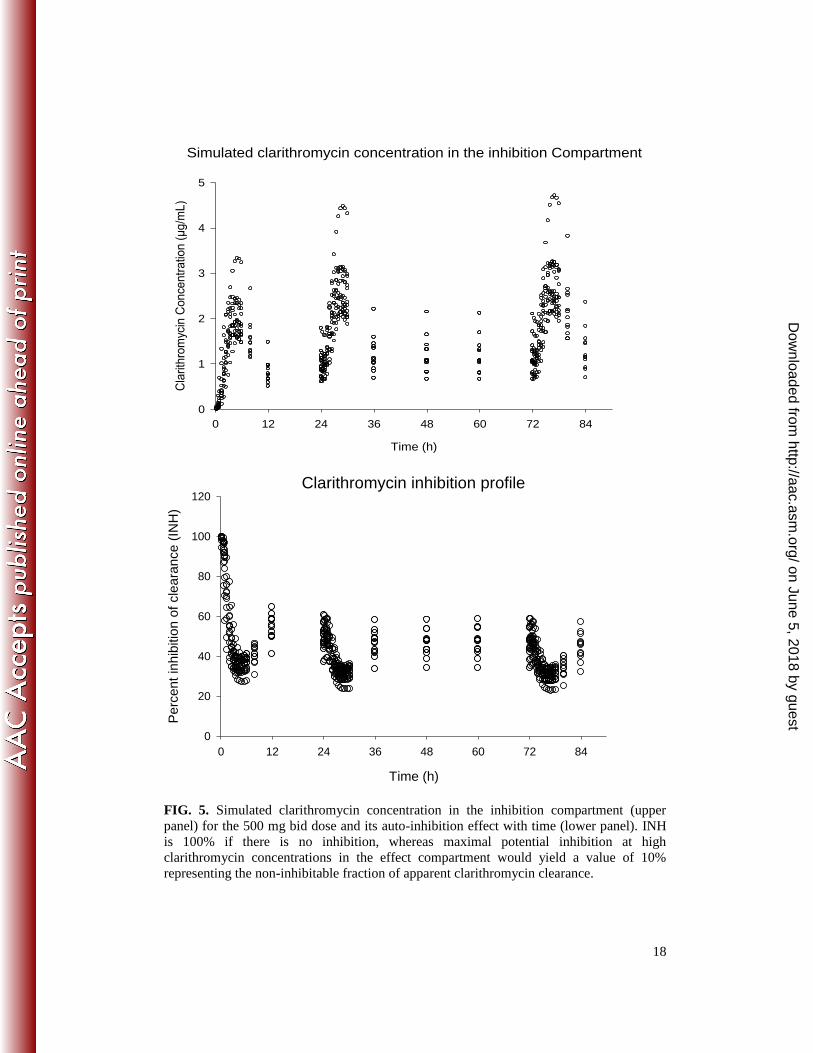
Concentrations of clarithromycin in the theoretical inhibition compartment as well as the
extent of time course inhibition are shown in Fig. 5. The plot suggested that inhibitions
started rapidly and that this 500 mg bid dose inhibited enzyme activity by approximately
50% to 70 % of initial values during steady state.
Based on the pharmacokinetic parameter estimates of the final model, the simulated
medians for four dose levels, i.e., 250, 500, 750 and 1000 mg twice daily (Fig. 6)
suggested that the extent of auto-inhibition and the emerging changes in pharmacokinetics
with time is much more pronounced for the higher doses. While for the 500 mg bid
standard dose no further increase of exposure occurs after the 2nd day of treatment, for a
1000 mg bid dose reaching steady state is expected to take several days. AUC values at
on June 5, 2018 by guesthttp://aac.asm
.org/D
ownloaded from

10
steady state for the 1000 mg bid dose would exceed those for the 500 mg bid dose by 3.6-
fold (Table 2). For the parent drug at steady state, the probability of achieving the target for
pathogens having MIC value of 0.5 mg/L is 0 %, 43 %, 94 % and 100 % for the 250, 500,
750 and 1000 mg doses, respectively (Table 2 and Figure 7).
Discussion
This study proposes a population pharmacokinetic model in which the nonlinearity in
clarithromycin pharmacokinetic profile was quantitatively described in term of an
inhibitable fraction of the total clearance. This was modelled by addition of an inhibition
compartment to the model, where the change of clarithromycin clearance over time in the
drug compartment is dependent on the concentration in the inhibition compartment. This
study supports the idea of explaining the auto-inhibition effect of a drug on its
metabolizing enzyme by inclusion of the inhibition compartment side by side to drug
compartment. This model was successively used to describe the inhibitory effect of
linezolid on its own metabolizing enzyme and the nonlinear increase in the extent of
bioavailability, which leads to the appearance of the side effects with time (27). The new
features of our model were the incorporation of a Weibull function input, the allometric
scaling approach for the covariate Ðdqf{" weightÑ on clearance and volumes of
distributions, the ability to describe parent and metabolite plasma concentration profiles, as
well as the auto-inhibition process of the parent elimination over time.
A single Weibull function successfully described the absorption process of clarithromycin.
The adequacy of the Weibull function emerges in its ability to reflect the change in the
absorption process from linearity with time, most probably as a consequence of intestinal
CYP inactivation. Thus, an adequate empirical description of the absorption phase greatly
contributed to the successful modelling of the non-linear elimination.
In the final model, distribution of clarithromycin throughout the body was assumed to
follow linear kinetics and a one-compartment model was sufficient. This is in accordance
with a previous study (5) and with data on tissue pharmacokinetics obtained by
microdialyses showing that elimination rather than distribution processes govern the
concentration vs. time profiles (33). Clarithromycin was estimated to enter the inhibition
compartment rapidly, with an average half-li fe of approximately about 0.35 h (Table 1). A
component of apparent total clearance of clarithromycin was subjected to inhibition by its
on June 5, 2018 by guesthttp://aac.asm
.org/D
ownloaded from

11
concentration in the inhibition compartment. The inhibitable component expresses the
function of the activity of clarithromycin metabolizing enzymes, mainly CYP3A4, which
is assumed to be inhibited with time by clarithromycin itself. This inhibition was quantified
by incorporating an inhibition compartment into the drug model. The fraction of
clarithromycin clearance that was inhibited over time was a function of the clarithromycin
concentration in this compartment. As shown in individual predictions versus observations
plot for clarithromycin (Figure 3), the observed peak concentrations were slightly higher
than the fitted concentrations. This might have been caused by the presence of a second
disposition compartment. Attempts to estimate a model with two disposition compartments
for clarithromycin however were unsuccessful.
The active metabolite 14-(R) hydroxyclarithromycin may be formed in part in the
enterocytes as a result of first pass metabolism. This process could not be modelled
separately here because the metabolite was not administered separately neither
clarithromycin i.v. data were available in this study. Thus, the final model assumption was
that all clarithromycin molecules are converted to the metabolite. Modelling additional
elimination pathways was not possible because neither metabolite formation fraction was
known nor the metabolite was administrated intravenously. This assumption should not
affect the quality of the model fits or its predictive performance. Modelling the elimination
process of the hydroxyl metabolite with a saturable kinetic model did not improve the
model fitting, however, circumstantial evidence for nonlinearity has been reported (5, 12)
as this metabolite undergoes further biotransformation (12, 35).
For the final model, apparent volume of distribution of clarithromycin was 172 litres
(95%CI 145Î198), which is in agreement with the previously reported range 126-306 litres
(5, 33). The apparent total clearance of clarithromycin was 60 L/h and it could be inhibited
to 10% of its original value (Table 1). This point estimate of oral clearance is the basic
clearance value and decreases over time with the subsequent doses until steady state is
achieved. Hence, it should not be compared directly with the previously reported range for
apparent total clearances at steady state 19-105 L/h with similar regimens (5, 15, 33). This
decrease in the clarithromycin clearance reflects the increasing inhibition of the
metabolizing enzyme CYP3A during long-term clarithromycin intake, which is important
to optimize dosage regimens of co-administered CYP3A substrates. However, more
complex inhibition models are probably required if other compounds that modify CYP3A4
on June 5, 2018 by guesthttp://aac.asm
.org/D
ownloaded from

12
activities or expression are present, the model is still be considered as long as no specific
data for these substrates are available. Furthermore, an approximate 60 % decrease in
CYP3A activity was observed for 500 mg clarithromycin bid at the steady state (Fig. 5,
lower panel). Therefore, concentrations of co-administered CYP3A-substrates may be
more than doubled which may reach clinical relevance (14). For higher doses, a further
pronounced decrease of CYP3A activity is to be expected (Fig. 6, Table 2).
The application of the fAUC/MIC concept for the current study assumes that the model
adequately describes the pharmacokinetics of clarithromycin including its metabolism and
that clarithromycin mediates the main part of the antimicrobial activity while the
metabolite makes only a minor contribution. The appropriateness of the former assumption
was confirmed via visual predictive checks. Given that the AUC of clarithromycin is
approximately 3-times as high as for its metabolite, the latter assumption seems reasonable
(18, 20). The calculated fAUC24, plasma values at steady state after different doses indicated
that the normal adult dose of 500 mg bid is sufficient to produce effective antibacterial
activity (fAUC/MIC >35 (33)) as long as the desired MIC of the pathogens is
approximately 0.25 mg/L or lower (Table 2) with a probability for target attainment of
91% (Figure 7). The presented model suggests that increasing the dose two-fold from 500
mg b.i.d. to 1000 mg b.i.d. would increase steady state exposure of clarithromycin by
almost 4-fold, suggesting that infections with pathogens with MIC values of up to 1 mg/L
could be treated successfully. However, further clinical studies are required to support this
conclusion.
Because of both a rapid elimination and a rapid exchange with tissues including the
inhibition compartment defined here, in subjects without hepatic and/or renal failure no
further increase of exposure upon chronic administration of the 500 mg standard dose is
expected after the 2nd day of treatment (Fig. 6). Accordingly, both therapeutic action and
inhibitory effects on co-administered drugs should have reached its maximum on the 2nd
day. This provides some re-assurance that no late augmentation of any drug interactions
would occur, although depending on the co-administered drug it may take longer than 2
days to subsequently reach its new steady-state. Also, the hope for subsequently increasing
concentrations to support continuation of an unsuccessful antimicrobial therapy beyond a
few days of treatment seems not justified for the 500 mg dose. In contrast, it may take
several days until steady state is reached with the 1000 mg bid dose (Fig. 6), thus changes
on June 5, 2018 by guesthttp://aac.asm
.org/D
ownloaded from

13
in the extent of inhibition and in the bacterial susceptibility e.g. due to emergence of
resistance need to be taken into account during this period. The theoretical benefit of the
high increase in plasma concentrations with increasing the dose to obtain better clinical
outcomes remains to be assessed in clinical trials. Because it will take some time for the
auto-inhibition of clearance to result in notably higher AUCs and the clinical success
probably depends on antimicrobial exposure during the first day(s) of therapy, the clinical
benefit of the auto-inhibition might be less pronounced than predicted by the steady-state
AUCs. For the same reasons, it might be reasonable considering a clarithromycin loading
dose.
Thus, the developed semi-mechanistic population PK model has the advantage of the
ability to describe both the concentration-time course of clarithromycin concentrations and
of the inhibitory action on CYP3A, and especially the change of its clearance over time.
Vjg"oqfgn"fqgu"pqv"kpeqtrqtcvg"ÐcnnÑ"wpfgtn{kpi"ogejcpkuou."uwej"cu"clarithromycin first
pass metabolism and a separate time course for inhibition of intestinal and hepatic CYP3A
enzymes. However, the model was still useful for the assessment of a possible dose
adjustment, as well as for the purpose of further pharmacokinetic/pharmacodynamic
considerations and model development activities.
In conclusion, this study identified and quantified a time-dependent decrease of
clarithromycin clearance in a non-linear fashion, which was completed on the 2nd day of
treatment for the 500 mg bid doses. Reaching steady state was predicted to take several
days for a 1000 mg bid dose. A semi-mechanistic population pharmacokinetic model for
clarithromycin and its 14-(R) hydroxy metabolite was developed, which provides an
adequate description of the time course of clearance inhibition within the used regimen.
The seemingly atypical absorption process could be the result of saturable / inhibited first
pass metabolism and may contribute to the overall nonlinear profiles of clarithromycin.
The presented model serves as a useful tool to predict clarithromycin plasma
concentrations and provides a rationale to improve its safety with regard to drug-drug
interactions and its efficacy based on PK/PD consideration. The applicability of the model
in the presence of additional CYP3A ligands (inhibitors or substrates) and the potential
clinical benefit of the pronounced increase in plasma concentrations with increasing the
clarithromycin dose remain to be assessed in further clinical trials.
on June 5, 2018 by guesthttp://aac.asm
.org/D
ownloaded from

14
Figures
Time (h)
0 2 4 6 8 10 12
Enctkvjtqo
{ekp"eqpegpvtcvkqpu"*-
i1oN+
0.0
0.5
1.0
1.5
2.0
2.5actual concentrationfirst orderfist order with lag timeWeibull function
FIG. 1. Geometric mean plasma concentration-time profile of clarithromycin after the first dose: Weibull vs. first order absorption using linear elimination pathway.
on June 5, 2018 by guesthttp://aac.asm
.org/D
ownloaded from
15
Dose Clarithromycin
Cp
14(R)-OH-
Clarithromycin
Cmet
Inhibition compartment
CLmet
CLp*INH
WB
500mg oral
FCLp
IC50
ki
Cinhibt
WB= [ 1 - EXP(Î (kw · Tw) そ) ] h-1
INH= FCLp + (1ÎFCLp) · (1 Î Cinhibt / (IC50 Î Cinhibt))
dAabs / dt = Î WB ·Aabs
dCp / dt = (WB · Aabs Î Cp · CLp · INH)/Vp
dCinhibt / dt = ki · Cp Î ki · Cinhibt
dCmet / dt = (Cp · CLp · INH Î Cmet · CLmet)/Vmet
FIG. 2. Blueprint and differential equations of the final model WB is the Weibull absorption function from the gastrointestinal tract, Aabs is the amount of drug in the absorption compartment, kw is the absorption rate constant, Tw is the time after the previous fqug"cpf"そ"ku"vjg shape parameter of the Weibull function. Vp, Vmet, Cp and Cmet are the apparent volumes of distribution and plasma concentrations of clarithromycin and its hydroxy metabolite respectively; ki is transfer rate constant between parent and inhibition compartments. Clarithromycin clearance (CLp) is inhibited based on the concentration in the inhibition compartment CInhibt; and IC50 is the concentration in the inhibition compartment yielding 50% of maximum clearance inhibition of clarithromycin. INH is the overall inhibition parameter, FCLp is the fraction of the clearance not subject to inhibition and Cinhibt is the concentration of the clarithromycin effective in the inhibition compartment. CLmet is the apparent total clearance of 14(R)-hydroxy clarithromycin.
on June 5, 2018 by guesthttp://aac.asm
.org/D
ownloaded from

16
Clarithromycin
Qdugtxgf"eqpegpvtcvkqpu"*-i1oN+0 1 2 3 4 5
Rqrw
ncvkqp"rtgf
kevkqpu"*-
i1oN+
0
1
2
3
4
514-OH-clarithromycin
Qdugtxgf"eqpegpvtcvkqpu"*-i1oN+0.0 0.4 0.8 1.2 1.6
Rqrw
ncvkqp"rtgf
kevkqpu"*-
i1oN+
0.0
0.4
0.8
1.2
1.6
Clarithromycin
Qdugtxgtf"eqpegpvtcvkqpu"*-i1oN+0 1 2 3 4 5
Kpfkxkfw
cn"rtgfkevkqpu"*-
i1oN+
0
1
2
3
4
514-OH-clarithromycin
Qdugtxgf"eqpegpvtcvkqpu"*-i1oN+0.0 0.4 0.8 1.2 1.6
Kpfkxkfw
cn"rtgfkevkqpu"*-
i1oN+
0.0
0.4
0.8
1.2
1.6
Clarithromycin
Rqrwncvkqp"rtgfkevkqpu"*-i1oN+0 1 2 3 4 5
Wei
ghte
d re
sidu
als
-6
-4
-2
0
2
4
614-OH-clarithromycin
Rqrwncvkqp"rtgfkevkqpu"*-i1oN+0.0 0.2 0.4 0.6 0.8 1.0 1.2 1.4
Wei
ghte
d re
sidu
als
-8
-6
-4
-2
0
2
4
6
8
Clarithromycin
Time (h)
0 20 40 60 80 100
Wei
ghte
d re
sidu
als
-6
-4
-2
0
2
4
6 14-OH-clarithromycin
Time (h)
0 20 40 60 80 100
Wei
ghte
d re
sidu
als
-8
-6
-4
-2
0
2
4
6
8
FIG. 3 Goodness-of-fit plots for the final model with unity and zero lines for clarithromycin and its hydroxyl metabolite in the left and right panels, respectively
on June 5, 2018 by guesthttp://aac.asm
.org/D
ownloaded from

17
Clarithromycin
0 12 24 36 48 60 72 84
Rncuoc"eqpegpvtc
vkqp"*-i1oN+
0
1
2
3
4
5
6
raw datamedian5th percentile95th percentile
14(R)-Hydroxy clarithromycin
Time (h)
0 12 24 36 48 60 72 84
Rncuoc"eqpegpvtc
vkqp"*-i1oN+
0.0
0.4
0.8
1.2
1.6
2.0
raw datamedian5th percentile95th percentile
Time (h)
FIG. 4. Visual predictive check of the final model for original plasma concentrations of clarithromycin (upper panel) and hydroxyl clarithromycin (lower panel) after multiple dosing. Circles correspond to the actual plasma concentrations. Lines represent 5%, median and 95% percentiles.
on June 5, 2018 by guesthttp://aac.asm
.org/D
ownloaded from
18
Simulated clarithromycin concentration in the inhibition Compartment
Time (h)
0 12 24 36 48 60 72 84
Enctkvjtqo{ekp"Eqpegpvtcvkqp"*-i1oN+
0
1
2
3
4
5
Clarithromycin inhibition profile
Time (h)
0 12 24 36 48 60 72 84
Per
cent
inhi
bitio
n of
cle
aran
ce (
INH
)
0
20
40
60
80
100
120
FIG. 5. Simulated clarithromycin concentration in the inhibition compartment (upper panel) for the 500 mg bid dose and its auto-inhibition effect with time (lower panel). INH is 100% if there is no inhibition, whereas maximal potential inhibition at high clarithromycin concentrations in the effect compartment would yield a value of 10% representing the non-inhibitable fraction of apparent clarithromycin clearance.
on June 5, 2018 by guesthttp://aac.asm
.org/D
ownloaded from
19
Time (h)
0 12 24 36 48 60 72 84 96 108
Eqpegpvtcvkqp"*-i1oN+
0
2
4
6
8
101000 mg750 mg500 mg250 mg
FIG. 6. Simulated median plasma concentrations of clarithromycin after 12 doses clarithromycin twice-daily at dose of 250, 500, 750 and 1000 mg
MIC (mg/L)
0.06 0.125 0.25 0.5 1 2 4 8
Pro
babi
lity
of ta
rget
atta
inm
ent (
%)
0
20
40
60
80
100
250 mg500 mg750 mg1000 mg
FIG. 7. Probability of target attainment of free clarithromycin (i.e. fAUC24h / MIC >35) at steady state for various MIC values upon b.i.d. administration of the respective clarithromycin doses.
on June 5, 2018 by guesthttp://aac.asm
.org/D
ownloaded from

20
Tables
TABLE 1. Estimates of population pharmacokinetic parameters of clarithromycin and 14(R)-hydroxy clarithromycin
Parameter Unit Point estimate 95% CI
Weibull absorption rate constant (kw) hr-1 0.56 0.42 Î 0.69 Weibull shape parameter *そ+ 2.23 1.67 Î 2.77 Apparent volume of distribution of clarithromycin (Vp) L 172 145 Î 198 Apparent total clearance of clarithromycin (CLp) L/hr 60 40 Î 80 Non-inhibited fraction of clarithromycin clearance (FCLp) 0.10 0.02 Î 0.17 Transfer ate constant into and from inhibition compartment (ki) hr-1 2.01 0.09 Î 3.93 Concentration in the inhibition compartment yielding 50% inhibition of maximum clearance (IC50)
µg/mL 0.77 0.23 Î 1.28
Apparent total clearance of 14-OH-clarithromycin (CLmet) L/hr 50.2 42.3 Î 58.1 Apparent volume of distribution of 14-OH-clarithromycin (Vmet ) L 34 12 Î 56 Between subject variability* Between subject variability in kw
45.3*
7.93%& Between subject variability in Vp 25.3* 2.83%& Between subject variability in CLp 17.4* 1.15%& Between subject variability in CLmet Residual variability
27.9* 2.11%&
Additive error of clarithromycin µg/mL 0.12 2.40%& Additive error of 14-OH-clarithromycin µg/mL 0.01 0.18%& * Coefficient of variation (%); &: These percentages are relative standard errors of the estimated variance.
on June 5, 2018 by guesthttp://aac.asm
.org/D
ownloaded from

21
TABLE 2. Simulation of main pharmacokinetic/pharmacodynamic parameters of clarithromycin and 14-(R) hydroxyclarithomycin after multiple ascending doses using the population model estimates.
Values were calculated on a basis of twice daily oral dosing and represent median and 90% nonparametric prediction intervals. fAUCinitial 0-24 h and fAUCss, 24h are the areas under the free concentration-time curves over 24h on the first day and in steady-state. The fAUC was calculated by correcting the total AUC for the free fraction (f) which is 0.3 assuming non-significant change in protein binding (23, 33). na: not applicable. a assuming that a (fAUC ss, 24 h plasma) /MIC ratio target of at least 35 is desirable in humans for pathogens eradication (32).
Dose (mg) fAUCinitial 0-24 h 90% PI
*-i"̋j"1oN+
fAUC ss, 24 h 90% PI
*-i"̋j"1oN+
Probability of target attainment (%) on steady state at different MIC values a
0.03
mg/L
0.06
mg/L
0.125
mg/L
0.25
mg/L
0.5
mg/L
1
mg/L
2
mg/L
4
mg/L
clar
ithro
myc
in
250 4.64 (1.06 Î 9.20)
5.1 (1.19 Î 10.18)
100 99 56 3 0 0 0 0
500 11.11 (5.10 Î 20.0)
15.10 (6.9 Î 31.9)
100 100 100 91 43 3 0 0
750 19.74 (10.9 Î 34.7)
33.4 (17.4 Î 62)
100 100 100 100 92 49 2 0
1000 28.71 (18.2 Î 51.2)
54.3 (30.4 Î 95.0)
100 100 100 100 100 83 24 0
14-O
H-
clar
ithro
myc
in
250 2.83 (1.16 Î 5.07)
3.17 (1.29 Î 5.57)
na
500 5.0 (2.45 Î 8.39)
6.29 (3.29 Î 10.25)
na
750 6.81 (3.75 Î 11.14)
9.42 (5.34 Î 15.10)
na
1000 8.29 (4.46 Î 13.63)
12.48 (7.24 Î 19.19)
na
on June 5, 2018 by guesthttp://aac.asm
.org/D
ownloaded from

22
References:
1. Anderson, B. J., A. D. McKee, and N. H. Holford. 1997. Size, myths and the clinical pharmacokinetics of analgesia in paediatric patients. Clin Pharmacokinet 33:313-27.
2. Bruce, M. A., S. D. Hall, B. D. Haehner-Daniels, and J. C. Gorski. 2001. In vivo effect of clarithromycin on multiple cytochrome P450s. Drug Metab Dispos 29:1023-8.
3. Bulitta, J., S. Horkovics-Kovats, M. Borek, A. Skott, M. Illauer, M. Rodamer, M. Kinzig-Schippers, and F. Sörgel. 2003. Self-Kpjkdkvkqp" qh" Enctkvjtqo{ekpÓu"(CLA) Metabolism in Humans at Steady-State. Poster A-1625, 43rd Interscience Conference on Antimicrobial Agents and Chemotherapy; Chicago, Illinois/USA; September 14 - 17.
4. Bulitta, J. B., S. B. Duffull, M. Kinzig-Schippers, U. Holzgrabe, U. Stephan, G. L. Drusano, and F. Sorgel. 2007. Systematic comparison of the population pharmacokinetics and pharmacodynamics of piperacillin in cystic fibrosis patients and healthy volunteers. Antimicrob Agents Chemother 51:2497-507.
5. Chu, S., D. S. Wilson, R. L. Deaton, A. V. Mackenthun, C. N. Eason, and J. H. Cavanaugh. 1993. Single- and multiple-dose pharmacokinetics of clarithromycin, a new macrolide antimicrobial. J Clin Pharmacol 33:719-26.
6. Chu, S. Y., R. Deaton, and J. Cavanaugh. 1992. Absolute bioavailability of clarithromycin after oral administration in humans. Antimicrob Agents Chemother 36:1147-50.
7. Chu, S. Y., G. R. Granneman, P. J. Pichotta, J. P. Decourt, J. Girault, and J. B. Fourtillan. 1993. Effect of moderate or severe hepatic impairment on clarithromycin pharmacokinetics. J Clin Pharmacol 33:480-5.
8. Chu, S. Y., L. T. Sennello, S. T. Bunnell, L. L. Varga, D. S. Wilson, and R. C. Sonders. 1992. Pharmacokinetics of clarithromycin, a new macrolide, after single ascending oral doses. Antimicrob Agents Chemother 36:2447-53.
9. Craig, W. A., S. Kiem, and D. R. Andes. Free Drug 24-Hr AUC/MIC is the PK/PD Target that Correlates with In Vivo Efficacy of Macrolides, Azalides, Ketolides and Clindamycin. Intersci Conf Antimicrob Agents Chemother. 2002 Sep 27-30; 42: abstract no. A-1264.
10. Davey, P. G. 1991. The pharmacokinetics of clarithromycin and its 14-OH metabolite. J Hosp Infect 19 Suppl A:29-37.
11. Fernandes, P. B., R. Bailer, R. Swanson, C. W. Hanson, E. McDonald, N. Ramer, D. Hardy, N. Shipkowitz, R. R. Bower, and E. Gade. 1986. In vitro and in vivo evaluation of A-56268 (TE-031), a new macrolide. Antimicrob Agents Chemother 30:865-73.
12. Ferrero, J. L., B. A. Bopp, K. C. Marsh, S. C. Quigley, M. J. Johnson, D. J. Anderson, J. E. Lamm, K. G. Tolman, S. W. Sanders, J. H. Cavanaugh, and R. C. Sonders. 1990. Metabolism and disposition of clarithromycin in man. Drug Metab Dispos 18:441-6.
13. Fraschini, F., F. Scaglione, and G. Demartini. 1993. Clarithromycin clinical pharmacokinetics. Clin Pharmacokinet 25:189-204.
14. Fuhr, U. 2008. Improvement in the handling of drug-drug interactions. Eur J Clin Pharmacol 64:167-71.
on June 5, 2018 by guesthttp://aac.asm
.org/D
ownloaded from
23
15. Gorski, J. C., D. R. Jones, B. D. Haehner-Daniels, M. A. Hamman, E. M. O'Mara, Jr., and S. D. Hall. 1998. The contribution of intestinal and hepatic CYP3A to the interaction between midazolam and clarithromycin. Clin Pharmacol Ther 64:133-43.
16. Hung, I. F., A. K. Wu, V. C. Cheng, B. S. Tang, K. W. To, C. K. Yeung, P. C. Woo, S. K. Lau, B. M. Cheung, and K. Y. Yuen. 2005. Fatal interaction between clarithromycin and colchicine in patients with renal insufficiency: a retrospective study. Clin Infect Dis 41:291-300.
17. Ishii, K., Y. Saito, S. Itai, M. Nemoto, K. Takayama, and T. Nagai. 1998. Comparative study of pharmacokinetic parameters between clarithromycin and erythromycin stearate in relation to their physicochemical properties. Drug Dev Ind Pharm 24:129-37.
18. Jones, R. N., M. E. Erwin, and M. S. Barrett. 1990. In vitro activity of clarithromycin (TE-031, A-67268) and 14OH-clarithromycin alone and in combination against Legionella species. Eur J Clin Microbiol Infect Dis 9:846-8.
19. Langtry, H. D., and R. N. Brogden. 1997. Clarithromycin. A review of its efficacy in the treatment of respiratory tract infections in immunocompetent patients. Drugs 53:973-1004.
20. Martin, S. J., C. G. Garvin, C. R. McBurney, and E. G. Sahloff. 2001. The activity of 14-hydroxy clarithromycin, alone and in combination with clarithromycin, against penicillin- and erythromycin-resistant Streptococcus pneumoniae. J Antimicrob Chemother 47:581-7.
21. Mayhew, B. S., D. R. Jones, and S. D. Hall. 2000. An in vitro model for predicting in vivo inhibition of cytochrome P450 3A4 by metabolic intermediate complex formation. Drug Metab Dispos 28:1031-7.
22. Noreddin, A. M., D. Roberts, K. Nichol, A. Wierzbowski, D. J. Hoban, and G. G. Zhanel. 2002. Pharmacodynamic modeling of clarithromycin against macrolide-resistant [PCR-positive mef(A) or erm(B)] Streptococcus pneumoniae simulating clinically achievable serum and epithelial lining fluid free-drug concentrations. Antimicrob Agents Chemother 46:4029-34.
23. Peters, D. H., and S. P. Clissold. 1992. Clarithromycin. A review of its antimicrobial activity, pharmacokinetic properties and therapeutic potential. Drugs 44:117-64.
24. Petricoul O, C. V., Fuseau E and Marchand M 2007. Population models for drug absorption and enterohepatic recycling. In: Ette EI and Williams (ed) Pharmacometrics; the science of quantitative pharmacology, 1st edn. John Wiley & Sons, New Jersey, pp345-382.
25. Pinto, A. G., J. Horlander, N. Chalasani, M. Hamman, A. Asghar, D. Kolwankar, and S. D. Hall. 2005. Diltiazem inhibits human intestinal cytochrome P450 3A (CYP3A) activity in vivo without altering the expression of intestinal mRNA or protein. Br J Clin Pharmacol 59:440-6.
26. Pinto, A. G., Y. H. Wang, N. Chalasani, T. Skaar, D. Kolwankar, J. C. Gorski, S. Liangpunsakul, M. A. Hamman, M. Arefayene, and S. D. Hall. 2005. Inhibition of human intestinal wall metabolism by macrolide antibiotics: effect of clarithromycin on cytochrome P450 3A4/5 activity and expression. Clin Pharmacol Ther 77:178-88.
27. Plock, N., C. Buerger, C. Joukhadar, S. Kljucar, and C. Kloft. 2007. Does linezolid inhibit its own metabolism? Population pharmacokinetics as a tool to
on June 5, 2018 by guesthttp://aac.asm
.org/D
ownloaded from

24
explain the observed nonlinearity in both healthy volunteers and septic patients. Drug Metab Dispos 35:1816-23.
28. Rodrigues, A. D., E. M. Roberts, D. J. Mulford, Y. Yao, and D. Ouellet. 1997. Oxidative metabolism of clarithromycin in the presence of human liver microsomes. Major role for the cytochrome P4503A (CYP3A) subfamily. Drug Metab Dispos 25:623-30.
29. Rodvold, K. A. 1999. Clinical pharmacokinetics of clarithromycin. Clin Pharmacokinet 37:385-98.
30. Sturgill, M. G., and R. P. Rapp. 1992. Clarithromycin: review of a new macrolide antibiotic with improved microbiologic spectrum and favorable pharmacokinetic and adverse effect profiles. Ann Pharmacother 26:1099-108.
31. Suzuki, A., I. Iida, M. Hirota, M. Akimoto, S. Higuchi, T. Suwa, M. Tani, T. Ishizaki, and K. Chiba. 2003. CYP isoforms involved in the metabolism of clarithromycin in vitro: comparison between the identification from disappearance rate and that from formation rate of metabolites. Drug Metab Pharmacokinet 18:104-13.
32. Tessier, P. R., M. K. Kim, W. Zhou, D. Xuan, C. Li, M. Ye, C. H. Nightingale, and D. P. Nicolau. 2002. Pharmacodynamic assessment of clarithromycin in a murine model of pneumococcal pneumonia. Antimicrob Agents Chemother 46:1425-34.
33. Traunmuller, F., M. Zeitlinger, P. Zeleny, M. Muller, and C. Joukhadar. 2007. Pharmacokinetics of single- and multiple-dose oral clarithromycin in soft tissues determined by microdialysis. Antimicrob Agents Chemother 51:3185-9.
34. Ushiama, H., H. Echizen, S. Nachi, and A. Ohnishi. 2002. Dose-dependent inhibition of CYP3A activity by clarithromycin during Helicobacter pylori eradication therapy assessed by changes in plasma lansoprazole levels and partial cortisol clearance to 6beta-hydroxycortisol. Clin Pharmacol Ther 72:33-43.
35. Yamamoto, F., S. Harada, T. Mitsuyama, Y. Harada, Y. Kitahara, M. Yoshida, and Y. Nakanishi. 2004. Concentration of clarithromycin and 14-R-hydroxy-clarithromycin in plasma of patients with Mycobacterium avium complex infection, before and after the addition of rifampicin. Jpn J Antibiot 57:124-33.
36. Zhou, S., S. Yung Chan, B. Cher Goh, E. Chan, W. Duan, M. Huang, and H. L. McLeod. 2005. Mechanism-based inhibition of cytochrome P450 3A4 by therapeutic drugs. Clin Pharmacokinet 44:279-304.
on June 5, 2018 by guesthttp://aac.asm
.org/D
ownloaded from
![ClaPD (Clarithromycin/[Biaxin®], Pomalidomide ...static9.light-kr.com/documents/Mark - ASH 2012 - Clarithromycin...SPEAKER: Tomer Mark MD, MSc ... PD 10 (10) IMWG, ... • The addition](https://static.fdocuments.in/doc/165x107/5aaaed457f8b9a95188eb76b/clapd-clarithromycinbiaxin-pomalidomide-ash-2012-clarithromycinspeaker.jpg)