Keywords: Nomenclature: Greek Symbols: IJOART · International Journal of Advancements in Research...
23
International Journal of Advancements in Research & Technology, Volume 5, Issue 8, August-2016 9 ISSN 2278-7763 Copyright © 2016 SciResPub. IJOART Development of Desalination system using Reverse Osmosis M.G.Mousa, Kamal El-Nahhas and Layla K. Haythoor Master student in Mechanical Power Engineering Depart., Faculty of Engineering, Mansoura University, Egypt Abstract The present work are a theoretical and an experimental investigation based on the influence of the main operation parameters on the performance of the RO elements. The theoretical work is experiment is performed in order to measure the total dissolved salts, PH and conductivity of the permeate water when different temperatures and concentrations values for the Feed water. Combined between RO desalination system and heater system would improve the performance of the system as the results which is clarified under the temperature limits to prevent scaling and fouling deposition. Temperature of the feed water is the most noticeable environmental condition affecting the performance of RO systems. The general rule of thumb is to estimate productivity change at 3% per degree Celsius, °C change from the standard of 25 °C. There are equations to provide a more exact estimate of productivity. Pressure is approximated by direct proportionality to productivity. Temperature correction is an exponential function related to the membrane material. Keywords: Desalination, thermal systems, membrane distillation, Energy consumption,permeate water. Nomenclature: T Temperature, °C C Concentration of the salts, mg/l K Thermal conductivity, W/m.K Cp Specific heat, J/kg.K Greek Symbols: ρ Density, kg/m3 μ Dynamic viscosity, N.S/m2 ϑ kinematic viscosity α Thermal diffusivity θ constant heat flux or constant temperature βvolumetric thermal expansion coefficient(equal to approximately 1/T, for ideal gases, where T is absolute temperature) ω Vorticity ψ Stream function Subscript: SEC Specific Energy Consumption ED Energy device ------------------------------------------------------------------ Introduction Due to the membrane's sensitivity to corrosive and oxidizing environments, average membrane life is between 1 and 3 years. RO is used alone or with pre- and/or post-treatment equipment to meet a specified requirement for water quality. Reverse osmosis is now used to treat hazardous waste as industrial processes have changed and environmental regulations become more stringent. One such IJOART
Transcript of Keywords: Nomenclature: Greek Symbols: IJOART · International Journal of Advancements in Research...

International Journal of Advancements in Research & Technology, Volume 5, Issue 8, August-2016 9 ISSN 2278-7763
Copyright © 2016 SciResPub. IJOART
Development of Desalination system using
Reverse Osmosis
M.G.Mousa, Kamal El-Nahhas and Layla K.
Haythoor
Master student in Mechanical Power
Engineering Depart., Faculty of Engineering,
Mansoura University, Egypt
Abstract
The present work are a theoretical
and an experimental investigation based on
the influence of the main operation
parameters on the performance of the RO
elements. The theoretical work is experiment
is performed in order to measure the total
dissolved salts, PH and conductivity of the
permeate water when different temperatures
and concentrations values for the Feed
water. Combined between RO desalination
system and heater system would improve
the performance of the system as the results
which is clarified under the temperature
limits to prevent scaling and fouling
deposition. Temperature of the feed water is
the most noticeable environmental condition
affecting the performance of RO systems.
The general rule of thumb is to estimate
productivity change at 3% per degree
Celsius, °C change from the standard of 25
°C. There are equations to provide a more
exact estimate of productivity. Pressure is
approximated by direct proportionality to
productivity. Temperature correction is an
exponential function related to the
membrane material.
Keywords: Desalination, thermal systems, membrane distillation, Energy consumption,permeate water. Nomenclature: T Temperature, °C C Concentration of the salts, mg/l K Thermal conductivity, W/m.K Cp Specific heat, J/kg.K Greek Symbols: ρ Density, kg/m3 μ Dynamic viscosity, N.S/m2 ϑ kinematic viscosity α Thermal diffusivity θ constant heat flux or constant temperature βvolumetric thermal expansion coefficient(equal to approximately 1/T, for ideal gases, where T is absolute temperature) ω Vorticity ψ Stream function Subscript: SEC Specific Energy Consumption ED Energy device ------------------------------------------------------------------ Introduction
Due to the membrane's sensitivity to
corrosive and oxidizing environments,
average membrane life is between 1 and 3
years. RO is used alone or with pre-
and/or post-treatment equipment to meet a
specified requirement for water quality.
Reverse osmosis is now used to treat
hazardous waste as industrial processes
have changed and environmental regulations
become more stringent. One such
IJOART

International Journal of Advancements in Research & Technology, Volume 5, Issue 8, August-2016 10 ISSN 2278-7763
Copyright © 2016 SciResPub. IJOART
application is the concentrating of metals in
rinse water in the metal plating industry. A
second application is the treatment of landfill
leachate and other liquids high in Total
Dissolved Solids (TDS) and Volatile Organic
Compounds (VOCs).
RO systems have limitations in plating
because the metals have high oxidation
potentials and the acid baths often have a
pH of less than (2.5) or greater than (11).
RO system alone cannot concentrate the
metals in rinse water to the strength of the
plating bath solution. An evaporator is
required to reach necessary concentrations
for reuse the plating bath [1]. The benefits
to using reverse osmosis are waste
reduction and/or concentration the waste for
disposal.
Water is one of the prime elements
responsible for life on earth perhaps fresh
water is the most important natural resource
for human survival and it is a human
necessity. Food production, industrial
productivity, energy production and the
global economy are dependent on
availability of water [4]. More than two-third
of the earth’s surface is covered with water
about 1.4x10⁹ km3 of water. Most of the
available water is either present as seawater
or icebergs in the Polar Regions. About 97%
of the earth’s water is salty and rest is fresh
water. Less than 1% fresh water is within
human reach. Despite, technological
progress, renewable fresh water reserves on
earth will be only 0.3% of the world water.
Agriculture uses two-third of available fresh
water. The proportion of irrigated surface
should increase by 1/3 in 2010 and by 50%
in 2025. Both forms are not easily
accessible for human use. Industrial and
domestic water use increases at twice the
rate of population increase. Water
consumption increased sevenfold since
1900. In total, water demand doubles every
20-year. Fresh water resources are almost
completely exhausted in many middle-east
countries.
1.2 Desalination Systems
The most commonly used in practice are
described. These systems are the multiple
effect (ME), Multi-stage flash (MSF), vapor
compression (VC), reverse osmosis
(RO),the electrodialysis (ED) desalination
systems, membrane distillation (MD) and
finally, solar energy powered desalination
systems. The most important features for
each system is explained.
1.2.1 Multiple Effects (ME) Distillation
IJOART

International Journal of Advancements in Research & Technology, Volume 5, Issue 8, August-2016 11 ISSN 2278-7763
Copyright © 2016 SciResPub. IJOART
In MED, a series of evaporator effects
produces water at progressively slightly
lower pressures. Because water boils at
lower temperatures as pressure decreases,
the water vapor of the first evaporator effect
serves as the heating medium for the
second evaporator effect, and so on. The
more effects, the higher the performance
ratio [4].
1.2.2 Multi Stage Flash (MSF) Distillation
Multi Stage Flash (MSF) Distillationwas the
first commercial plants were commissioned
in 1960 [5]. Seawater is pressurized and
flashed in various chambers at lower
pressures with a drastic reduction of the
specific heat transfer[6].
1.2.3 Vapor Compression (VC) Distillation
(VC) process refers to a distillation process
where the evaporation of sea or saline water
is obtained by the application of heat
delivered by compressed vapor. Since
compression of the vapor increases both the
pressure and temperature of the vapor, it is
possible to use the latent heat rejected
during condensation to generate additional
vapor.VC is normally applied to a single
effect and it takes place either by a high
speed centrifugal compressor (mechanical
vapor compression MVC) or by means of a
steam ejector (thermal vapor vapour
compression TVC) [7].
1.2.4 Reverse Osmosis (RO) Process
Reverse Osmosis (RO) Process is a
process where in a relatively pure solvent is
separated from a salt solution by using a
semipermeable membrane by the application
of hydrostatic pressure. In seawater
desalination it commonly ranges from 55 to
68 bar [8]. Operating pressures for the
purification of brackish water are lower due
to the lower osmotic pressure caused by
lower feed water salinity. Reverse osmosis
process can separate not only ions and low
molecular weight substances in the feed
water, but also most impure matters such as
bacteria and organic matters by the action of
pressure difference across the membrane
without any heat treatment and chemical
addition.
1.2.5 Electro dialysis (ED) Process
Electro dialysis (ED) Process is a
membrane process which upgrades brackish
water (up to 10000 ppm) by the use of
electrical energy to transfer ionized salts
from the feed water through a membrane,
leaving purified product water behind. The
basic unit in the ED process consists of two
metal electrodes (the cathode and the
IJOART

International Journal of Advancements in Research & Technology, Volume 5, Issue 8, August-2016 12 ISSN 2278-7763
Copyright © 2016 SciResPub. IJOART
anode) separated by two ion-exchange
membranes.
1.2.6 Membrane Distillation(MD)
Membrane Distillation (MD) is an emerging,
thermally driven membrane separation
process that utilizes a low-grade heat source
to facilitate mass transport through a
hydrophobic, micro porous membrane. The
driving force for mass transfer is a vapor
pressure gradient between a hot feed
solution and a colder distillate; MD is
capable of producing ultra-pure water; most
likely at lower cost compared to conventional
distillation processes. There are four unique
configurations: direct contact MD (DCMD),
vacuum MD (VMD), air gap MD (AGMD),
and sweeping gas MD (SGMD).DCMD and
AGMD are the most likely to be deployed as
either pretreatment or post-treatment [9].
1.2.7 Solar Desalination
Solar energy can be directly utilized to
produce fresh water [10] .The most efficient
solar distillation system is the simple solar
still which it consists of a basin coated with
black paint to increase the absorptivity of
solar radiation, covered with an inclined
glass cover. The salt water flows to the
basin in a shallow layer. The still may
continue to work after the sunset as long as
this temperature difference exist.
2.Literature Review
Desalination Technology is fasting growing
with a greater number of installation around
the world due to the capital cost and specific
energy consumption (SEC) reduction. The
spiral wound module is most popular among
RO membrane modules.There is many
studies and researches in development the
separations properties of the RO membrane
modules. But far fewer models have been
developed to describe the whole membrane
module.Senthilmurugan et al. [11]
developed a steady-state model for the
spiral wound module using a three-
parameter nonlinear membrane transport
model. Abbas [12] presented a semi-
rigorous steady-state model for simulation
and analysis of an industrial medium-scale
brackish water RO plant based on spiral-
wound membrane modules. Recently, Oh et
al. [13] proposed a simplified simulation
model based on the solution-diffusion theory
and multiple fouling mechanisms to analyze
the operation, optimization and performance
of RO systems. Kaghazchi et al. [14]
presented a semi-rigorous steady-state
model to simulate and investigate the
IJOART

International Journal of Advancements in Research & Technology, Volume 5, Issue 8, August-2016 13 ISSN 2278-7763
Copyright © 2016 SciResPub. IJOART
operation and performance of two industrial
seawater RO plants based on spiral-wound
membrane modules.
As mentioned by Marriott and Sorensen
[15] developed a detailed mathematical
model of a general membrane separation
process from rigorous mass, momentum and
energy balances and disregards some
common assumptions due to the complex
mechanism of flow through membrane
module and lots of idealized assumptions,
existing RO unit models are usually process
specific and are only valid within a limited
operating range.This work tries to study the
dynamic characteristics and process
operation aspects of an industrial large
scaled RO desalination plant. The feasible
steady-state and dynamic models of the
membrane modules and RO plants
presented in the literature are effectively
combined to develop the overall process
flow sheets for the industrial scale RO
desalination process by using powerful
commercial process design simulators.
Simulation results of the steady-state and
dynamic operating conditions of the
proposed RO process flow sheet are
compared to those shown in the literature.
Aim of the present work
In the present work the theoretical and
experimental study of reverse osmosis is
investigated. The operating parameter on
RO system are feed water in, temperature of
feed water inlet, input pressure of feed
water, and the concentration of salt on feed
water. Combined between RO desalination
system and heater system would improve
the performance of the system under the
temperature limits to prevent scaling and
fouling deposition. The main aim of the
present work is the performance of reverse
osmosis membrane. The water parameters
are followed as a function of the running
condition in order to follow the behavior of
the membranes tested.
3. RO desalination system description
Reverse osmosis is a pressure-driven
membrane process used to separate solute
and solvent of the same order of molecular
size. It is well known the most common
application of RO unit is the separation of
salt from water to obtain portable water.
There are four types of membrane modules
available in the marketplace: plate and
frame, hollow-fiber, spiral-wound and
tubular. Among these membrane modules,
the spiral wound module occupies the
largest market share due to its relative ease
IJOART

International Journal of Advancements in Research & Technology, Volume 5, Issue 8, August-2016 14 ISSN 2278-7763
Copyright © 2016 SciResPub. IJOART
of cleaning, fabrication technology and very
large surface area per unit volume.
3.1 Modeling of A Spiral wound module
In general, the following factors may directly
affect the performance of RO desalination
processes:
1. Effectiveness of the pre-treatment
units.
2. Membrane: type, size and the
number of modules used and their
arrangement.
3. Rate and degree of fouling and
cleaning ability.
4. Operating conditions such as feed
pressure, temperature and permeate
recovery.
5. Efficiency of pumps and energy
recovery device.
In this study, the effectiveness of the
pretreatment units is neglected. The spiral
wound module with general property is used
in the RO membrane module. To investigate
the dynamic characteristics and process
operation aspects of an industrial RO
desalination plant, the steady-state and
dynamic mathematical models for the
membrane modules are developed below.
3.2 Model Assumptions
The main assumptions used for the RO
model derivation include:
1. The solutiondiffusion model is valid
for the transport mechanism of the
solute and solvent through the
membrane.
2. The RO membrane module is non-
porous and is treated as a flat sheet
with spacers.
3. The RO process is isothermal.
4. Osmosis pressure is proportional to
the salt concentration and pressure
drop in permeate side is negligible.
5. The film model theory and Fick’s law
for diffusion are applicable for
calculating concentration polarization
effect.
6. Diffusion coefficient is independent of
solute concentration.
7. Mass transfer coefficient is constant
for a given fluid condition.
3.3 Membrane Transport Modeling
The applied solution-diffusion model
modified with the concentration polarization
theory for analyzing the operation,
optimization and performance of RO
systems.
The following steady-state membrane
transport equations can be derived. The
IJOART

International Journal of Advancements in Research & Technology, Volume 5, Issue 8, August-2016 15 ISSN 2278-7763
Copyright © 2016 SciResPub. IJOART
solvent flux𝐽𝐽𝑣𝑣, through the membrane is
given by [11]
𝑱𝑱𝒗𝒗 = 𝑳𝑳𝒗𝒗�𝑷𝑷𝒇𝒇 − 𝑷𝑷𝑳𝑳𝑳𝑳𝑳𝑳𝑳𝑳� = 𝑳𝑳𝒗𝒗 [𝑷𝑷𝒇𝒇 −(𝚫𝚫𝝅𝝅 + 𝑷𝑷𝒅𝒅)] (1)
Where Lvis the solvent transport parameter,
Pf is the feed pressure and Plossis the
pressure loss by osmosis pressure (bar) ,
Δπ and the pressure drop along a RO
system Pd. Here, Lv, Δπ andPdare
expressed by [11]:
𝑳𝑳𝒗𝒗 = 𝟏𝟏𝟏𝟏
𝐋𝐋𝐞𝐞𝛂𝛂𝟏𝟏(𝐓𝐓−𝟐𝟐𝟐𝟐𝟐𝟐)
𝟐𝟐𝟐𝟐𝟐𝟐 −𝛂𝛂𝟐𝟐𝛂𝛂𝛂𝛂+ 𝛈𝛈𝛈𝛈
(𝟏𝟏 − 𝐀𝐀𝐀𝐀𝐀𝐀𝐀𝐀
)(2)
𝚫𝚫𝝅𝝅 = �𝑪𝑪𝒎𝒎 − 𝑪𝑪𝒑𝒑�𝑹𝑹𝑹𝑹(3)
𝑷𝑷𝒅𝒅 = 𝜸𝜸𝟏𝟏(𝑽𝑽𝒗𝒗𝒛𝒛.𝒅𝒅𝒉𝒉𝝂𝝂
)𝜸𝜸𝟐𝟐(4)
Where𝐿𝐿𝑣𝑣0 is the intrinsic solvent transport
parameter (m/s), T is the temperature (k),
ηis the viscosity(m²/s),Cis the resistance
due to cake formation, As is the membrane
area occupied byprecipitation (m²),Am is the
total membrane area (m²), and 𝛼𝛼1and ∝2
are two contents(constant) for solvent
transport.𝐶𝐶𝑚𝑚and𝐶𝐶𝑝𝑝are solute concentration
at the membrane surface on the feed side
and solute concentration on the permeate
side (kg/m³), respectively. R is the ideal
gas constant (kJ/kg.k).𝛾𝛾1 and 𝛾𝛾2 aretwo
contents(constant) for pressure drop along a
RO system. 𝑣𝑣𝑧𝑧 ,𝑑𝑑ℎand 𝜈𝜈denote the feed
solution velocity on the bulk solution side
(m/s), hydraulic diameter (m) and
kinematic viscosity, respectively.
The solute flux, Js, through the membrane
is given by
𝐽𝐽𝑠𝑠 = 𝐽𝐽𝑣𝑣 .𝐶𝐶𝑝𝑝 = 𝐿𝐿𝑠𝑠(𝐶𝐶𝑚𝑚 − 𝐶𝐶𝑝𝑝)(5)
Where Lsis the solute transport parameter
𝐿𝐿𝑠𝑠 = 𝐿𝐿𝑠𝑠𝑠𝑠𝑒𝑒𝛼𝛼1(𝑇𝑇−273 )
273 (6)
where𝐿𝐿𝑠𝑠𝑠𝑠 is the intrinsic solute transport
parameter and 𝛼𝛼1is contents for solute
transport. Accumulation of the impermeable
solutes on the membrane surface leads to
the development of a concentration
polarization layer which may be determined
by the concentration polarization.
𝛟𝛟 = 𝑪𝑪𝒎𝒎−𝑪𝑪𝑷𝑷𝑪𝑪𝒃𝒃−𝑪𝑪𝒑𝒑
= 𝒆𝒆𝑱𝑱𝒗𝒗/𝒉𝒉𝒎𝒎(7)
Where 𝐶𝐶𝑏𝑏 is the solute concentration in the
bulk solution (kg/m³) and 𝒉𝒉𝒎𝒎is the mass
transfer coefficient for the back diffusion of
the solute (m/s), whichis dependent upon
fluid flow characteristics within the
membrane channel.
𝒉𝒉𝒎𝒎 = 𝑫𝑫𝜹𝜹
= 𝑺𝑺𝒉𝒉.𝑫𝑫𝒅𝒅𝒉𝒉
(8)
The mass transfer coefficient,𝒉𝒉𝒎𝒎, is equal to
the molecular diffusivity (D) of the solute
(m²/s) divided by the thickness of the
boundary layer (δ). Since we cannot
measure δ directly, Sherwood number (Sh)
IJOART

International Journal of Advancements in Research & Technology, Volume 5, Issue 8, August-2016 16 ISSN 2278-7763
Copyright © 2016 SciResPub. IJOART
correlations must be used. Sherwood
number is calculated as;
𝑺𝑺𝒉𝒉 =𝒉𝒉𝒎𝒎.𝑳𝑳𝑫𝑫
Or
𝒉𝒉𝒎𝒎 = 𝟎𝟎.𝟓𝟓𝟓𝟓𝟏𝟏𝟎𝟎 �𝒗𝒗𝒛𝒛.𝒅𝒅𝒉𝒉𝒗𝒗
�𝟎𝟎.𝟒𝟒
�𝒗𝒗𝑫𝑫�𝟎𝟎.𝟏𝟏𝟐𝟐
�𝒄𝒄𝒃𝒃𝝆𝝆�−𝟎𝟎.𝟐𝟐𝟐𝟐
(𝑫𝑫𝒅𝒅𝒉𝒉
)
Where ρ is the density (kg/m³) and D is the
solute diffusion coefficient.
Developed a two-dimension flow model to
describe flow in the axial and spiral
directions on both the feed and permeate
sides. According to the schematic diagram of
a flat membrane envelope shown in Figure
(1), the following dynamic mass balance can
be derived. 𝝏𝝏𝑪𝑪𝒃𝒃𝝏𝝏𝝏𝝏
= −𝝏𝝏𝑪𝑪𝝏𝝏𝒛𝒛
− 𝟏𝟏𝒉𝒉𝑱𝑱𝑳𝑳 = − 𝜕𝜕
𝜕𝜕𝑧𝑧�𝐶𝐶𝑏𝑏 𝑣𝑣 − 𝐷𝐷 𝜕𝜕𝐶𝐶𝑏𝑏
𝜕𝜕𝑧𝑧� − 𝐽𝐽𝑠𝑠
ℎ(9)
Where 𝐶𝐶𝑏𝑏 the solute molar flux in the axial
direction and h is is the channel height on
the feed side.
In this work, the effect of the solute molar
flux in the spiral direction is neglected for
simplifying above equation. On the other
hand, the effect of the change in
concentration due to the flux of solvent
through the membrane is not considered in
above equation. As mentioned by [16],
above equation can be modified as
𝝏𝝏𝑪𝑪𝒃𝒃𝝏𝝏𝝏𝝏
= −𝝏𝝏𝑪𝑪𝝏𝝏𝒛𝒛
−𝟏𝟏𝒉𝒉𝑱𝑱𝑳𝑳 −
𝟏𝟏𝒉𝒉𝑱𝑱𝒚𝒚𝒄𝒄𝒃𝒃
= − 𝜕𝜕𝜕𝜕𝑧𝑧 �
𝐶𝐶𝑏𝑏 𝑣𝑣 − 𝐷𝐷 𝜕𝜕𝐶𝐶𝑏𝑏𝜕𝜕𝑧𝑧 �
−𝐽𝐽𝑠𝑠ℎ
− 𝟏𝟏𝒉𝒉𝑱𝑱𝒚𝒚𝒄𝒄𝒃𝒃(10)
Furthermore, the overall material balances
for the feed and the permeate sides
proposed by are given by
𝒅𝒅𝒗𝒗𝒛𝒛𝒅𝒅𝒛𝒛
= − 𝑱𝑱𝒗𝒗𝒉𝒉(11)
𝒅𝒅𝒗𝒗𝒑𝒑𝒅𝒅𝒑𝒑
= 𝑱𝑱𝒗𝒗𝒉𝒉𝑷𝑷
(12)
Where 𝑣𝑣𝑝𝑝 is the feed solution velocity on the
permeate side and ℎ𝑝𝑝 is the channel height
on the permeate side (m).
3.4 Heat Transfer:
Temperature polarization coefficient(TPC) is
used to quantify this phenomena as
following:
pf
mm
TTTTTPC−−
= 21
Where 1mT is temperature at the
membrane, 2mT is temperature at the other
side of membrane, fT is temperature at
feed bulk solution and pT is the
temperature at the permeate water. The
lower TPC value, the higher temperature
Fig. (1): Sketch of spiral module
IJOART

International Journal of Advancements in Research & Technology, Volume 5, Issue 8, August-2016 17 ISSN 2278-7763
Copyright © 2016 SciResPub. IJOART
polarization effect, and vice versa. The
temperature polarization effect increases
with increase in feed temperature [17]. The
thermal boundary layers depend on fluid
properties, operation condition and
hydrodynamic conditions [18]. Figure (2)
shows below the cross section of RO
membrane.
3.4.1 The heat flux from the feed bulk to
the interface at the membrane side:
Can be described by [19 and 20]:
))(.*( 1mfpf TTcmhQ −+=
Where fh is the film heat transfer
coefficient (w/m².k),m* is the mass flux
(kg/m².s), pc is liquid specific heat
capacity (kJ/kg.k).
3.4.2 The total heat transfer across the
membrane:
It is the sum of the conductive heat transfer
of the membrane material and membrane
pores filled with air/gas which acts as a
stagnant film. This heat flux is described by:
)( 21 mmm TT
dkQ −=
sam kkk )1(. εε −+= Where mk is effective thermal conductivity of
the membrane (solid material and air in the
pores) (w/m.k), d is the membrane
thickness (m), ε is the membrane porosity,
ak is the thermal conductivity of the air and
sk is thermal conductivity of the solid
material (w/m.k).
3.4.3 The total heat transfer from the
membrane and the permeate water side is:
)( 2 pmf TThQ −=
Where Q total heat transfer (w/m²) and fh
is the heat transfer coefficient inside the film
flow.
3.5 Mass Transfer:
Mass transport of a volatile species occurs
in threesteps [18]:
1. Mass transport from the bulk feed
solution to the seed membrane
surface.
2. Mass transport through the
membrane pores.
3. Mass transport from the membrane
surface to permeate bulk liquid, the
mass transported through the
membrane is affected by diffusion
through the pores [19].
3.5.1 Mass transport from the bulk feed
solution to the seed membrane
surface.
Considering only water; contain dissolved
solids, the concentration of the solute at the
membrane surface becomes higher than the
one in the feed bulk due to mass transfer
IJOART

International Journal of Advancements in Research & Technology, Volume 5, Issue 8, August-2016 18 ISSN 2278-7763
Copyright © 2016 SciResPub. IJOART
across the membrane. When the
concentration of the solute increases; a
concentration layer is formed on membrane
surface reducing the flux as it constitutes a
resistance to mass transfer. Concentration
polarization coefficient (CPC) is used to
quantify this resistance within the
concentration layer [18]. It is defined as:
f
m
CCCPC =
Where mC is the concentration at the
membrane and fC is the concentration at
feed bulk.
The molar flux of the water through the
concentration layer is defined by [18]
Where molarC is the bulk total molar
concentration, mh is the mass transfer
coefficient
3.5.2 Mass transport through the
membrane.
The mass transfer mechanism is governed
by three mechanisms: Knudsen diffusion,
Poiseuille flow, and molecular diffusion or
combination between them, and the dusty-
gas module is used as a general model
describing the mass transport through the
membrane generally [18]. In general, the
mass flux is described by the following
relation.
PKm ∆=* Where K is membrane permeability and
P∆ is the difference pressure across the
membrane.
One can solve the above equation and get
the Sherwood number as;
𝑆𝑆ℎ = ℎ𝑚𝑚 . 𝐿𝐿 𝐷𝐷
Where L is the membrane total length in
meter
4. Experimental setup
The present study includes a hybrid system
of a small size reverse osmosis desalination
plant and heating system. The experimental
is worked under nominal operating
conditions.
The effecting parameters are pressure,
temperature and salinity. The operating
parameters is 12 bar for the operating
pressure, 25.4°C for the temperature and
0.26 to 10 ppt for the feed water salinity.
Fig. (2): Cross section of RO membrane
)ln(..m
fmmolarw C
ChcJ = IJOART

International Journal of Advancements in Research & Technology, Volume 5, Issue 8, August-2016 19 ISSN 2278-7763
Copyright © 2016 SciResPub. IJOART
4.1 System description:
The reverse osmosis desalination system
figure (3) consists of a mixing tank, a feed
water pump, a pretreatment system, a high-
pressure pump and RO membrane.
4.1.1 Feed water tank
The feed water tank is a black polyethylene
tank with a capacity of 0.21 m³, in which the
salinity is prepared.
4.1.2 Feed pump:
The feed water pump drives the feed water
from the mixing tank to the pretreatment
system. The technical characteristics of the
motor pump are shown in table (1).
4.1.3 Pretreatment system:
The pretreatment system consists of three
stages: stage (1) sediment filter (5 µm) for
the removal particles, sediments and
suspended solids, stage (2) granular
activated carbon (1 µm) absorbed chlorine,
dissolved gases, bad taste and odours
disinfection by product, stage (3) post
carbon filter provides the final polish by
absorbing, remaining impurities and
improving the final taste.
4.1.4 High-pressure pump:
After pretreatment, the feed water passes to
the main RO pump. The technical
specifications of the high-pressure pump are
shown in table (2).
4.1.5. Membranes:
The reverse osmosis system consists of one
spiral wound module), figure (4) shows the
Technical Data of a Single Stage Centrifugal Pump
MOC F42, F46 & HT200 -CNP pumps
Flow range
(Q)
0.32 – 0.50 M3/hr.
Delivery head:
Max.
50 M Head
Medium
temperature
20°C -120°C
Voltage 220V
Membrane type Spiral-wound thin
film composite
Active area 7.6 m²
Model BW30-4040
Maximum operating
pressure
15.5 bar
Product water flow rate 9.1 l/d
Minimum salt rejection 99.5 %
Recovery rate 15 %
Fig. (3): Simplified schematic diagram of the conventional RO system.
Fig. (4): Schematic of the RO membrane
IJOART

International Journal of Advancements in Research & Technology, Volume 5, Issue 8, August-2016 20 ISSN 2278-7763
Copyright © 2016 SciResPub. IJOART
Schematic of the RO membrane element.
The membrane is the heart of any RO
desalination system. It separates the feed
water stream into two output streams: low
salinity product water and high salinity
concentrate. Tables (3) and (4) show the
RO membrane specifications and the
operation limits of RO membrane module
respectively.
4.1.6 System of the Instrumentation:
The RO system is initially provided with
measuring instruments shown in table (5).
Equipment Position
Pressure gauge Inlet of the high pressure
pump
Flow meter Outlet of the feed water
line
PH gauge Measure the
concentrate line and
permeate water line and
also the conductivity
TDS / conductivity
meter
4.2 Experimental Setup and Procedure
The mixing tank (volume 0.21m³) is
connected with pipes (diameter 0.75 inch)
then it is connected with the feed pump,
then the pretreatment system, then the high
pressure pump before it is connected with
RO membrane, pressure gauge and
Pump type high-pressure pump
Model Pentair Water/Italy
S.r.l
Type RMY90SA2 V18
Horse power 1.5 hp
Current / Voltage 6.9 A / 230 V
Rated flow rate 0.6 – 3.5 mP
3P/h
Pressure 25 bar
Rated speed 2785 rpm
Membrane type Polyamide Thin film
composite
Maximum operation
pressure
41 bar(600psi)
Maximum feed flow rate 3.6m³/h (16gpm)
Maximum pressure drop 1 bar (15 psi)
pH range, continuous
operation
2-11
pH range, short term
cleaning
1-12
Maximum feed silt density
index
SDI 5
Table (2): Technical specifications of the high-pressure
Table (1): Technical characteristics of the feed water pump
Table (3): RO membrane specifications
Table (4): Operations limits for RO membrane BW30-4040
Table (5): Basic instrumentation of the RO unit
IJOART

International Journal of Advancements in Research & Technology, Volume 5, Issue 8, August-2016 21 ISSN 2278-7763
Copyright © 2016 SciResPub. IJOART
flowmeter is put to measure the operation
parameters. All the inlet pipes are the same
(dia. 0.75 inch).Outlet product water pipe
with diameter 0.5 inch and brine water pipe
also the same and then it is connected each
other with tap valve. Figure (5) shows the
small RO desalination system.
• Steps of the procedure
1. Prepare the Salinity of the Feed
water.
2. Measure pH, TDS, Conductivity,
Pressure and temperature of the
Feed water before operation.
3. Operate the RO system and at this
moment check the valves and pipes
leakages. After sure that there is no
leakage.
4. After ten minutes take a sample from
outlet (permeate water and brine
water and
Keep it out side.
5. Repair the fourth step for 5 times.
6. When the one hour complete, start to
take the measurement of (TDS, pH
and conductivity) of the six samples
and record it.
7. Changing the Feed water the TDS
and repetition the fourth, fifth and
sixth steps for the new values.
Note:Flashing the RO membrane
before every new case. • The Measurement Instruments
1. A pressure gauge is an
instrument that uses to
measure pressure of the fluid
inside tube. The accuracy of
the Bourdon gauge is equal to
(±0.4%).
2. Flow meter is device that
measure the amount of liquid
that passes through pipe.
Flow meter accumulates a
fixed volume of fluid and then
count the number of times the
volume is filled to measure
flow.
3. A pH meter is an electronic
device used for measuring the
pH (acidity or alkalinity) of a
liquid. The range (2.0 to 16.0
pH), resolution(0.1/0.01 pH),
accuracy (±0.1 / ±0.01 pH),
PH calibration automatic (1or
2 point with 2 sets of
memorized buffers (pH
4.01/7.01/10.01 or
4.01/6.86/9.18) and
dimensions (175.5 x 39 x 23
mm).
IJOART

International Journal of Advancements in Research & Technology, Volume 5, Issue 8, August-2016 22 ISSN 2278-7763
Copyright © 2016 SciResPub. IJOART
4. Total dissolved solids and
conductivity meter measures
the conductivity and total
dissolved solids (TDS) in
water including salts, metals
and minerals. It is essential
tool to check water purity of
Reverse Osmosis (RO)
systems. Range (0.00 to
20.00 mS/cm / 0.00 to
10.00 PPt), resolution (0.01
mS/cm / 1 PPt),
Accurcy(±2% f.s.
(EC/TDS)), TDS calibration
(automatic, 1 point12.88
mS/cm, 6.44 PPt or 9.02
PPt) and the
dimensions(175.5 x 39 x 23
mm).
4.3 Data Reduction
• Mass balance
21 mmmT +=
Where 21 ,, mmmT are masses of the
feed water, permeate water and the brine
water respectively. Figure (6) shows
schematic of the RO membrane process.
• Concentration
2211 ... TDSmTDSmTDSm TT +=
21 mmm T −= Where 21 ,, TDSTDSTDST are total
dissolved solids of the feed water, the
permeate water and the brine water
respectively.
2212 .).(. TDSmTDSmmTDSm TTT +−=
).(.. 1221 TDSTDSmTDSmTDSm TTT −=−
12
12
TDSTDSTDSTDS
mm T
T −−
=
TT mm
mm 21 1−=
4.4 Mass Transfer
The mass transfer inside the membrane due
to the concentration of feed water and the
product is used as;
XCDm∂∂
−=≡
Amm 1=≡
Where ≡m is the mass flux (kg/m².s), D
is the diffusivity, C is the inlet or the outlet
Fig. (6): Schematic of the RO membrane process
Fig. (5): Flowchart of RO desalination system combined with Heater
IJOART

International Journal of Advancements in Research & Technology, Volume 5, Issue 8, August-2016 23 ISSN 2278-7763
Copyright © 2016 SciResPub. IJOART
concentration, dx is the width equal (0.099
m), 1m is the mass of permeate water
(kg/s) and A is the area of the RO
membrane (m²).
4.5 Concentration polarization coefficient
(CPC)
The concentration polarization coefficient
(CPC) is used to quantify this resistance
within the concentration layer [25]. It is
defined as:
f
m
CCCPC =
Where mC is the concentration at the
membrane side of the feed and fC is the
concentration at feed bulk.
4.6Temperature polarization coefficient
(TPC)
The influence of this thermal layer in the
feed channel is referred to as temperature
polarization effect. Temperature polarization
coefficient (TPC) is used to quantify these
phenomena as following:
pf
mm
TTTTTPC−−
= 21
Where 1mT is temperature at the
membrane, 2mT is temperature at other side
of membrane, fT is temperature at feed
bulk solution and pT is the temperature at
the permeate waterside. The lower TPC
value, the higher temperature polarization
effect, and vice versa.
5. Results and Discussion
The reverse osmosis system is operated
under various operating parameters values.
Salinity, pH value of the feed water and it
influences on the performance of RO
elements.
5.1 Theoretical Results
As
shown in
Figure
(8),
permeat
e flow
rate is seen to decrease with increasing feed
concentration at different feed water
temperature. In Figure (9) permeate flow
rate is seen to increase with increasing feed
pressure atdifferent feed water temperature.
0 100000 200000 300000 400000Reynoulds Number, Re
0.8
1
1.2
1.4
1.6
1.8
2
Sherw
ood Nu
mber,
Sh
IJOART

International Journal of Advancements in Research & Technology, Volume 5, Issue 8, August-2016 24 ISSN 2278-7763
Copyright © 2016 SciResPub. IJOART
1010 2020 3030 4040Feed Pressure, barFeed Pressure, bar
11
1.21.2
1.41.4
1.61.6
1.81.8
22
Prod
uct m
Prod
uct m
3 3 /hr /hr
T=300 KT=300 KT=320 KT=320 KT=340 KT=340 KT=350 KT=350 K
Figure (10) shows the Sherwood
number versus Reynolds number.Sherwood
number increasing at increasing Re which
limit in Re=20000, then Sh. Decreases with
Re increases due to formation of scaling in
the pressurized of RO membrane surface.
Figure (11) shows Concentration
versus time at Reynolds number.
Concentration increases at time increases
and the high value of concentration is in
Re=800, due to formation of scaling in the
pressurized of RO membrane surface.
Figure (12) shows Applied Pressure
versus time at Reynolds number. Applied
pressure increases at time increases and the
high value of concentration is in Re=2000,
due to formation of scaling in the
pressurized of RO membrane surface.
5.2The Experimental Results:
In the section, there are two parts;
first the feed water temperature and the
pressure are constant, second the feed
water temperature is not constant until the
pressure is still constant. The feed water is
Fig. (9): The flow rate of product vs inlet feed pressure at different temperature
0.20.2 0.40.4 0.60.6 0.80.8 11TimeTime
00
0.10.1
0.20.2
0.30.3
Dimen
sionle
ss Co
ncete
ration
,Dim
ensio
nless
Conc
eterat
ion,
Re=2200Re=2200Re=2000Re=2000Re=1000Re=1000Re=800Re=800
0.20.2 0.40.4 0.60.6 0.80.8 11TimeTime
00
0.40.4
0.80.8
1.21.2
1.61.6
Requ
ired P
ressur
e, Mp
aRe
quired
Press
ure, M
pa
Re=2200Re=2200Re=2000Re=2000Re=1000Re=1000Re=800Re=800
Fig. (11): Concentration vs. time at Reynolds number
Fig. (12): Applied Pressure verses time at Reynolds number
Fig. (10): Sherwood number vs. Reynolds number
Fig. (8): The flow rate of product vs inlet concentration at different temperature
00 0.20.2 0.40.4 0.60.6 0.80.8 11 1.21.2 1.41.4 1.61.6 1.81.8 22 2.22.2Inlet ConcentrationInlet Concentration
00
0.20.2
0.40.4
0.60.6
0.80.8
11
Prod
uct m
Prod
uct m
3 3 /hr /hr
T=300 KT=300 KT=320 KT=320 KT=340 KT=340 KT=350 KT=350 K
IJOART

International Journal of Advancements in Research & Technology, Volume 5, Issue 8, August-2016 25 ISSN 2278-7763
Copyright © 2016 SciResPub. IJOART
changed in ninth values of salinity, pH and
conductivity. These cases measure and
record at every ten minutes to see the
difference in the salinity, conductivity and pH
values.
The Brackish water used from the
Laboratory water source and then changed
in its salinity. Table (6) shows the
specifications of the water source and in the
ninth cases.
From figure (13) the property of water is
constant at start (time=0.0 s) and the
change with time. Figure (13-a) the change
of TDS.increases for brine with time but the
TDS. permeate decreases with time due to
the effect of RO membrane. Figure (13-b)
the change of PH decreases for brine with
time but the PH permeate increases with
time due to the effect of RO membrane.
Figure (13-c) the change of conductivity
increases for brine with time but the
conductivity permeate decreases with time
due to the effect of RO membrane.
NO. Water source T. °C pH TDS
ppt
Conductivity
µs
1 Water source
region
25.4
8.9 0.18 0.37
2 Case 1 8.1 0.26 0.52
3 Case 2 8.6 0.66 1.33
4 Case 3 8.2 2.56 5.11
5 Case 4 8 3.21 6.38
6 Case 5 8 4.82 9.70
7 Case 6 7.2 5.17 10.34
8 Case 7 7.7 8.34 16.68
9 Case 8 8.1 8.76 17.52
10 Case 9 7.6 10 20
0 600 1200 1800 2400 3000 3600Time, s
0
0.4
0.8
1.2
1.6
TDS,
PPt
0 600 1200 1800 2400 3000 3600Time,s
7.8
8
8.2
8.4
8.6
8.8
9
9.2
PH
T=25.40CPHBrine
PHFeed=8.1PHPermeate
Fig. (13-a): Total dissolved solids vs. time for feed, permeate and brine water at P=12 bar
Fig. (13-c) conductivity verses time for feed, permeate and brine at p=12bar
Fig. (13-b): Characteristics of water at pressure equal 12 bar
Table (6): The specifications of the water source and in the ninth cases.
IJOART

International Journal of Advancements in Research & Technology, Volume 5, Issue 8, August-2016 26 ISSN 2278-7763
Copyright © 2016 SciResPub. IJOART
0 600 1200 1800 2400 3000 3600Time,s
0
1
2
3
Cond
uctiv
ity, µ
s
5.2.1 The Performance of the RO
desalination system
5.2.1.1 Effect of Feed water salinity on
permeate water
At the operation pressure equal (12 bar)
and the temperature equal (25.4°C) with
various feed water TDS. values.
Figure (14) shows the effect of the TDS.of
the feed water on TDS.of permeate water
with the time. In general TDS. of the feed
water takes the maximum value then
decreases with time when the water passes
the RO membrane due to the RO membrane
separate the salts to water.
5.2.1.2 Effect of feed water pH
At the operation pressure equal (12 bar)
and the temperature equal (25.4°C) with
various feed water pH values.
Figure (15) shows the effect of the pH of the
feed water on pH of permeate water with the
time. In general the pH of the feed water
takes
the
minimu
m
value
and
then
increases with time when the water passes
the RO membrane due to the RO membrane
separate the salts to water.
Fig. (15): The effect of the feed water pH on
permeate water pH with time 5.2.1.3 Effect of Feed water conductivity
At the operation pressure equal (12 bar)
and the temperature equal (25.4°C) with
various feed water conductivity values. Fig. (14): The effect of the feed water salinity on
Fig
IJOART

International Journal of Advancements in Research & Technology, Volume 5, Issue 8, August-2016 27 ISSN 2278-7763
Copyright © 2016 SciResPub. IJOART
Figure (16) shows the effect of the
conductivity of the feed water on conductivity
of the permeate water with the time. In
general the conductivity of the feed water
takes the maximum value and then
decreases when the water passes the RO
membrane due to the RO membrane
separate the salts to water.
5.2.1.4 Effect of Feed water temperature
In the experimental work, at the operation
pressure equal (12 bar), the changes
through used various values of water
temperature which is influenced also on the
performance of RO desalination system.
Figure (17) shows the mass ratio of the
brine to the feed water versus the feed water
temperature at the operation pressure equal
(12 bar). The mass ratio of the brine water
to the feed water decreases with the
temperature increasing.
Figure (18) shows the mass ratio of
permeate water versus the feed water
temperature at the operation pressure equal
(12 bar).The mass ratio of permeate water
to the feed water increases with the
temperature increasing.
Fig. (16): The effect of the feed water conductivity onpermeate water conductivity with time
Fig. (18): the mass ratio of permeate water versus the vs. the feed water temperature at the Pf =12 bar
IJOART
International Journal of Advancements in Research & Technology, Volume 5, Issue 8, August-2016 28 ISSN 2278-7763
Copyright © 2016 SciResPub. IJOART
RO membrane prevents salts to pass
through it but with large time and the
increasing of temperature, the salts
accumulate in the pressurized RO
membrane surface which is called scaling,
makes some of salts pass through the RO
membrane and this effect on the quality and
quantity of product water. It makes
understanding principle of that there must
temperature limit to prevent salts pass the
RO membrane.
5.2.1.5 Performance of RO system in
Diffusivity
Diffusivity is defined as the ratio between the
mass transport by across the element RO,
and its down with concentration gradient.
Figure (19) shows the diffusivity of permeate
versus the feed water temperature.
Diffusivity of permeate decreases with the
increasing of the feed water temperature.
For increasing inlet temperature that leads to
the increasing of concentration and that will
decrease the diffusivity of permeate.
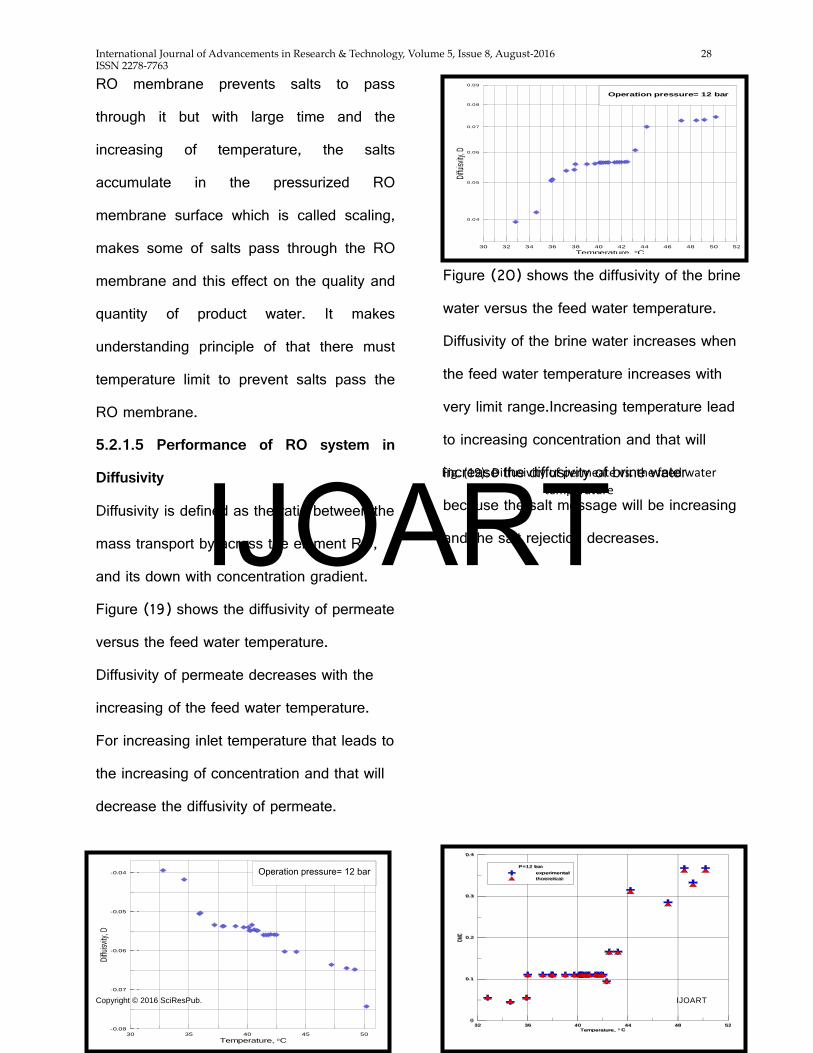
Figure (20) shows the diffusivity of the brine
water versus the feed water temperature.
Diffusivity of the brine water increases when
the feed water temperature increases with
very limit range.Increasing temperature lead
to increasing concentration and that will
increase the diffusivity of brine water
because the salt message will be increasing
and the salt rejection decreases.
30 35 40 45 50Temperature, oC
-0.08
-0.07
-0.06
-0.05
-0.04
Diffui
svity
, D
Fig. (19): Diffusivity of permeate vs. the feed water temperature
3232 3636 4040 4444 4848 5252Temperature, Temperature, o o C C
00
0.10.1
0.20.2
0.30.3
0.40.4
CMC
CMC
P=12 barP=12 barexperimentalexperimentalthoereticalthoeretical
30 32 34 36 38 40 42 44 46 48 50 52Temperature, oC
0.09
0.08
0.07
0.06
0.05
0.04
Diffuis
vity, D
Operation pressure= 12 bar
IJOART

International Journal of Advancements in Research & Technology, Volume 5, Issue 8, August-2016 29 ISSN 2278-7763
Copyright © 2016 SciResPub. IJOART
5.3 comparisons between Theoretical and
Experimental Results
.The membrane performance parameters
have been estimated for the experimental
data of present work, and the results clearly
show that the present theoretical model
predicts the data, and the estimated
membrane parameters remain constant for a
variety of operating conditions. Figure (21)
shows the comparisons between the
theoretical and Experimental results.
5.4 comparisons between present and
previous work
Figure (22) shows a comparison between
theoretical and previous work [19], for
relation between Sherwood number and
Reynolds number of permeate this figure
show the Sherwood number of permeate
increases with Reynolds number but then it
decreases due to the fouling outside the
ROmembrane and the outlet concentration
increases, the theoretical results have a
lower than previous results, but have the
same trend.
Conclusions
From the present work the following
conclusions can be drawn
1. Applied pressure and solution
temperature have positive impact on
permeate flux from RO membranes. But it
was inversely related to concentration and
pH.
2. The separation of salt and permeate
flux were mainly dependent on the
concentration of the feed solution.
3. The permeate flux increased with
increasing flow rate; for high feed flow rates
it seemed to reach its maximum values
asymptotically.
4. It was found that the order of effect of
the operating variables on the removal of
RO membranes was in the following
sequence: T > pH > P > TD S.
Fig. (20): Diffusivity of the brine vs. the feed water temperature
00 100000100000 200000200000 300000300000 400000400000
Reynolds number, ReReynolds number, Re
0.80.8
11
1.21.2
1.41.4
1.61.6
1.81.8
22
Sherw
ood n
umbe
r, Sh
Sher
wood
numb
er, S
h
Present work theoreticalPresent work theoreticalPrevious work[60]Previous work[60]
Fig. (22): Sherwood number versus Reynolds number
IJOART

International Journal of Advancements in Research & Technology, Volume 5, Issue 8, August-2016 30 ISSN 2278-7763
Copyright © 2016 SciResPub. IJOART
5. The initial concentration and initial
volume of the solution played an important
role in determining the flux and the
concentration in permeate.
References
[1] Higgins, T. E. (1995). Pollution
prevention handbook. CRC Press., pp.274.
[2] Tchobanoglous, George, Hilary Theisen,
Samuel Vigil. (1993). Integrated solid waste
management: Engineering principles and
management issues. New York: McGraw-
Hill, pp.440.
[3] United states environmental protection
agency. Rochem separation systems, Inc.
Disc TubeTM module technology: Innovative
Technology Evaluation Report. Washington
D.C. January 1998.
[4] Watson I. C., Morin O. and Henthorne
L., Desalting handbook for planners, in
Desalination Research and Development
Program Report. vol. 72, ed., 2003.
[5] Silver, R. S. (1971). Multi-stage flash
distillation. The first 10 years. Desalination,
Vol. 9, no. 1, pp. 3-17.
[6] Almulla A., Hamad A. and Gadalla, M.
(2005). Integrating hybrid systems with
existing thermal desalinationplants.
Desalination, Vol.174, no.2, pp. 171-192.
[7] Leao A. J. (2004). Polymer film heat
transfer elements for multi effect and vapour
compression desalination (Doctoral
dissertation, University of Pretoria), pp. 23.
[8] Fritzmann C., Löwenberg J., Wintgens
T. and Melin, T. (2007). State-of-the-art of
reverse osmosis desalination.
Desalination,Vol. 216, no.1, pp. 1-76.
[9] Feng C. (2009). Development of novel
nanofiber membranes for seawater
desalination by air gap membrane
distillation, pp. 140-146.
[10] El-Dessouky T. and Ettouney H.
(2002). Fundamentals of salt water
desalination. Elsevier, pp. 12.
[11] Senthilmurugan S., Ahluwalia A. and
Gupta S. K., Modeling of a spiral-wound
module and estimation of model parameters
using numerical techniques, Desalination,
173, 269-286, 2005.
[12] Abbas A., Simulation and analysis of
an industrial water desalination plant,
Chemical engineering and processing, 44,
999-1004, 2005.
[13] Oh H. J., Hwang T. M. and Lee S., A
simplified simulation model of RO systems
for seawater desalination, Desalination, 238,
128–139, 2009.
IJOART

International Journal of Advancements in Research & Technology, Volume 5, Issue 8, August-2016 31 ISSN 2278-7763
Copyright © 2016 SciResPub. IJOART
[14] Kaghazchi T., Mehri M., Ravanchi M.
T. and Karari A., A mathematical modeling
for two industrial seawater desalination
plants in the Persian gulf region,
Desalination, 252, 135-142, 2010.
[15] Marriott J. I. and Sorensen E., A
general approach to modelling membrane
modules, Chemical engineering science, 58,
4975–4990, 2003.
[16] Lee S. and Lueptow R. M., Rotating
Reverse Osmosis: a Dynamic model for flux
and rejection, Journal of membrane science,
192, 129–143, 2001.
[17] Chernyshov M. N., Meindersma G. W.
and Haan d. (2003). Modelling temperature
and salt concentration distribution in
membrane distillation feed channel.
Desalination, Vol.157, no.1, pp. 315-324.
[18] El-Bourawi M. S., Ding Z., Ma, R. and
Khayet M. (2006). A framework for better
understanding membrane distillation
separation process. Journal of Membrane
Science, Vol.285, no.1, pp. 4-29.
[19] Bouguecha S., Chouikh R. and Dhahbi
M. (2003). Numerical study of the coupled
heat and mass transfer in membrane
distillation. Desalination, Vol.152, no.1, pp.
245-252.
[20] Kubota S., Ohta K., Hayano I., Hirai,
M., Kikuchi K. and Murayama Y. (1988).
Experiments on seawater desalination by
membrane distillation. Desalination, Vol.69,
no.1, pp.19-26.
IJOART