Keysight Technologies 8990B Peak Power Analyzer and N1923A ... · Keysight Technologies 8990B Peak...
19
Keysight Technologies 8990B Peak Power Analyzer and N1923A/N1924A Wideband Power Sensors Data Sheet
Transcript of Keysight Technologies 8990B Peak Power Analyzer and N1923A ... · Keysight Technologies 8990B Peak...
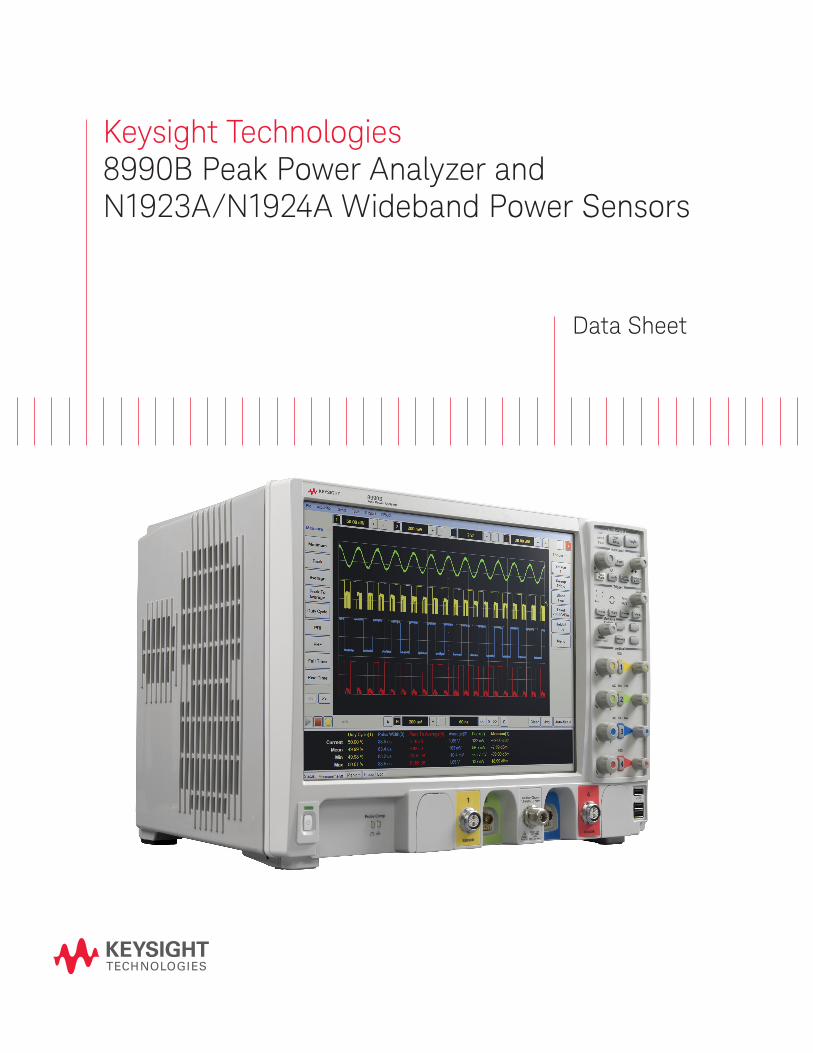
Keysight Technologies 8990B Peak Power Analyzer and N1923A/N1924A Wideband Power Sensors
Data Sheet
02 | Keysight | 8990B Peak Power Analyzer and N1923A/N1924A Wideband Power Sensors - Data Sheet
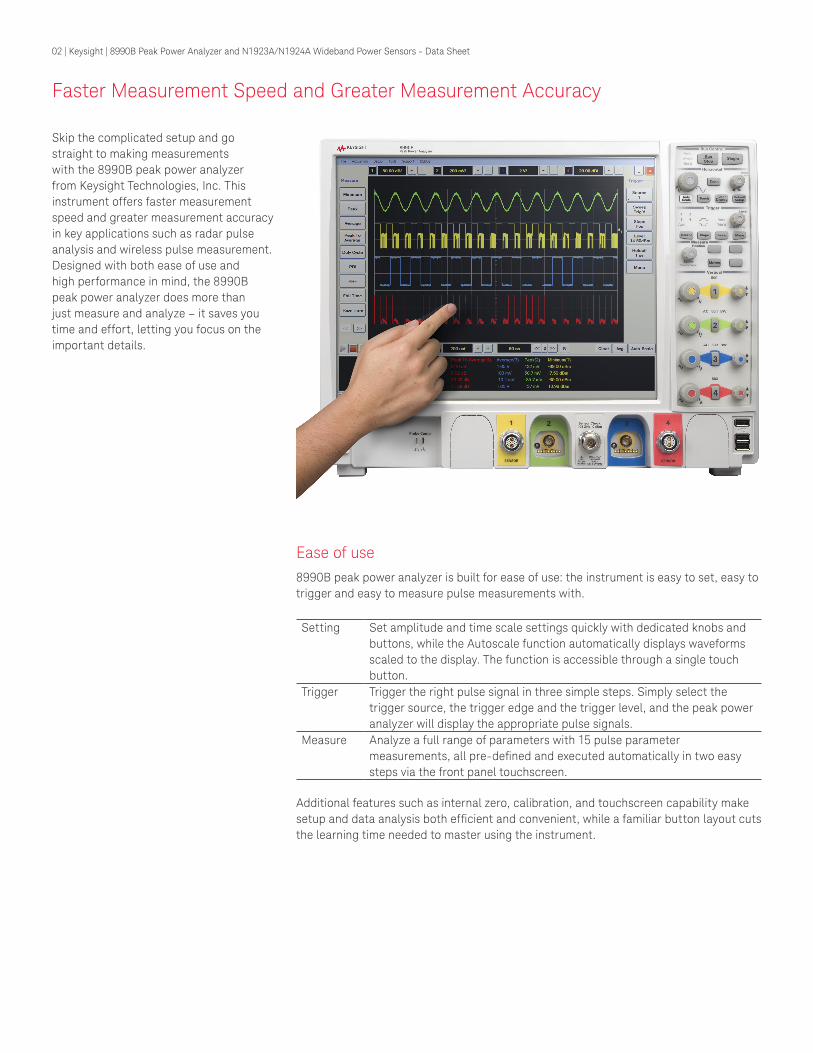
Faster Measurement Speed and Greater Measurement Accuracy
Skip the complicated setup and go straight to making measurements with the 8990B peak power analyzer from Keysight Technologies, Inc. This instrument offers faster measurement speed and greater measurement accuracy in key applications such as radar pulse analysis and wireless pulse measurement. Designed with both ease of use and high performance in mind, the 8990B peak power analyzer does more than just measure and analyze – it saves you time and effort, letting you focus on the important details.
Ease of use8990B peak power analyzer is built for ease of use: the instrument is easy to set, easy to trigger and easy to measure pulse measurements with.
Setting Set amplitude and time scale settings quickly with dedicated knobs and buttons, while the Autoscale function automatically displays waveforms scaled to the display. The function is accessible through a single touch button.
Trigger Trigger the right pulse signal in three simple steps. Simply select the trigger source, the trigger edge and the trigger level, and the peak power analyzer will display the appropriate pulse signals.
Measure Analyze a full range of parameters with 15 pulse parameter measurements, all pre-defined and executed automatically in two easy steps via the front panel touchscreen.
Additional features such as internal zero, calibration, and touchscreen capability make setup and data analysis both efficient and convenient, while a familiar button layout cuts the learning time needed to master using the instrument.
03 | Keysight | 8990B Peak Power Analyzer and N1923A/N1924A Wideband Power Sensors - Data Sheet
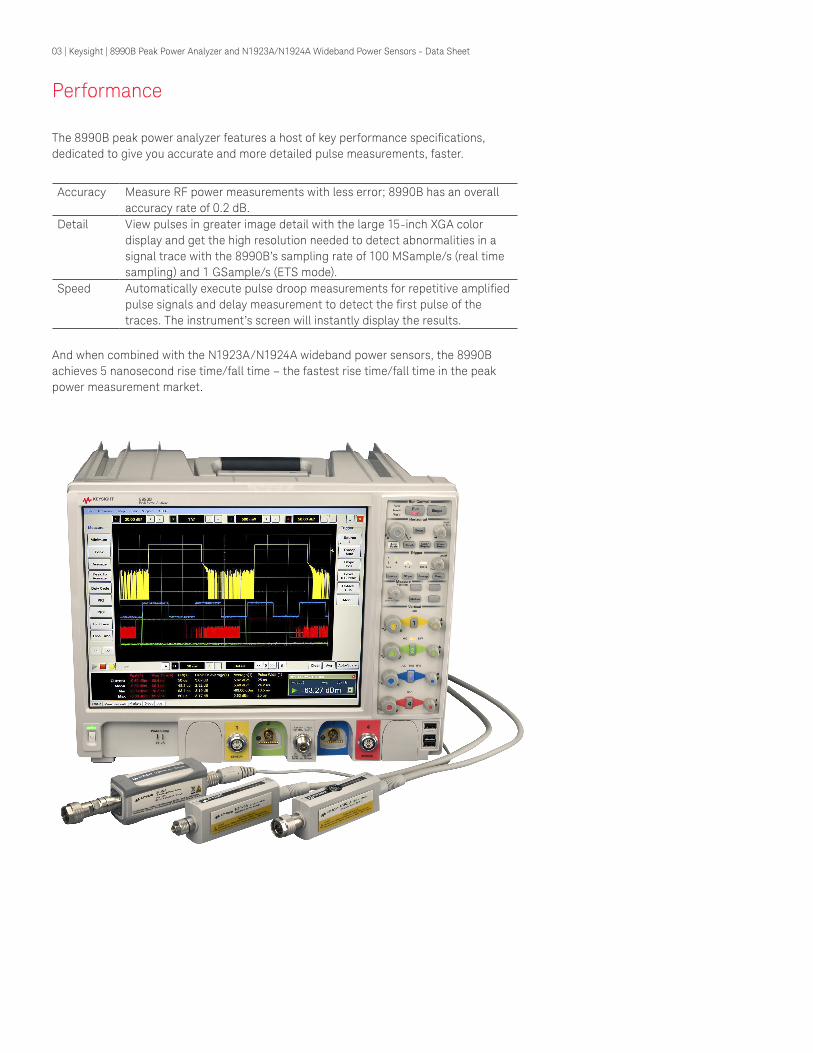
Performance
The 8990B peak power analyzer features a host of key performance specifications, dedicated to give you accurate and more detailed pulse measurements, faster.
And when combined with the N1923A/N1924A wideband power sensors, the 8990B achieves 5 nanosecond rise time/fall time – the fastest rise time/fall time in the peak power measurement market.
Accuracy Measure RF power measurements with less error; 8990B has an overall accuracy rate of 0.2 dB.
Detail View pulses in greater image detail with the large 15-inch XGA color display and get the high resolution needed to detect abnormalities in a signal trace with the 8990B’s sampling rate of 100 MSample/s (real time sampling) and 1 GSample/s (ETS mode).
Speed Automatically execute pulse droop measurements for repetitive amplified pulse signals and delay measurement to detect the first pulse of the traces. The instrument’s screen will instantly display the results.
04 | Keysight | 8990B Peak Power Analyzer and N1923A/N1924A Wideband Power Sensors - Data Sheet
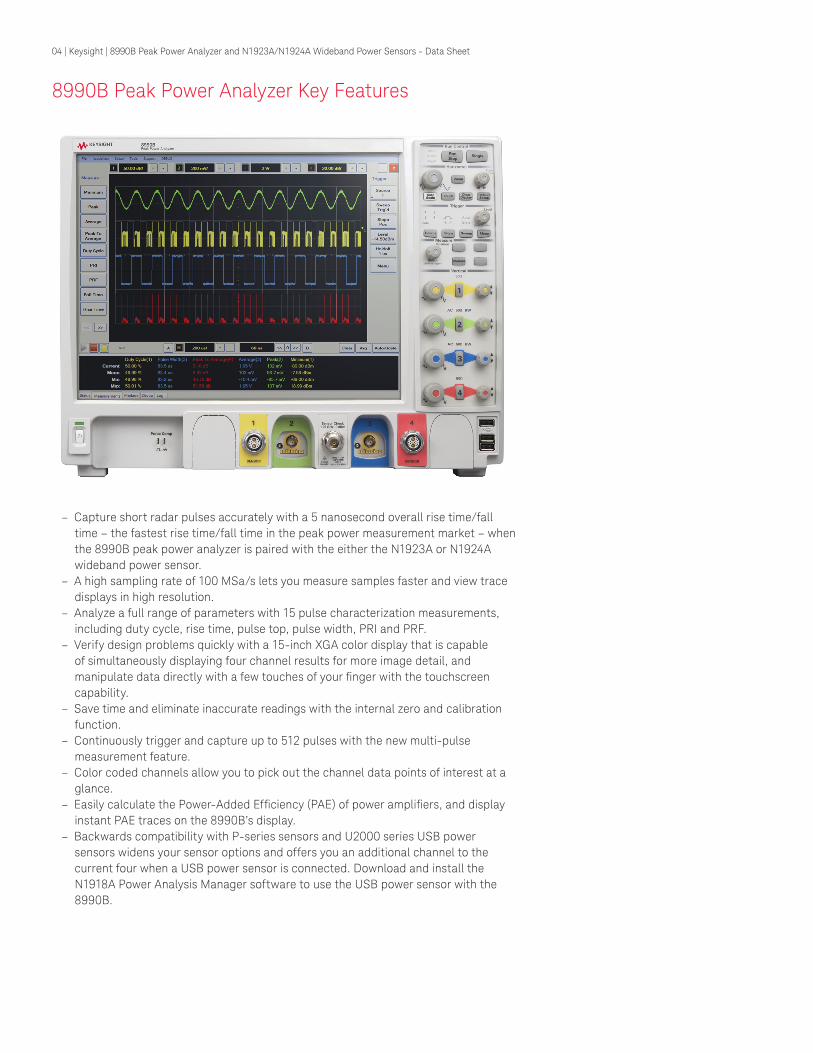
8990B Peak Power Analyzer Key Features
– Capture short radar pulses accurately with a 5 nanosecond overall rise time/fall time – the fastest rise time/fall time in the peak power measurement market – when the 8990B peak power analyzer is paired with the either the N1923A or N1924A wideband power sensor.
– A high sampling rate of 100 MSa/s lets you measure samples faster and view trace displays in high resolution.
– Analyze a full range of parameters with 15 pulse characterization measurements, including duty cycle, rise time, pulse top, pulse width, PRI and PRF.
– Verify design problems quickly with a 15-inch XGA color display that is capable of simultaneously displaying four channel results for more image detail, and manipulate data directly with a few touches of your finger with the touchscreen capability.
– Save time and eliminate inaccurate readings with the internal zero and calibration function.
– Continuously trigger and capture up to 512 pulses with the new multi-pulse measurement feature.
– Color coded channels allow you to pick out the channel data points of interest at a glance.
– Easily calculate the Power-Added Efficiency (PAE) of power amplifiers, and display instant PAE traces on the 8990B’s display.
– Backwards compatibility with P-series sensors and U2000 series USB power sensors widens your sensor options and offers you an additional channel to the current four when a USB power sensor is connected. Download and install the N1918A Power Analysis Manager software to use the USB power sensor with the 8990B.
05 | Keysight | 8990B Peak Power Analyzer and N1923A/N1924A Wideband Power Sensors - Data Sheet
Graphical User Interface Overview
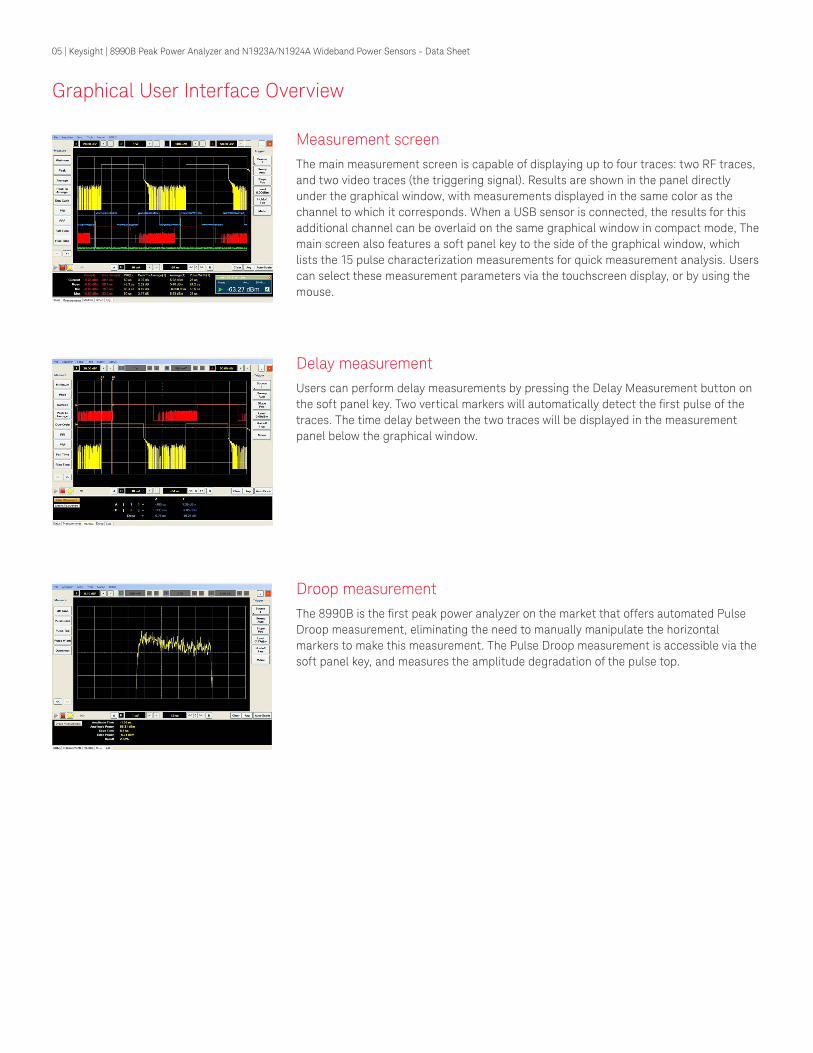
Measurement screen The main measurement screen is capable of displaying up to four traces: two RF traces, and two video traces (the triggering signal). Results are shown in the panel directly under the graphical window, with measurements displayed in the same color as the channel to which it corresponds. When a USB sensor is connected, the results for this additional channel can be overlaid on the same graphical window in compact mode, The main screen also features a soft panel key to the side of the graphical window, which lists the 15 pulse characterization measurements for quick measurement analysis. Users can select these measurement parameters via the touchscreen display, or by using the mouse.
Delay measurement Users can perform delay measurements by pressing the Delay Measurement button on the soft panel key. Two vertical markers will automatically detect the first pulse of the traces. The time delay between the two traces will be displayed in the measurement panel below the graphical window.
Droop measurement The 8990B is the first peak power analyzer on the market that offers automated Pulse Droop measurement, eliminating the need to manually manipulate the horizontal markers to make this measurement. The Pulse Droop measurement is accessible via the soft panel key, and measures the amplitude degradation of the pulse top.

06 | Keysight | 8990B Peak Power Analyzer and N1923A/N1924A Wideband Power Sensors - Data Sheet
Spacing measurementEasily measure the space between pulses when a long pulse train occurs. The 8990B allows users to select the starting pulse and the end pulse, a function that is important in pulse block validation. R&D engineers may use this function to detect potential abnormalities in certain pulse groups, and whether those abnormalities are repeated in a long pulse train.
Zoom screen The 8990B provides dual window zoom capability. When this function is enabled, the top screen will display the original signal, while the bottom screen displays the enlarged signal trace.
To focus and zoom in on a particular segment of the signal trace, use the white zoom box to select the area of interest on the original signal trace. The measurement panel below will display the results of the selected signal segment. This function provides R&D engineers the flexibility to focus on particular parts of the signal and to obtain only the measurement results they need.
The dual zoom window capability allows users to observe the original trace while focusing in on the selected signal segment instead of flipping between screens or losing the original trace after zooming in on the segment.
Threshold/power display settings and erase memory The 8990B allows users to change channel settings. The default threshold setting is 90% and 10%; however, users may change the reference levels to any value. If a pulse has high overshoot in the traces, users can choose to reduce the upper trace level to 80% or 70% to eliminate the overshoot signal’s impact on the results. Users can also modify the trace level of two different signals for the delay measurement according to what is the best reference level for the individual signal.
Users can also change their settings to display power measurements in either logarithmic or watts to help with easy result conversion or to match the results to the traces in the graphical window.
For users in the aerospace and defense industry, the 8990B offers several ways to secure both data and measurement settings such as the memory sanitization feature, a standard product feature in all Keysight equipment that will erase the system’s setup and data results. Users can also opt for the removable hard drive option, which switches the attached hard drive with a removable version, so users can remove data and settings together with the hard drive without worrying about information leaks.
Graphical User Interface Overview (Continued)
07 | Keysight | 8990B Peak Power Analyzer and N1923A/N1924A Wideband Power Sensors - Data Sheet
Additional Features
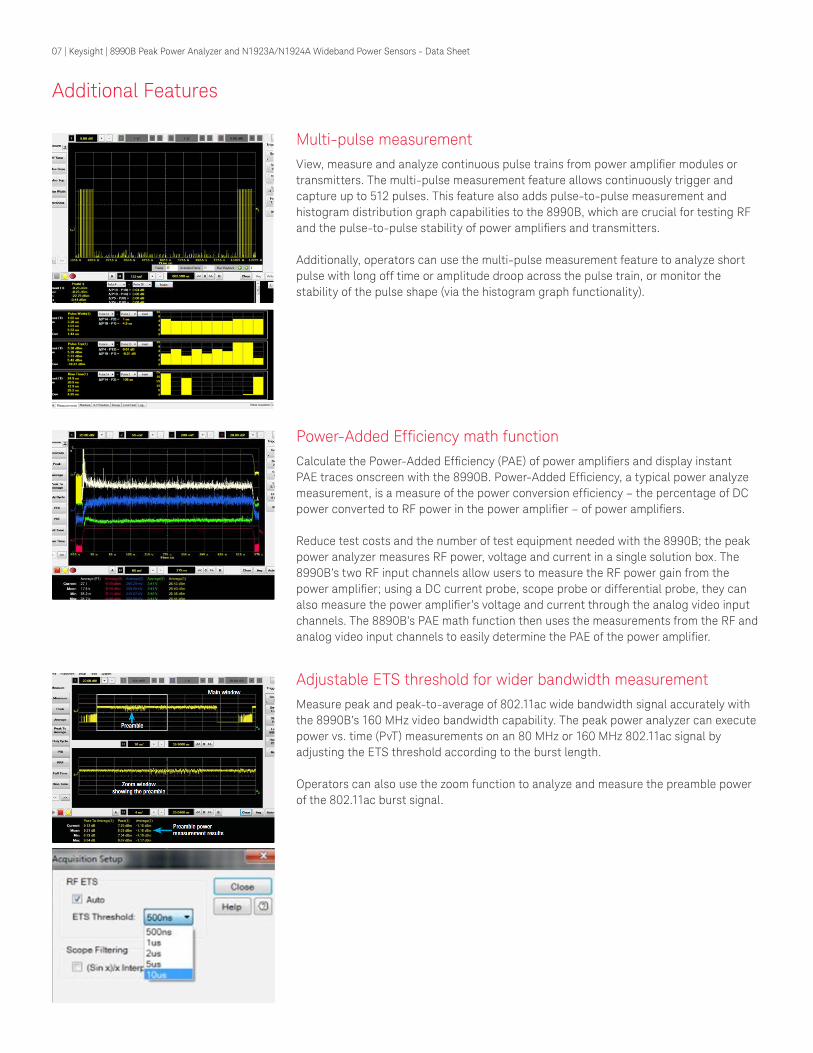
Multi-pulse measurement View, measure and analyze continuous pulse trains from power amplifier modules or transmitters. The multi-pulse measurement feature allows continuously trigger and capture up to 512 pulses. This feature also adds pulse-to-pulse measurement and histogram distribution graph capabilities to the 8990B, which are crucial for testing RF and the pulse-to-pulse stability of power amplifiers and transmitters.
Additionally, operators can use the multi-pulse measurement feature to analyze short pulse with long off time or amplitude droop across the pulse train, or monitor the stability of the pulse shape (via the histogram graph functionality).
Power-Added Efficiency math functionCalculate the Power-Added Efficiency (PAE) of power amplifiers and display instant PAE traces onscreen with the 8990B. Power-Added Efficiency, a typical power analyze measurement, is a measure of the power conversion efficiency – the percentage of DC power converted to RF power in the power amplifier – of power amplifiers.
Reduce test costs and the number of test equipment needed with the 8990B; the peak power analyzer measures RF power, voltage and current in a single solution box. The 8990B’s two RF input channels allow users to measure the RF power gain from the power amplifier; using a DC current probe, scope probe or differential probe, they can also measure the power amplifier’s voltage and current through the analog video input channels. The 8890B’s PAE math function then uses the measurements from the RF and analog video input channels to easily determine the PAE of the power amplifier.
Adjustable ETS threshold for wider bandwidth measurement Measure peak and peak-to-average of 802.11ac wide bandwidth signal accurately with the 8990B’s 160 MHz video bandwidth capability. The peak power analyzer can execute power vs. time (PvT) measurements on an 80 MHz or 160 MHz 802.11ac signal by adjusting the ETS threshold according to the burst length.
Operators can also use the zoom function to analyze and measure the preamble power of the 802.11ac burst signal.
08 | Keysight | 8990B Peak Power Analyzer and N1923A/N1924A Wideband Power Sensors - Data Sheet
Performance Specifications
Specification definitions There are two types of product specifications:
– Warranted specifications are specifications which are covered by the product warranty and apply over a range of 0 to 55 °C unless otherwise noted. Warranted specifications include measurement uncertainty calculated with a 95% confidence.
– Characteristic specifications are specifications that are not warranted. They describe product performance that is useful in the application of the product. These characteristic specifications are shown in italics.
Characteristic information is representative of the product. In many cases, it may also be supplemental to a warranted specification. Characteristic specifications are not verified on all units. There are several types of characteristic specifications. They can be divided into two groups:
One group of characteristic types describes ‘attributes’ common to all products of a given model or option. Examples of characteristics that describe ‘attributes’ are the product weight and ‘50-ohm input Type-N connector’. In these examples, product weight is an ‘approximate’ value and a 50-ohm input is ‘nominal’. These two terms are most widely used when describing a product’s ‘attributes’.
Conditions The power meter and sensor will meet its specifications when:
– Stored for a minimum of two hours at a stable temperature within the operating temperature range, and turned on for at least 30 minutes.
– The power meter and sensor are within their recommended calibration period. – Used in accordance to the information provided in the User’s Guide.
09 | Keysight | 8990B Peak Power Analyzer and N1923A/N1924A Wideband Power Sensors - Data Sheet
Power requirements 100 to 120 V (at 50/60/400 Hz)100 to 240 V (at 50 to 60 Hz)Maximum power dissipated at 375 W
Operating Operating temperature from 5 to 40 °CRelative humidity up to 95% at 40 °C (non-condensing)Operating altitude up to 4600m (15000 ft.)Operating random vibration at 5 to 500 Hz, 10 minutes/axis, 0.21 g (rms)
Non-operating conditions Non-operating temperature from –40 to +70 °CRelative humidity up to 90% at 65 °CNon-operating altitude up to 4600 m (15000 ft.)Non-operating random vibration at 5 to 500 Hz, 10 minutes/axis, 2.09 g (rms); resonant search at 5 to 500 Hz, swept sine, 1 octave/minute, sweep rate at 0.5 g (0 peak), 5 minutes resonant, dwell at 4 resonance/axis
Dimensions (W x D x H) 430 mm (16.9 in) x 347 mm (13.7 in) x 330 mm (13.0 in)Weight < 16 kg (net)
< 23.5 kg (shipping)Sound pressure level 45 dB Electromagnetic compatibility
Complies with the essential requirements of the European (EC) Directives as follows: – IEC 61326-2-1:2005/EN 61326-2-1:2006 – CISPR 11:2003/EN 55011:2007 (Group 1, Class A)
The product also meets the following EMC standards: – Canada: ICES-1:2004 – Australia/New Zealand: AS/NZS CISPR 11:2004
Safety Conforms to the following product specifications: – EN61010-1: 2001/IEC 61010-1:2001 – CAN/CSA C22.2 No. 61010-1-04 – ANSI/UL std No. 61010-1-2004
The following specifications are applicable only when the N1923A/N1924A wideband power sensors are used with the 8990B peak power analyzer. Using the 8990B with other supported sensors might yield different results.
Product Characteristics
10 | Keysight | 8990B Peak Power Analyzer and N1923A/N1924A Wideband Power Sensors - Data Sheet
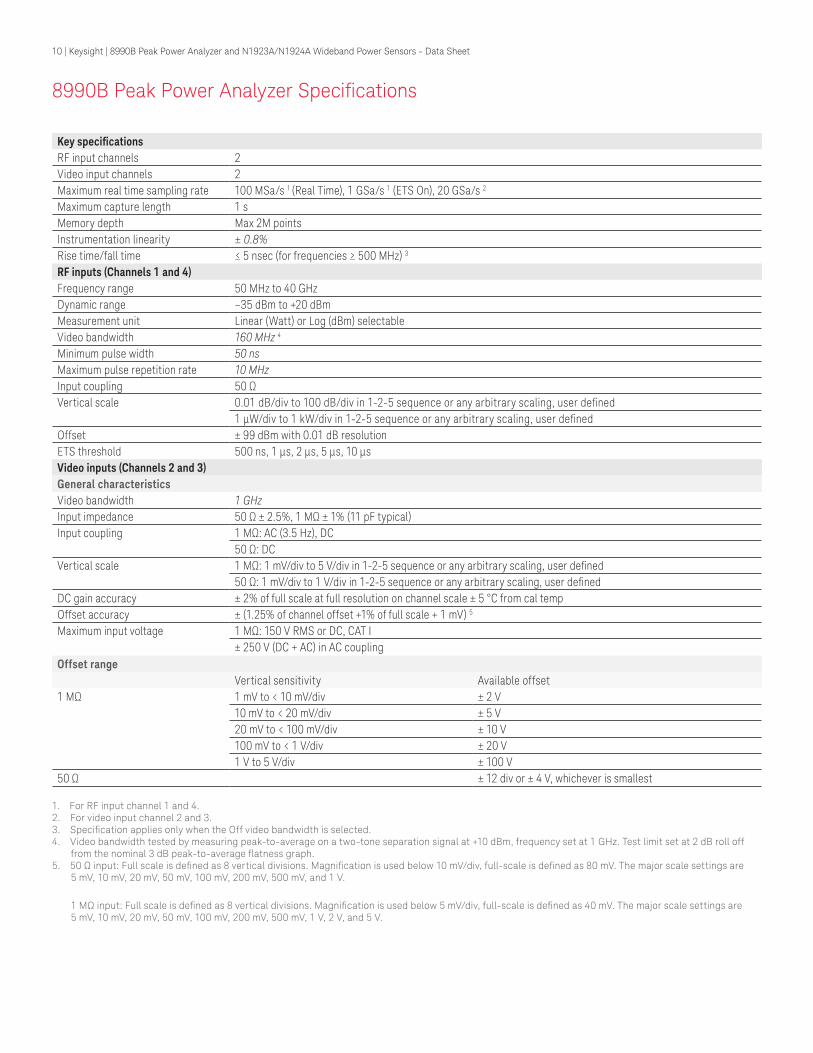
Key specificationsRF input channels 2Video input channels 2Maximum real time sampling rate 100 MSa/s 1 (Real Time), 1 GSa/s 1 (ETS On), 20 GSa/s 2
Maximum capture length 1 sMemory depth Max 2M pointsInstrumentation linearity ± 0.8%Rise time/fall time ≤ 5 nsec (for frequencies ≥ 500 MHz) 3
RF inputs (Channels 1 and 4) Frequency range 50 MHz to 40 GHzDynamic range –35 dBm to +20 dBmMeasurement unit Linear (Watt) or Log (dBm) selectableVideo bandwidth 160 MHz 4
Minimum pulse width 50 nsMaximum pulse repetition rate 10 MHzInput coupling 50 ΩVertical scale 0.01 dB/div to 100 dB/div in 1-2-5 sequence or any arbitrary scaling, user defined
1 µW/div to 1 kW/div in 1-2-5 sequence or any arbitrary scaling, user definedOffset ± 99 dBm with 0.01 dB resolutionETS threshold 500 ns, 1 µs, 2 µs, 5 µs, 10 µsVideo inputs (Channels 2 and 3) General characteristicsVideo bandwidth 1 GHzInput impedance 50 Ω ± 2.5%, 1 MΩ ± 1% (11 pF typical)Input coupling 1 MΩ: AC (3.5 Hz), DC
50 Ω: DCVertical scale 1 MΩ: 1 mV/div to 5 V/div in 1-2-5 sequence or any arbitrary scaling, user defined
50 Ω: 1 mV/div to 1 V/div in 1-2-5 sequence or any arbitrary scaling, user definedDC gain accuracy ± 2% of full scale at full resolution on channel scale ± 5 °C from cal tempOffset accuracy ± (1.25% of channel offset +1% of full scale + 1 mV) 5
Maximum input voltage 1 MΩ: 150 V RMS or DC, CAT I± 250 V (DC + AC) in AC coupling
8990B Peak Power Analyzer Specifications
Offset rangeVertical sensitivity Available offset
1 MΩ 1 mV to < 10 mV/div ± 2 V10 mV to < 20 mV/div ± 5 V20 mV to < 100 mV/div ± 10 V100 mV to < 1 V/div ± 20 V1 V to 5 V/div ± 100 V
50 Ω ± 12 div or ± 4 V, whichever is smallest
1. For RF input channel 1 and 4.2. For video input channel 2 and 3.3. Specification applies only when the Off video bandwidth is selected.4. Video bandwidth tested by measuring peak-to-average on a two-tone separation signal at +10 dBm, frequency set at 1 GHz. Test limit set at 2 dB roll off
from the nominal 3 dB peak-to-average flatness graph. 5. 50 Ω input: Full scale is defined as 8 vertical divisions. Magnification is used below 10 mV/div, full-scale is defined as 80 mV. The major scale settings are
5 mV, 10 mV, 20 mV, 50 mV, 100 mV, 200 mV, 500 mV, and 1 V.
1 MΩ input: Full scale is defined as 8 vertical divisions. Magnification is used below 5 mV/div, full-scale is defined as 40 mV. The major scale settings are 5 mV, 10 mV, 20 mV, 50 mV, 100 mV, 200 mV, 500 mV, 1 V, 2 V, and 5 V.
11 | Keysight | 8990B Peak Power Analyzer and N1923A/N1924A Wideband Power Sensors - Data Sheet
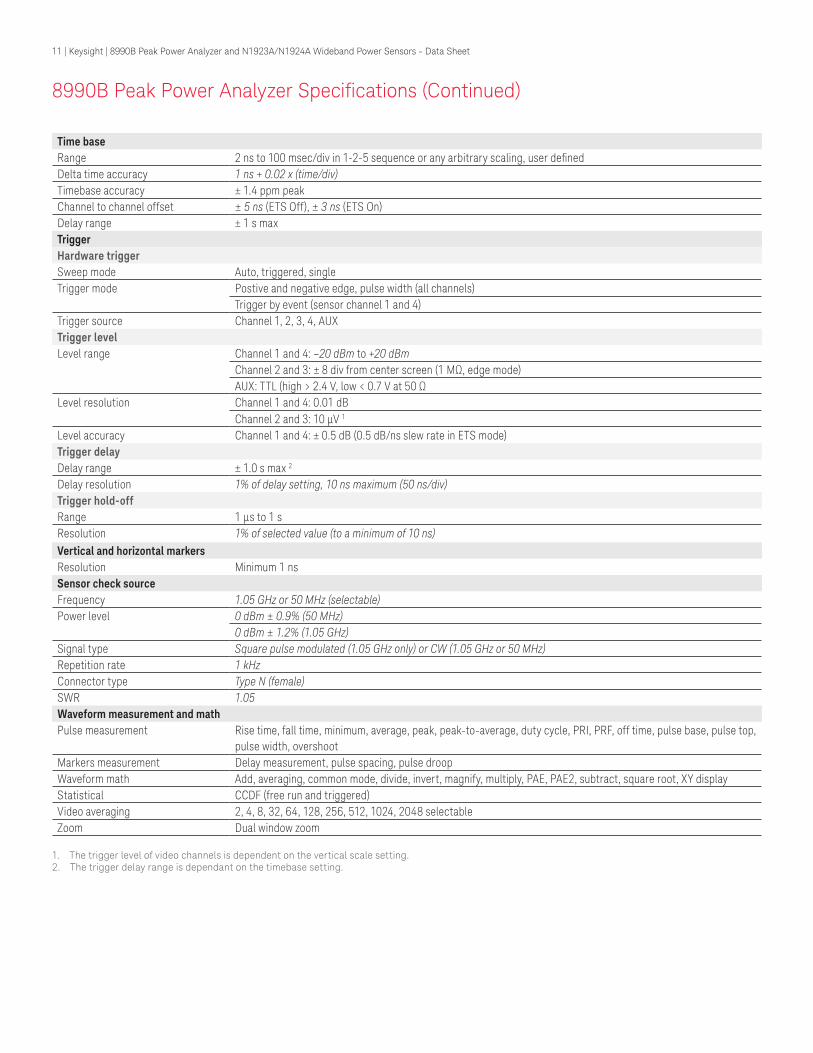
Time baseRange 2 ns to 100 msec/div in 1-2-5 sequence or any arbitrary scaling, user definedDelta time accuracy 1 ns + 0.02 x (time/div)Timebase accuracy ± 1.4 ppm peakChannel to channel offset ± 5 ns (ETS Off), ± 3 ns (ETS On)Delay range ± 1 s maxTriggerHardware triggerSweep mode Auto, triggered, singleTrigger mode Postive and negative edge, pulse width (all channels)
Trigger by event (sensor channel 1 and 4)Trigger source Channel 1, 2, 3, 4, AUXTrigger levelLevel range Channel 1 and 4: –20 dBm to +20 dBm
Channel 2 and 3: ± 8 div from center screen (1 MΩ, edge mode)AUX: TTL (high > 2.4 V, low < 0.7 V at 50 Ω
Level resolution Channel 1 and 4: 0.01 dBChannel 2 and 3: 10 µV 1
Level accuracy Channel 1 and 4: ± 0.5 dB (0.5 dB/ns slew rate in ETS mode)Trigger delay Delay range ± 1.0 s max 2
Delay resolution 1% of delay setting, 10 ns maximum (50 ns/div)Trigger hold-offRange 1 µs to 1 s Resolution 1% of selected value (to a minimum of 10 ns)Vertical and horizontal markersResolution Minimum 1 ns Sensor check source Frequency 1.05 GHz or 50 MHz (selectable)Power level 0 dBm ± 0.9% (50 MHz)
0 dBm ± 1.2% (1.05 GHz)Signal type Square pulse modulated (1.05 GHz only) or CW (1.05 GHz or 50 MHz)Repetition rate 1 kHzConnector type Type N (female)SWR 1.05Waveform measurement and mathPulse measurement Rise time, fall time, minimum, average, peak, peak-to-average, duty cycle, PRI, PRF, off time, pulse base, pulse top,
pulse width, overshoot Markers measurement Delay measurement, pulse spacing, pulse droop Waveform math Add, averaging, common mode, divide, invert, magnify, multiply, PAE, PAE2, subtract, square root, XY display Statistical CCDF (free run and triggered)Video averaging 2, 4, 8, 32, 64, 128, 256, 512, 1024, 2048 selectableZoom Dual window zoom
1. The trigger level of video channels is dependent on the vertical scale setting.2. The trigger delay range is dependant on the timebase setting.
8990B Peak Power Analyzer Specifications (Continued)
12 | Keysight | 8990B Peak Power Analyzer and N1923A/N1924A Wideband Power Sensors - Data Sheet
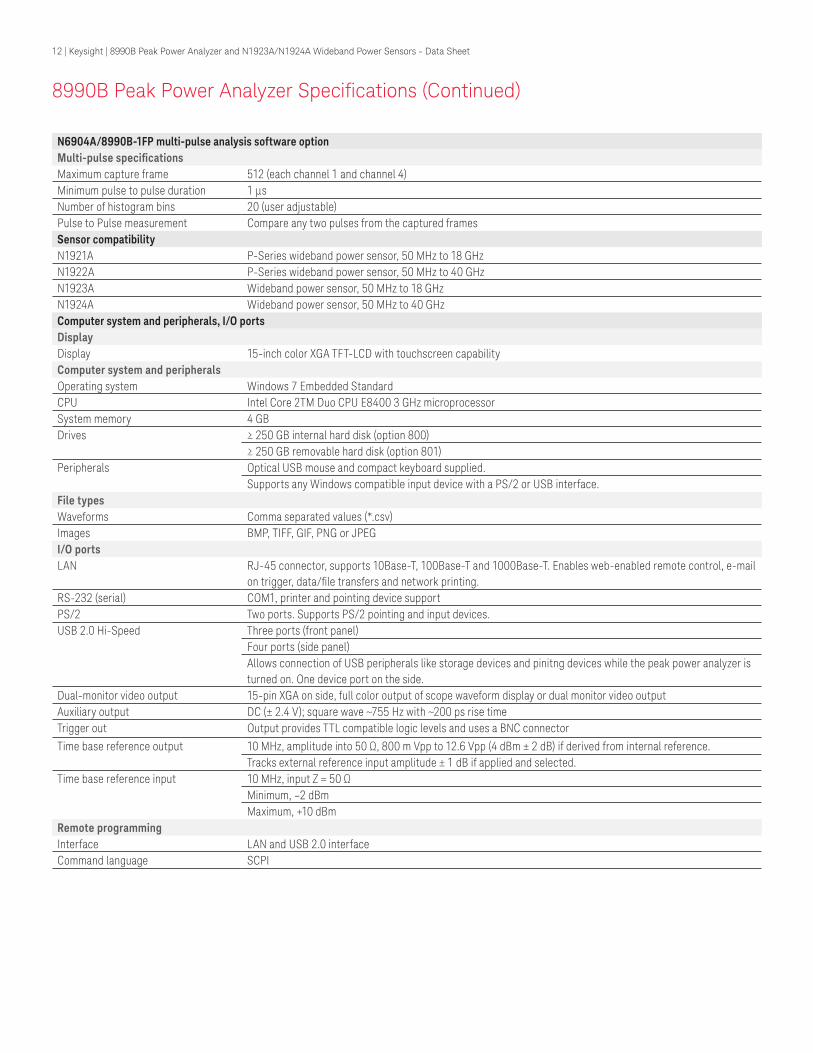
N6904A/8990B-1FP multi-pulse analysis software optionMulti-pulse specifications Maximum capture frame 512 (each channel 1 and channel 4)Minimum pulse to pulse duration 1 µsNumber of histogram bins 20 (user adjustable)Pulse to Pulse measurement Compare any two pulses from the captured framesSensor compatibilityN1921A P-Series wideband power sensor, 50 MHz to 18 GHzN1922A P-Series wideband power sensor, 50 MHz to 40 GHzN1923A Wideband power sensor, 50 MHz to 18 GHzN1924A Wideband power sensor, 50 MHz to 40 GHzComputer system and peripherals, I/O portsDisplay Display 15-inch color XGA TFT-LCD with touchscreen capabilityComputer system and peripherals Operating system Windows 7 Embedded StandardCPU Intel Core 2TM Duo CPU E8400 3 GHz microprocessorSystem memory 4 GBDrives ≥ 250 GB internal hard disk (option 800)
≥ 250 GB removable hard disk (option 801)Peripherals Optical USB mouse and compact keyboard supplied.
Supports any Windows compatible input device with a PS/2 or USB interface.File typesWaveforms Comma separated values (*.csv)Images BMP, TIFF, GIF, PNG or JPEGI/O portsLAN RJ-45 connector, supports 10Base-T, 100Base-T and 1000Base-T. Enables web-enabled remote control, e-mail
on trigger, data/file transfers and network printing.RS-232 (serial) COM1, printer and pointing device supportPS/2 Two ports. Supports PS/2 pointing and input devices.USB 2.0 Hi-Speed Three ports (front panel)
Four ports (side panel)Allows connection of USB peripherals like storage devices and pinitng devices while the peak power analyzer is turned on. One device port on the side.
Dual-monitor video output 15-pin XGA on side, full color output of scope waveform display or dual monitor video outputAuxiliary output DC (± 2.4 V); square wave ~755 Hz with ~200 ps rise timeTrigger out Output provides TTL compatible logic levels and uses a BNC connector
Time base reference output 10 MHz, amplitude into 50 Ω, 800 m Vpp to 12.6 Vpp (4 dBm ± 2 dB) if derived from internal reference.Tracks external reference input amplitude ± 1 dB if applied and selected.
Time base reference input 10 MHz, input Z = 50 ΩMinimum, –2 dBm Maximum, +10 dBm
Remote programmingInterface LAN and USB 2.0 interfaceCommand language SCPI
8990B Peak Power Analyzer Specifications (Continued)
13 | Keysight | 8990B Peak Power Analyzer and N1923A/N1924A Wideband Power Sensors - Data Sheet
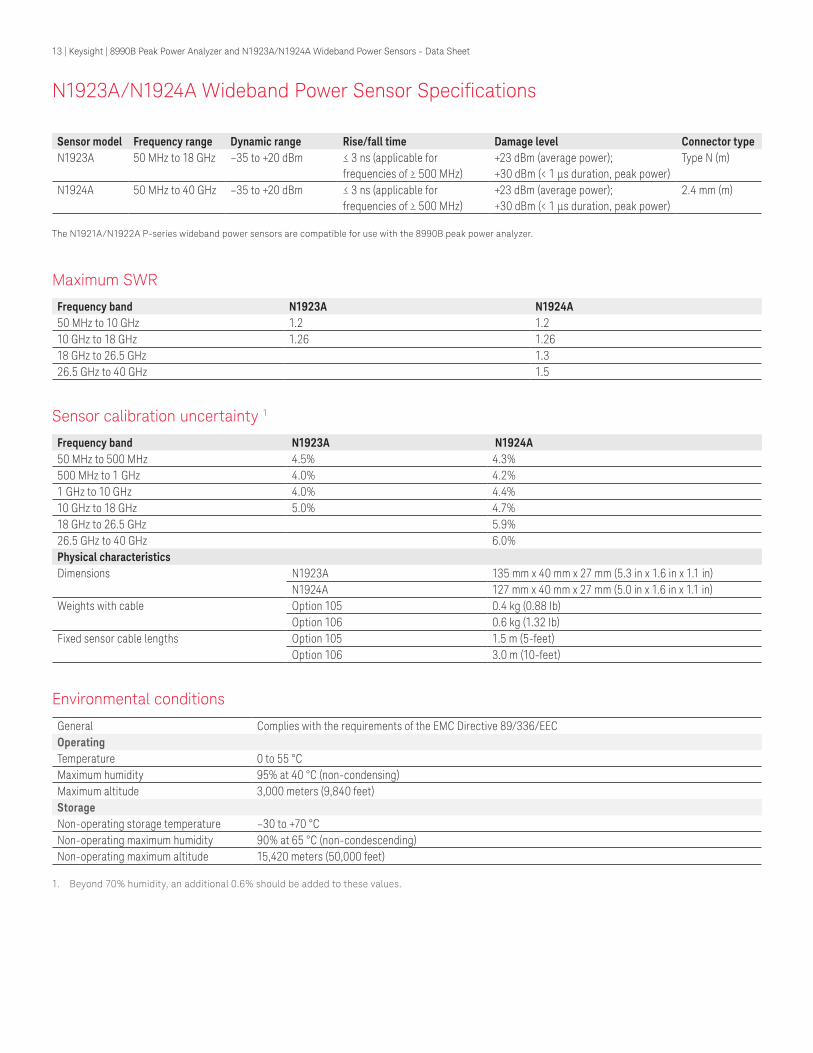
N1923A/N1924A Wideband Power Sensor Specifications
Sensor model Frequency range Dynamic range Rise/fall time Damage level Connector typeN1923A 50 MHz to 18 GHz –35 to +20 dBm ≤ 3 ns (applicable for
frequencies of ≥ 500 MHz)+23 dBm (average power);+30 dBm (< 1 μs duration, peak power)
Type N (m)
N1924A 50 MHz to 40 GHz –35 to +20 dBm ≤ 3 ns (applicable for frequencies of ≥ 500 MHz)
+23 dBm (average power); +30 dBm (< 1 μs duration, peak power)
2.4 mm (m)
The N1921A/N1922A P-series wideband power sensors are compatible for use with the 8990B peak power analyzer.
Maximum SWR
Frequency band N1923A N1924A50 MHz to 10 GHz 1.2 1.210 GHz to 18 GHz 1.26 1.2618 GHz to 26.5 GHz 1.326.5 GHz to 40 GHz 1.5
Sensor calibration uncertainty 1
Frequency band N1923A N1924A50 MHz to 500 MHz 4.5% 4.3%500 MHz to 1 GHz 4.0% 4.2%1 GHz to 10 GHz 4.0% 4.4%10 GHz to 18 GHz 5.0% 4.7%18 GHz to 26.5 GHz 5.9%26.5 GHz to 40 GHz 6.0%Physical characteristics Dimensions N1923A 135 mm x 40 mm x 27 mm (5.3 in x 1.6 in x 1.1 in)
N1924A 127 mm x 40 mm x 27 mm (5.0 in x 1.6 in x 1.1 in)Weights with cable Option 105 0.4 kg (0.88 Ib)
Option 106 0.6 kg (1.32 Ib)Fixed sensor cable lengths Option 105 1.5 m (5-feet)
Option 106 3.0 m (10-feet)
Environmental conditions
General Complies with the requirements of the EMC Directive 89/336/EECOperating Temperature 0 to 55 °CMaximum humidity 95% at 40 °C (non-condensing) Maximum altitude 3,000 meters (9,840 feet) Storage Non-operating storage temperature –30 to +70 °CNon-operating maximum humidity 90% at 65 °C (non-condescending) Non-operating maximum altitude 15,420 meters (50,000 feet)
1. Beyond 70% humidity, an additional 0.6% should be added to these values.

14 | Keysight | 8990B Peak Power Analyzer and N1923A/N1924A Wideband Power Sensors - Data Sheet
System Specifications and Characteristics
Average power measurement accuracyN1923A ≤ ± 0.2 dB or ± 4.5% 1
N1924A ≤ ± 0.3 dB or ± 6.7%
1. Specification is valid over a range of –15 to +20 dBm, and a frequency range of 0.5 to 10 GHz, DUT Max. SWR < 1.27 for the N1923A, and a frequency range of 0.5 to 40 GHz, DUT Max. SWR < 1.2 for the N1924A. Averaging is set to 32.
Figure 1. Flatness response.
Video bandwidthThe video bandwidth in the peak power analyzer can be set to High, Medium, Low and Off. The video bandwidths stated in the table below are not the 3 dB bandwidths, as the video bandwidths are corrected for optimal flatness (except the Off filter). Refer to Figure 1 for information on the flatness response. The Off video bandwidth setting provides the warranted rise time and fall time specification and is the recommended setting for minimizing overshoot on pulse signals.
Figure 2. Video Bandwidth set to Off.
Low
0.5
0.0
−0.5
−1.0
−1.5
−2.0
−2.5
−3.0
−3.5
0
Erro
r (d
B)
5 10 15 20 25 30
Medium
Input tone separation frequency (MHz)
High
Off (< 500 MHz)
Off (> 500 MHz)
3.5
3.0
2.5
2.0
1.5
1.0
0.5
0
Peak
to
aver
age
(dB
)
10−10 30 50 70 90 110 120 150
Tone separation (MHz)
15 | Keysight | 8990B Peak Power Analyzer and N1923A/N1924A Wideband Power Sensors - Data Sheet
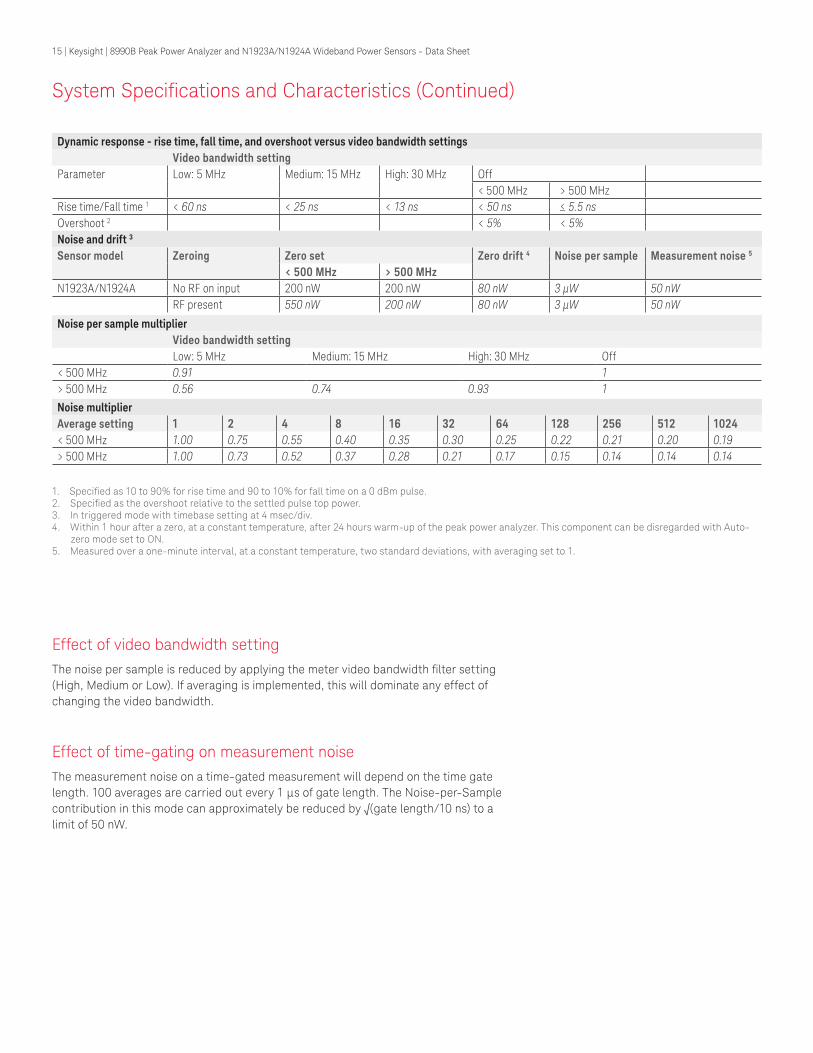
Effect of video bandwidth setting The noise per sample is reduced by applying the meter video bandwidth filter setting (High, Medium or Low). If averaging is implemented, this will dominate any effect of changing the video bandwidth.
Effect of time-gating on measurement noise The measurement noise on a time-gated measurement will depend on the time gate length. 100 averages are carried out every 1 µs of gate length. The Noise-per-Sample contribution in this mode can approximately be reduced by √(gate length/10 ns) to a limit of 50 nW.
1. Specified as 10 to 90% for rise time and 90 to 10% for fall time on a 0 dBm pulse. 2. Specified as the overshoot relative to the settled pulse top power.3. In triggered mode with timebase setting at 4 msec/div.4. Within 1 hour after a zero, at a constant temperature, after 24 hours warm-up of the peak power analyzer. This component can be disregarded with Auto-
zero mode set to ON.5. Measured over a one-minute interval, at a constant temperature, two standard deviations, with averaging set to 1.
Noise multiplierAverage setting 1 2 4 8 16 32 64 128 256 512 1024< 500 MHz 1.00 0.75 0.55 0.40 0.35 0.30 0.25 0.22 0.21 0.20 0.19> 500 MHz 1.00 0.73 0.52 0.37 0.28 0.21 0.17 0.15 0.14 0.14 0.14
Noise per sample multiplier Video bandwidth settingLow: 5 MHz Medium: 15 MHz High: 30 MHz Off
< 500 MHz 0.91 1> 500 MHz 0.56 0.74 0.93 1
Dynamic response - rise time, fall time, and overshoot versus video bandwidth settings Video bandwidth setting
Parameter Low: 5 MHz Medium: 15 MHz High: 30 MHz Off< 500 MHz > 500 MHz
Rise time/Fall time 1 < 60 ns < 25 ns < 13 ns < 50 ns ≤ 5.5 nsOvershoot 2 < 5% < 5%Noise and drift 3
Sensor model Zeroing Zero set Zero drift 4 Noise per sample Measurement noise 5
< 500 MHz > 500 MHzN1923A/N1924A No RF on input 200 nW 200 nW 80 nW 3 μW 50 nW
RF present 550 nW 200 nW 80 nW 3 μW 50 nW
System Specifications and Characteristics (Continued)
16 | Keysight | 8990B Peak Power Analyzer and N1923A/N1924A Wideband Power Sensors - Data Sheet
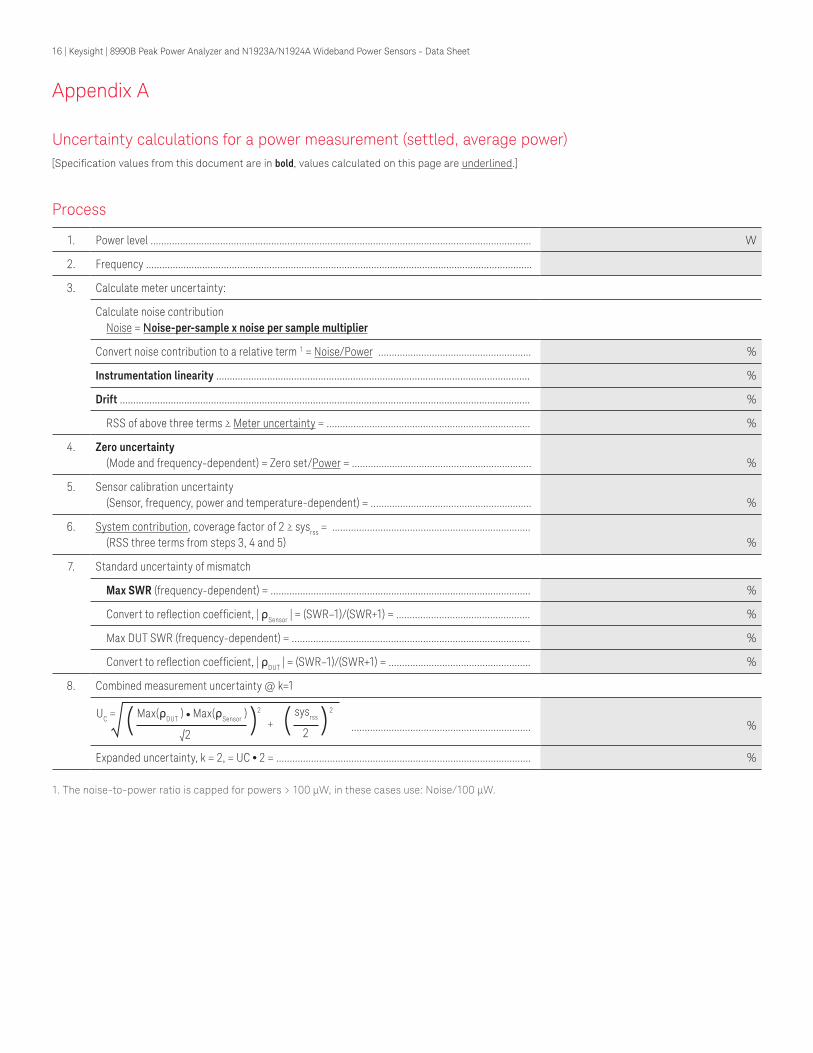
Appendix A
Uncertainty calculations for a power measurement (settled, average power)[Specification values from this document are in bold, values calculated on this page are underlined.]
Process
1. Power level .............................................................................................................................................. W
2. Frequency ................................................................................................................................................
3. Calculate meter uncertainty:
Calculate noise contribution Noise = Noise-per-sample x noise per sample multiplier
Convert noise contribution to a relative term 1 = Noise/Power ......................................................... %
Instrumentation linearity ..................................................................................................................... %
Drift ......................................................................................................................................................... %
RSS of above three terms ≥ Meter uncertainty = ............................................................................ %
4. Zero uncertainty (Mode and frequency-dependent) = Zero set/Power = ...................................................................
%
5. Sensor calibration uncertainty (Sensor, frequency, power and temperature-dependent) = ............................................................
%
6. System contribution, coverage factor of 2 ≥ sysrss = .......................................................................... (RSS three terms from steps 3, 4 and 5)
%
7. Standard uncertainty of mismatch
Max SWR (frequency-dependent) = ................................................................................................. %
Convert to reflection coefficient, | ρSensor | = (SWR–1)/(SWR+1) = .................................................. %
Max DUT SWR (frequency-dependent) = ......................................................................................... %
Convert to reflection coefficient, | ρDUT | = (SWR–1)/(SWR+1) = ..................................................... %
8. Combined measurement uncertainty @ k=1
%
Expanded uncertainty, k = 2, = UC ⦁ 2 = ............................................................................................... %
1. The noise-to-power ratio is capped for powers > 100 μW, in these cases use: Noise/100 μW.
( () )2 2UC = Max(ρDUT ) ⦁ Max(ρSensor )
√2+
sysrss
2 ...................................................................
17 | Keysight | 8990B Peak Power Analyzer and N1923A/N1924A Wideband Power Sensors - Data Sheet
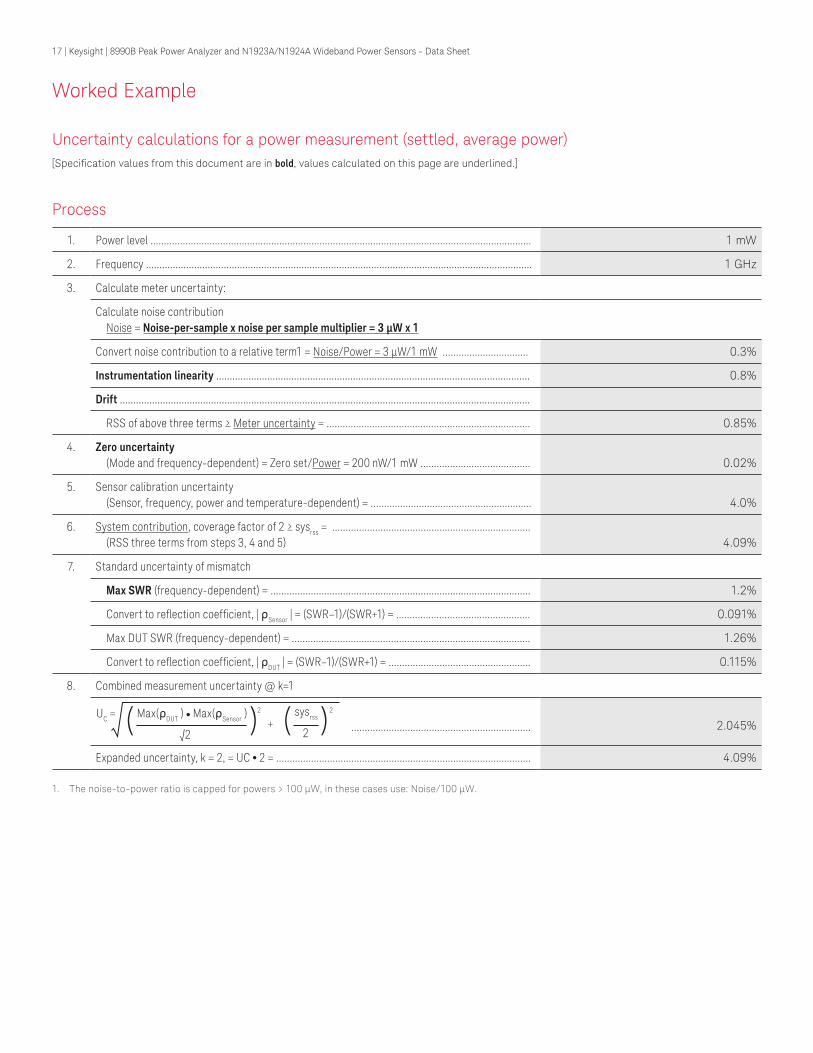
Worked Example
Uncertainty calculations for a power measurement (settled, average power)[Specification values from this document are in bold, values calculated on this page are underlined.]
Process
1. Power level .............................................................................................................................................. 1 mW
2. Frequency ................................................................................................................................................ 1 GHz
3. Calculate meter uncertainty:
Calculate noise contribution Noise = Noise-per-sample x noise per sample multiplier = 3 μW x 1
Convert noise contribution to a relative term1 = Noise/Power = 3 μW/1 mW ................................ 0.3%
Instrumentation linearity ..................................................................................................................... 0.8%
Drift .........................................................................................................................................................
RSS of above three terms ≥ Meter uncertainty = ............................................................................ 0.85%
4. Zero uncertainty (Mode and frequency-dependent) = Zero set/Power = 200 nW/1 mW .........................................
0.02%
5. Sensor calibration uncertainty (Sensor, frequency, power and temperature-dependent) = ............................................................
4.0%
6. System contribution, coverage factor of 2 ≥ sysrss = .......................................................................... (RSS three terms from steps 3, 4 and 5)
4.09%
7. Standard uncertainty of mismatch
Max SWR (frequency-dependent) = ................................................................................................. 1.2%
Convert to reflection coefficient, | ρSensor | = (SWR–1)/(SWR+1) = .................................................. 0.091%
Max DUT SWR (frequency-dependent) = ......................................................................................... 1.26%
Convert to reflection coefficient, | ρDUT | = (SWR–1)/(SWR+1) = ..................................................... 0.115%
8. Combined measurement uncertainty @ k=1
2.045%
Expanded uncertainty, k = 2, = UC ⦁ 2 = ............................................................................................... 4.09%
1. The noise-to-power ratio is capped for powers > 100 μW, in these cases use: Noise/100 μW.
( () )2 2UC = Max(ρDUT ) ⦁ Max(ρSensor )
√2+
sysrss
2 ...................................................................
18 | Keysight | 8990B Peak Power Analyzer and N1923A/N1924A Wideband Power Sensors - Data Sheet
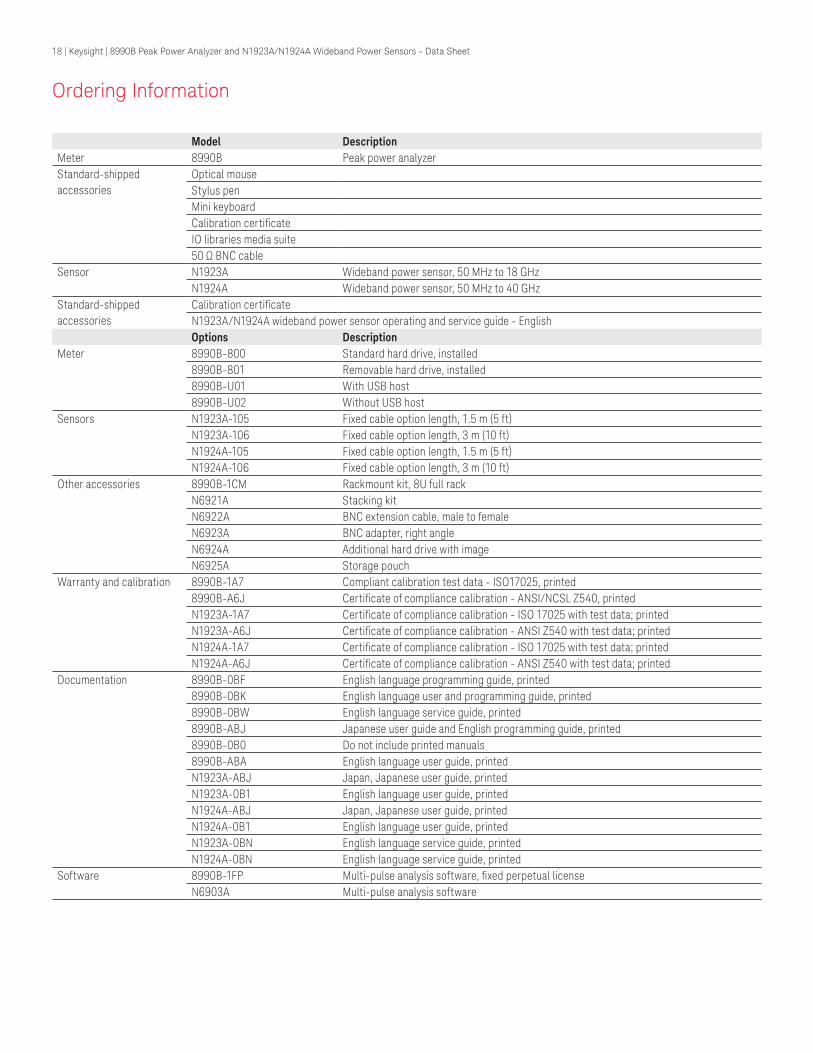
Model Description Meter 8990B Peak power analyzer Standard-shipped accessories
Optical mouseStylus penMini keyboardCalibration certificateIO libraries media suite50 Ω BNC cable
Sensor N1923A Wideband power sensor, 50 MHz to 18 GHzN1924A Wideband power sensor, 50 MHz to 40 GHz
Standard-shipped accessories
Calibration certificateN1923A/N1924A wideband power sensor operating and service guide - English Options Description
Meter 8990B-800 Standard hard drive, installed8990B-801 Removable hard drive, installed8990B-U01 With USB host8990B-U02 Without USB host
Sensors N1923A-105 Fixed cable option length, 1.5 m (5 ft)N1923A-106 Fixed cable option length, 3 m (10 ft)N1924A-105 Fixed cable option length, 1.5 m (5 ft)N1924A-106 Fixed cable option length, 3 m (10 ft)
Other accessories 8990B-1CM Rackmount kit, 8U full rackN6921A Stacking kitN6922A BNC extension cable, male to femaleN6923A BNC adapter, right angleN6924A Additional hard drive with imageN6925A Storage pouch
Warranty and calibration 8990B-1A7 Compliant calibration test data - ISO17025, printed8990B-A6J Certificate of compliance calibration - ANSI/NCSL Z540, printedN1923A-1A7 Certificate of compliance calibration - ISO 17025 with test data; printedN1923A-A6J Certificate of compliance calibration - ANSI Z540 with test data; printedN1924A-1A7 Certificate of compliance calibration - ISO 17025 with test data; printedN1924A-A6J Certificate of compliance calibration - ANSI Z540 with test data; printed
Documentation 8990B-0BF English language programming guide, printed8990B-0BK English language user and programming guide, printed8990B-0BW English language service guide, printed8990B-ABJ Japanese user guide and English programming guide, printed8990B-0B0 Do not include printed manuals8990B-ABA English language user guide, printedN1923A-ABJ Japan, Japanese user guide, printedN1923A-0B1 English language user guide, printedN1924A-ABJ Japan, Japanese user guide, printedN1924A-0B1 English language user guide, printedN1923A-0BN English language service guide, printedN1924A-0BN English language service guide, printed
Software 8990B-1FP Multi-pulse analysis software, fixed perpetual licenseN6903A Multi-pulse analysis software
Ordering Information

myKeysight
www.keysight.com/find/mykeysightA personalized view into the information most relevant to you.
Three-Year Warranty
www.keysight.com/find/ThreeYearWarrantyKeysight’s committed to superior product quality and lower total cost of ownership. Keysight is the only test and measurement company with three-year warranty standard on all instruments, worldwide. And, we provide a full one-year warranty on all accessories, calibration devices, systems and custom products.
Keysight Assurance Planswww.keysight.com/find/AssurancePlansUp to five years of protection and no budgetary surprises to ensure your instruments are operating to specification so you can rely on accurate measurements.
Keysight Infolinewww.keysight.com/find/serviceKeysight’s insight to best in class information management. Free access to your Keysight equipment company reports and e-library.
Keysight Channel Partnerswww.keysight.com/find/channelpartnersGet the best of both worlds: Keysight’s measurement expertise and product breadth, combined with channel partner convenience.
www.keysight.com/find/peakpoweranalyzer
From Hewlett-Packard through Agilent to KeysightFor more than 75 years, we‘ve been helping you unlock measurement insights.
Our unique combination of hardware, software and people can help you reach
your next breakthrough. Unlocking measurement insights since 1939.
1939 THE FUTURE
For more information on Keysight Technologies’ products, applications or services, please contact your local Keysight office. The complete list is available at:www.keysight.com/find/contactus
Americas Canada (877) 894 4414Brazil 55 11 3351 7010Mexico 001 800 254 2440United States (800) 829 4444
Asia PacificAustralia 1 800 629 485China 800 810 0189Hong Kong 800 938 693India 1 800 11 2626Japan 0120 (421) 345Korea 080 769 0800Malaysia 1 800 888 848Singapore 1 800 375 8100Taiwan 0800 047 866Other AP Countries (65) 6375 8100
Europe & Middle EastAustria 0800 001122Belgium 0800 58580Finland 0800 523252France 0805 980333Germany 0800 6270999Ireland 1800 832700Israel 1 809 343051Italy 800 599100Luxembourg +32 800 58580Netherlands 0800 0233200Russia 8800 5009286Spain 800 000154Sweden 0200 882255Switzerland 0800 805353
Opt. 1 (DE)Opt. 2 (FR)Opt. 3 (IT)
United Kingdom 0800 0260637
For other unlisted countries:www.keysight.com/find/contactus(BP-07-24-15)
www.keysight.com/go/qualityKeysight Technologies, Inc.DEKRA Certified ISO 9001:2008 Quality Management System
19 | Keysight | 8990B Peak Power Analyzer and N1923A/N1924A Wideband Power Sensors - Data Sheet
This information is subject to change without notice.© Keysight Technologies, 2013 -2015Published in USA, October 9, 20155990-8126ENwww.keysight.com