Keynote: Advances in Polarimetric SAR...
33
1 Keynote: Advances in Polarimetric SAR Interferometry Presented at POLInSAR 2007 by Shane R. Cloude*,Eric Pottier** *AEL Consultants,Scotland, UK e-mail : [email protected] Web :http://web.mac.com/aelc ** University of Rennes, France, e-mail : eric.pottier@univ_rennes1.fr Web : http://www.ietr.org/ ** Acknowledgements :
Transcript of Keynote: Advances in Polarimetric SAR...
1
Keynote:Advances in
Polarimetric SAR Interferometry
Presented at POLInSAR 2007 by
Shane R. Cloude*,Eric Pottier**
*AEL Consultants,Scotland, UK e-mail : [email protected] Web :http://web.mac.com/aelc** University of Rennes, France, e-mail : eric.pottier@univ_rennes1.fr Web : http://www.ietr.org/
**
Acknowledgements :
2
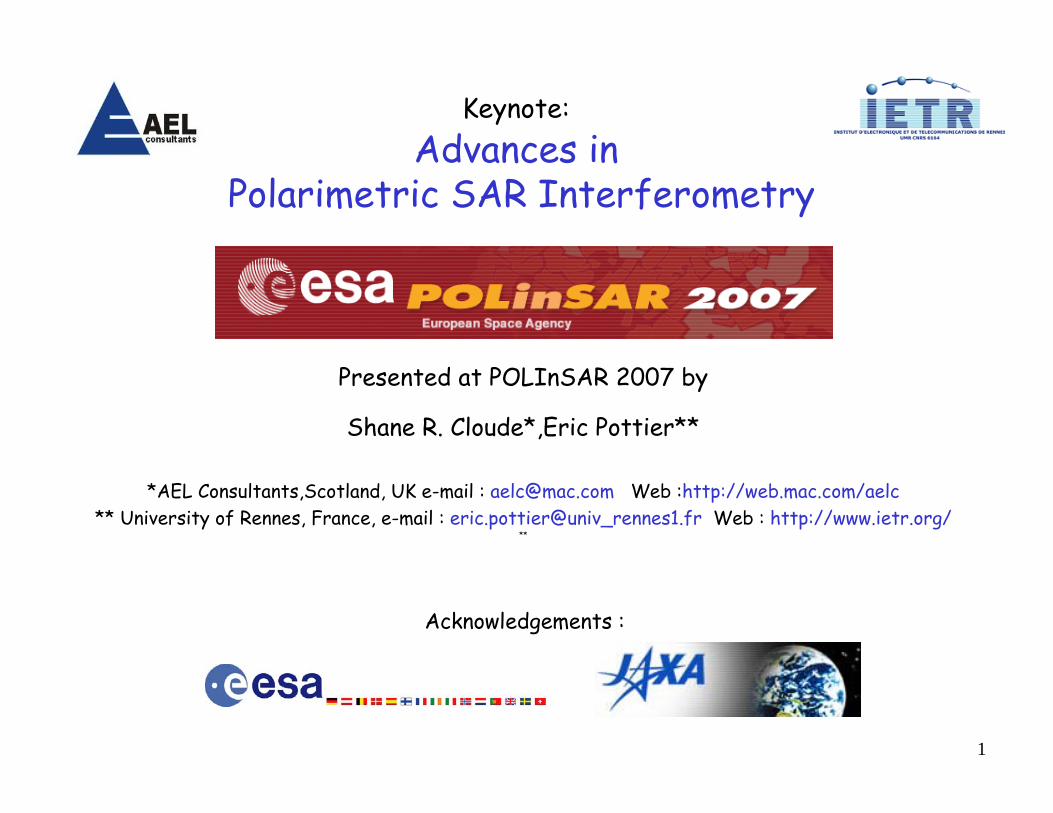
Outline
• POLInSAR Introduction
• ALOS-PALSAR : a new spaceborne coherent polarimeter
• ALOS Case Studies
- Quad and Dual Polarimetry for improved Forest Classification
- Polarimetric Time Series Analysis
- First Polarimetric Interferometry (POLInSAR) results
- L-Band tropical forest results
• The Future : Polarimetric Coherence Tomography
• Summary and Conclusions
3
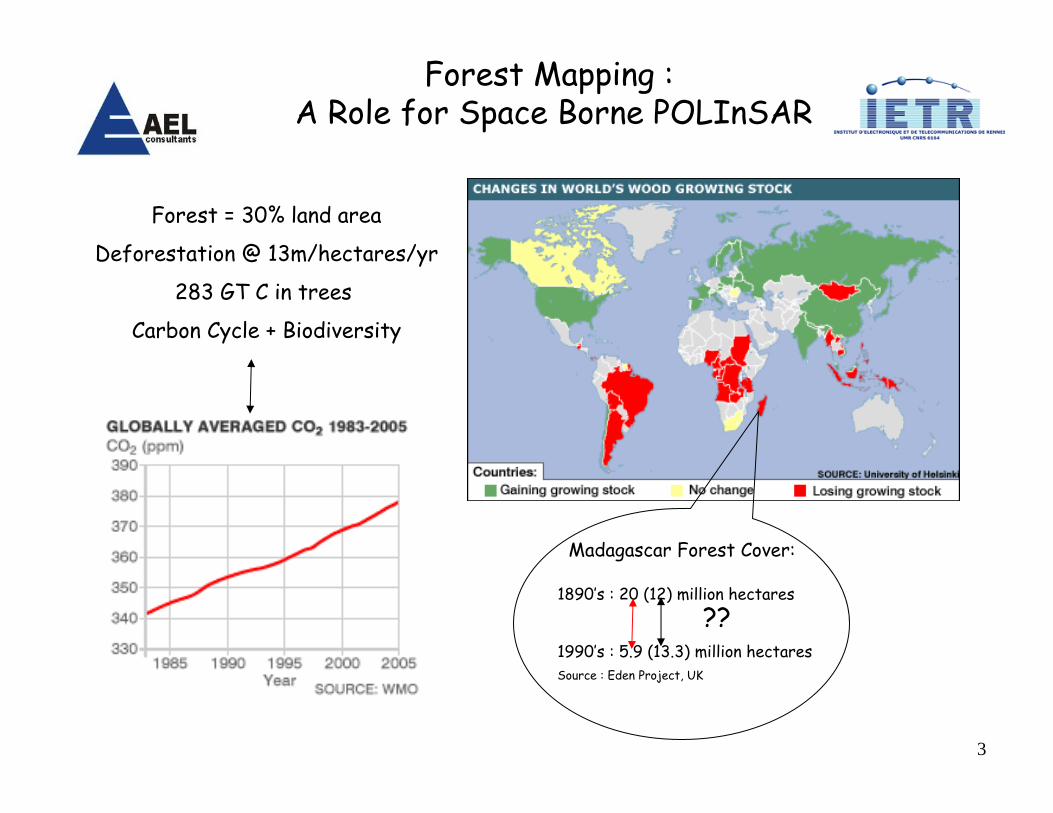
1890’s : 20 (12) million hectares
1990’s : 5.9 (13.3) million hectaresSource : Eden Project, UK
Madagascar Forest Cover:
Forest Mapping : A Role for Space Borne POLInSAR
??
Forest = 30% land area
Deforestation @ 13m/hectares/yr
283 GT C in trees
Carbon Cycle + Biodiversity
4
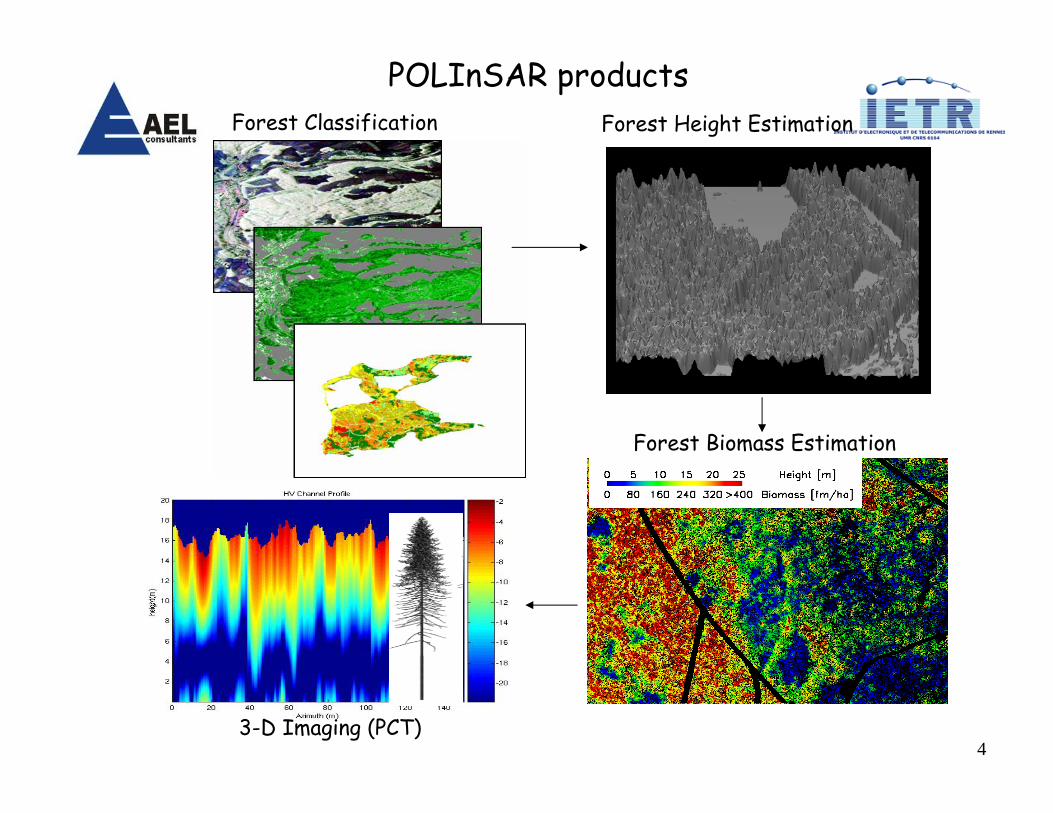
Forest Classification Forest Height Estimation
Forest Biomass Estimation
3-D Imaging (PCT)
POLInSAR products

5
Forest Parameter Estimation from POLInSAR
˜ γ w( )= eiφ γ tv ˜ γ v (hv ) + µ w( )1+ µ w( )
ˆ φ = arg( ˜ γ wV− ˜ γ w S
1− Lw S( )) 0 ≤ Lw S≤1
hv =arg( ˜ γ wv
) − ˆ φ kz
+ 0.8sinc−1( ˜ γ wv
)kz
γ t >> ˜ γ v
RVOG (OVOG)
˜ γ σ 0 = γgσ 0ge−βV + γ t ˜ γ v (hv )σ 0v (1− e−βV )
IWCM
γ t << ˜ γ v
γσ 0 = γ1σ 01 + γ2σ 02 + ...
2-layer Vertical structure function
z
e.g. γ tv = 0,γ tg =1
⇒ γ w( )=µ w( )
1+ µ w( )
TemporalDecorrelation
Dominant
Volume Decorrelation
Dominant
f ↑ B⊥ ↓ BT ↑f ↓ B⊥ ↑ BT ↓
f(z)
Forest heightStem VolumeSurface topography

6

7
L-band POLInSAR Simulations of Injune*
Critical performance figure is variation of µ with polarisationat POLInSAR 2005 we only had theoretical models, for example:
* Courtesy of Mark Williams
8
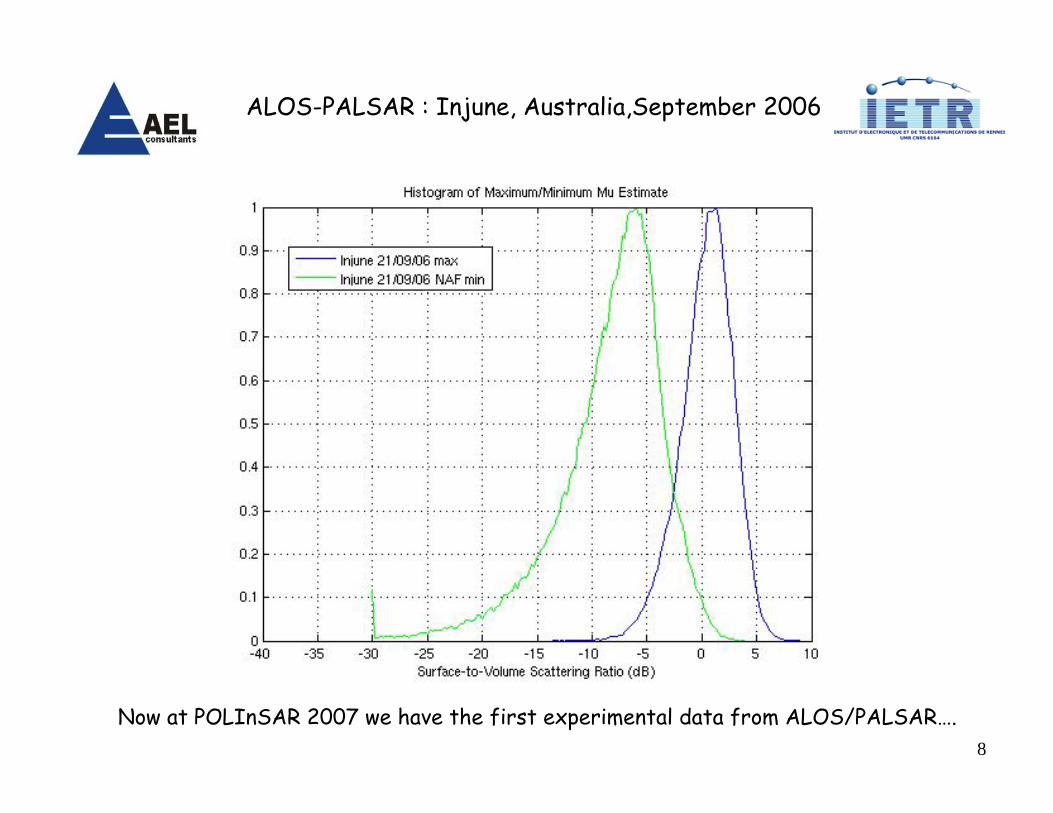
Now at POLInSAR 2007 we have the first experimental data from ALOS/PALSAR….
ALOS-PALSAR : Injune, Australia,September 2006
9
POLInSAR Results from ALOS-PALSAR
10
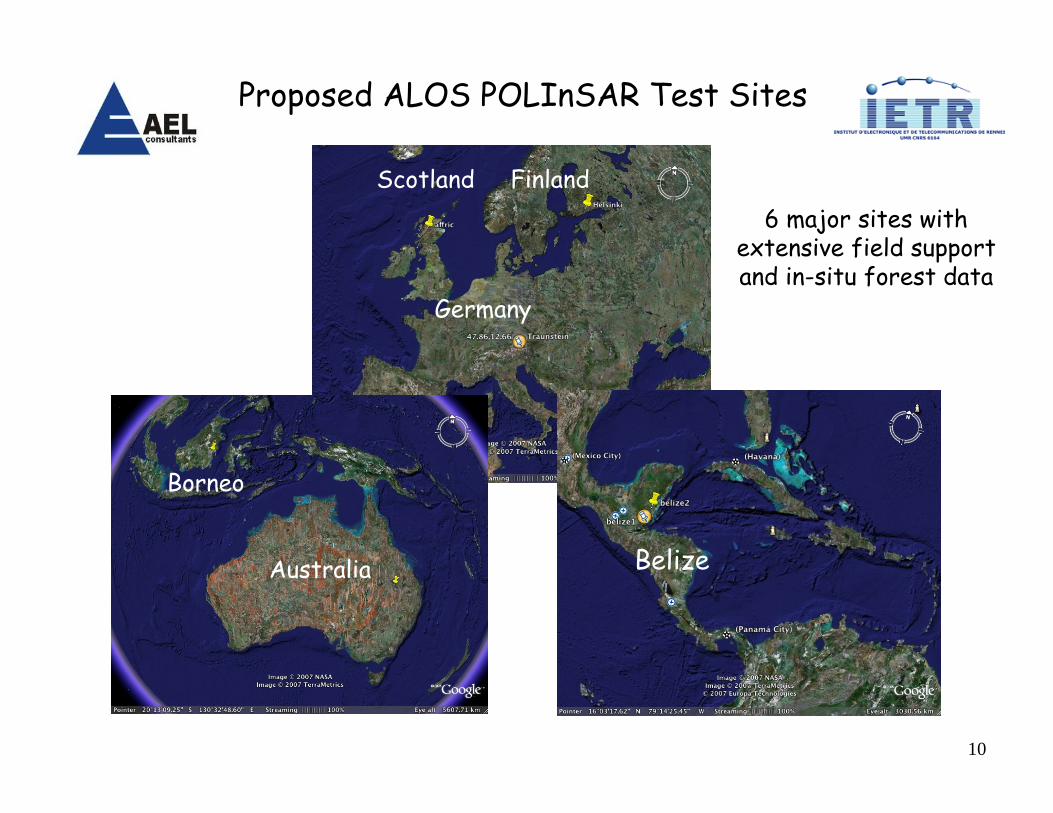
Proposed ALOS POLInSAR Test Sites
Scotland Finland
Germany
Borneo
Australia Belize
6 major sites withextensive field supportand in-situ forest data
11
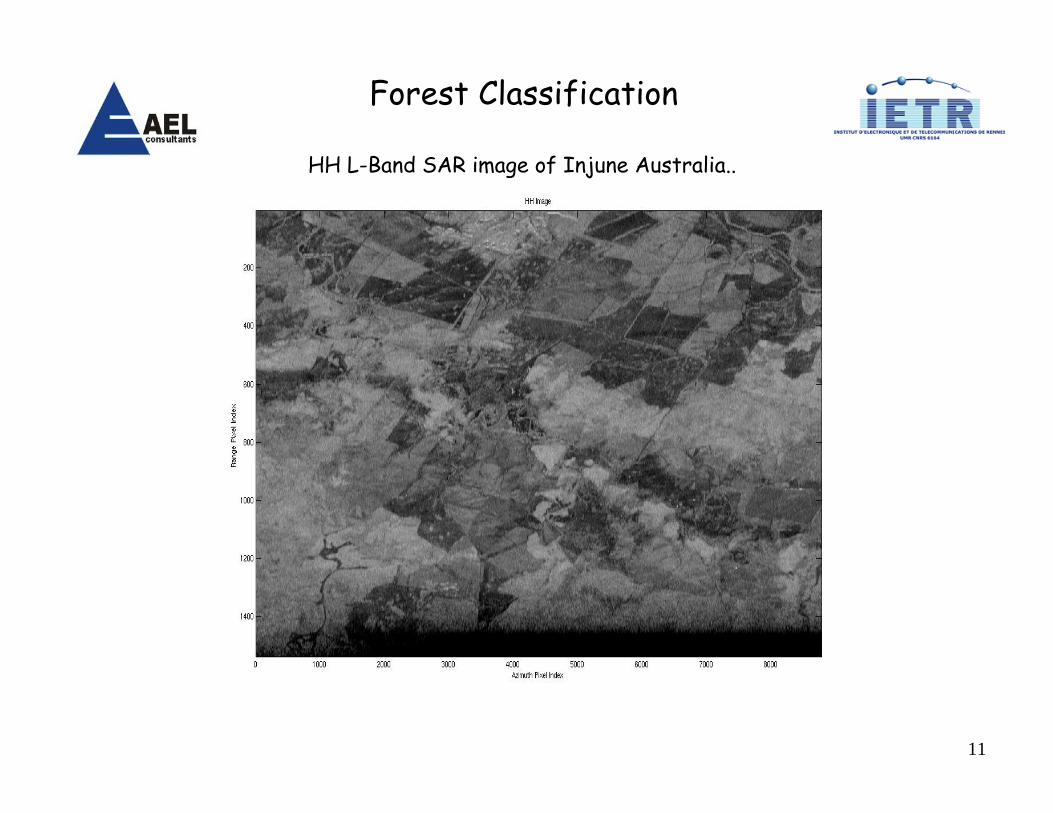
Forest Classification
HH L-Band SAR image of Injune Australia..

12
and Polarimetric L-Band SAR image of Injune Australia..
Forest Classification
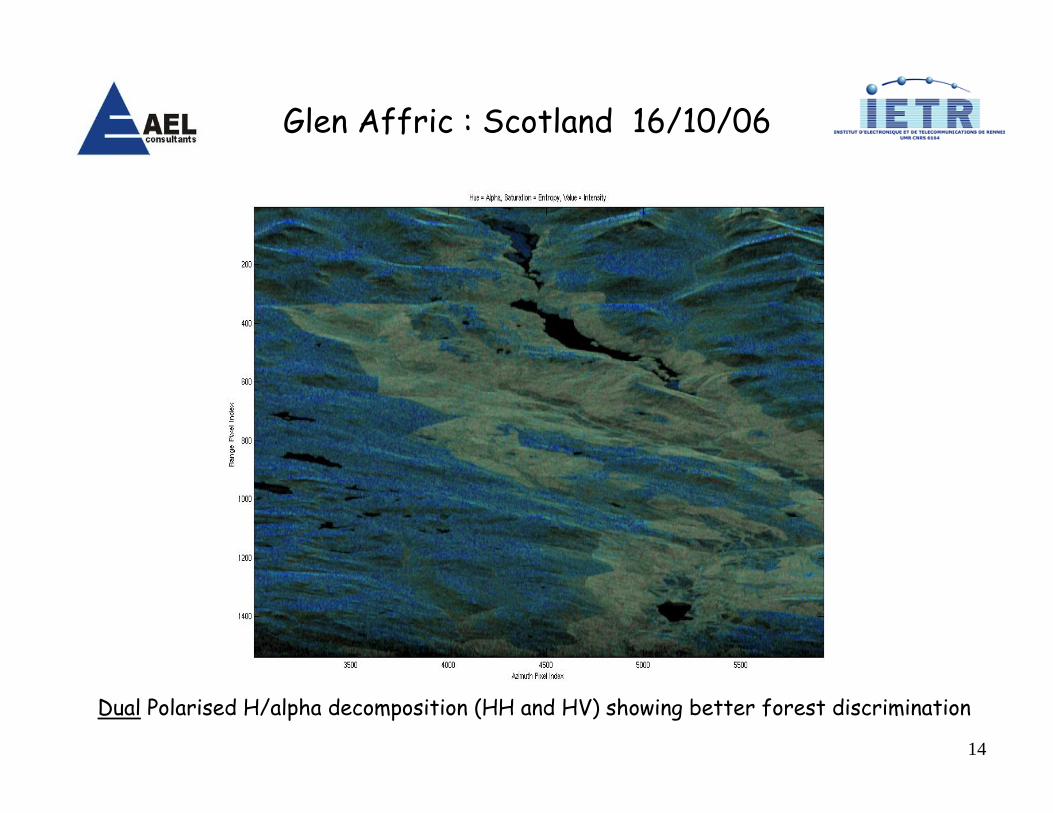
HSV image : Hue = alpha, Saturation = Entropy, Value = Total Intensity
13
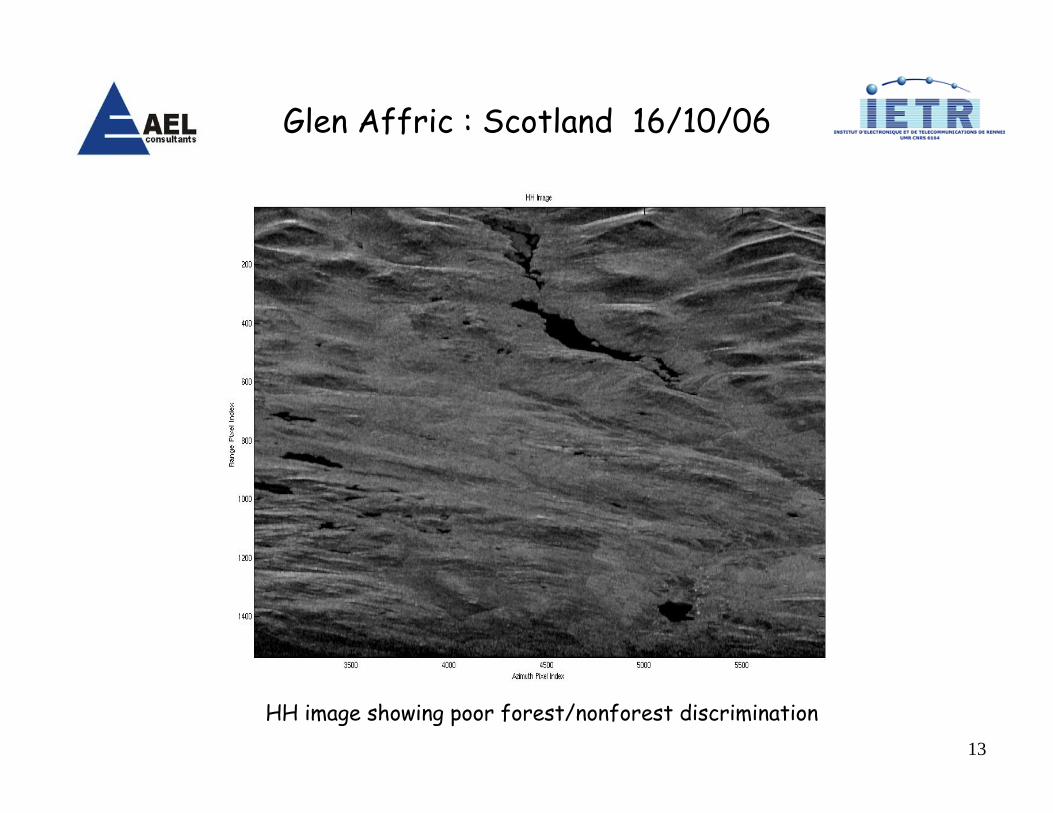
Glen Affric : Scotland 16/10/06
HH image showing poor forest/nonforest discrimination
14
Dual Polarised H/alpha decomposition (HH and HV) showing better forest discrimination
Glen Affric : Scotland 16/10/06

15
Polarimetric Time Series Analysis

16
HH PALSAR Image 21/09/06
17
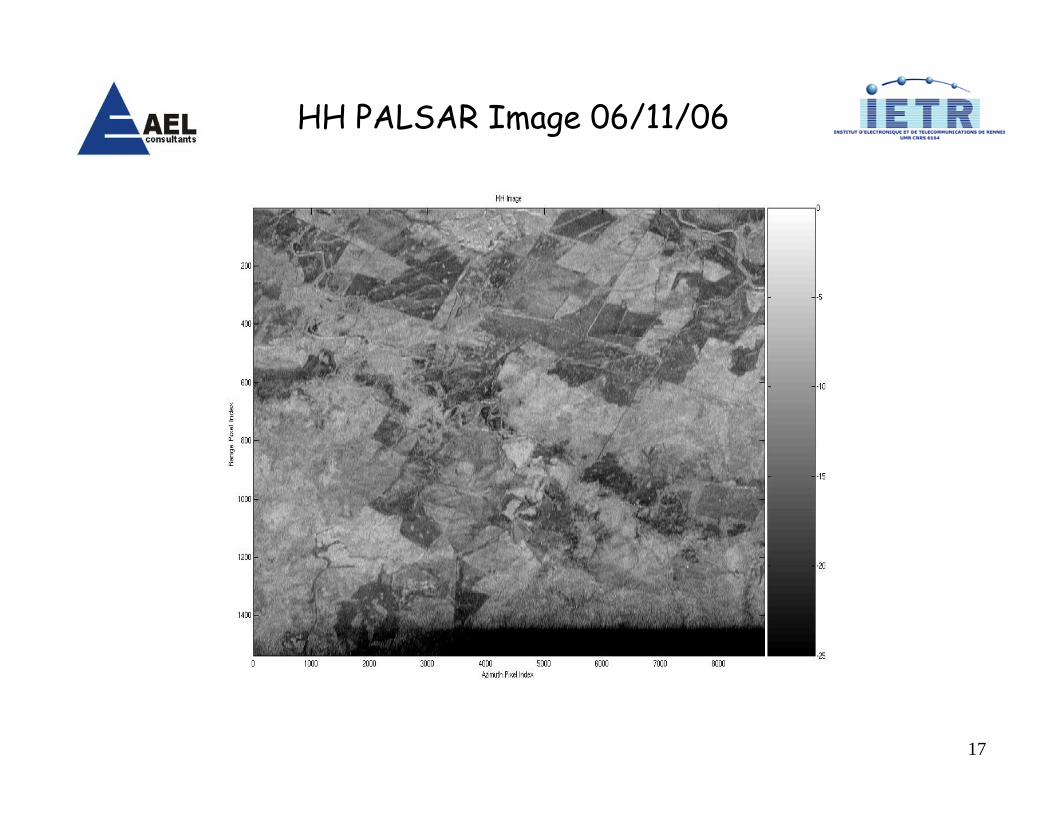
HH PALSAR Image 06/11/06
18
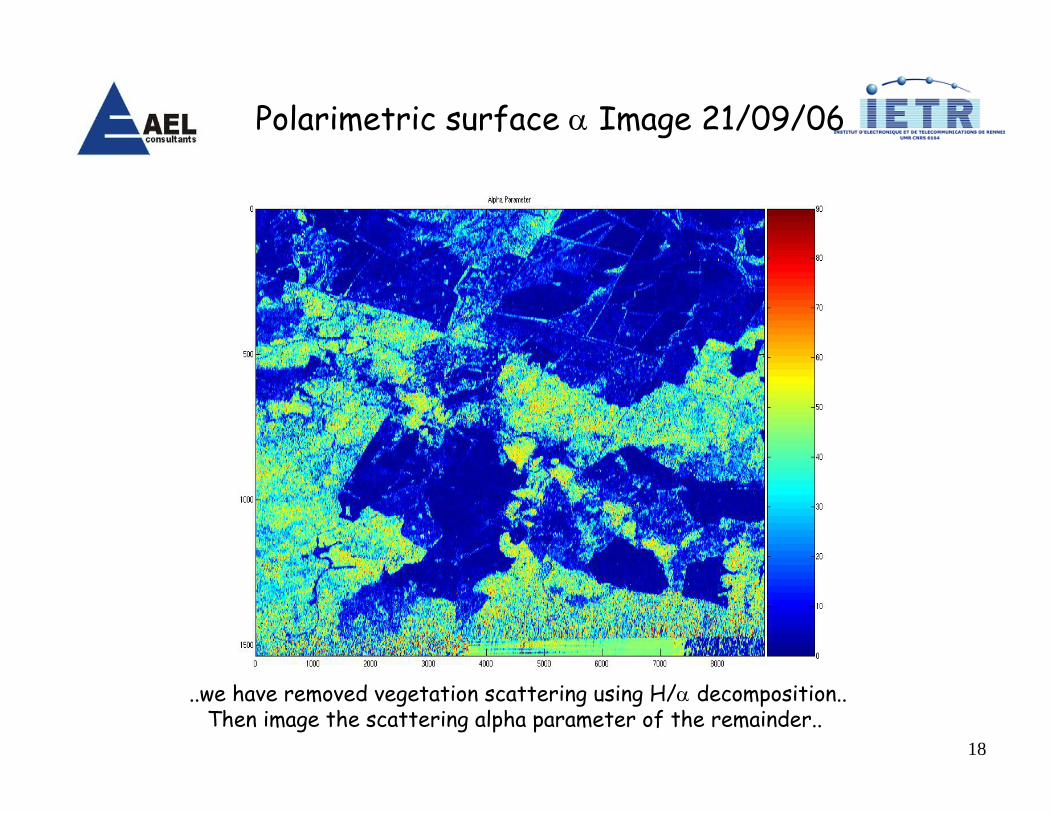
Polarimetric surface α Image 21/09/06
..we have removed vegetation scattering using H/α decomposition..Then image the scattering alpha parameter of the remainder..
19
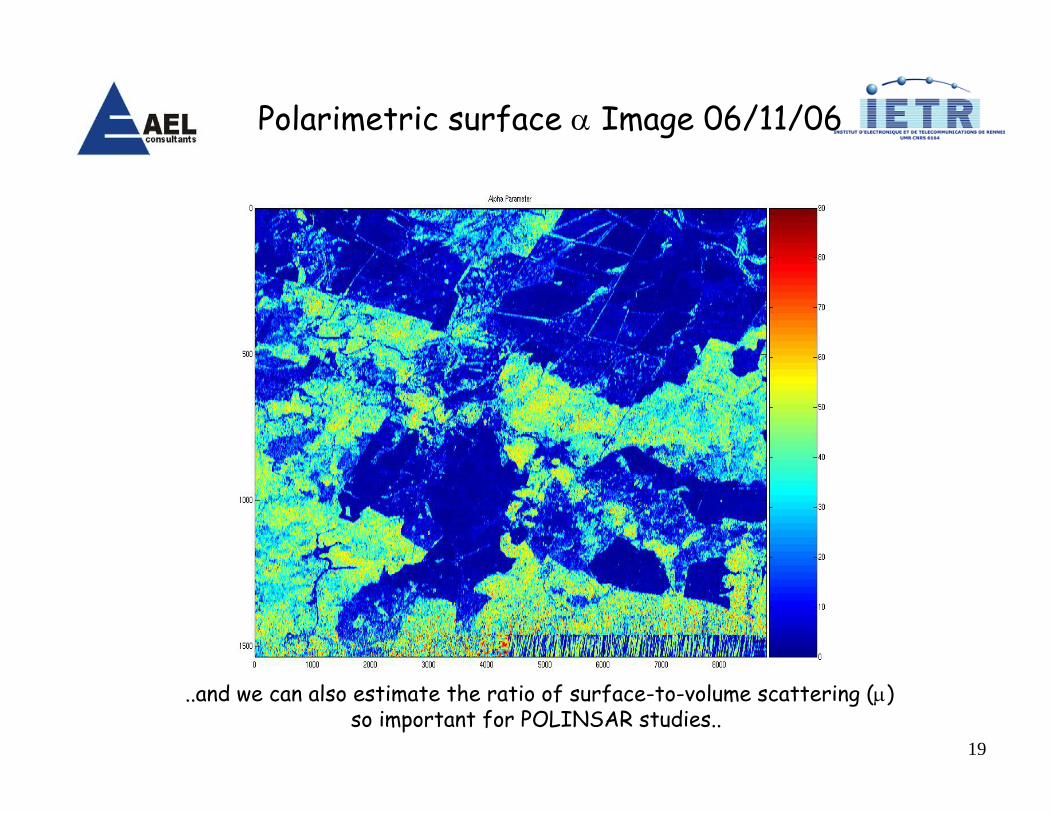
Polarimetric surface α Image 06/11/06
..and we can also estimate the ratio of surface-to-volume scattering (µ)so important for POLINSAR studies..
20
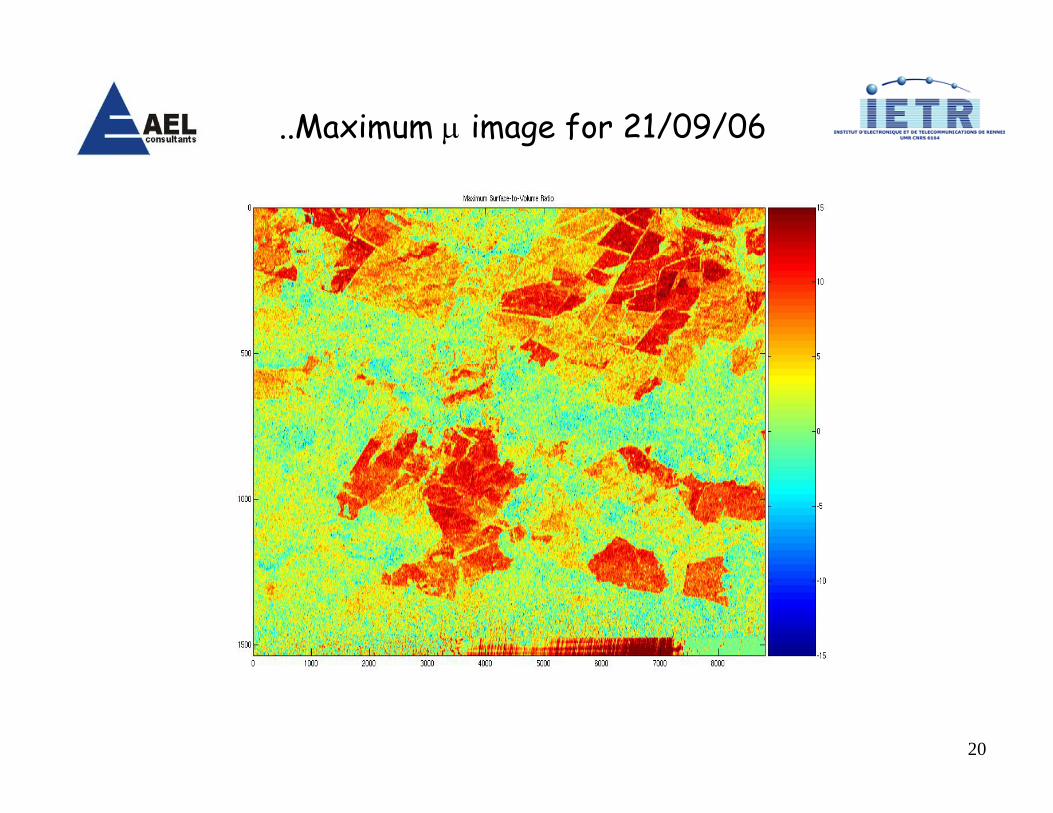
..Maximum µ image for 21/09/06
21
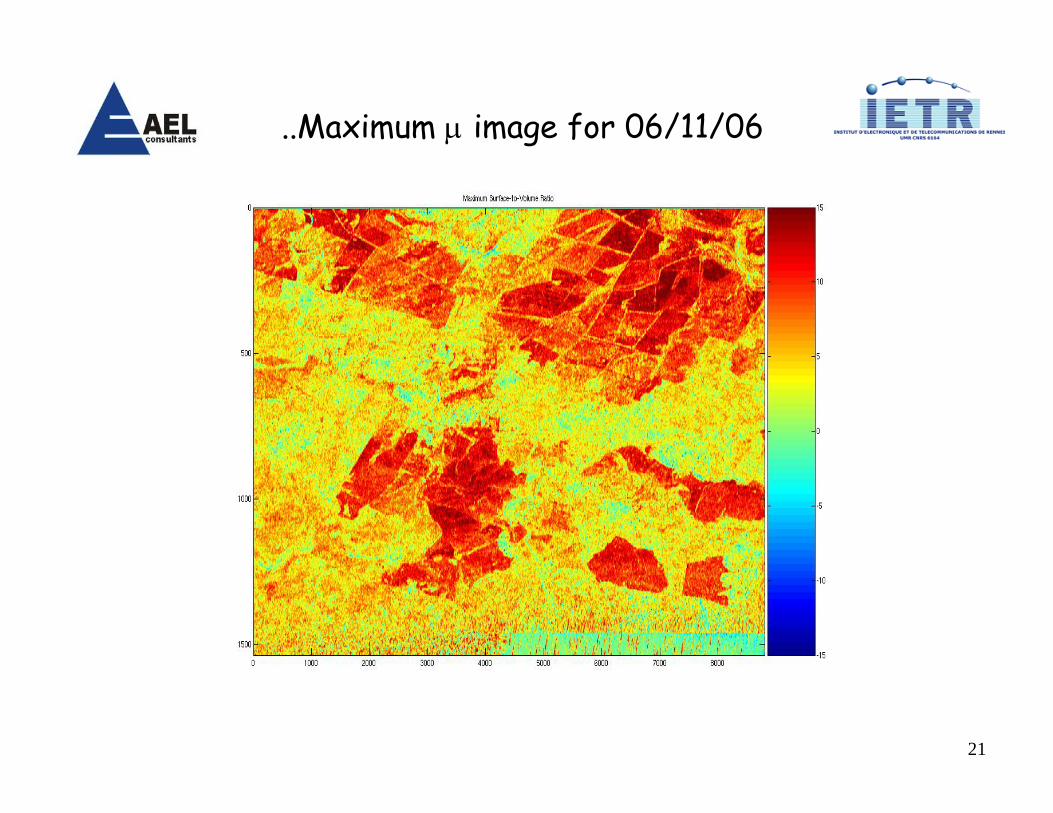
..Maximum µ image for 06/11/06
22
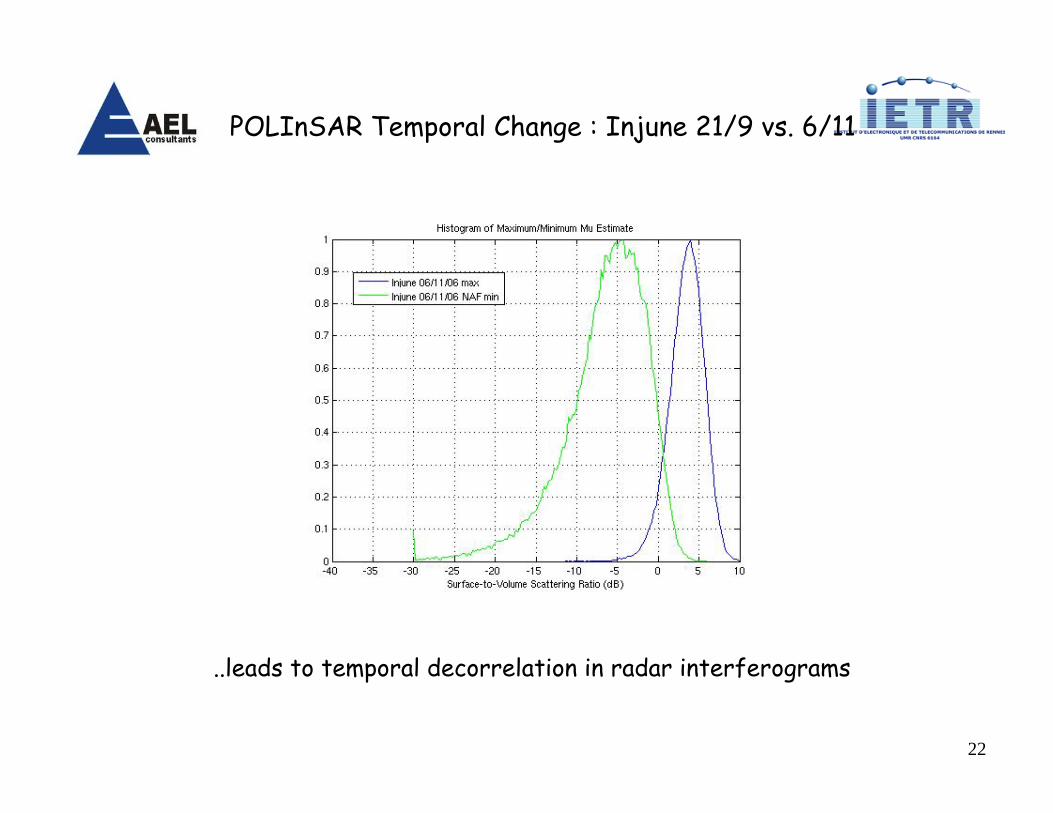
POLInSAR Temporal Change : Injune 21/9 vs. 6/11
..leads to temporal decorrelation in radar interferograms
23
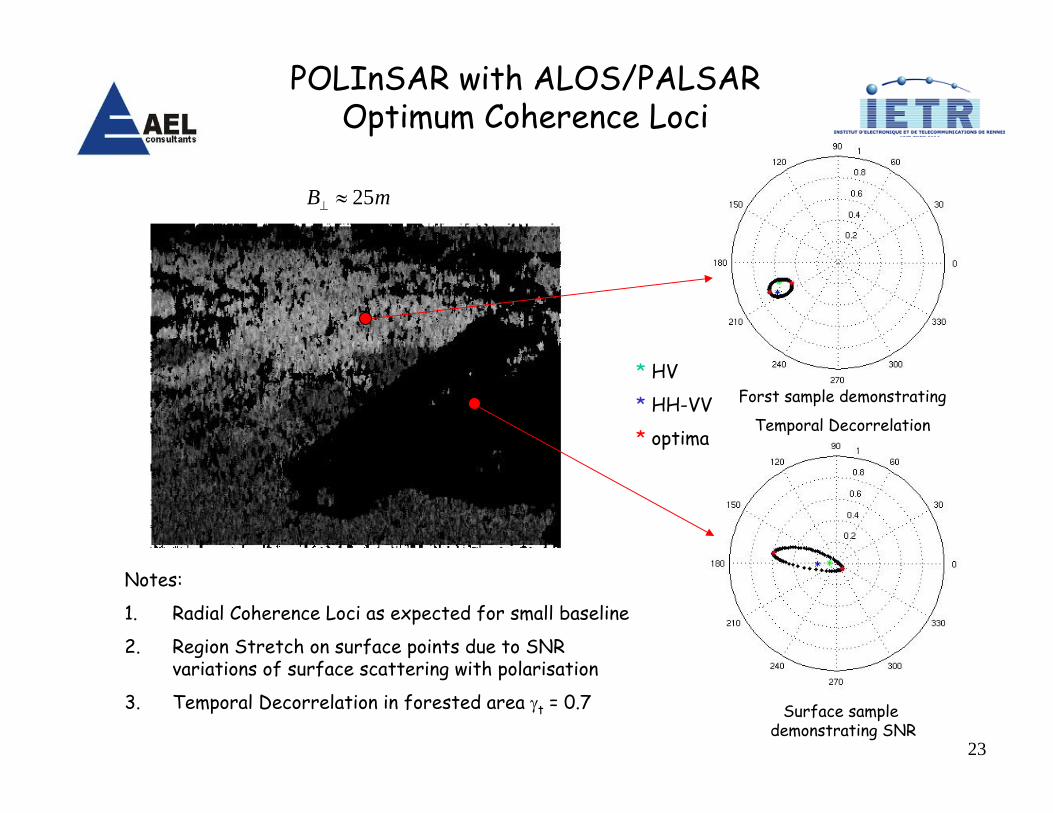
POLInSAR with ALOS/PALSAROptimum Coherence Loci
* HV
* HH-VV
* optima
Surface sample demonstrating SNR
Forst sample demonstrating
Temporal Decorrelation
B⊥ ≈ 25m
Notes:
1. Radial Coherence Loci as expected for small baseline
2. Region Stretch on surface points due to SNR variations of surface scattering with polarisation
3. Temporal Decorrelation in forested area γt = 0.7
24
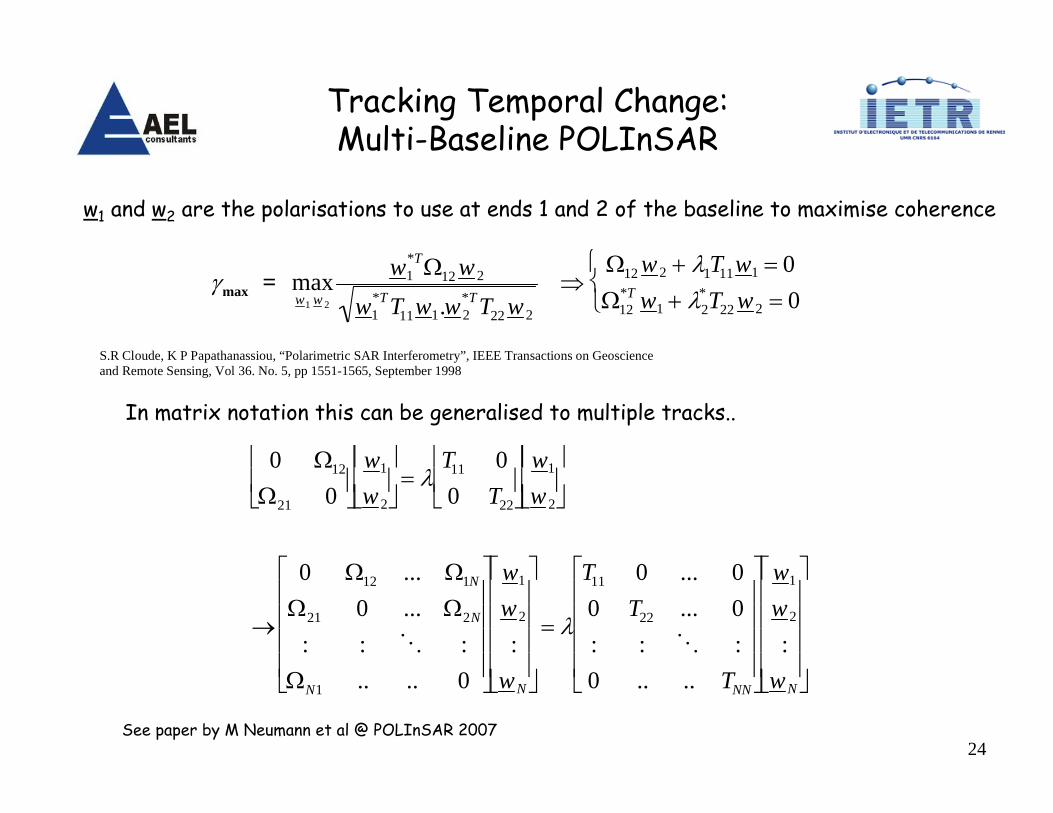
Tracking Temporal Change:Multi-Baseline POLInSAR
γmax = maxw1 w 2
w1*TΩ12 w 2
w1*TT11w1.w 2
*TT22 w 2
⇒Ω12 w 2 + λ1T11w1 = 0Ω12
*T w1 + λ2*T22 w 2 = 0
⎧ ⎨ ⎩
0 Ω12
Ω21 0⎡
⎣ ⎢
⎤
⎦ ⎥
w1
w2
⎡
⎣ ⎢
⎤
⎦ ⎥ = λ
T11 00 T22
⎡
⎣ ⎢
⎤
⎦ ⎥
w1
w2
⎡
⎣ ⎢
⎤
⎦ ⎥
→
0 Ω12 ... Ω1N
Ω21 0 ... Ω2N
: : O :ΩN1 .. .. 0
⎡
⎣
⎢ ⎢ ⎢ ⎢
⎤
⎦
⎥ ⎥ ⎥ ⎥
w1
w2
:wN
⎡
⎣
⎢ ⎢ ⎢ ⎢
⎤
⎦
⎥ ⎥ ⎥ ⎥
= λ
T11 0 ... 00 T22 ... 0: : O :0 .. .. TNN
⎡
⎣
⎢ ⎢ ⎢ ⎢
⎤
⎦
⎥ ⎥ ⎥ ⎥
w1
w2
:wN
⎡
⎣
⎢ ⎢ ⎢ ⎢
⎤
⎦
⎥ ⎥ ⎥ ⎥
w1 and w2 are the polarisations to use at ends 1 and 2 of the baseline to maximise coherence
In matrix notation this can be generalised to multiple tracks..
S.R Cloude, K P Papathanassiou, “Polarimetric SAR Interferometry”, IEEE Transactions on Geoscienceand Remote Sensing, Vol 36. No. 5, pp 1551-1565, September 1998
See paper by M Neumann et al @ POLInSAR 2007
25
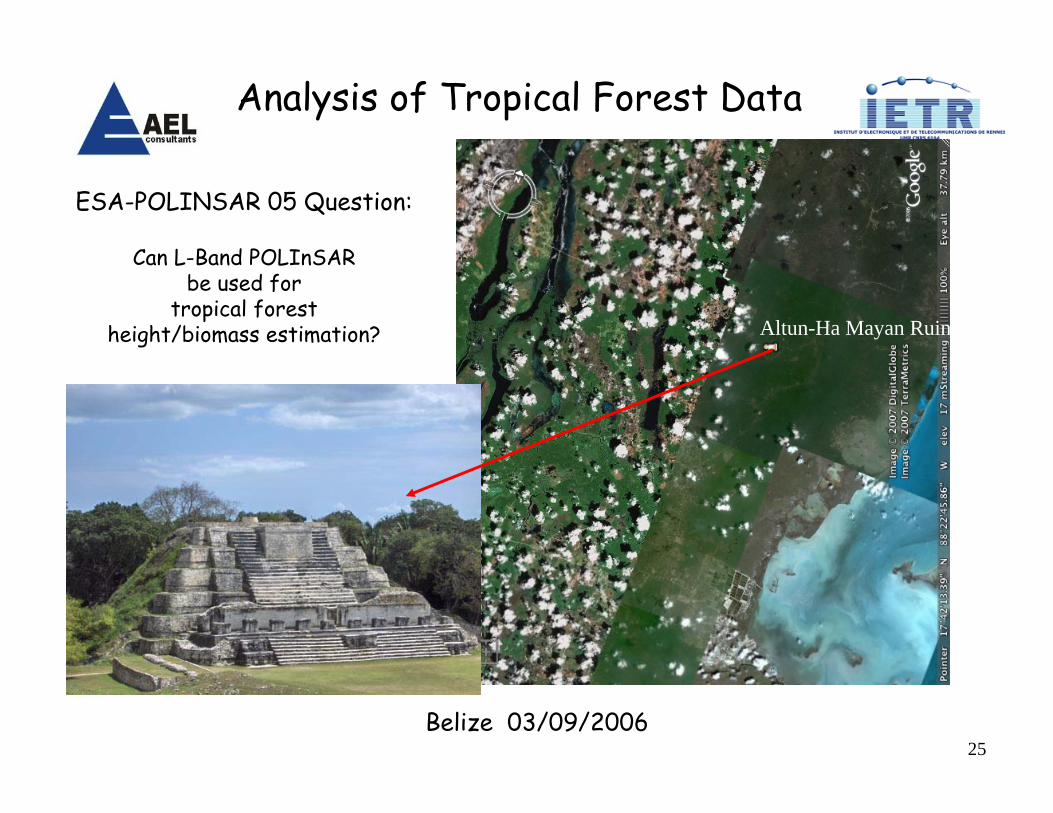
Altun-Ha Mayan Ruins
ESA-POLINSAR 05 Question:
Can L-Band POLInSAR be used for
tropical forest height/biomass estimation?
Belize 03/09/2006
Analysis of Tropical Forest Data
26
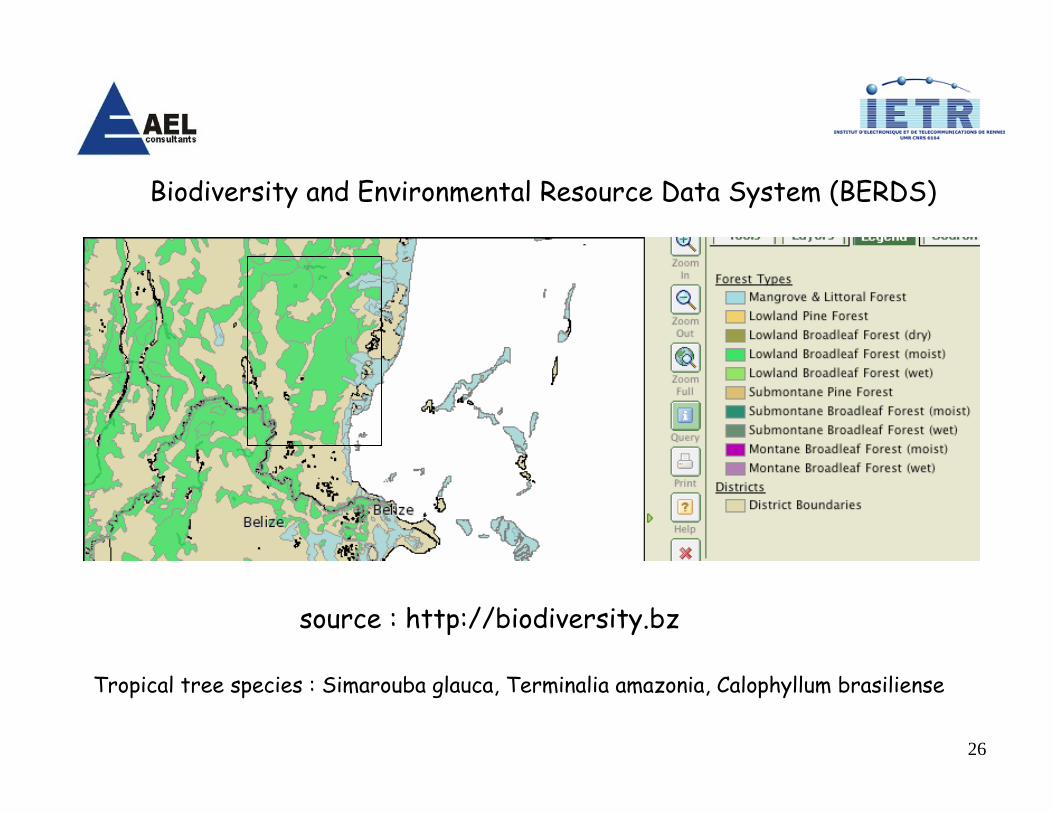
source : http://biodiversity.bz
Biodiversity and Environmental Resource Data System (BERDS)
Tropical tree species : Simarouba glauca, Terminalia amazonia, Calophyllum brasiliense
27
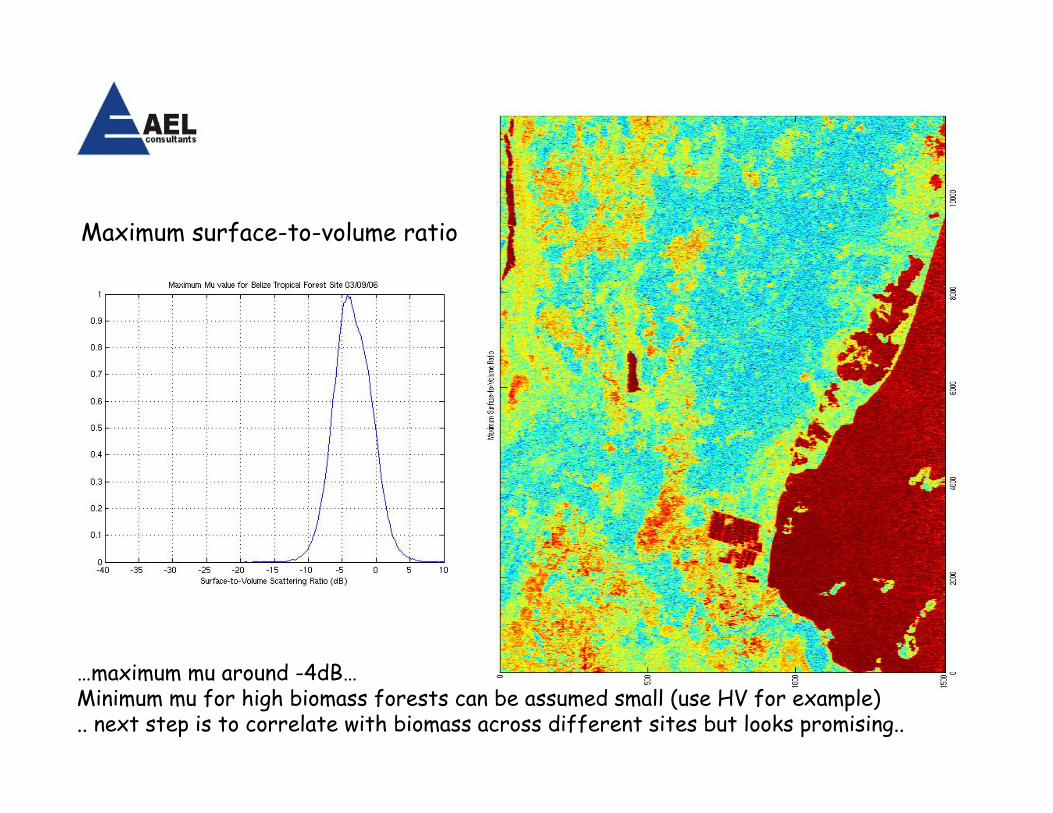
…maximum mu around -4dB…Minimum mu for high biomass forests can be assumed small (use HV for example).. next step is to correlate with biomass across different sites but looks promising..
Maximum surface-to-volume ratio
28
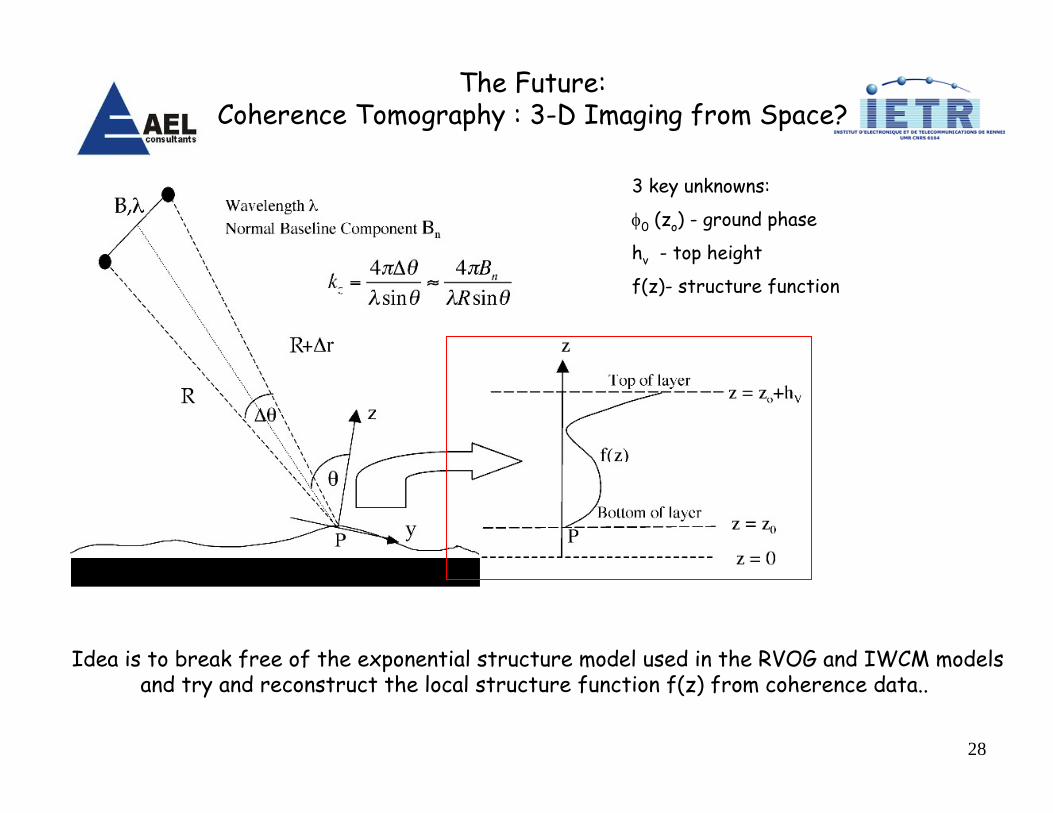
3 key unknowns:
φ0 (zo) - ground phase
hv - top height
f(z)- structure function
The Future:Coherence Tomography : 3-D Imaging from Space?
Idea is to break free of the exponential structure model used in the RVOG and IWCM modelsand try and reconstruct the local structure function f(z) from coherence data..
29
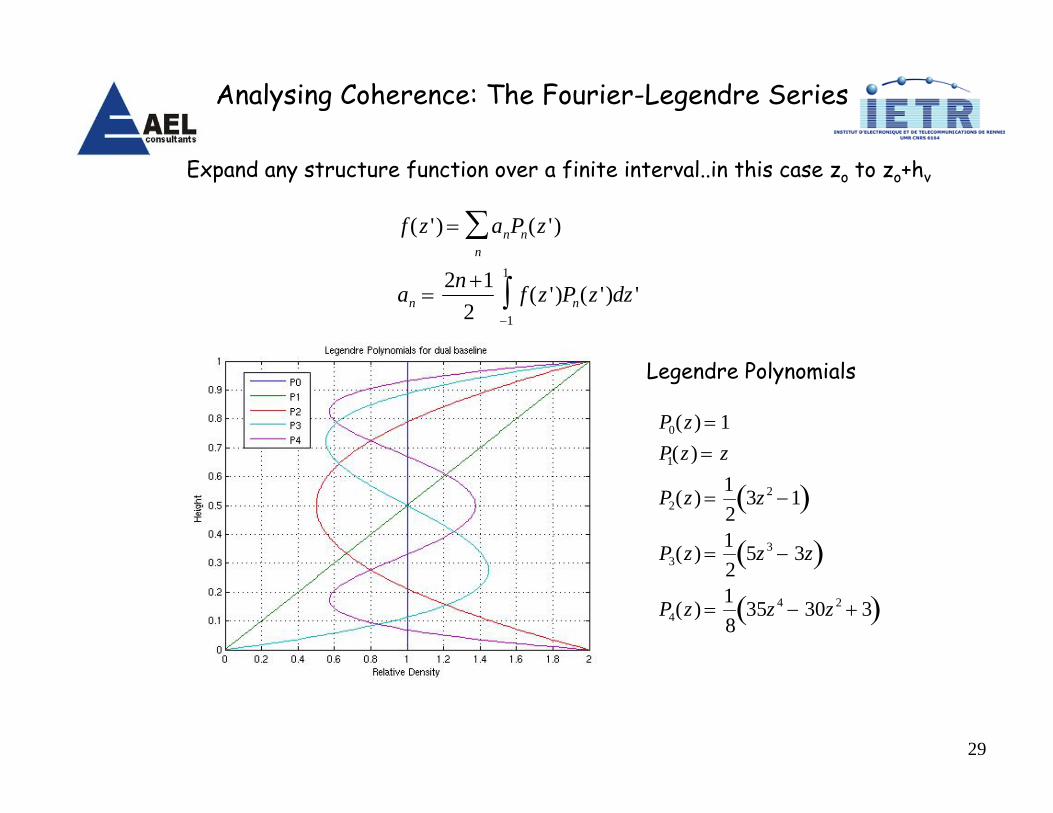
Analysing Coherence: The Fourier-Legendre Series
f (z ') = anPnn
∑ (z ')
an =2n +1
2f (z ')Pn(z ')dz '
−1
1
∫
P0(z) = 1P1(z) = z
P2(z) =12
3z 2 −1( )
P3(z) =12
5z 3 − 3z( )
P4(z) =18
35z 4 − 30z 2 + 3( )
Expand any structure function over a finite interval..in this case zo to zo+hv
Legendre Polynomials

30
Vertical Tomograms
17m Scots Pine Forest 10m Uniform Hedge
Height estimated from POLInSAR, Profiles from PCT
S.R. Cloude, D.G. Corr, M.L. Williams, “Target Detection Beneath Foliage Using Polarimetric SARInterferometry”, Waves in Random Media, volume 14, issue 2, pages S393 - S414., 2004
Simulations from 3-D SAR simulator:
31
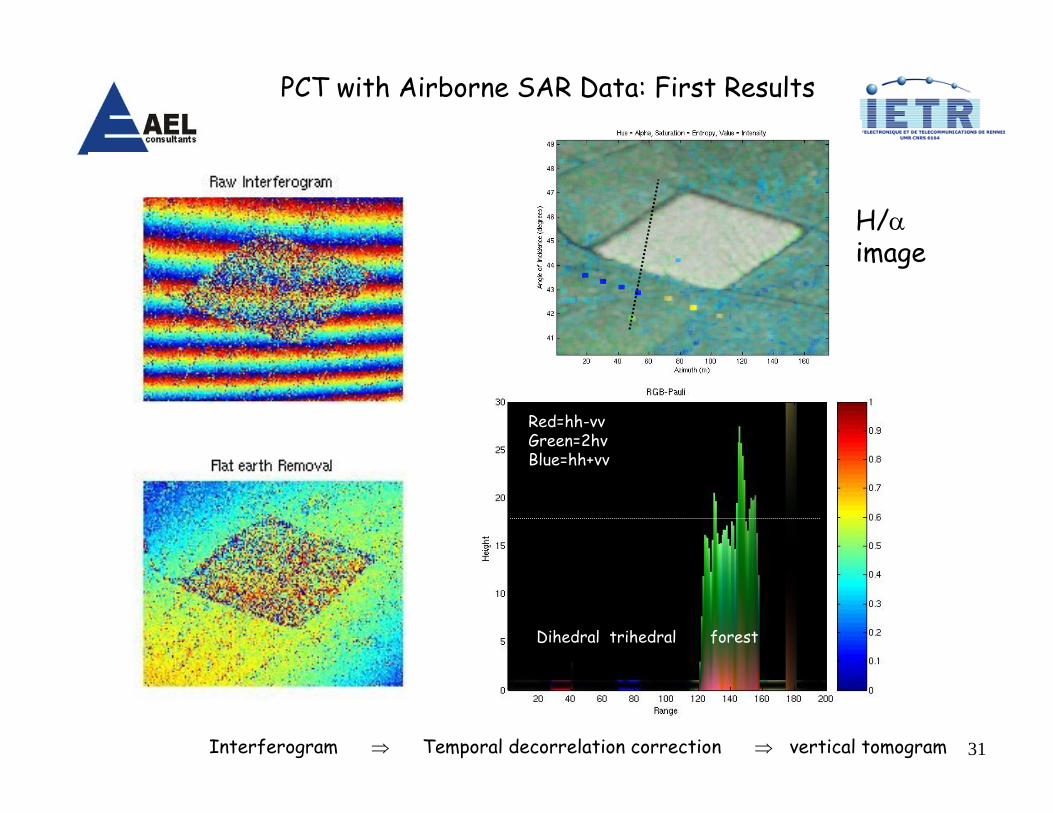
PCT with Airborne SAR Data: First Results
H/αimage
Interferogram ⇒ Temporal decorrelation correction ⇒ vertical tomogram
Red=hh-vvGreen=2hvBlue=hh+vv
Dihedral trihedral forest
32
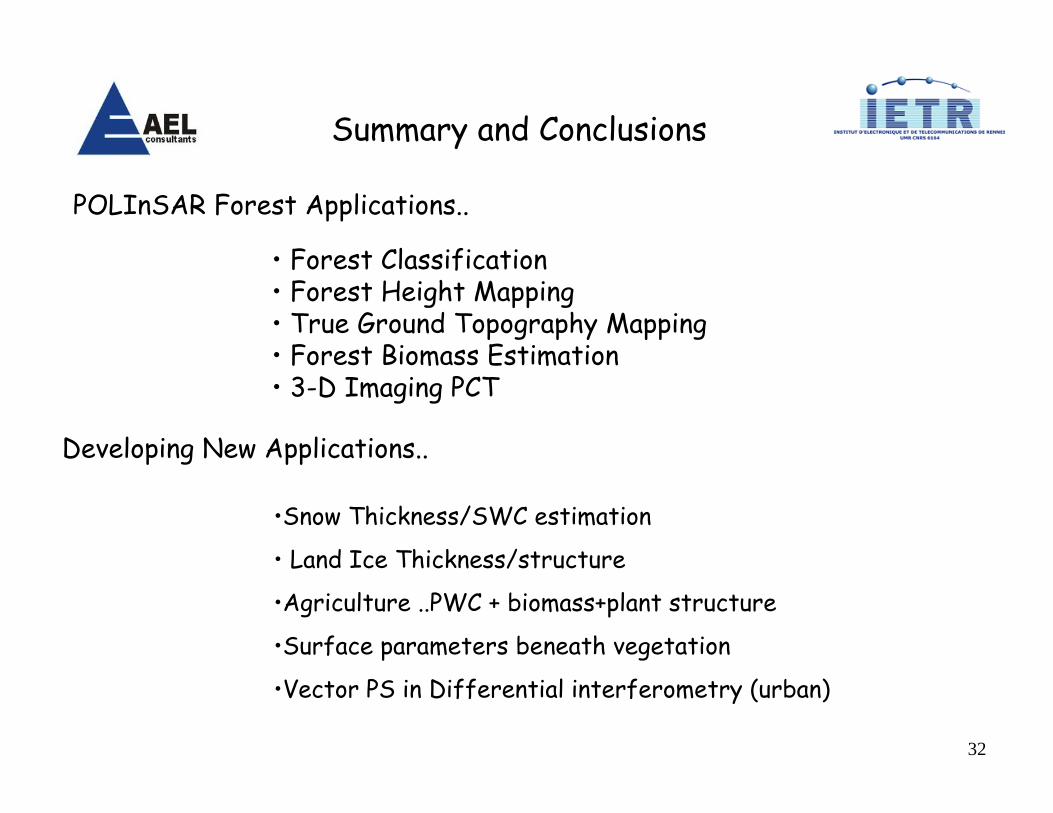
Summary and Conclusions
• Forest Classification • Forest Height Mapping• True Ground Topography Mapping• Forest Biomass Estimation• 3-D Imaging PCT
Developing New Applications..
•Snow Thickness/SWC estimation
• Land Ice Thickness/structure
•Agriculture ..PWC + biomass+plant structure
•Surface parameters beneath vegetation
•Vector PS in Differential interferometry (urban)
POLInSAR Forest Applications..
33
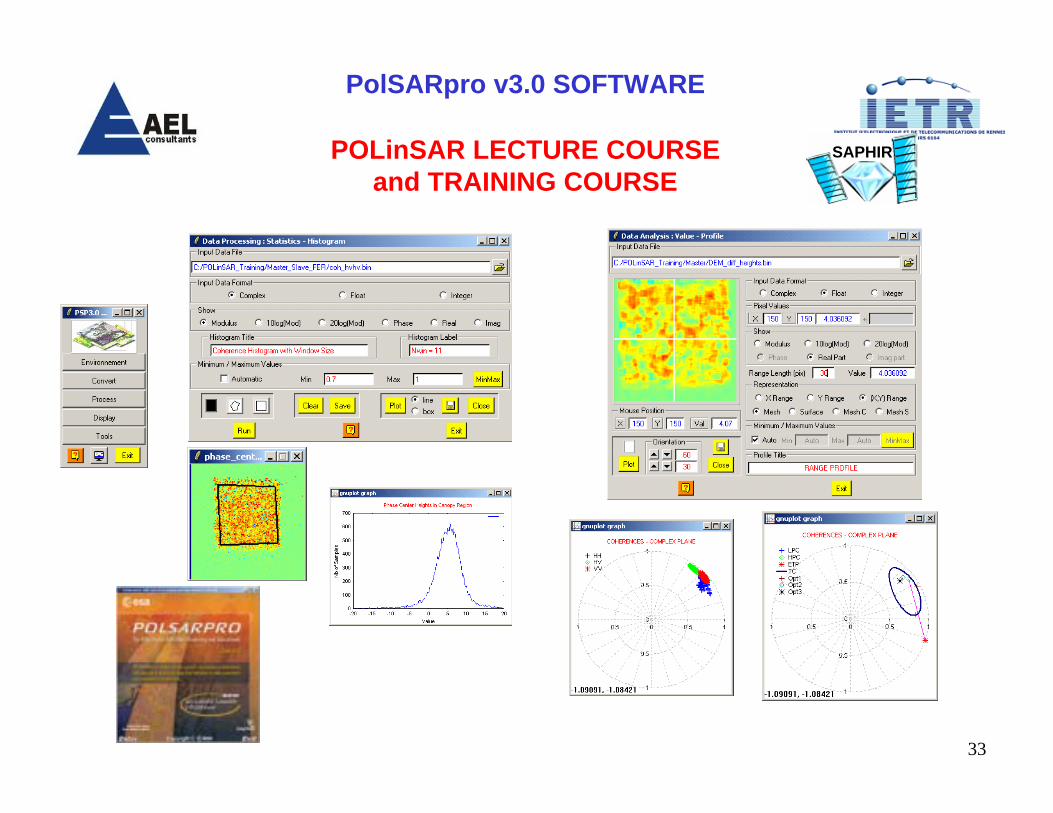
POLinSAR LECTURE COURSEand TRAINING COURSE
PolSARpro v3.0 SOFTWARE
SAPHIR