Key World Energy Trends
19
statistics 2016 Please note that this PDF is subject to specific restrictions that limit its use and distribution. The terms and conditions are available online at http://www.iea.org/t&c Key World Energy Trends Excerpt from : World energy balances
Transcript of Key World Energy Trends

st
at
is
tic
s
2016Please note that this PDF is subject to
specific restrictions that limit its use and
distribution. The terms and conditions are
available online at http://www.iea.org/t&c
Key World Energy TrendsExcerpt f rom : World energy balances

2 - EXCERPT FROM WORLD ENERGY BALANCES (2016 edition)
INTERNATIONAL ENERGY AGENCY
The following analysis is an excerpt from the publication World Energy Balances (new release, 2016 edition).
Please note that we strongly advise users to read definitions, detailed methodology and country specific notes which can be found either in our publication or online at www.iea.org/statistics/topics/energybalances/.
Please address your inquiries to [email protected].
Please note that all IEA data is subject to the following Terms and Conditions found on the IEA’s website: http://www.iea.org/t&c/termsandconditions/

EXCERPT FROM WORLD ENERGY BALANCES (2016 edition) - 3
INTERNATIONAL ENERGY AGENCY
WORLD ENERGY TRENDS: AN OVERVIEW
Global trends
In 2014, global energy demand increased but at a slow-er rate than in 2013 (1.1% compared to 2.5%) to reach 13 700 Mtoe. In non-OECD countries, energy demand rose by 2.3%, whereas in OECD countries it decreased by 0.7% and remained approximately stable in 2015, as discussed in more detail in the OECD section.
Production
World energy production was 13 800 Mtoe in 2014 – 1.1% more than in 2013. Fossil fuels accounted for 81.2% of it- a 0.4% decrease compared to 81.6% in 2013. Oil production increased the most (+2.1%), followed by coal and natural gas (+0.8% and 0.6% respectively). Together the production of these three fossil fuels increased by +1.3% in 2014 (Figure 1).
Figure 1. Global annual change in energy production by fuel
* In this graph peat and oil shale are aggregated with coal. ** Includes geothermal, solar thermal, solar photovoltaic and wind.
Among non-fossil sources, biofuels and waste main-tained their share of the world energy production in 2014 (10.2%), though their development has slowed down (+1.7% compared to +2.8% in 2013). Hydro increased by 2.5% in 2014, and provided 2.4% of global production, just as in 2013. Other renewable sources such as wind, solar thermal, solar PV, geo-thermal, kept on expanding at a fast pace (+11.1%, +7.7%, +35.1%, +8.3% respectively) but still ac-counted for little more than 1% of global energy pro-duction. Finally, nuclear slightly increased its share of energy production (4.7%), producing 2.3% more en-ergy in 2014 than in 2013.
For 2015, global country level production data is prelim-inary and restricted to fossil fuels. Based on these data, production growth of fossil fuels slowed down (+0.5% higher than in 2014). Lower growth was mainly caused by a fall in coal production in 2015 (-3.1%), whilst crude oil and natural gas increased at a higher rate in 2015 (+3.0% and +1.6% respectively). The decrease in coal production was equally shared between OECD countries and China (-125 Mtoe in total, of which -64 Mtoe and -57 Mtoe respectively). Around 40% of the growth in crude oil and 60% for gas in 2015 occurred in OECD countries and is largely due to “unconventional” produc-tion. The remainder of the article looks at the detail of 2014 world production and use, and 2015 OECD supply.
At a regional level, the OECD regained its place of largest energy producing area, just ahead of Asia1 in 2014: it produced 30.0% of global energy, whereas
1. In this chapter, Asia includes China region unless otherwise speci-fied and excludes Asian countries of the OECD.
0%
2%
4%
6%
8%
10%
12%
14%
1971 - 2014 2013 - 2014

4 - EXCERPT FROM WORLD ENERGY BALANCES (2016 edition)
INTERNATIONAL ENERGY AGENCY
Asia accounted for 29.6% of it. Indeed in 2014 the OECD increased its production by almost 4% (Figure 2), thanks to the boom of production in the United States of America (+7.1%) and Canada (+5.2%). On the contrary production growth in Asia slowed down to only 1.3%.
Figure 2. Annual change in energy production by region
The United States and Canada accounted for almost 2 500 of the 4 100 Mtoe of energy produced by the OECD, so almost 60%. Australia, OECD’s third big-gest producer, also greatly increased its production (+6.1%). Energy production grew in 15 of the 34 member countries of the OECD, but fell in 19 member countries, the most significant in volumes being the Netherlands (- 10.7 Mtoe) and Mexico (- 8.3 Mtoe).
In Asia, energy production increased by 1.3% in 2014, mainly in the line with a slowdown in China (+1.2%). Indeed, after a 7.9% growth in 2013, coal production in China stalled in 2014 whilst natural gas, solar and wind productions also increased at a slower pace. They were not balanced by the increasing production in nuclear and hydro (+18.7% and +15.6% respective-ly). The growth of energy production in India (+3.4%), the second biggest producer in Asia, hardly compensated the slowdown in China.
With 1 820 Mtoe, non-OECD Europe and Eurasia produced around the same amount of energy than Middle East in 2014 (1 810 Mtoe). But energy pro-duction decreased in the former (-2.3%) and increased in the latter (+1.0%). Africa produced 1 100 Mtoe in 2014, a level higher than non-OECD America (820 Mtoe) where energy production nevertheless increased the most after OECD (+2.6%).
Figure 3. Largest producers by fuel in 2014
* In this graph peat and oil shale are aggregated with coal.
Energy production is not evenly distributed across countries: for each fuel, less than four countries gen-erally account for more than half of global production (Figure 3). China was not far from producing half of the world coal in 2014, and 27% of hydro. The United States and France combined produced 50% of all nuclear. Saudi Arabia, The Russian Federation and the United States contributed slightly less than 40% of the world crude oil – these last two also accounting for 40% of the world natural gas.
Total Primary Energy Supply (TPES)
Between 1971 and 2014, world total primary energy supply (TPES) was multiplied by almost 2.5 times and changed structure somewhat (Figure 4). Oil remained the dominant fuel in 2014, nonetheless fell from 44% to 31% of TPES. The share of coal has increased con-stantly in recent years, influenced primarily by in-creased consumption in China, reaching its highest level since 1971, 29% in 2014 and 2013. Meanwhile natural gas increased from 16% to 21% and nuclear from 1% to 5%.
Figure 4. Total primary energy supply by fuel 1971 2014
5 523 Mtoe 13 700 Mtoe
* In this graph peat and oil shale are aggregated with coal.
-4%
-2%
0%
2%
4%
6%
OECD Africa Non-OECD
Americas
Non-OECDEurope
andEurasia
MiddleEast
Asia World
1971 - 2014 2013 - 2014
OthersOthers
Others
Others Others
0%
10%
20%
30%
40%
50%
60%
70%
80%
90%
100%
Coal* Oil Natural gas Nuclear Hydro
China
USA Other OPEC
USA
Russian Fed.
Saudi Arabia
Qatar
USA
Russian Fed.
Rus. Fed.
France
USA
USA
Canada
China
Brazil
Coal*
29%
Oil31%
Nat. gas21%
Nuclear5%
Hydro2%
Biofuels10%
Other2%
Coal*
26%
Oil44%
Nat. gas16%
Nuclear1%
Hydro2%
Biofuels11%

EXCERPT FROM WORLD ENERGY BALANCES (2016 edition) - 5
INTERNATIONAL ENERGY AGENCY
Energy demand increased at very different rates in the regions between 1971 and 2014. The OECD’s share of global TPES fell from 61% in 1971 to 38% in 2014 (Figure 5). It is now almost on par with Asia, where energy demand was multiplied by seven times, and whose share of TPES almost tripled over the period. Though its energy demand only increased by less than a third between 1971 and 2014, non-OECD Europe and Eurasia was still the third biggest energy consum-ing region, with more than 1 100 Mtoe TPES. It was followed by Africa, where energy demand over the period has multiplied by four.
Figure 5. Total primary energy supply by region 1971 2014
5 523 Mtoe 13 700 Mtoe
* Including international marine and aviation bunkers.
During 2014 the higher increase in TPES were in the Middle East, Non-OECD Americas and Africa (+5.9%, +3.2% and +3.1% respectively). It de-creased in OECD by 0.7%, and by 2.6% in non OECD Europe and Eurasia (Figure 6). In Asia, TPES in-creased by 2.7% in 2014 – half the rate seen in 2013.
Figure 6. Annual change in TPES by region
* World also includes international marine and aviation bunkers.
Non-OECD countries account for a continuously growing share of the world energy consumption. In 2014, China accounted for 22% of global TPES while the United States accounted for 16% (Table 1). India and the Russian Federation ranked third and fourth, respectively. Japan, the second largest OECD con-suming country, was in fifth position.
Table 1. TPES - top-ten countries in 2014 and 1971
Country TPES (Mtoe)
Share in world TPES
2014 1971
People’s Rep. of China 3 052 22% 7% United States 2 216 16% 29% India 825 6% 3% Russian Federation 711 5% N/A Japan 442 3% 5% Germany 306 2% 6% Brazil 303 2% 1% Canada 280 2% 0.3% Korea 268 2% 3% France 243 2% 3% Rest of the world 5 054 37% 44%
World 13 700 100% 100%
Global energy demand was even more concentrated in 2014 compared to 1971, as the top 10 countries repre-sented 63% of global energy demand, as opposed to 56% in 1971.
In 2014, the top-five countries in terms of TPES ac-counted for less than half of the world GDP2, and world population (47% and 46% respectively) but consumed 53% of total world energy. However, the relative shares of GDP, population and TPES of these five countries significantly varied from one to another (Figure 7).
Figure 7. Top-five energy consumers: 2014 relative shares*
* Relative shares within the top-five, which differ from shares in the world total.
2. In this chapter, GDP refers to GDP using purchasing power parities.
-4%
-3%
-2%
-1%
0%
1%
2%
3%
4%
5%
6%
7%
OECD Africa Non-OECD
Americas
Non-OECDEurope
andEurasia
MiddleEast
Asia World*
1971 - 2014 2013 - 2014
0%
20%
40%
60%
80%
100%
TPES Population GDP PPP
Japan
RussianFederation
India
United States
China
OECD61%
Africa4%
Non-OECD
Americas3%
Non-OECD Europe
and Eurasia
16%
Middle East 1%
Asia 13%
Bunkers*3%
OECD38%
Africa6%Non-
OECD Americas
5%
Non-OECD Europe
and Eurasia
9%
Middle East 5%
Asia 35%
Bunkers*3%

6 - EXCERPT FROM WORLD ENERGY BALANCES (2016 edition)
INTERNATIONAL ENERGY AGENCY
The United States consumed 16% of world energy, with 4% of the world’s population. Conversely, China and India consumed 22% and 6% of global energy respectively, but accounted for 19% and 18% of the global population. The Russian Federation and Japan also consumed significant amounts of energy in 2013. However, energy intensities differed significantly. To produce the same amount of wealth, as measured by GDP in PPP, the Russian Federation consumed 2.2 times as much energy as Japan in 2014.
Total Final Consumption (TFC)
Between 1971 and 2014, total final consumption (TFC) more than doubled (Figure 8). However, the energy use by the different economy sectors3 did not dramatically change. In 2014 industry remained the largest consuming sector, only one percentage point lower than in 1971 (37%). It was followed by the
3. In this chapter, each sector of final consumption includes its respec-tive non-energy use quantity.
transport sector (28%), which share has most increased (plus five percentage points), and residential (23%).
The following sections briefly describe OECD trends up to 2015 and 1971-2014 energy trends in six differ-ent regions of the world: OECD, Africa, Non-OECD Americas, Asia, Non-OECD Europe and Eurasia, and the Middle East.
Figure 8. Total final consumption by sector 1971 2014
4 244 Mtoe 9 426 Mtoe
Industry 37%
Transport 28%
Residential 23%
Commerce and public services
8%
Agriculture/forestry
2%
Non-specified (other)
2%
Industry 38%
Transport 23%
Residential 24%
Commerce and public services
8%
Agriculture/forestry
3%
Non-specified (other)
4%

EXCERPT FROM WORLD ENERGY BALANCES (2016 edition) - 7
INTERNATIONAL ENERGY AGENCY
OECD
Key supply trends in 2015
The overall OECD TPES remained approximately stable in 20154 (5 269 Mtoe, 0.1% less than in 2014), with regional trends opposite to those observed in the previous year.
In OECD Europe, TPES rose by 1.8%, partly explained by the fact that in 2014 energy demand was unusually low due to a warm winter. In OECD Asia-Oceania, TPES increased by slightly less than 1%. On the other hand, in OECD Americas, TPES decreased by 1.5%, led by the 1.5% reduction in the United States (Figure 9).
Figure 9. OECD total primary energy supply 2014-2015 change
The United States reduction was mainly due a de-creased use of coal (15% less than in 2014), linked to a switch in the power sector and reflecting the associ-ated change in generation efficiency, with more than 200 TWh of electricity coming from natural gas in-stead of coal, as compared to 2014. This change in the United States also drove the 6% decrease of coal de-mand of the overall OECD region (Figure 10).
Compared to 2014, the OECD increased its use of the two largest energy sources: oil (36% of TPES, +1%) and natural gas (26% of TPES, +1%). Nuclear (10% of TPES) remained stable, with Asia-Oceania increasing and Europe lowering its use, while other sources (10% of TPES) increased by 2%, mainly due to renewables, as discussed in the section on electricity generation.
4. All the energy supply data for 2015 described in this chapter are provisional.
Figure 10. OECD total primary energy supply 2014-2015 change by source
Mtoe
*Other includes hydro, geothermal, solar, wind, biofuels, waste as well as electricity and heat trade.
In 2015, the United States represented 41% of the overall OECD TPES, a weight comparable to that of the following largest nine countries when taken all together (Figure 11). Therefore, changes seen in the US, such as the switch from coal to gas in power gen-eration, are strongly reflected in OECD totals.
Figure 11. Top-ten OECD countries by TPES* in 2015
Mtoe
*Total primary energy supply
Energy production in 2015 only slightly increased (+0.5%), to reach 4 164 Mtoe, the highest level since the International Energy Agency (IEA) was founded in 1974 (Figure 12). Exports were also the highest ever recorded (1 790 Mtoe, +5.5% from 2014). As imports increased as well by 3.2%, after three consec-utive years of decline, net imports remained broadly stable in the region, compared to 2014.
-0.1%
-1.5%
0.9%
1.8%
-3%
-2%
-1%
1%
2%
3%
OECD Total OECDAmericas
OECD AsiaOceania
OECDEurope
-80
-60
-40
-20
0
20
40
Total Coal Oil Gas Nuclear Other*
0 500 1000 1500 2000 2500
Australia
Italy
United Kingdom
Mexico
France
Canada
Korea
Germany
Japan
United States

8 - EXCERPT FROM WORLD ENERGY BALANCES (2016 edition)
INTERNATIONAL ENERGY AGENCY
Figure 12. OECD energy supply 1971-2015
Mtoe
*Total primary energy supply
About half of the energy production in OECD occurs in the United States, with levels in 2015 over four times larger than those of the second regional produc-er, Canada (Figure 13).
Figure 13. Top-five OECD producing countries in 2015
Mtoe
*Other includes hydro, geothermal, solar, wind, and heat.
Energy production trends differed across OECD coun-tries. In the United States, production increased mar-ginally in 2015 (+0.5%), a lower growth compared to previous years, as a drop in coal production offset for most of the growth of oil and gas. Still, in absolute terms, the United States’ 11 Mtoe increase was second in 2015 only to that of Australia (13 Mtoe), and larger than those of Norway and the United Kingdom (around 9.5 Mtoe). On the other hand, production dropped significantly in Mexico (-12 Mtoe, a 6% decrease), mostly due to lower crude oil production. Among smaller producers, the Netherlands experi-enced a 20% decrease, as earthquakes above the Groningen field impeded production of natural gas.
With production increasing more than energy use, the level of self-sufficiency (defined as production/TPES) increased to 79% in 2015 in the OECD as a whole, which is comparable to the high levels observed around 1985, after the responses to the oil crises of the previous decade. Notably, in 2015, the OECD Ameri-cas became self-sufficient overall for the first time since the IEA was founded, with the United States reaching a level of 93%. This is in contrast with the levels observed in OECD Europe and OECD Asia Oceania, both lower than 60% (Figure 14).
Figure 14. OECD energy self-sufficiency 1971-2015
About a quarter of the OECD TPES is used for electric-ity generation, a sector in which important structural changes have been occurring. Overall, the OECD elec-tricity generation mix was still dominated by fossil fuels in 2015 (58%), one percentage-point lower than in 2014 (Figure 15). Within the fossil sources, coal went from 32% in 2014 to 30% in 2015, compensated by the increase of natural gas (from 24% to 26%) – a change driven by the fuel switch in the United States.
Figure 15. OECD electricity generation mix 2015
*Other includes geothermal, solar, wind, tide, biofuels, waste and heat.
0
1000
2000
3000
4000
5000
6000
1971 1975 1980 1985 1990 1995 2000 2005 2010 2015
TPES* Production Net imports
0 500 1000 1500 2000
United States
Canada
Australia
Norway
Mexico
Coal OilGas NuclearHydro Biofuels and WasteOther*
0%
20%
40%
60%
80%
100%
120%
1971 1975 1980 1985 1990 1995 2000 2005 2010 2015
OECD Total OECD Americas
OECD Asia Oceania OECD Europe
Coal 30%
Oil 2%
Gas 26%
Nuclear 18%
Hydro 13%
Other*11%

EXCERPT FROM WORLD ENERGY BALANCES (2016 edition) - 9
INTERNATIONAL ENERGY AGENCY
Fossil fuels use in electricity generation continued its decline in 2015 with around 105 TWh less generated (-2%). ‘Other sources’, which are non-hydro renewa-bles, biofuels and waste, compensated this decrease by generating 115 TWh more than in 2014 (11% in-crease), providing roughly 1 150 TWh overall in 2015 in OECD. In terms of relative growth, solar photovol-taics (+19%) and wind (+16%) again led the way in 2015 at the OECD level (Figure 16).
Figure 16. OECD electricity generation 2014-2015 change
*Fossil includes coal, peat, oil shale, oil and gas. **Other includes geothermal, solar, wind, biofuels, waste and heat.
Non-hydro renewable electricity generation rose very fast over the last ten years, bringing its contribution to above 11% of total generation in 2015, comparable with the 13% of conventional hydro. Across the OECD in 2015, total renewable sources (hydro and non-hydro) accounted for 2 471 TWh electricity gen-eration (23% of the total), which represents another all-time high (Figure 17).
Figure 17. OECD renewable electricity generation 1971-2015
TWh
More specifically, in OECD Europe alone, non-hydro renewable electricity generation increased in 2015 by 14% to reach 640 TWh, higher than hydro electricity generation (564 TWh) for the first time (Figure 18).
Figure 18. OECD electricity generation in 2015 shares of renewable sources, by region
*Other includes geothermal, solar thermal, tide and renewable municipal waste.
The share of renewable sources in electricity became larger than that of nuclear in 2011, with the gap con-tinuing to grow, and comparable to that of natural gas (26%); despite a significant decrease over the last ten years, coal was still the largest electricity source, ac-counting for 30% of total generation in 2015 (Figure 19).
Figure 19. OECD electricity generation mix 1971-2015
Key demand trends in 2014
In 2014, total final consumption in the OECD fell by almost 1%, representing a trend change compared to the 2% increase observed in 2013, although there were differences across the three OECD regions (Figure 20).
-3%
0%
3%
6%
9%
12%
Total Fossil* Nuclear Hydro Otherrenewables
andwaste**
0
500
1000
1500
2000
2500
3000
1971 1975 1980 1985 1990 1995 2000 2005 2010 2015
Total Hydro Other non-hydro renewables
0%
5%
10%
15%
20%
25%
30%
35%
OECD Total Americas Asia Oceania Europe
Hydro Wind Solar PV Biofuels Other*
0%
5%
10%
15%
20%
25%
30%
35%
40%
45%
1971 1975 1980 1985 1990 1995 2000 2005 2010 2015
Nuclear Coal Oil Gas Total Renewables

10 - EXCERPT FROM WORLD ENERGY BALANCES (2016 edition)
INTERNATIONAL ENERGY AGENCY
Figure 20. OECD Total final consumption 2013-2014 change by region
A warmer winter in Europe was the main cause for the 4% decrease, with significant reductions reported for the Netherlands (-7%), France (-6%), Switzerland (-8%) and the United Kingdom (-6%). On the other hand, final consumption in OECD Americas rose by 1.4% in 2014, led by a 2% increase observed in the United States.
Figure 21. OECD Total final consumption by region, 1971-2014
Mtoe
Final energy consumption continued to fall in Europe (Figure 21) and the general decoupling of economic growth from energy consumption observed over the years continued across the OECD (Figure 22).
Changes in final energy intensities are very different across countries, depending on changes in economic structures and on efficiency improvements. Sectoral energy intensities (defined based on the national GDP) also show decreasing trends and levels. The downward trend continued in 2014 for all sectors (Figure 23).
The structure of the OECD TFC shows that transport was again the largest energy consuming sector in 2014, accounting for roughly a third of final energy
-0.6%
1.4%
-0.6%
-3.9%-5%
-4%
-3%
-2%
-1%
0%
1%
2%
OECD Total OECDAmericas
OECD AsiaOceania
OECDEurope
0
500
1000
1500
2000
1971 1975 1980 1985 1990 1995 2000 2005 2010 2014
OECD Americas Asia Oceania OECD Europe
Figure 22. Final energy intensity in OECD1971-2014
1971=100
*GDP based on 2010 USD PPP.
Figure 23. Sectoral energy intensities* in OECD 1971-2014
toe/million USD PPP
*Defined as sectoral final consumption/GDP PPP.
Figure 24. OECD Total final consumption by sector, 2014
*Other includes agriculture, forestry, fishing and non-specified.
0
50
100
150
200
250
300
1971 1975 1980 1985 1990 1995 2000 2005 2010 2014
GDP* Total Final Consumption (TFC) TFC/GDP*
0
10
20
30
40
50
60
70
1971 1975 1980 1985 1990 1995 2000 2005 2010 2014
Industry Transport Residential Services
Industry31%
Transport34%Residential
19%
Services13%
Other*3%

EXCERPT FROM WORLD ENERGY BALANCES (2016 edition) - 11
INTERNATIONAL ENERGY AGENCY
consumption, followed by industry with 31% (Figure 24). Such shares have reversed since 1971, when industry accounted for 41% of TFC and transport for 24%.
Differences in economic structure affect the energy mix at national level, as different sectors tend to use fuels differently. In particular, transport almost com-pletely relies on oil, while residential and services in the OECD make large use of electricity and gas. Coal, heavily used for electricity generation, is used very little by final consumers (Figure 25).
Figure 25. Total final consumption by sector: shares by energy source, 2014
*Other includes biofuels and waste, direct use of geothermal/solar thermal and heat.
The OECD in the world
In 2014, the OECD accounted for 17% of global pop-ulation, 46% of GDP, 40% of TPES and 30% of ener-gy production (Figure 26). For population and GDP, these numbers represent a one percentage-point de-cline compared to 2013 levels. These shares have significantly changed since 1971, when the region accounted for 61% of the global energy supply.
Figure 26. OECD in the world, 2014
*GDP based on 2010 USD PPP.
However, with 4.2 toe per capita (compared to a world average of 1.8 toe per capita), the OECD is the most energy-intensive region, in terms of TPES/population. Several factors explain these high levels: an electrification rate of almost 100%, a high rate of cars per household, large industry and service sectors, high heating degree-days and a high GDP per capita.
While OECD levels of energy per capita are generally larger than the world average by a factor of two, with some regional variations, OECD levels of energy intensity of the economy (TPES/GDP, based on PPP) tend to be slightly lower than the world average, possibly reflecting a less energy-intensive economic structure and a generally more advanced development in efficient use of energy, with high efficiency in transformation and some final consumption sectors (Figure 27).
Figure 27. OECD energy indicators by region, 2014
World average=1
*GDP based on 2010 USD PPP.
While energy intensity is on a declining trend across the whole OECD (22% lower in 2015 compared to 2000), levels have been historically lower in OECD Europe than in OECD Americas, with OECD average reflecting the levels of Asia Oceania since around the year 2000 (Figure 28).
Figure 28. TPES per GDP of OECD by region 1971-2015
0%
20%
40%
60%
80%
100%
Industry Transport Residential Services
Coal Oil Gas Electricity Other*
0%
20%
40%
60%
80%
100%
Population GDP* TPES Production
OECD Non-OECD
0
1
2
3
OECD Total OECDAmericas
OECD AsiaOceania
OECD Europe
TPES/capita TPES/GDP*
0
0.05
0.1
0.15
0.2
0.25
0.3
0.35
1971 1975 1980 1985 1990 1995 2000 2005 2010 2015
OECD Total OECD AmericasOECD Asia Oceania OECD Europe

12 - EXCERPT FROM WORLD ENERGY BALANCES (2016 edition)
INTERNATIONAL ENERGY AGENCY
Africa
In 2014, Africa produced 8.2% of the world’s energy, a share similar than in 1971 (7.8%). African produc-tion is dominated by oil (36%), followed by tradition-al biomass (33%), natural gas (16%) and coal (14%).
Fossil fuels reserves are unevenly distributed across Africa (Figure 29). West Africa was the main producer of crude oil in 2014, due to Nigeria (almost 29% of the African crude oil). North Africa produces mainly crude oil and natural gas: in 2014 Algeria accounted for al-most 40% of the natural gas and 18% of the crude oil in Africa, and Egypt for 8% of crude oil and 26% of natu-ral gas. Southern Africa is characterized by the high share of coal and of crude oil; South Africa, the sixth largest coal exporter in the world, produced 94% of African coal in 2014 whereas Angola is the second biggest producer of crude oil in Africa, with 21% of the region production.
Figure 29. Energy production by sub-region in 2014, Africa
* In this graph peat and oil shale are aggregated with coal.
North Africa includes Algeria, Egypt, Libya, Morocco and Tunisia; East Africa includes Eritrea, Ethiopia, Kenya, Mauritius, Mozambique, South Sudan, Sudan and United Republic of Tanzania; Southern Africa includes Angola, Botswana, Namibia, South Africa, Zambia and Zimbabwe; Central Africa includes Cameroon, Congo and Democratic Republic of Congo; West Africa includes Benin, Côte d'Ivoire, Gabon, Ghana, Niger, Nigeria, Senegal and Togo.
In 2014, Africa’s crude oil production decreased com-pared to 2013 (-5.1%), as it plummeted in Libya (-51%), and decreased in Angola and Egypt (-2.7%, -3.0% respectively). Africa represented 9% of world crude oil output and it exported 79% of this production in 2014.
The production and consumption of biofuels (mainly fuelwood) is significantly higher across Africa (48% of total TPES) than the world average (10% of total
TPES). The presence of large forests, agro-industry, agriculture, a large rural population, and a low GDP per capita have resulted in a large use of solid biofuels for cooking. Because of the extensive use of wood and charcoal, energy intensity5 is higher than the world average.
Figure 30: Total primary energy supply* by fuel, Africa
1971 2014
192 Mtoe 772 Mtoe
* Excluding electricity trade. ** In this graph peat and oil shale are aggregated with coal.
However, the share of traditional biomass in TPES has decreased significantly between 1971 and 2014 (Figure 30), due to increased electrification, and par-ticularly the recent development of power generation from natural gas. Natural gas share in TPES steeply increased from 1% in 1971 to 14% in 2014. Coal continued to represent an important share of African TPES (15% in 2014) even if it has declined since 1971. Its share is largely due to South Africa, where coal represented in 2014 88% of primary production, 69% of TPES, 94% of electricity generation and 26% of total final consumption.
Figure 31. Electricity generation by fuel, Africa
* In this graph peat and oil shale are aggregated with coal.
5. Measured by the ratio TPES/GDP.
0
50
100
150
200
250
300
350
400
NorthAfrica
EastAfrica
SouthernAfrica
CentralAfrica
WestAfrica
OtherAfrica
Mtoe
Other
Biofuels
Nat. gas
Oil
Coal
0
100
200
300
400
500
600
700
800
1971 2014
Other
Nuclear
Hydro
Gas
Oil
Coal
TWh
Coal** 15%
Oil 21%
Nat. gas 14%Hydro
1%
Biofuels48%
Other1%Coal**
19%
Oil 18%
Nat. gas 1%
Hydro 1%
Biofuels61%
EXCERPT FROM WORLD ENERGY BALANCES (2016 edition) - 13
INTERNATIONAL ENERGY AGENCY
Between 1971 and 2014, power generation in Africa has multiplied by more than seven times (Figure 31). In the meantime it has shifted: in 1971, coal account-ed for 61.5% of power generation, hydro for 25.6%. During the period, the share of natural gas has soared from 1.1% to 37.0%. In 2014, natural gas provided 98% of the electricity in Algeria, 94% in Tunisia and 79% in Egypt. On a regional level, the share was 37%, larger than in the OECD (24%), and only behind Non-OECD Europe and Eurasia (41%) and Middle East (62%). The large share of coal in electricity production is due
to South Africa, which derived 93% of its electricity from coal in 2014.
Electricity production reflects the disparity in fossil fuel resources between sub-regions of Africa. In 2014, North African countries plus South Africa, represent-ed only 18% of the population but generated 75% of the electricity in Africa. Electricity remains a grave scarcity for most Sub-Saharan African countries, with electrification rates averaging 32%, compared to 43% for the whole continent, in 2013, but only 17% in rural Sub-Saharan areas6.
6. Electrification rate extracted from WEO electricity database, 2015 http://www.worldenergyoutlook.org/resources/

14 - EXCERPT FROM WORLD ENERGY BALANCES (2016 edition)
INTERNATIONAL ENERGY AGENCY
Non-OECD Americas
In 2014, energy production in Non-OECD Americas was 2.6% higher than in 2013, driven similar growth rates - oil +3.1%, coal +3.3%, natural gas +2.5%, biofuels (+3.1%). The fall in oil production in the region main producer, Venezuela, (-4.0%) was more than compensated by a surge of production in second producer Brazil (+11.5%), Argentina (+4.9%) and Ecuador (+5.0%). In Colombia, which accounts for more than 93% of the region’s coal, coal production increased by 3.6%. As for natural gas, production has increased mainly in Brazil (+7.4%), Peru (+5.9%) and Bolivia (+5.6%).
As a result of similar growth rates the energy mix in non OECD Americas in 2014 was similar to 2013: oil still provided the biggest share of TPES in the region (44% - Figure 32), followed by natural gas (22%) and biofuels (19%).
Figure 32. Total primary energy supply* by fuel
1971 2014
190 Mtoe 639 Mtoe
* Excluding electricity trade. ** In this graph peat and oil shale are aggregated with coal.
In 2014, other renewables (solar thermal, solar photo-voltaic, wind, geothermal) which were non-existent in 1971, increased their energy supply by 17% compared to 2013 (Figure 33) whilst a severe lack of rainfall in Brazil and Paraguay, provoking the worst drought in almost a century, explains the drop of hydro genera-tion and TPES in 2014. Though slightly declining due to climate conditions, hydro still accounted for 56% of total Non OECD Americas power generation, a much higher share than in the world (16%). Biofuels kept increasing, at a higher rate (3% in 2014 compared to 2% since 1971): liquid biofuels (and in particular
transport biofuels in Brazil) in addition to traditional solid biofuels, are important in Non-OECD Americas (19% of TPES, compared to 10% globally).
Figure 33. Annual change in TPES by fuel
* In this graph peat and oil shale are aggregated with coal. ** Includes geothermal, solar thermal, solar photovoltaic and wind.
In 2014, industry was by far the biggest energy consum-ing sector (39%) followed by transport (35%) and resi-dential (16%). Although in Brazil transport is the largest consuming sector, with 37% (and a share of 18% biofu-els in transport final consumption). Transport energy final consumption has increased the most, a four-fold increase since 1971 (Figure 34). In 2014, as in 1971, oil accounted for almost half of total final consumption, driven by road transport; the share of electricity has tripled, that of natural gas been multiplied by four, dur-ing that period. In 2014 electricity accounted for more than a third of residential final consumption on non OECD Americas, six times more than in 1971.
Figure 34. Total final consumption by sector and fuel
* In this graph peat and oil shale are aggregated with coal.
-6%
-2%
2%
6%
10%
1971-2014 2013-2014
0
20
40
60
80
100
120
140
160
180
200
1971 2014 1971 2014 1971 2014 1971 2014
Mtoe
Other
Electricity
Nat. gas
Oil
Coal*
Industry Transport Residential Other
Coal** 3%
Oil 53%
Nat. gas 8%
Hydro 3%
Biofuels32%
Coal** 4%
Oil 44%
Nat. gas 22%
Nuclear 1%
Hydro 9%
Biofuels19%
Other 1%

EXCERPT FROM WORLD ENERGY BALANCES (2016 edition) - 15
INTERNATIONAL ENERGY AGENCY
Asia
Asia had been the largest energy producing region in the world since 2011 but ranked second in 2014 behind OECD. It accounted for almost 30% of global production in 2014 – a share similar to that of 2013. China alone provided 63% of energy production in 2014 (Figure 35). India and Indo-nesia together accounted for a quarter of the continent pro-duction (13.2% and 11.2% respectively), with increasing coal, nuclear and crude oil productions in India.
Figure 35. Energy production by country, Asia
In 2014, Asia’s total primary energy supply kept on increas-ing, but at a much slower rate than in 2013 (+2.7% com-pared to 5.9% a year before). It thus seemed decoupled from the still strong economic growth, GDP increasing by 6.5% in Asia. This is particularly true in China, where GDP increased by 7.3% in 2014, while TPES only increased by 1.6%. In India, on the other hand, GDP and energy demand increased at a quite similar pace (+7.3% and +6.3% respec-tively). TPES in India has been growing at a rate of 5.2% per annum since 2003, compared to 3.3% between 1992 and 2003.
In 2014, Asia accounted for 35.1% of global TPES. However with its production not covering its needs Asia is a net importer. China and India’s self-sufficiency kept on declining (85% and 66% respectively); Indonesia covered more than 200% of its energy needs in 2014, but due to increasing demand for oil its self-sufficiency is declining too.
In 2014, the share of biofuels in TPES is a third of its level in 1971, whereas natural gas has reached 8% of TPES, from negligible in 1971. Coal remains by far the main energy source in Asia, supplying more than half of its energy demand (Figure 36), compared to 29% globally. This is also the case in the main energy consuming countries (Figure 37).
Figure 36. Total primary energy supply* by fuel, Asia
1971 2014
705 Mtoe 4,805 Mtoe
* Excluding electricity trade. ** In this graph peat and oil shale are aggregated with coal.
Figure 37. TPES by country in 2014, Asia
* In this graph peat and oil shale are aggregated with coal.
Coal’s significance is partly explained by the use of coal in power generation: in 2014, coal represented 67% of the electricity mix, versus 41% globally (Figure 38). Coal still provided 73% of electricity in China, 75% in India, 53% in Indonesia. In China, the power mix is gradually shifting to less coal and more other sources of energy (natural gas, hydro, other renewables).
Figure 38. Share of coal in electricity generation in 2014, Asia
0
500
1000
1500
2000
2500
3000
3500
4000
4500
1971 1975 1980 1985 1990 1995 2000 2005 2014
China India Indonesia Malaysia Viet Nam Other
Mtoe
0
1000
2000
3000
4000
5000
6000
Asia ChinaIndia Indonesia Thailand
Mtoe
Other
Nuclear
Hydro
Natural gas
Oil
Coal
0% 20% 40% 60% 80%
Non-OECD Americas
Middle East
OECD
Africa
Non-OECD Europeand Eurasia
Asia
World
Coal**35%
Oil 16%
Natural gas1%
Hydro 1%
Biofuels 47%
Coal** 54%
Oil 21%
Natural gas8%
Nuclear 1%
Hydro 2%
Biofuels13%
Other 2%

16 - EXCERPT FROM WORLD ENERGY BALANCES (2016 edition)
INTERNATIONAL ENERGY AGENCY
In 2014, total electricity generation in Asia increased by 6.3%, mainly driven by India (+7.9%). Electricity production grew in the region at an average annual rate of 8.2% since 1971.
Use of fossil and traditional sources of energy (coal, oil, gas, biofuels) has increased much less in 2014 than that of renewables and nuclear (Figure 39). How-ever, nuclear, hydro, and other renewables still ac-counted for hardly 5% of Asia TPES in 2014.
Figure 39. Annual growth in TPES by fuel, Asia
* In this graph peat and oil shale are aggregated with coal. ** Includes geothermal, solar thermal, solar photovoltaic and wind.
Total final consumption in Asia has increased five times over four decades (Figure 40) and has changed considerably. The use of traditional biofuels (biomass, waste) has been divided by almost three, meaning that coal, with approximately the same share in 1971 and
2014 (29% and 28% respectively) is now the most important fuel consumed by sectors. The share of oil in total final consumption has almost doubled (from 15% to 28%), that of electricity rose from 3% to 19%. With a seven-fold increase industry is by far the big-gest energy consuming sector in Asia, representing in 2014 42% of the region total final consumption. Though coal is still the main fuel consumed in indus-try (55% in 2014) it is now followed by electricity (27%). The residential sector is now second behind industry, and has increased by 120% between 1971 and 2014; though traditional biomass is still the main fuel consumed by residential, electricity and natural gas have significantly increased. Energy consumption has been multiplied by 12 times in the transport sec-tor, but relies mainly on oil.
Figure 40. Total final consumption by sector and fuel, Asia
* In this graph peat and oil shale are aggregated with coal. ** Includes geothermal, solar thermal, solar photovoltaic and wind.
0%2%4%6%8%
10%12%14%16%18%20%
1971-2014 2013-2014
0
200
400
600
800
1000
1200
1400
1971 2014 1971 2014 1971 2014 1971 2014
Mtoe
Other
Electricity
Natural Gas
Oil
Coal
OtherTransport ResidentialIndustry
EXCERPT FROM WORLD ENERGY BALANCES (2016 edition) - 17
INTERNATIONAL ENERGY AGENCY
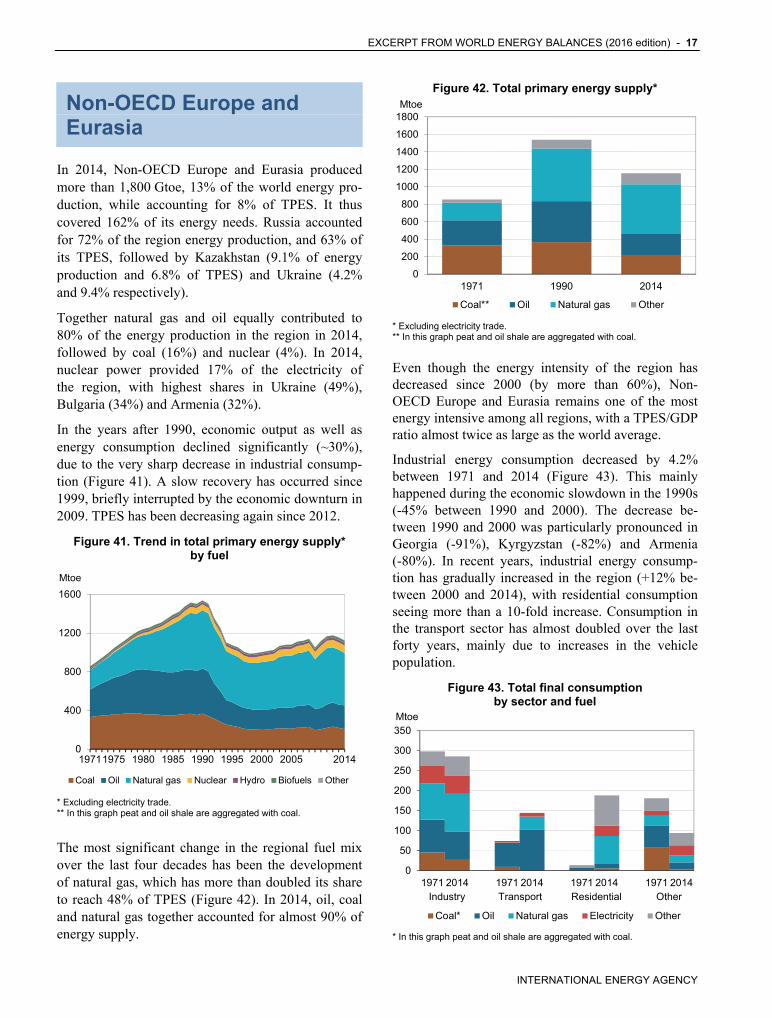
Non-OECD Europe and Eurasia
In 2014, Non-OECD Europe and Eurasia produced more than 1,800 Gtoe, 13% of the world energy pro-duction, while accounting for 8% of TPES. It thus covered 162% of its energy needs. Russia accounted for 72% of the region energy production, and 63% of its TPES, followed by Kazakhstan (9.1% of energy production and 6.8% of TPES) and Ukraine (4.2% and 9.4% respectively).
Together natural gas and oil equally contributed to 80% of the energy production in the region in 2014, followed by coal (16%) and nuclear (4%). In 2014, nuclear power provided 17% of the electricity of the region, with highest shares in Ukraine (49%), Bulgaria (34%) and Armenia (32%).
In the years after 1990, economic output as well as energy consumption declined significantly (~30%), due to the very sharp decrease in industrial consump-tion (Figure 41). A slow recovery has occurred since 1999, briefly interrupted by the economic downturn in 2009. TPES has been decreasing again since 2012.
Figure 41. Trend in total primary energy supply* by fuel
* Excluding electricity trade. ** In this graph peat and oil shale are aggregated with coal.
The most significant change in the regional fuel mix over the last four decades has been the development of natural gas, which has more than doubled its share to reach 48% of TPES (Figure 42). In 2014, oil, coal and natural gas together accounted for almost 90% of energy supply.
Figure 42. Total primary energy supply*
* Excluding electricity trade. ** In this graph peat and oil shale are aggregated with coal.
Even though the energy intensity of the region has decreased since 2000 (by more than 60%), Non-OECD Europe and Eurasia remains one of the most energy intensive among all regions, with a TPES/GDP ratio almost twice as large as the world average.
Industrial energy consumption decreased by 4.2% between 1971 and 2014 (Figure 43). This mainly happened during the economic slowdown in the 1990s (-45% between 1990 and 2000). The decrease be-tween 1990 and 2000 was particularly pronounced in Georgia (-91%), Kyrgyzstan (-82%) and Armenia (-80%). In recent years, industrial energy consump-tion has gradually increased in the region (+12% be-tween 2000 and 2014), with residential consumption seeing more than a 10-fold increase. Consumption in the transport sector has almost doubled over the last forty years, mainly due to increases in the vehicle population.
Figure 43. Total final consumption by sector and fuel
* In this graph peat and oil shale are aggregated with coal.
0
400
800
1200
1600
19711975 1980 1985 1990 1995 2000 2005 2014
Coal Oil Natural gas Nuclear Hydro Biofuels Other
Mtoe
0
200
400
600
800
1000
1200
1400
1600
1800
1971 1990 2014
Mtoe
Coal** Oil Natural gas Other
0
50
100
150
200
250
300
350
1971 2014 1971 2014 1971 2014 1971 2014
Mtoe
Coal* Oil Natural gas Electricity Other
Industry Transport Residential Other
18 - EXCERPT FROM WORLD ENERGY BALANCES (2016 edition)
INTERNATIONAL ENERGY AGENCY
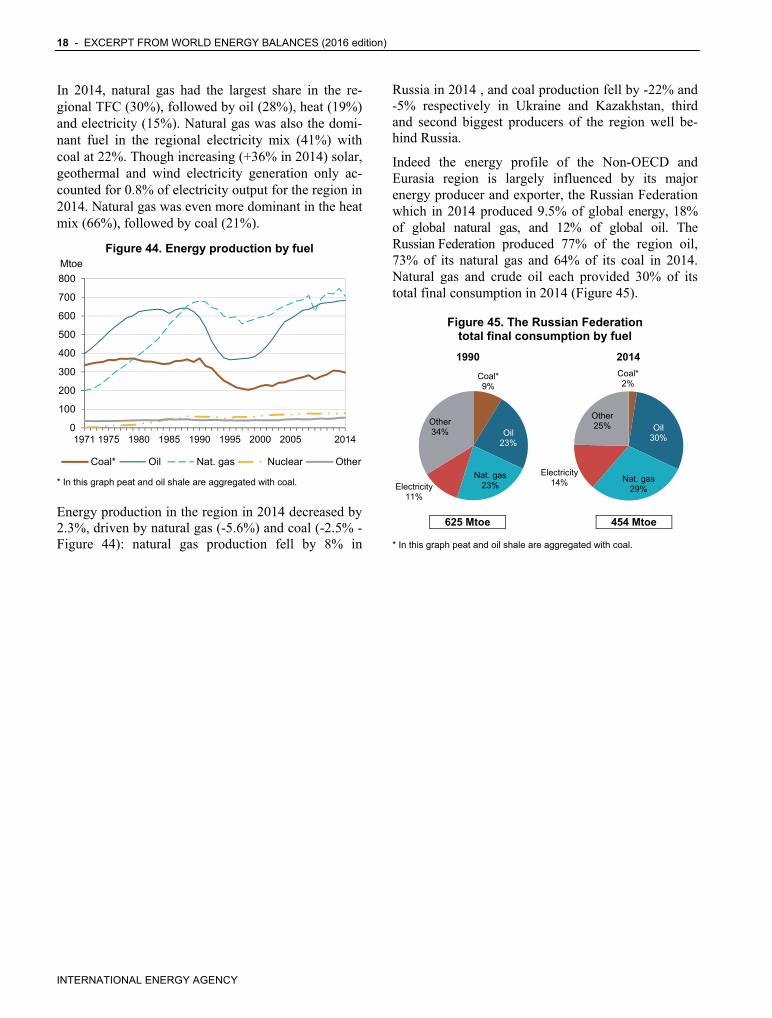
In 2014, natural gas had the largest share in the re-gional TFC (30%), followed by oil (28%), heat (19%) and electricity (15%). Natural gas was also the domi-nant fuel in the regional electricity mix (41%) with coal at 22%. Though increasing (+36% in 2014) solar, geothermal and wind electricity generation only ac-counted for 0.8% of electricity output for the region in 2014. Natural gas was even more dominant in the heat mix (66%), followed by coal (21%).
Figure 44. Energy production by fuel
* In this graph peat and oil shale are aggregated with coal.
Energy production in the region in 2014 decreased by 2.3%, driven by natural gas (-5.6%) and coal (-2.5% - Figure 44): natural gas production fell by 8% in
Russia in 2014 , and coal production fell by -22% and -5% respectively in Ukraine and Kazakhstan, third and second biggest producers of the region well be-hind Russia.
Indeed the energy profile of the Non-OECD and Eurasia region is largely influenced by its major energy producer and exporter, the Russian Federation which in 2014 produced 9.5% of global energy, 18% of global natural gas, and 12% of global oil. The Russian Federation produced 77% of the region oil, 73% of its natural gas and 64% of its coal in 2014. Natural gas and crude oil each provided 30% of its total final consumption in 2014 (Figure 45).
Figure 45. The Russian Federation total final consumption by fuel
1990 2014
625 Mtoe 454 Mtoe
* In this graph peat and oil shale are aggregated with coal.
0
100
200
300
400
500
600
700
800
1971 1975 1980 1985 1990 1995 2000 2005 2014
Mtoe
Coal* Oil Nat. gas Nuclear Other
Coal*2%
Oil30%
Nat. gas29%
Electricity14%
Other25%
Coal*9%
Oil23%
Nat. gas23%Electricity
11%
Other34%

EXCERPT FROM WORLD ENERGY BALANCES (2016 edition) - 19
INTERNATIONAL ENERGY AGENCY
Middle East
With a production more than 2.5 times as large as its supply, Middle East is the region with the highest energy self-sufficiency ratio in the world. In 2014 as in 2013, the region produced 13% of global energy, 31% of global oil and 16% of global natural gas.
Saudi Arabia was still by far the largest oil producer in the region (42%), followed by Iran, Iraq, UAE, and Kuwait (each 12% - Figure 46). Iran overtook Qatar as the region largest producer of natural gas in 2014 (31% and 30% of the regional production respective-ly). Indeed in Iran natural gas production increased by 11.4%, while it decreased in Qatar by 2.0%. In 2014, the major growth in oil production was seen in Iraq (+4.0%) and Bahrain (+2.6%). Production has plum-meted in Syria (-47.9%) and Yemen (-18.2%) due to political unrest.
Figure 46. Energy production in 2014, Middle East
The Middle East has also dramatically developed its own energy demand. Over the period 1971-2014, TPES grew on average by 7% per year, faster than in any other region in the world. In 2014 the supply is almost exclusively based on oil and natural gas (Fig-ure 47). Natural gas has partly displaced oil, doubling its share between 1971 and 2014.
Key factors for the fast development of natural gas in Middle East are power generation and the petro-chemical sector. While the share of oil in electricity
production shrank from 54% in 1971 to 35% in 2014, the share of natural gas increased from 27% to 62% in the same period. In 2014, natural gas provided almost all the electricity generated in Bahrain, Qatar, the United Arab Emirates, and in Oman.
Figure 47. Total primary energy supply* by fuel, Middle East
1971 2014
43 Mtoe 721 Mtoe
* Excluding electricity trade.
Over the last four decades, total final consumption has steadily increased in all sectors, particularly in indus-try and transport, where it was 20 times larger (Figure 48). Oil accounted respectively for 95%, 36% and 17% of final consumption in transport, industry and residential in 2014: it is responsible for 48% of total consumption in the region as a whole. Natural gas provided 55% and 47% of final consumption in industry and residential respectively. Electricity more than doubled its share in final energy consumption (from 5.6% in 1971 to 14.7% in 2014).
Figure 48. Total final consumption by sector and fuel, Middle East
0 200 400 600
Others
Oman
Qatar
Iraq
Kuwait
UAE
Islamic Rep. of Iran
Saudi Arabia
MtoeOil Natural gas Other
020406080
100120140160180200220
1971 2014 1971 2014 1971 2014 1971 2014
Mtoe
Other
Electricity
Nat. gas
Oil
Industry Transport Residential Other
Oil47.9%Nat. gas
51.5%
Other0.6%
Coal0.5%
Oil72.7%
Nat. gas25.5%
Other1.5%