Key Vocabulary - CEGA | Center for Effective Global...
15
Case 2: Savings Groups Intervention Evaluation Methods: Considering the Counterfactual
Transcript of Key Vocabulary - CEGA | Center for Effective Global...

Case 2: Savings Groups Intervention
Evaluation Methods: Considering the Counterfactual
.

CASE 2: SAVINGS GROUPS
Key Vocabulary
1. Counterfactual – what would have happened to the program participants if they had not participated in the intervention.
The counterfactual cannot be observed, as by definition it is the state of the world that does not occur.
2. Comparison Group – members of the study’s population that are compared to the group that received a particular intervention in order to estimate the impact of the intervention.1 The accuracy of an impact evaluation is based on how well this group represents the counterfactual.
3. Estimated Impact – the difference in outcomes between participants who receive the program and those in the comparison group. The estimated impact will differ from the true impact when the comparison group is not an accurate representation of the counterfactual.
4. True Impact – the difference in outcomes between the participants who receive the program and the counterfactual; that is the difference in outcomes for subjects who do receive the program compared to those same subjects had they not received the program.
5. Selection Bias – a source of distortion to the validity of the estimated impact that can occur when the individuals who participate in an intervention differ significantly from those who do not take part in the intervention, on characteristics associated with the outcomes of interest.
If selection bias is present, participants who receive the intervention and the comparison group could have different outcomes even if the comparison group had participated in the intervention. In other words, the comparison group is not a good representation of the counterfactual. Therefore, the selection bias can threaten the validity of the estimated impact.
6. Baseline – data collected before the implementation of a particular intervention.
7. Endline – data collected after the implementation of a particular intervention.
The baseline and endline can include only those who receive the intervention or also the members of the comparison group.
1 Conversely, note that unless stated otherwise we call the members of the study’s population that do receive the intervention “participants.”
1

CASE 2: SAVINGS GROUPS
IntroductionContrary to popular opinion, poor people can and do save. However, they often face significant barriers to saving. Formal savings mechanisms such as deposit accounts are often inaccessible due to lack of banks in rural areas, administrative barriers and prohibiting cost. Informal savings mechanisms (i.e. savings not deposited in a formal institution such as a bank) are usually not ideal, as savings are subject to theft, temptation, and pressure from family and friends. These barriers to formal saving prevent the poor from maximizing their investments, smoothing consumption, and weathering shocks such as illnesses or natural disasters. These savings constraints – like credit constraints – keep individuals from investing adequately in their microenterprises, health, education and asset purchasing.
Microfinance institutions (MFIs) have provided access to financial services for millions of people in developing countries. However, it is relatively costly for these organizations to provide financial services in remote rural settings. In addition, MFIs are usually more focused on providing credit rather than savings products. Under the typical Grameen loan model, participants also face relatively high interest rates and the pressure of group repayments.
Savings groups attempt to overcome the difficulties of offering credit to the rural poor. Savings groups have the potential to bring financial services to remote areas as they are self-sustaining and self-replicating. By contributing each week, the members form their own pool of money from which individuals can borrow when necessary. Savings groups can also provide a mechanism by which members can save for a lump sum expense without the dangers of theft and temptation associated with saving cash at home. Although administrative data shows savings groups to be popular, the impact of these groups on access to credit, savings and assets, income, food security, consumption, education, and empowerment is not yet known.
Impact is defined as the difference between what happened with the program and what would have happened without the program. The “counterfactual” is a term we use for the state of the world that program participants would have experienced in the absence of the program. Because we cannot observe the counterfactual, we must identify a comparison group to represent it. We estimate the program impact to be the difference between the comparison group and the program participants after they received the intervention. If the comparison is not a good representation of the counterfactual, however, then the estimated impact will not be accurate.
2

CASE 2: SAVINGS GROUPS
Section 1: Pre/Post ComparisonYou are charged with assessing the impact of savings groups. You decide to conduct a baseline survey of community members in a new area before the savings groups are formed. You target the 200 villages in which your partner NGO promises to set up savings groups. Since the groups consist mainly of women, you decide to survey one adult woman from each household. Two years later, after the savings groups have been formed, you send your evaluation staff back to those same respondents to conduct an endline survey. In both the baseline and endline surveys, you ask the women about whether they currently own a business. This produces the following results:
Table 1: Pre/Post Comparison
Business Ownership
Baseline 21%
Endline 28%
Estimated Impact
Discussion Questions:
1. What is the comparison group in this evaluation?
2. Draw a graph below that represents these results. Calculate the program’s estimated impact size, record it in the chart above and indicate in the graph below where you can see the estimated impact size.
3

CASE 2: SAVINGS GROUPS
Figure 1: Pre/Post Comparison
Baseline Endline18%19%20%21%22%23%24%25%26%27%28%29%30%
Perc
ent
of b
usin
ess
owne
rs
3. Is the comparison group a good representation of the counterfactual? If not, what other factors might lead to the changes we see above?
1
Section 2: Simple DifferenceOne of your colleagues tells you that in order to better determine if the program has had an impact, you need to have a comparison group consisting of individuals that did not participate in the intervention. Your colleague notes that there is already a natural comparison group – i.e. the community members who decide not to join the savings groups. You decide to collect endline data from both the community members who initially joined a savings group and those who did not. You find the following results:
4

CASE 2: SAVINGS GROUPS
Table 2: Simple Difference
Business Ownership
Individuals who participated in savings groups 28%
Individuals who did NOT participate in savings groups 19%
Estimated Impact
Discussion Questions:
1. What is the comparison group?
2. Draw a graph below that represents these results. Calculate the program’s estimated impact size, record it in the chart above and indicate in the graph below where you can see the estimated impact size.
Figure 2: Simple Difference
baseline endline18%19%20%21%22%23%24%25%26%27%28%29%30%
Perc
ent
of b
usin
ess
owne
rs
5

CASE 2: SAVINGS GROUPS
3. Is the comparison group a good representation of the counterfactual? If not, what other factors might lead to the changes we see above?
Section 3: Difference-in-DifferenceWhen the program is introduced, a more senior colleague advises you to survey everyone, both the participants and comparison group, not only after but also before the savings groups are formed. Instead of looking at the difference between just the individuals in savings groups and those who are not in savings groups after the program has ended, you now compare the change over time for the individuals in the savings groups and the change over this same time for the individuals who did not join the groups. This will help control for initial differences between the groups and changes that occurred over time that were not a result of the program but of an unrelated third factor. This is called a difference-in-difference calculation. You find the following results:
Table 3 Difference-in-Difference
Business Ownership
Individuals who did not participated in savings
groups
Individuals who participated in savings
groupsDifferenc
e
Baseline 16% 21% (d)
6

CASE 2: SAVINGS GROUPS
Endline 19% 28% (e)
Difference
(a) (b) (c)
Discussion Questions:
1. What is the comparison group in this evaluation and what exactly represents the counterfactual (you may want to refer back to the definition of counterfactual)?
2. Which field of the table above indicates the impact size of the program under the difference-in-difference method? Fill in the empty fields.
i. First, calculate the difference between the baseline and endline surveys for both the participants and comparison groups and enter the results in cells (a) and (b).
ii. Now, calculate the difference between these numbers and enter this in cell (c). This is your difference-in-difference impact calculation.
iii. Next, calculate the difference between the groups at the baseline and endline, and enter it in cell (d) and (e) respectively. Note that the difference-in-difference calculation is the same when you use the method suggested in (i) and in (iii): (T 1−T 2 )−(C 1−C2 )=(T 1−C1)−(T2−C2)
3. Draw a graph that represents these results below. Calculate the program’s estimated impact size, record it in the chart above and indicate in the graph below where you can see the estimated impact size.
4. Can you also see the impact size as estimated by the pre/post comparison and simple difference methods in this graph?
7

CASE 2: SAVINGS GROUPS
Figure 2: Difference-in-Difference
baseline endline15%16%17%18%19%20%21%22%23%24%25%26%27%28%29%30%
Perc
ent
of b
usin
ess
owne
rs
5. How does the difference-in-difference estimated impact compare in size/magnitude to the pre/post comparison and simple difference estimates?
6. Do the simple difference and pre/post method over- or underestimate the impact size? Why do you think this is the case?
7. Is the comparison group a good representation of the counterfactual? If not, what other factors might lead to the changes we see above?
8

CASE 2: SAVINGS GROUPS
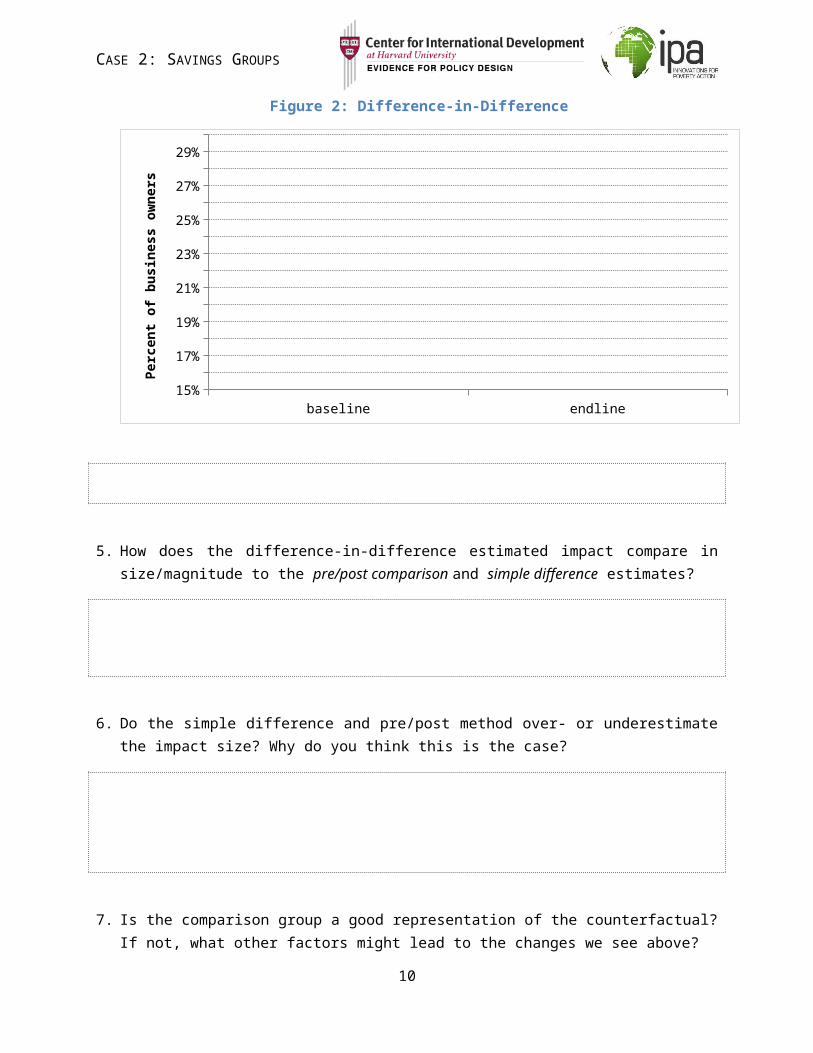
Section 4: National StatisticsYou have access to a national survey on entrepreneurship that provides district-level as well as national-level data. Your partner NGO set up savings groups in 200 villages in the Blue District in 2009 but has not expanded to other areas of the country yet. Luckily, the national survey was conducted in 2009 as well as 2011. The Red District borders the Blue District and at baseline its population is similar in income, occupation, and demographics.
Table 4 National data
Business Ownership
2009 2011
Blue District 23% 26%
Red District 22% 22%
National without Blue District 20% 18%
1. Discuss in your group how you might evaluate the impact of this program with the available data.
2. Discuss the assumptions that are necessary for this evaluation method to be a credible estimate of the impact of the program.
9
CASE 2: SAVINGS GROUPS
Section 5: Randomly Selecting Participants
Key Vocabulary for Randomized Experiments
1. Treatment – in a randomized experiment the intervention being evaluated is called the treatment.
2. Treatment and Control Group – in a randomized experiment participants that are randomly assigned to receive the treatment are naturally called the treatment group; in our example, this would be individuals who participated in savings groups. Conversely, the group of individuals that receive either no treatment or a standard treatment is called the control group.
Note that previously the group that received an intervention was called participants of the program evaluation.
3. Treatment effect – in a randomized experiment, the program impact is called the treatment effect.
In order to eliminate the problem of self-selection, you decide to randomize which villages are invited to join savings groups. You select 400 villages to partake in the study. Of these, you randomly choose 200 villages to receive the treatment and 200 to be control villages (who do not get the training). Your partner NGO sends agents to villages that have been selected to join savings groups, i.e. invited to receive the treatment. After two years, you survey both the treatment and control villages and find the following results in business ownership:
Table 5 Participant Randomization
Business Ownership
10
CASE 2: SAVINGS GROUPS
Control Treatment Difference
Baseline 20% 20% 0%
Endline 22% 25% 3%
Discussion Questions:
1. Assuming that the randomization was successfully executed, is it necessary that the researcher collect baseline data for this experiment?
2. What is the comparison/control group?
3. Is the comparison/control group a good representation of the counterfactual? If not, what other factors might lead to the changes we see above?
11