Key to higher productivity to double farmers’ income · innovation in farm machinery sector....
68
Mechanisation Key to higher productivity to double farmers’ income
Transcript of Key to higher productivity to double farmers’ income · innovation in farm machinery sector....

MechanisationKey to higher productivity to double farmers’ income
Even with slow growth of mechanisation, the total production of food grains in India increased from over 50 million tonnes in 1950-51 to 272 million tonnes in 2016-17. Food grain demand is expected to reach 355 million tonnes in 2030 as compared to 250 million tonnes in 2016.
2 Mechanisation - Key to higher productivity to double farmers’ income

ContentsMessage from FICCI 4
Foreword 5
Executive Summary 7
Section I: The Global economy and role of agriculture 8Role of agriculture in shaping the global economy 9
Key Trends in Global Agriculture Industry 12
India’s current economic status and future outlook 17
Evolution of agriculture in the last 70 years (Post independence) 18
SECTION II: Status of farm mechanisation in India 21Overview of farm equipment 22
Classification of farm equipment manufacturers in India 25
Region wise adoption of farm equipment sector 26
Import & export scenario of farm equipment 29
Custom Hiring Centres (CHC’s) 31
Role of technology in farm mechanisation 33
Section III: Key factors driving farm mechanisation in India 35Growing population and demand 36
Increase in agriculture productivity 37
Increase in agriculture exports 38
Labour migration and shortage 39
Increase in labour cost 43
Better stubble management 45
Section IV: Government’s role in farm equipment sector 46Overview of schemes and policies 47
Progress post-implementation of recently rolled out schemes 49
Impact of GST Act on farm equipment sector 52
Section V: Global benchmarking 54Global Farm Equipment Market 55
Comparison of India with other countries in terms of mechanisation rates 56
Select Case Studies 58
Section VI: Challenges 59
Section VII: Our recommendations 62
Mechanisation - Key to higher productivity to double farmers’ income 3

Message from FICCI
Farm mechanisation is essential for sustaining agricultural growth, especially in the context of diminishing agricultural labour. However, large communities of small and marginal farmers are still not in a position to take full benefit of farm mechanisation because of adverse economies of scale, particularly in operations like land preparation and harvesting. The question that emerges is not only how to leverage farm mechanisation for enhancing agricultural productivity, but also, how to bring the large community of small and marginal farmers into the fold of mechanised farming. One viable option can be in form of greater degree of adoption of Custom Hiring Centres (CHC) for farm machineries and other modern farming services.
I strongly believe the next phase of agricultural growth will be achieved through innovation and development of the farm mechanisation sector. The use of modern machinery is currently being promoted by private and public sector both, with several initiatives being taken up by the government like the Sub-Mission on Agricultural Mechanisation (SMAM) under National Mission on Agricultural Extension and Technology, Rashtriya Krishi Vikas Yojana (RKVY), and Mission for Integrated Development of Horticulture (MIDH).
This knowledge paper explores many similar initiatives and also identifies the problems in farm equipment sector, reflecting suggestions and opinions of various stakeholders collected through structured interviews. Subsequently, the report proposes measures for transforming Indian agriculture through mechanisation. It also showcases the best practices followed by various countries with a higher rate of farm mechanisation.
FICCI has always been at the forefront of providing thought leadership. We wish this report helps in opening up another facet to the emergent knowledge base of farm mechanisation sector.
Vinay Mathur Deputy Secretary General FICCI
Greater adoption of Custom Hiring Centres (CHC) for farm machineries and other modern farming services will drive change
4 Mechanisation - Key to higher productivity to double farmers’ income

Foreword
Today, there is a widespread realisation that farm mechanisation is an indispensable for increasing yield, bringing more area under cultivation and improving application efficiency of water and other agricultural inputs. By 2022, farm equipment market is expected to reach USD 12.5 billion. This offers numerous possibilities to establish business models that can drive technological advances and catalyse entrepreneurial innovation in farm machinery sector.
However, agriculture is a labour intensive sector and its shortage during peak season can derail growth. Therefore, farming systems need to be adequately mechanised and customised for the Indian scenario. Considering small size of farms across India, farm mechanisation would have to be enhanced through promotion of custom hiring models. Government of India (GoI) has been encouraging mechanisation through various policy interventions. Greater impetus is needed to develop need-based and regionally differentiated farm machinery.
The knowledge paper provides an overview of the farm mechanisation market, including region-wise trends on adoption of farm equipment in India. It also highlights the role of the CHCs in driving the agricultural output, especially for small and marginal farms that comprise over 85 per cent of the total land holdings in India.
I am sure this paper will be of interest to stakeholders, policymakers and various industry players.
Jasmeet Singh Head – Agriculture & Food Processing FICCI
By 2022, farm equipment market is expected to reach USD 12.5 billion
Mechanisation - Key to higher productivity to double farmers’ income 5

I strongly believe that mechanisation has a lot to contribute in the development and sustainability of the agriculture sector in India
Today, India has established itself as the fastest growing economy in the world with a growth rate of 6-7 per cent since 1991. In fact, the country surpassed China in 2016, producing 272 million tonnes of food grains that accounted for more than 10 per cent of the global food grain production.
In order to increase productivity with a balanced degree of mechanisation, government needs to ensure that implementation of policies takes place in a transparent and methodical manner, especially to support small and marginal farmers. While approximately 86 per cent of all farm land holdings belong to small and marginal farmers, machine penetration seems to be limited. Going forward, this must be an area of focus to promote overall growth within the industry at a time when agricultural labourers are moving to other sectors for better opportunities.
I strongly believe that mechanisation has a lot to contribute in the development and sustainability of the agriculture sector in India. For example, CHCs could go a long way in promoting advanced farm machinery penetration for small and marginal farmers. In addition, technological innovation in the agricultural sector will drive the next phase of growth in the country by dealing with challenges that include climate change, water scarcity, among others.
This knowledge paper provides an in-depth analysis of farm mechanisation sector in the country. The report also highlights the existing challenges faced by the small and marginal farmers and makes recommendations on how to increase productivity and farm equipment penetration.
We hope this report works as a solid point of reference for all stakeholders in the farm mechanisation sector including policymakers, corporates, farmers and equipment suppliers.
Rahul KapurPartnerGrant Thornton India LLP
Foreword
6 Mechanisation - Key to higher productivity to double farmers’ income
Executive Summary
Farm mechanisation in India is still in its early stages as compared to the developed countries. Even with slow growth of mechanisation, the total production of food grains in India increased from over 50 million tonnes in 1950-51 to 272 million tonnes in 2016-17. Food grain demand is expected to reach 355 million tonnes in 2030 as compared to 250 million tonnes in 2016. The adoption rates of farm equipment has been on a rise and a clear indicator of this is the sale of tractors, which increased from 0.35 million units in 2007 to 0.57 million units in 2016, witnessing a CAGR of 5.5 per cent during 2007-16. India is also one of the largest manufacturers of agricultural equipment such as tractors, harvesters and tillers.
Government of India (GoI) has introduced several schemes and policies that push for greater mechanisation in the country. Sub-Mission on Agricultural Mechanisation (SMAM) is one of the key initiatives towards achieving greater mechanisation rates. Besides, the government also wants to achieve its target of 2.8 kW/ha of farm power by 2022 from the existing level of 2.02 kW/ha in 2016-17.
Higher productivity, increase in agricultural exports, labour shortage and migration and increase in labour cost, are some of the factors driving farm mechanisation in India. With growing employment opportunities in other sectors, people will be moving from rural to urban and agriculture to non-agriculture sector areas. These trends will reduce the supply of labour for agriculture, pushing the labour wages and overall cultivation cost of a farm product upwards.
The sector faces some major challenges such as large proportion of small and marginal farmers, declining land holding sizes, unaffordability, lack of farmer awareness and complex legislation structure. Average farm size is expected to decrease, making individual ownership of agricultural machinery even more uneconomical.
Custom Hiring promotes farm mechanisation by bringing mechanisation to places that face low farm power availability and negates the adverse economies of scale associated with individual ownership. It seeks to make modernised farm equipment available to small and marginal farmers.
Modernisation of the Custom Hiring Model and innovation in farm machinery sector will drive the next phase of agricultural growth in the country. Some of the private players are working on product upgradation and customisation as part of their own R&D efforts. These players are also working to make their equipment accessible in all states and villages of the country. Policies and legislative changes that will favour issuance of credit to small and marginal farmers will help them in coming out of distress situations and work effectively towards raising productivity through mechanisation. Congenial policy framework can also incentivise establishment of CHCs as the preferred business model in the country.
It goes without saying, raising farmers’ awareness and knowledge through various stakeholders in the agriculture supply chain and incorporating farmers’ inputs for future implementation of schemes and policies can lead to better value creation.
Mechanisation - Key to higher productivity to double farmers’ income 7

Section I: The Global economy and role of agriculture
8 Mechanisation - Key to higher productivity to double farmers’ income

Role of agriculture in shaping the global economy
Figure 1: GDP Contribution of Agriculture Sector Region-wiseAgriculture, value added (% of GDP)
Agricultural sector plays a vital role in the economy of developing countries. It has played a vital role in the economic prosperity of developed countries. Emphasis on agricultural will always remain strong as increased agricultural output and productivity contributes in economic growth and environment sustainability. Agriculture makes its contribution to economic development in following ways:
• Contribution to economic output (GDP): The contribution of agriculture sector in a nation’s GDP cannot be undermined. The share of agriculture sector in GDP of developing and under-developed economies remains fairly significant (around 20 per cent); this share is sub-10 per cent in developed economies. The graph below represents the sector’s contribution to the GDP across nations globally.
Source: World Bank, GT analysis
0.0
5.0
10.0
15.0
20.0
25.0
Latin America &Caribbean
Middle East &North Africa
Europe & CentralAsia
Sub-Saharan Africa South Asia
2010 2011 2012 2013 2014 2015 2016
Mechanisation - Key to higher productivity to double farmers’ income 9
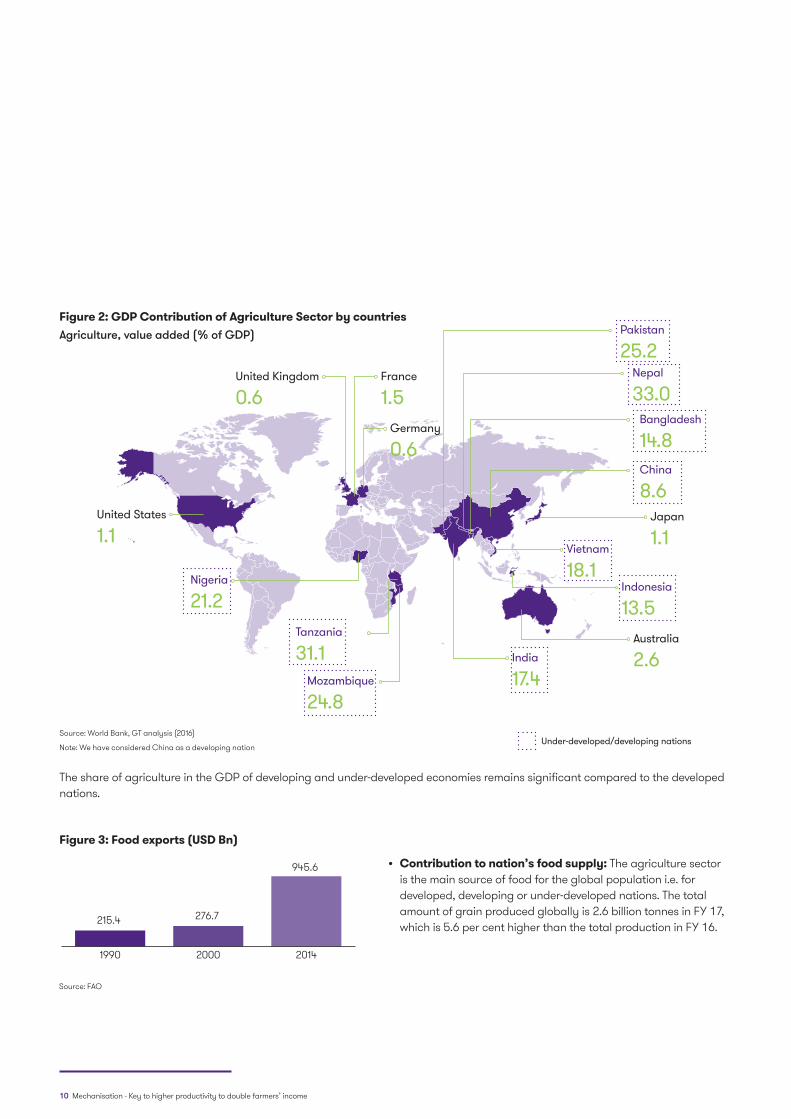
Figure 2: GDP Contribution of Agriculture Sector by countriesAgriculture, value added (% of GDP)
Figure 3: Food exports (USD Bn)
Japan
1.1Vietnam
18.1Indonesia
13.5Australia
2.6
Under-developed/developing nations
India
17.4
China
8.6
Bangladesh
14.8
Nepal
33.0
Pakistan
25.2
Germany
0.6
France
1.5United Kingdom
0.6
United States
1.1
Nigeria
21.2
Mozambique
24.8
Tanzania
31.1
Source: World Bank, GT analysis (2016)
Note: We have considered China as a developing nation
The share of agriculture in the GDP of developing and under-developed economies remains significant compared to the developed nations.
215.4 276.7
945.6
1990 2000 2014
• Contribution to nation’s food supply: The agriculture sector is the main source of food for the global population i.e. for developed, developing or under-developed nations. The total amount of grain produced globally is 2.6 billion tonnes in FY 17, which is 5.6 per cent higher than the total production in FY 16.
Source: FAO
10 Mechanisation - Key to higher productivity to double farmers’ income

Figure 5: Employment contribution by agriculture in the nation’s workforce Employment in Agriculture (% of total employment)
Figure 4: Total Global Grain Production (MT)
Japan
3.5Vietnam
42.6Indonesia
32.9Australia
2.6
Under-developed/developing nations
India
48.9
China
28.3
Germany
1.4
France
2.8
United Kingdom
1.1
United States
1.6
Source: World Bank, GT analysis (2016)
Source: FAO, GT analysis (2016)
2468
2606
2015-16 2016-17
• A source of raw material for industrial production: Agricultural sector is a key supplier of raw materials to different agro-based industries such as flour mills, bread, meat, milk products, sugar, wineries to name a few. This contributes to the country’s overall industrial production and growth. Thus, the agricultural and industrial sector growth is complementary to each other.
• Acts as a source of foreign exchange: For developing and under developed countries, agriculture sector usually is the primary contributor to the country’s foreign exchange earnings. Additionally, the capacity to import capital goods and machinery for industrial development for a country depends on the export earnings from agriculture sector. If exports of agricultural goods fail to increase at a sufficiently high rate, countries usually incur heavy deficit in the balance of payments.
• A source of employment: The agriculture sector acts as a source of providing employment to the country’s workforce, especially in the rural areas. Over one-fourth of the global population is employed in the agriculture sector. The share of employment contribution by the agriculture sector in the developing and under-developed nations is fairly large (>35 per cent) as compared to developed countries.
Mechanisation - Key to higher productivity to double farmers’ income 11

Key Trends in Global Agriculture Industry
Agriculture sector is highly dependent on the demographics of any country. The increase or decrease in population will have a direct impact on the demand of agriculture production. The key trends observed in the global agricultural sector are listed as under:
• Increase in global population: The world’s population has grown over two times with 7.6 billion people in 2016 from 3.4 billion in 1965.
Nearly 65 million people are expected to be added to the world’s population during 2016-2050 , mostly from countries such as India, Pakistan, Congo, Ethiopia, Nigeria, Uganda, and United Republic of Tanzania. India, the second most populated country in the world is expected to exceed China in the next decade. Nigeria is expected to become the third largest country by 2050.
• Increase in demand for global food, feed and fibre: The overall food demand is expected to increase in the range of 59 per cent to 98 per cent by 2050.
The overall crop production over the last two decades (1995-2015) has witnessed significant increase with the period from 1995-2005 seeing a higher rate of growth in the overall crop production. This can be attributed to increased use of farm technology and increased farmer productivity.
Figure 6: Global population
Figure 7: Crop production Worldwide: (1995 -2015)
3.4
7.6 8.69.8
1965 2016 2030 2050
Num
bers
in b
n
Source: UN estimates
Source: OECD estimates
0
200
400
600
800
1,000
1,200
1995 1996 1997 1998 1999 2000 2001 2002 2003 2004 2005
Cro
p pr
oduc
tion
(MT)
MAIZE RICE SOYBEAN WHEAT
2 0 0 5 2 0 0 6 2 0 0 7 2 0 0 8 2 0 0 9 2 0 1 0 2 0 1 1 2 0 1 2 2 0 1 3 2 0 1 4 2 0 1 5
MAIZE SOYBEAN RICE WHEAT
• Increase in global agriculture yield/production: The growth in population in the last two decades has pushed the overall agriculture production of crops such as rice, wheat, maize and soybean. Majority of this growth in the global crop production has been witnessed primarily due to increase in yields and higher cropping intensity.
12 Mechanisation - Key to higher productivity to double farmers’ income
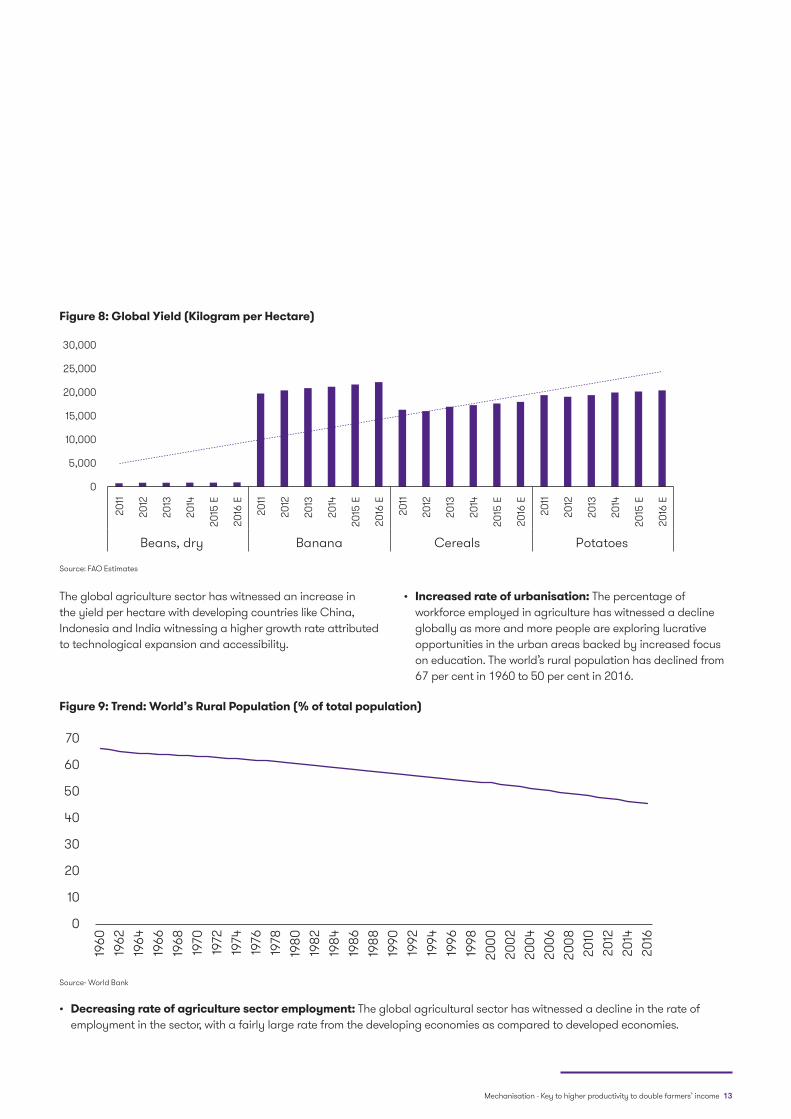
The global agriculture sector has witnessed an increase in the yield per hectare with developing countries like China, Indonesia and India witnessing a higher growth rate attributed to technological expansion and accessibility.
• Increased rate of urbanisation: The percentage of workforce employed in agriculture has witnessed a decline globally as more and more people are exploring lucrative opportunities in the urban areas backed by increased focus on education. The world’s rural population has declined from 67 per cent in 1960 to 50 per cent in 2016.
• Decreasing rate of agriculture sector employment: The global agricultural sector has witnessed a decline in the rate of employment in the sector, with a fairly large rate from the developing economies as compared to developed economies.
Figure 8: Global Yield (Kilogram per Hectare)
Figure 9: Trend: World’s Rural Population (% of total population)
Source: FAO Estimates
Source- World Bank
0
5,000
10,000
15,000
20,000
25,000
30,000
2011
2012
2013
2014
2015
E
2016
E
2011
2012
2013
2014
2015
E
2016
E
2011
2012
2013
2014
2015
E
2016
E
2011
2012
2013
2014
2015
E
2016
E
Beans, dry Banana Cereals Potatoes
0
10
20
30
40
50
60
70
1960
1962
1964
1966
1968
1970
1972
1974
1976
1978
1980
1982
1984
1986
1988
1990
1992
1994
1996
1998
2000
2002
2004
2006
2008
2010
2012
2014
2016
Mechanisation - Key to higher productivity to double farmers’ income 13

Figure 10: Employment in agriculture (% of total employment)
Figure 11: Agricultural, value added over the years (constant 2010 USD)
010203040506070
1990 1991
1992
1993
1994
1995
1996
1997
1998
1999
2000
2001
2002
2003
2004
2005
2006
2007
2008
2009
2010
2011
2012
2013
2014
2015
2016
Empl
oym
ent i
n %
Australia China United Kingdom IndonesiaRussian Federation Egypt United States
USD
Tril
lion
0
0.5
1
1.5
2
2.5
3
3.5
2000 2001 2002 2003 2004 2005 2006 2007 2008 2009 2010 2011 2012 2013 2014 2015 2016
Source- World Bank, * Estimates for 2016 except Australia and US.
Source- World Bank.
Note: Agriculture sector comprises of value added from forestry, hunting, and fishing as well as cultivation of crops and livestock production.
This shift of workforce preference is largely attributed to commercialisation of agricultural sector i.e. shift in the workforce from pure farm oriented activities to allied sectors. Food processing, farm equipment manufacturing, fertiliser factories and labs attract a significant percentage of population from pure agriculture sector.
• Increased farm mechanisation and technology adoption: Farm mechanisation include the use of technology and equipment to enhance productivity and profitability in agriculture sector. Growing population and urbanisation has put a constraint on land availability and size for crop cultivation, leading to a technological growth spurt in the agricultural sector.
14 Mechanisation - Key to higher productivity to double farmers’ income

The growth in the agricultural value add can be largely attributed to the adoption of farm mechanisation and related technology, fertilisers, seed quality resulting in improved yield. Select examples of farm mechanisation and technological adoption include:
• Increased software integration in precision farming including weather pattern projection, soil testing and reporting, GPS guidance and reporting systems, farm management and yield projections helping farmers with crop planning and post-harvest loss minimisation. For example, Skymet Weather is a leading weather forecasting and monitoring company that works closely with farmers. The company measures, predicts and limits climate risk to agriculture by providing information about weather to the farmers.
• With the growing trend of irrigated farmland across the world, a few manufacturers have developed new mechanised irrigation systems using regenerative water technology to conserve water and enhance crop productivity. For example, a technology company based in Vijaywada, Andhra Pradesh uses technology in aquaculture, an area where farmers face problems due to the unavailability of adequate technology to measure and control water health. The company develops solar-powered flouting buoys that measure different water parameters, such as oxygen levels, temperature and pH range, crucial for the growth and survival of fish and shrimp. The collected information is uploaded on the cloud and transmitted to individual customers through an Android app, SMS, voice call or the internet. Farmers can also remotely control automated equipment such as aerators and feeders.
• Increased use of aluminium, magnesium and titanium alloy to reduce the weight of farm machinery. Engineers in developed countries are working on the use of such lighter-weight materials in developing farm machineries.
• Changing food habits: Increasing urbanisation and per capita income and access to a larger variety of food groups have influenced food consumption in many countries. During 2010-2050, the demand for staple food is expected to rise faster than global population i.e. nearly 50 per cent. The demand for food increases with growing population and incomes in developing countries, the composition of diets will tend to head towards more nutrient-dense foods.1
1. According to International Food Policy Research Institute
Mechanisation - Key to higher productivity to double farmers’ income 15

Sub-Saharan Africa
812
812
808
202
224
228
911
912
914
2010
2030
2050
Cereals Fruits and vegetables
Meat, dairy and eggs
Cereals Fruits and vegetables
Meat, dairy and eggs
1363
1377
1403
105
189
329
156
212
247
2010
2030
2050
Cereals Fruits and vegetables
Meat, dairy and eggs
1067
1137
1181
154
204
266
142
178
243
2010
2030
2050
Per capita consumption growth (CAGR)
North America South Asia Sub-Saharan Africa
2010-30 2030-50 2010-30 2030-50 2010-30 2030-50
Cereals 0.00% -0.02% 0.05% 0.09% 0.32% 0.19%
Fruits and vegetables 0.52% 0.09% 2.98% 2.81% 1.42% 1.34%
Meat, dairy and eggs 0.01% 0.01% 1.55% 0.77% 1.14% 1.57%
Source: International Food Policy Research Institute
South Asia and sub-Saharan Africa is expected to witness a higher change in food diets in the coming years as compared to the developed region of North America.
North America
812
812
808
202
224
228
911
912
914
2010
2030
2050
Cereals Fruits and vegetables
Meat, dairy and eggs
Cereals Fruits and vegetables
Meat, dairy and eggs
1363
1377
1403
105
189
329
156
212
247
2010
2030
2050
Cereals Fruits and vegetables
Meat, dairy and eggs
1067
1137
1181
154
204
266
142
178
243
2010
2030
2050
South Asia
812
812
808
202
224
228
911
912
914
2010
2030
2050
Cereals Fruits and vegetables
Meat, dairy and eggs
Cereals Fruits and vegetables
Meat, dairy and eggs
1363
1377
1403
105
189
329
156
212
247
2010
2030
2050
Cereals Fruits and vegetables
Meat, dairy and eggs
1067
1137
1181
154
204
266
142
178
243
2010
2030
2050
Figure 12: Per Capita Calories Geography wise
16 Mechanisation - Key to higher productivity to double farmers’ income

Figure 13: Sectoral composition - Indian GDP (%)
Source: CIA
2. IMF3. https://data.worldbank.org/indicator/NY.GDP.PCAP.CD?year_high_desc=true4. Source: IMF and World Bank
India’s current economic status and future outlook
India is the sixth-largest economy in the world measured by nominal GDP and the third-largest by purchasing power parity (PPP). The country ranks 141 in GDP per capita (nominal) with USD 1723 in 20162. After the economic liberalisation in the 90s, India achieved 6-7 per cent GDP growth annually. In FY 2017, India’s economy has become the world’s fastest growing major economy beating China.3
India has the second fastest growing service sectors in the world with an annual growth rate of around 9 per cent. The services sector contributed around 45 per cent to the country’s GDP in 2015-16. The IT industry continues to be the largest private-sector employer. India is the third-largest start-up hub in the world with over 3,100 technology start-ups in 2014-15.
The agricultural sector has around 17 per cent share in India’s GDP. Farming represents 65 per cent of the total contribution of agriculture and allied sectors and livestock represents 23 per cent . At 157.35 million hectares, India stands as the second largest agricultural land in the world. India ranks among the top countries in the world in production of a number of crops including rice, wheat, sugarcane, fruits and vegetables. India ranks third in farm and agriculture output globally. In the realm of plantation crops, India is the world’s largest producer, consumer and exporter of spices, and also ranks high in the production of tea and coffee. Farming of land is a major source of income for nearly half of the total population of India.
Future outlook
India is expected to become the third largest economy by 2030, leaving behind developed countries such as Japan, Germany, Britain and France. The country is expected to grow annually at an average rate of 7.4 per cent to USD 6.84 trillion4 by 2030, which will make it larger than other developed countries. India’s GDP will exceed the US GDP in PPP terms by 2040, making India the largest economy in the world after China. India’s recent performance in agriculture has been favourable, with agricultural production growing in the last few years. According to industry experts, the consumption expenditure in India is likely to reach USD 3.6 trillion by 2020, up from an estimated USD 0.2 trillion in FY 16.
58%Services
25%Industrial
17%Agriculture
Mechanisation - Key to higher productivity to double farmers’ income 17

Evolution of agriculture in the last 70 years (post-independence)Today, India is the largest producer of variety of agricultural products including spices, pulses, milk, tea, cashew, jute etc. It is the second largest producer of wheat, rice, fruits and vegetables, sugarcane, cotton, and oilseeds. The country has transformed itself from an import dependent country to an export oriented economy for agricultural commodities.
• India’s food grain production was stagnant during 1950s
• During 1952-53, food grain production in India stood at 59.2 MT with a yield of 579.8 kg/ha
• In 1960s, High Yield Variety of seeds, increased use of fertilisers and irrigation resulted in a significant spike in production
• Green revolution in 1965 made the county self reliant in meeting its food demand
• Import of food grains declined during the period
• India witnessed a growth in the cereal production and the nation started emerging as a net exporter of a range of agriculture products i.e. surplus over domestic demand
• Various economic reforms were introduced which led to further boost to agriculture exports
• Liberalisation of Indian economy in 1991
• Ministry of Agriculture launched Agricultural Marketing Information Network in March 2000 with the aim to link all important agricultural market products for effective information exchange.
• In 2007s, National Food Security Mission to enhance the production of rice, wheat, pulses etc., Rashtriya Krishi Vikas Yojana to achieve high growth in agricultural sector amongst others
• Government introduced various key schemes such as Pradhan Mantri Krishi Sinchai Yojana, Pradhan Mantri Fasal Bima Yojna, Paramparagat Krishi Vikas Yojana etc.
• Allocation of US$ 830 million for the development of micro irrigation, watershed and Pradhan Mantri Krishi Sinchai Yojana
• A lot of initiatives, with focus on agriculture marketing, have been taken by the government such as establishment of National Agriculture Market
1950-1965
1965-1990
1990-2010
2010 onwards
18 Mechanisation - Key to higher productivity to double farmers’ income

5 Source: Ministry of Agriculture
Before 1965 (Pre-Green Revolutionand HYV programme)
In the last six decades, Indian agriculture sector has witnessed tremendous change in terms of yield, productivity and the overall production. The food grain production witnessed an average growth of less than 1 per cent per annum during the period from 1900 to 1950. In 1951, India produced over 50 million tons of food grains, which was not sufficient to feed 350 million people and led to import of food grains in India. In the 1960s, India started importing high-yielding variety (HYV) of seeds from Mexico, which increased the agriculture production and helped the country attain food security and reduce imports.
1965-1990 (Post-Green Revolution)
India, primarily across Punjab and Haryana, witnessed the Green Revolution in 1965 which helped the country move out of a situation of importing food grains tobeing a self-sufficient nation. Food grain production doubled between 1966 and 1986from 72 MT to 150MT. Majority of the growth in agriculture output was due to an increase in product yields and not due to an increase in the area under crops. The High Yielding Varieties Programme (H.Y.V.P) in India was started in 1966 and the area under H.Y.V.P grew 12.6 times (from 6.07 million ha in 1966 to nearly 70 million ha in 1990s).
1990 -2010 (Post-economic liberalisation)
In the 90s, the governmentintroduced major policy reforms which signaled that it wasmoving to a more open and liberal economy with greater participation from the private sector, especially foreign investment. As a result, new technologies and institutional credits were brought in by large multi-national players, which further gave boost to exports. During 2000-10, the government introduced a number of agriculture focused policies and schemes. For example, the government introduced National Food Security Mission to enhance the production of rice, wheat, pulses, coarse cereals and commercial crops. The overall objective of the national policy was to attain agriculture output growth rate of 4 per cent per annum.
Later in 2007, Rashtriya Krishi Vikas Yojna was introduced to achieve high growth in agricultural sector. Other key schemes introduced by the government werePradhan Mantri Krishi Sinchai Yojana, Pradhan Mantri Fasal Bima Yojna, Paramparagat Krishi Vikas Yojana,among others. A number of commodity exchanges were opened which helped the country in fair pricing of commodities. The government undertook many initiatives to improve agricultural infrastructure, examples of which include establishing pesticide and fertiliser factories, agricultural universities and research institutions. Today, India ranks among the leading producers ofa variety of agricultural products in the world.
2010 onwards
The government has been promoting organised marketing of agriculturalcommodities through a network of regulated markets to improve farmer’s profitability bycreating an integrated online platform. In 2015, Department of Agriculture (DAC) approved USD 31 million for developing the National Agricultural Market (NAM) and it was launched in 2016. The NAM is an online trading portal, which integrates the existing agricultural produce market committee (APMC) with mandis to create a unified national market for agricultural commodities. The states are working towards deregulating marketing of fruits and vegetables to decline the price gap between producers and consumers through reduction in the number of intermediaries in the supply chain. State governments are making alterations in their existing policy framework and encouraging private sector participation to deregulate fruits and vegetables marketing. Government has even established pesticide and fertiliser factories, mega food parks, agricultural universities and research institutions etc. to encourage agricultural commodities.
Mechanisation - Key to higher productivity to double farmers’ income 19
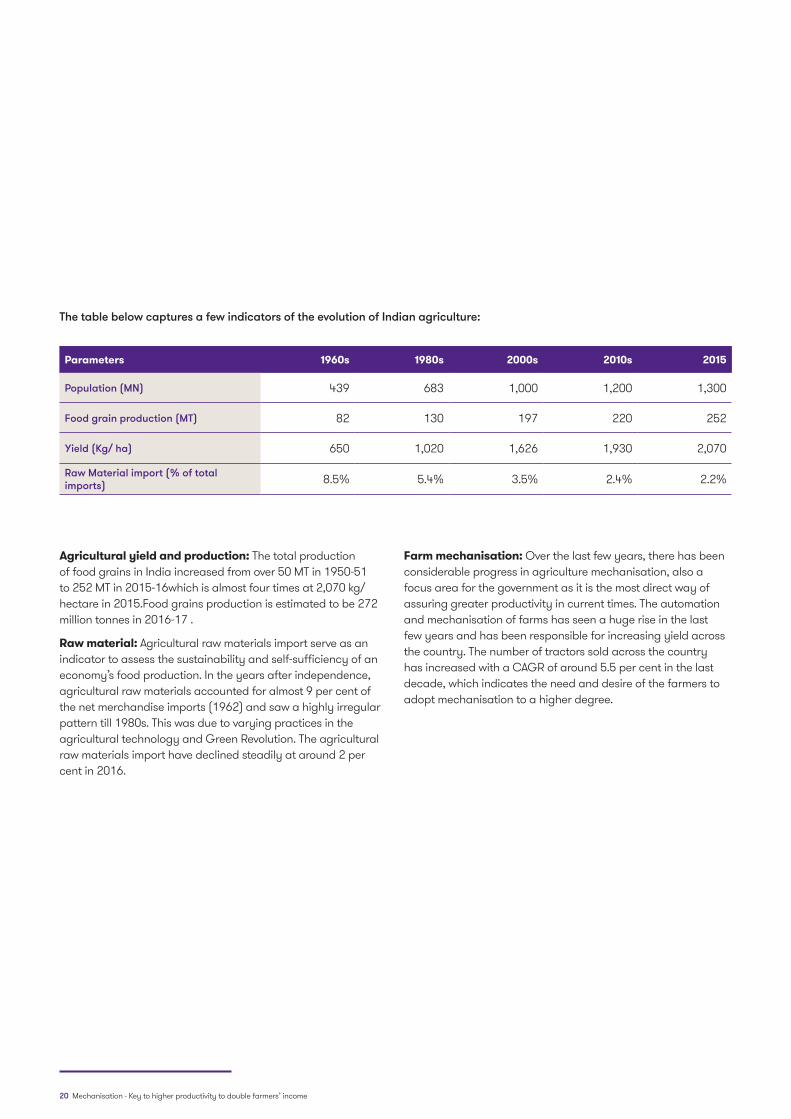
The table below captures a few indicators of the evolution of Indian agriculture:
Parameters 1960s 1980s 2000s 2010s 2015
Population (MN) 439 683 1,000 1,200 1,300
Food grain production (MT) 82 130 197 220 252
Yield (Kg/ ha) 650 1,020 1,626 1,930 2,070
Raw Material import (% of total imports) 8.5% 5.4% 3.5% 2.4% 2.2%
Agricultural yield and production: The total production of food grains in India increased from over 50 MT in 1950-51 to 252 MT in 2015-16which is almost four times at 2,070 kg/hectare in 2015.Food grains production is estimated to be 272 million tonnes in 2016-17 .
Raw material: Agricultural raw materials import serve as an indicator to assess the sustainability and self-sufficiency of an economy’s food production. In the years after independence, agricultural raw materials accounted for almost 9 per cent of the net merchandise imports (1962) and saw a highly irregular pattern till 1980s. This was due to varying practices in the agricultural technology and Green Revolution. The agricultural raw materials import have declined steadily at around 2 per cent in 2016.
Farm mechanisation: Over the last few years, there has been considerable progress in agriculture mechanisation, also a focus area for the government as it is the most direct way of assuring greater productivity in current times. The automation and mechanisation of farms has seen a huge rise in the last few years and has been responsible for increasing yield across the country. The number of tractors sold across the country has increased with a CAGR of around 5.5 per cent in the last decade, which indicates the need and desire of the farmers to adopt mechanisation to a higher degree.
20 Mechanisation - Key to higher productivity to double farmers’ income

SECTION II: Status of farm mechanisation in India
Mechanisation - Key to higher productivity to double farmers’ income 21
Overview of farm equipment
Farm equipment market in India is currently estimated at USD 8.8 billion in 2017 and it is expected to reach USD 12.5 billion by 2022.
Farm equipment are machines that can be used for conducting a wide range of agricultural operations such as land development, seed bed preparation, sowing and planting, weeding, inter-cultivation, plant protection, harvesting, cultivation and post-harvesting, etc. These machineries are used for the production of crops and agricultural livestock.
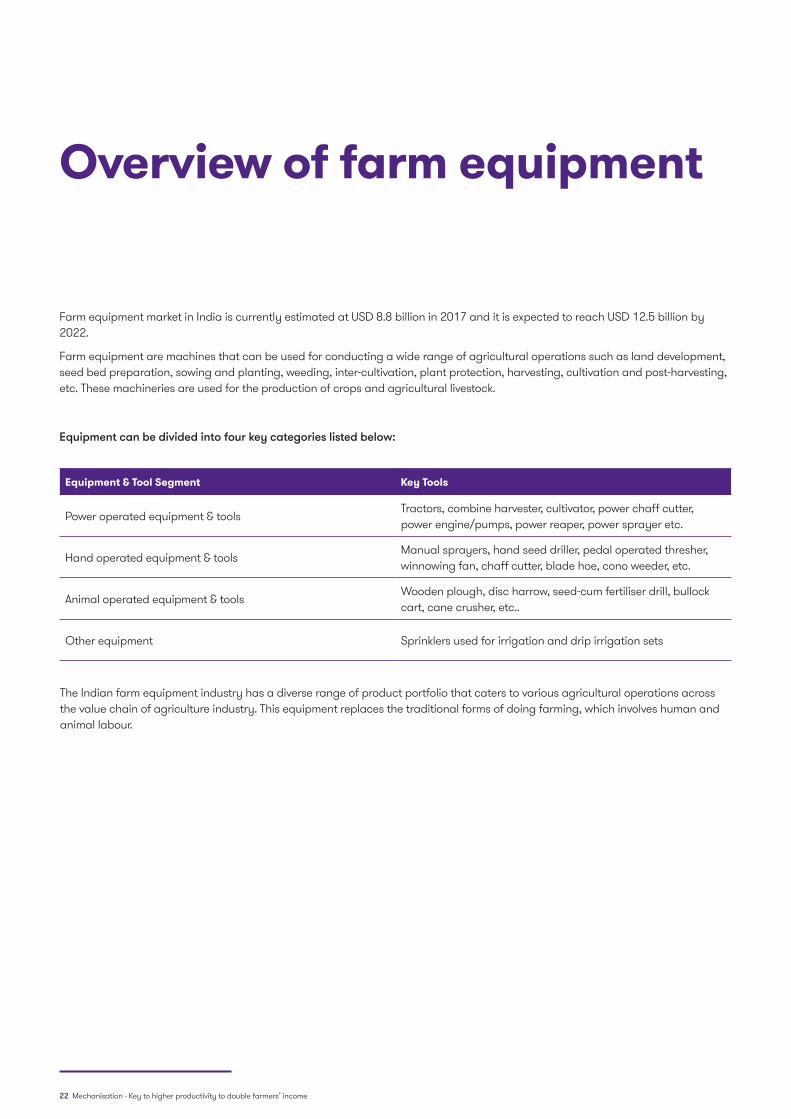
Equipment can be divided into four key categories listed below:
Equipment & Tool Segment Key Tools
Power operated equipment & toolsTractors, combine harvester, cultivator, power chaff cutter, power engine/pumps, power reaper, power sprayer etc.
Hand operated equipment & toolsManual sprayers, hand seed driller, pedal operated thresher, winnowing fan, chaff cutter, blade hoe, cono weeder, etc.
Animal operated equipment & toolsWooden plough, disc harrow, seed-cum fertiliser drill, bullock cart, cane crusher, etc..
Other equipment Sprinklers used for irrigation and drip irrigation sets
The Indian farm equipment industry has a diverse range of product portfolio that caters to various agricultural operations across the value chain of agriculture industry. This equipment replaces the traditional forms of doing farming, which involves human and animal labour.
22 Mechanisation - Key to higher productivity to double farmers’ income

Land Development, Tilla
ge, Seed Bed Preparation
Sowing and Planting
Weeding, Inter Cultivation, Plant
Protection
Harvesting and Threshing
Post Harvest and Agro Processing
Ope
rati
ons • Soil opening
• Making farm roads
• Field bundling
• Levelling
• Sowing seeds
• Planting
• Weed control
• Improve soil condition
• Infiltration of rain
through insecticide
/pesticide
• To separate grain
straw, tubers without
much loss
• Separate grain from
harvested crops
• Cleaning
• Grading
• Separation
• Drying and storage
• Food processing
Mac
hine
s • Tractors
• Levellers
• Ploughs
• Dozers
• Drill
• Seeder
• Planter
• Dibbler
• Transplanter
• Shovel/Plough
• Harrow
• Tiller
• Sprayer
• Duster
• Harvester
• Thresher
• Digger
• Reaper
• Sheller
• Sickle/Dao
• Seed Extractor
• Dehusker
• Huller/De-huller
• Cleaner
• Grader
• Mill
• Dryer
Figure 14: Agriculture value chain
Figure 15: Farm Equipment Market in India (USD bn)
Market size and segmentation
The farm equipment market is expected to grow at a CAGR of 7.5 per cent during the forecast period of 2015-2022.
7.63 8.138.67
9.249.85
10.4911.19
11.92
2015 2016 2017E 2018E 2019E 2020E 2021E 2022E
Mechanisation - Key to higher productivity to double farmers’ income 23
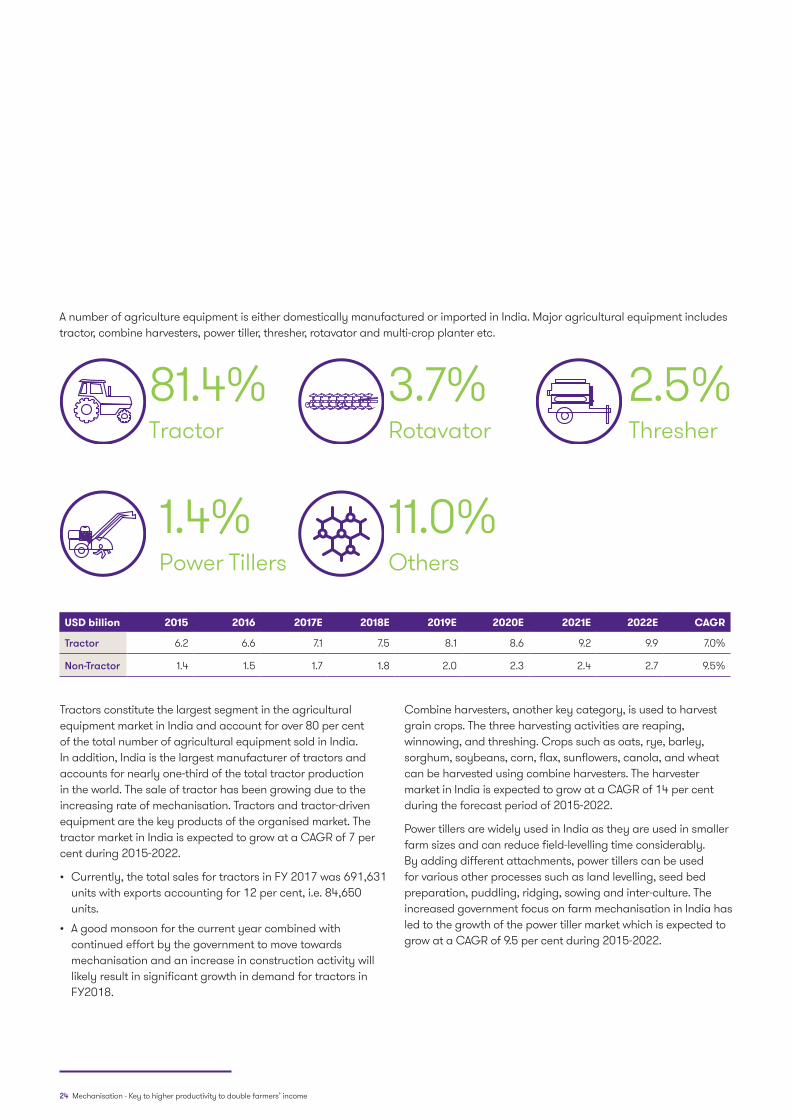
A number of agriculture equipment is either domestically manufactured or imported in India. Major agricultural equipment includes tractor, combine harvesters, power tiller, thresher, rotavator and multi-crop planter etc.
USD billion 2015 2016 2017E 2018E 2019E 2020E 2021E 2022E CAGR
Tractor 6.2 6.6 7.1 7.5 8.1 8.6 9.2 9.9 7.0%
Non-Tractor 1.4 1.5 1.7 1.8 2.0 2.3 2.4 2.7 9.5%
Tractors constitute the largest segment in the agricultural equipment market in India and account for over 80 per cent of the total number of agricultural equipment sold in India. In addition, India is the largest manufacturer of tractors and accounts for nearly one-third of the total tractor production in the world. The sale of tractor has been growing due to the increasing rate of mechanisation. Tractors and tractor-driven equipment are the key products of the organised market. The tractor market in India is expected to grow at a CAGR of 7 per cent during 2015-2022.
• Currently, the total sales for tractors in FY 2017 was 691,631 units with exports accounting for 12 per cent, i.e. 84,650 units.
• A good monsoon for the current year combined with continued effort by the government to move towards mechanisation and an increase in construction activity will likely result in significant growth in demand for tractors in FY2018.
Combine harvesters, another key category, is used to harvest grain crops. The three harvesting activities are reaping, winnowing, and threshing. Crops such as oats, rye, barley, sorghum, soybeans, corn, flax, sunflowers, canola, and wheat can be harvested using combine harvesters. The harvester market in India is expected to grow at a CAGR of 14 per cent during the forecast period of 2015-2022.
Power tillers are widely used in India as they are used in smaller farm sizes and can reduce field-levelling time considerably. By adding different attachments, power tillers can be used for various other processes such as land levelling, seed bed preparation, puddling, ridging, sowing and inter-culture. The increased government focus on farm mechanisation in India has led to the growth of the power tiller market which is expected to grow at a CAGR of 9.5 per cent during 2015-2022.
2.5%Thresher
81.4%Tractor
1.4%Power Tillers
3.7%Rotavator
11.0%Others
24 Mechanisation - Key to higher productivity to double farmers’ income

Classification of farm equipment manufacturers in IndiaThe farm equipment is developed by three broad categories of manufacturers
Village level craftsmen: These artisans are the primary source of supply, repair, and maintenance of hand tools in villages. They deal with a number of farm tools such as spades, sickles, local ploughs, sowing devices, yokes, levellers, grinding wheels, hand mills, hand operated milk churning tools, sieves, wooden storage structures, bullock carts, and manual water lifting devices etc.
• They are considered influential as they deal directly and frequently with farmers
• There are more than 100,000 village-level artisans currently operating in India
Small-scale industries: They manufacture and supply improved farm equipment such as ploughs, cultivators, disc ploughs and harrows, seed grills, planters, plant protection equipment, reaper harvesters, combine harvesters, soil working
tools, seeding, graders, mills, and oil expellers and many others. They also manufacture equipment for tractor and power tiller manufacturers.
• There are nearly 2,500 small-scale industries currently operating in India
Organised farm machinery industries: Sophisticated agriculture machinery includes diesel engines, electric motors, irrigation pumps, sprayers and dusters, land development machinery, tractors, power tillers, post-harvest and processing machinery and dairy machinery. They also provide after-sales services to the distributors. They focus on product upgradation and process technologies through their own R&D efforts.
• There are nearly 250 medium- to large-scale units currently operating in India.
Village-level craftsmen
Small-scale industries
Organised farm machinery industries
Mechanisation - Key to higher productivity to double farmers’ income 25

Region-wise adoption of farm equipment sector
Farm mechanisation includes the use of technology and equipment to enhance productivity, production and profitability in agriculture. The overall level of mechanisation in India is less than 50 per cent, as compared to 90 per cent in most of the developed countries. Hence, the farm mechanisation in India is still in its nascent stage having witnessed a growth of less than 5 per cent in the last two decades.
The level of mechanisation in agriculture sector depends on different accomplishments:
• Overall mechanisation (40-50 per cent)
• Soil working and seed bed preparation (40 per cent)
• Seeding and planting (30 per cent)
• Plant protection (34 per cent)
• Irrigation (34 per cent)
• Harvesting and threshing (65 per cent) Source: Department of Agriculture, Cooperatives and Farmer’s Welfare
Level of Mechanisation (in %) - Major crops across the Value Chain
Major Crops Seedbed Preparation Sowing / Planting / Transplanting
Weed and Pest Control Harvesting
Paddy 85-90 5-10 80-90 70-80
Wheat 90-95 80-90 70-80 80-90
Potato 90-95 80-90 80-90 70-80
Cotton 90-95 50-60 50-60 0
Maize 90-95 80-90 70-80 50-60
Gram 90-95 50-60 60-70 30-40
Sorghum 80-90 30-50 60-70 20-30
Millets 80-90 30-40 60-70 20-30
Oilseeds 80-90 30-40 60-80 20-30
*The data is for the year 2014
Similar to this, the level of mechanisation varies across different states in India. To simplify this, we have segregated India into four regions to highlight the use of agriculture equipment.
26 Mechanisation - Key to higher productivity to double farmers’ income
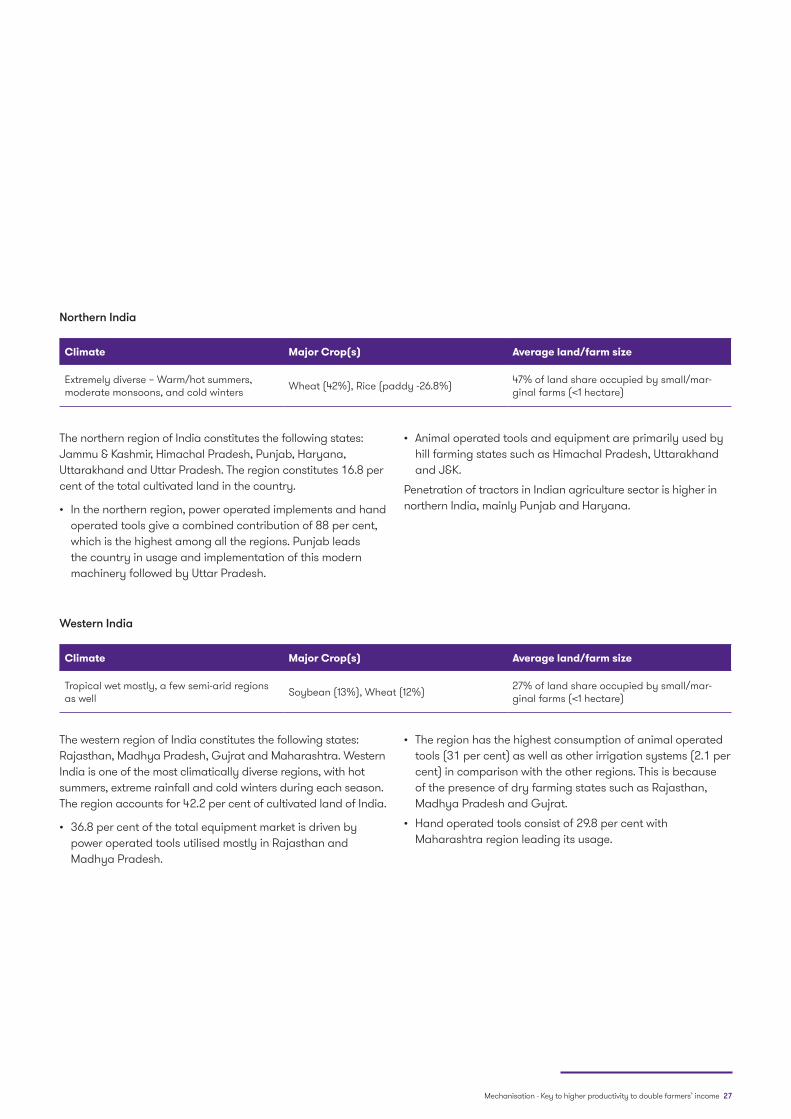
Northern India
Climate Major Crop(s) Average land/farm size
Extremely diverse – Warm/hot summers, moderate monsoons, and cold winters Wheat (42%), Rice (paddy -26.8%) 47% of land share occupied by small/mar-
ginal farms (<1 hectare)
The northern region of India constitutes the following states: Jammu & Kashmir, Himachal Pradesh, Punjab, Haryana, Uttarakhand and Uttar Pradesh. The region constitutes 16.8 per cent of the total cultivated land in the country.
• In the northern region, power operated implements and hand operated tools give a combined contribution of 88 per cent, which is the highest among all the regions. Punjab leads the country in usage and implementation of this modern machinery followed by Uttar Pradesh.
• Animal operated tools and equipment are primarily used by hill farming states such as Himachal Pradesh, Uttarakhand and J&K.
Penetration of tractors in Indian agriculture sector is higher in northern India, mainly Punjab and Haryana.
Western India
Climate Major Crop(s) Average land/farm size
Tropical wet mostly, a few semi-arid regions as well Soybean (13%), Wheat (12%) 27% of land share occupied by small/mar-
ginal farms (<1 hectare)
The western region of India constitutes the following states: Rajasthan, Madhya Pradesh, Gujrat and Maharashtra. Western India is one of the most climatically diverse regions, with hot summers, extreme rainfall and cold winters during each season. The region accounts for 42.2 per cent of cultivated land of India.
• 36.8 per cent of the total equipment market is driven by power operated tools utilised mostly in Rajasthan and Madhya Pradesh.
• The region has the highest consumption of animal operated tools (31 per cent) as well as other irrigation systems (2.1 per cent) in comparison with the other regions. This is because of the presence of dry farming states such as Rajasthan, Madhya Pradesh and Gujrat.
• Hand operated tools consist of 29.8 per cent with Maharashtra region leading its usage.
Mechanisation - Key to higher productivity to double farmers’ income 27

Southern India
Eastern India
Climate Major Crop(s) Average land/farm size
Tropical climate - dependent on monsoon for rainfall (except Tamil Nadu) Rice(paddy-27%), Groundnut (10%) 45.5% of land share occupied by small/mar-
ginal farms (<1 hectare)
Climate Major Crop(s) Average land/farm size
Humid-subtropical climate – extreme sum-mers, heavy rains during monsoons and mild winters
Rice (68%), Wheat (9%) 51.2% of land share occupied by small/mar-ginal farms (<1 hectare)
The Southern region of India comprising the states of Karnataka, Kerala, Tamil Nadu and Andhra Pradesh constitute 21.6 per cent of cultivated land in the country.
• Hand operated machines and tools is the largest segment in the southern region contributing almost 39 per cent of the total market, Tamil Nadu and Kerala being the highest contributors.
• Power operated tools contribute around 31 per cent of the total market, with most of the consumption driven by Karnataka and Andhra Pradesh.
• Animal operated tools in the region constitute 29.9 of the total consumption of equipment.
The Eastern region of India includes Odisha, Chhattisgarh, Jharkhand, Bihar, West Bengal, Sikkim, Assam, Meghalaya, Arunachal Pradesh, Nagaland, Manipur, Mizoram and Tripura. This region constitutes 9.7 per cent of cultivated land in the country.
• The eastern region thrives on using power operated tools and machines. 31 per cent of consumption is primarily driven by West Bengal, Bihar, Odisha and Chhattisgarh.
• The region has the highest consumption of hand operated tools and machinery (43 per cent) primarily due to the presence of various small farming states such as Assam, Mizoram, Sikkim, Arunachal Pradesh, Tripura,among others.
• Animal operated tools in the region constitute 24 per cent of the total consumption, primarily driven by Assam, Bihar and Odisha.
28 Mechanisation - Key to higher productivity to double farmers’ income

Import & export scenario of farm equipment
Historically, India has been a net exporter and that trend continues to grow today with steady growth in exports and declining imports. However, its export demand has seen many fluctuations due to seasonality effects and various other factors that determine agricultural growth. Nevertheless, India is a strong exporter in agricultural machinery with a CAGR of 6.2 per cent over the last four years, as depicted in Figure 13.
India’s leading export market for agricultural machinery continues to be the United States despite a decrease in the percentage of exports from 23.2 per cent in FY 2016 to 20 per cent in FY 2017. In contrast, the import for agricultural machinery has seen a CAGR of around 6.8 per cent. China continues to be India’s leading partner for imports with 10.2 per cent of total imports for agricultural machinery.
Figure 16: Import and Export of Agricultural Machinery
Figure 17: Exports and Imports by country
0
20
40
60
80
100
FY 2014
53
73
47
84
42
86
43
88
FY 2015 FY 2016 FY 2017
Imports Exports Linear (Imports) Linear (Exports)
USD
Mn
Source: research on India, agricultural machinery market in India 2017
20.00%
9.50%
9.00%
6.30%4.80%4.80%
45.50%USAAlegeriaSri LankaMyanmarThailandBangladeshOthers
10%
5%
3%
4%3%1%
74%
China
ItalyJapan
ThailandUSA
TaiwanOthers
Mechanisation - Key to higher productivity to double farmers’ income 29

Source: CMIE industry outlook based on DGFT data
India’s export market is dominated by tractors, with approximately 60,000 units exported per annum. India is the global market leader today for tractor exports accounting for approximately one-third of the total exports. India’s largest share of tractor export was to the Unites States of America in the year 2017. It exported 84,650 units to USA which was approximately 12 per cent of its total exports in 2017.Figure 15 below represents the total volume of tractor sales in India including exports. A good monsoon for the current year, government’s efforts to move towards mechanisation and an increase in construction activity, will result in significant growth in demand for tractors in2018.
More than 90 per cent of total domestic tractor sales are concentrated among top six players.
591
697
627
571
661
FY 2013 FY 2014 FY 2015 FY 2016 FY 2017
Domestic Sales Exports Total
91%88%
86%88%
90%
9%
12%
14%
12%
10%
Figure 18: Total volume of tractor sales (in thousand units)
Source: DGFT
A growing tractor market
30 Mechanisation - Key to higher productivity to double farmers’ income
Custom Hiring Centres (CHC)
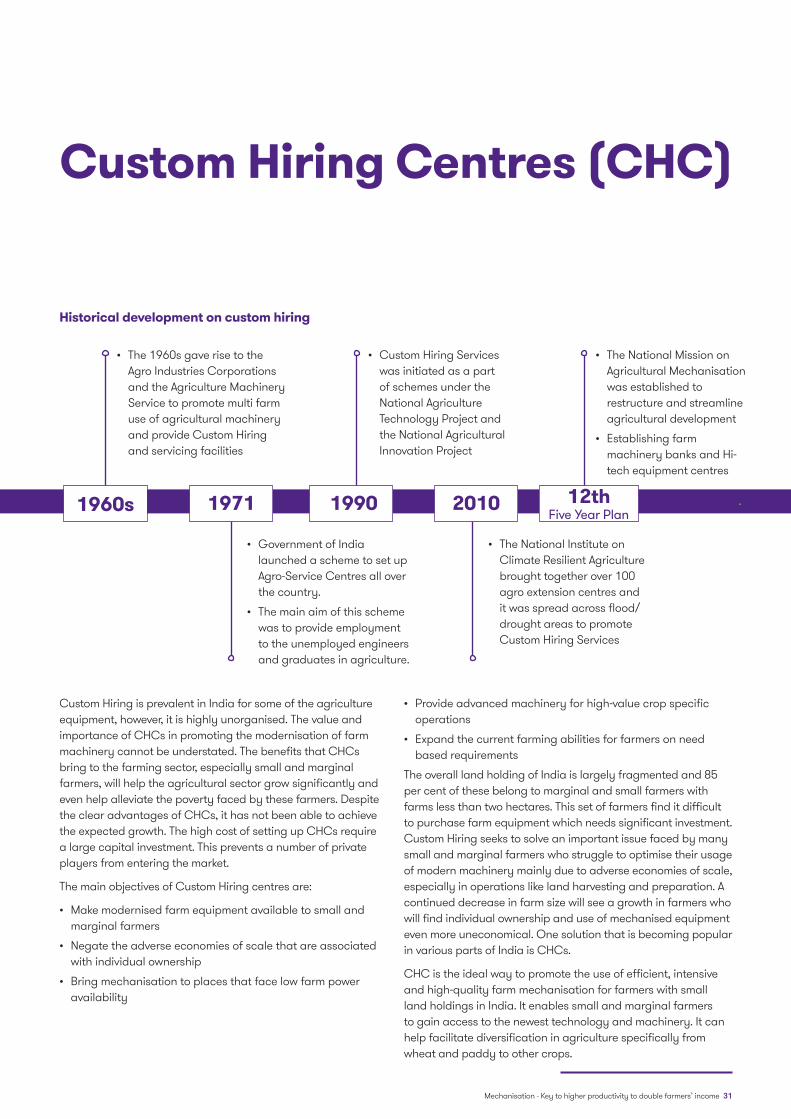
Historical development on custom hiring
Custom Hiring is prevalent in India for some of the agriculture equipment, however, it is highly unorganised. The value and importance of CHCs in promoting the modernisation of farm machinery cannot be understated. The benefits that CHCs bring to the farming sector, especially small and marginal farmers, will help the agricultural sector grow significantly and even help alleviate the poverty faced by these farmers. Despite the clear advantages of CHCs, it has not been able to achieve the expected growth. The high cost of setting up CHCs require a large capital investment. This prevents a number of private players from entering the market.
The main objectives of Custom Hiring centres are:
• Make modernised farm equipment available to small and marginal farmers
• Negate the adverse economies of scale that are associated with individual ownership
• Bring mechanisation to places that face low farm power availability
• Provide advanced machinery for high-value crop specific operations
• Expand the current farming abilities for farmers on need based requirements
The overall land holding of India is largely fragmented and 85 per cent of these belong to marginal and small farmers with farms less than two hectares. This set of farmers find it difficult to purchase farm equipment which needs significant investment. Custom Hiring seeks to solve an important issue faced by many small and marginal farmers who struggle to optimise their usage of modern machinery mainly due to adverse economies of scale, especially in operations like land harvesting and preparation. A continued decrease in farm size will see a growth in farmers who will find individual ownership and use of mechanised equipment even more uneconomical. One solution that is becoming popular in various parts of India is CHCs.
CHC is the ideal way to promote the use of efficient, intensive and high-quality farm mechanisation for farmers with small land holdings in India. It enables small and marginal farmers to gain access to the newest technology and machinery. It can help facilitate diversification in agriculture specifically from wheat and paddy to other crops.
• The 1960s gave rise to the Agro Industries Corporations and the Agriculture Machinery Service to promote multi farm use of agricultural machinery and provide Custom Hiring and servicing facilities
• Government of India launched a scheme to set up Agro-Service Centres all over the country.
• The main aim of this scheme was to provide employment to the unemployed engineers and graduates in agriculture.
• The National Institute on Climate Resilient Agriculture brought together over 100 agro extension centres and it was spread across flood/drought areas to promote Custom Hiring Services
• Custom Hiring Services was initiated as a part of schemes under the National Agriculture Technology Project and the National Agricultural Innovation Project
• The National Mission on Agricultural Mechanisation was established to restructure and streamline agricultural development
• Establishing farm machinery banks and Hi-tech equipment centres
1960s 1971 2010 12th Five Year Plan
1990
Mechanisation - Key to higher productivity to double farmers’ income 31
CHCs play a pivotal role in introducing high level technology to even the smallest farmer by providing farm equipment on a rental basis, designed with the objective to boost crop production, improve quality, timeliness and efficiency of agricultural operations. There are two main operational models, namely the tractor-centric model and the operation-specific model.
Additionally, limited awareness about the merits of CHCs among the farmers and their lack of knowledge in utilising advanced farm machinery restricts the potential use and implementation of this model. While there are a number of restrictions and challenges to the growth of CHCs, there is also a plethora of ways to make it a success. Custom hiring is an important facet of the modernisation and development of the agricultural sector in India, though government and private CHCs will help bring in a new age in modern mechanised farming.
Role of different stakeholders
Different stakeholders including private and government organisations have been participating in promoting the concept of custom hiring in India. They have been building supply of different agriculture equipment across the agriculture supply chain and life cycle of crops.
Private sector: The private sector has played a major role in farm mechanisation in India through the establishment of CHCs with unique business models. Select examples include:
• An Indian private sector firm focussing on farm mechanisation is creating a pan India network of farm service centres – “Samadhan Kendras” which are the specialised centres (CHCs ) equipped with various kinds of modern agro machinery used for all field practices.
• A private sector supplier of agriculture goods and services uses a combination of library model and radio taxi model to provide farm equipment services.
• A number of large corporates have been running CHCs for sugarcane harvesting in Madhya Pradesh through a tie-up with the local agro tech service providers.
In addition to standalone CHCs, a number of big private farm equipment manufacturers have also played an active role in this space.
• An Indian multinational recently launched a platform called Trringo that operates on a dual model. The first model is where the franchisee invests in the purchase of the equipment that is rented out and the second is a C2C model where customers who have already purchased the equipment can rent it out to optimise utilisation. Trringo has already expanded its operations to five states since its inception in March 2016. Its penetration has reached upto 50,000 farmers. The effect of this has been three-fold in increasing the accessibility to all farmers, generating employment for tractor operators and creating business opportunities for rural businessmen.
• An Indian engineering company has also started rolling out its pay-per-use model for farm equipment and crop solutions. The roll out for this model has already begun with the goal being pan-India operations which can be rolled out across other countries at a later stage.
Government sector: The NMAM (National Mission on Agricultural Mechanisation) was introduced by the Department of Agriculture, Cooperation and Farmers Welfare to restructure and streamline agricultural development with regard to modern mechanisation. In its 12th plan, the NMAM has identified the following interventions:
• Establishment of farm machinery banks for Custom Hiring.
• Establishing hi-tech and high productive equipment centres.
• Enhancing farm productivity at village level by introducing appropriate farm mechanisation in select villages.
• Creating ownership of appropriate farm equipment among small and marginal farmers in eastern and north eastern regions.
The advanced mechanisation will be promoted through training, testing and demonstration. The plan includes financial assistance, post-harvest technology management, establishment of farm machinery banks, etc. The proposed budget for this mission in its 12th year is USD 527 million and it aims to improve the productivity of food grains in India.
32 Mechanisation - Key to higher productivity to double farmers’ income

Role of technology in farm mechanisation
The increased adoption of technology can be witnessed across leading sectors in India and agriculture is no different. Farm productivity can be largely attributed to technological advancements by enabling farmers with knowledge about best practices in farming, predicting weather conditions, assessing soil conditions, predicting yield, prioritising crop sowing and cultivation and everything else that can contribute to increased yield.
Today, technology is offering an array of possibilities across different agriculture operations. For example, laser land levelling technology is used to level bigger fields and it is an important operation for good agronomic, soil and crop management practice. There are other technologies such as zero-tillage, raised bed planting, residue management, precision agriculture, micro-irrigation, mulching, etc. which have resulted in an increase in farm mechanisation in India. Select examples of the same are mentioned below:
• An Indian multinational is developing India’s first driver-less tractor which would plough farm fields without human intervention. These driverless tractors are expected to bring another revolution in India’s labour-intensive farming sector.
• India’s first and largest integrated portal on agriculture is a website which acts a medium for farmers to buy seeds, saplings, and farm machinery. This is the first and largest integrated portal on agriculture in India which provides all information on crops, government schemes, products and services at one place.
• An agriculture start-up provides technology and expertise needed to create a smarter and safer food supply for consumers around the world. The company is benefitting more than 5,00,000 farmers through digital technology and is managing over 1 million acres of farmland with IoT (Internet of Things) based mobile application.
• An agro tech enterprise and the second largest micro-irrigation player in the world offers a wide range of irrigation based products such as drip irrigation, sprinkler irrigation, plumbing systems etc. The company has brought revolution in the Indian irrigation system with the help of latest technology which uses cutting-edge research and development to save water and increase the crop yield.
Innovation in farm machinery sector will drive the next phase of agricultural growth in the country. Up until now, the tractors and power tillers have witnessed a significant progress in terms of production and indigenisation of technology. Leading agriculture equipment manufacturers are increasingly striving to provide innovative, cost-effective, and high-quality services to their consumers. Majority of agriculture equipment manufacturers are focusing on integrating the various technologies including robotic systems, GPS, and Google Earth navigation systems to improve their equipment productivity and to stay competitive. Equipment manufacturers have either developed their in-house R&D centres or have entered into joint ventures with advanced countries for upgrading technology, catering to farmers with technologically advanced machines:
Mechanisation - Key to higher productivity to double farmers’ income 33
6 Source: NASSCOM
Technology is driving farm mechanisation
• Big Data offers a huge potential to various touch points on farms including selection of right agriculture-inputs, monitoring the soil moisture, tracking prices of markets, controlling irrigations, finding the right selling point and getting the right price. For example,an international equipment manufacturer uses big data technology to step into the future of farming. It uses sensors in its equipment to help farmers manage their fleet and to reduce downtime of their tractors. The data is combined with historical and real-time weather data, soil conditions, crop features and other data sets and presented on digital platforms. The information helps farmers decide on which crops to plant, where to plant, when to plough, where the best return will be made and other cropping-related decisions. Big data is a key driver of the progress made in cutting-edge technological interventions in farming such as precision agriculture and automated farm machinery operations. Large farmers in India are now deploying Precision Farming techniques that use field sensors to monitor farming operations.
• Artificial Intelligence (AI) include creation of computers and software capable of intelligent behaviour. This helps create self-learning algorithms and capabilities, and helps automate on-ground agriculture practices. A number of farm operations including sowing, ploughing, fertiliser spray, harvesting, weeding and post-harvest will be done via applications and processes developed around AI. As of now, the technology is at a nascent stage and with time and capital investment, all modern-day farm operations will be automated, leading to an increase in efficiency and reduction in production cost.
• Internet of Things (IoT): The IoT technology include Robotics, Drones, GPS and Remote Sensing Technologies and Computer Imaging. These low-cost sensors will helps determine soil conditions, groundwater levels, determine NDVI, Chlorophyll Index and highlights crop stress in time. There are around 280 start-ups in IoT space in India, out of which nearly 40 are focusing on smart agriculture solution. The adoption of IoT devices in agriculture will be a boom for the Indian agriculture industry. It can reap benefits of the huge potential of IoT driven solutions to improve supply chains and farming practices.
34 Mechanisation - Key to higher productivity to double farmers’ income

Section III: Key factors driving farm mechanisation in India
Mechanisation - Key to higher productivity to double farmers’ income 35
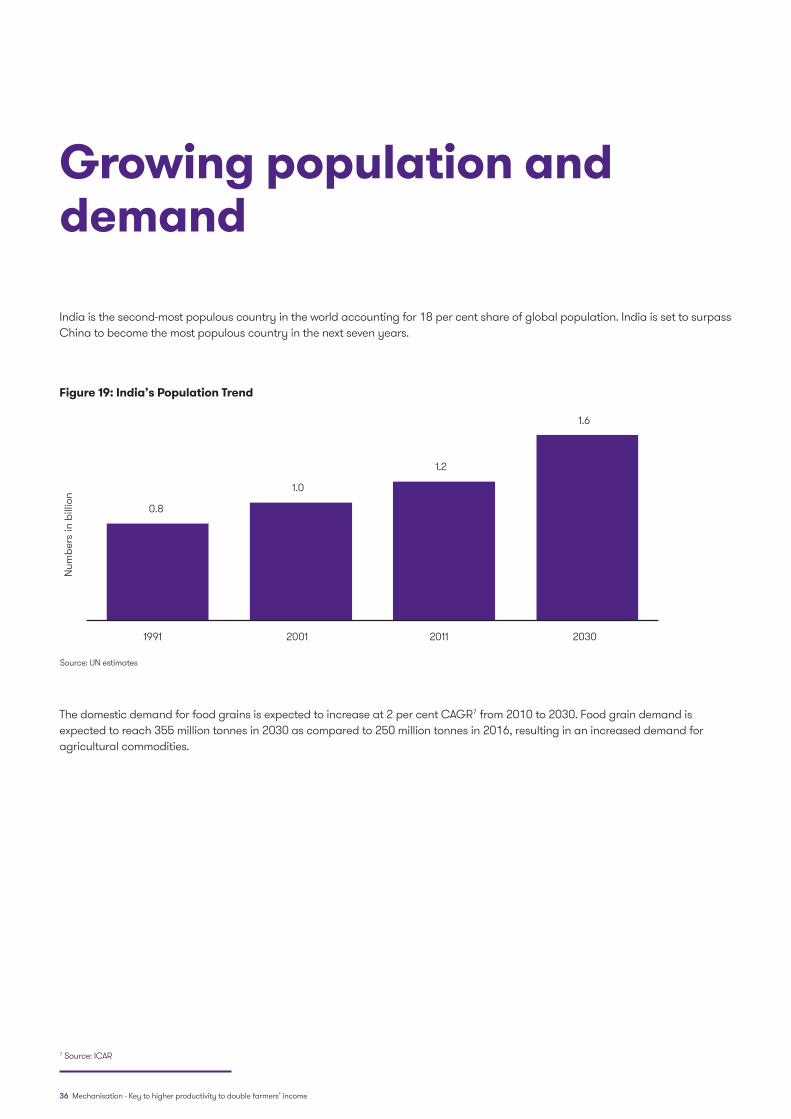
Growing population and demand
India is the second-most populous country in the world accounting for 18 per cent share of global population. India is set to surpass China to become the most populous country in the next seven years.
The domestic demand for food grains is expected to increase at 2 per cent CAGR7 from 2010 to 2030. Food grain demand is expected to reach 355 million tonnes in 2030 as compared to 250 million tonnes in 2016, resulting in an increased demand for agricultural commodities.
7 Source: ICAR
Source: UN estimates
0.8
1.0
1.2
1.6
1991 2001 2011 2030
Num
bers
in b
illio
n
Figure 19: India’s Population Trend
36 Mechanisation - Key to higher productivity to double farmers’ income

Increase in agriculture productivity
A growing number of farmers in India are getting familiar with different techniques and farming equipment that are resulting in increasing farm yields. The greater adoption of farm equipment is evident from the fact that the sale of tractors increased from 0.35 million units in 2007 to 0.57 million units in 2016, witnessing growth at a CAGR of 5.5 per cent during 2007-16. In addition, the government has introduced various schemes and policies such as SMAM related to farm mechanisation that puts greater emphasis on the optimal utilisation of resources to improve agriculture yields.
The yield of farmlands producing food grains has improved from 522 kg/hectare in 1951 to 2,098 kg/hectare in 2014, growing at CAGR of 2.2 per cent for the period. The growth in the number of farming population moving towards mechanisation will lead to an increase in the demand for modern machines and equipment in the coming years.
Source: Ministry of Agriculture, Industry reports
Figure 20: Increase in yield per farm
522
2,098
1951 2014
Yiel
d pe
r far
m(k
g/he
ctar
e)
Mechanisation - Key to higher productivity to double farmers’ income 37

Increase in agriculture exports
India is one of the largest producers of agricultural products such as rice, sugarcane, tea, mangoes, tobacco, cotton, etc. The nation has witnessed an unprecedented growth in farm output that has helped it to transform itself from being import dependent to selfsufficient in food grains exports. As a result, agriculture export contribution has increased from 8.5 per cent in 2010 to 12.3 per cent in 2015, meeting external demand of countries such as the Middle East, Australia and China, among others.
It is expected that the export demand of Indian agricultural products is likely to reach USD 45 billion in 2020 as compared from USD 32 billion in 2016, growing at a CAGR of 8.8 per cent. The demand growth from the external market will boost the Indian farming sector, resulting in an increase in the demand for various farm equipment to meet the growing demand for exports.
Source: Ministry of Commerce, World Trade Organisation, IBEF
32
2016 2020
(USD
bn)
45
Figure 21: Agriculture exports (USD bn)
38 Mechanisation - Key to higher productivity to double farmers’ income

Labour migration and shortage
Despite a growing economy, the percentage share of agricultural workers to total workforce in India has declined from 59.1 per cent in 1991 to 54.6 per cent in 2011, although it is still a significant proportion of the total population of India. As of 2016, the share has further declined to 48.9 per cent. On the other hand, the share of total workforce to total population has grown to 40 per cent in 2011 from 37 per cent in 1991. It is expected that the ratio will further grow to 43 per cent by 2020 and 49 per cent by 2030.
There are various factors contributing to the decline in workforce depletion. Higher income and growth opportunities in other sectors, and relatively lower wage growth in agricultural sector have led to the migration of workforce away from agriculture. The ratio of agriculture labour to total workforce is expected to decline to 25.7 per cent by 2030, leading to severe farm labour shortage.
The emerging trend of declining agriculture labour to total work force can pose a serious threat to the overall sector’s productivity, income level and standard of living of Indian farmers. Technology and machines will be key solutions to the problem of growing shortage of labour as it saves time, money and gives higher yield. According to industry experts, farm mechanisation can improve agriculture production and rescue the sector from facing harmful effects labour shortage.
The intensity or impact of labour shortage varies across different crops and states in India. Productivity of a few crops is highly impacted by the shortage of labour.
Rice and wheat are labour intensive crops, which comprise nearly 70 per cent of agricultural production by cultivable area in India. There are other crops such as cotton, sugarcane and groundnut, which are also highly impacted by farmer’s’ scarcity in India.
Currently 5.5MT of sugarcane is produced across various parts of India. There are a number of operations from preparatory tillage to harvesting which require an average of 260 to 290days of human labour without any use of machines. Harvesting activities consume over 35-40 per cent of the labour requirement, followed by 15-20 per cent time which is required for planting activities. However, the human demand for labour is higher in tropical than sub-tropical states. Tractors with 30-35 HP have become a critical source to perform almost all operations in fields.
Source: Vision 2050 Document of Central Institute of Agricultural Engineering, Bhopal, 2015
313.7
402.2
481.7
566.0
787.0
59% 58%55%
41%
26%
0%
20%
40%
60%
0
200
400
600
800
1991 2001 2011 2020 2030Ag
ri la
bour
to to
tal w
orkf
orce
Wor
kfor
ce in
mill
ion
Total workers Agricultural workers’ share
Figure 22: Total workers and agricultural workers share
Mechanisation - Key to higher productivity to double farmers’ income 39

Rice is cultivated on a total land of over 40 million hectares and is another important labour intensive crop, which requires 850 to 900 man hours for cultivating across a number of states. Transplanting, weeding and harvesting activities consume majority of the labour requirement. Nearly 40 per cent of the total labour man hours is required for the transplanting activity, followed by 20 per cent each for weeding and harvesting activities. In addition, the demand for labour is higher during peak periods that adversely affects the timeliness and overall productivity. According to industry experts, rice demand is expected to grow from 100 MT in 2015 to 120 MT by 2020. With declining natural resources, declining input efficiency and growing labour shortage the target of 120 MT seems to be a little daunting.
Wheat is a staple food crop in India occupying 31.0 million hectares of land. This accounts for 3.5 per cent of the global wheat production. The entire process of wheat cultivation requires 425 to 475man hours. Mechanisation in wheat cultivation greatly impacts the overall productivity. The use of machines like the deep plough have proven to increase productivity by 23 per cent. It usually takes 15 days through manual labour to perform harvesting and threshing wheat in one acre of land.
Cotton is cultivated on a total land of over 9 million hectares in the country and requires 800 to 900 man hours for cultivation across India. However, the human demand for labour is higher in tropical states than sub-tropical states. Transplanting, weeding, irrigation and harvesting activities consumes majority of the labour requirement for the cotton production in the country.
Groundnut is the kingpin among oilseed crops in India, occupying around 9 million hectare of land that accounts for a total of 8.2 tonnes of oil seeds (55 per cent of the total production). The yield as well as the area of land under cultivation are the largest in the world. The harvest consists of three main steps – lifting, shaking and threshing. Usually one hectare of groundnut can be harvested by 12-14 labourers in one day. Weeding, irrigation and harvesting activities consume majority of the labour requirement for the groundnut production in the country. Leftover pods from a harvest are the biggest threat to the subsequent yields as the presence of pods can decrease the next yield by over 20 per cent. Mechanisation will not only help in this task, but it will drastically reduce time and increase yield.
Labour-use in major crops in India
Labour -use in major crops in India
Crops produced(FY 2016) Production (MT) Production land
Ha (MT)Avg. Man hours required per Ha
Avg. man days requiredper Ha
Avg. machine labour cost range (% of Op. Cost)
Critical opera-tions
Sugarcane 352.2 5.5 1700-1900 260-290 3-10% - Planting- Harvesting
Wheat 93.5 31.0 425-475 40-60 22-25% - Harvesting - Threshing
Rice 104.0 40.0 900-1000 100-135 10-15%-Transplanting-Weeding - Harvesting
Groundnut 6.9 9.0 600-750 70-90 8-10%-Weeding & Irri-gation- Harvesting
Cotton 30.0 9.0 800-900 90-120 6-10%
- Weeding & Irrigation - Transplanting- Harvesting
40 Mechanisation - Key to higher productivity to double farmers’ income

Crops Land preparation, Sow-ing and Transplanting
Weeding, Fertiliser ap-plication and Irrigation Other activities Harvesting
Sugarcane
Rice
Groundnut
Cotton
Note: Colors represents men days to perform an operation (Per Ha)
< 25 days 25-50 days 50-75 days >75 Days
• Andhra Pradesh, Madhya Pradesh, Maharashtra and Uttar Pradesh have highest area under cultivation of the above mentioned five crops.
• Punjab, West Bengal, Orissa, Gujarat, Bihar, Chhattisgarh fall in the second category in terms having a large quantity of cultivated land producing these five key crops.
• The demand for human labour for performing an agriculture operation could be higher or lower between tropical and sub-tropical states in the country.
During 2004-12,around 29 millionpeople decreased from the agricultural workforce across India, despite an increase in size of total workforce.
Key states with higher impact of labour shortages:
Uttar Pradesh
Karnataka
West Bengal
Bihar
Rajasthan
Others
27.7%
15.3%
12.1%11.9%
11.6%
21.3%
Figure 23: State-wise share in agri labour reduction (2004-12)
Source: ICAR
Mechanisation - Key to higher productivity to double farmers’ income 41

In terms of absolute decline in agriculture labour, Uttar Pradesh, Karnataka and West Bengal were the top three states, which had together contributed to over 55 per cent of the total decline in the agriculture workforce during 2004-12.
• More than one fourth of total agriculture workforce decline was recorded from Utter Pradesh only, followed by over 15 per cent from Karnataka, and 12 per cent from West Bengal.
• States such as Uttar Pradesh, Maharashtra, Andhra Pradesh, Punjab, Madhya Pradesh and West Bengal have substantial coverage under labour intensive crops and have also faced a considerable decline in labour availability. These states have a high propensity to face labour challenges going ahead and require immediate attention.
• Kerala experienced the largest shift (around 37 per cent) in labour from agriculture, followed by Uttarakhand (34 per cent) and Karnataka (27 per cent)
Amid growing demand and area under cultivation, the labour plays an important role for the development of such crops. With growing labour shortage and labour cost, the use of farm equipment will become highly important to improve productivity, reduce cost of production and improve profitability.
The demand for farm equipment will be growing due to increasing gap between labour demand and supply, however, the elasticity will be different for different states and different crops. In other words, the demand for agriculture equipment will be driven by states and crops with the highest level of labour migration. The overall labour shortage across India will contribute to the growth of the farm equipment market at a CAGR of 7.5 per cent during 2017-2022.
Source: ICAR
37%34%
27% 26%24% 24% 24% 23% 23%
21% 20% 20%17%
14%
8%
0%
5%
10%
15%
20%
25%
30%
35%
40%
Kerala
Uttarakhand
Karnataka
Jamm
u & Kashmir
Haryana
Jharkhand
West Bengal
Assam
Tamil N
adu
Gujarat
Rajasthan
Uttar Pradesh
Bihar
Orissa
Madhya Pradesh
Figure 24: State-wise change in workforce (2004-2012)
42 Mechanisation - Key to higher productivity to double farmers’ income

Increase in labour cost
Labour wages account for more than half of the total variable cost of crop production. Agricultural wages have witnessed high growth in recent years due to robust economic growth, increase in minimum wages and government employment generation schemes. For example, The Mahatma Gandhi National Rural Employment Guarantee Act 2005 (MGNREGA) has put pressure on rising agriculture-related costs.
The average daily wage price in agriculture operations has witnessed a CAGR growth of 21.1 per cent for female workers and around 20.0 per cent for male workers in the last six years (2007-14). The rise in the average wage rates can also be examined by various agriculture operations.
Source: Indiastat
Source: Indiastat
11.9%11.8%
12.3%
11.9%
12.7%
13.1% 13.0%
12.4%
12.8%
13.5%
13.1% 13.0%
12.6%12.7% 12.7%
13.4%
Ploughing Sowing Weeding Transplanting Harvesting Winnowing Threshing Picking
CAG
R (2
003-
13)
Men Women
Figure 26: Average annual wage rate increase by activities (2003-13)
Figure 25: Average Daily Wage Rate in Agricultural Operations(INR)
78 89104
124149
176
232
58 6680
97117
139
183
2007-08 2008-09 2009-10 2010-11 2011-12 2012-13 2013-14
Male Workers Female Workers
Mechanisation - Key to higher productivity to double farmers’ income 43

Average annual wage rise for men: 2003-13
• Agriculture labour by men has witnessed an average annual wage increase of 12.4 per cent across various operations.
• The highest wage rise (men) of around 13 per cent per annum was recorded in winnowing, threshing and harvesting activities during 2003-13.
Average annual wage rise for women: 2003-13
• The women agriculture labour has witnessed an average annual wage increase of 13 per cent across various operations.
• The highest wage rise (women) of around 13.5 per cent per annum was recorded in sowing, weeding and picking activities during 2003-13
With growing employment opportunities in other sectors, people will be moving from rural to urban and agriculture to non-agriculture sector areas. These trends will reduce the supply of agriculture labour and will push the labour wages and overall cultivation cost of a farm product. Farm mechanisation will be seen as a key measure to substitute labour and improve profitability in India. Hence, growing labour cost per hectare would increase the demand for farm machines and equipment, and it will lead to an increase in mechanisation rate in the country.
44 Mechanisation - Key to higher productivity to double farmers’ income

Better stubble management
Stubble is defined as plant residue (aboveground) left in the field after a harvest. In conventional farming systems, stubble can be mulched, slashed or left standing.
In India, especially in the northern farming regions, i.e. Haryana and Punjab, the stubble is often burnt after the harvest of crops like wheat and straw, usually in the months of October and November. The reasons behind burning stubble to clear residue are:
• It is quick to clear vast areas of land and is very cheap
• It kills weeds that are often resilient to certain herbicides
• It kills pests that are resilient to pesticides
• It can possibly reduce nitrogen tie-ups
It is estimated that 35 million tonnes of stubble is burnt in the two states of Haryana and Punjab to make room for the winter crop. This practice has been severely regulated globally. In fact, this has been banned in Europe for over 15 years due to its vast negative impacts, especially with regard to pollution.
Stubble burning contributes anywhere between 12 per cent and 60 per cent of the pollution in New Delhi and the national capital region. While this practice has been banned by the National Green Tribunal (NGT) in 2015, the implementation has turned out to be exceedingly challenging. As of October 2017, over 1000 cases of stubble burning have been reported and despite avid protests the number is expected to rise significantly before the winter crop is planted.
One tonne of stubble burning releases:
SO2 2 Kg
Particulate Matter (PM) 3 Kg
CO 60 Kg
CO2 1460 Kg
Ash 199 Kg
In Europe and other developed countries, alternatives are being implemented to prevent widespread pollution due to stubble burning. The most widely suggested alternative was crop rotation, however, the modernisation of machinery provided more and better alternatives. Machines like the Stubble Management System, that increase the height of the stubble to make it easily removable by the machine, have helped farmers working in Germany reduce harvest costs by up to USD 43 per hectare by increasing the stubble height to 35 cm. In Canada, the development of new seeding equipment is specifically designed to plant seeds despite the presence of residue is gaining popularity. In India, dry fermentation of paddy stubble to produce biogas and biochar has been promoted, but it failed to attract farmers.
Usage and knowledge of advanced machinery can help Indian farmers overcome the negative effects of stubble burning. The non-availability of stubble management, reluctance shown by farmers, costly straw management equipment and the extra time required for proper disposal of stubble, contribute to stubble burning and mechanisation of farms can help in controlling this to a great extent.
Mechanisation - Key to higher productivity to double farmers’ income 45

Section IV: Government’s role in farm equipment sector
46 Mechanisation - Key to higher productivity to double farmers’ income

Overview of schemes and policies
GoI has a multitude of missions, which directly or indirectly work towards increasing farm mechanisation in India. These missions have specific schemes and policies, which offer many incentives and assistance at various levels to promote farm mechanisation.
Farm mechanisation would also play an important role in realising the government’s vision of doubling farmers’ income. Currently, public investment towards this is below national average in numerous states. In order to double farmers’ income by 2022-23, an additional investment of USD 98 billion is required from both public and private sectors. Reduction in post-harvest losses, integrating the value chain and securing investments from foreign corporates would help in transforming the food economy and assist in achieving the goal of doubling farmers’ income. Companies in the private sector have launched programmes aimed at increasing farmers’ knowledge about mechanisation which will lead to increased productivity.
Sub-Mission on Agricultural Mechanisation(SMAM) under the Ministry of Agriculture was started in 2014-15. This scheme is implemented in all the states to promote the usage of farm mechanisation and increase the ratio of farm power to cultivable unit area up to 2.8 kW/hectares by 2022 under its new 7-year plan.
SMAM is a sub-mission under National Mission on Agricultural Extension and Technology and enlists 8 components under it ranges from promoting agricultural mechanisation through training, testing and demonstration to providing financial assistance to farmers to help them procure agricultural machinery and equipment.
Among the states, farm power availability in Punjab, Haryana, Western Uttar Pradesh and Western part of Rajasthan is higher than the national average of 1.84 kW/hectares. In rest of the country, especially in Eastern and North-Eastern regions, it is significantly lower which necessitates promotion of farm mechanisation as a special mission.
This sub-mission will operate along with a line of other policies and schemes, which have different parts dedicated to farm mechanisation. Rashtriya Krishi Vikas Yojana (RKVY), Mission for Integrated Development of Horticulture (MIDH), National Mission on Oilseeds and Oil Palm (NMOOP) and National Food Security Mission (NFSM)will work in tandem with SMAM.
Capacity building and training are an essential part of the sub-mission because they aim at sustainability and ensure proper utilisation of the technology to maximise productivity, thereby increasing returns for farmers.
States with low mechanisation like the north-eastern states and others need special attention and had been neglected before the implication of the sub mission. SMAM aims to promote farm machinery and equipment in these states and has incorporated it as a component of the sub-mission.
9http://agricoop.nic.in/sites/default/files/SMAM%20%282%29_1.pdf
Mechanisation - Key to higher productivity to double farmers’ income 47

Source- National Portal on Mechanisation and Technology.
A total of USD 67 million worth of funds have been released for the year 2017-18 till 20/09/2017 with the state distribution as shown in the graph above.
The 7-year plan which ranges from 2016-17 to 2021-22 implemented from August, 2017 has defined new targets for the sub-mission
• Farm Power availability of 2.8 kW/hectares to be achieved by 2022 from the existing level of 2.02 kW/hectares in 2016-17.
• 1,48,000 trainees to be trained to develop skilled manpower in farm mechanisation sector.
• 10,270 agricultural machineries to be tested.
• 2,80,000 CHCs to be established at the village level.
• 19,000 demonstrations to be organised on farmer fields.
• 19,00,000 numbers of farm machinery to be distributed under SMAM.
• 8 new Farm Machinery Training and Testing Institutes (FMTTIs) to be established in addition to the existing 4.
• 2,00,000 beneficiaries to be benefitted from distribution of farm machinery for individual ownership in north-eastern and Himalayan region.
Going Digital
National Portal on Mechanisation and Technology is an active online portal developed and launched by Department of Agriculture to help farmers across the country to get acquainted with and apply for all types of schemes and subsidies they are eligible for.
Online booking for farm equipment testing, financial assistance application and other numerous facilities can be directly accessed by farmers even in remote villages.
Portals are also separately available and functional for state level schemes and policies under SMAM and other missions like RKVY, MIDH, NMOOP and NFSM which allow aid and subsidies for farm mechanisation across all crop types, ranging from cereals, horticulture crops to oilseeds as per their functional guidelines and regulations.
Figure 27: State-wise allocation of funds under SMAM in 2017-18 (in USD Mn)
- 2.00 4.00 6.00 8.00
10.00
Andh
ra P
radd
esh
Arun
acha
l Pra
ddes
h
Assa
m
Biha
r
Chh
attis
garh
Guj
arat
Har
yana
Him
acha
l Pra
ddes
h
Jam
mu
& Ka
shm
ir
Jhar
khan
d
Karn
atak
a
Kera
la
Mad
hya
Prad
desh
Mah
aras
htra
Man
ipur
Meg
hala
ya
Miz
oram
Nag
alan
d
Oris
sa
Punj
ab
Raja
stha
n
Sikk
im
Tam
il N
adu
Tela
ngan
a
Trip
ura
Utta
r Pra
desh
Utta
rakh
and
Wes
t Ben
gal
5.3
0.41.5
4.6
1.0
6.9
1.40.3 0.1
4.6
0.7
6.6
2.6
0.4 0.1 0.51.7
3.6
7.4
1.30.2
3.5
1.5 1.2
7.6
0.51.5
48 Mechanisation - Key to higher productivity to double farmers’ income
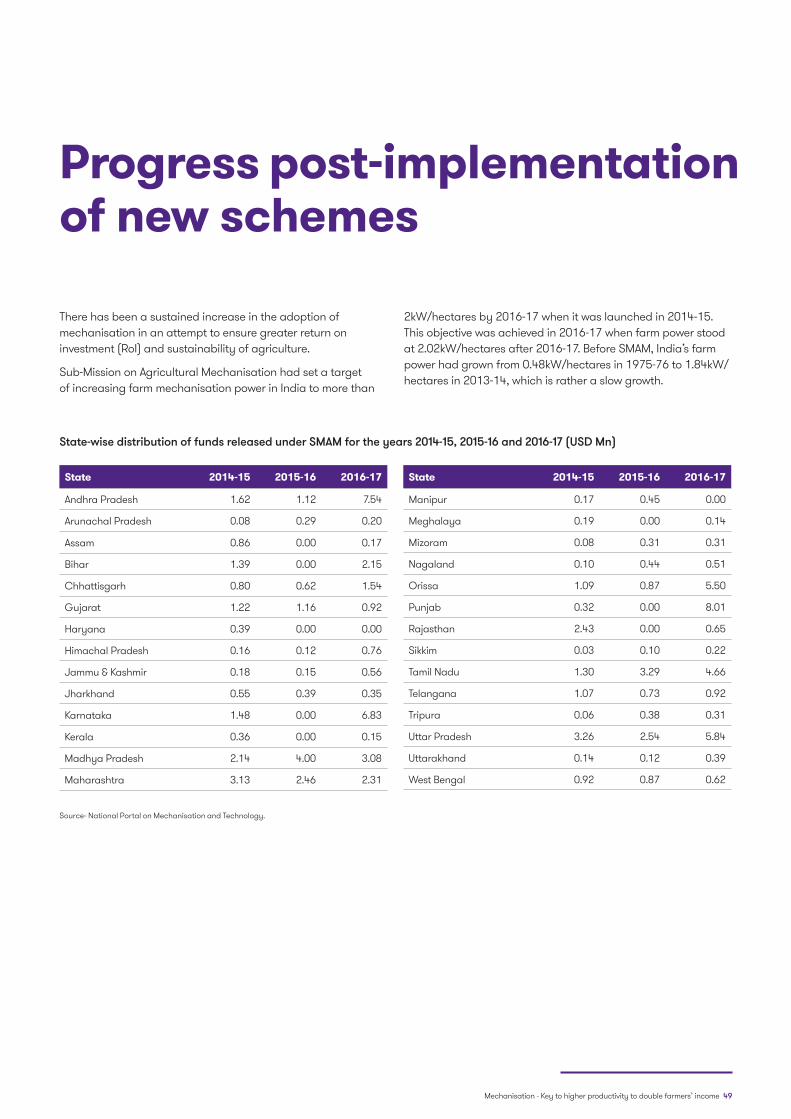
State 2014-15 2015-16 2016-17
Andhra Pradesh 1.62 1.12 7.54
Arunachal Pradesh 0.08 0.29 0.20
Assam 0.86 0.00 0.17
Bihar 1.39 0.00 2.15
Chhattisgarh 0.80 0.62 1.54
Gujarat 1.22 1.16 0.92
Haryana 0.39 0.00 0.00
Himachal Pradesh 0.16 0.12 0.76
Jammu & Kashmir 0.18 0.15 0.56
Jharkhand 0.55 0.39 0.35
Karnataka 1.48 0.00 6.83
Kerala 0.36 0.00 0.15
Madhya Pradesh 2.14 4.00 3.08
Maharashtra 3.13 2.46 2.31
Progress post-implementation of new schemes
There has been a sustained increase in the adoption of mechanisation in an attempt to ensure greater return on investment (RoI) and sustainability of agriculture.
Sub-Mission on Agricultural Mechanisation had set a target of increasing farm mechanisation power in India to more than
2kW/hectares by 2016-17 when it was launched in 2014-15. This objective was achieved in 2016-17 when farm power stood at 2.02kW/hectares after 2016-17. Before SMAM, India’s farm power had grown from 0.48kW/hectares in 1975-76 to 1.84kW/hectares in 2013-14, which is rather a slow growth.
State-wise distribution of funds released under SMAM for the years 2014-15, 2015-16 and 2016-17 (USD Mn)
Source- National Portal on Mechanisation and Technology.
State 2014-15 2015-16 2016-17
Manipur 0.17 0.45 0.00
Meghalaya 0.19 0.00 0.14
Mizoram 0.08 0.31 0.31
Nagaland 0.10 0.44 0.51
Orissa 1.09 0.87 5.50
Punjab 0.32 0.00 8.01
Rajasthan 2.43 0.00 0.65
Sikkim 0.03 0.10 0.22
Tamil Nadu 1.30 3.29 4.66
Telangana 1.07 0.73 0.92
Tripura 0.06 0.38 0.31
Uttar Pradesh 3.26 2.54 5.84
Uttarakhand 0.14 0.12 0.39
West Bengal 0.92 0.87 0.62
Mechanisation - Key to higher productivity to double farmers’ income 49

The number of tractors and power tillers sold per year serve as a viable marker to assess the growth of farm mechanisation levels in India as they are the preferred and first choice of a farmer who is embracing farm machinery. Also, because they serve as
the most important and versatile tools in farm mechanisation. GoI has implemented a variety of programmes and schemes to promote farm mechanisation throughout the country over the years.
Farm Mechanisation Programmes under various agriculture scheme
Financial assistance in the form of subsidy at the rate of 25-40 per cent under RKVY, NFSM, NHM, and NMOOP has been provided as per guidelines of SMAM to the farmers for individual
ownership of agricultural equipment including hand tools, bullock- drawn and power-driven equipment, planting, reaping, harvesting and threshing equipment, tractors, power-tillers and other specialised agricultural machines.
Figure 28: Year-wise sale of tractors and power tillers in India from year 2004-05 to 2015-16
Source- Department of Agriculture, Cooperation & Farmers Welfare
247531296080
352835 346501 342836393836
545109 535210590672
696828
551463 571249
0
10000
20000
30000
40000
50000
60000
70000
0
100000
200000
300000
400000
500000
600000
700000
800000
2004-05 2005-06 2006-07 2007-08 2008-09 2009-10 2010-11 2011-12 2012-13 2013-14 2014-15 2015-16
Tractor Sales (numbers) Power Tiller Sales (numbers)
The sum total of the released funds under SMAM for the years 2014-15. 2015-16 and 2016-17 (in USD million)is 165.87, 132.57 and 355.25, respectively. This amount has been further extended to USD 88.8 million for the year 2017-18 owing to both, the government’s increasing interest in promoting farm mechanisation and also the states’ response and progress achieved via the use of these funds. This establishes an overall increasing pattern of funds directed towards the farm mechanisation schemes.
50 Mechanisation - Key to higher productivity to double farmers’ income

Training of farmers and technicians
Training different categories of beneficiaries like farmers, technicians, under-graduate engineers, entrepreneurs and the foreign nationals (who get nominated under international exchange treaty) on topics ranging from selection, operation, maintenance, energy conservation to management of agricultural equipment has also been a major part of the
schemes. The government has exceeded the annual target of beneficiaries to be trained for the past two years. This is indicative of the importance laid down on increasing trained manpower and increased interest in ensuring smooth functioning and maximising efficiency of mechanised farms by the government.
Beneficiaries trained and targets set for the years 2015-16 and 2016-17.
Year Actual Target
2015-16 7545 6000
2016-17 7801 6000
The target set for the number of beneficiaries to be trained at FMTTIs was surpassed in the past two years
Source- Department of Agriculture, Cooperation & Farmers Welfare.
North eastern states which have low levels of farm mechanisation as compared to the Indian average have been a focus point in SMAM.
During 2015-16, total 934 trainees were trained at FMTTI, Biswanath Chariali, Assam against the target of 800 and tested 36agricultural implements and machinery against the annual target of 25. During 2016-17 (till December 2016) total 788 trainees were trained against the target of 800 and tested 22 implements and machinery against the annual target of 25.
To support the agricultural mechanisation in north eastern states where the mechanisation level is very low, the maximum permissible subsidy per machine per beneficiary is provided at 50 per cent limited to INR 1.25 lakh.
For procurement of various agricultural machinery and equipment for individual ownership, subsidy is given at 95 per cent of the cost of the machinery/implement up to INR 10 lakh per farm machinery. Farm Machinery Banks with a minimum of 8-10 farmers respectively is also provided to support these states.
10. http://agricoop.nic.in/sites/default/files/Annual_rpt_201617_E.pdf
Mechanisation - Key to higher productivity to double farmers’ income 51

Impact of GST Act on farm equipment sector
GST is an indirect tax levied on the supply of goods and services. It is a comprehensive, multi-stage, destination-based tax that will be levied on every value addition. The idea of GST was conceived in 2010 and its implementation took 7 years.
The GST Act was passed in the Lok Sabha on 29 March, 2017, and came into effect from 1st July, 2017. The GST law has replaced many indirect tax laws that previously existed in India, eliminating the cascading effect of taxes caused before GST and a decrease in overall prices of the goods.
It has impacted every industry, goods and services since it was announced and the Act is under constant tweaking to arrive at a tax system which not only benefits the people, but streamlines functioning across every level.
GST has a slab based system whereby every good or service will be assigned a Harmonised System Nomenclature code (HSN) number which is an internationally adopted commodity description and coding system. The HSN number will serve all purposes for transaction. It will directly link the goods or services to the tax slab it has been categorised into automatically according to the government and the taxpayer does not need to know the tax slab.
GST slabs are pegged at 0%, 5%, 12%, 18%and 28% with every good and service falling in either of the five slabs. GST has three component taxes- CGST, SGST, IGST.
Central Goods and Service Tax (CGST): Collected by the Central Government on an intra-state sale.
State Goods and Service Tax (SGST): Collected by the State Government on an intra-state sale.
Integrated Goods and Service Tax (IGST): Collected by the Central Government for inter-state sale.
Online system for tax filing makes the procedure simpler and increases efficiency while decreasing possibility of instances of tax avoidance.
A sector like agriculture that is highly sensitive to changes in its economical or physical stimuli has been greatly affected by GST and in turn, affected its allied sectors as well.
The farm equipment sector which, was earlier untouched by many taxes, upon arrival of GST found itself placed in the 28% slab which caused a lot of stir and caused huge decrease in returns for farmers. The government took note of it in time and realigned the farm machinery sector to fall under 12% slab.
52 Mechanisation - Key to higher productivity to double farmers’ income

The following table illustrates the various farm machinery and equipment with the allocated tax slabs
S.No. Type of Farm Equipment GST Slab allotted
1 Combine Harvester- Threshers
12%2 Tractors
3 No-till direct seeders, planters and transplanters
4 Tractor ploughs and Disc ploughs
5 Refrigerated farm tanks 28%
6 Combs for cotton textile
18%7 Construction services of harbours, waterways, dams, water mains and lines, irrigation and
other waterworks
8 Turbo-jets, turbo-propellers and other gas turbines turbo-jets
9 Hydraulic turbines, water wheels and regulators
Although, in states like Punjab where people enjoyed zero tax rates till GST on farm equipment, even 12 per cent is a massive increase in prices.
GST has been rolled out across the country and is a uniform tax system, the farmers cannot take advantage of inter-state price differentials since they do not exist anymore.
Fertilisers and pesticides, too, have been affected by GST and are now placed in the 18 per cent tax slab as compared to the 5 per cent VAT applicable on earlier. The good part is: These commodities will not be taxed again while passing state boundaries to be utilised in another state away from state of manufacturing.
Agriculture as an entire sector is likely to benefit from the implementation of GST due to smoothening of supply chain segments and creation of uniform markets nationwide in the long run. For the short term, although, the input prices (pesticides, fertilisers, machinery and seeds) are likely to increase, while the prices of finished products (grain, fruits, vegetables and milk etc.) are likely to fall as they are tax-free commodities placed in the 0 per cent segment, thereby driving down the revenues generated by the farmer.
Mechanisation - Key to higher productivity to double farmers’ income 53

Section V: Global benchmarking
54 Mechanisation - Key to higher productivity to double farmers’ income

Global Farm Equipment Market
The global agriculture and farm equipment industry is estimated at USD 161.5 bn in 2016 and is expected to grow at a CAGR of 8.6 per cent during 2017 to 2022 and reach USD 263.2 bn in 2022. On the other hand, the Indian farm equipment industry is expected to grow at a CAGR of 6.6 per cent during 2017 to 2022 and reach USD 11.8 bn in 2022.
Source: GT analysis, Industry reports
Governments across the world are trying to focus on increasing food productivity thus, the demand for agricultural equipment with modern technology is also expected to rise as machinery with better technology will help in increasing yield.
• Tractors and harvesters are the two largest agriculture equipment categories. The growing demand for farm tractors and harvesting equipment is expected to spread further mechanisation in the next five years.
• A substantial growth of harvesting machinery is expected to be seen from the Asia-Pacific region including China and India. This increase in demand is due to the growth in food consumption owing to the rise in population numbers in this region.
• Other equipment such as cultivating machinery and planting and fertilising machinery are expected to witness a moderate growth.
Figure 29: Global farm equipment market segmentation Figure 30: Global farm equipment market
55.2%
22.3%
8.2%
7.5%6.8%
Tractors
Harvesting equipment
Planting and fertlizingequipment
Plowing and cultivatingequipment
Haying and forageequipment
165
251
9
12
2017 2022
USD
bill
ion
Global (excluding India) India
Mechanisation - Key to higher productivity to double farmers’ income 55

Comparison of India with other countries in terms of mechanisation ratesFarm mechanisation industry in the world is highly dependent on agricultural land and farm output. The agricultural production has a direct impact on the demand for farm equipment.
Source: World Bank, Industry reports, Secondary research
India is one of the largest nations in terms of size of agricultural area that facilitates the development of large-scale agricultural activities. India has nearly 2.4 per cent of the global geographic area and access to more than 4 per cent of total water reserves. The country is considered as an agrarian economy, and the agriculture and allied sector contribute more than 17 per cent to the country’s GDP. In addition, more than 55 per cent of the total population needs to rely on agriculture activities for their economic and social requirements. It is evident that India is ahead of many developed and developing countries in the world in terms of share of agriculture in the GDP.
• North America: The region is ahead of other countries in terms of farm mechanisation. The trend is of using larger and higher horsepower equipment. The agriculture sector is working towards automation of farms using IoT (in agriculture), artificial intelligence and commercial drones.
• Europe: This region has high mechanisation rate as a larger number of agriculture machines are employed per hectare of land. There are a few farmers who use high-powermachines such as high power tractors and long swathe boom sprayers.
Russia
4.7% | 15% | 80%Western Europe
5.0% | 4.0% | 95%
US
1.0% | 3.0% | 97%
Agriculture share in GDP (%) | Pop. engaged in Agriculture (%) | Mechanisation Rate (%)
China
8.6% | 63% | 48%
India
17.4% | 55% | 40%Brazil
5.5% | 17% | 75%
56 Mechanisation - Key to higher productivity to double farmers’ income

• Japan: The agriculture sector in Japan relies on sophisticated and specialised farm equipment and is headed towards technological automation. In the northeast, Japan was the first country to mechanise due to rapid industrialisation immediately after the second World War. The agriculture equipment industry is considered as a strong industry with export to various Asian countries. The agriculture sector in Japan uses more than 500 tractors and 250 harvesters per 1,000 hectares.
• China: Unlike other countries,land ownership in China is held at the state level and farmers can keep control of their land allocations themselves. The country does 48 per cent of farm activities through agriculture machineries and equipment, which is higher than India. The primary equipment used by farmers include tractors, combine harvesters (self-propelled and tractor-mounted), rice trans planters and cotton processing machinery.
• Brazil: With its aging population, the country is rapidly adopting digital technologies and automation within the agricultural sector. It has a large, dynamic and rapidly growing market for agricultural equipment.
• Sub-Sahara Africa: The land productivity in Sub-Saharan Africa region is among the lowest in the world in terms of the agricultural sector. Nearly 80 per cent of agricultural land is cultivated by human power equipment and only 5 per cent with tractors. More than two thirds of the total tractors in Sub-Sahara Africa are found in South Africa and Nigeria, with growing imports from India and China.
• Middle East: The Middle East region has a higher level of mechanisation than Sub-Saharan Africa region. This region has an average number of 11 tractors per 1,000 hectares. However, a large disparity can be seen in the region. For example, the average usage of tractors per 1,000 hectares is 6 in Morocco as compared to 31 in Egypt.
Despite high share of agriculture sector in GDP and employment, the farm mechanisation rate in India is currently prevailing at around 40 per cent. Although, farm mechanisation has witnessed an improvement in the last two decades, there has been a negligible growth of less than 5 per cent during 1995-2015. It is evident that farm mechanisation in India is facing various challenges related to equipment, technology, policy framework and operations. A few key reasons are mentioned below:
• Large share of small and marginal farmers: More than 80 per cent of the total farmers in the country own small and marginal farms which is less than 2 hectares.
• Declining land holding sizes: With continued decrease in average farm size, more farms will fall into the adverse category thereby, making individual ownership of agricultural machinery increasingly unviable.
• High cost of farm machinery: Agricultural machines are capital-intensive. For example,the average price range of a power tiller is USD 480 to USD 2,100. While a tractor will cost USD 7,000 to USD 12,000,a laser land leveller costs around USD 5,800 to USD 6,500.
• Lack of credit: The average rural debt per household in India in 2016 was USD 1,585. Majority of short and medium term loans in rural area carry an interest rate of around 40 per cent per annum. This is a deterrent while buying equipment.
• Other factors including the existing legislation and policy framework. The farm mechanisation sector in India has a complex structural composition.
Mechanisation - Key to higher productivity to double farmers’ income 57

Select Case Studies
Country: Japan
Crop: Lettuce
Organisation: Spread - Techno Farm Keihanna
Factory operation: Winter 2017
Technology adopted: Automated farming
Expected Sales (approx.): USD 8.8 mn
Summary:
In 2007, Japan based company Spread started its indoor vertical farm, Kameoka plant, that produces 21,000 heads or two tonnes of lettuce each day while minimising the use of water and labour. This plant serves as a precursor to Spread’s Techno Farm Keihanna which is slated to be fully operational by 2018.
At this new plant, the company has used advanced automated cultivation that reduces labour by 50 per cent in comparison to the Kameoka plant and reduces water usage for cultivation by an astounding 98 per cent. The farm will use self-developed LED lighting as a substitute for sunlight while reducing energy consumption by 30 per cent in comparison to currently existing LED lighting. Despite the drastic decrease in water usage, labour and energy consumption, the Techno Farm plans to increase its yield to 30,000 heads or three tonnes of lettuce each day. Using this technology, Spread aims to grow its market share to 10 per cent of total lettuce production in Japan by expanding its production and establishing 20 facilities under a franchise model.
Country: France
Crop: Multiple Crops
Organisation: OCEALIA Group
Time duration: 2017
Technology adopted: Drone-based farming
Summary:
The OCEALIA group is a French farming cooperative with 7,200 members and roughly 900 employees. The group has been using 5 drone operators, flying 2 drones (AIRINOV multiSPEC 4C sensor-equipped SenseFly eBee Ag drones) to help farmers collect detailed data on fertilisation and its effect on their crops.
The drones provide aerial crop scouting in combination with data processing and analysis done by AIRINOV and OCEALIA’s complementary controls to provide farmers with fertilisation advice no more than 48 hours after the drones’ flight. The drone uses Airinov’s multi-spec 4C camera to capitulate the amount of dry matter in the field and the level of nitrogen absorption at each stage of the crops development. For instance, it could determine the level of protein needed by the crop during its Z39 (final stage before crop harvest) stage to ensure a higher yield for harvest.
Farmers who have used this technology have reported an increase in their average yield by over 10 per cent on a consistent basis in comparison to analysis carried out by non-drone methods. OCEALIA’s results are a solid example of the effective use of drone collected data and expert algorithmic analysis in the agricultural sector. This technology is slated to help the sector globally when adopted on a larger cost-effective scale.
58 Mechanisation - Key to higher productivity to double farmers’ income

Section VI: Challenges
Mechanisation - Key to higher productivity to double farmers’ income 59
The country’s agricultural production has stagnated at a time when the economy and population has grown. While India ranks as one of the top countries for agricultural production, it is lower than the world average in terms of farm mechanisation. While there is significant opportunity for the sector, it is currently fraught with several challenges:
• Fragmented farms resulting in lower yields: Agriculture in India has been kept within the family and land holdings have been passed from generation to generation. However, this has led to fragmentation of land sizes over the generations and is a key reason for the average farm size in India to be less than 2 hectares,with 33 percent of all farm households owning less than 0.4 hectares of land, resulting in lower yield and harvest per land bank. It is not commercially viable for small and non-contiguous farms to own agricultural machinery individually given that they would never be able to achieve economies of scale.
• High cost of agricultural equipment: Machines such as combine harvesters, sugarcane harvesters, potato combines, paddy transplanters and laser guided land levelers are expensive and require significant capital investments. The cost for a power tiller ranges between USD 480 to USD 2,100. The price range for a tractor is USD 7,000 to USD 12,000 and the cost of a laser land leveler ranges between USD 5,800 to USD 6,500. Inability of the small farmers to invest such high amounts are one of the key contributors for low penetration rates of agricultural machinery in India.
• Low access to rural finance and loan eligibility: Lower yield has resulted in lower income for the farmer base across India. Approximately 90% of the tractors sold in India are through financing schemes which use the applicant’s profile as a base for deciding eligibility which given irregular levels of income becomes a deterrent for majority of the small farmers. Interest rates in rural areas for short and medium term loans can go as high as 40% per annum. Additionally, commercial banks and other financial institutions not only charge a high interest rate, but also take a substantial period of time to disburse the same once sanctioned, thus further discouraging farmers from availing such assistance.
• Low penetration of agricultural equipment: The Indian farm equipment market is dominated by the sale of tractors. Other equipment, such as tillers, harvesters, sowers, etc. constitute only 15% of the farm equipment market,primarily on account of lack of awareness amongst the farmers, limited access to information such as impact of using other equipment and techniques on agricultural yield, cost – benefit analysis for such equipment, their operational realities etc. Penetration of other farm equipment is touted to increase in the future with greater emphasis on mechanisation, government impetus on running programmes to enhance awareness and provide access to subsidised capital, improvement in irrigation and increase in corporate and cooperative farming
• Equipment quality and after-sale service: Given the lower income trends of farmers, majority are price sensitive while purchasing farm equipment. Several local manufacturers offer farm equipment at a fraction of the cost of standardised players by compromising on the quality and design of such equipment and given the price sensitive nature of such purchases, farmers tend to lean towards such local manufacturers. While this is a low capital cost, usage of low quality equipment results in poor yield, longer downtime, and higher operational costs. Additionally, availability of spare parts is also a challenge for such local equipment manufacturers as the cost of servicing customers in rural areas is usually high and therefore not sustainable for such manufacturers.
• Diverse soil conditions and cropping pattern: The cultivable land in India is spread across various geographical regions and therefore experiences different climate and weather patterns. The conditions of the soil are directly related to its surrounding ecological environment; and thus, we see diverse soil types across the different regions in the country. These soil conditions give rise to differing cropping patterns as well. Farm machinery has to be customised in order to cater to these varying conditions in order to be optimally used. The diverse types of soil found across different regions gives rise to the need for customised farm machinery.
60 Mechanisation - Key to higher productivity to double farmers’ income

• Inefficient tendering process inefficiencies resulting in low application of farm equipment: The time taken to shortlist and award a public tender is usually long. In few states, the tendering process takes place during the Kharif crop season (August to October), which is towards the end of the cropping seasons and as such results in the farmers acquiring and using the equipment, in a timely manner, to improve their yield.
• Inefficiencies in farm equipment testing: The Sub-Mission on Agricultural Mechanisation (SMAM) scheme was launched with an objective of promoting the utilisation of farm mechanisation in order to improve farm productivity. Under this scheme, farm equipment is regularly tested at one of the four Farm Machinery Training and Testing Institutes (FMTTI) in Madhya Pradesh, Haryana, Andhra Pradesh and Assam. Apart from these four locations, testing is also undertaken at designated State Agricultural Universities (SAUs) and ICAR institutions. The government also plans on opening additional FMTTI’s in Gujarat Maharashtra and Uttar Pradesh. Despite these efforts, the number of institutions that can provide these certifications remain low in number. Apart from the aforementioned reasons, manufacturers of farm machinery also face logistical issues of proximity to these institutions.
• Long and cumbersome process for availing farmer subsidy: The adoption rate for the agriculture support subsidy scheme to encourage mechanisation of agriculture is very low. In 2016-17, the agriculture department was able to disburse only USD 3.5 million(13% of USD 26million subsidy earmarked for farm implements). Only 4,800 farmers in Bihar received the subsidy to buy machines for sowing and harvesting of crops. The primary reason for the low adoption rate is a long and cumbersome process that farmers have to go through in order to avail the subsidy. To apply for the subsidy, a farmer needs to provide invoices, land ownership documents, etc. and has to go through various departments for clearance. Post clearance, he has to go through further checks from the District Agriculture Officer in order to obtain approval and clearance for the subsidy. The entire process from application to disbursement becomes a big roadblock for a farmer.
Mechanisation - Key to higher productivity to double farmers’ income 61

Section VII: Our recommendations
62 Mechanisation - Key to higher productivity to double farmers’ income
While policy makers have initiated preliminary support to farm mechanisation by including it as a focus area in broader schemes such as Rashtrya Krishi Vikas Yojna and Macro Management of Agriculture schemes, concerted focus on this sector is still lacking. Closer attention is required to further enhance the growth of this sector and tap the immense potential it offers.
Some of the key areas that need specific interventions include:
• Enabling easier access to services offered by Custom Hiring Centres (CHCs):
− A fairly large number of CHCs are in operation across the country due to the concerted action of the central and state governments over the past few years. Most of these CHCs are operated by private entrepreneurs, cooperatives, farmer producer organisations (FPOs) and other local players. There is a mix of self- and venture-financed, as well as bank-financed and subsidy led models. This has certainly resulted in increased availability of modern farm equipment available for hiringby farmers. However, access to CHC services is not uniform across categories of farmers. Most of the users are large and medium farmers, with only limited access for small and marginal farmers, who together constitute over 86 per cent of all farm holdings. Even as the number of CHCs needs to increase, especially in the under-served central and eastern regions, innovative financial products for end users have to be designed by financial institutions, to enable farmers to purchase the services offered by CHCs. The central and state governments too need to redesign their subsidy schemes to provide more direct benefit transfers (DBT), so that farmers can choose the services they require the most.
− Focused interventions aimed at enhancing the knowledge of farmers with respect to the benefits of adopting advanced farm equipment is required. The official extension machinery is mostly trained for production technology and few have engineering skills. Yet, the optimal use of modern machinery is critical to achieve higher productivity across a range of crops. Policy must provide a role for private-led extension for farm mechanisation, and this can be partly supported through DBT to farmers. Knowledge dissemination about the benefits of using various types of machinery is a necessary adjunct to the growth and sustainability of CHCs in the long run.
− The issue of crop residue burning on a large scale in Punjab and Haryana, and the consequent environmental challenge in the entire northern region, is an ideal opportunity for the government, private sector players, and farmers, to develop innovative solutions in a PPP mode. It’s encouraging to see that states concerned are already engaging industry and some pilots have already been put on the ground. Public policy can incentivise both farmers and private players to develop crop specific and location specific solutions, since a one-size-fits-all approach may not succeed. Government could even consider procurement of crop residues, implemented on its behalf by private sector players, with the processed products being offered against a system of environmental credits to public and private sector users as fuel. CHCs can play a major role in the roll-out of this idea.
• Uniform implementation of GST rate across agricultural products:
Farm equipment has numerous spare parts such as blades, rubber, gear box etc. and different GST rates are applicable across categories. This becomes a major operational challenge for spare parts/ implement distributors, as they have to apply different GST rates and in some cases, even prepare different invoices for such items. Given that the intent of GST is to simplify taxation processes, the government can consider re-assessing the number of applicable HS codes across categories of equipment with the aim to create one tax slab for an equipment as well as its corresponding spare parts to further boost the usage of agriculture equipment in India.
Our recommendations
Mechanisation - Key to higher productivity to double farmers’ income 63

• Promote use of technology in daily farming practices: There is scope to introduce technological innovations in the
farm equipment sector. GPS, Big Data, Artificial Intelligence and IoT are upcoming technologies and some of them are already being used successfully by developed nations in order to meet the growing food demand. GPS and Big Data is quite prevalent in India as private companies are pumping funds into upgrading their R&D teams to match international standards. Our government can support or provide incentives to organisations, promote collaborations between private and the public sector (PPP models) and increase the overall spend on agricultural research.
−Apart from technology, focused research efforts towards design and development of farm machinery suitable for different types of soils, farm sizes and diverse crops is required. Additionally, commercialisation of research undertaken by universities, especially in the farm equipment space, should be promoted. This cannot be undertaken by public sector research systems alone. Policy must support private sector efforts to develop new technologies and products to cater to the needs of Indian agriculture.
• Faster testing for speedier induction of new farm machinery/innovations:
While a lot has been done to upgrade public sector testing facilities for farm machinery in recent times, the waiting time to test and clear new farm machinery products is too long by international standards. This is a price ultimately paid by the country due to delayed deployment of these products and consequent benefits. In several cases, innovations could not be tested as they were not covered under existing testing parameters. However, that is the very purpose of innovation, to go beyond existing limits and achieve higher standards. A joint working group of government and industry representatives needs to thoroughly review current testing methods and suggest best practices prevailing worldwide to smoothen and accelerate the process. This will encourage investment and development of new technologies to address the myriad challenges of Indian agriculture.
64 Mechanisation - Key to higher productivity to double farmers’ income

About FICCI
Established in 1927, FICCI is the largest and oldest apex business organisation in India. Its history is closely interwoven with India’s struggle for independence, its industrialisation, and its emergence as one of the most rapidly growing global economies.
A non-government, not-for-profit organisation, FICCI is the voice of India’s business and industry. From influencing policy to encouraging debate, engaging with policy makers and civil society, FICCI articulates the views and concerns of industry. It serves its members from the Indian private and public corporate sectors and multinational companies, drawing its strength from diverse regional chambers of commerce and industry across states, reaching out to over 2,50,000 companies.
FICCI provides a platform for networking and consensus building within and across sectors and is the first port of call for Indian industry, policy makers and the international business community.
Agriculture DivisionFederation House, 1, Tansen MargNew Delhi 110001, INDIAT: +91-11- 23738760 to 70 (Extn- 407)F: +91-11-23765333, 23721504
Mechanisation - Key to higher productivity to double farmers’ income 65
Grant Thornton in India is a member of Grant Thornton International Ltd. It has over 3,000 people across 13 locations around the country, including major metros. Grant Thornton in India is at the forefront of helping reshape the values in our profession and in the process help shape a more vibrant Indian economy. Grant Thornton in India aims to be the most promoted firm in providing robust compliance services to dynamic Indian global companies, and to help them navigate the challenges of growth as they globalise. Firm’s proactive teams, led by accessible and approachable partners, use insights, experience and instinct to understand complex issues for privately owned, publicly listed and public sector clients, and help them find growth solutions.
Over 3000 people
Office locations 13
One of the largest fully integrated Assurance, Tax & Advisory firms in India
“Our competitive advantage includes our use of software technology, experience in working with international clients, language skills, and commitment to value and excellence.”
Vishesh C Chandiok,National Managing Partner, Grant Thornton India LLP
About Grant Thornton in India
66 Mechanisation - Key to higher productivity to double farmers’ income

Acknowledgements
Grant Thornton FICCI
Authors Authors
Rahul KapurPrerna GuptaDinesh KumarMeenal KukrejaKaram Sawhney
Pravesh Sharma, AdvisorJasmeet Singh, Head - Agriculture & Food Processing DivisionRuchira Saini, Deputy DirectorPritish Rohan, Assistant DirectorSarita Koli, Assistant DirectorApoorva Mishra, Research Associate
Editorial review
Rohit Nautiyal
Design
Gurpreet Singh
For further information, please contact:
Rahul KapurPartnerGrant Thornton India LLPE: [email protected]
For media queries, please contact:
Spriha Jayati E [email protected] +91 93237 44249
Mechanisation - Key to higher productivity to double farmers’ income 67

© 2017 Grant Thornton India LLP. All rights reserved.
“Grant Thornton in India” means Grant Thornton India LLP, a member firm within Grant Thornton International Ltd, and those legal entities which are its related parties as defined by the Companies Act, 2013.
Grant Thornton India LLP is registered with limited liability with identity number AAA-7677 and has its registered office at L-41 Connaught Circus, New Delhi, 110001.
References to Grant Thornton are to Grant Thornton International Ltd (Grant Thornton International) or its member firms. Grant Thornton International and the member firms are not a worldwide partnership. Services are delivered independently by the member firms.
Contact us
For more information or for any queries, write to us at [email protected]
NEW DELHINational OfficeOuter CircleL 41 Connaught CircusNew Delhi 110001T +91 11 4278 7070
AHMEDABAD7th Floor, Heritage Chambers, Nr. Azad Society, Nehru Nagar, Ahmedabad - 380015
BENGALURU5th Floor, 65/2, Block A, Bagmane Tridib, Bagmane Tech Park, C V Raman Nagar, Bengaluru - 560093T +91 80 4243 0700
CHANDIGARHB-406A, 4th Floor L&T Elante Office BuildingIndustrial Area Phase IChandigarh 160002T +91 172 4338 000
CHENNAI7th Floor, Prestige Polygon471, Anna Salai, TeynampetChennai - 600 018T +91 44 4294 0000
GURGAON21st Floor, DLF SquareJacaranda MargDLF Phase IIGurgaon 122002T +91 124 462 8000
HYDERABAD7th Floor, Block IIIWhite HouseKundan Bagh, BegumpetHyderabad 500016T +91 40 6630 8200
KOCHI6th Floor, Modayil Centre pointWarriam road junctionM. G. RoadKochi 682016T +91 484 406 4541
KOLKATA10C Hungerford Street5th FloorKolkata 700017T +91 33 4050 8000
MUMBAI16th Floor, Tower IIIndiabulls Finance CentreSB Marg, Elphinstone (W)Mumbai 400013T +91 22 6626 2600
MUMBAI9th Floor, Classic PentagonNr Bisleri factory, Western Express HighwayAndheri (E)Mumbai 400099T +91 22 6176 7800
NOIDAPlot No. 19A, 7th FloorSector – 16ANoida 201301T +91 120 7109 001
PUNE3rd Floor, Unit No 309 to 312West Wing, Nyati UnitreeNagar Road, Yerwada Pune- 411006T +91 20 6744 8800
To know more, please visit www.grantthornton.in or contact any of our offices as mentioned below:
Follow us @GrantThorntonIN