
Key Success Factors in Business Intelligence - DiVA portal833175/FULLTEXT01.pdf · Key success...
172
School of Management Blekinge Institute of Technology Thesis for the Master’s degree in Business Administration Spring 2011 Key Success Factors in Business Intelligence An analysis of companies primarily in Poland and primarily from vendor perspective Supervisor: Dr Klaus Solberg Søilen Szymon Adamala [email protected] Linus Cidrin [email protected]
Transcript of Key Success Factors in Business Intelligence - DiVA portal833175/FULLTEXT01.pdf · Key success...

School of Management
Blekinge Institute of Technology
Thesis for the Master’s degree in Business Administration
Spring 2011
Key Success Factors in Business Intelligence An analysis of companies primarily in Poland
and primarily from vendor perspective
Supervisor: Dr Klaus Solberg Søilen
Szymon Adamala [email protected]
Linus Cidrin [email protected]
Key success factors in Business Intelligence, Szymon Adamala & Linus Cidrin
2
Table of contents Abstract .................................................................................................................................................. 8
Acknowledgements ................................................................................................................................ 9
1. Introduction ................................................................................................................................. 10
1.1. Background ........................................................................................................................... 10
1.2. Problem discussion and delimitations ................................................................................... 10
1.3. Problem Formulation and Purpose ........................................................................................ 11
1.4. Delimitations ......................................................................................................................... 13
1.5. Glossary ................................................................................................................................. 13
2. Theory and literature review ...................................................................................................... 15
2.1. The importance of success criteria ........................................................................................ 15
2.2. Frameworks of success criteria ............................................................................................. 16
2.3. Discussion of success factors not classified into frameworks ............................................... 23
2.4. Other aspects relevant for BI success .................................................................................... 25
2.5. Literature review summary.................................................................................................... 25
3. Research Method ......................................................................................................................... 27
3.1. Phases of research ................................................................................................................. 27
3.2. Sampling ................................................................................................................................ 28
3.3. Choice of method .................................................................................................................. 29
4. Research results and analysis ..................................................................................................... 32
4.1. Analysis of individual variables’ impact on BI success ........................................................ 32
4.2. Statistical model of Business Intelligence initiatives’ success. ............................................. 38
4.3. Measures Analysis - Question 22. ......................................................................................... 46
4.4. Hypotheses Analysis ............................................................................................................. 64
5. Conclusion .................................................................................................................................... 73
5.1. Non-technological problems dominate in Business Intelligence projects primarily in Poland 73
5.2. Successful projects primarily in Poland share common factors ............................................ 73
5.3. Successful and non-successful projects primarily in Poland show differences in certain factors 74
5.4. Business Intelligence projects primarily in Poland have success factors that differ from IS projects in general ............................................................................................................................. 74
5.5. Clear objective measures for the CSFs can be identified ...................................................... 74
5.6. A statistical model can be constructed that, to a certain extent, predicts success of BI projects primarily in Poland .............................................................................................................. 74
5.7. Summary of support for hypotheses ...................................................................................... 74

Key success factors in Business Intelligence, Szymon Adamala & Linus Cidrin
3
5.8. Implications ........................................................................................................................... 75
5.9. Suggestions for future work .................................................................................................. 75
References list ...................................................................................................................................... 77
Appendices ........................................................................................................................................... 80
Appendix I. Survey questions ...................................................................................................... 81
Appendix II. Demographics of survey results ............................................................................. 84
II.A. By country ............................................................................................................................ 84
II.B. By project side ......................................................................................................................... 85
II.C. By customer company ......................................................................................................... 86
II.D. By vendor company ............................................................................................................. 87
II.E. By project role ......................................................................................................................... 88
II.F. By project successfulness ........................................................................................................ 89
Appendix III. Survey results aggregated by country or region ................................................... 92
Appendix IV. Comparison of projects in Poland and outside of Poland .................................. 161
Appendix V. Summary of question 22 results (proposed measures) ....................................... 171

Key success factors in Business Intelligence, Szymon Adamala & Linus Cidrin
4
List of Figures
Figure 1 - Delone&McLean model for IS success ................................................................................ 17 Figure 2 - Yeoh&Koronios model of success in BI .............................................................................. 18 Figure 3 - Hwang & Xu structural model of data warehousing success ............................................... 21 Figure 4 - Wixom&Watson statistical model of DW success ............................................................... 22 Figure 5 - Survey results for question 10 - How was the project funded .............................................. 33 Figure 6 - Survey results for question 14 - When iterative development was used, did each iteration provide business value by itself ............................................................................................................. 33 Figure 7 - Survey results for question 19:3 - Did the end users use the data warehouse/BI solution provided ................................................................................................................................................. 34 Figure 8 - Survey results for question 19:5 - Was there a clear strategic vision for Business Intelligence or data warehouse .............................................................................................................. 34 Figure 9 - Survey results for question 19:6 - Were the business needs that the project tried to solve aligned to the strategic vision ................................................................................................................ 35 Figure 10 - Survey results for question 19:10 - Did project scope definition concentrate on choosing the best opportunities ............................................................................................................................. 35 Figure 11 - Survey results for question 19:12 - When an expert was assigned to a team or made available to a team, was it always the best expert available .................................................................. 36 Figure 12 - Survey results for question 19:20 - Were non-technological issues encountered during the project .................................................................................................................................................... 36 Figure 13 - Survey results for question 19:18 - Were technological issues encountered during the project .................................................................................................................................................... 37 Figure 14 - Survey results for question 20 - From all the problems encountered, which were hardest to solve - technological or non-technological ............................................................................................ 37 Figure 15 - Survey results for question 21 - From all the time spent resolving pending issues, most of it was devoted to technological or non-technological problems ............................................................... 38 Figure 16 - Trivial PLS regression model ............................................................................................. 39 Figure 17 - PLS regression model with 5 significant variables ............................................................. 40 Figure 18 - PLS regression model with all transformed variables ........................................................ 42 Figure 19 - PLS regression model 4 - equivalent of model 2 with transformed variables .................... 43 Figure 20 - PLS regression model with the best fit ............................................................................... 44 Figure 21- Q22:1 Do you think weekly number of distinct users is a good measure of data warehouse use? ........................................................................................................................................................ 46 Figure 22 - Q22:2 Do you think weekly number of queries submitted is a good measure of data warehouse use........................................................................................................................................ 47 Figure 23 - Q22:3 Do you think weekly number of logons is a good measure of data warehouse use? 47 Figure 24 - Q22:4 Do you think that mean response time for a request is a good measure for access to subject matter experts? .......................................................................................................................... 48 Figure 25 - Q22:5 Do you think that percentage of requests responded within one business day is a good measure for access to subject matter experts? .............................................................................. 49 Figure 26 - Q22:6 Do you think that average number of questions needed to be asked per subject matter issue is a good measure for subject matter expert quality? ........................................................ 50 Figure 27 - Q22:7 Do you think that the average number of available documents per subject matter issue is a good measure for subject matter expert quality? ................................................................... 50 Figure 28 - Q22:8 Do you think that percentage of questions answered within one business day is a good measure for subject matter expert quality? ................................................................................... 51
Key success factors in Business Intelligence, Szymon Adamala & Linus Cidrin
5
Figure 29 - Q22:9 Is the percentage of man-days spent by business staff on a project an adequate measure for whether there was enough business staff on the project? .................................................. 52 Figure 30 - Q22:10 Is the mean time to resolve a business issue an adequate measure of whether there was enough business staff on a project? ................................................................................................ 52 Figure 31 - Q22:11 Is the percentage of business issues resolved within a business week an adequate measure of whether there was enough business staff on a project? ...................................................... 53 Figure 32 - Q22:12 Is the average number of weeks of duration for iterations a good measure for the size of deliverable in iterative development?Percentage of total project time for each iteration .......... 54 Figure 33 - Q22:13 Is the percentage of total project time for each iteration a good measure for the size of deliverable on iterative development? .............................................................................................. 55 Figure 34 - Q22:14 Is the number of issues a good measure for data quality issues at source systems? ............................................................................................................................................................... 56 Figure 35 - Q22:15 Is the number of unresolved issues a good measure for data quality issues at source systems? ................................................................................................................................................ 56 Figure 36 - Q22:16 Is the average number of man-days of extra project work per issue a good measure for data quality issues at source systems? ............................................................................................. 57 Figure 37 - Q22:17 Is the number of issues a good measure for data quality issues in BI system or data warehouse? ............................................................................................................................................ 58 Figure 38 - Q22:18 Is the number of unresolved issues a good measure for data quality issues in BI system or data warehouse? .................................................................................................................... 58 Figure 39 - Q22:19 Is the average number of man-days of extra project work per issue a good measure for data quality issues in BI system or data warehouse? ....................................................................... 59 Figure 40 - Q22:20 Is a calculated ROI a good measure of benefits quantification? ............................ 60 Figure 41 - Q22:21 Is a proposition on how the business intelligence capabilities enables the realization of business strategy a good measure of benefits quantification? ......................................... 60 Figure 42 - Q22:22 Is the calculation of contribution to the internal rate of return a good measure of benefits quantification? ......................................................................................................................... 61 Figure 43 - Q22:23 Is the percentage of business benefits that have detailed written definition a good measure of business benefits definition? ............................................................................................... 62 Figure 44 - Q22:24 Is the percentage of business benefits that are objectively measureable a good measure of business benefits definition? ............................................................................................... 62 Figure 45 - Q22:25 Is the presence or absence of business benefits measurements process owner a good measure of business benefits measurements? ............................................................................... 63 Figure 46 - Q22:26 Is the monthly amount of time assigned for business benefits measurements process execution a good measure of business benefits measurements? .............................................. 64 Figure 47 - Most important factors in successful projects..................................................................... 66 Figure 48 - Most important factors in non-successful projects ............................................................. 66 Figure 49 - Survey results for question 14 - When iterative development was used, did each iteration provide business value by itself ............................................................................................................. 67 Figure 50 - Survey results for question 19:5 - Was there a clear strategic vision for Business Intelligence or data warehouse .............................................................................................................. 68 Figure 51 - Survey results for question 19:6 - Were the business needs that the project tried to solve aligned to the strategic vision ................................................................................................................ 68 Figure 52 - Survey results for question 19:10 - Did project scope definition concentrate on choosing the best opportunities ............................................................................................................................. 69 Figure 53 - Survey results for question 20 - From all the problems encountered, which were hardest to solve - technological or non-technological ............................................................................................ 69
Key success factors in Business Intelligence, Szymon Adamala & Linus Cidrin
6
Figure 54 - Survey results for question 21 - From all the time spent resolving pending issues, most of it was devoted to technological or non-technological problems ............................................................... 70 Figure 55 - Survey result for question 19:20 - Were non-technological issues encountered during the project .................................................................................................................................................... 71 Figure 56 - Number of answers per project place ................................................................................. 84 Figure 57 - Number of answers in countries other than Poland ............................................................ 85 Figure 58 - Number of answers per project side (for all projects) ........................................................ 85 Figure 59 - Number of answers per project side (for projects in Poland) ............................................. 86 Figure 60 - Number of answers per project side (for projects outside Poland) ..................................... 86 Figure 61 - Number of answers per customer ....................................................................................... 87 Figure 62 - Number of answers per vendor ........................................................................................... 88 Figure 63 - Number of answers by project role ..................................................................................... 88 Figure 64 - Was the project you are describing successful? Percentage of answers (for all projects) .. 89 Figure 65 - Was the project you are describing successful? Percentage of answers (for projects in Poland) .................................................................................................................................................. 90 Figure 66 - Was the project you are describing successful? Percentage of answers (for projects outside Poland) .................................................................................................................................................. 90
Key success factors in Business Intelligence, Szymon Adamala & Linus Cidrin
7
List of Tables
Table 1 - (Wixom & Watson, 2001) Hypotheses findings ................................................................... 22 Table 2 - Factors used in PLS regression model 2 ................................................................................ 40 Table 3 - Functions applied to variables ................................................................................................ 42 Table 4 - Variables used in the regression model with best fit .............................................................. 45 Table 5 - Spearman’s rank correlation coefficient for the correlation between the success of the initiative and the different questions ..................................................................................................... 65 Table 6 - Summary of veriables analysis .............................................................................................. 71 Table 8 - The support for the five hypoteses of the thesis ..................................................................... 75 Table 9 - Survey questions .................................................................................................................... 83 Table 10 - Survey results aggregated by country or region ................................................................. 160 Table 11 - Comparison of projects in Poland and in the rest of the world .......................................... 170 Table 12 - Simple statistics for question 22 ........................................................................................ 172
Key success factors in Business Intelligence, Szymon Adamala & Linus Cidrin
8
Abstract Business Intelligence can bring critical capabilities to an organization, but the implementation of such capabilities is often plagued with problems and issues. Why is it that certain projects fail, while others succeed? The theoretical problem and the aim of this thesis is to identify the factors that are present in successful Business Intelligence projects and organize them into a framework of critical success factors.
A survey was conducted during the spring of 2011 to collect primary data on Business Intelligence projects. It was directed to a number of different professionals operating in the Business Intelligence field in large enterprises, primarily located in Poland and primarily vendors, but given the similarity of Business Intelligence initiatives across countries and increasing globalization of large enterprises, the conclusions from this thesis may well have relevance and be applicable for projects conducted in other countries.
Findings confirm that Business Intelligence projects are wrestling with both technological and non-technological problems, but the non-technological problems are found to be harder to solve as well as more time consuming than their technological counterparts. The thesis also shows that critical success factors for Business Intelligence projects are different from success factors for IS projects in general and Business Intelligences projects have critical success factors that are unique to the subject matter. Major differences can be predominately found in the non-technological factors, such as the presence of a specific business need to be addressed by the project and a clear vision to guide the project.
Results show that successful projects have specific factors present more frequently than non-successful. Such factors with great differences are the type of project funding, business value provided by each iteration of the project and the alignment of the project to a strategic vision for Business Intelligence.
Furthermore, the thesis provides a framework of critical success factors that, according to the results of the study, explains 61% of variability of success of projects.
Given these findings, managers responsible for introducing Business Intelligence capabilities should focus on a number of non-technological factors to increase the likelihood of project success. Areas which should be given special attention are: making sure that the Business Intelligence solution is built with end users in mind, that the Business Intelligence solution is closely tied to company’s strategic vision and that the project is properly scoped and prioritized to concentrate on best opportunities first.
Keywords: Critical Success Factors, Business Intelligence, Enterprise Data Warehouse Projects, Success Factors Framework, Risk Management

Key success factors in Business Intelligence, Szymon Adamala & Linus Cidrin
9
Acknowledgements
We would like to thank our supervisor Dr Klaus Solberg Søilen for his valuable input and thoughtful comments that has led us through the work with the thesis. Perhaps it was not always easy for us to accept his comments, but we would not have achieved the final result without his guidance. Now, when the hardships are over and we no longer have to “redo and resend”, we are able to appreciate his help. The supervisor has to be like a father – tough and fair. We owe gratitude to Dr Gabriel Pietrzkowski, a friend from secondary school who has chosen the path of fame, for his support in understanding the intricacies of Partial Least Squares and his challenging and critical comments about our initial models. All the discussions we had stimulated improvement, but he was wise enough not to suggest specific changes, letting us come with our own ideas instead. This thesis would not be in its current shape if not our colleagues and peers who agreed to review it and offer their comments. Nicklas Bylund, Emil Larsson and Rachel Ramos-Reid did not have an easy task, but their help allowed us to eliminate errors and increase clarity of argument. Also, special thanks to all the survey participants that made this thesis possible. Since they were promised anonymity, we will not mention their names here. We would also like to thank Dr Christian Ringle, Sven Wende and Alexander Will for allowing us to use their SmartPLS software (Ringle, Wende & Will, 2005) free of charge for the purpose of analyzing the primary research data. Having the technical side of data analysis covered saved us a lot of time. Finally, we would like to thank those we should mention at the beginning, our families, for all the support and understanding, especially in the final weeks of our thesis work. For them, it was especially hard to accept the fact that we needed to spend all of our free time in front of a computer. We will make up that time to you. Szymon Adamala and Linus Cidrin
Key success factors in Business Intelligence, Szymon Adamala & Linus Cidrin
10
1. Introduction
1.1. Background The aim of this thesis is to develop the tools necessary to analyze, predict and manage the success of Business Intelligence, data warehousing or competitive intelligence initiatives in the contemporary organizations. “There is no reason that each organization, as it begins and continues to develop data warehouse projects, must wrestle with many of the very difficult situations that have confounded other organizations. The same impossible situations continue to raise their ugly heads, often with surprisingly little relation to the industry, the size of the organization, or the organizational structure” (Adelman, 2003). If there is indeed little correlation between success and the environmental factors of those initiatives, the cause of success must be related to something else. It is worth investigating whether the difficulty, complexity of initiatives and their high probability of failure is related to some factors inherent to Business Intelligence itself.
In fact, most of the Business Intelligence and data warehouse projects fail and the failure rate is estimated to be between 50% and 80% (Beal, 2005; Meehan, 2011; Laskowski, 2001; Legodi & Barry, 2010). Why do so many of those projects fail? “The warehouse is used differently than other data and systems built by information systems” (Inmon, 2002). Therefore, the available knowledge on how to manage ordinary projects in the information systems domain should not be expected to be readily applicable in the area of Business Intelligence.
1.2. Problem discussion and delimitations Our initial information search revealed that Business Intelligence has been covered in a large number of academic articles and books. However, Business Intelligence success is not so widely treated. Few articles attempt to analyze what the factors influencing BI are. Some of them have developed frameworks, but there is no proven framework which can be relied upon for this particular problem.
The article with an approach closest to ours is (Yeoh & Koronios, 2010). The authors conducted an empirical, qualitative study to define Critical Success Factors (CSFs) and classified them into 3 categories: organization, process and technology factors that together include committed management support and sponsorship, clear vision and well-established business case, business centric championship and balanced team composition, business-driven and iterative development approach, user-oriented change management, business-driven, scalable and flexible technical framework and sustainable data quality and integrity. Later, leveraging five case studies, they verified that those cases that scored high on all or most of the factors were indeed successful. The single case where the factors were rated low turned out to be an unsuccessful implementation. However, the case study approach used in this article would not be sufficient to draw conclusions about CSFs of BI solutions in general. Moreover, Yeoh and Koronios (2010) fail to propose any objective measures for any of the factors. Despite these shortcomings, this article (Yeoh & Koronios, 2010) can be used as a starting point for conducting primary research.
In the article by Popovic and Jaklic (2010), the authors concentrate on one of the success factors identified by Yeoh and Koronios (2010), namely information quality. They distinguish between content quality and media quality and successfully prove their hypothesis that there is a positive correlation between BI systems maturity and both content and media quality and that this correlation is not of equal strength in both cases. We are unsure whether the authors’ proposed causal effect is right and in fact, it is the information quality that drives BI systems maturity, not vice versa. However, this issue will remain unaddressed in our thesis.
Key success factors in Business Intelligence, Szymon Adamala & Linus Cidrin
11
Another article (Legodi & Barry, 2010) is an example that the issue of BI can be analyzed from many different angles. The authors take a purely risk management viewpoint and treat BI as a project rather than a process. Therefore, problems tormenting BI initiatives they identified look more like an excerpt from project management handbook rather than a result of scientific research. We would not like our research to be that generic and we plan on concentrating on BI specific criteria. Even if they turn out to be in line with broader success factors applicable in other fields, we would like to identify exactly what each criterion means in Business Intelligence.
Finally, we would like to mention a book (Kimball, Ross, Thornthwaite, Mondy & Becker, 2008) as a valuable source of insight into BI implementations. Although the book is targeted at practitioners, one of the authors holds a PhD and is credited with developing one of the two most successful BI systems architectures - dimensional modeling. This book highlights many pitfalls present during the implementation of BI in the enterprise. Despite traditionally technical approach of manuals for practitioners, this book devotes a significant amount of focus to the business side of BI and potential issues. It also concentrates on best practices that might be invaluable for structuring our primary research. Recommendations of the book (Kimball, Ross, Thornthwaite, Mondy & Becker, 2008) are in line with those of one of the aforementioned articles (Yeoh & Koronios, 2010).
1.3. Problem Formulation and Purpose The success of the BI initiatives undertaken by companies depends on various factors. Because BI implementation depends on the successful use of IT resources, some of those factors are undoubtedly technological. However, Information Technology is merely a tool in implementing a BI solution. BI success depends chiefly on organizational and process factors that business administration focuses on. Despite differences in BI systems between various industries, those factors should be identified and classified. The existence of link between individual factors or their combinations and success of BI initiatives should be verified. Moreover, success factors could be classified and a method of measurement be devised for each individual factor. As the management thinker Peter Drucker once said, “what gets measured, gets managed”. Currently, BI initiatives have a relatively low success ratio, estimated to be no higher than 50% (Beal, 2005; Meehan, 2011; Laskowski, 2001; Legodi & Barry, 2010). Successful ones achieve ROI in excess of 400% (according to some vendors). This figure is even more impressive when taking into account enormous (traditionally capital) investments in the infrastructure and equally high (traditionally operational) expenses on development projects, operations, consulting services etc. An ability to assess the chances of success prior to engaging in the initiative would have two practical benefits:
1. Preventing some of the initiatives from commencing if they score low in the framework of success factors or allowing them to focus on critical issues that otherwise would have caused the failure - as a result improving the success ratio of all BI initiatives.
2. Facilitating management of the investment in Business Intelligence and lowering the entry barriers (given the high level of investment, 50% probability of failure might be too high for smaller companies if the loss resulting from failure might push the company into bankruptcy).
As the existence of Business Intelligence success factors is not widely covered in the academic literature and the link between those factors and the success of BI is not scientifically proven, the research can potentially fill the gap in theoretical knowledge. The purpose of this thesis is to identify why certain projects fail, while others succeed, by addressing the theoretical question of identifying the factors that are present in successful Business Intelligence projects and organize them into a framework of critical success factors.
The thesis is focusing on the following hypotheses:

Key success factors in Business Intelligence, Szymon Adamala & Linus Cidrin
12
H1. It is possible to identify critical success factors (CSFs) of BI initiatives primarily in Poland. H2. CSFs of BI initiatives primarily in Poland are not the same as for information systems in
general. H3. Non-technical and non-technological CSFs play a dominant role in BI initiatives’ success for
initiatives primarily in Poland. H4. Technology plays a secondary role and is less critical for BI initiatives’ success for initiatives
primarily in Poland. H5. It is possible to develop objective measures for each of CSFs of BI initiatives primarily in
Poland.
If the abovementioned hypotheses can be proved, CSFs of BI initiatives create a framework that can be used to predict the success in early stages of BI initiatives.
It should be noted that, even though the thesis is primarily studying vendors in Poland, the conclusions from this thesis may well have relevance and be applicable for other countries as well, especially since many of the companies studied were global enterprises and other aspects of projects and IT are seeing globalization, outsourcing, offshoring, nearshoring and other forms of international operations. Moreover, as can be seen in Appendix III, the differences in survey results between Poland and other countries were not significant and drawing conclusions from the sample we gathered, we can claim that our findings are also applicable to Business Intelligence projects in large enterprises worldwide. The reason for choosing Poland as a primary country is that one of the authors has been working there for many years and has good access to data points.
In this thesis, the terms project and initiative are being used interchangeably.
There is some ambiguity around the use of the terms data warehouse and Business Intelligence among practitioners. Historically, data warehousing meant “the overall process of providing information to support business decision making” (Kimball, Ross, Thornthwaite, Mondy & Becker, 2008, p. 10). Following those authors, “delivering the entire end-to-end solution, from the source extracts to the queries and applications that the business users interact with” (Kimball, Ross, Thornthwaite, Mondy & Becker, 2008, p. 10) has always been a fundamental principle. However, the term business intelligence coined in the 1990s meant only reporting and analysis of data stored in the warehouse, effectively separating those two terms. Even now, there is no agreement in the industry – some “refer to data warehousing as the overall umbrella term, with the data warehouse databases and BI layers as subset deliverables within that context” (Kimball, Ross, Thornthwaite, Mondy & Becker, 2008, p. 10), while others “refer to business intelligence as the overarching term, with the data warehouse relegated to describe the central data store foundation of the overall business intelligence environment(Kimball, Ross, Thornthwaite, Mondy & Becker, 2008, p. 10).
Because the aim of this thesis is not to define the term of Business Intelligence, but rather to investigate its success factors, both conventions have to be accommodated. Therefore, articles referring both to data warehouse systems/projects and Business Intelligence systems have to be reviewed. There is no difference in their relevance to our study, especially when taken into account the industry practice that even “though some would agree that you can theoretically deliver BI without a data warehouse, and vice versa, that is ill-advised (…). Linking the two together in the DW/BI acronym further reinforces their dependency” (Kimball, Ross, Thornthwaite, Mondy & Becker, 2008). Despite this argumentation, Business Intelligence is used in this thesis as an overall term instead.
Key success factors in Business Intelligence, Szymon Adamala & Linus Cidrin
13
1.4. Delimitations
1.4.1. NPV calculation for BI projects The research is concentrated mainly on the factors that lead to the success of BI initiatives, cause the success (or are able to prevent it) or are otherwise correlated with the success. However, little attention is paid to the definition of the success itself or its measurement. According to Delone and McLean (1992; 2003), the success entails the net benefits. To properly define the success, those net benefits need to be measured. The authors’ goal of obtaining objective measurement criteria would call for a method to compute the NPV of BI initiative. A similar subject (without the emphasis on BI, but rather for software in general) has recently been a topic of a PhD thesis (Numminen, 2010). Clearly, calculating the NPV of BI initiatives will be out of scope for this thesis. Therefore, the success itself will not be defined as clearly as the authors would want. There would be room for further research in this area.
1.4.2. Interdependence between individual independent variables Several of the models proposed in the literature (Delone & McLean, 1992; 2003; Hwang & Xu, 2008; Wixom & Watson, 2001) analyzed the interdependency between independent variables. Furthermore, none of the abovementioned authors proposed a direct correlation with success for those variables that were used to explain variability of other independent variables. The goal of this thesis is to enumerate all the CSFs of BI projects, not to analyze how they depend from each other. For each of the independent variables analyzed, a direct dependency between success and that variable is analyzed.
1.5. Glossary
1.5.1. Business Intelligence (BI). A generic term to describe leveraging the organization’s internal and external information assets to support improved business decision making (Kimball, Ross, Thornthwaite, Mondy & Becker, 2008, 0. 596).
1.5.2. Correlation. The state or relation of being correlated ; specifically : a relation existing between phenomena or things or between mathematical or statistical variables which tend to vary, be associated, or occur together in a way not expected on the basis of chance alone (Merriam-Webster Dictionary, 2011)
1.5.3. Correlation coefficient. A number or function that indicates the degree of correlation between two sets of data or between two random variables and that is equal to their covariance divided by the product of their standard deviations (Merriam-Webster Dictionary, 2011)
1.5.4. Critical success factor (CSF). See (Project) Success factor.
1.5.5. Data warehouse. The conglomeration of an organization’s data staging and presentation areas, where operational data is specifically structured for query and analysis performance and ease-of-use (Kimball & Ross, 2002, p. 397).
1.5.6. Delphi study or Delphi panel. A method used for a structured study based on communication between a group of individuals (usually experts) (Linstone & Turoff, 2002)
Key success factors in Business Intelligence, Szymon Adamala & Linus Cidrin
14
1.5.7. Framework. A basic conceptional structure (as of ideas) (Merriam-Webster Dictionary, 2011).
1.5.8. Information system (IS). Any combination of information technology and people's activities using that technology to support operations, management, and decision-making (Ellison & Moore, 2003).
1.5.9. Iteration. A procedure in which repetition of a sequence of operations yields results successively closer to a desired result (Merriam-Webster Dictionary, 2011).
1.5.10. Likert survey. Survey with questions that have ordinal level of measurement in which the categories of responses have rank order. Likert scale are commonly used in questionnaires for measuring attitudes (Jamieson, 2004).
1.5.11. Partial least squares (PLS). A method of constructing regression equations. PLS constructs new explanatory variables, often called factors, latent variables, or components, where each component is a linear combination of independent variables. Standard regression methods are then used to determine equations relating the components to the dependent variable (Garthwaite, 1994).
1.5.12. Program. A group of related projects managed in a coordinated way. Programs usually include an element of ongoing activity (Duncan, 1996, p. 167).
1.5.13. Project. A temporary endeavor undertaken to create a unique product or service (Duncan, 1996, p. 167).
1.5.14. (Project) Success factor. A feature or property of a project that is necessary for it to be successful or to achieve what it set out to create (Daniel, 1961).
1.5.15. Retrun on investment (ROI). The net benefits from an investment or project (gain minus cost) divided by the cost of the investment or project (Pisello, 2001).
1.5.16. Statistical model. A mathematical description of relationships between variables. Can be of different types such as confirmatory or exploratory (Adèr & Mellenbergh, pp. 271-304). See also PLS.
1.5.17. Variable. A logical set of (…) characteristics of an object (Babbie, 2009)
Key success factors in Business Intelligence, Szymon Adamala & Linus Cidrin
15
2. Theory and literature review This chapter is dedicated to the review of available subject matter literature. First, existing frameworks are being examined. Because of the differences between them, they will be treated separately from each other. Then, articles enumerating success factors without attempting to organize them into any framework are discussed. Again, profound differences in the approach suggest there doesn’t exists a coherent body of theory describing success factors in Business Intelligence. Therefore, the discussion of success factors will usually be limited to enumerating or summarizing the factors identified in the literature. After a brief paragraph about the dependence of success from the stakeholder’s interest, a summary of theory identified in the literature is offered.
2.1. The importance of success criteria Starting the discussion of the subject theory, let us take a look at the work of one of the most famous practitioners in the field of data warehousing and Business Intelligence, Dr Ralph Kimball. He is credited with developing arguably the most successful data warehouse architecture1, the dimensional modeling. The success criteria as described by Kimball are named “readiness factors”. The author suggests giving up the initiative, if some of the criteria are missing or insufficient. “Readiness shortfalls represent project risks; the shortfalls will not correct themselves over time. It is far better to pull the plug on the project before significant investments have been made than it is to continue marching down a path filled with hazards and obstacles” (Kimball, Ross, Thornthwaite, Mondy, & Becker, 2008, p. 16).
Why are the success criteria so important? As we have already mentioned in the introduction, “some data warehouse implementations fail. It’s possible that many of those ‘failures’ would be considered by some to be successes (or at least to be positioned someplace between failure and success). The criteria for success are often determined after the fact. This is a dangerous practice since those involved with the project don’t really know their targets and will make poor decisions about where to put their energies and resources” (Inmon, 2002, p. 5).
According to (Adelman, 2003), the example measures of success include the following:
- The data warehouse usage. - Usefulness of the data warehouse, including end user satisfaction. - Acceptable performance as perceived and experienced by end users. - Acceptable ROI - benefits justifying the costs. - Relevance of data warehouse application. - Proper leverage of a business opportunity (i.e. establishing competitive advantage thank to
the application of data warehouse). - Timely answers to business questions. - Higher quality / cleanliness of data (than in the source systems). - Initiation of changes in the business processes that can be improved as a result of the use of
data warehouse (Adelman, 2003, p. 5&40).
Douglas Hackney emphasized the critical importance of establishing success measures – “The ‘build it and they will come’ approach (…) does not work in data warehousing” (Adelman, 2003, p. 41). He further suggests starting with business “pain” by the available data. The words “life-threatening” seem to accurately describe the problem that need to be chosen to solve (Inmon, 2002, p. 41). An example of a business “pain” might be the “loss of revenue or excessive operating costs” (Inmon, 2002, p. 42). 1 There is another very popular data warehouse architecture, called Enterprise Data Warehouse (EDW), proposed by William Inmon. Some practitioners prefer it over Kimball’s dimensional modeling technique.
Key success factors in Business Intelligence, Szymon Adamala & Linus Cidrin
16
2.2. Frameworks of success criteria In the academic literature, there exist many frameworks that enumerate, classify and organize success factors of Business Intelligence or Information Systems in general into a coherent body of knowledge. Let us examine them one by one, starting with the most renown and most general framework and moving into specific BI success frameworks afterwards.
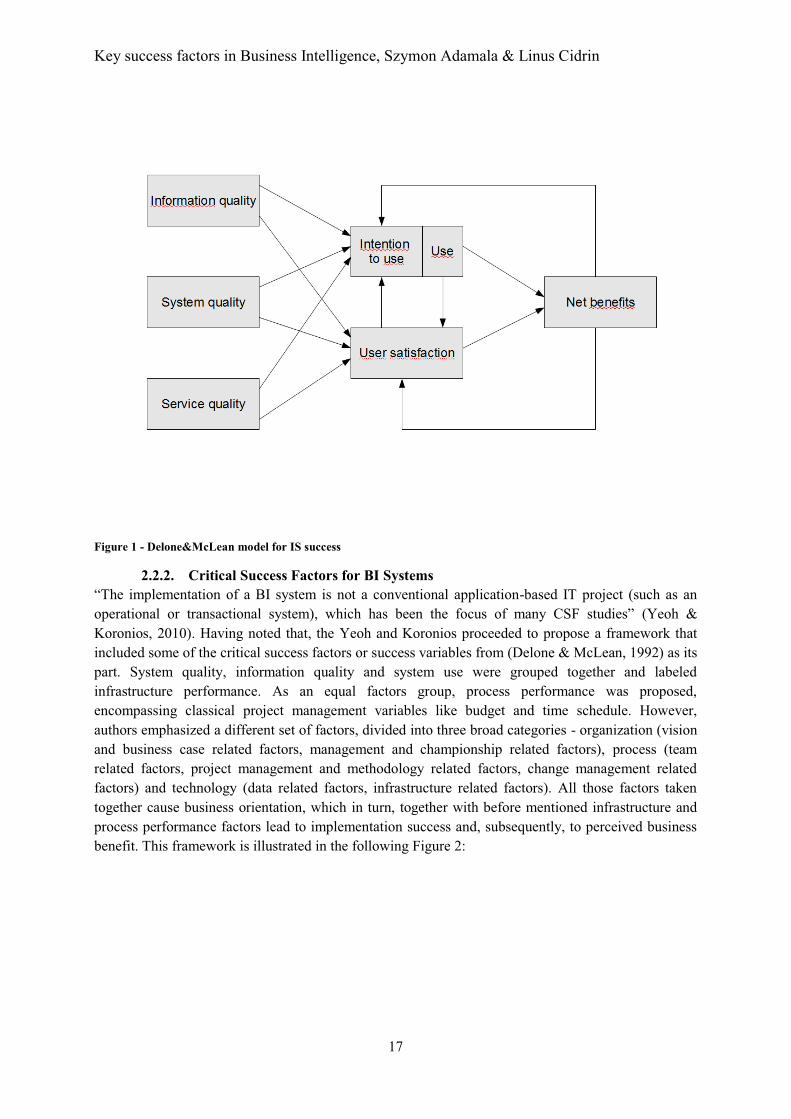
2.2.1. Information Systems Success The most obvious first choice when trying to discover BI success factors is to look at the information systems (IS) in general. There exists an excellent framework proposed by Delone and McLean (Delone & McLean, 1992; 2003) that has been widely cited, revisited, criticized, validated or extended in hundreds of articles (Delone & McLean, 2003). The original framework proposed by the authors (Delone & McLean, 1992) has been reexamined in the light of that subsequent research, resulting in a slightly updated version (Delone & McLean, 2003) that will be discussed here. The proposed framework defines IS success in terms of system use, user satisfaction and net benefits whereas the factors leading to the success encompass information quality, system quality and service quality. The interdependences between those variables is depicted on Figure 1on the subsequent page.
We should note that one should not measure system quality and service quality at all, as they are inapplicable in Business Intelligence. As Solberg Søilen and Hasslinger found (Solberg Søilen & Hasslinger, 2009), vendors of BI tools do not differentiate their products and tools (other than adopting different definitions of Business Intelligence). Therefore, system quality should not be a factor in Business Intelligence domain. Because Business Intelligence systems are built to present data and facilitate its analysis, data quality is probably the most important factor. From the “second tier” variables, intention to use and user satisfaction should play little role in Business Intelligence. If BI is tied to strategic vision for the entire company, users are obliged to use the solution and not their own data sources. Therefore, only use as a variable plays a role.
One major drawback of this framework that we identified, is the concentration on technology. Success of BI initiatives relies on numerous factors that are within the management domain rather than technological factors. Therefore, although the Delone and McLean model of IS success has been applicable to many specific information systems, even those that have been unforeseen when the framework was originally constructed (Delone & McLean, 2003), we think it cannot be applied to Business Intelligence systems without changes.
A noteworthy fact is that Delone and McLean framework not only does not propose any specific measurement methods, but it also avoids specific variable definitions, leaving them to be concretized at the time of framework application, depending on the specific context. According to the framework authors, that was their intended goal (Delone & McLean, 2003).
Key success factors in Business Intelligence, Szymon Adamala & Linus Cidrin
17
Figure 1 - Delone&McLean model for IS success
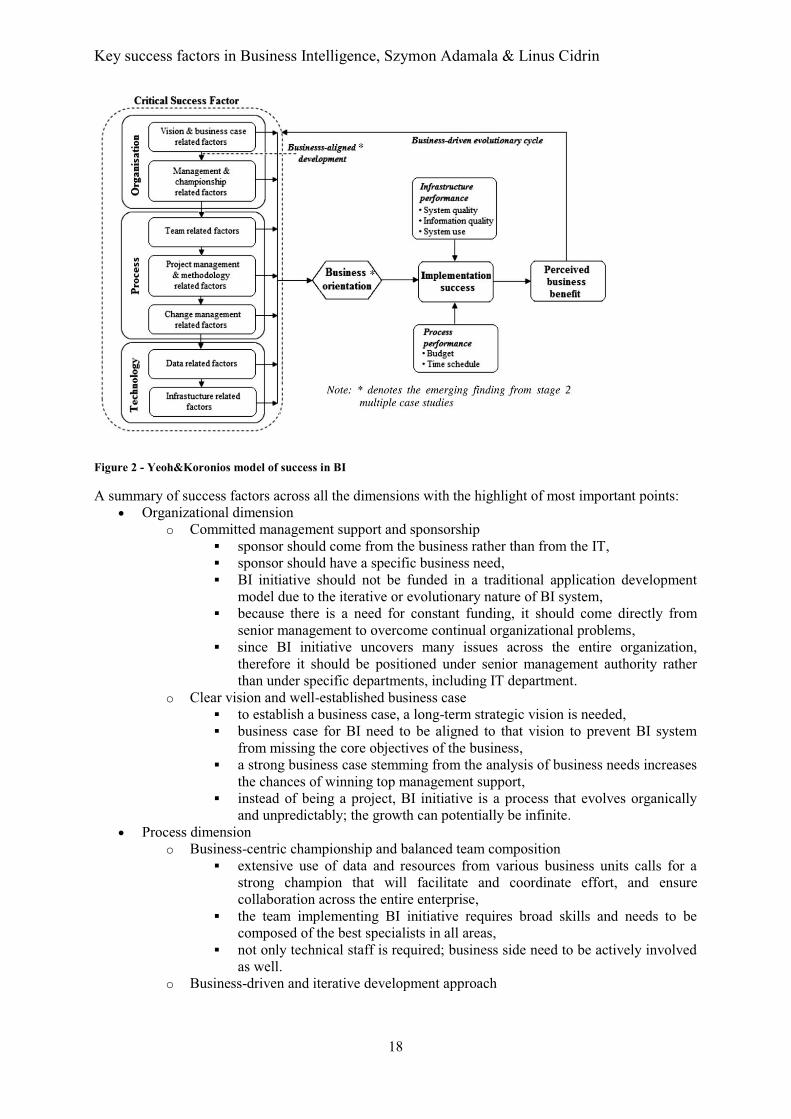
2.2.2. Critical Success Factors for BI Systems “The implementation of a BI system is not a conventional application-based IT project (such as an operational or transactional system), which has been the focus of many CSF studies” (Yeoh & Koronios, 2010). Having noted that, the Yeoh and Koronios proceeded to propose a framework that included some of the critical success factors or success variables from (Delone & McLean, 1992) as its part. System quality, information quality and system use were grouped together and labeled infrastructure performance. As an equal factors group, process performance was proposed, encompassing classical project management variables like budget and time schedule. However, authors emphasized a different set of factors, divided into three broad categories - organization (vision and business case related factors, management and championship related factors), process (team related factors, project management and methodology related factors, change management related factors) and technology (data related factors, infrastructure related factors). All those factors taken together cause business orientation, which in turn, together with before mentioned infrastructure and process performance factors lead to implementation success and, subsequently, to perceived business benefit. This framework is illustrated in the following Figure 2:
Key success factors in Business Intelligence, Szymon Adamala & Linus Cidrin
18
Figure 2 - Yeoh&Koronios model of success in BI
A summary of success factors across all the dimensions with the highlight of most important points: � Organizational dimension
o Committed management support and sponsorship � sponsor should come from the business rather than from the IT, � sponsor should have a specific business need, � BI initiative should not be funded in a traditional application development
model due to the iterative or evolutionary nature of BI system, � because there is a need for constant funding, it should come directly from
senior management to overcome continual organizational problems, � since BI initiative uncovers many issues across the entire organization,
therefore it should be positioned under senior management authority rather than under specific departments, including IT department.
o Clear vision and well-established business case � to establish a business case, a long-term strategic vision is needed, � business case for BI need to be aligned to that vision to prevent BI system
from missing the core objectives of the business, � a strong business case stemming from the analysis of business needs increases
the chances of winning top management support, � instead of being a project, BI initiative is a process that evolves organically
and unpredictably; the growth can potentially be infinite. � Process dimension
o Business-centric championship and balanced team composition � extensive use of data and resources from various business units calls for a
strong champion that will facilitate and coordinate effort, and ensure collaboration across the entire enterprise,
� the team implementing BI initiative requires broad skills and needs to be composed of the best specialists in all areas,
� not only technical staff is required; business side need to be actively involved as well.
o Business-driven and iterative development approach
Key success factors in Business Intelligence, Szymon Adamala & Linus Cidrin
19
� appropriate planning and business-oriented scoping should concentrate on choosing the best opportunities (“low-hanging fruit”),
� planning and scoping allows to adapt to changing requirements, � iterative approach to development is advised in as short increments as
feasible, � iterations should be chosen in such a way that each provides deliverables that
add value to the business. o User-oriented change management
� formal user participation can help meet the expectations of end users, � business users work with the data directly, therefore know it the best, � when done properly, user support will evolve with each development
iteration. � Technological dimension
o Business-driven, scalable and flexible technical framework � flexible and scalable infrastructure design allows for system expansion when
the need arises, � additional data sources (internal or external) could be subsequently added to
the system, � infrastructure involves all technical issues, not only the hardware.
o Sustainable data quality and integrity � quality of data is crucial, not only in the BI system, but also (or rather
especially) at the source systems, � BI system often uncovers data quality issues or database related issues that
were present in the source and not discovered earlier, � common measures and definitions (standardization) allow for cross-functional
and cross-departmental use of the data, � data architecture should be done at the beginning of BI initiative as it becomes
harder to do it as the subsequent iterations are being delivered (Yeoh & Koronios, Critical Success Factors for Business Intelligence Systems, 2010).
This framework is considerably more suited for Business Intelligence systems than the Delone and McLean model of IS success (Delone & McLean, 2003). However, it has a few drawbacks. First, there are no specific measurement criteria proposed. Since several of the variables are defined in a way that very different and broad measurement criteria can be defined or it would be hard to devise measures other than the Likert scale, the framework would be impractical to apply and the results might depend on the subjective opinions of those that provide or calculate variable’s values, resulting in the false prediction of the BI initiative success. Another drawback is an artificial reliance on the Delone and McLean model of IS success (Delone & McLean, 2003). Some infrastructure performance factors (system quality, information quality) belong under technology category (infrastructure related factors or data related factors) and should not be repeated at all or the causal dependency should be included in the framework.
Further criticism of this article (Yeoh & Koronios, 2010) can be based on the way inclusion of technology related factors was performed. “Business-driven, scalable and flexible technical framework” and particular variables that fall into this category are too close to the way the vendor that delivered the solution advertises his product. Also, the fact that (Yeoh & Koronios, 2010) was based on a single project plays down the objectivity of its findings.

Key success factors in Business Intelligence, Szymon Adamala & Linus Cidrin
20
2.2.3. Critical Success Factor Framework for Implementing Business Intelligence Systems
Let us take a look at a qualitative study presented in Critical Success Factor Framework for Implementing Business Intelligence Systems (Yeoh, Gao, & Koronios, 2007), in which the authors performed a Delphi study covering 15 BI systems experts to define a critical success factor framework for implementing business intelligence systems. The authors propose a framework that is organized into seven dimensions covering 22 factors. The seven dimensions of this article (Yeoh, Gao, & Koronios, 2007) are:
� Commitment management support and championship. � User-oriented change management. � Business vision. � Project planning. � Team skills and composition. � Infrastructure-related dimensions. � Data related issues.
The factors in those dimensions are rated by the Delphi panel and a mean is calculated for each dimension. The above list of dimensions is ordered in a falling mean ranking, starting with the dimension with the highest rating. Notable is that more technical dimensions can be found at the very bottom, while non technical dimensions are found higher up in the list.
This article (Yeoh, Gao, & Koronios, 2007) demonstrates that management championship and the presence of a clear vision for Business Intelligence is important when executing a Business Intelligence initiative. While the result from this thesis seems to indicate that the technical factors to be less important than the non-technical, the authors of this article (Yeoh, Gao, & Koronios, 2007) have included two “technical” dimensions out of seven. It should be granted though, that the ratings of the two technical dimensions are the lowest out of the seven.
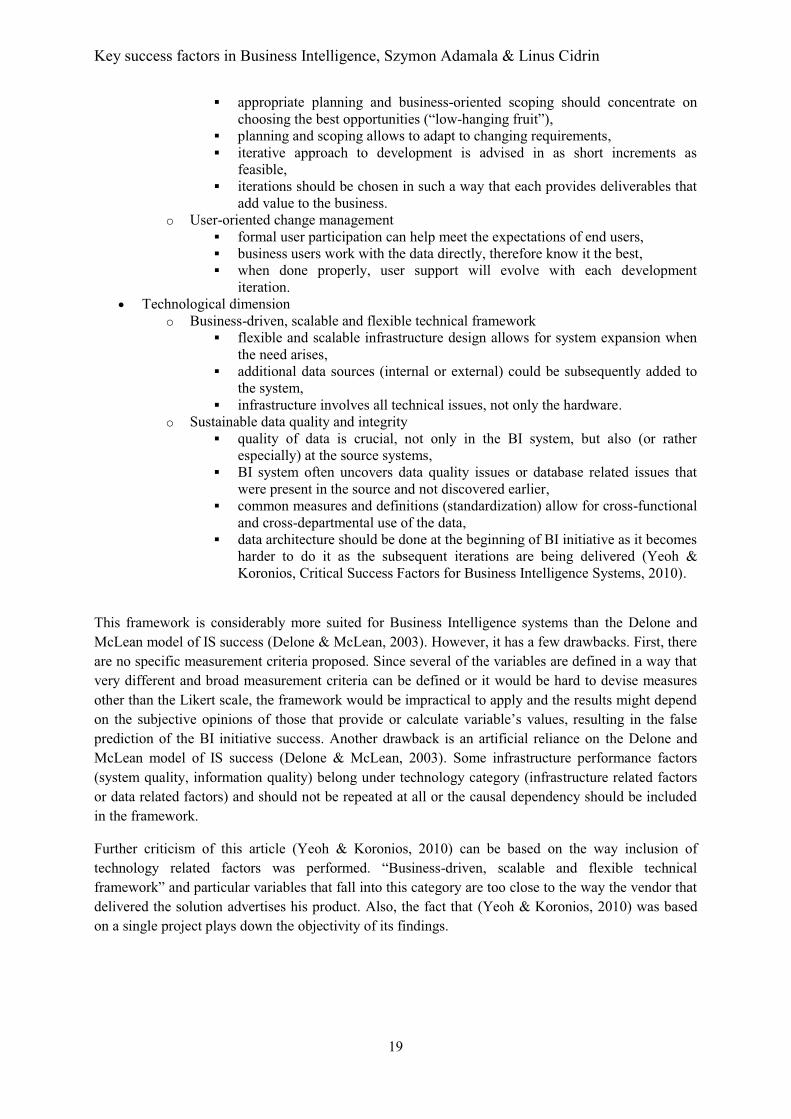
2.2.4. A Structural Model of Data Warehousing Success A Structural Model of Data Warehousing Success (Hwang & Xu, 2008) analyzes several factors influencing data warehousing success. Success is not measured as a separate variable. Instead, following Delone and McLean (Delone & McLean, 1992; 2003), benefits and quality are used as proxy, with a distinction between individual and organizational benefits as well as system and information quality. The independent variables are operational factor, technical factor, schedule factor and economic factor. Authors propose at least two measures for each variable, dependent and independent. A model proposed by authors (see Figure 3) is able to explain between 27% (system quality) and 41% (organizational benefits) of dependent variables variability.
Key success factors in Business Intelligence, Szymon Adamala & Linus Cidrin
21
Figure 3 - Hwang & Xu structural model of data warehousing success
The most prominent difference in approaches is definition of what a variable is and what a measure is. Many measures from this article (Hwang & Xu, 2008) are variables in our study, for example business benefits definition, business benefits measurability or scoping of project. Our aim for objective measurement methods were not one of the goals of Hwang & Xu (2008) and it is unclear how measures proposed in their work should be performed in practice. The authors were overly reliant on the model of IS success (Delone & McLean, 1992; 2003), achieving little explanatory power of their model in return. From the way model was constructed, it is also hard to determine whether technical or non-technical factors play major role in data warehousing success.
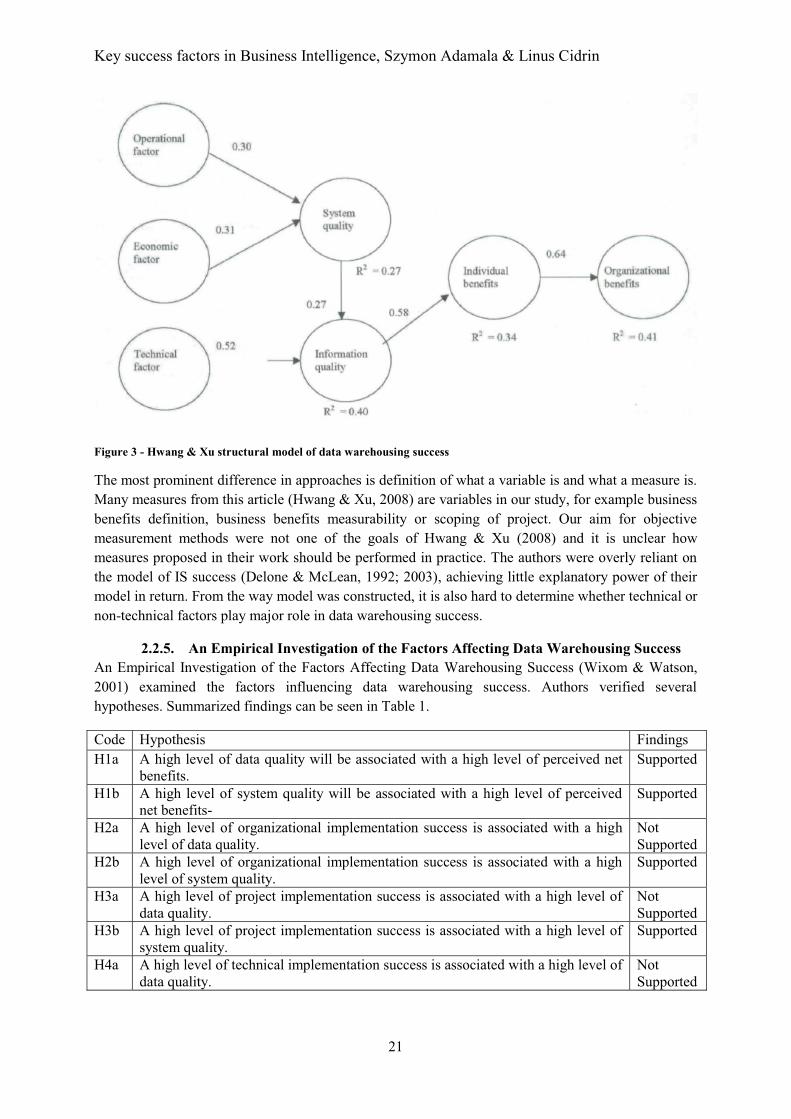
2.2.5. An Empirical Investigation of the Factors Affecting Data Warehousing Success An Empirical Investigation of the Factors Affecting Data Warehousing Success (Wixom & Watson, 2001) examined the factors influencing data warehousing success. Authors verified several hypotheses. Summarized findings can be seen in Table 1.
Code Hypothesis Findings H1a A high level of data quality will be associated with a high level of perceived net
benefits. Supported
H1b A high level of system quality will be associated with a high level of perceived net benefits-
Supported
H2a A high level of organizational implementation success is associated with a high level of data quality.
Not Supported
H2b A high level of organizational implementation success is associated with a high level of system quality.
Supported
H3a A high level of project implementation success is associated with a high level of data quality.
Not Supported
H3b A high level of project implementation success is associated with a high level of system quality.
Supported
H4a A high level of technical implementation success is associated with a high level of data quality.
Not Supported
Key success factors in Business Intelligence, Szymon Adamala & Linus Cidrin
22
Code Hypothesis Findings H4b A high level of technical implementation success is associated with a high level of
system quality. Not Supported
H5 A high level of management support is associated with a high level of organizational implementation success.
Supported
H6a A strong champion presence is associated with a high level of organizational implementation success.
Not Supported
H6b A strong champion presence is associated with a high level of project implementation success.
Not Supported
H7a A high level of resources is associated with a high level of organizational implementation success.
Supported
H7b A high level of resources is associated with a high level of project implementation success.
Supported
H8a A high level of user participation is associated with organizational implementation success.
Supported
H8b A high level of user participation is associated with project implementation success.
Supported
H9a A high level of team skills is associated with project implementation success. Supported H9b A high level of team skills is associated with technical implementation success. Not
Supported H10 High-quality source systems are associated with technical implementation
success. Supported
H11 Better development technology is associated with technical implementation success.
Supported
Table 1 - (Wixom & Watson, 2001) Hypotheses findings
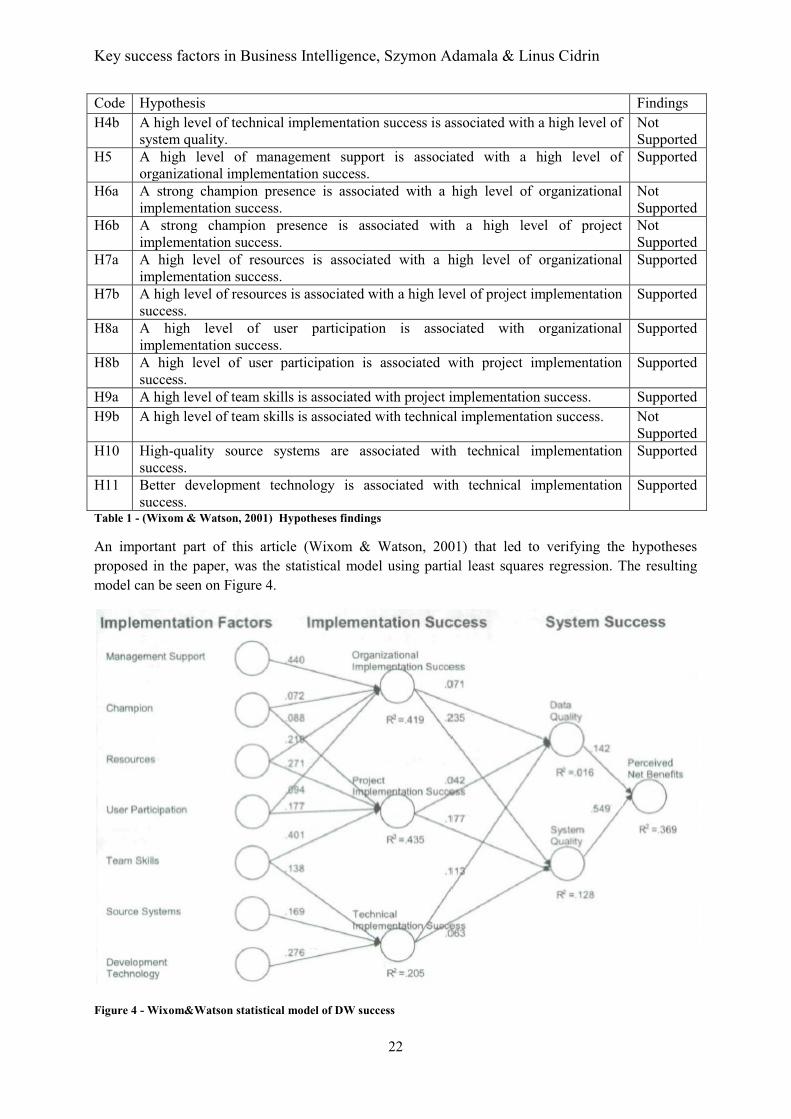
An important part of this article (Wixom & Watson, 2001) that led to verifying the hypotheses proposed in the paper, was the statistical model using partial least squares regression. The resulting model can be seen on Figure 4.
Figure 4 - Wixom&Watson statistical model of DW success
Key success factors in Business Intelligence, Szymon Adamala & Linus Cidrin
23
R2 values obtained by Wixom and Watson (2001), see Figure 4, ranging between 0.016 to 0.435, mean that independent variables used in the model provide limited explanatory power for dependent variables. The model relies on IS success model (Delone & McLean, 1992) with regards to defining system success using a structure of proxy variables – data and system quality, and benefits. Variables used coved both technical and non-technical factors influencing data warehouse implementation success. The way model was constructed makes it impossible to verify whether technical or non-technical factors influence the success more strongly. Also, this article (Wixom & Watson, 2001) did not attempt to propose specific measurement criteria for the variables used.
2.3. Discussion of success factors not classified into frameworks The discussion of success factors of Business Intelligence in the literature is not limited to frameworks. There are many academic articles as well as books targeted at practitioners that treat success factors individually without organizing them, limiting itself into classifying such factors into categories or simply enumerating them. There is little point is comparing which author mentions which particular factor and similarly pointless would be the comparison of such lists. Let us examine what factors are present in the literature.
The main theme of “Impossible Data Warehouse Situations” (Adelman, 2003) is not the success factors of Business Intelligence initiatives. Instead, the authors concentrate on various difficult situations and propose methods to overcome those adversities. Although they do not name those factors as influencing the success itself, some of them should at least be evaluated for possible inclusion in the final framework of this thesis. According to authors, all difficulties can be organized in one of the following categories (the first seven represent management issues, the rest is concerned with technical side):
1. Management issues. 2. Changing requirements and objectives. 3. Justification and budget. 4. Organization and staffing. 5. User issues. 6. Team issues. 7. Project planning and scheduling. 8. Data warehouse standards. 9. Tools and vendors. 10. Security. 11. Data quality. 12. Integration. 13. Data warehouse architecture. 14. Performance.
Authors of “Impossible Data Warehouse Situations” (Adelman, 2003) were devoting at least equal attention to technical issues in general as to all non-technical issues, the latter being mentioned in less detailed discussion. Rather broad and general categories of “user issues”, “team issues”, “organization and staffing” etc. diminish the objectivity as well as both practical and theoretical applicability of author’s propositions. There are also terminological differences, for example, “data warehouse usage” is a measure for Adelman while it is a variable for Delone (1992).
Legodi and Barry noted that data warehousing implementation projects have high estimated failure rates, up to about 50% (Legodi & Barry, 2010). The objective of their paper and the study was to investigate the main areas of risk for these projects, and a Delphi method was used for the data

Key success factors in Business Intelligence, Szymon Adamala & Linus Cidrin
24
collection. The study was performed in South Africa. Results from the study are in the form of the main problems and the success factors for this type of project. The identified factors that have the greatest impact on success from the study (Legodi & Barry, 2010) can be found in the following list (listed in priority order):
1. Scope Creep. 2. Uncontrolled Finances. 3. Poor Communication. 4. Stake Holder Non-Involvement. 5. Skills Shortage. 6. Unavailability of Tools and Technology. 7. Uncontrolled Quality of Deliverables. 8. Poor, Wrong or No Leader. 9. Technical Difficulties. 10. Legal Difficulties.
Notable here is that the first technical difficulties can be found in the ninth item. (Legodi & Barry, 2010) show that non technical factors affect the success of a project the most. Out of the ten factors from (Legodi & Barry, 2010), only one were of technical nature and placed as the ninth factor (Technical difficulties). The fourth item, stakeholder non-involvement, can be comparable to the importance of vision and addressing a specific business need of the sponsor. While the paper surveyed a more narrowly defined geography (South Africa), the finding that non-technological factors dominate seems to be shared between that paper and this thesis.
The variables used in a study by Shin (2003) are system throughput, ease of use, ability to locate data, access authorization, data quality (subdivided into 4 more detailed categories of recency/currency, level of detail, accuracy and consistency), information utility, user training and user satisfaction, with the latter being used as dependent variable. The data was gathered from a single large US enterprise, based on a single project, therefore even the author agrees that his study can be treated as a case study (Shin, 2003, p. 157). Author found that 70% of end user satisfaction can be explained by the independent variables he measured.
Shin (Shin, 2003) approaches data warehousing success treating end user satisfaction as a proxy for project success. This is inconsistent with Delone and McLean approach (Delone & McLean, 1992; 2003) which Shin cited and claimed to be “the most influential model in conducting research on information systems success factors” (Shin, 2003, p. 144). It is worth noting that variables used by Shin (2003) describe predominantly technological factors. Because in our thesis actual use is only one of the variables, the results are hardly comparable. Also, a case study approach concentrated on success within just one company makes this article (Shin, 2003) less valuable for creating data warehousing or Business Intelligence success criteria framework as the results are not general in nature.
The study conducted in Current Practices in Data Warehousing (Watson, Annino, Wixom, Avery, & Rutherford, 2001) concentrated on some of the factors influencing data warehousing projects success. Survey respondents were asked to provide answers to questions about who sponsored the data warehouse, which organization unit was the driving force behind the initiative, about solution architecture and end users, about implementation costs, operational costs, solution approval process, after implementation assessment, realization of expected benefits (together with the expectations). To
Key success factors in Business Intelligence, Szymon Adamala & Linus Cidrin
25
describe success, two questions were used, one about ROI and the other about perceived successfulness of implementation.
Although the authors gathered enough data to analyze the dependency of individual factors with success or to build a statistical model of several variables, they have chosen not to do so. Instead, they analyzed individual questions, summarizing contemporary practices. Example findings would be that most data warehouse sponsors come from business units and no single architecture dominates all implementations (Watson, Annino, Wixom, Avery, & Rutherford, 2001). This article (Watson, Annino, Wixom, Avery, & Rutherford, 2001) did not attempt to propose any objective measurement methods for variables included in the study.
Measuring User Satisfaction with Data Warehouses: An Exploratory Study (Chen, Soliman, Mao, & Frolick, 2000) used end user satisfaction as a proxy for success and examined factors influencing the aforementioned user satisfaction. Study results identify three factors comprising several questions each. Those factors are: support provided to end users, accuracy, format and preciseness of data, and fulfillment of end user needs. Authors did not propose a framework for success and did not attempt to build a statistical model. They also did not attempt to develop objective and universal measurement methods for the variables identified.
Treatment of end user satisfaction as a proxy for project success and the goal to identify only the factors that influence this variable makes it difficult to compare the results with other articles. Authors (Chen, Soliman, Mao, & Frolick, 2000) claimed to had relied on the model of IS success (Delone & McLean, 1992), but included only one of the “use” variables presented there. They also used one of the Delone and McLean’s independent variables as a depended variable. It is impossible to tell whether technical or non-technical factors are more important to project success according to this article (Chen, Soliman, Mao, & Frolick, 2000) and as mentioned above, there are no objective measurement methods proposed.
2.4. Other aspects relevant for BI success
2.4.1. Competing Value Model Since different stakeholders will look at different criteria to determine if the initiative was a successful one, different perspectives may need to be taken into account. This issue of potentially conflicting criteria has been discussed by Walton and Dawson in their Competing Value Model which organizes criteria in different dimensions (Walton & Dawson, 2001). This could be present in BI initiatives, where different stakeholders can have different non-overlapping criteria for success, for example a system integrator can have different objectives for engaging in a BI initiative, different from the end user organization (the customer).
2.5. Literature review summary Although there exist numerous frameworks concerning Business Intelligence success factors, none of them offer high explanatory power. No more than 40% of success can be explained using the existing theory which means that controlling for the variables identified in those frameworks does not guarantee success of BI project. Moreover, there are profound differences that make it difficult to form a coherent body of theory. Those differences range from the inconsistent use of terminology or lack of agreement regarding what the success is (and what might be used as its proxy), through little or no propositions how to measure the variables, to the differences in the actual choice of variables selected for inclusion in the framework.

Key success factors in Business Intelligence, Szymon Adamala & Linus Cidrin
26
Many of the articles treating Business Intelligence success are either mostly based on literature review or are themselves case studies, based on a single project or just a few of them. Even if quantitative methods were used, the data points were obtained from a single project. There is no guarantee that the findings of those articles could be applicable for all Business Intelligence projects in general.
All of the above arguments (profound differences in treatment, limited explanatory power of frameworks and lack of qualitative studies encompassing large number of projects) suggest that the theory available for explaining Business Intelligence success factors is still underdeveloped and there is a lot of room for research in this area. This would be in line with the dates of those articles’ publication. Most of the articles are just a few years old, especially those specialized in BI). Even the oldest framework, Delone and McLean model of IS success (not focused on BI) created in 1992 had been updated in 2003.
For this reason, the theory review performed in this chapter is useful only twofold. First, it makes available the collection of variables that could be potentially selected for use in the primary research. Second, it highlights some shortcomings of existing frameworks and makes it easier to avoid such pitfalls when constructing own framework. However, rather than building upon the existing theory, there is a need to construct another framework, one that would offer a higher explanatory power and be free of some drawbacks of the existing frameworks.
Key success factors in Business Intelligence, Szymon Adamala & Linus Cidrin
27
3. Research Method The work with the thesis was divided into four main phases; each phase is described in the following subchapters. The first two phases will be dedicated to studying literature in order to conclude what has been written earlier on the subject and to develop a theoretical framework for the thesis. The early phases consisted mostly of secondary research, primarily to determine recent viewpoints on areas like the factors influencing BI success and failures, and measurement methods available and suitable for measuring the variables that will form part of the framework developed in the later phases. Secondary research was performed on both academic sources and sources external to academia. Academic sources primarily included published articles (including the ones outlined below). Non-academic information were sourced from trade and industry associations and vendor published papers.
The latter phases were focused on validating the framework via quantitative methods and on comparing and contrasting the authors’ framework to those published by others. Primary research was performed by utilizing questionnaires gathering information from organizations that have deployed BI, mostly system integrators and other service providers, active in the field of BI in Poland. Primary research was conducted, to a large extent, in order to base, validate andsubstantiate the framework developed during the earlier phases. As a last step, the authors’ proposed framework was compared to those of others.
3.1. Phases of research
3.1.1. Phase 1 – Initial literature review In the first phase of study, the authors performed secondary research to gather material from existing literature around all of the five hypotheses. The literature study collected:
● Critical success factors (CSFs) of BI initiatives that have been suggested by previous work. ● The importance and significance of different CSFs on the success of BI initiatives that has
been identified in academic literature. ● Different measurement methods available and suitable for measuring the variables that will
form part of the framework to be suggested in the later phases of the thesis work.
The secondary data was based on a number of different sources, with research papers on the subject, for example (Yeah & Koroniios, 2010; Markarian, Brobst & Bedell, 2007; Ariyachandra & Watson, 2006; Delone & McLean, 2003) as main references.
Phase 1 of the research was concentrated on all the hypotheses proposed in this thesis.
3.1.2. Phase 2 – Primary research Phase 2 goal was to gather data to allow authors to construct the BI success factors framework and provide proof for existence of correlation between CSFs of BI initiatives and their ultimate success.
For primary research, surveys were used. 68 fully completed surveys were obtained. The results were analyzed using quantitative methods - simple statistics (mean, mode, median) performed on individual questions, correlation analysis of individual variables with the dependent variable of success and Partial Least Squares Regression (PLS-R) used to build the target framework. Internet-based e-surveys were used. Two different kinds of participants were targeted:
1. Subject matter practitioners that worked on the same projects as authors. 2. Subject matter practitioners found in LinkedIn social network.
Key success factors in Business Intelligence, Szymon Adamala & Linus Cidrin
28
3.1.3. Phase 3 - Framework construction After completing the primary research, the authors proposed their own framework for BI initiatives success, using the prior research as a starting point. The framework was separated from the measurement methods to maintain the flexibility and applicability of the framework in various contexts. However, the measurement methods were also proposed. Keeping those two separated will allow any future studies to propose different measurement for the variables. Also, a fact of importance is that it is much easier to combine a theoretical framework with specific measurement methods if they are kept separate than to split them if they are merged in a single framework. Therefore, the authors have decided to separately propose a theoretical framework and specific measurement methods for each of the variables.
3.1.4. Phase 4 – Secondary research Phase 4 of the research was the comparison of phase 2 findings and a framework proposed in phase 3 with the existing literature. This phase extends the list of readings beyond the scope of phase 1 of the research.
3.2. Sampling Each single data point / measurement was a distinct Business Intelligence project. This implies that several measurements could have been obtained from a single vendor, customer or individual, provided that each of those measurements described distinct project. Each survey contained optional questions about customer and vendor company names, project name, place where the project was performed as well as whether the survey participant was involved in a project on customer or vendor side, and a precise project role of the participant. As already mentioned, two sampling methods were used.
3.2.1. Subject matter practitioners that had worked in the same companies as authors Approximately 30 of authors’ professional associates had been selected for survey participation. The criteria for inclusion were not random. To ensure all participants provide distinct data points, each candidate’s professional experience was analyzed with respect to the projects they had participated in. In cases where there was a choice between several candidates for a single project, selection was based on participant’s role in the project, customer company, vendor company and whether a person was part of vendor or customer side. Because most of the respondents in this group are located in Poland and participated in BI projects primarily in this country, this selection criterion causes this thesis’ focus on the Polish BI market. Receiving surveys from this group cannot be clearly classified as a sampling procedure. It might be treated as a convenience sample (practitioners were chosen because they were personally known to one of the authors), but also as a judgement sample (the analysis of experience described earlier in this paragraph). Despite being a non-probability sample, it is still representative of the entire population of projects2. Practitioners included in this group no longer work together; instead, they work in many different companies and undertake various projects. Taken together, they cover the entire population of projects. One thing to note is that a single sample corresponded to a project while the convenience of the sampling method was based on a project participant characteristic rather than that of the project.
2 If the argument is still inconvincing to the reader, Appendix IV analyzes the differences in projects in Poland and outside Poland according to the results obtained in the survey. Projects in Poland mostly correspond to the non-probability sample while projects outside Poland were mostly described by the respondents of the probability sample. The differences in results received in those two samples were insignificant.
Key success factors in Business Intelligence, Szymon Adamala & Linus Cidrin
29
3.2.2. Subject matter practitioners found in LinkedIn social network LinkedIn.com is a social network for maintaining professional contacts. There are several interest groups present in this portal. Some of them are open for every participant; others are accessible only through an invitation. Leveraging authors’ group membership, a link to the questionnaire was posted on a dozen of groups’ discussion boards. Member count in each of the groups ranges from 1052 to 56191. The same internet based e-survey was used to obtain the data from this group of participants. Most of the respondents describing BI projects outside Poland were in this group. Because the authors had no influence over who responds to the survey and which project is being described, this was a simple random sample.
3.2.3. Sample size Both samples were considered equal in terms of their reliability and representativeness3. Therefore, sample size was determined together for both samples with the intention of performing a joint analysis of data obtained from both samples. The sample size was determined predominantly on the feasibility of performing the survey within the time limits of a thesis. It was planned to obtain 70 fully completed surveys. It is notable that the choice of sample size was influenced by the choice of statistical method to be applied as outlined in subchapter 3.3.8 on page 31. Had another statistical method be chosen for analysis, the requirement for sample size would have been higher.
3.3. Choice of method Initial secondary research revealed that some of independent variables chosen by authors are correlated. Because of this and the fact that authors aimed at analyzing direct dependency of all independent variables with success, there was very high probability of multicollinearity in the data. For this reason, a method of data analysis insensitive for multicollinearity had to be chosen. Also, because of high number of independent variables chosen based on phase 1 findings and relatively low number of observations obtained through the survey, an appropriate method had to bo chosen. Both requirements combined were satisfied by Partial Least Squares regression, a method that “was designed to deal with (…) regression when data has small sample, missing values, or multicollinearity” (Pirouz, 2006).
The details of certain choices is outlined in the following subchapters.
3.3.1. Qualitative versus quantitative method Because in this thesis we wanted to test and verify certain hypotheses and obtain the results that will be general in nature regardless of the sample population membership, the most obvious choice was to apply a quantitative method. As shown in the preceding chapter, qualitative methods were already utilized in the existing literature. Even when statistical methods were used, they were mainly applied in the context of qualitative study – applied to case studies of a single project or few projects.
3.3.2. Primary versus secondary data There was no secondary data available that could be analyzed in this thesis utilizing the quantitative method. Therefore, the only available choice was to obtain the primary data. This had the advantage of getting exactly the data that was needed for this particular study and the main disadvantage of the time required to collect the data.
3.3.3. Experiments versus observations versus communication methods Experiment was clearly infeasible because of the costs and time required to conduct a number of Business Intelligence projects. Similarly, observations were impossible because of the time span of BI
3 See Appendix IV for proof that it was indeed the case
Key success factors in Business Intelligence, Szymon Adamala & Linus Cidrin
30
projects that exceeds the time available for writing this thesis. Therefore, the only available method for use in this thesis was communication. The other benefits of this choice were better control over data collection scope and lower cost of obtaining the data. However, objectivity, precision and accuracy were potentially.
3.3.4. Survey versus interview The choice between a survey and an interview was also an easy one. Survey is better suited for obtaining the data for quantitative analysis than an interview and takes less time to perform, therefore yielding more data points.
3.3.5. Analytic versus descriptive survey Because the factors influencing Business Inteligence project success have already been identified in the literature, there was no needto perform a descriptive survey. Instead, an analytic survey was necessary in order to gain insights into the relationships between the already identified independent variables and the success.
3.3.6. Survey delivery method Personal delivery of survey was immediately ruled out as infeasible, especially on a random sample. Similarly, electronic or ordinary mail was impossible to use due to the fact that on a random sample, the addresses were unknown. Identical argument applies to performing the survey over the phone. The survey was published in the internet using one of the electronic survey websites. The link was delivered to the random sample by posting messages in appropriate forums and to the convenience sample by email (because the addresses were known in this case). When necessary, reminders were sent using similar methods. In the convenience sample, reminders were also performed in person or over the phone.
3.3.7. Survey versus case study Despite the fact that case study is an example of an observation method while case study is an example of a communication method, the two are most commonly used in business studies. Moreover, case study was used in most of the literature relevant to the topic of this thesis while the survey has been used in this case. Let us compare the two methods directly to motivate our choice even further.
Both a survey based approach and a case study based approach have strengths and weaknesses and for the most part where one of them is strong, the other is weak. In an ideal situation with unlimited resources and time, an approach that combines the two could be utilized. Given the limited time and resources for this thesis and other boundary conditions, the authors chose the survey based approach. One key aspect of this thesis is to produce a framework for Business Intelligence success, generalizable across different business intelligence initiatives. To that extent the thesis utilized a survey-based method. This since a survey based method likely will produce generalizable results given appropriately stated survey questions while the case study approach is less likely to produce generalizable results compared to a survey based approach. Case study based method’s problem of allowing for generalizability has been discussed many authors, including Lee (1989). Repeatability of the results is another aspect discussed by Lee (1989). Case study based research do often have a problem of the results being hard to replicate, i.e. to verify the findings in a new, independent study. Repeatability is another important aspect chosen for this thesis.
3.3.8. The choice of statistical method for data analysis When a quantitative method is applied, it is very important to choose an appropriate statistical method to get the desired result. There are many aspects that need to taken into account. Because this thesis aimed at developing the tools for explaining the success of Business Intelligence projects, two
Key success factors in Business Intelligence, Szymon Adamala & Linus Cidrin
31
methods were potentially applicable. First, the relationship between each individual independent variable and success had to be investigated to determine the variables that do or do not have an impact on the success. This was accomplished by inspecting the correlation of individual variables with the success. From all the methods for computing correlation, Spearman’s rank correlation was chosen because of being a method dedicated for calculating correlation when the variables are measured using discrete scales similar to the one proposed in the survey.
After inspecting individual variables correlation with success, the multiple regression method had to be chosen to inspect the impact on success of several independent variables at once. The most popular linear regression methods were immediately ruled out because of their inability to cope with multicollinearity in data. We were certain there will be correlation between individual variables and this intuition was also confirmed in the literature. For this reason, a specialized method insensitive to multicollinearity had to be chosen.
Another important factor in the choice of method was the number of required data points in relation to the number of variables used. The characteristics of our goals called for a large number of independent variables, but most regression methods have very high requirements for the number of observations compared to the number of variables. It is notable that this requirement was considered before determining the desired sample size for the survey, not vice versa.
There was only one statistical method known to authors that met both abovementioned selection criteria. For this reason, Partial Least Squares regresson (PLS-R) was chosen as a desired method of choice for analyzing the data.
Key success factors in Business Intelligence, Szymon Adamala & Linus Cidrin
32
4. Research results and analysis This chapter presents research results and the analysis that can be drawn from the data collected. Firstly, in 4.1, individual variables and their impact on Business Intelligence project success are analyzed. Secondly, in 4.2, survey results are analyzed using the Partial Least Squares regression method and a statistical model of Business intelligence success is built. Thirdly, in 4.3, an analysis of objective measures for each of the success factors of BI initiatives are presented. Finally, in 4.4, the results and analysis centered around the hypotheses of this thesis are outlined.
As already mentioned, this thesis omits trying to define what BI project success looks like. Instead, to determine whether a project is successful or not, the following interpretation from the survey results have been made throughout the thesis.
� Successful project/initiative - Project with answers “definitely yes” and “rather yes” to the question Q19:1 - “Was the project you are describing successful?”
� Non-successful project/initiative - Project with answers “neutral”, “rather no” and “definitely no” to the question Q19:1 - “Was the project you are describing successful?”. That is, non-successful means unsuccessful or neutral.
The reason behind such a distinction is that this thesis aims for developing tools that managers could use to achieve success. Merely avoiding failure is not good enough. If the project failed to achieve success, it cannot be treated as a mild success or neutral. Instead, it should be considered a not successful project.
4.1. Analysis of individual variables’ impact on BI success In this section, individual variables relevant to Business Intelligence projects’ success are analyzed. All variables discussed here are based on the results of the survey and each subchapter is labeled with the question number. Not all questions are presented, only those that are part of the final framework or those that show significant differences for successful and non-successful projects. Variables that are not part of the final framework and, at the same time, are not distinguishing successful projects from non-successful ones are left out.
4.1.1. Question 10. How was the project funded? Results from the survey seem to indicate that the funding of successful initiatives and non-successful ones differs. Successful initiatives are more likely to be funded in a phased approach, with separate budgets for each iteration, while the non-successful tend to be funded in a traditional way as other IT projects, i.e. one budget for the entire project. The below chart (Figure 5) illustrates the results from question 10.

Key success factors in Business Intelligence, Szymon Adamala & Linus Cidrin
33
Figure 5 - Survey results for question 10 - How was the project funded
4.1.2. Question 14 - When iterative development was used, did each iteration provide business value by itself?
Iterative development is used by both successful and non-successful initiatives. Results from the survey show that for an overwhelming majority (89%) of the successful initiatives, each of the iterations provided business value by itself. For the non-successful initiatives that used an iterative approach, every other initiative had iterations that provided business value by itself. The aforementioned differences are presented on Figure 6.
Figure 6 - Survey results for question 14 - When iterative development was used, did each iteration provide business value by itself
4.1.3. Question 19:3 - Did the end users use the data warehouse / BI solution provided? Question 19:3 asks whether users did use the BI solution provided. A whopping 96% of the successful initiatives have users that actually use the Business Intelligence solution. The results for the non-successful ones vary, as shown on Figure 7.
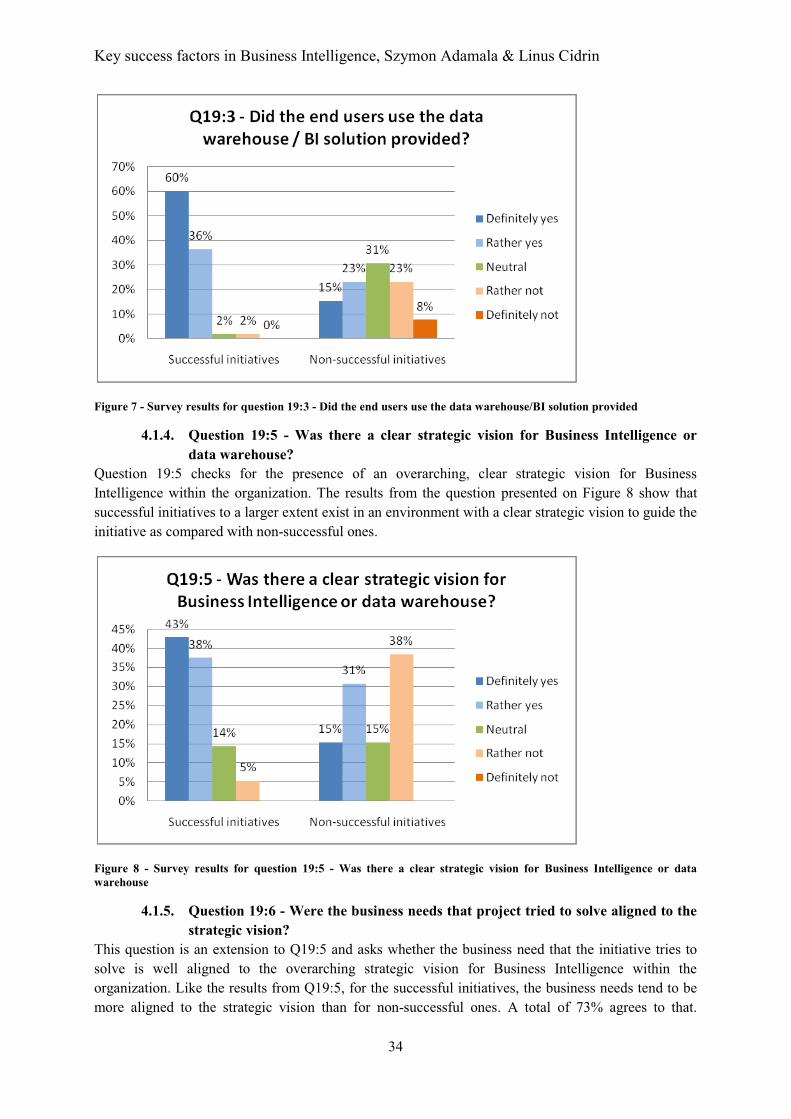
Key success factors in Business Intelligence, Szymon Adamala & Linus Cidrin
34
Figure 7 - Survey results for question 19:3 - Did the end users use the data warehouse/BI solution provided
4.1.4. Question 19:5 - Was there a clear strategic vision for Business Intelligence or data warehouse?
Question 19:5 checks for the presence of an overarching, clear strategic vision for Business Intelligence within the organization. The results from the question presented on Figure 8 show that successful initiatives to a larger extent exist in an environment with a clear strategic vision to guide the initiative as compared with non-successful ones.
Figure 8 - Survey results for question 19:5 - Was there a clear strategic vision for Business Intelligence or data warehouse
4.1.5. Question 19:6 - Were the business needs that project tried to solve aligned to the strategic vision?
This question is an extension to Q19:5 and asks whether the business need that the initiative tries to solve is well aligned to the overarching strategic vision for Business Intelligence within the organization. Like the results from Q19:5, for the successful initiatives, the business needs tend to be more aligned to the strategic vision than for non-successful ones. A total of 73% agrees to that.
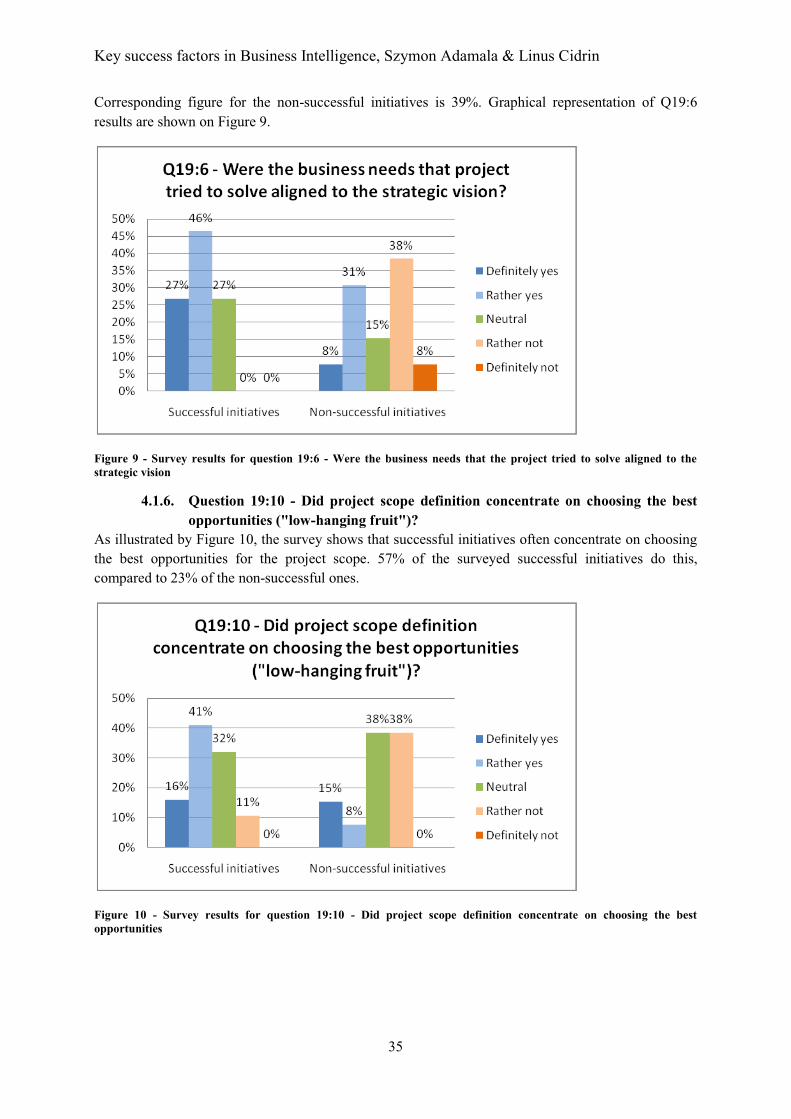
Key success factors in Business Intelligence, Szymon Adamala & Linus Cidrin
35
Corresponding figure for the non-successful initiatives is 39%. Graphical representation of Q19:6 results are shown on Figure 9.
Figure 9 - Survey results for question 19:6 - Were the business needs that the project tried to solve aligned to the strategic vision
4.1.6. Question 19:10 - Did project scope definition concentrate on choosing the best opportunities ("low-hanging fruit")?
As illustrated by Figure 10, the survey shows that successful initiatives often concentrate on choosing the best opportunities for the project scope. 57% of the surveyed successful initiatives do this, compared to 23% of the non-successful ones.
Figure 10 - Survey results for question 19:10 - Did project scope definition concentrate on choosing the best opportunities
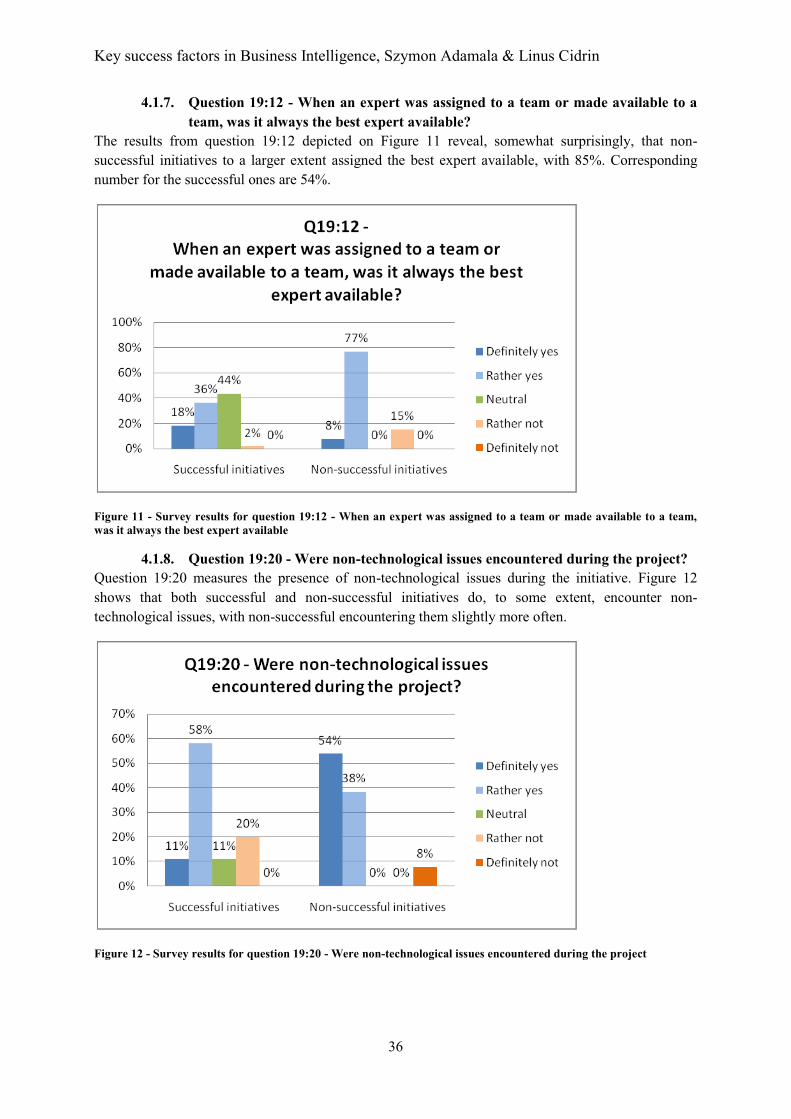
Key success factors in Business Intelligence, Szymon Adamala & Linus Cidrin
36
4.1.7. Question 19:12 - When an expert was assigned to a team or made available to a team, was it always the best expert available?
The results from question 19:12 depicted on Figure 11 reveal, somewhat surprisingly, that non-successful initiatives to a larger extent assigned the best expert available, with 85%. Corresponding number for the successful ones are 54%.
Figure 11 - Survey results for question 19:12 - When an expert was assigned to a team or made available to a team, was it always the best expert available
4.1.8. Question 19:20 - Were non-technological issues encountered during the project? Question 19:20 measures the presence of non-technological issues during the initiative. Figure 12 shows that both successful and non-successful initiatives do, to some extent, encounter non-technological issues, with non-successful encountering them slightly more often.
Figure 12 - Survey results for question 19:20 - Were non-technological issues encountered during the project
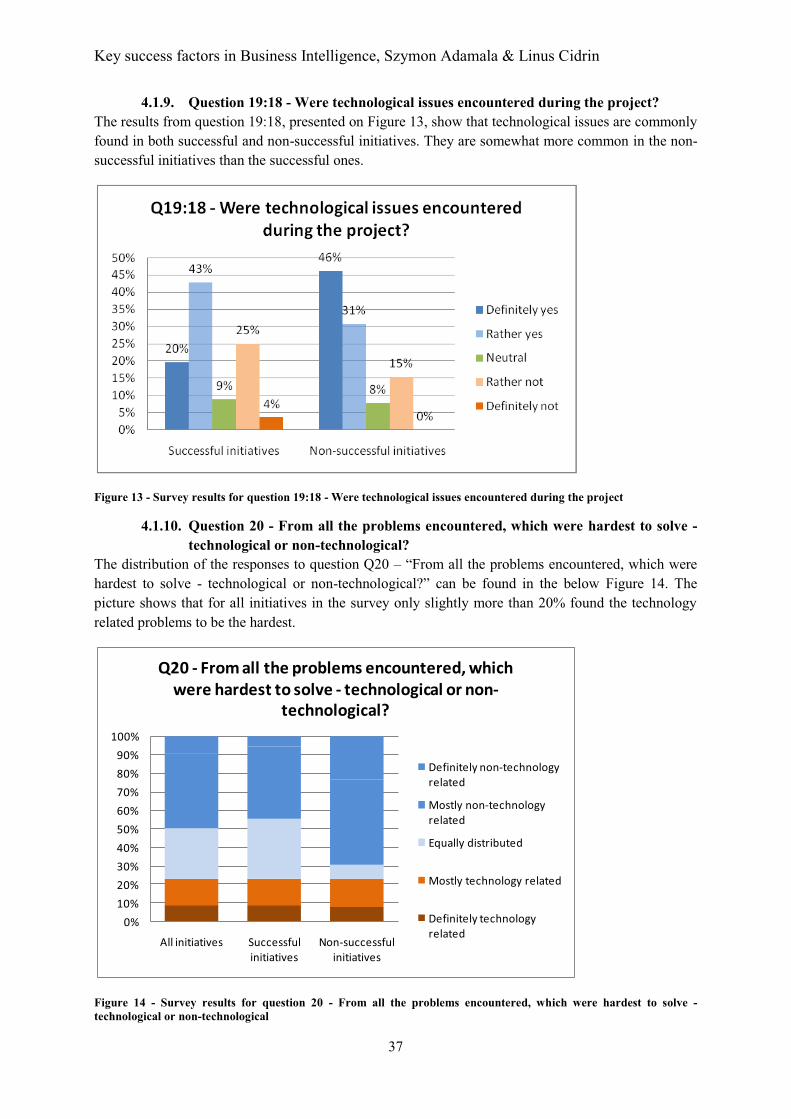
Key success factors in Business Intelligence, Szymon Adamala & Linus Cidrin
37
4.1.9. Question 19:18 - Were technological issues encountered during the project? The results from question 19:18, presented on Figure 13, show that technological issues are commonly found in both successful and non-successful initiatives. They are somewhat more common in the non-successful initiatives than the successful ones.
Figure 13 - Survey results for question 19:18 - Were technological issues encountered during the project
4.1.10. Question 20 - From all the problems encountered, which were hardest to solve - technological or non-technological?
The distribution of the responses to question Q20 – “From all the problems encountered, which were hardest to solve - technological or non-technological?” can be found in the below Figure 14. The picture shows that for all initiatives in the survey only slightly more than 20% found the technology related problems to be the hardest.
Figure 14 - Survey results for question 20 - From all the problems encountered, which were hardest to solve - technological or non-technological
0%10%20%30%40%50%60%70%80%90%
100%
All initiatives Successful initiatives
Non-successful initiatives
Q20 - From all the problems encountered, which were hardest to solve - technological or non-
technological?
Definitely non-technology related
Mostly non-technology related
Equally distributed
Mostly technology related
Definitely technology related
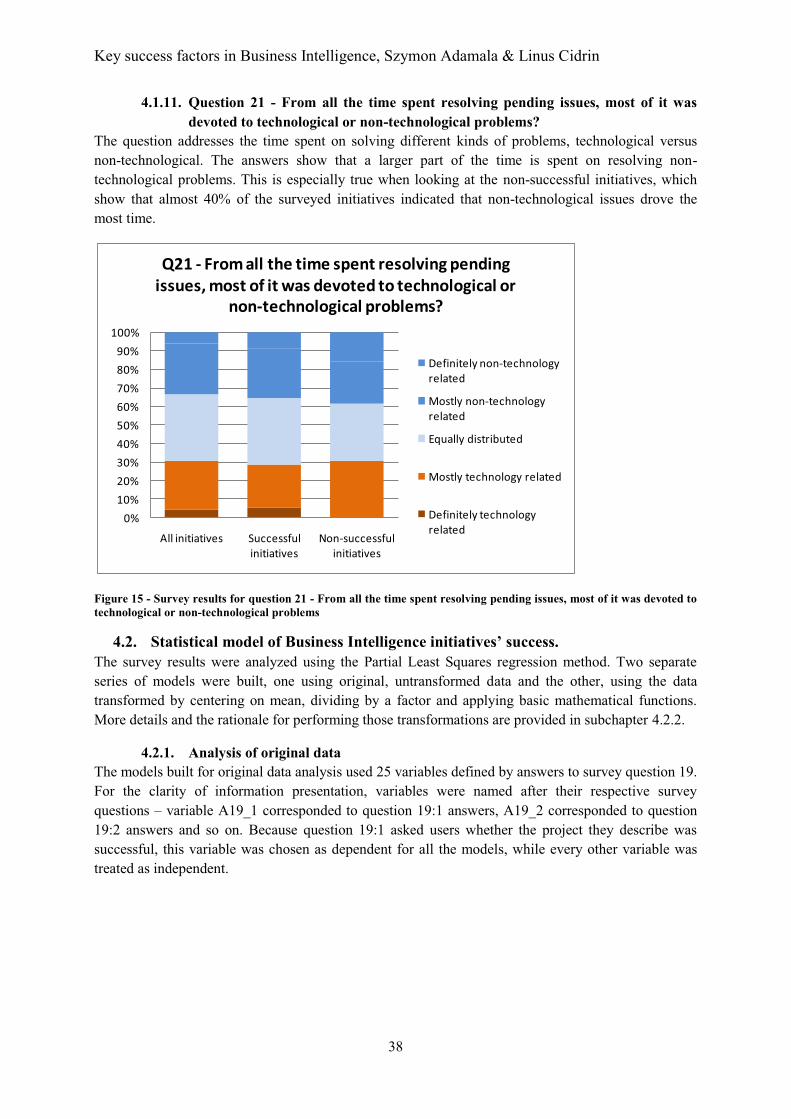
Key success factors in Business Intelligence, Szymon Adamala & Linus Cidrin
38
4.1.11. Question 21 - From all the time spent resolving pending issues, most of it was devoted to technological or non-technological problems?
The question addresses the time spent on solving different kinds of problems, technological versus non-technological. The answers show that a larger part of the time is spent on resolving non-technological problems. This is especially true when looking at the non-successful initiatives, which show that almost 40% of the surveyed initiatives indicated that non-technological issues drove the most time.
Figure 15 - Survey results for question 21 - From all the time spent resolving pending issues, most of it was devoted to technological or non-technological problems
4.2. Statistical model of Business Intelligence initiatives’ success. The survey results were analyzed using the Partial Least Squares regression method. Two separate series of models were built, one using original, untransformed data and the other, using the data transformed by centering on mean, dividing by a factor and applying basic mathematical functions. More details and the rationale for performing those transformations are provided in subchapter 4.2.2.
4.2.1. Analysis of original data The models built for original data analysis used 25 variables defined by answers to survey question 19. For the clarity of information presentation, variables were named after their respective survey questions – variable A19_1 corresponded to question 19:1 answers, A19_2 corresponded to question 19:2 answers and so on. Because question 19:1 asked users whether the project they describe was successful, this variable was chosen as dependent for all the models, while every other variable was treated as independent.
0%10%20%30%40%50%60%70%80%90%
100%
All initiatives Successful initiatives
Non-successful initiatives
Q21 - From all the time spent resolving pending issues, most of it was devoted to technological or
non-technological problems?
Definitely non-technology related
Mostly non-technology related
Equally distributed
Mostly technology related
Definitely technology related

Key success factors in Business Intelligence, Szymon Adamala & Linus Cidrin
39
Model 1
Figure 16 - Trivial PLS regression model
The first attempt used all available independent variables grouped together. The model had R2 equal to 0.494, which means slightly less than half of success can be explained using linear combination of factors (independent variables) used in this model. Resulting regression model can be seen on Figure 16.
Model 2 Unlike other linear regression methods, adding more variables does not necessarily imply an increase of model’s R2. The method cannot be used to eliminate insignificant variables, which is easily achievable in other linear regression methods. Therefore, the model that used all the available variables was not necessarily the best. Because the method cannot eliminate insignificant variables by setting the linear combination coefficients to 0 (or even close to 0), other models that used less variables were built.
Choice of variables that explain success should be made based on individual independent variables’ correlation with the dependent variable. After some experimentation, 5 variables with correlation with success stronger than 0.4 were chosen (absolute value of correlation coefficient greater than 0.4).
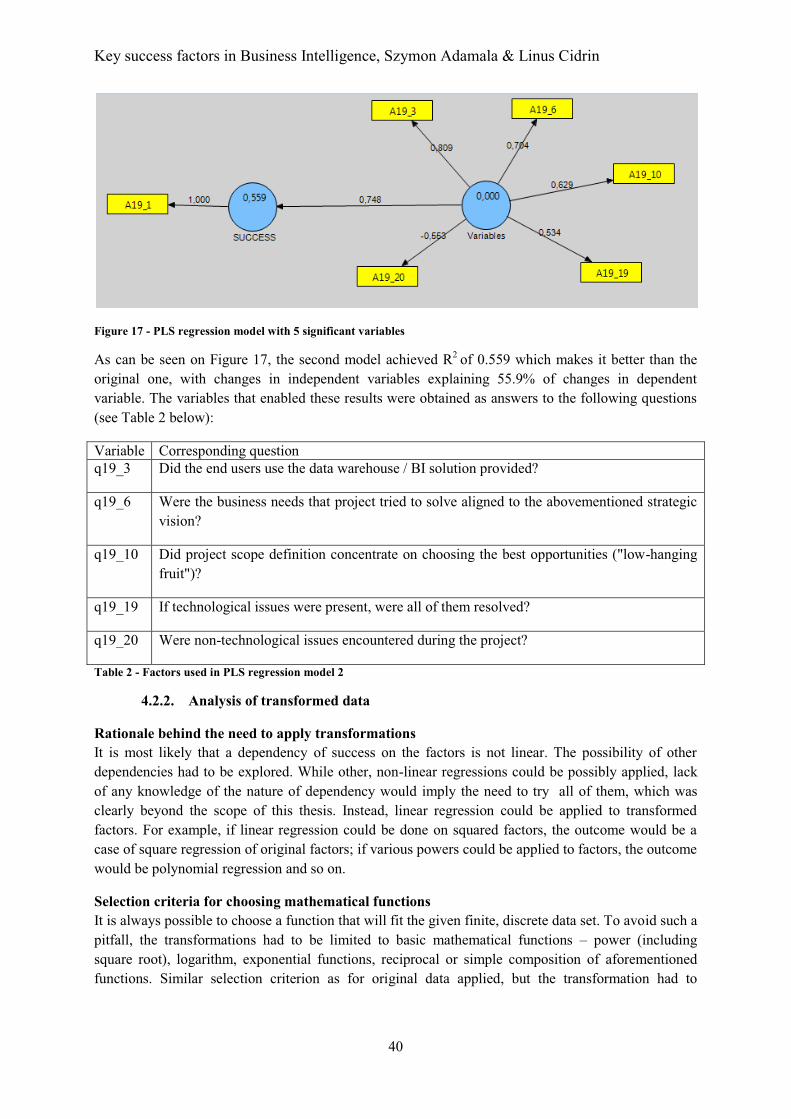
Key success factors in Business Intelligence, Szymon Adamala & Linus Cidrin
40
Figure 17 - PLS regression model with 5 significant variables
As can be seen on Figure 17, the second model achieved R2 of 0.559 which makes it better than the original one, with changes in independent variables explaining 55.9% of changes in dependent variable. The variables that enabled these results were obtained as answers to the following questions (see Table 2 below):
Variable Corresponding question q19_3 Did the end users use the data warehouse / BI solution provided?
q19_6 Were the business needs that project tried to solve aligned to the abovementioned strategic vision?
q19_10 Did project scope definition concentrate on choosing the best opportunities ("low-hanging fruit")?
q19_19 If technological issues were present, were all of them resolved?
q19_20 Were non-technological issues encountered during the project?
Table 2 - Factors used in PLS regression model 2
4.2.2. Analysis of transformed data
Rationale behind the need to apply transformations It is most likely that a dependency of success on the factors is not linear. The possibility of other dependencies had to be explored. While other, non-linear regressions could be possibly applied, lack of any knowledge of the nature of dependency would imply the need to try all of them, which was clearly beyond the scope of this thesis. Instead, linear regression could be applied to transformed factors. For example, if linear regression could be done on squared factors, the outcome would be a case of square regression of original factors; if various powers could be applied to factors, the outcome would be polynomial regression and so on.
Selection criteria for choosing mathematical functions It is always possible to choose a function that will fit the given finite, discrete data set. To avoid such a pitfall, the transformations had to be limited to basic mathematical functions – power (including square root), logarithm, exponential functions, reciprocal or simple composition of aforementioned functions. Similar selection criterion as for original data applied, but the transformation had to
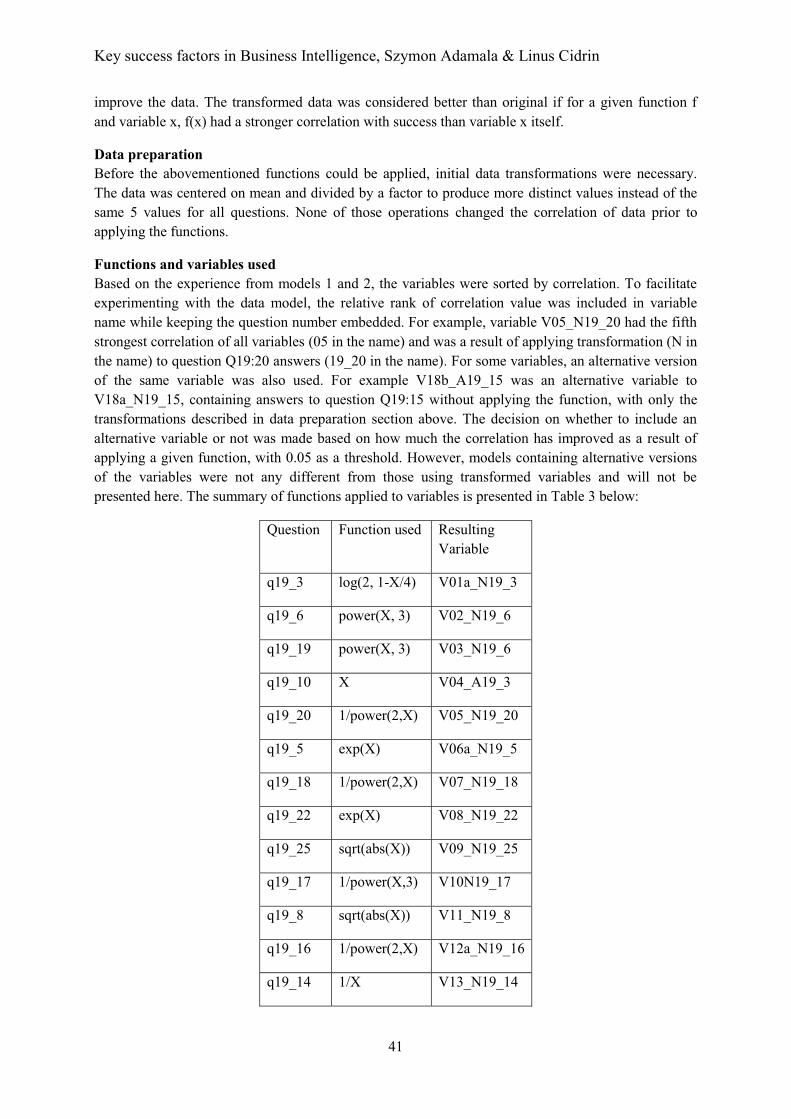
Key success factors in Business Intelligence, Szymon Adamala & Linus Cidrin
41
improve the data. The transformed data was considered better than original if for a given function f and variable x, f(x) had a stronger correlation with success than variable x itself.
Data preparation Before the abovementioned functions could be applied, initial data transformations were necessary. The data was centered on mean and divided by a factor to produce more distinct values instead of the same 5 values for all questions. None of those operations changed the correlation of data prior to applying the functions.
Functions and variables used Based on the experience from models 1 and 2, the variables were sorted by correlation. To facilitate experimenting with the data model, the relative rank of correlation value was included in variable name while keeping the question number embedded. For example, variable V05_N19_20 had the fifth strongest correlation of all variables (05 in the name) and was a result of applying transformation (N in the name) to question Q19:20 answers (19_20 in the name). For some variables, an alternative version of the same variable was also used. For example V18b_A19_15 was an alternative variable to V18a_N19_15, containing answers to question Q19:15 without applying the function, with only the transformations described in data preparation section above. The decision on whether to include an alternative variable or not was made based on how much the correlation has improved as a result of applying a given function, with 0.05 as a threshold. However, models containing alternative versions of the variables were not any different from those using transformed variables and will not be presented here. The summary of functions applied to variables is presented in Table 3 below:
Question Function used Resulting Variable
q19_3 log(2, 1-X/4) V01a_N19_3
q19_6 power(X, 3) V02_N19_6
q19_19 power(X, 3) V03_N19_6
q19_10 X V04_A19_3
q19_20 1/power(2,X) V05_N19_20
q19_5 exp(X) V06a_N19_5
q19_18 1/power(2,X) V07_N19_18
q19_22 exp(X) V08_N19_22
q19_25 sqrt(abs(X)) V09_N19_25
q19_17 1/power(X,3) V10N19_17
q19_8 sqrt(abs(X)) V11_N19_8
q19_16 1/power(2,X) V12a_N19_16
q19_14 1/X V13_N19_14

Key success factors in Business Intelligence, Szymon Adamala & Linus Cidrin
42
Question Function used Resulting Variable
q19_2 sqrt(abs(X)) V14_N19_2
q19_12 1/power(X,3) V15a_N19_12
q19_7 power(X, 2) V16_N19_7
q19_11 1/power(X,3) V17_N19_11
q19_15 power(X, 3) V18a_N19_15
q19_24 1/X V19_N19_24
q19_23 1/X V20_N19_23
q19_9 sqrt(abs(X)) V21_N19_9
Table 3 - Functions applied to variables
Model 3
Figure 18 - PLS regression model with all transformed variables
After including all transformed variables, the model achieved R2 = 0.58 which was significantly better than in case of untransformed model. The resulting model can be seen on Figure 18 above.
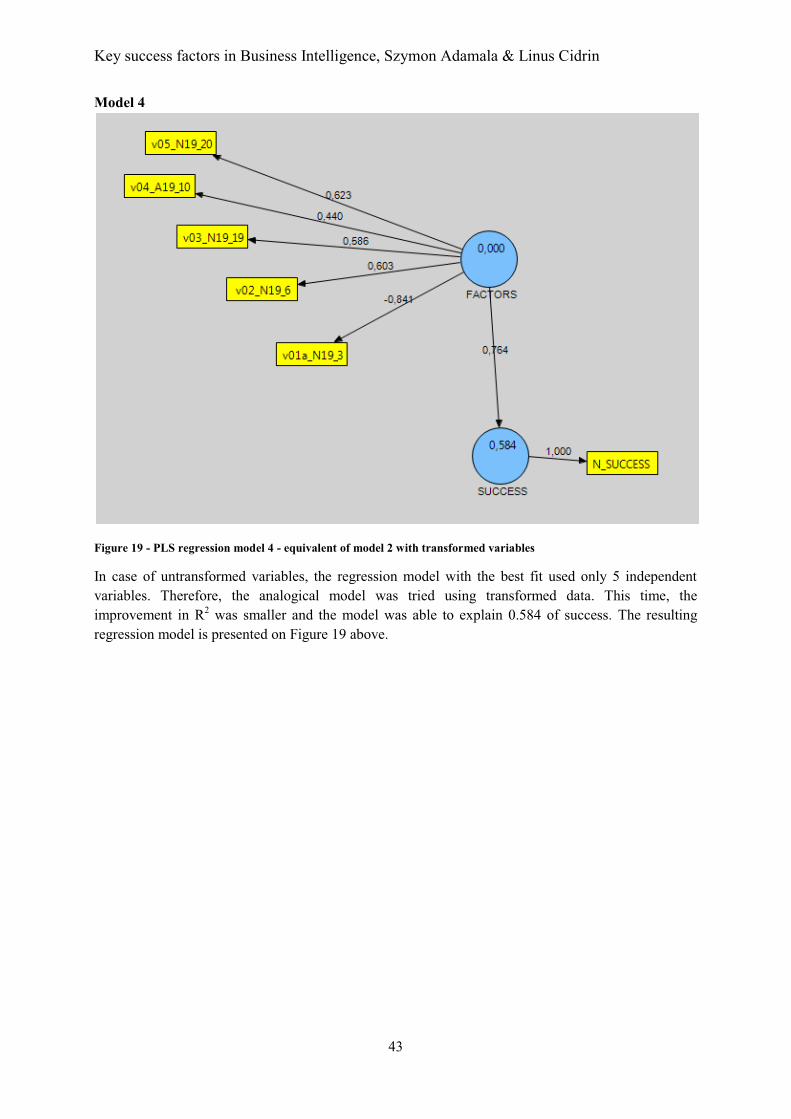
Key success factors in Business Intelligence, Szymon Adamala & Linus Cidrin
43
Model 4
Figure 19 - PLS regression model 4 - equivalent of model 2 with transformed variables
In case of untransformed variables, the regression model with the best fit used only 5 independent variables. Therefore, the analogical model was tried using transformed data. This time, the improvement in R2 was smaller and the model was able to explain 0.584 of success. The resulting regression model is presented on Figure 19 above.
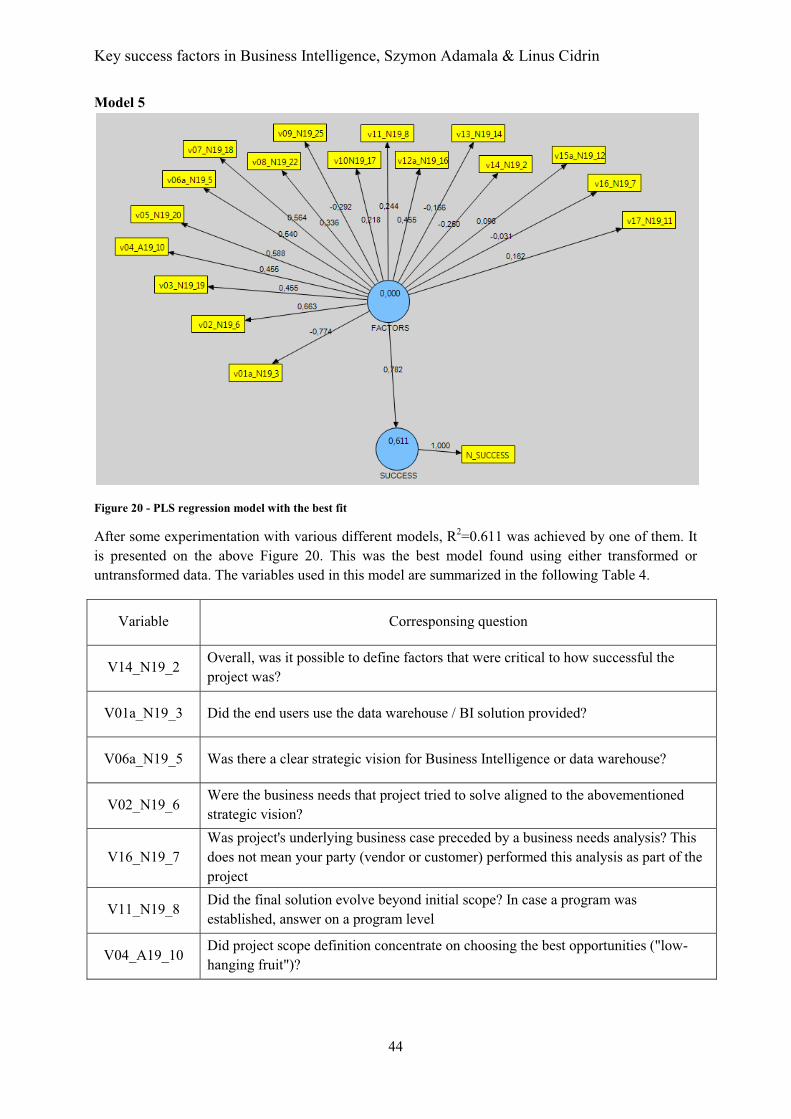
Key success factors in Business Intelligence, Szymon Adamala & Linus Cidrin
44
Model 5
Figure 20 - PLS regression model with the best fit
After some experimentation with various different models, R2=0.611 was achieved by one of them. It is presented on the above Figure 20. This was the best model found using either transformed or untransformed data. The variables used in this model are summarized in the following Table 4.
Variable Corresponsing question
V14_N19_2 Overall, was it possible to define factors that were critical to how successful the project was?
V01a_N19_3 Did the end users use the data warehouse / BI solution provided?
V06a_N19_5 Was there a clear strategic vision for Business Intelligence or data warehouse?
V02_N19_6 Were the business needs that project tried to solve aligned to the abovementioned strategic vision?
V16_N19_7 Was project's underlying business case preceded by a business needs analysis? This does not mean your party (vendor or customer) performed this analysis as part of the project
V11_N19_8 Did the final solution evolve beyond initial scope? In case a program was established, answer on a program level
V04_A19_10 Did project scope definition concentrate on choosing the best opportunities ("low-hanging fruit")?
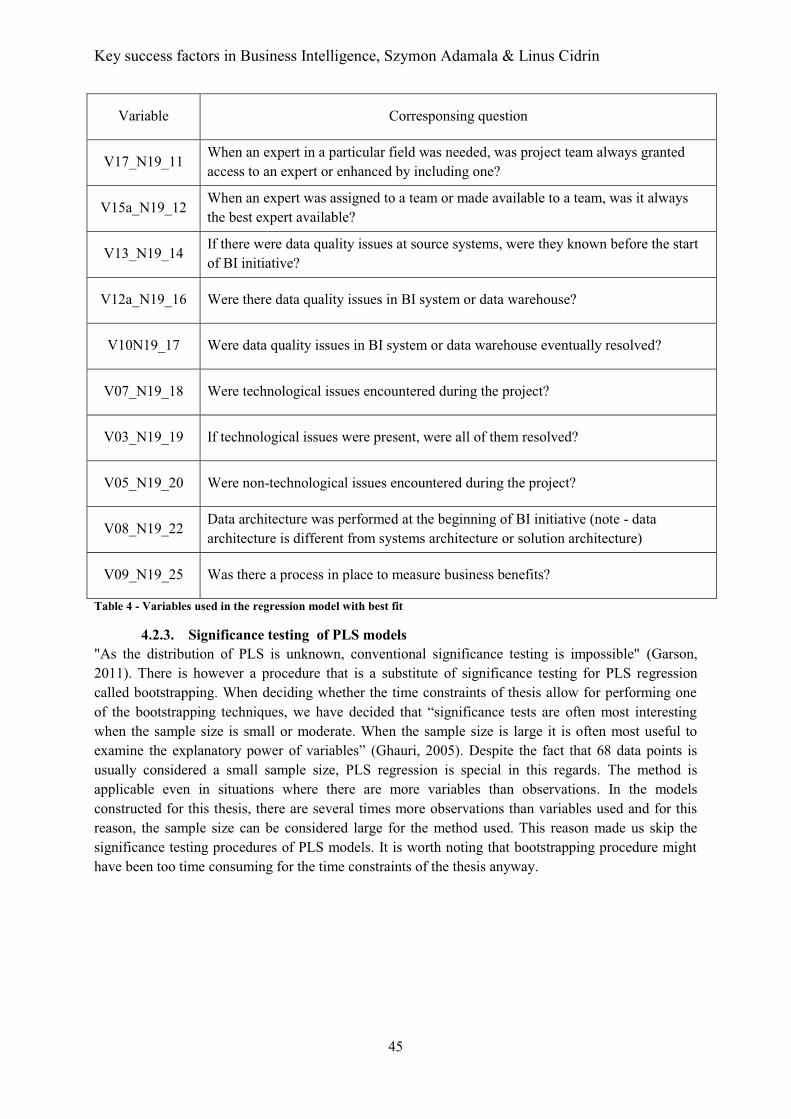
Key success factors in Business Intelligence, Szymon Adamala & Linus Cidrin
45
Variable Corresponsing question
V17_N19_11 When an expert in a particular field was needed, was project team always granted access to an expert or enhanced by including one?
V15a_N19_12 When an expert was assigned to a team or made available to a team, was it always the best expert available?
V13_N19_14 If there were data quality issues at source systems, were they known before the start of BI initiative?
V12a_N19_16 Were there data quality issues in BI system or data warehouse?
V10N19_17 Were data quality issues in BI system or data warehouse eventually resolved?
V07_N19_18 Were technological issues encountered during the project?
V03_N19_19 If technological issues were present, were all of them resolved?
V05_N19_20 Were non-technological issues encountered during the project?
V08_N19_22 Data architecture was performed at the beginning of BI initiative (note - data architecture is different from systems architecture or solution architecture)
V09_N19_25 Was there a process in place to measure business benefits?
Table 4 - Variables used in the regression model with best fit
4.2.3. Significance testing of PLS models "As the distribution of PLS is unknown, conventional significance testing is impossible" (Garson, 2011). There is however a procedure that is a substitute of significance testing for PLS regression called bootstrapping. When deciding whether the time constraints of thesis allow for performing one of the bootstrapping techniques, we have decided that “significance tests are often most interesting when the sample size is small or moderate. When the sample size is large it is often most useful to examine the explanatory power of variables” (Ghauri, 2005). Despite the fact that 68 data points is usually considered a small sample size, PLS regression is special in this regards. The method is applicable even in situations where there are more variables than observations. In the models constructed for this thesis, there are several times more observations than variables used and for this reason, the sample size can be considered large for the method used. This reason made us skip the significance testing procedures of PLS models. It is worth noting that bootstrapping procedure might have been too time consuming for the time constraints of the thesis anyway.
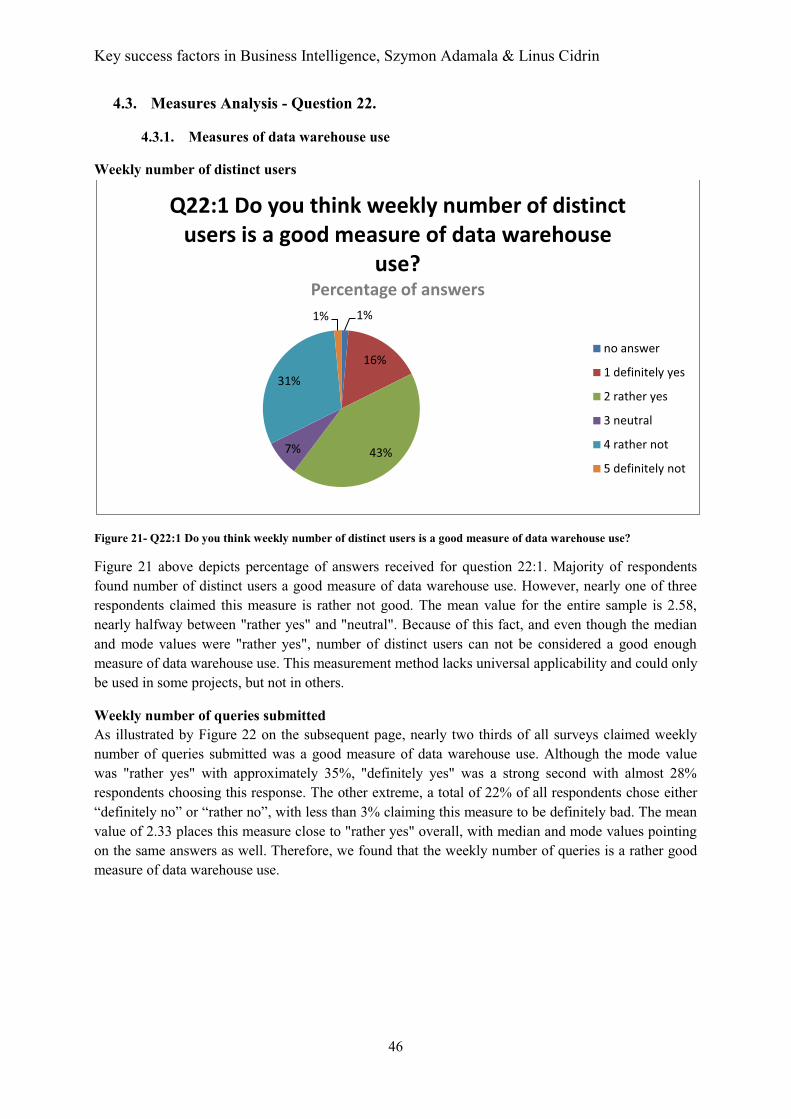
Key success factors in Business Intelligence, Szymon Adamala & Linus Cidrin
46
4.3. Measures Analysis - Question 22.
4.3.1. Measures of data warehouse use
Weekly number of distinct users
Figure 21- Q22:1 Do you think weekly number of distinct users is a good measure of data warehouse use?
Figure 21 above depicts percentage of answers received for question 22:1. Majority of respondents found number of distinct users a good measure of data warehouse use. However, nearly one of three respondents claimed this measure is rather not good. The mean value for the entire sample is 2.58, nearly halfway between "rather yes" and "neutral". Because of this fact, and even though the median and mode values were "rather yes", number of distinct users can not be considered a good enough measure of data warehouse use. This measurement method lacks universal applicability and could only be used in some projects, but not in others.
Weekly number of queries submitted As illustrated by Figure 22 on the subsequent page, nearly two thirds of all surveys claimed weekly number of queries submitted was a good measure of data warehouse use. Although the mode value was "rather yes" with approximately 35%, "definitely yes" was a strong second with almost 28% respondents choosing this response. The other extreme, a total of 22% of all respondents chose either “definitely no” or “rather no”, with less than 3% claiming this measure to be definitely bad. The mean value of 2.33 places this measure close to "rather yes" overall, with median and mode values pointing on the same answers as well. Therefore, we found that the weekly number of queries is a rather good measure of data warehouse use.
1%
16%
43%7%
31%
1%
Q22:1 Do you think weekly number of distinct users is a good measure of data warehouse
use?Percentage of answers
no answer
1 definitely yes
2 rather yes
3 neutral
4 rather not
5 definitely not
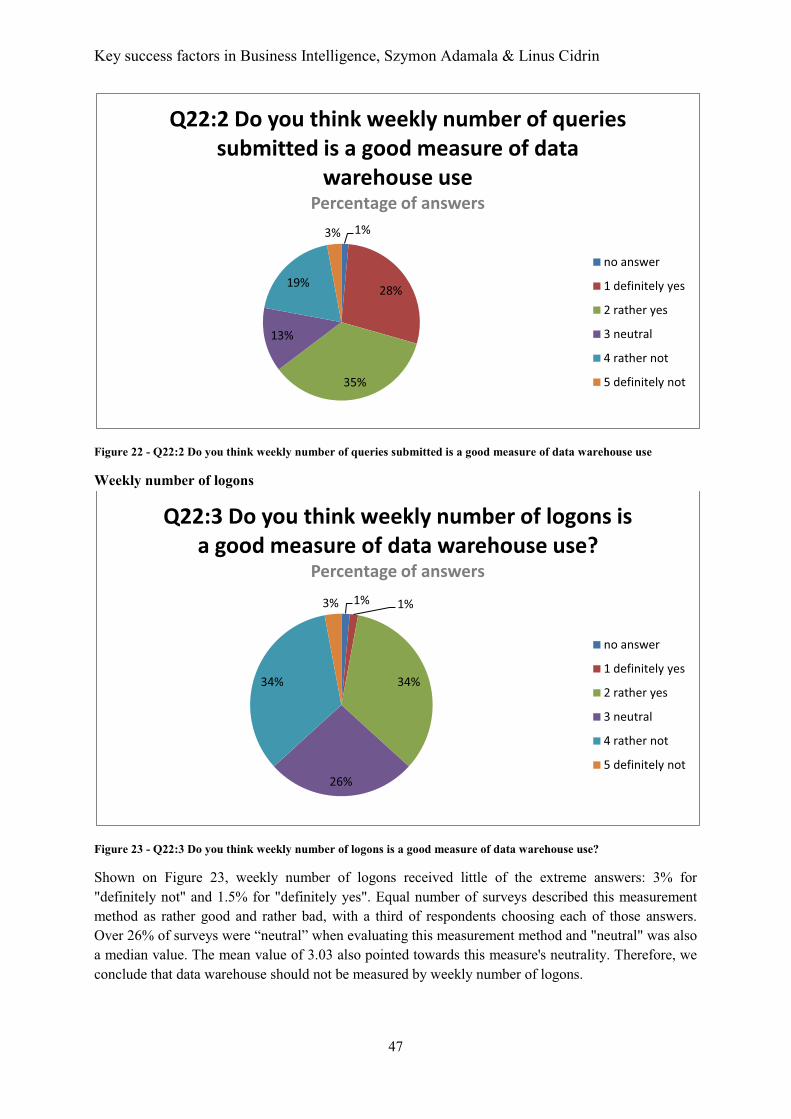
Key success factors in Business Intelligence, Szymon Adamala & Linus Cidrin
47
Figure 22 - Q22:2 Do you think weekly number of queries submitted is a good measure of data warehouse use
Weekly number of logons
Figure 23 - Q22:3 Do you think weekly number of logons is a good measure of data warehouse use?
Shown on Figure 23, weekly number of logons received little of the extreme answers: 3% for "definitely not" and 1.5% for "definitely yes". Equal number of surveys described this measurement method as rather good and rather bad, with a third of respondents choosing each of those answers. Over 26% of surveys were “neutral” when evaluating this measurement method and "neutral" was also a median value. The mean value of 3.03 also pointed towards this measure's neutrality. Therefore, we conclude that data warehouse should not be measured by weekly number of logons.
1%
28%
35%
13%
19%
3%
Q22:2 Do you think weekly number of queries submitted is a good measure of data
warehouse usePercentage of answers
no answer
1 definitely yes
2 rather yes
3 neutral
4 rather not
5 definitely not
1% 1%
34%
26%
34%
3%
Q22:3 Do you think weekly number of logons is a good measure of data warehouse use?
Percentage of answers
no answer
1 definitely yes
2 rather yes
3 neutral
4 rather not
5 definitely not
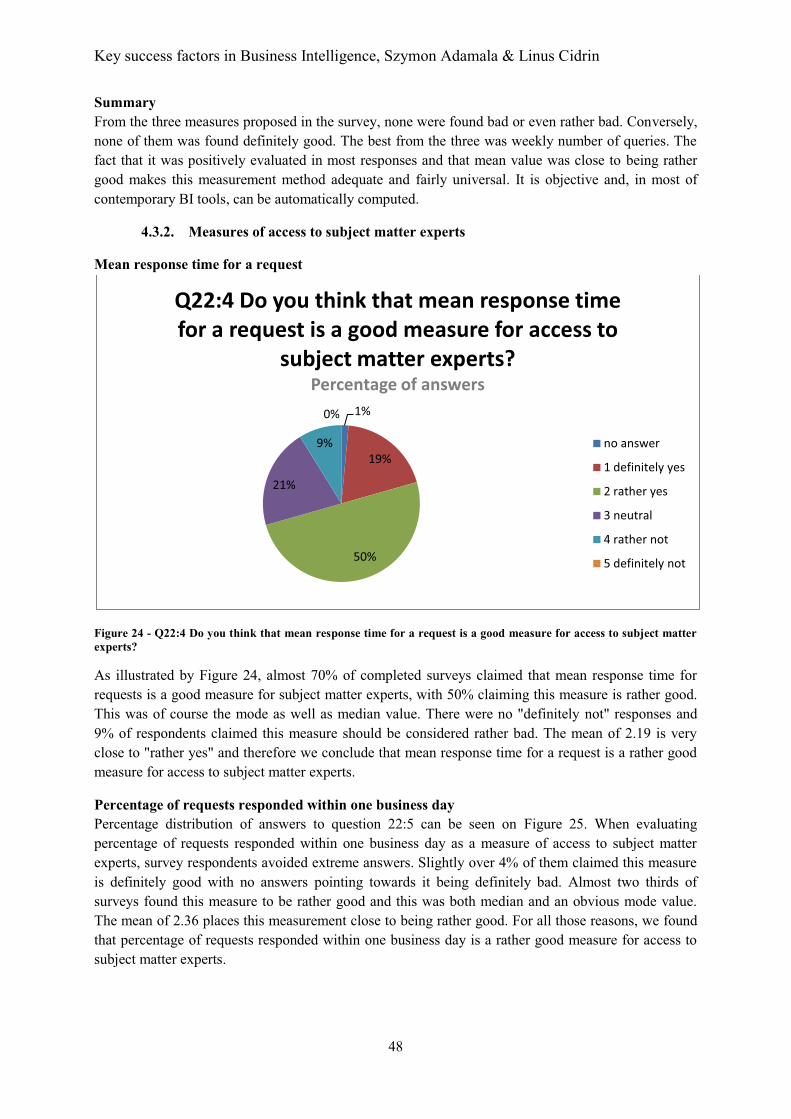
Key success factors in Business Intelligence, Szymon Adamala & Linus Cidrin
48
Summary From the three measures proposed in the survey, none were found bad or even rather bad. Conversely, none of them was found definitely good. The best from the three was weekly number of queries. The fact that it was positively evaluated in most responses and that mean value was close to being rather good makes this measurement method adequate and fairly universal. It is objective and, in most of contemporary BI tools, can be automatically computed.
4.3.2. Measures of access to subject matter experts
Mean response time for a request
Figure 24 - Q22:4 Do you think that mean response time for a request is a good measure for access to subject matter experts?
As illustrated by Figure 24, almost 70% of completed surveys claimed that mean response time for requests is a good measure for subject matter experts, with 50% claiming this measure is rather good. This was of course the mode as well as median value. There were no "definitely not" responses and 9% of respondents claimed this measure should be considered rather bad. The mean of 2.19 is very close to "rather yes" and therefore we conclude that mean response time for a request is a rather good measure for access to subject matter experts.
Percentage of requests responded within one business day Percentage distribution of answers to question 22:5 can be seen on Figure 25. When evaluating percentage of requests responded within one business day as a measure of access to subject matter experts, survey respondents avoided extreme answers. Slightly over 4% of them claimed this measure is definitely good with no answers pointing towards it being definitely bad. Almost two thirds of surveys found this measure to be rather good and this was both median and an obvious mode value. The mean of 2.36 places this measurement close to being rather good. For all those reasons, we found that percentage of requests responded within one business day is a rather good measure for access to subject matter experts.
1%
19%
50%
21%
9%
0%
Q22:4 Do you think that mean response time for a request is a good measure for access to
subject matter experts?Percentage of answers
no answer
1 definitely yes
2 rather yes
3 neutral
4 rather not
5 definitely not
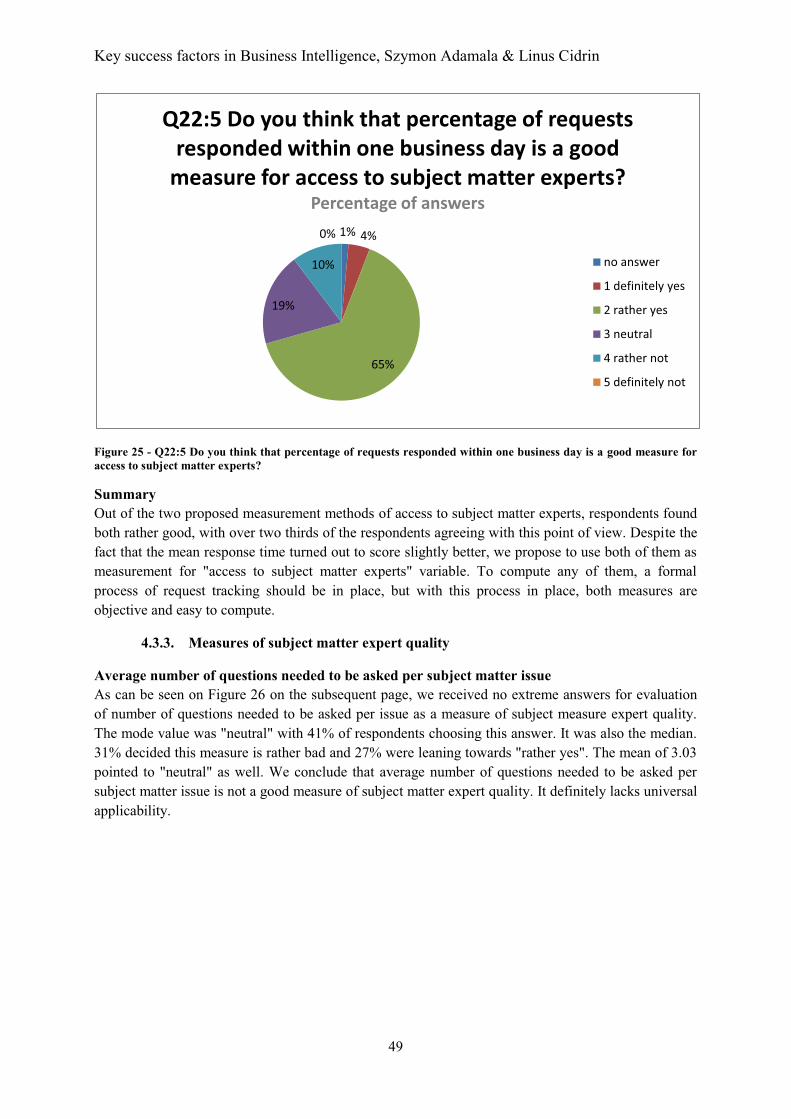
Key success factors in Business Intelligence, Szymon Adamala & Linus Cidrin
49
Figure 25 - Q22:5 Do you think that percentage of requests responded within one business day is a good measure for access to subject matter experts?
Summary Out of the two proposed measurement methods of access to subject matter experts, respondents found both rather good, with over two thirds of the respondents agreeing with this point of view. Despite the fact that the mean response time turned out to score slightly better, we propose to use both of them as measurement for "access to subject matter experts" variable. To compute any of them, a formal process of request tracking should be in place, but with this process in place, both measures are objective and easy to compute.
4.3.3. Measures of subject matter expert quality
Average number of questions needed to be asked per subject matter issue As can be seen on Figure 26 on the subsequent page, we received no extreme answers for evaluation of number of questions needed to be asked per issue as a measure of subject measure expert quality. The mode value was "neutral" with 41% of respondents choosing this answer. It was also the median. 31% decided this measure is rather bad and 27% were leaning towards "rather yes". The mean of 3.03 pointed to "neutral" as well. We conclude that average number of questions needed to be asked per subject matter issue is not a good measure of subject matter expert quality. It definitely lacks universal applicability.
1% 4%
65%
19%
10%
0%
Q22:5 Do you think that percentage of requests responded within one business day is a good
measure for access to subject matter experts?Percentage of answers
no answer
1 definitely yes
2 rather yes
3 neutral
4 rather not
5 definitely not

Key success factors in Business Intelligence, Szymon Adamala & Linus Cidrin
50
Figure 26 - Q22:6 Do you think that average number of questions needed to be asked per subject matter issue is a good measure for subject matter expert quality?
Average number of available documents per subject matter issue
Figure 27 - Q22:7 Do you think that the average number of available documents per subject matter issue is a good measure for subject matter expert quality?
Illustrated by Figure 27 above, average number of available documents per issue as a measure of subject matter expert quality was neutrally evaluated in 46% of all responses. There were no "definitely yes" answers and 15% of respondents found this measurement method rather good. On the other end, 3% were sharply claiming this measure is bad, and slightly over a third of all answers scoring it as rather bad. Both median and mode were 3, with mean of 3.27 evaluating this
1% 0%
26%
41%
31%
0%
Q22:6 Do you think that average number of questions needed to be asked per subject matter issue is a good measure for subject
matter expert quality?Percentage of answers
no answer
1 definitely yes
2 rather yes
3 neutral
4 rather not
5 definitely not
1% 0%
15%
46%
35%
3%
Q22:7 Do you think that the average number of available documents per subject matter issue is
a good measure for subject matter expert quality?
Percentage of answers
no answer
1 definitely yes
2 rather yes
3 neutral
4 rather not
5 definitely not
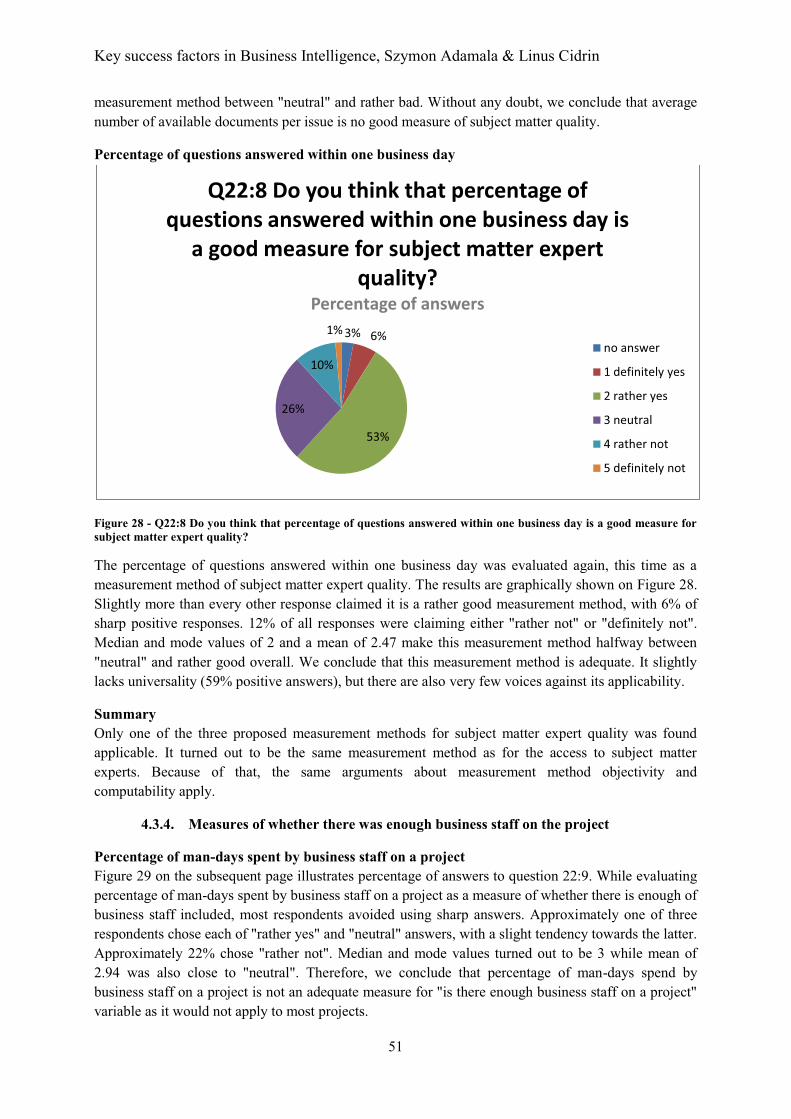
Key success factors in Business Intelligence, Szymon Adamala & Linus Cidrin
51
measurement method between "neutral" and rather bad. Without any doubt, we conclude that average number of available documents per issue is no good measure of subject matter quality.
Percentage of questions answered within one business day
Figure 28 - Q22:8 Do you think that percentage of questions answered within one business day is a good measure for subject matter expert quality?
The percentage of questions answered within one business day was evaluated again, this time as a measurement method of subject matter expert quality. The results are graphically shown on Figure 28. Slightly more than every other response claimed it is a rather good measurement method, with 6% of sharp positive responses. 12% of all responses were claiming either "rather not" or "definitely not". Median and mode values of 2 and a mean of 2.47 make this measurement method halfway between "neutral" and rather good overall. We conclude that this measurement method is adequate. It slightly lacks universality (59% positive answers), but there are also very few voices against its applicability.
Summary Only one of the three proposed measurement methods for subject matter expert quality was found applicable. It turned out to be the same measurement method as for the access to subject matter experts. Because of that, the same arguments about measurement method objectivity and computability apply.
4.3.4. Measures of whether there was enough business staff on the project
Percentage of man-days spent by business staff on a project Figure 29 on the subsequent page illustrates percentage of answers to question 22:9. While evaluating percentage of man-days spent by business staff on a project as a measure of whether there is enough of business staff included, most respondents avoided using sharp answers. Approximately one of three respondents chose each of "rather yes" and "neutral" answers, with a slight tendency towards the latter. Approximately 22% chose "rather not". Median and mode values turned out to be 3 while mean of 2.94 was also close to "neutral". Therefore, we conclude that percentage of man-days spend by business staff on a project is not an adequate measure for "is there enough business staff on a project" variable as it would not apply to most projects.
3% 6%
53%
26%
10%
1%
Q22:8 Do you think that percentage of questions answered within one business day is
a good measure for subject matter expert quality?
Percentage of answers
no answer
1 definitely yes
2 rather yes
3 neutral
4 rather not
5 definitely not
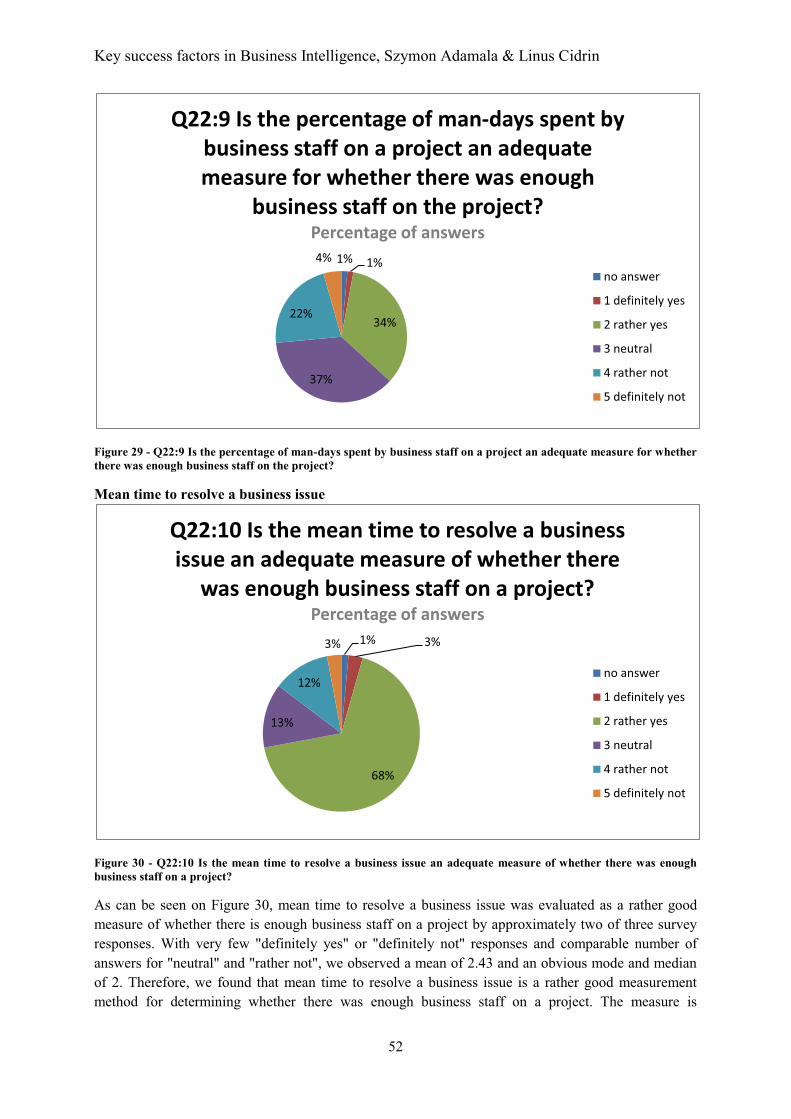
Key success factors in Business Intelligence, Szymon Adamala & Linus Cidrin
52
Figure 29 - Q22:9 Is the percentage of man-days spent by business staff on a project an adequate measure for whether there was enough business staff on the project?
Mean time to resolve a business issue
Figure 30 - Q22:10 Is the mean time to resolve a business issue an adequate measure of whether there was enough business staff on a project?
As can be seen on Figure 30, mean time to resolve a business issue was evaluated as a rather good measure of whether there is enough business staff on a project by approximately two of three survey responses. With very few "definitely yes" or "definitely not" responses and comparable number of answers for "neutral" and "rather not", we observed a mean of 2.43 and an obvious mode and median of 2. Therefore, we found that mean time to resolve a business issue is a rather good measurement method for determining whether there was enough business staff on a project. The measure is
1% 1%
34%
37%
22%
4%
Q22:9 Is the percentage of man-days spent by business staff on a project an adequate measure for whether there was enough
business staff on the project?Percentage of answers
no answer
1 definitely yes
2 rather yes
3 neutral
4 rather not
5 definitely not
1% 3%
68%
13%
12%
3%
Q22:10 Is the mean time to resolve a business issue an adequate measure of whether there
was enough business staff on a project?Percentage of answers
no answer
1 definitely yes
2 rather yes
3 neutral
4 rather not
5 definitely not
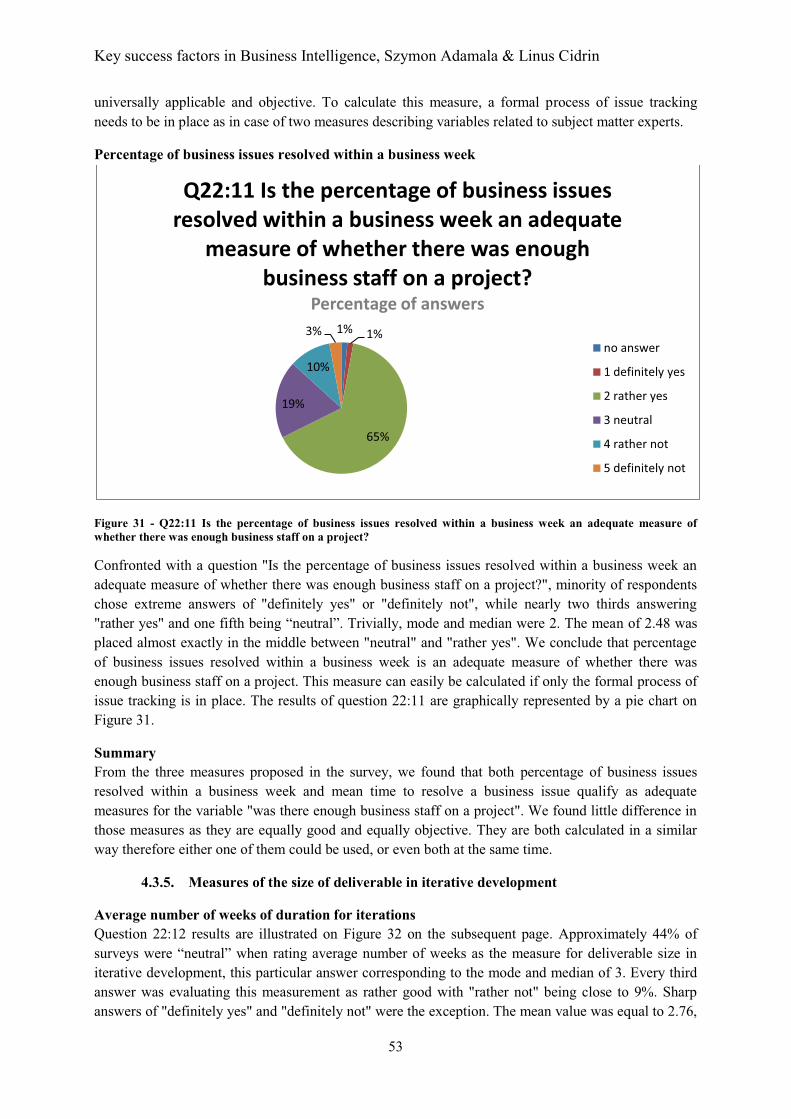
Key success factors in Business Intelligence, Szymon Adamala & Linus Cidrin
53
universally applicable and objective. To calculate this measure, a formal process of issue tracking needs to be in place as in case of two measures describing variables related to subject matter experts.
Percentage of business issues resolved within a business week
Figure 31 - Q22:11 Is the percentage of business issues resolved within a business week an adequate measure of whether there was enough business staff on a project?
Confronted with a question "Is the percentage of business issues resolved within a business week an adequate measure of whether there was enough business staff on a project?", minority of respondents chose extreme answers of "definitely yes" or "definitely not", while nearly two thirds answering "rather yes" and one fifth being “neutral”. Trivially, mode and median were 2. The mean of 2.48 was placed almost exactly in the middle between "neutral" and "rather yes". We conclude that percentage of business issues resolved within a business week is an adequate measure of whether there was enough business staff on a project. This measure can easily be calculated if only the formal process of issue tracking is in place. The results of question 22:11 are graphically represented by a pie chart on Figure 31.
Summary From the three measures proposed in the survey, we found that both percentage of business issues resolved within a business week and mean time to resolve a business issue qualify as adequate measures for the variable "was there enough business staff on a project". We found little difference in those measures as they are equally good and equally objective. They are both calculated in a similar way therefore either one of them could be used, or even both at the same time.
4.3.5. Measures of the size of deliverable in iterative development
Average number of weeks of duration for iterations Question 22:12 results are illustrated on Figure 32 on the subsequent page. Approximately 44% of surveys were “neutral” when rating average number of weeks as the measure for deliverable size in iterative development, this particular answer corresponding to the mode and median of 3. Every third answer was evaluating this measurement as rather good with "rather not" being close to 9%. Sharp answers of "definitely yes" and "definitely not" were the exception. The mean value was equal to 2.76,
1% 1%
65%
19%
10%
3%
Q22:11 Is the percentage of business issues resolved within a business week an adequate
measure of whether there was enough business staff on a project?
Percentage of answers
no answer
1 definitely yes
2 rather yes
3 neutral
4 rather not
5 definitely not
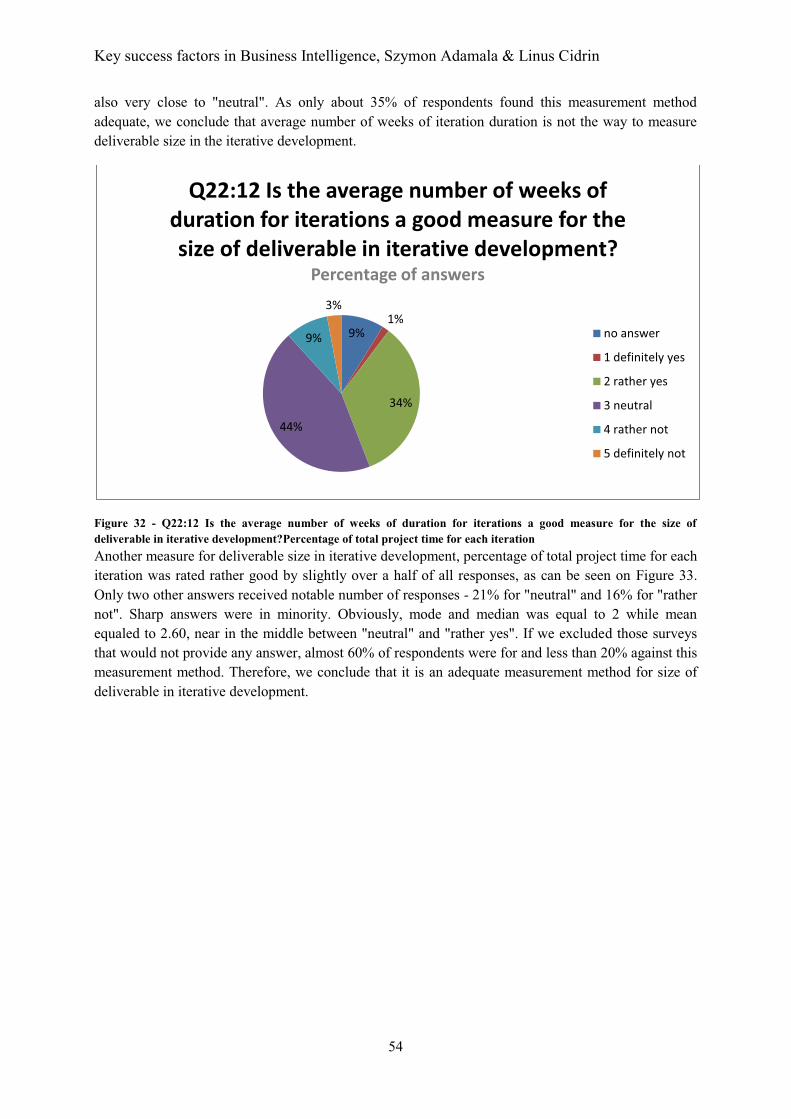
Key success factors in Business Intelligence, Szymon Adamala & Linus Cidrin
54
also very close to "neutral". As only about 35% of respondents found this measurement method adequate, we conclude that average number of weeks of iteration duration is not the way to measure deliverable size in the iterative development.
Figure 32 - Q22:12 Is the average number of weeks of duration for iterations a good measure for the size of deliverable in iterative development?Percentage of total project time for each iteration Another measure for deliverable size in iterative development, percentage of total project time for each iteration was rated rather good by slightly over a half of all responses, as can be seen on Figure 33. Only two other answers received notable number of responses - 21% for "neutral" and 16% for "rather not". Sharp answers were in minority. Obviously, mode and median was equal to 2 while mean equaled to 2.60, near in the middle between "neutral" and "rather yes". If we excluded those surveys that would not provide any answer, almost 60% of respondents were for and less than 20% against this measurement method. Therefore, we conclude that it is an adequate measurement method for size of deliverable in iterative development.
9%1%
34%
44%
9%
3%
Q22:12 Is the average number of weeks of duration for iterations a good measure for the size of deliverable in iterative development?
Percentage of answers
no answer
1 definitely yes
2 rather yes
3 neutral
4 rather not
5 definitely not
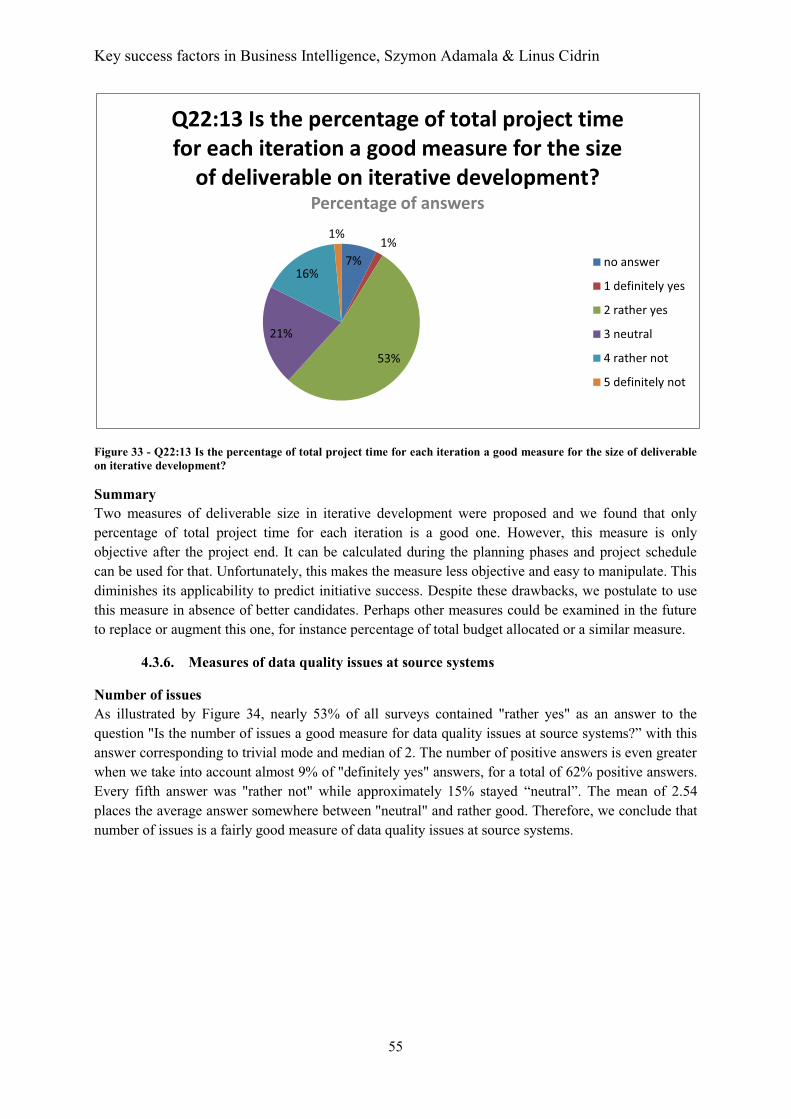
Key success factors in Business Intelligence, Szymon Adamala & Linus Cidrin
55
Figure 33 - Q22:13 Is the percentage of total project time for each iteration a good measure for the size of deliverable on iterative development?
Summary Two measures of deliverable size in iterative development were proposed and we found that only percentage of total project time for each iteration is a good one. However, this measure is only objective after the project end. It can be calculated during the planning phases and project schedule can be used for that. Unfortunately, this makes the measure less objective and easy to manipulate. This diminishes its applicability to predict initiative success. Despite these drawbacks, we postulate to use this measure in absence of better candidates. Perhaps other measures could be examined in the future to replace or augment this one, for instance percentage of total budget allocated or a similar measure.
4.3.6. Measures of data quality issues at source systems
Number of issues As illustrated by Figure 34, nearly 53% of all surveys contained "rather yes" as an answer to the question "Is the number of issues a good measure for data quality issues at source systems?” with this answer corresponding to trivial mode and median of 2. The number of positive answers is even greater when we take into account almost 9% of "definitely yes" answers, for a total of 62% positive answers. Every fifth answer was "rather not" while approximately 15% stayed “neutral”. The mean of 2.54 places the average answer somewhere between "neutral" and rather good. Therefore, we conclude that number of issues is a fairly good measure of data quality issues at source systems.
7%1%
53%
21%
16%
1%
Q22:13 Is the percentage of total project time for each iteration a good measure for the size
of deliverable on iterative development?Percentage of answers
no answer
1 definitely yes
2 rather yes
3 neutral
4 rather not
5 definitely not
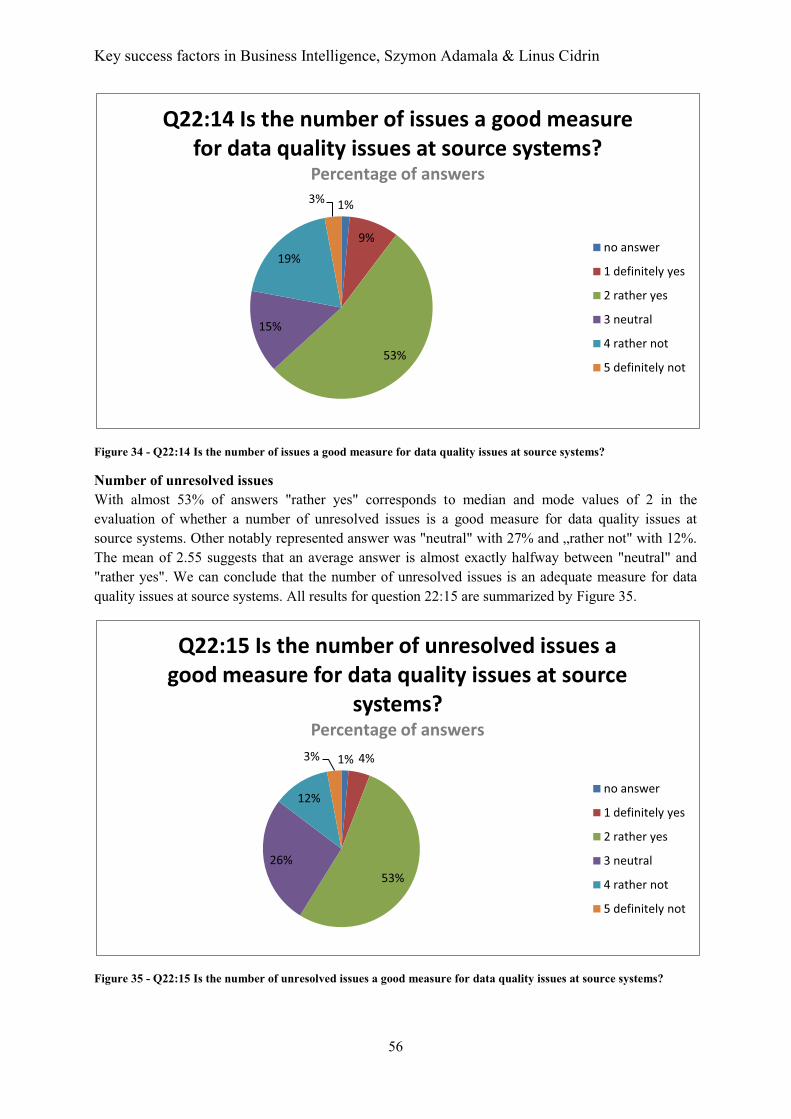
Key success factors in Business Intelligence, Szymon Adamala & Linus Cidrin
56
Figure 34 - Q22:14 Is the number of issues a good measure for data quality issues at source systems?
Number of unresolved issues With almost 53% of answers "rather yes" corresponds to median and mode values of 2 in the evaluation of whether a number of unresolved issues is a good measure for data quality issues at source systems. Other notably represented answer was "neutral" with 27% and „rather not" with 12%. The mean of 2.55 suggests that an average answer is almost exactly halfway between "neutral" and "rather yes". We can conclude that the number of unresolved issues is an adequate measure for data quality issues at source systems. All results for question 22:15 are summarized by Figure 35.
Figure 35 - Q22:15 Is the number of unresolved issues a good measure for data quality issues at source systems?
1%
9%
53%
15%
19%
3%
Q22:14 Is the number of issues a good measure for data quality issues at source systems?
Percentage of answers
no answer
1 definitely yes
2 rather yes
3 neutral
4 rather not
5 definitely not
1% 4%
53%26%
12%
3%
Q22:15 Is the number of unresolved issues a good measure for data quality issues at source
systems?Percentage of answers
no answer
1 definitely yes
2 rather yes
3 neutral
4 rather not
5 definitely not
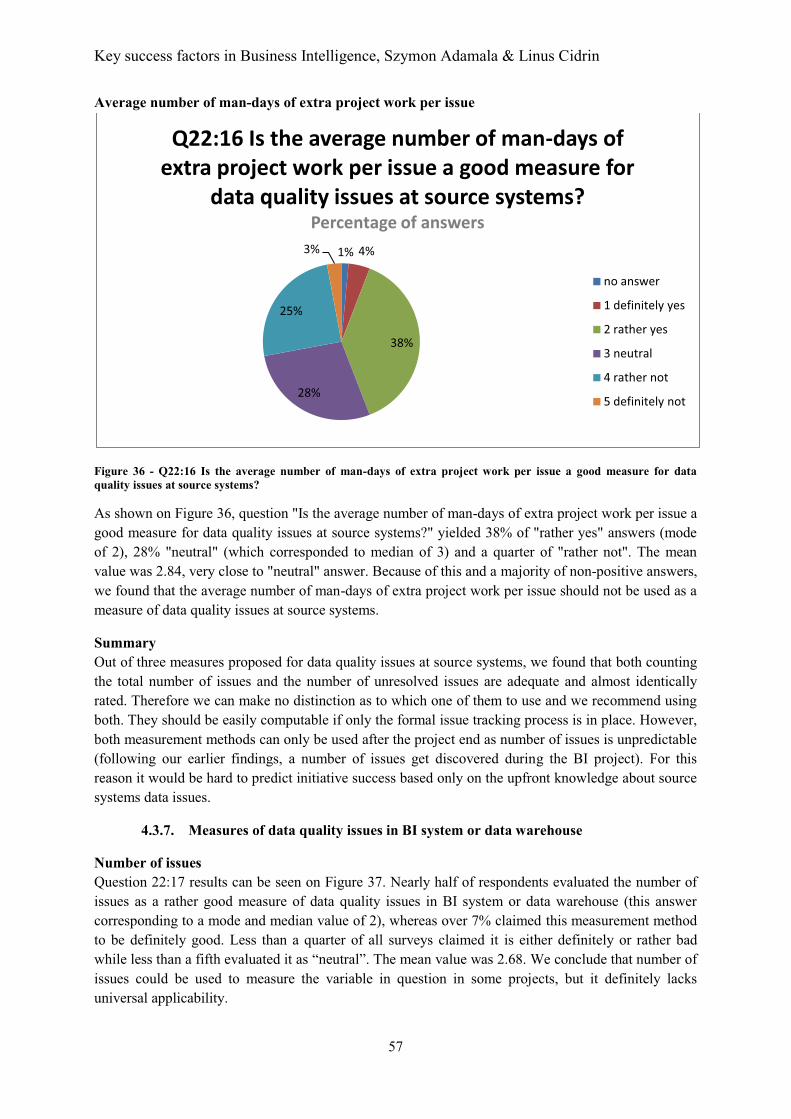
Key success factors in Business Intelligence, Szymon Adamala & Linus Cidrin
57
Average number of man-days of extra project work per issue
Figure 36 - Q22:16 Is the average number of man-days of extra project work per issue a good measure for data quality issues at source systems?
As shown on Figure 36, question "Is the average number of man-days of extra project work per issue a good measure for data quality issues at source systems?" yielded 38% of "rather yes" answers (mode of 2), 28% "neutral" (which corresponded to median of 3) and a quarter of "rather not". The mean value was 2.84, very close to "neutral" answer. Because of this and a majority of non-positive answers, we found that the average number of man-days of extra project work per issue should not be used as a measure of data quality issues at source systems.
Summary Out of three measures proposed for data quality issues at source systems, we found that both counting the total number of issues and the number of unresolved issues are adequate and almost identically rated. Therefore we can make no distinction as to which one of them to use and we recommend using both. They should be easily computable if only the formal issue tracking process is in place. However, both measurement methods can only be used after the project end as number of issues is unpredictable (following our earlier findings, a number of issues get discovered during the BI project). For this reason it would be hard to predict initiative success based only on the upfront knowledge about source systems data issues.
4.3.7. Measures of data quality issues in BI system or data warehouse
Number of issues Question 22:17 results can be seen on Figure 37. Nearly half of respondents evaluated the number of issues as a rather good measure of data quality issues in BI system or data warehouse (this answer corresponding to a mode and median value of 2), whereas over 7% claimed this measurement method to be definitely good. Less than a quarter of all surveys claimed it is either definitely or rather bad while less than a fifth evaluated it as “neutral”. The mean value was 2.68. We conclude that number of issues could be used to measure the variable in question in some projects, but it definitely lacks universal applicability.
1% 4%
38%
28%
25%
3%
Q22:16 Is the average number of man-days of extra project work per issue a good measure for
data quality issues at source systems?Percentage of answers
no answer
1 definitely yes
2 rather yes
3 neutral
4 rather not
5 definitely not
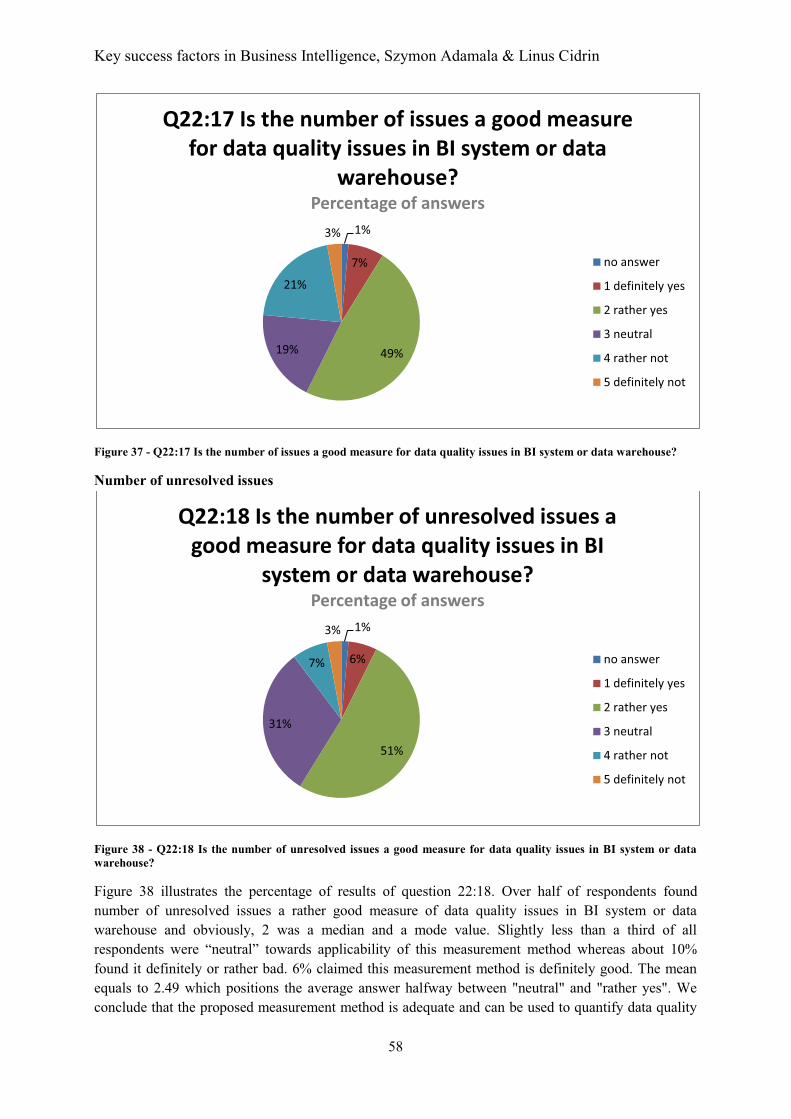
Key success factors in Business Intelligence, Szymon Adamala & Linus Cidrin
58
Figure 37 - Q22:17 Is the number of issues a good measure for data quality issues in BI system or data warehouse?
Number of unresolved issues
Figure 38 - Q22:18 Is the number of unresolved issues a good measure for data quality issues in BI system or data warehouse?
Figure 38 illustrates the percentage of results of question 22:18. Over half of respondents found number of unresolved issues a rather good measure of data quality issues in BI system or data warehouse and obviously, 2 was a median and a mode value. Slightly less than a third of all respondents were “neutral” towards applicability of this measurement method whereas about 10% found it definitely or rather bad. 6% claimed this measurement method is definitely good. The mean equals to 2.49 which positions the average answer halfway between "neutral" and "rather yes". We conclude that the proposed measurement method is adequate and can be used to quantify data quality
1%
7%
49%19%
21%
3%
Q22:17 Is the number of issues a good measure for data quality issues in BI system or data
warehouse?Percentage of answers
no answer
1 definitely yes
2 rather yes
3 neutral
4 rather not
5 definitely not
1%
6%
51%
31%
7%
3%
Q22:18 Is the number of unresolved issues a good measure for data quality issues in BI
system or data warehouse?Percentage of answers
no answer
1 definitely yes
2 rather yes
3 neutral
4 rather not
5 definitely not

Key success factors in Business Intelligence, Szymon Adamala & Linus Cidrin
59
issues in BI system or data warehouse. It is universal enough to be used in all projects and is objective. However, it can only be computed after the project end and therefore its applicability to predict project success at the early stages of the project is limited.
Average number of man-days of extra project work per issue
Figure 39 - Q22:19 Is the average number of man-days of extra project work per issue a good measure for data quality issues in BI system or data warehouse?
As depicted by Figure 39, nearly half of all results for the question "Is the average number of man-days of extra project work per issue a good measure for data quality issues in BI system or data warehouse?" corresponded to mode and median values of 2. Combined with "definitely yes" answers, exactly half of respondents positively evaluated this measurement method. Taking into account 30% or "neutral" answers, about 20% of respondents had "rather" or "definitely" negative opinions. The mean value was 2.67, between "rather yes" and "neutral". We conclude that it is acceptable measurement method for variable in question, even though the number of projects it will not work on is quite high. It cannot be used in predictions as well as it can be measured only after the project end. It is also not strictly objective as the man-days spent on resolving issues may be attributed to other work.
Summary From the three measurement methods proposed for data quality issues in BI system or data warehouse, we found one better than others. Therefore, we conclude that this variable should be measured using the number of unresolved issues. The fact that this variable could be objectively measured only after the project end makes it unsuitable for use in predicting project success.
4.3.8. Measures of benefits quantification
Calculated ROI Figure 40 on the subsequent page shows than 69% percent of all respondents claimed calculated ROI was a good measure of benefits quantification (either "definitely yes" or "rather yes"). There were no opposing points of view and nearly 30% of respondents were “neutral”. Mode and median were both 2 which corresponds to "rather yes" and the mean was 2.19. We can say that calculated ROI can be used
1% 3%
47%29%
18%
1%
Q22:19 Is the average number of man-days of extra project work per issue a good measure for
data quality issues in BI system or data warehouse?
Percentage of answers
no answer
1 definitely yes
2 rather yes
3 neutral
4 rather not
5 definitely not

Key success factors in Business Intelligence, Szymon Adamala & Linus Cidrin
60
to quantify benefits from BI project and this measurement method will be universally applicable across projects. It is objective but its calculation is much easier after the project end. Calculating it up-front can pose a number of complex challenges while estimating it will diminish its objectivity. This slightly limits its applicability to predict project success in its early stages.
Figure 40 - Q22:20 Is a calculated ROI a good measure of benefits quantification?
Proposition on how the business intelligence capabilities enables the realization of business strategy
Figure 41 - Q22:21 Is a proposition on how the business intelligence capabilities enables the realization of business strategy a good measure of benefits quantification?
1%
10%
59%
29%
0% 0%
Q22:20 Is a calculated ROI a good measure of benefits quantification?
Percentage of answers
no answer
1 definitely yes
2 rather yes
3 neutral
4 rather not
5 definitely not
1%
7%
62%
29%
0% 0%
Q22:21 Is a proposition on how the business intelligence capabilities enables the realization
of business strategy a good measure of benefits quantification?
Percentage of answers
no answer
1 definitely yes
2 rather yes
3 neutral
4 rather not
5 definitely not
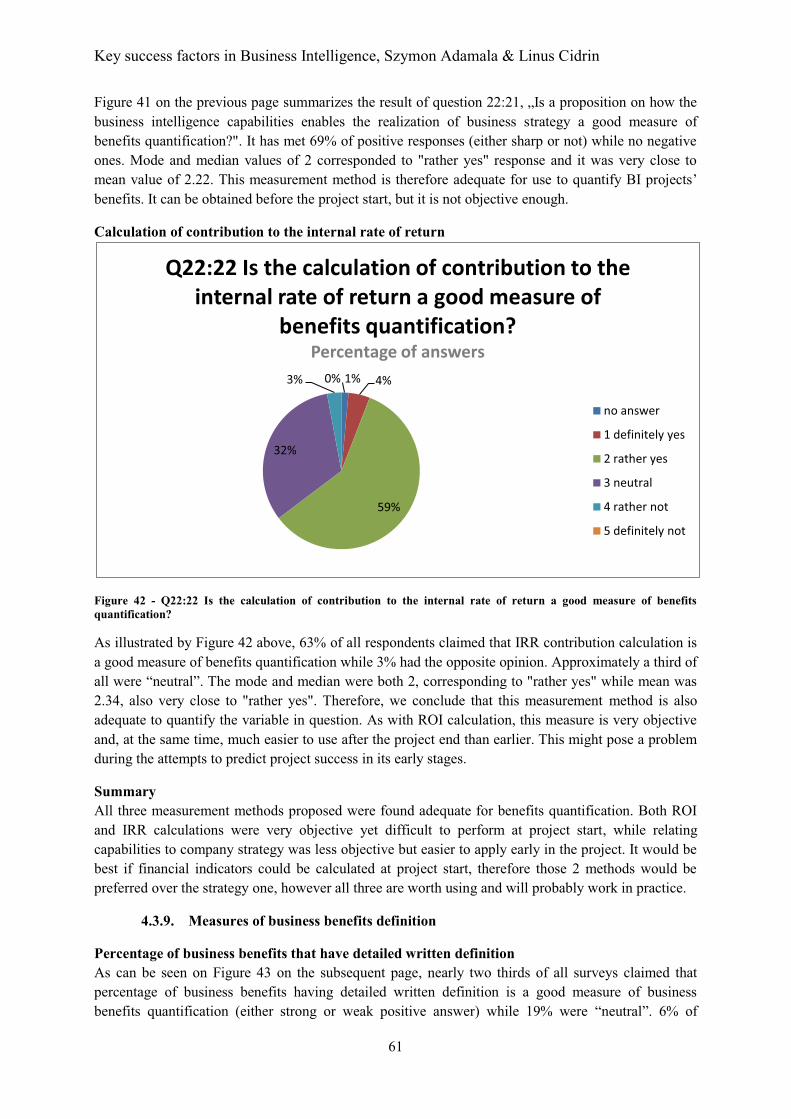
Key success factors in Business Intelligence, Szymon Adamala & Linus Cidrin
61
Figure 41 on the previous page summarizes the result of question 22:21, „Is a proposition on how the business intelligence capabilities enables the realization of business strategy a good measure of benefits quantification?". It has met 69% of positive responses (either sharp or not) while no negative ones. Mode and median values of 2 corresponded to "rather yes" response and it was very close to mean value of 2.22. This measurement method is therefore adequate for use to quantify BI projects’ benefits. It can be obtained before the project start, but it is not objective enough.
Calculation of contribution to the internal rate of return
Figure 42 - Q22:22 Is the calculation of contribution to the internal rate of return a good measure of benefits quantification?
As illustrated by Figure 42 above, 63% of all respondents claimed that IRR contribution calculation is a good measure of benefits quantification while 3% had the opposite opinion. Approximately a third of all were “neutral”. The mode and median were both 2, corresponding to "rather yes" while mean was 2.34, also very close to "rather yes". Therefore, we conclude that this measurement method is also adequate to quantify the variable in question. As with ROI calculation, this measure is very objective and, at the same time, much easier to use after the project end than earlier. This might pose a problem during the attempts to predict project success in its early stages.
Summary All three measurement methods proposed were found adequate for benefits quantification. Both ROI and IRR calculations were very objective yet difficult to perform at project start, while relating capabilities to company strategy was less objective but easier to apply early in the project. It would be best if financial indicators could be calculated at project start, therefore those 2 methods would be preferred over the strategy one, however all three are worth using and will probably work in practice.
4.3.9. Measures of business benefits definition
Percentage of business benefits that have detailed written definition As can be seen on Figure 43 on the subsequent page, nearly two thirds of all surveys claimed that percentage of business benefits having detailed written definition is a good measure of business benefits quantification (either strong or weak positive answer) while 19% were “neutral”. 6% of
1% 4%
59%
32%
3% 0%
Q22:22 Is the calculation of contribution to the internal rate of return a good measure of
benefits quantification?Percentage of answers
no answer
1 definitely yes
2 rather yes
3 neutral
4 rather not
5 definitely not
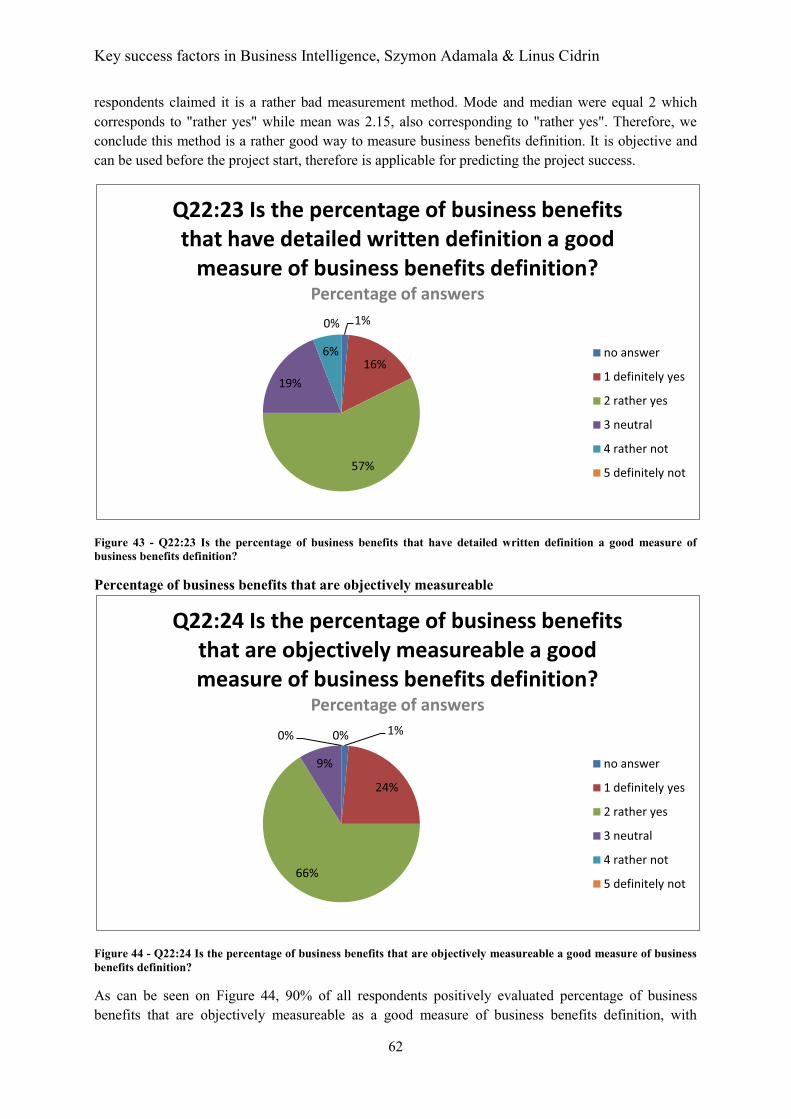
Key success factors in Business Intelligence, Szymon Adamala & Linus Cidrin
62
respondents claimed it is a rather bad measurement method. Mode and median were equal 2 which corresponds to "rather yes" while mean was 2.15, also corresponding to "rather yes". Therefore, we conclude this method is a rather good way to measure business benefits definition. It is objective and can be used before the project start, therefore is applicable for predicting the project success.
Figure 43 - Q22:23 Is the percentage of business benefits that have detailed written definition a good measure of business benefits definition?
Percentage of business benefits that are objectively measureable
Figure 44 - Q22:24 Is the percentage of business benefits that are objectively measureable a good measure of business benefits definition?
As can be seen on Figure 44, 90% of all respondents positively evaluated percentage of business benefits that are objectively measureable as a good measure of business benefits definition, with
1%
16%
57%
19%
6%
0%
Q22:23 Is the percentage of business benefits that have detailed written definition a good
measure of business benefits definition?Percentage of answers
no answer
1 definitely yes
2 rather yes
3 neutral
4 rather not
5 definitely not
1%
24%
66%
9%
0% 0%
Q22:24 Is the percentage of business benefits that are objectively measureable a good measure of business benefits definition?
Percentage of answers
no answer
1 definitely yes
2 rather yes
3 neutral
4 rather not
5 definitely not
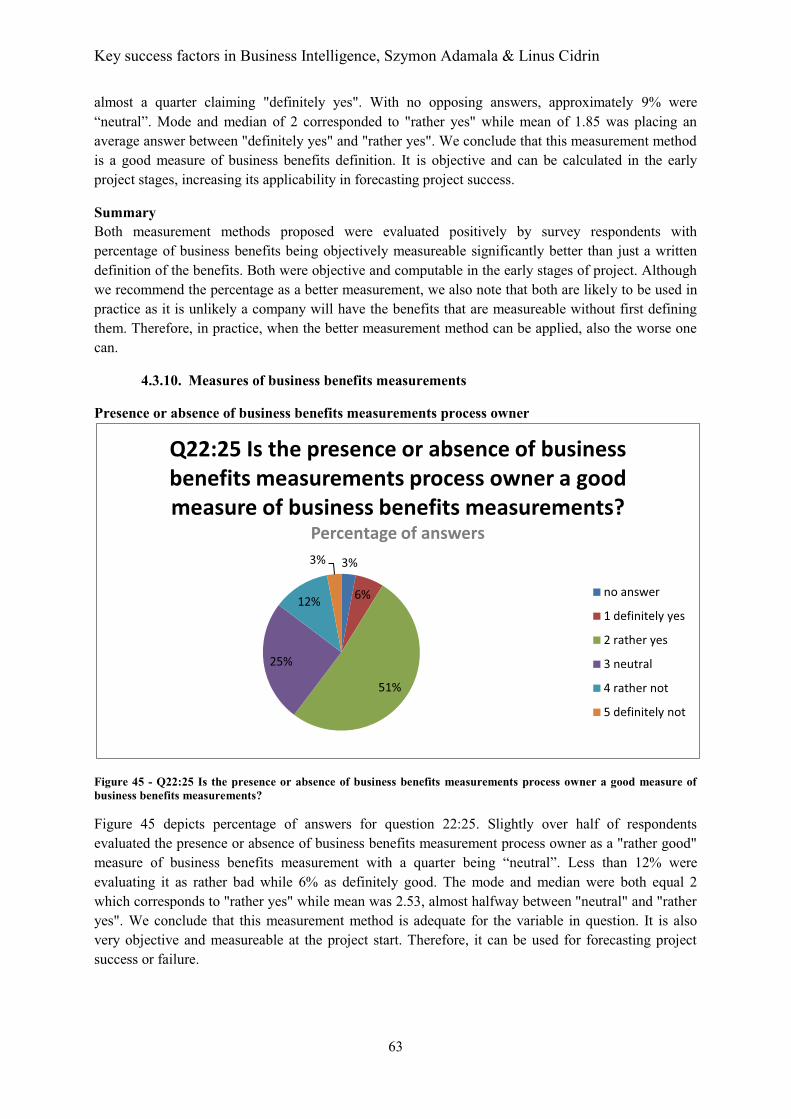
Key success factors in Business Intelligence, Szymon Adamala & Linus Cidrin
63
almost a quarter claiming "definitely yes". With no opposing answers, approximately 9% were “neutral”. Mode and median of 2 corresponded to "rather yes" while mean of 1.85 was placing an average answer between "definitely yes" and "rather yes". We conclude that this measurement method is a good measure of business benefits definition. It is objective and can be calculated in the early project stages, increasing its applicability in forecasting project success.
Summary Both measurement methods proposed were evaluated positively by survey respondents with percentage of business benefits being objectively measureable significantly better than just a written definition of the benefits. Both were objective and computable in the early stages of project. Although we recommend the percentage as a better measurement, we also note that both are likely to be used in practice as it is unlikely a company will have the benefits that are measureable without first defining them. Therefore, in practice, when the better measurement method can be applied, also the worse one can.
4.3.10. Measures of business benefits measurements
Presence or absence of business benefits measurements process owner
Figure 45 - Q22:25 Is the presence or absence of business benefits measurements process owner a good measure of business benefits measurements?
Figure 45 depicts percentage of answers for question 22:25. Slightly over half of respondents evaluated the presence or absence of business benefits measurement process owner as a "rather good" measure of business benefits measurement with a quarter being “neutral”. Less than 12% were evaluating it as rather bad while 6% as definitely good. The mode and median were both equal 2 which corresponds to "rather yes" while mean was 2.53, almost halfway between "neutral" and "rather yes". We conclude that this measurement method is adequate for the variable in question. It is also very objective and measureable at the project start. Therefore, it can be used for forecasting project success or failure.
3%
6%
51%
25%
12%
3%
Q22:25 Is the presence or absence of business benefits measurements process owner a good measure of business benefits measurements?
Percentage of answers
no answer
1 definitely yes
2 rather yes
3 neutral
4 rather not
5 definitely not
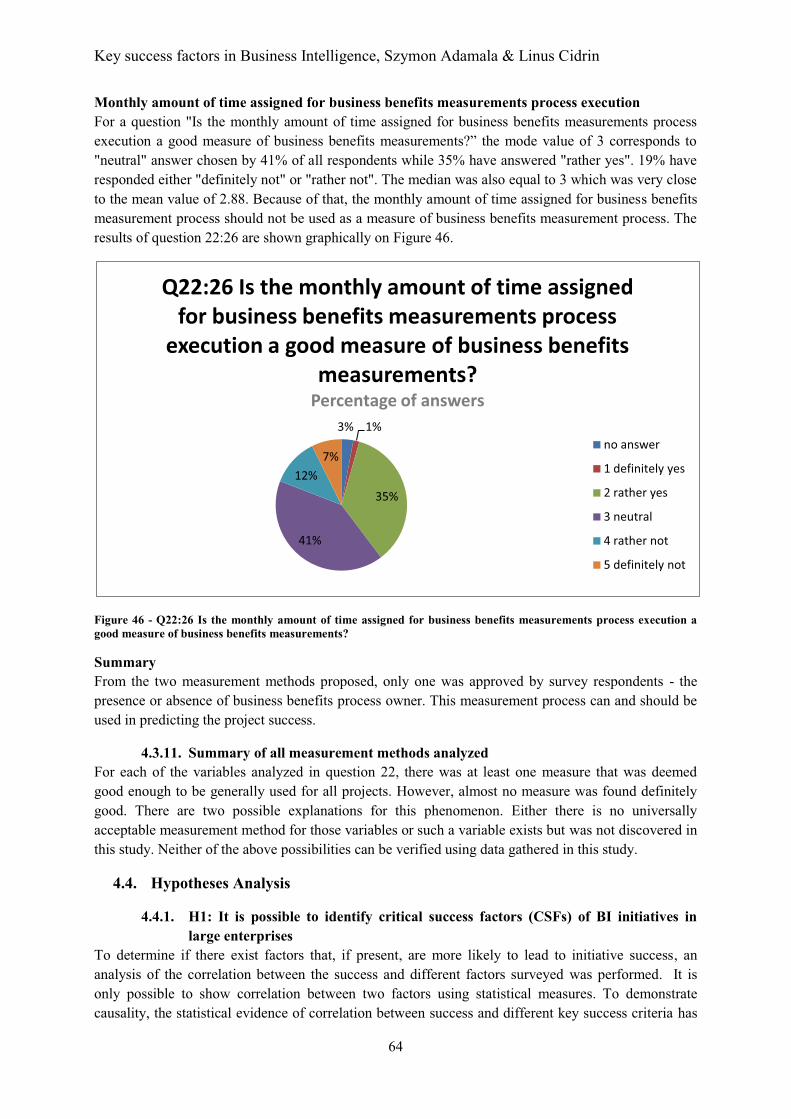
Key success factors in Business Intelligence, Szymon Adamala & Linus Cidrin
64
Monthly amount of time assigned for business benefits measurements process execution For a question "Is the monthly amount of time assigned for business benefits measurements process execution a good measure of business benefits measurements?” the mode value of 3 corresponds to "neutral" answer chosen by 41% of all respondents while 35% have answered "rather yes". 19% have responded either "definitely not" or "rather not". The median was also equal to 3 which was very close to the mean value of 2.88. Because of that, the monthly amount of time assigned for business benefits measurement process should not be used as a measure of business benefits measurement process. The results of question 22:26 are shown graphically on Figure 46.
Figure 46 - Q22:26 Is the monthly amount of time assigned for business benefits measurements process execution a good measure of business benefits measurements?
Summary From the two measurement methods proposed, only one was approved by survey respondents - the presence or absence of business benefits process owner. This measurement process can and should be used in predicting the project success.
4.3.11. Summary of all measurement methods analyzed For each of the variables analyzed in question 22, there was at least one measure that was deemed good enough to be generally used for all projects. However, almost no measure was found definitely good. There are two possible explanations for this phenomenon. Either there is no universally acceptable measurement method for those variables or such a variable exists but was not discovered in this study. Neither of the above possibilities can be verified using data gathered in this study.
4.4. Hypotheses Analysis
4.4.1. H1: It is possible to identify critical success factors (CSFs) of BI initiatives in large enterprises
To determine if there exist factors that, if present, are more likely to lead to initiative success, an analysis of the correlation between the success and different factors surveyed was performed. It is only possible to show correlation between two factors using statistical measures. To demonstrate causality, the statistical evidence of correlation between success and different key success criteria has
3% 1%
35%
41%
12%7%
Q22:26 Is the monthly amount of time assigned for business benefits measurements process
execution a good measure of business benefits measurements?
Percentage of answers
no answer
1 definitely yes
2 rather yes
3 neutral
4 rather not
5 definitely not
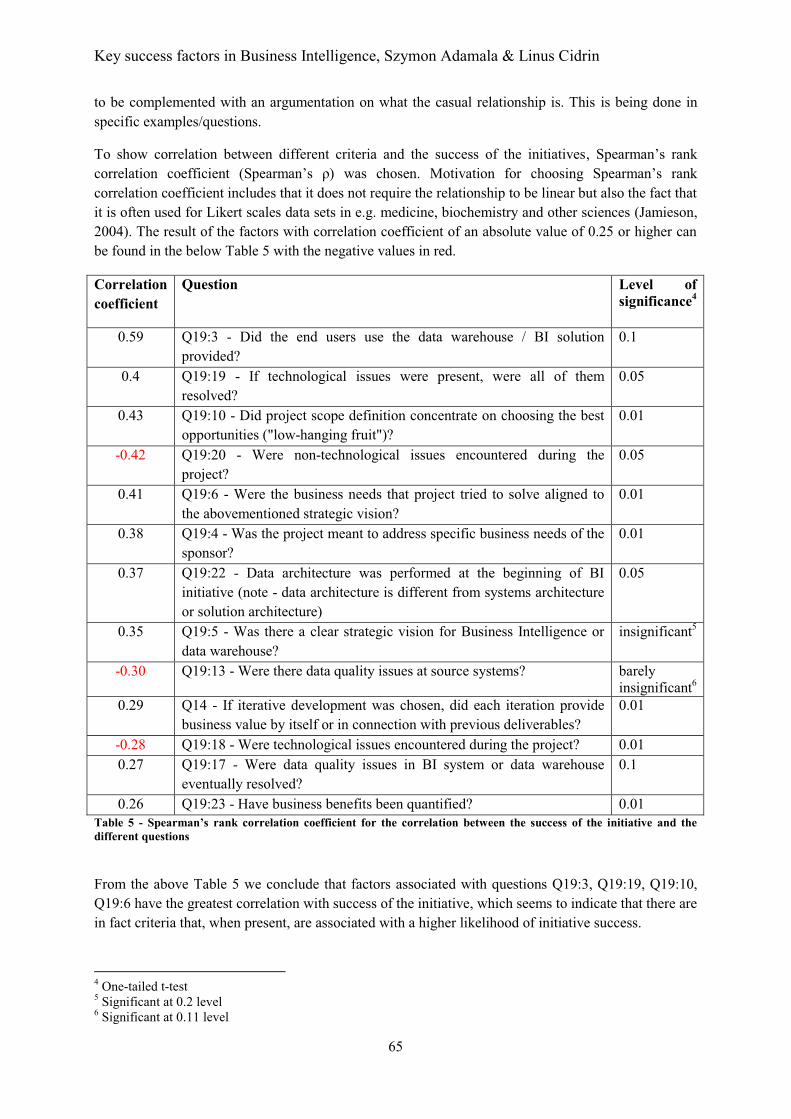
Key success factors in Business Intelligence, Szymon Adamala & Linus Cidrin
65
to be complemented with an argumentation on what the casual relationship is. This is being done in specific examples/questions.
To show correlation between different criteria and the success of the initiatives, Spearman’s rank correlation coefficient (Spearman’s ρ) was chosen. Motivation for choosing Spearman’s rank correlation coefficient includes that it does not require the relationship to be linear but also the fact that it is often used for Likert scales data sets in e.g. medicine, biochemistry and other sciences (Jamieson, 2004). The result of the factors with correlation coefficient of an absolute value of 0.25 or higher can be found in the below Table 5 with the negative values in red.
Correlation coefficient
Question Level of significance4
0.59 Q19:3 - Did the end users use the data warehouse / BI solution provided?
0.1
0.4 Q19:19 - If technological issues were present, were all of them resolved?
0.05
0.43 Q19:10 - Did project scope definition concentrate on choosing the best opportunities ("low-hanging fruit")?
0.01
-0.42 Q19:20 - Were non-technological issues encountered during the project?
0.05
0.41 Q19:6 - Were the business needs that project tried to solve aligned to the abovementioned strategic vision?
0.01
0.38 Q19:4 - Was the project meant to address specific business needs of the sponsor?
0.01
0.37 Q19:22 - Data architecture was performed at the beginning of BI initiative (note - data architecture is different from systems architecture or solution architecture)
0.05
0.35 Q19:5 - Was there a clear strategic vision for Business Intelligence or data warehouse?
insignificant5
-0.30 Q19:13 - Were there data quality issues at source systems? barely insignificant6
0.29 Q14 - If iterative development was chosen, did each iteration provide business value by itself or in connection with previous deliverables?
0.01
-0.28 Q19:18 - Were technological issues encountered during the project? 0.01 0.27 Q19:17 - Were data quality issues in BI system or data warehouse
eventually resolved? 0.1
0.26 Q19:23 - Have business benefits been quantified? 0.01 Table 5 - Spearman’s rank correlation coefficient for the correlation between the success of the initiative and the different questions
From the above Table 5 we conclude that factors associated with questions Q19:3, Q19:19, Q19:10, Q19:6 have the greatest correlation with success of the initiative, which seems to indicate that there are in fact criteria that, when present, are associated with a higher likelihood of initiative success.
4 One-tailed t-test 5 Significant at 0.2 level 6 Significant at 0.11 level
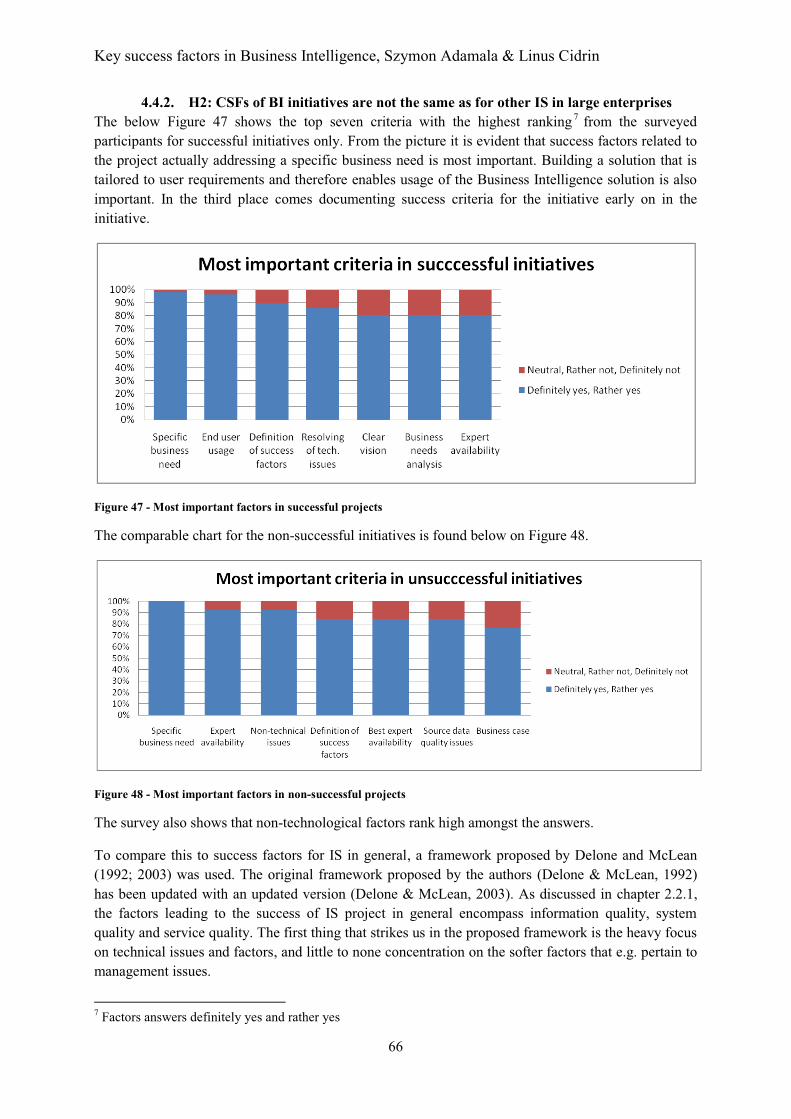
Key success factors in Business Intelligence, Szymon Adamala & Linus Cidrin
66
4.4.2. H2: CSFs of BI initiatives are not the same as for other IS in large enterprises The below Figure 47 shows the top seven criteria with the highest ranking 7 from the surveyed participants for successful initiatives only. From the picture it is evident that success factors related to the project actually addressing a specific business need is most important. Building a solution that is tailored to user requirements and therefore enables usage of the Business Intelligence solution is also important. In the third place comes documenting success criteria for the initiative early on in the initiative.
Figure 47 - Most important factors in successful projects
The comparable chart for the non-successful initiatives is found below on Figure 48.
Figure 48 - Most important factors in non-successful projects
The survey also shows that non-technological factors rank high amongst the answers.
To compare this to success factors for IS in general, a framework proposed by Delone and McLean (1992; 2003) was used. The original framework proposed by the authors (Delone & McLean, 1992) has been updated with an updated version (Delone & McLean, 2003). As discussed in chapter 2.2.1, the factors leading to the success of IS project in general encompass information quality, system quality and service quality. The first thing that strikes us in the proposed framework is the heavy focus on technical issues and factors, and little to none concentration on the softer factors that e.g. pertain to management issues.
7 Factors answers definitely yes and rather yes
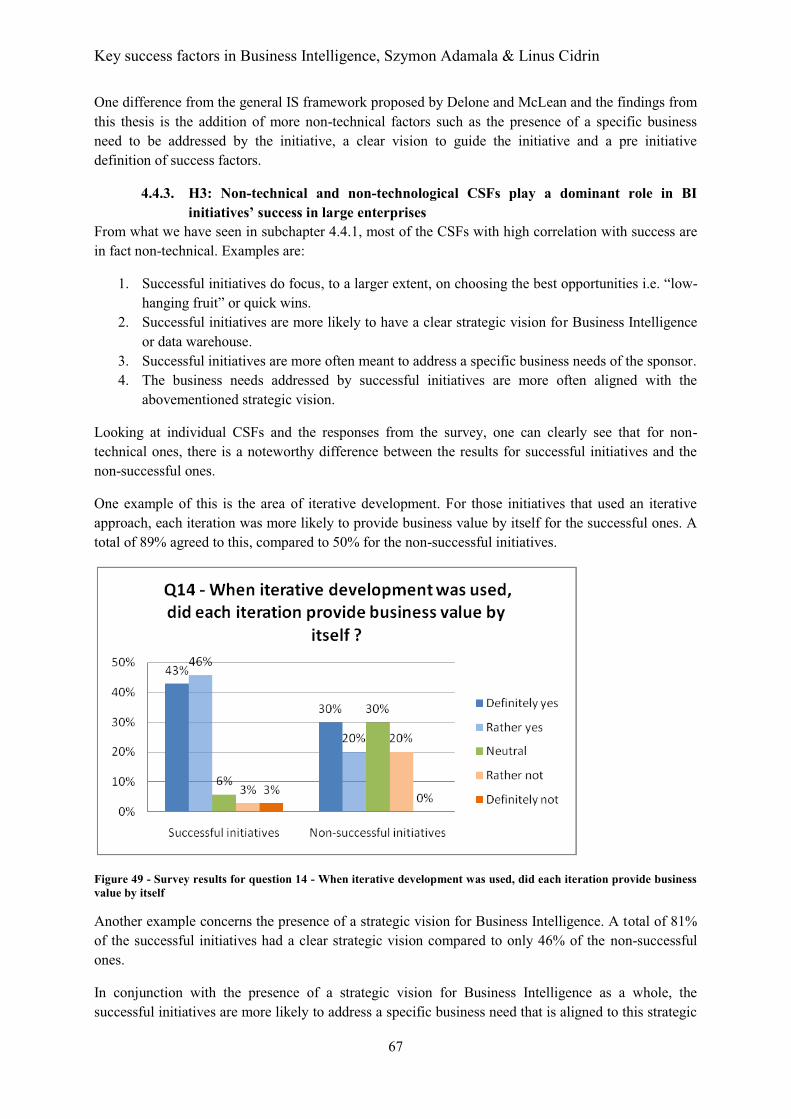
Key success factors in Business Intelligence, Szymon Adamala & Linus Cidrin
67
One difference from the general IS framework proposed by Delone and McLean and the findings from this thesis is the addition of more non-technical factors such as the presence of a specific business need to be addressed by the initiative, a clear vision to guide the initiative and a pre initiative definition of success factors.
4.4.3. H3: Non-technical and non-technological CSFs play a dominant role in BI initiatives’ success in large enterprises
From what we have seen in subchapter 4.4.1, most of the CSFs with high correlation with success are in fact non-technical. Examples are:
1. Successful initiatives do focus, to a larger extent, on choosing the best opportunities i.e. “low-hanging fruit” or quick wins.
2. Successful initiatives are more likely to have a clear strategic vision for Business Intelligence or data warehouse.
3. Successful initiatives are more often meant to address a specific business needs of the sponsor. 4. The business needs addressed by successful initiatives are more often aligned with the
abovementioned strategic vision.
Looking at individual CSFs and the responses from the survey, one can clearly see that for non-technical ones, there is a noteworthy difference between the results for successful initiatives and the non-successful ones.
One example of this is the area of iterative development. For those initiatives that used an iterative approach, each iteration was more likely to provide business value by itself for the successful ones. A total of 89% agreed to this, compared to 50% for the non-successful initiatives.
Figure 49 - Survey results for question 14 - When iterative development was used, did each iteration provide business value by itself
Another example concerns the presence of a strategic vision for Business Intelligence. A total of 81% of the successful initiatives had a clear strategic vision compared to only 46% of the non-successful ones.
In conjunction with the presence of a strategic vision for Business Intelligence as a whole, the successful initiatives are more likely to address a specific business need that is aligned to this strategic
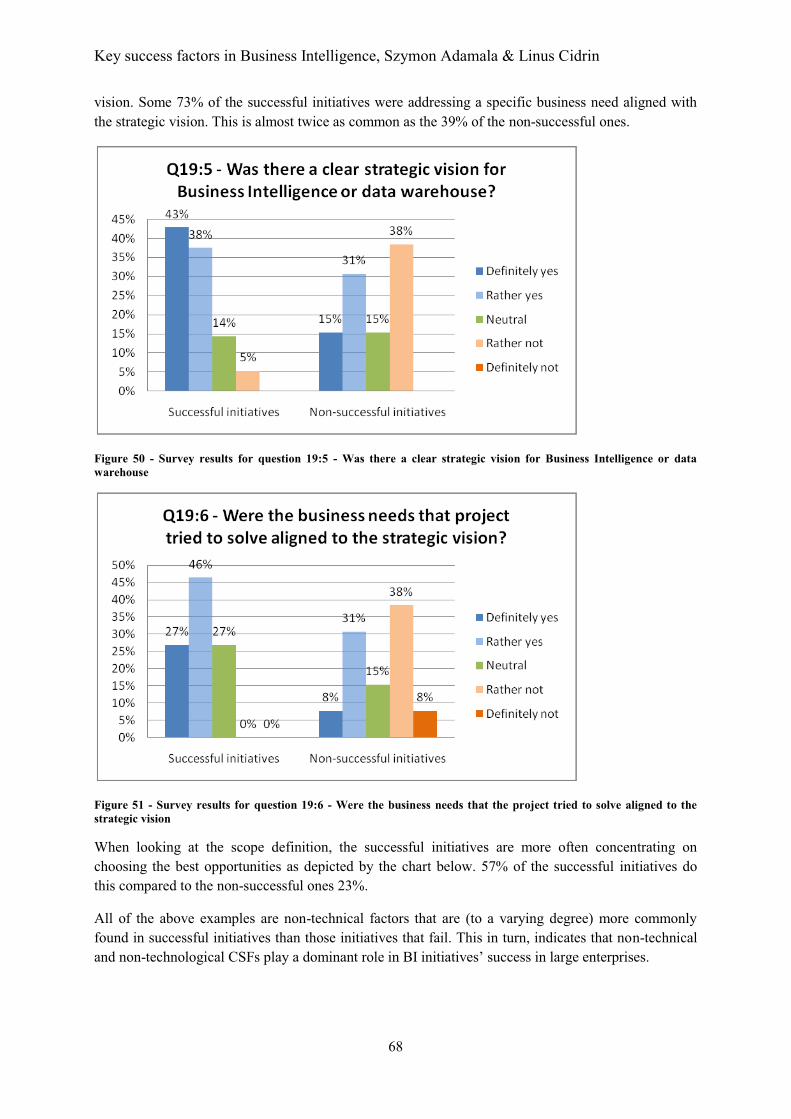
Key success factors in Business Intelligence, Szymon Adamala & Linus Cidrin
68
vision. Some 73% of the successful initiatives were addressing a specific business need aligned with the strategic vision. This is almost twice as common as the 39% of the non-successful ones.
Figure 50 - Survey results for question 19:5 - Was there a clear strategic vision for Business Intelligence or data warehouse
Figure 51 - Survey results for question 19:6 - Were the business needs that the project tried to solve aligned to the strategic vision
When looking at the scope definition, the successful initiatives are more often concentrating on choosing the best opportunities as depicted by the chart below. 57% of the successful initiatives do this compared to the non-successful ones 23%.
All of the above examples are non-technical factors that are (to a varying degree) more commonly found in successful initiatives than those initiatives that fail. This in turn, indicates that non-technical and non-technological CSFs play a dominant role in BI initiatives’ success in large enterprises.
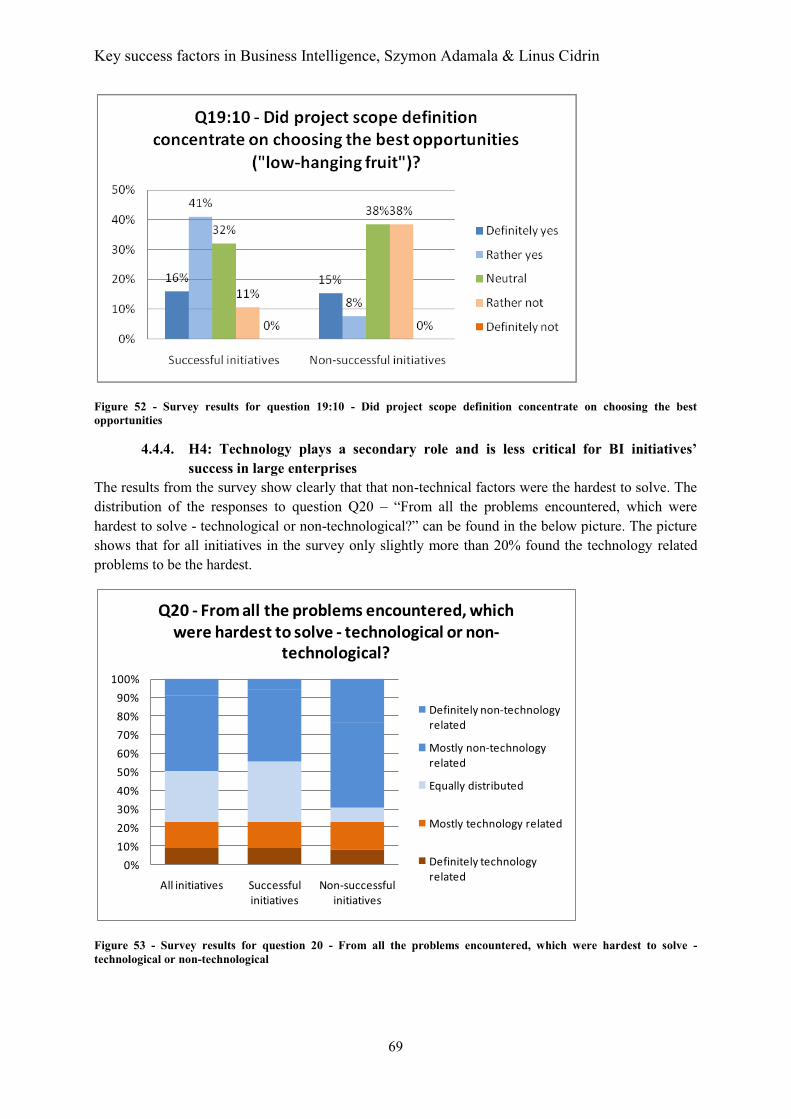
Key success factors in Business Intelligence, Szymon Adamala & Linus Cidrin
69
Figure 52 - Survey results for question 19:10 - Did project scope definition concentrate on choosing the best opportunities
4.4.4. H4: Technology plays a secondary role and is less critical for BI initiatives’ success in large enterprises
The results from the survey show clearly that that non-technical factors were the hardest to solve. The distribution of the responses to question Q20 – “From all the problems encountered, which were hardest to solve - technological or non-technological?” can be found in the below picture. The picture shows that for all initiatives in the survey only slightly more than 20% found the technology related problems to be the hardest.
Figure 53 - Survey results for question 20 - From all the problems encountered, which were hardest to solve - technological or non-technological
0%10%20%30%40%50%60%70%80%90%
100%
All initiatives Successful initiatives
Non-successful initiatives
Q20 - From all the problems encountered, which were hardest to solve - technological or non-
technological?
Definitely non-technology related
Mostly non-technology related
Equally distributed
Mostly technology related
Definitely technology related
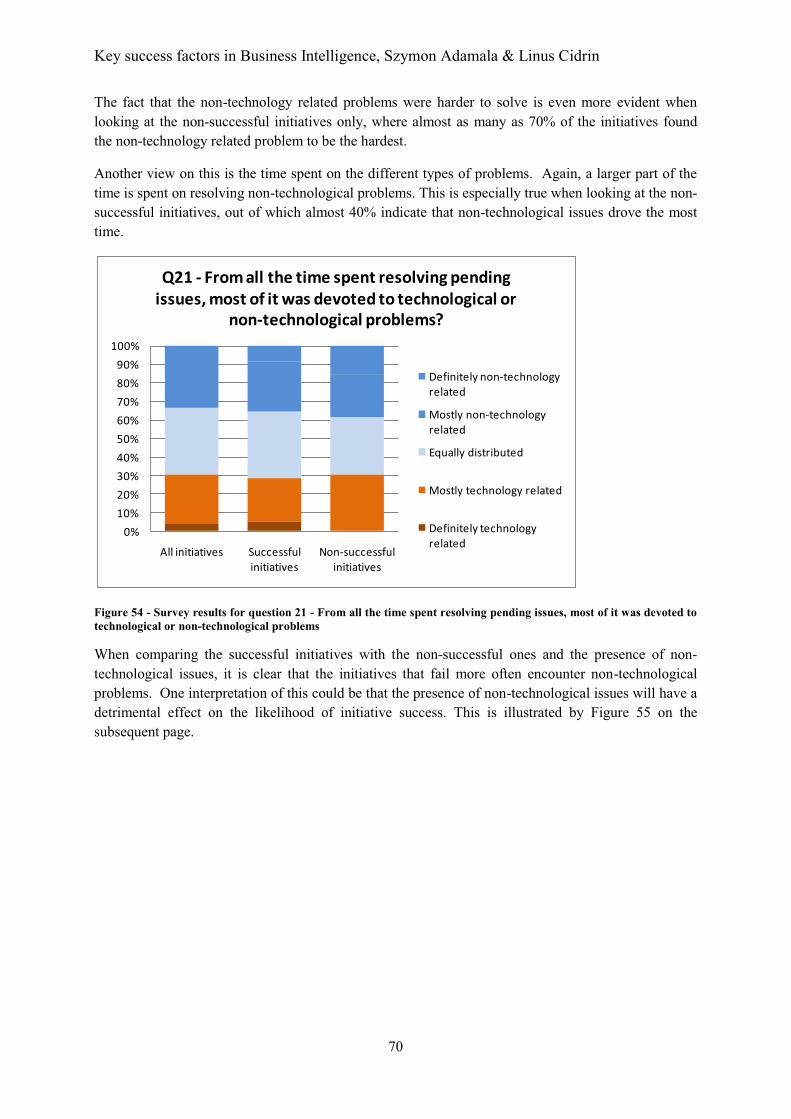
Key success factors in Business Intelligence, Szymon Adamala & Linus Cidrin
70
The fact that the non-technology related problems were harder to solve is even more evident when looking at the non-successful initiatives only, where almost as many as 70% of the initiatives found the non-technology related problem to be the hardest.
Another view on this is the time spent on the different types of problems. Again, a larger part of the time is spent on resolving non-technological problems. This is especially true when looking at the non-successful initiatives, out of which almost 40% indicate that non-technological issues drove the most time.
Figure 54 - Survey results for question 21 - From all the time spent resolving pending issues, most of it was devoted to technological or non-technological problems
When comparing the successful initiatives with the non-successful ones and the presence of non-technological issues, it is clear that the initiatives that fail more often encounter non-technological problems. One interpretation of this could be that the presence of non-technological issues will have a detrimental effect on the likelihood of initiative success. This is illustrated by Figure 55 on the subsequent page.
0%10%20%30%40%50%60%70%80%90%
100%
All initiatives Successful initiatives
Non-successful initiatives
Q21 - From all the time spent resolving pending issues, most of it was devoted to technological or
non-technological problems?
Definitely non-technology related
Mostly non-technology related
Equally distributed
Mostly technology related
Definitely technology related

Key success factors in Business Intelligence, Szymon Adamala & Linus Cidrin
71
Figure 55 - Survey result for question 19:20 - Were non-technological issues encountered during the project
4.4.5. H5: It is possible to develop objective measures for each of CSFs of BI initiatives in large enterprises
The result of this thesis shows that all the CSFs clearly have one or more measures that are ranked higher than the rest. The following summarizes summarizes the proposed measurements methods resulting from the survey
Area/Variable Proposed method(s)
Data warehouse use � Weekly number of queries submitted
Access to subject matter experts
� Percentage of requests responded within one business day � Mean response time for a request
Subject matter expert quality
� Average number of questions needed to be asked per subject matter issue
� Average number of available documents per subject matter issue � Percentage of questions answered within one business day
Adequate level of business staff on the project
� Percentage of business issues resolved within a business week � Mean time to resolve a business issue
Size of deliverable in iterative development
� Percentage of total project time for each iteration
Data quality issues at source systems
� Total number of issues � Number of unresolved issues
Quality issues in BI system or data warehouse
� Number of unresolved issues
Benefits quantification � Calculated ROI � Proposition on how the business intelligence capabilities enables the
realization of business strategy � Contribution to the internal rate of return
Business benefits definition � Percentage of business benefits that are objectively measureable Business benefits measurements
� Presence or absence of business benefits measurements process owner
Table 6 - Summary of veriables analysis

Key success factors in Business Intelligence, Szymon Adamala & Linus Cidrin
72
For details on the specific measures per CSF, see section 4.3.

Key success factors in Business Intelligence, Szymon Adamala & Linus Cidrin
73
5. Conclusion The hypotheses of this thesis are centered on the factors that make Business Intelligence initiatives successful. The hypotheses are:
H1. It is possible to identify critical success factors (CSFs) of BI initiatives primarily in Poland. H2. CSFs of BI initiatives primarily in Poland are not the same as for information systems in
general. H3. Non-technical and non-technological CSFs play a dominant role in BI initiatives’ success for
initiatives primarily in Poland. H4. Technology plays a secondary role and is less critical for BI initiatives’ success for initiatives
primarily in Poland. H5. It is possible to develop objective measures for each of CSFs of BI initiatives primarily in
Poland.
A quantitative approach was used to gather data to support or reject the above hypotheses. A primary research survey was used for gathering data on the above hypotheses. The survey was conducted online during Q2 of 2011. The findings can be summarized as following.
5.1. Non-technological problems dominate in Business Intelligence projects primarily in Poland
Business Intelligence projects wrestle with both technological and non-technological problems, but the non-technological problems are found to be both harder to solve as well as more time consuming than their technological counterparts. For all initiatives in the survey, only slightly more than 20% found the technology related problems to be the hardest. When looking at the non-successful initiatives only, almost as much as 70% found the non-technology related problem to be the hardest. The other view on this, the time spent on the different types of problems, also shows that a larger part of the time is spent on resolving non-technological problems. This is especially true when looking at the non-successful initiatives, almost 40% of which indicate that non-technological issues drove the most time.
5.2. Successful projects primarily in Poland share common factors Certain factors or attributes of Business Intelligence projects are correlated with the success of the initiative. The correlation has been calculated using Spearman’s rank and shown in the model that was developed using Partial Least Squares. By using rational argumentation, it can be shown that those factors do in fact have a causal relationship with the likelihood of success. The highest correlated factors are:
� A project scope definition that concentrate on choosing the best opportunities ("low-hanging fruit").
� The alignment of the business needs that project tries to solve aligned with the strategic vision of business intelligence.
� A project that is meant to address specific business needs of the sponsor. � Performing data architecture at the beginning of BI initiative. � Having a clear strategic vision for Business Intelligence or data warehouse.
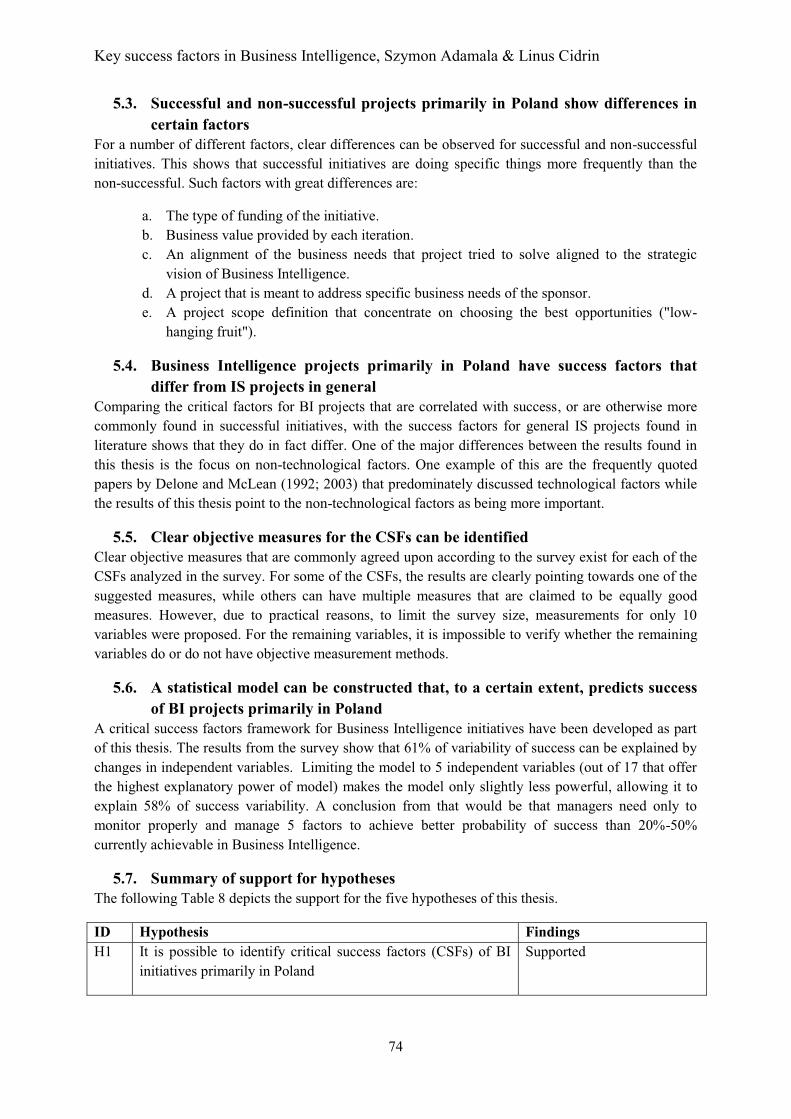
Key success factors in Business Intelligence, Szymon Adamala & Linus Cidrin
74
5.3. Successful and non-successful projects primarily in Poland show differences in certain factors
For a number of different factors, clear differences can be observed for successful and non-successful initiatives. This shows that successful initiatives are doing specific things more frequently than the non-successful. Such factors with great differences are:
a. The type of funding of the initiative. b. Business value provided by each iteration. c. An alignment of the business needs that project tried to solve aligned to the strategic
vision of Business Intelligence. d. A project that is meant to address specific business needs of the sponsor. e. A project scope definition that concentrate on choosing the best opportunities ("low-
hanging fruit").
5.4. Business Intelligence projects primarily in Poland have success factors that differ from IS projects in general
Comparing the critical factors for BI projects that are correlated with success, or are otherwise more commonly found in successful initiatives, with the success factors for general IS projects found in literature shows that they do in fact differ. One of the major differences between the results found in this thesis is the focus on non-technological factors. One example of this are the frequently quoted papers by Delone and McLean (1992; 2003) that predominately discussed technological factors while the results of this thesis point to the non-technological factors as being more important.
5.5. Clear objective measures for the CSFs can be identified Clear objective measures that are commonly agreed upon according to the survey exist for each of the CSFs analyzed in the survey. For some of the CSFs, the results are clearly pointing towards one of the suggested measures, while others can have multiple measures that are claimed to be equally good measures. However, due to practical reasons, to limit the survey size, measurements for only 10 variables were proposed. For the remaining variables, it is impossible to verify whether the remaining variables do or do not have objective measurement methods.
5.6. A statistical model can be constructed that, to a certain extent, predicts success of BI projects primarily in Poland
A critical success factors framework for Business Intelligence initiatives have been developed as part of this thesis. The results from the survey show that 61% of variability of success can be explained by changes in independent variables. Limiting the model to 5 independent variables (out of 17 that offer the highest explanatory power of model) makes the model only slightly less powerful, allowing it to explain 58% of success variability. A conclusion from that would be that managers need only to monitor properly and manage 5 factors to achieve better probability of success than 20%-50% currently achievable in Business Intelligence.
5.7. Summary of support for hypotheses The following Table 8 depicts the support for the five hypotheses of this thesis.
ID Hypothesis Findings H1 It is possible to identify critical success factors (CSFs) of BI
initiatives primarily in Poland Supported
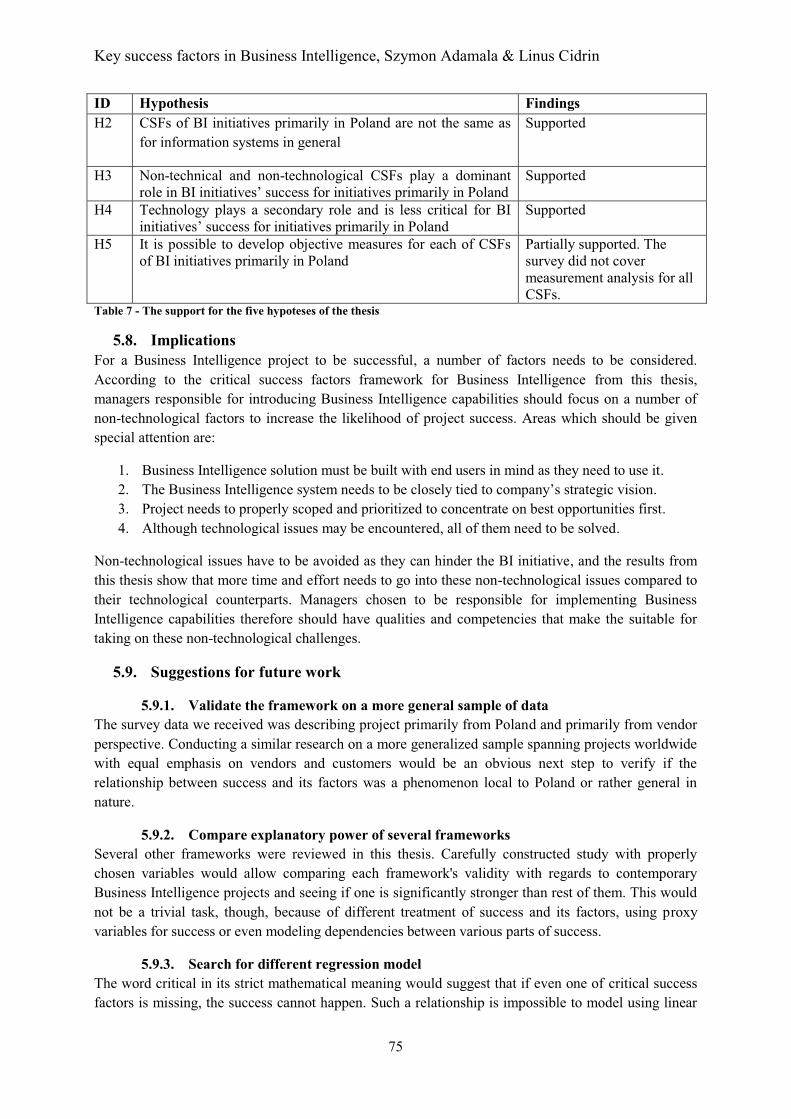
Key success factors in Business Intelligence, Szymon Adamala & Linus Cidrin
75
ID Hypothesis Findings H2 CSFs of BI initiatives primarily in Poland are not the same as
for information systems in general Supported
H3 Non-technical and non-technological CSFs play a dominant role in BI initiatives’ success for initiatives primarily in Poland
Supported
H4 Technology plays a secondary role and is less critical for BI initiatives’ success for initiatives primarily in Poland
Supported
H5 It is possible to develop objective measures for each of CSFs of BI initiatives primarily in Poland
Partially supported. The survey did not cover measurement analysis for all CSFs.
Table 7 - The support for the five hypoteses of the thesis 5.8. Implications
For a Business Intelligence project to be successful, a number of factors needs to be considered. According to the critical success factors framework for Business Intelligence from this thesis, managers responsible for introducing Business Intelligence capabilities should focus on a number of non-technological factors to increase the likelihood of project success. Areas which should be given special attention are:
1. Business Intelligence solution must be built with end users in mind as they need to use it. 2. The Business Intelligence system needs to be closely tied to company’s strategic vision. 3. Project needs to properly scoped and prioritized to concentrate on best opportunities first. 4. Although technological issues may be encountered, all of them need to be solved.
Non-technological issues have to be avoided as they can hinder the BI initiative, and the results from this thesis show that more time and effort needs to go into these non-technological issues compared to their technological counterparts. Managers chosen to be responsible for implementing Business Intelligence capabilities therefore should have qualities and competencies that make the suitable for taking on these non-technological challenges.
5.9. Suggestions for future work
5.9.1. Validate the framework on a more general sample of data The survey data we received was describing project primarily from Poland and primarily from vendor perspective. Conducting a similar research on a more generalized sample spanning projects worldwide with equal emphasis on vendors and customers would be an obvious next step to verify if the relationship between success and its factors was a phenomenon local to Poland or rather general in nature.
5.9.2. Compare explanatory power of several frameworks Several other frameworks were reviewed in this thesis. Carefully constructed study with properly chosen variables would allow comparing each framework's validity with regards to contemporary Business Intelligence projects and seeing if one is significantly stronger than rest of them. This would not be a trivial task, though, because of different treatment of success and its factors, using proxy variables for success or even modeling dependencies between various parts of success.
5.9.3. Search for different regression model The word critical in its strict mathematical meaning would suggest that if even one of critical success factors is missing, the success cannot happen. Such a relationship is impossible to model using linear

Key success factors in Business Intelligence, Szymon Adamala & Linus Cidrin
76
regression, even taking into account the application of data transformations similar to ours to achieve linear combinations of some functions of variables. Therefore, another study could be performed to search for a model that would better explain the success using the variables used by us. It is possible that the variables used in our study would be able to predict more of the Business Intelligence success when organized in a different fashion
5.9.4. Search for other success factors Because almost 40% of success variability remains unexplained in our model, it is possible that it can be attributed to the weakness of linear relationship assumed in the model, to the missing variable that remains unidentified or even to a random factor that is influenced only by chance and cannot be controlled by management. Before a model with higher explanatory power is constructed, it is always appropriate to keep looking for a missing variable that might potentially account for a significant portion of unexplained success variability
5.9.5. Search for other measurement criteria Although our work proposed several objective measurement criteria for independent variables, most of them cannot be considered universally applicable in all (or even most) Business Intelligence projects. Therefore, another study could be conducted to verify whether such universal and objective measures exist and attempt to define them. In case such measures do not exist, perhaps there is a set of measures for each variable such that at least one of the quantification methods would be universally applicable?
5.9.6. Define financial aspect of success of Business Intelligence One of the delimitations in our work was lack of treatment of NPV, ROI and other financial measures of Business Intelligence projects. Since success factors are different for BI than for IS in general, perhaps Business Intelligence managers should also employ different methods for calculating financial measures than in case of other IS. In case such differences are identified, appropriate methods should be proposed and aforementioned differences should be thoroughly understood. This, however, would be an undertaking much larger than the material for a single master’s thesis.

Key success factors in Business Intelligence, Szymon Adamala & Linus Cidrin
77
References Adelman, S. (2003). Impossible Data Warehouse Situations. Solutions from the Experts. Boston, MA: Pearson Education.
Adèr, & Mellenbergh, G. Advising on Research Methods: A consultant's companion. Huizen, The Netherlands: Johannes van Kessel Publishing.
Ariyachandra, T., & Watson, H. (2006). Which Data Warehouse Architecture Is Most Successful? Business Intelligence Journal , 11 (1).
Babbie, E. (2009). The Practice of Social Research. Wadsworth Publishing.
Beal, B. (2005, March 9). Report: Half of data warehouse projects to fail. Retrieved May 22, 2011, from Search CRM: http://searchcrm.techtarget.com/news/1066086/Report-Half-of-data-warehouse-projects-to-fail
Chen, L., Soliman, K., Mao, E., & Frolick, M. (2000). Measuring user satisfaction with data warehouses: An exploratory study. Information & Management , 37 (3), 103-110.
Daniel, D. (1961). Management Information Crisis. Harvard Business Review .
Delone, W., & McLean, E. (1992). Information Systems Success: The Quest for the Dependent Variable. Journal of Information System Research , 3 (1), 60-95.
Delone, W., & McLean, E. (2003). The DeLone and McLean Model of Information Systems Success: A Ten-Year Update. Journal of Management Information Systems , 19 (4), 9-30.
Duncan, W. (1996). A Guide to the Project Management Body of Knowledge. Sylva, North Carolina: PMI Publishing.
Ellison, R., & Moore, A. (2003). Trustworthy Refinement Through Intrusion-Aware Design. Carnegie Mellon Software Engineering Institute.
Garson, G. (2011). Statnotes on Partial Least Squares Regression and Path Modeling. Retrieved August 14, 2011, from http://faculty.chass.ncsu.edu/garson/PA765/pls.htm
Garthwaite, P. (1994). An Interpretation of Partial Least Squares. Journal of the American Statistical Association , 89 (425), 122-127.
Ghauri, P. (2005). Research Methods in Business Studies (3rd ed. ed.). Essex: Pearson Education.
Hwang, M., & Xu, H. (2008). A Structural Model of Data Warehousing Success. Journal of Computer Information Systems , 48-56.
Inmon, W. H. (2002). Building the Data Warehouse, 3rd ed. New York, NY: John Wiley & Sons.
Jamieson, S. (2004). Likert scales: how to (ab)use them. Medical Education , 1217-1218.
Kimball, R., & Ross, M. (2002). The data warehouse Toolkit (2 ed.). New York, NY: John Wiley and Sons, Inc.
Key success factors in Business Intelligence, Szymon Adamala & Linus Cidrin
78
Kimball, R., Ross, M., Thornthwaite, W., Mondy, J., & Becker, B. (2008). The Data Warehouse Lifecycle Toolkit, 2nd ed. Indianapolis, IN: Wiley Publishing.
Laskowski, N. (2001, May 5). Gartner BI Summit: Business intelligence benefits lie in orchestration. Retrieved May 22, 2011, from http://searchbusinessanalytics.techtarget.com/news/2240035533/Gartner-BI-Summit-Business-intelligence-benefits-lie-in-orchestration?asrc=EM_NLN_13851353&track=NL-544&ad=832107
Lee, A. (1989). A Scientific Methodology for MIS Case Studies. MIS Quarterly , 13 (1), 32-55.
Legodi, I., & Barry, M.-L. (2010). The current challenges and status of risk management in enterprise data warehouse projects in South Africa. PICMET 2010 Technology Management for Global Economic Growth.
Linstone, H. A., & Turoff, M. (2002). The Delphi Method Techniques and Applications.
Markarian, J., Brobst, S., & Bedell, J. (2007). Critical Success Factors Deploying Pervasive BI.
Meehan, P. (2011, January 31). Patrick Meehan speech during Gartner Business Intelligence Summit 2011. London, UK. Retrieved from http://link.brightcove.com/services/player/bcpid1156010110?bctid=741282639001
Merriam-Webster Dictionary. (2011). Retrieved May 24, 2011, from Merriam-Webster.com
Numminen, E. (2010). On the Economic Return of a Software Investment – Managing Cost, PhD Dissertation.
Pirouz, D. (2006, October 10). An Overview of Partial Least Squares. Retrieved May 27, 2011, from Social Science Research Network: http://ssrn.com/abstract=1631359
Pisello, T. (2001). IT Value Chain Management –Maximizing the ROI from IT Investments. Alinean, LLC.
Popovic, A., & Jaklic, J. (2010). Benefits of Business Intelligence System Implementation: An Empirical Analysis of the Impact of Business Intelligence System Maturity on Information Quality.
Ringle, C., Wende, S., & Will, S. (2005). SmartPLS 2.0 (M3) Beta. Hamburg.
Shin, B. (2003). An Exploratory Investigation of System Success Factors in Data Warehousing. Communications of the Association for Information Systems , 6 (4), 141-170.
Solberg Søilen, K., & Hasslinger, A. (2009). How application integration, security issues and pricing strategies in business intelligence shape vendor differentiation. ECIS 2009: THIRD EUROPEAN COMPETITIVE INTELLIGENCE SYMPOSIUM, (pp. 252-260). Stockholm.
Walton, E. J., & Dawson, S. (2001). Managers’ Perceptions of Criteria of Organizational Effectiveness. Journal of Management Studies , 173-179.
Watson, H., Annino, D., Wixom, B., Avery, L., & Rutherford, M. (2001). Current Practices in Data Warehousing. Information Systems Management , 18 (1), 47-55.
Wixom, B., & Watson, H. (2001). An Empirical Investigation of the Factors Affecting Data Warehousing Success. MIS Quarterly , 25 (1), 17-41.

Key success factors in Business Intelligence, Szymon Adamala & Linus Cidrin
79
Yeoh, W., & Koronios, A. (2010). Critical Success Factors for Business Intelligence Systems. Journal of Computer Information Systems , 50 (3), 23-32.
Yeoh, W., Gao, J., & Koronios, A. (2007). Towards a CSF Framework for Implementation of Business Intelligence Systems: A Delphi Study in Engineering Asset Management Organisations. Research and Practical Issues of Enterprise Information Systems II. Beijing, PRC.

Key success factors in Business Intelligence, Szymon Adamala & Linus Cidrin
80
Appendices
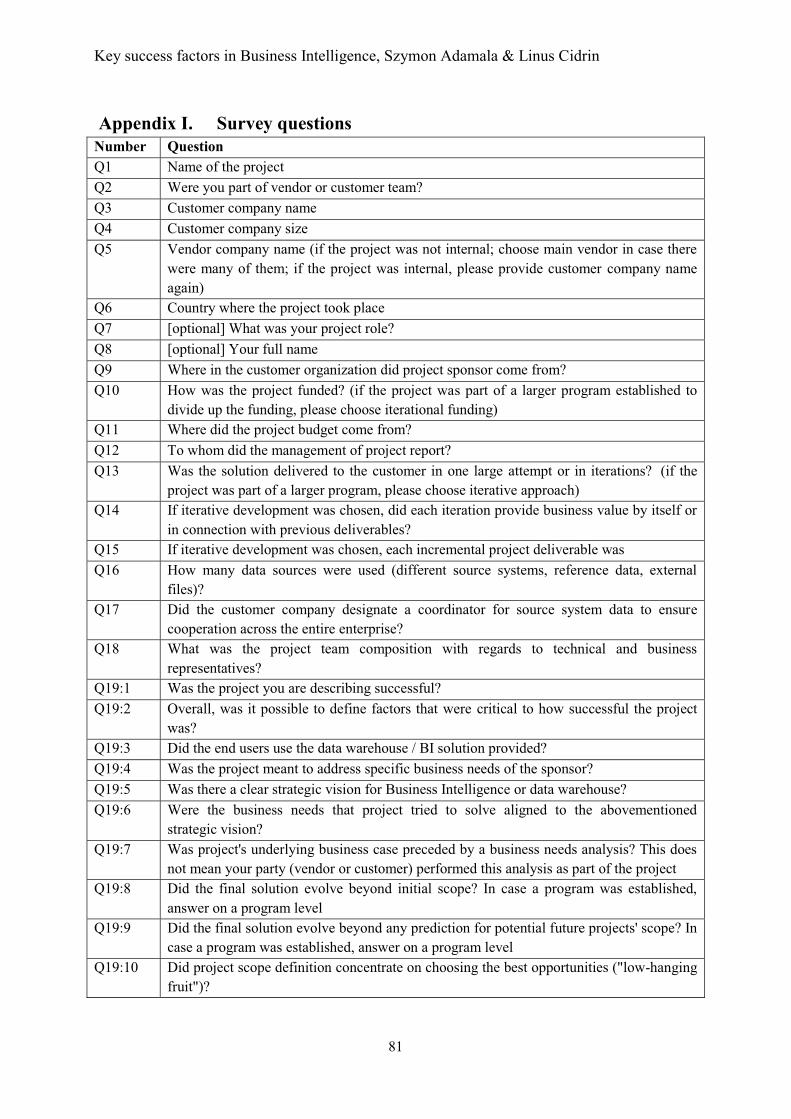
Key success factors in Business Intelligence, Szymon Adamala & Linus Cidrin
81
Appendix I. Survey questions Number Question Q1 Name of the project Q2 Were you part of vendor or customer team? Q3 Customer company name Q4 Customer company size Q5 Vendor company name (if the project was not internal; choose main vendor in case there
were many of them; if the project was internal, please provide customer company name again)
Q6 Country where the project took place Q7 [optional] What was your project role? Q8 [optional] Your full name Q9 Where in the customer organization did project sponsor come from? Q10 How was the project funded? (if the project was part of a larger program established to
divide up the funding, please choose iterational funding) Q11 Where did the project budget come from? Q12 To whom did the management of project report? Q13 Was the solution delivered to the customer in one large attempt or in iterations? (if the
project was part of a larger program, please choose iterative approach) Q14 If iterative development was chosen, did each iteration provide business value by itself or
in connection with previous deliverables? Q15 If iterative development was chosen, each incremental project deliverable was Q16 How many data sources were used (different source systems, reference data, external
files)? Q17 Did the customer company designate a coordinator for source system data to ensure
cooperation across the entire enterprise? Q18 What was the project team composition with regards to technical and business
representatives? Q19:1 Was the project you are describing successful? Q19:2 Overall, was it possible to define factors that were critical to how successful the project
was? Q19:3 Did the end users use the data warehouse / BI solution provided? Q19:4 Was the project meant to address specific business needs of the sponsor? Q19:5 Was there a clear strategic vision for Business Intelligence or data warehouse? Q19:6 Were the business needs that project tried to solve aligned to the abovementioned
strategic vision? Q19:7 Was project's underlying business case preceded by a business needs analysis? This does
not mean your party (vendor or customer) performed this analysis as part of the project Q19:8 Did the final solution evolve beyond initial scope? In case a program was established,
answer on a program level Q19:9 Did the final solution evolve beyond any prediction for potential future projects' scope? In
case a program was established, answer on a program level Q19:10 Did project scope definition concentrate on choosing the best opportunities ("low-hanging
fruit")?
Key success factors in Business Intelligence, Szymon Adamala & Linus Cidrin
82
Number Question Q19:11 When an expert in a particular field was needed, was project team always granted access
to an expert or enhanced by including one? Q19:12 When an expert was assigned to a team or made available to a team, was it always the
best expert available? Q19:13 Were there data quality issues at source systems? Q19:14 If there were data quality issues at source systems, were they known before the start of BI
initiative? Q19:15 If there were data quality issues at source systems, were they discovered because of BI
initiative? Q19:16 Were there data quality issues in BI system or data warehouse? Q19:17 Were data quality issues in BI system or data warehouse eventually resolved? Q19:18 Were technological issues encountered during the project? Q19:19 If technological issues were present, were all of them resolved? Q19:20 Were non-technological issues encountered during the project? Q19:21 If non-technological issues were present, were all of them resolved? Q19:22 Data architecture was performed at the beginning of BI initiative (note - data architecture
is different from systems architecture or solution architecture) Q19:23 Have business benefits been quantified? Q19:24 Were key metrics for business benefits defined? Q19:25 Was there a process in place to measure business benefits? Q20 From all the problems encountered, which were hardest to solve - technological or non-
technological? Q21 From all the time spent resolving pending issues, most of it was devoted to technological
or non-technological problems? Q22:1 Do you think weekly number of distinct users is a good measure of data warehouse use? Q22:2 Do you think weekly number of queries submitted is a good measure of data warehouse Q22:3 Do you think weekly number of logons is a good measure of data warehouse use? Q22:4 Do you think that mean response time for a request is a good measure for access to
subject matter experts? Q22:5 Do you think that percentage of requests responded within one business day is a good
measure for access to subject matter experts? Q22:6 Do you think that average number of questions needed to be asked per subject matter
issue is a good measure for subject matter expert quality? Q22:7 Do you think that the average number of available documents per subject matter issue is a
good measure for subject matter expert quality? Q22:8 Do you think that percentage of questions answered within one business day is a good
measure for subject matter expert quality? Q22:9 Is the percentage of man-days spent by business staff on a project an adequate measure
for whether there was enough business staff on the project? Q22:10 Is the mean time to resolve a business issue an adequate measure of whether there was
enough business staff on a project? Q22:11 Is the percentage of business issues resolved within a business week an adequate measure
of whether there was enough business staff on a project? Q22:12 Is the average number of weeks of duration for iterations a good measure for the size of
deliverable in iterative development?

Key success factors in Business Intelligence, Szymon Adamala & Linus Cidrin
83
Number Question Q22:13 Is the percentage of total project time for each iteration a good measure for the size of
deliverable on iterative development? Q22:14 Is the number of issues a good measure for data quality issues at source systems? Q22:15 Is the number of unresolved issues a good measure for data quality issues at source
systems? Q22:16 Is the average number of man-days of extra project work per issue a good measure for
data quality issues at source systems? Q22:17 Is the number of issues a good measure for data quality issues in BI system or data
warehouse? Q22:18 Is the number of unresolved issues a good measure for data quality issues in BI system or
data warehouse? Q22:19 Is the average number of man-days of extra project work per issue a good measure for
data quality issues in BI system or data warehouse? Q22:20 Is a calculated ROI a good measure of benefits quantification? Q22:21 Is a proposition on how the business intelligence capabilities enables the realization of
business strategy a good measure of benefits quantification? Q22:22 Is the calculation of contribution to the internal rate of return a good measure of benefits
quantification? Q22:23 Is the percentage of business benefits that have detailed written definition a good measure
of business benefits definition? Q22:24 Is the percentage of business benefits that are objectively measureable a good measure of
business benefits definition? Q22:25 Is the presence or absence of business benefits measurements process owner a good
measure of business benefits measurements? Q22:26 Is the monthly amount of time assigned for business benefits measurements process
execution a good measure of business benefits measurements? Table 8 - Survey questions
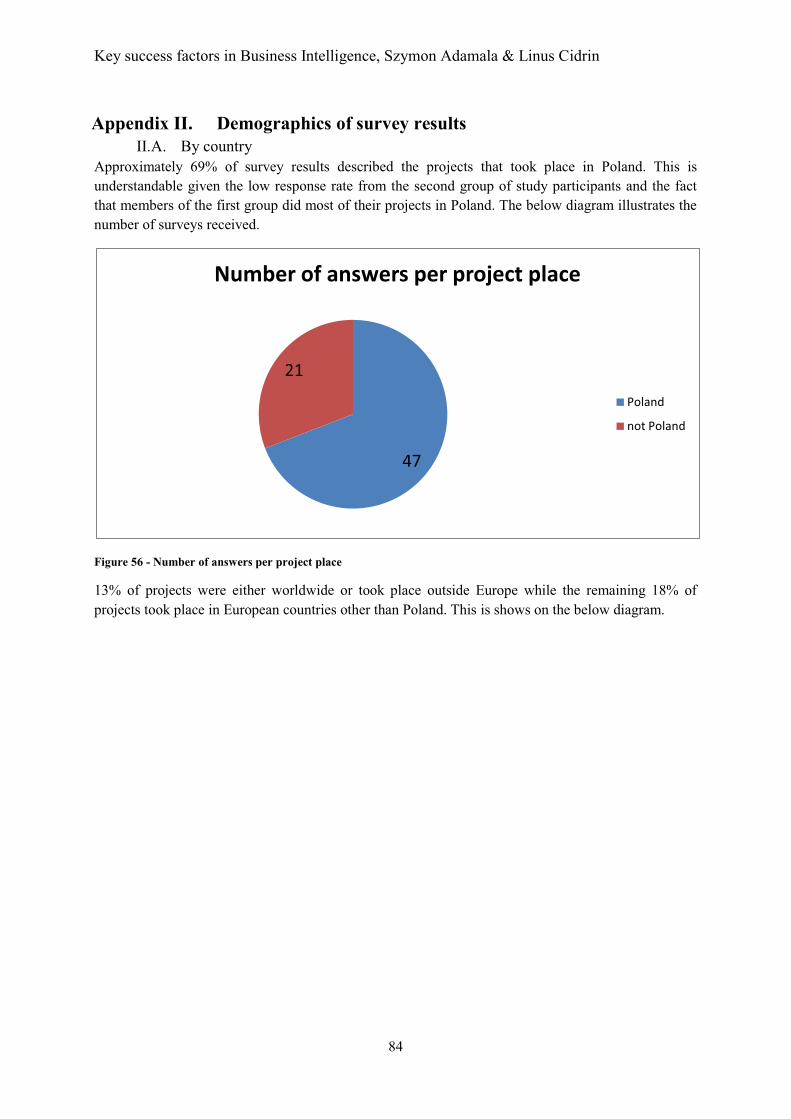
Key success factors in Business Intelligence, Szymon Adamala & Linus Cidrin
84
Appendix II. Demographics of survey results II.A. By country
Approximately 69% of survey results described the projects that took place in Poland. This is understandable given the low response rate from the second group of study participants and the fact that members of the first group did most of their projects in Poland. The below diagram illustrates the number of surveys received.
Figure 56 - Number of answers per project place
13% of projects were either worldwide or took place outside Europe while the remaining 18% of projects took place in European countries other than Poland. This is shows on the below diagram.
47
21
Number of answers per project place
Poland
not Poland
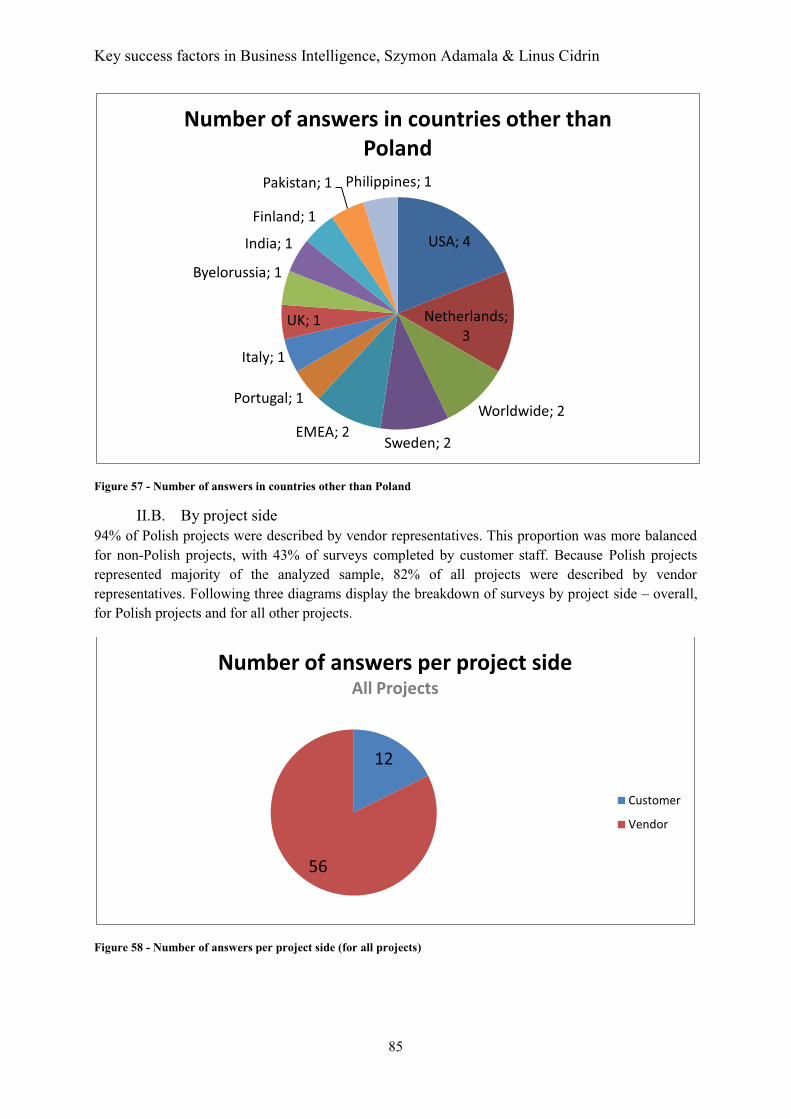
Key success factors in Business Intelligence, Szymon Adamala & Linus Cidrin
85
Figure 57 - Number of answers in countries other than Poland
II.B. By project side 94% of Polish projects were described by vendor representatives. This proportion was more balanced for non-Polish projects, with 43% of surveys completed by customer staff. Because Polish projects represented majority of the analyzed sample, 82% of all projects were described by vendor representatives. Following three diagrams display the breakdown of surveys by project side – overall, for Polish projects and for all other projects.
Figure 58 - Number of answers per project side (for all projects)
USA; 4
Netherlands; 3
Worldwide; 2
Sweden; 2EMEA; 2
Portugal; 1
Italy; 1
UK; 1
Byelorussia; 1
India; 1
Finland; 1
Pakistan; 1 Philippines; 1
Number of answers in countries other than Poland
12
56
Number of answers per project sideAll Projects
Customer
Vendor
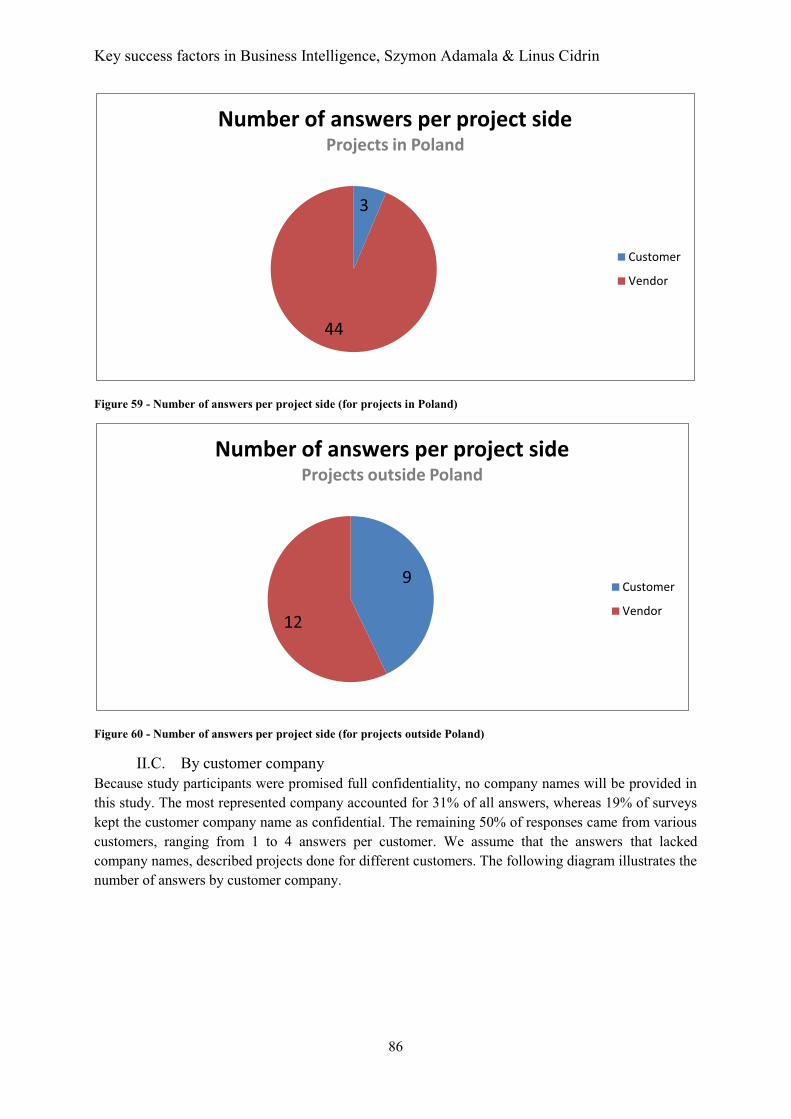
Key success factors in Business Intelligence, Szymon Adamala & Linus Cidrin
86
Figure 59 - Number of answers per project side (for projects in Poland)
Figure 60 - Number of answers per project side (for projects outside Poland)
II.C. By customer company Because study participants were promised full confidentiality, no company names will be provided in this study. The most represented company accounted for 31% of all answers, whereas 19% of surveys kept the customer company name as confidential. The remaining 50% of responses came from various customers, ranging from 1 to 4 answers per customer. We assume that the answers that lacked company names, described projects done for different customers. The following diagram illustrates the number of answers by customer company.
3
44
Number of answers per project sideProjects in Poland
Customer
Vendor
9
12
Number of answers per project sideProjects outside Poland
Customer
Vendor
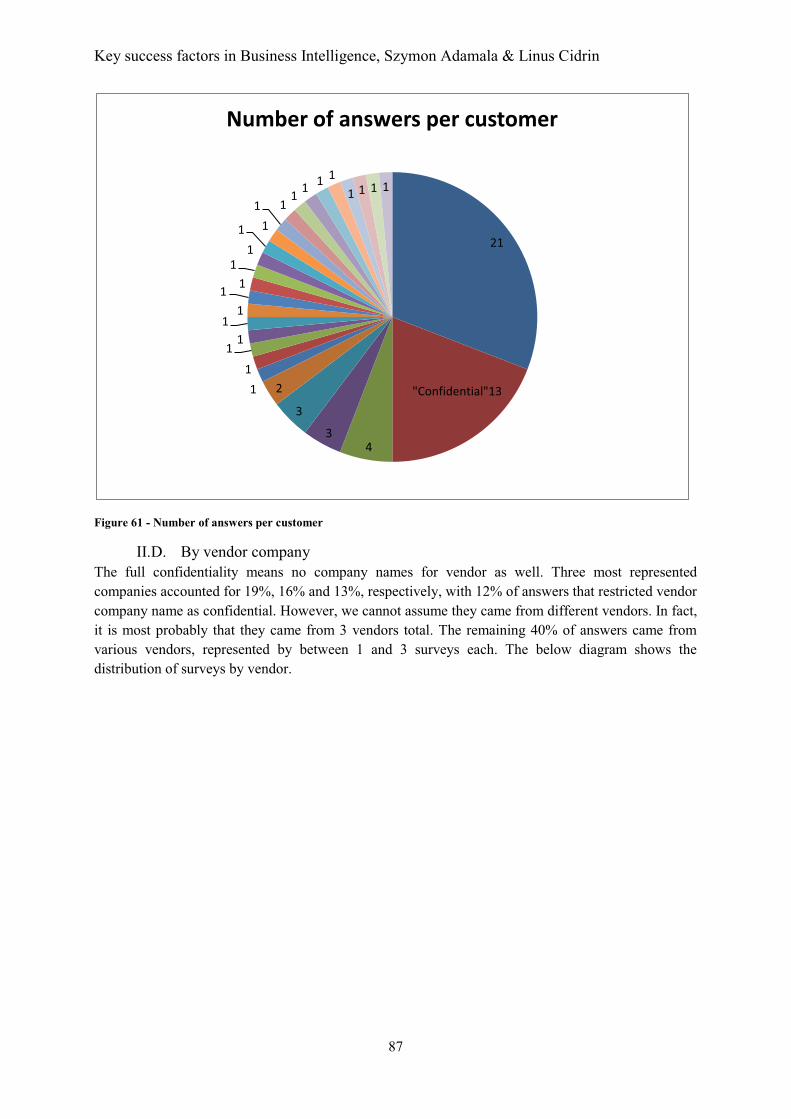
Key success factors in Business Intelligence, Szymon Adamala & Linus Cidrin
87
Figure 61 - Number of answers per customer
II.D. By vendor company The full confidentiality means no company names for vendor as well. Three most represented companies accounted for 19%, 16% and 13%, respectively, with 12% of answers that restricted vendor company name as confidential. However, we cannot assume they came from different vendors. In fact, it is most probably that they came from 3 vendors total. The remaining 40% of answers came from various vendors, represented by between 1 and 3 surveys each. The below diagram shows the distribution of surveys by vendor.
21
"Confidential"13
43
3
211
11
11
1 11
11 1
1 11 1 1 1
1 1 1 1
Number of answers per customer
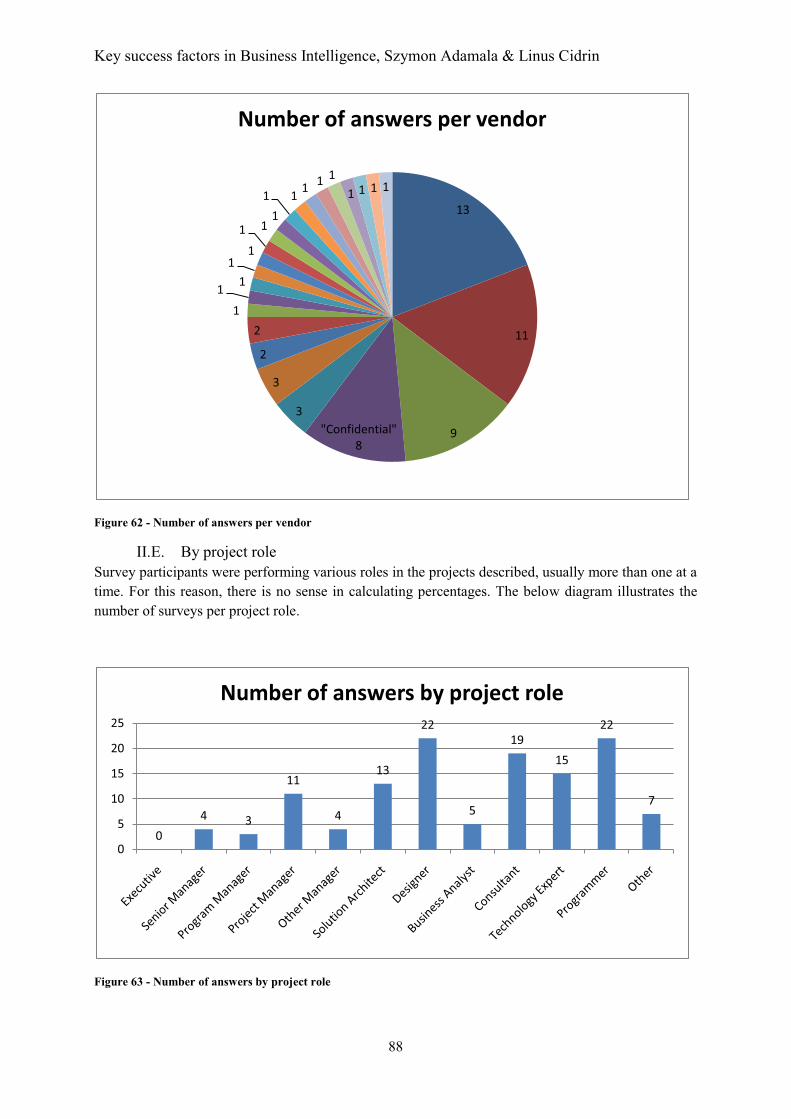
Key success factors in Business Intelligence, Szymon Adamala & Linus Cidrin
88
Figure 62 - Number of answers per vendor
II.E. By project role Survey participants were performing various roles in the projects described, usually more than one at a time. For this reason, there is no sense in calculating percentages. The below diagram illustrates the number of surveys per project role.
Figure 63 - Number of answers by project role
13
11
9"Confidential" 8
3
3
2
21
1 11
11 1
11 1 1 1 1
1 1 1 1
Number of answers per vendor
04 3
11
4
13
22
5
1915
22
7
0
5
10
15
20
25
Number of answers by project role
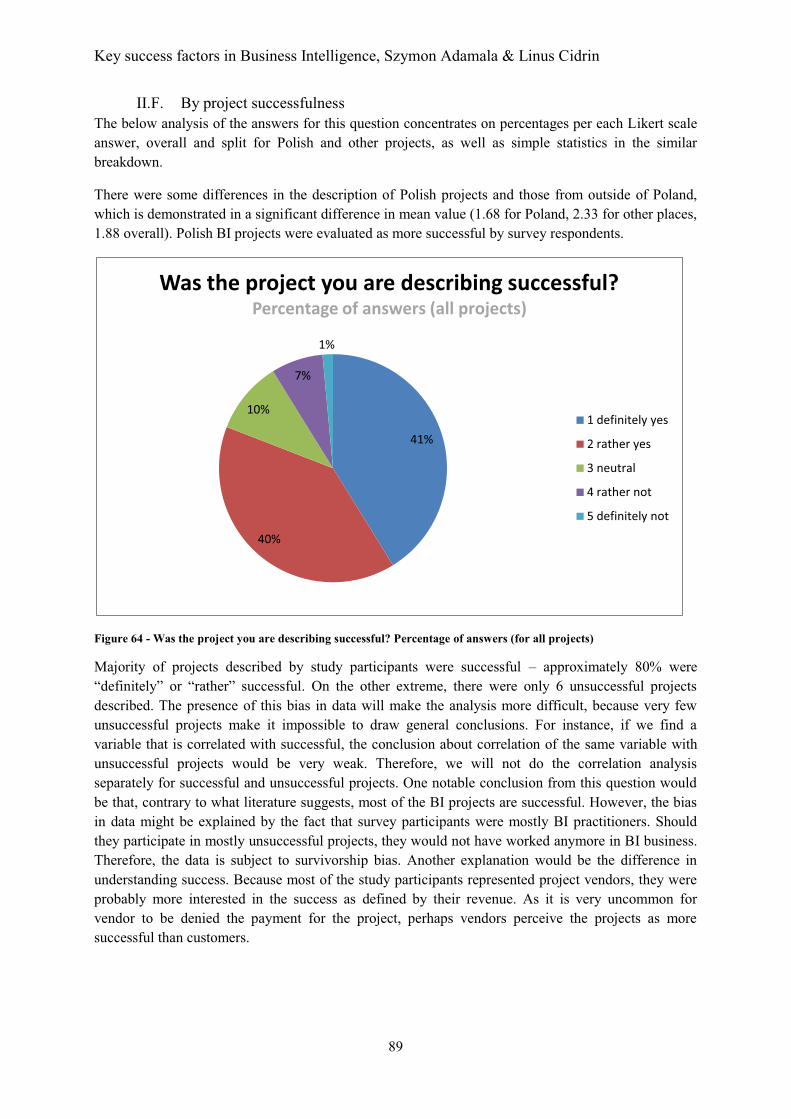
Key success factors in Business Intelligence, Szymon Adamala & Linus Cidrin
89
II.F. By project successfulness The below analysis of the answers for this question concentrates on percentages per each Likert scale answer, overall and split for Polish and other projects, as well as simple statistics in the similar breakdown.
There were some differences in the description of Polish projects and those from outside of Poland, which is demonstrated in a significant difference in mean value (1.68 for Poland, 2.33 for other places, 1.88 overall). Polish BI projects were evaluated as more successful by survey respondents.
Figure 64 - Was the project you are describing successful? Percentage of answers (for all projects)
Majority of projects described by study participants were successful – approximately 80% were “definitely” or “rather” successful. On the other extreme, there were only 6 unsuccessful projects described. The presence of this bias in data will make the analysis more difficult, because very few unsuccessful projects make it impossible to draw general conclusions. For instance, if we find a variable that is correlated with successful, the conclusion about correlation of the same variable with unsuccessful projects would be very weak. Therefore, we will not do the correlation analysis separately for successful and unsuccessful projects. One notable conclusion from this question would be that, contrary to what literature suggests, most of the BI projects are successful. However, the bias in data might be explained by the fact that survey participants were mostly BI practitioners. Should they participate in mostly unsuccessful projects, they would not have worked anymore in BI business. Therefore, the data is subject to survivorship bias. Another explanation would be the difference in understanding success. Because most of the study participants represented project vendors, they were probably more interested in the success as defined by their revenue. As it is very uncommon for vendor to be denied the payment for the project, perhaps vendors perceive the projects as more successful than customers.
41%
40%
10%
7%
1%
Was the project you are describing successful?Percentage of answers (all projects)
1 definitely yes
2 rather yes
3 neutral
4 rather not
5 definitely not
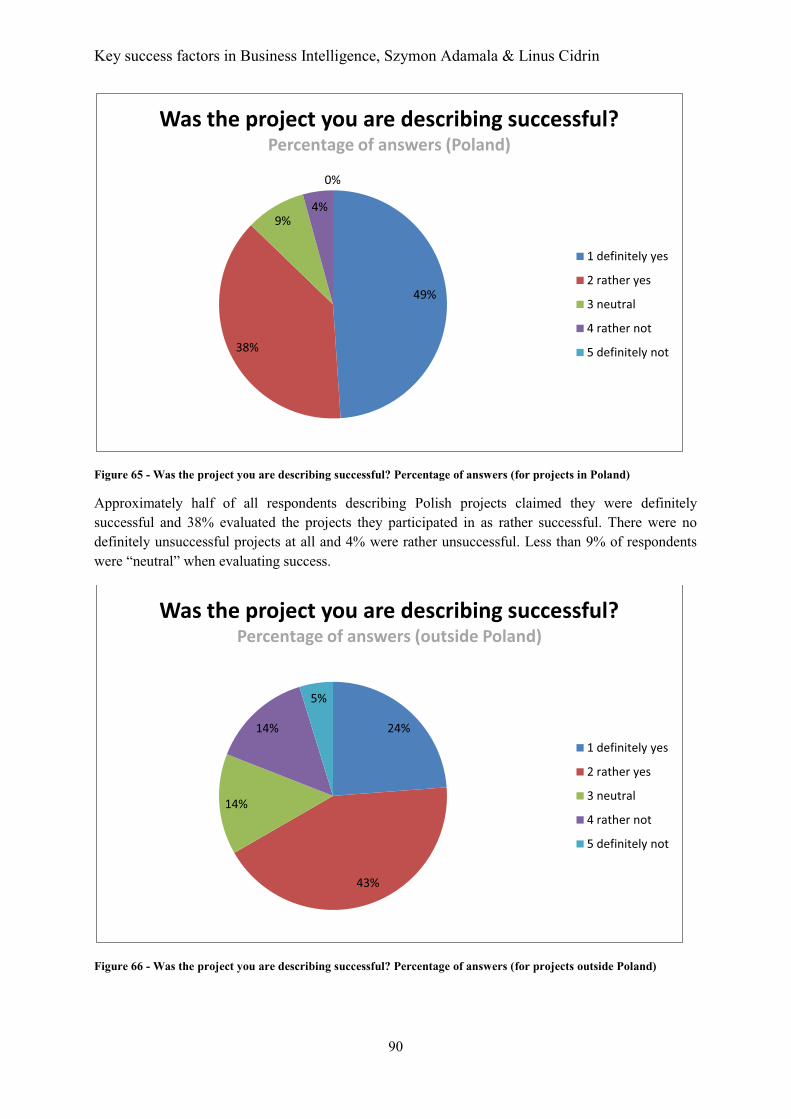
Key success factors in Business Intelligence, Szymon Adamala & Linus Cidrin
90
Figure 65 - Was the project you are describing successful? Percentage of answers (for projects in Poland)
Approximately half of all respondents describing Polish projects claimed they were definitely successful and 38% evaluated the projects they participated in as rather successful. There were no definitely unsuccessful projects at all and 4% were rather unsuccessful. Less than 9% of respondents were “neutral” when evaluating success.
Figure 66 - Was the project you are describing successful? Percentage of answers (for projects outside Poland)
49%
38%
9%4%
0%
Was the project you are describing successful?Percentage of answers (Poland)
1 definitely yes
2 rather yes
3 neutral
4 rather not
5 definitely not
24%
43%
14%
14%
5%
Was the project you are describing successful?Percentage of answers (outside Poland)
1 definitely yes
2 rather yes
3 neutral
4 rather not
5 definitely not

Key success factors in Business Intelligence, Szymon Adamala & Linus Cidrin
91
The most answers evaluated non-Polish projects as rather successful, with 24% definitely successful. 5% of them were definitely unsuccessful while 14% rather unsuccessful. Similar numbers of respondents were “neutral” towards the success of their projects.
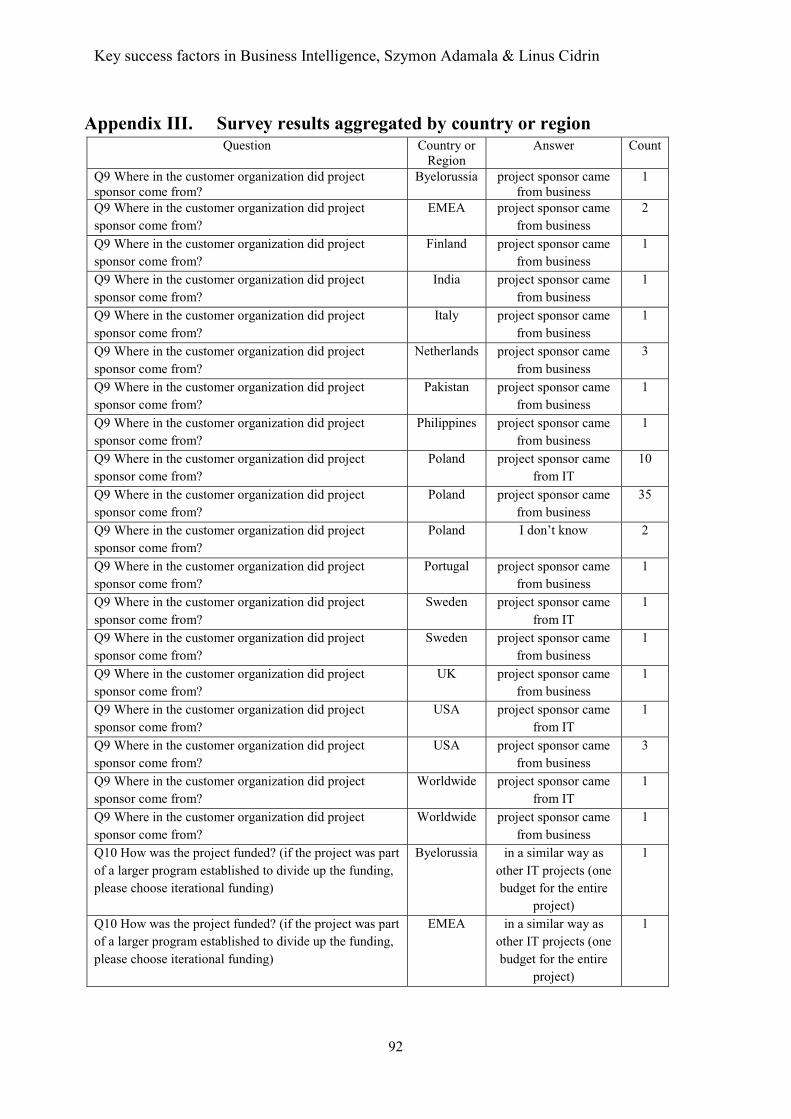
Key success factors in Business Intelligence, Szymon Adamala & Linus Cidrin
92
Appendix III. Survey results aggregated by country or region Question Country or
Region Answer Count
Q9 Where in the customer organization did project sponsor come from?
Byelorussia project sponsor came from business
1
Q9 Where in the customer organization did project sponsor come from?
EMEA project sponsor came from business
2
Q9 Where in the customer organization did project sponsor come from?
Finland project sponsor came from business
1
Q9 Where in the customer organization did project sponsor come from?
India project sponsor came from business
1
Q9 Where in the customer organization did project sponsor come from?
Italy project sponsor came from business
1
Q9 Where in the customer organization did project sponsor come from?
Netherlands project sponsor came from business
3
Q9 Where in the customer organization did project sponsor come from?
Pakistan project sponsor came from business
1
Q9 Where in the customer organization did project sponsor come from?
Philippines project sponsor came from business
1
Q9 Where in the customer organization did project sponsor come from?
Poland project sponsor came from IT
10
Q9 Where in the customer organization did project sponsor come from?
Poland project sponsor came from business
35
Q9 Where in the customer organization did project sponsor come from?
Poland I don’t know 2
Q9 Where in the customer organization did project sponsor come from?
Portugal project sponsor came from business
1
Q9 Where in the customer organization did project sponsor come from?
Sweden project sponsor came from IT
1
Q9 Where in the customer organization did project sponsor come from?
Sweden project sponsor came from business
1
Q9 Where in the customer organization did project sponsor come from?
UK project sponsor came from business
1
Q9 Where in the customer organization did project sponsor come from?
USA project sponsor came from IT
1
Q9 Where in the customer organization did project sponsor come from?
USA project sponsor came from business
3
Q9 Where in the customer organization did project sponsor come from?
Worldwide project sponsor came from IT
1
Q9 Where in the customer organization did project sponsor come from?
Worldwide project sponsor came from business
1
Q10 How was the project funded? (if the project was part of a larger program established to divide up the funding, please choose iterational funding)
Byelorussia in a similar way as other IT projects (one budget for the entire
project)
1
Q10 How was the project funded? (if the project was part of a larger program established to divide up the funding, please choose iterational funding)
EMEA in a similar way as other IT projects (one budget for the entire
project)
1

Key success factors in Business Intelligence, Szymon Adamala & Linus Cidrin
93
Question Country or Region
Answer Count
Q10 How was the project funded? (if the project was part of a larger program established to divide up the funding, please choose iterational funding)
EMEA in an iterational manner (phase or iteration specific
budget)
1
Q10 How was the project funded? (if the project was part of a larger program established to divide up the funding, please choose iterational funding)
Finland I don’t know 1
Q10 How was the project funded? (if the project was part of a larger program established to divide up the funding, please choose iterational funding)
India I don’t know 1
Q10 How was the project funded? (if the project was part of a larger program established to divide up the funding, please choose iterational funding)
Italy in an iterational manner (phase or iteration specific
budget)
1
Q10 How was the project funded? (if the project was part of a larger program established to divide up the funding, please choose iterational funding)
Netherlands in a similar way as other IT projects (one budget for the entire
project)
2
Q10 How was the project funded? (if the project was part of a larger program established to divide up the funding, please choose iterational funding)
Netherlands in an iterational manner (phase or iteration specific
budget)
1
Q10 How was the project funded? (if the project was part of a larger program established to divide up the funding, please choose iterational funding)
Pakistan in an iterational manner (phase or iteration specific
budget)
1
Q10 How was the project funded? (if the project was part of a larger program established to divide up the funding, please choose iterational funding)
Philippines in a similar way as other IT projects (one budget for the entire
project)
1
Q10 How was the project funded? (if the project was part of a larger program established to divide up the funding, please choose iterational funding)
Poland in a similar way as other IT projects (one budget for the entire
project)
29
Q10 How was the project funded? (if the project was part of a larger program established to divide up the funding, please choose iterational funding)
Poland in an iterational manner (phase or iteration specific
budget)
12
Q10 How was the project funded? (if the project was part of a larger program established to divide up the funding, please choose iterational funding)
Poland I don’t know 6
Q10 How was the project funded? (if the project was part of a larger program established to divide up the funding, please choose iterational funding)
Portugal in a similar way as other IT projects (one budget for the entire
project)
1
Q10 How was the project funded? (if the project was part of a larger program established to divide up the funding, please choose iterational funding)
Sweden in a similar way as other IT projects (one budget for the entire
project)
1

Key success factors in Business Intelligence, Szymon Adamala & Linus Cidrin
94
Question Country or Region
Answer Count
Q10 How was the project funded? (if the project was part of a larger program established to divide up the funding, please choose iterational funding)
Sweden in an iterational manner (phase or iteration specific
budget)
1
Q10 How was the project funded? (if the project was part of a larger program established to divide up the funding, please choose iterational funding)
UK in a similar way as other IT projects (one budget for the entire
project)
1
Q10 How was the project funded? (if the project was part of a larger program established to divide up the funding, please choose iterational funding)
USA in a similar way as other IT projects (one budget for the entire
project)
1
Q10 How was the project funded? (if the project was part of a larger program established to divide up the funding, please choose iterational funding)
USA in an iterational manner (phase or iteration specific
budget)
3
Q10 How was the project funded? (if the project was part of a larger program established to divide up the funding, please choose iterational funding)
Worldwide in a similar way as other IT projects (one budget for the entire
project)
2
Q11 Where did the project budget come from? Byelorussia from specific business department budget
1
Q11 Where did the project budget come from? EMEA from specific business department budget
2
Q11 Where did the project budget come from? Finland from specific business department budget
1
Q11 Where did the project budget come from? India from specific business department budget
1
Q11 Where did the project budget come from? Italy from specific business department budget
1
Q11 Where did the project budget come from? Netherlands from senior management directly
2
Q11 Where did the project budget come from? Netherlands from specific business department budget
1
Q11 Where did the project budget come from? Pakistan from senior management directly
1
Q11 Where did the project budget come from? Philippines from senior management directly
1
Q11 Where did the project budget come from? Poland from senior management directly
12
Q11 Where did the project budget come from? Poland from IT department budget
11
Q11 Where did the project budget come from? Poland from specific business department budget
24
Q11 Where did the project budget come from? Portugal from specific business department budget
1
Q11 Where did the project budget come from? Sweden from senior management directly
1
Q11 Where did the project budget come from? Sweden from IT department budget
1
Q11 Where did the project budget come from? UK from senior management directly
1

Key success factors in Business Intelligence, Szymon Adamala & Linus Cidrin
95
Question Country or Region
Answer Count
Q11 Where did the project budget come from? USA from senior management directly
2
Q11 Where did the project budget come from? USA from IT department budget
1
Q11 Where did the project budget come from? USA from specific business department budget
1
Q11 Where did the project budget come from? Worldwide from IT department budget
1
Q11 Where did the project budget come from? Worldwide from specific business department budget
1
Q12 To whom did the management of project report? Byelorussia to specific business department
management
1
Q12 To whom did the management of project report? EMEA to IT department management
2
Q12 To whom did the management of project report? Finland to IT department management
1
Q12 To whom did the management of project report? India to specific business department
management
1
Q12 To whom did the management of project report? Italy to specific business department
management
1
Q12 To whom did the management of project report? Netherlands to senior management directly
1
Q12 To whom did the management of project report? Netherlands to specific business department
management
2
Q12 To whom did the management of project report? Pakistan to senior management directly
1
Q12 To whom did the management of project report? Philippines to senior management directly
1
Q12 To whom did the management of project report? Poland to senior management directly
12
Q12 To whom did the management of project report? Poland to IT department management
12
Q12 To whom did the management of project report? Poland to specific business department
management
22
Q12 To whom did the management of project report? Poland I don’t know 1 Q12 To whom did the management of project report? Portugal to IT department
management 1
Q12 To whom did the management of project report? Sweden to senior management directly
1
Q12 To whom did the management of project report? Sweden to IT department management
1
Q12 To whom did the management of project report? UK to IT department management
1
Q12 To whom did the management of project report? USA to senior management directly
2
Q12 To whom did the management of project report? USA to IT department management
1
Q12 To whom did the management of project report? USA I don’t know 1
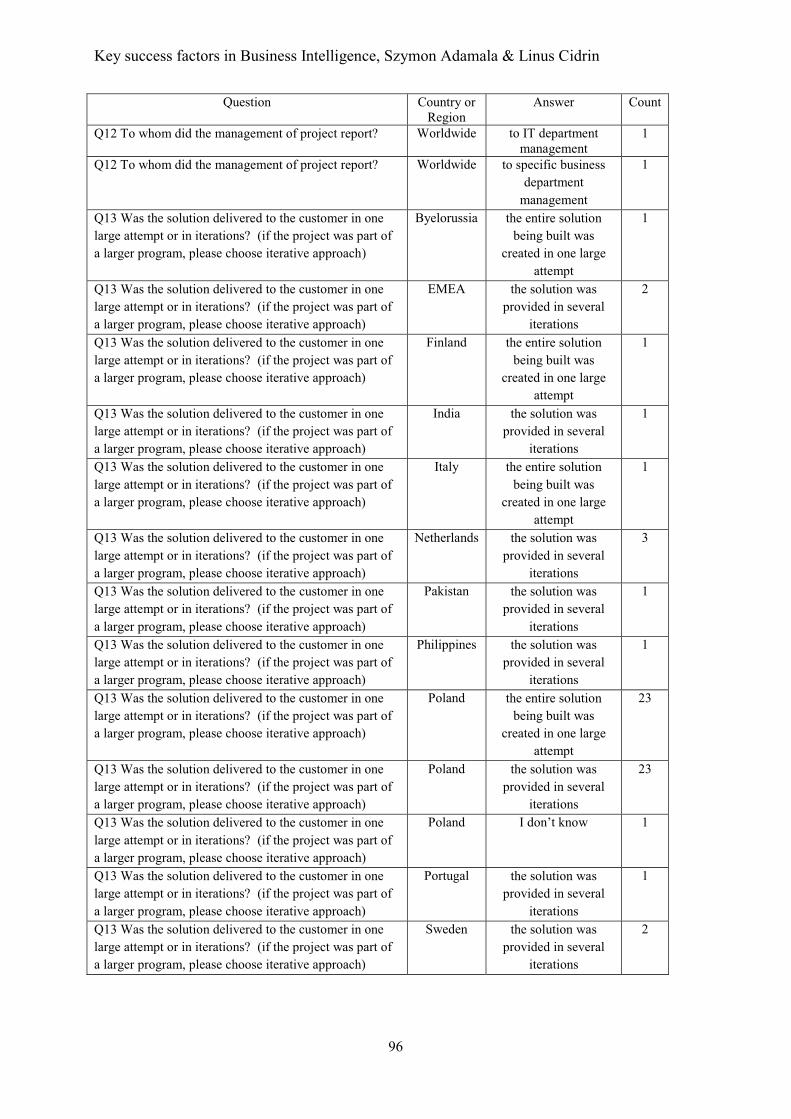
Key success factors in Business Intelligence, Szymon Adamala & Linus Cidrin
96
Question Country or Region
Answer Count
Q12 To whom did the management of project report? Worldwide to IT department management
1
Q12 To whom did the management of project report? Worldwide to specific business department
management
1
Q13 Was the solution delivered to the customer in one large attempt or in iterations? (if the project was part of a larger program, please choose iterative approach)
Byelorussia the entire solution being built was
created in one large attempt
1
Q13 Was the solution delivered to the customer in one large attempt or in iterations? (if the project was part of a larger program, please choose iterative approach)
EMEA the solution was provided in several
iterations
2
Q13 Was the solution delivered to the customer in one large attempt or in iterations? (if the project was part of a larger program, please choose iterative approach)
Finland the entire solution being built was
created in one large attempt
1
Q13 Was the solution delivered to the customer in one large attempt or in iterations? (if the project was part of a larger program, please choose iterative approach)
India the solution was provided in several
iterations
1
Q13 Was the solution delivered to the customer in one large attempt or in iterations? (if the project was part of a larger program, please choose iterative approach)
Italy the entire solution being built was
created in one large attempt
1
Q13 Was the solution delivered to the customer in one large attempt or in iterations? (if the project was part of a larger program, please choose iterative approach)
Netherlands the solution was provided in several
iterations
3
Q13 Was the solution delivered to the customer in one large attempt or in iterations? (if the project was part of a larger program, please choose iterative approach)
Pakistan the solution was provided in several
iterations
1
Q13 Was the solution delivered to the customer in one large attempt or in iterations? (if the project was part of a larger program, please choose iterative approach)
Philippines the solution was provided in several
iterations
1
Q13 Was the solution delivered to the customer in one large attempt or in iterations? (if the project was part of a larger program, please choose iterative approach)
Poland the entire solution being built was
created in one large attempt
23
Q13 Was the solution delivered to the customer in one large attempt or in iterations? (if the project was part of a larger program, please choose iterative approach)
Poland the solution was provided in several
iterations
23
Q13 Was the solution delivered to the customer in one large attempt or in iterations? (if the project was part of a larger program, please choose iterative approach)
Poland I don’t know 1
Q13 Was the solution delivered to the customer in one large attempt or in iterations? (if the project was part of a larger program, please choose iterative approach)
Portugal the solution was provided in several
iterations
1
Q13 Was the solution delivered to the customer in one large attempt or in iterations? (if the project was part of a larger program, please choose iterative approach)
Sweden the solution was provided in several
iterations
2
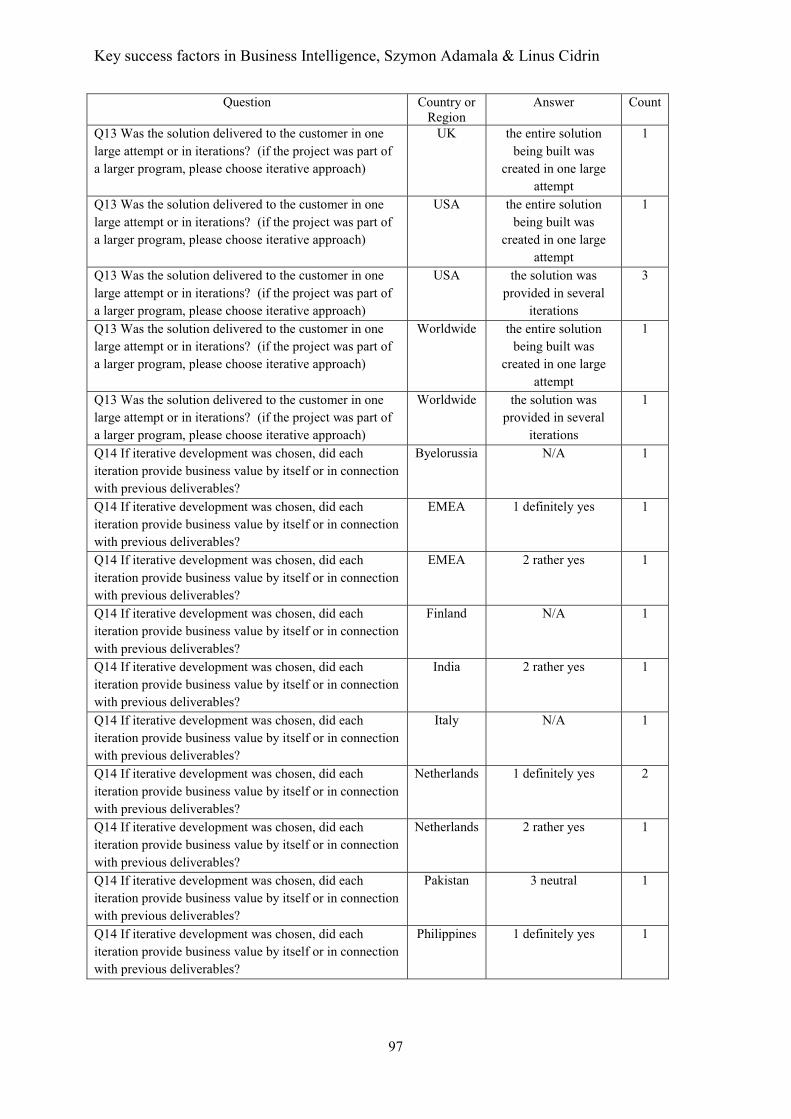
Key success factors in Business Intelligence, Szymon Adamala & Linus Cidrin
97
Question Country or Region
Answer Count
Q13 Was the solution delivered to the customer in one large attempt or in iterations? (if the project was part of a larger program, please choose iterative approach)
UK the entire solution being built was
created in one large attempt
1
Q13 Was the solution delivered to the customer in one large attempt or in iterations? (if the project was part of a larger program, please choose iterative approach)
USA the entire solution being built was
created in one large attempt
1
Q13 Was the solution delivered to the customer in one large attempt or in iterations? (if the project was part of a larger program, please choose iterative approach)
USA the solution was provided in several
iterations
3
Q13 Was the solution delivered to the customer in one large attempt or in iterations? (if the project was part of a larger program, please choose iterative approach)
Worldwide the entire solution being built was
created in one large attempt
1
Q13 Was the solution delivered to the customer in one large attempt or in iterations? (if the project was part of a larger program, please choose iterative approach)
Worldwide the solution was provided in several
iterations
1
Q14 If iterative development was chosen, did each iteration provide business value by itself or in connection with previous deliverables?
Byelorussia N/A 1
Q14 If iterative development was chosen, did each iteration provide business value by itself or in connection with previous deliverables?
EMEA 1 definitely yes 1
Q14 If iterative development was chosen, did each iteration provide business value by itself or in connection with previous deliverables?
EMEA 2 rather yes 1
Q14 If iterative development was chosen, did each iteration provide business value by itself or in connection with previous deliverables?
Finland N/A 1
Q14 If iterative development was chosen, did each iteration provide business value by itself or in connection with previous deliverables?
India 2 rather yes 1
Q14 If iterative development was chosen, did each iteration provide business value by itself or in connection with previous deliverables?
Italy N/A 1
Q14 If iterative development was chosen, did each iteration provide business value by itself or in connection with previous deliverables?
Netherlands 1 definitely yes 2
Q14 If iterative development was chosen, did each iteration provide business value by itself or in connection with previous deliverables?
Netherlands 2 rather yes 1
Q14 If iterative development was chosen, did each iteration provide business value by itself or in connection with previous deliverables?
Pakistan 3 neutral 1
Q14 If iterative development was chosen, did each iteration provide business value by itself or in connection with previous deliverables?
Philippines 1 definitely yes 1

Key success factors in Business Intelligence, Szymon Adamala & Linus Cidrin
98
Question Country or Region
Answer Count
Q14 If iterative development was chosen, did each iteration provide business value by itself or in connection with previous deliverables?
Poland N/A 24
Q14 If iterative development was chosen, did each iteration provide business value by itself or in connection with previous deliverables?
Poland 1 definitely yes 9
Q14 If iterative development was chosen, did each iteration provide business value by itself or in connection with previous deliverables?
Poland 2 rather yes 9
Q14 If iterative development was chosen, did each iteration provide business value by itself or in connection with previous deliverables?
Poland 3 neutral 2
Q14 If iterative development was chosen, did each iteration provide business value by itself or in connection with previous deliverables?
Poland 4 rather not 3
Q14 If iterative development was chosen, did each iteration provide business value by itself or in connection with previous deliverables?
Portugal 2 rather yes 1
Q14 If iterative development was chosen, did each iteration provide business value by itself or in connection with previous deliverables?
Sweden 1 definitely yes 1
Q14 If iterative development was chosen, did each iteration provide business value by itself or in connection with previous deliverables?
Sweden 2 rather yes 1
Q14 If iterative development was chosen, did each iteration provide business value by itself or in connection with previous deliverables?
UK N/A 1
Q14 If iterative development was chosen, did each iteration provide business value by itself or in connection with previous deliverables?
USA N/A 1
Q14 If iterative development was chosen, did each iteration provide business value by itself or in connection with previous deliverables?
USA 1 definitely yes 2
Q14 If iterative development was chosen, did each iteration provide business value by itself or in connection with previous deliverables?
USA 3 neutral 1
Q14 If iterative development was chosen, did each iteration provide business value by itself or in connection with previous deliverables?
Worldwide N/A 1
Q14 If iterative development was chosen, did each iteration provide business value by itself or in connection with previous deliverables?
Worldwide 3 neutral 1
Q15 If iterative development was chosen, each incremental project deliverable was
Byelorussia N/A 1
Q15 If iterative development was chosen, each incremental project deliverable was
EMEA 3 neither small or large
1
Q15 If iterative development was chosen, each incremental project deliverable was
EMEA 4 rather large 1
Q15 If iterative development was chosen, each incremental project deliverable was
Finland N/A 1
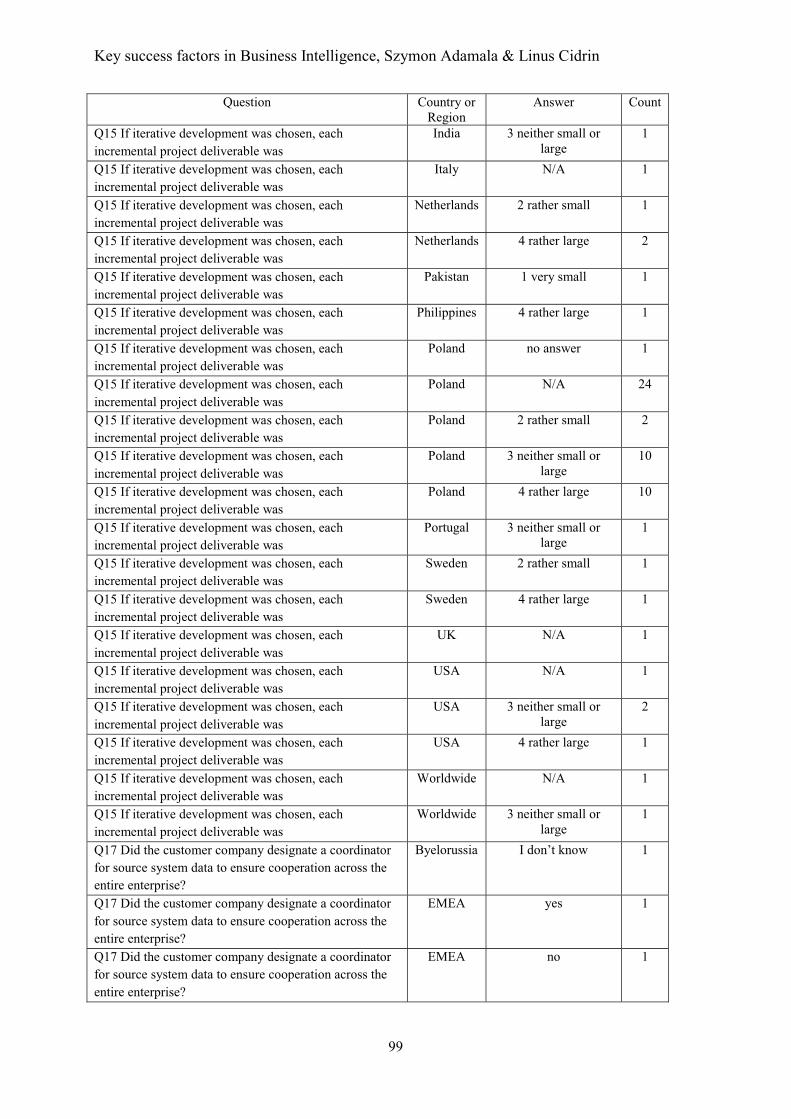
Key success factors in Business Intelligence, Szymon Adamala & Linus Cidrin
99
Question Country or Region
Answer Count
Q15 If iterative development was chosen, each incremental project deliverable was
India 3 neither small or large
1
Q15 If iterative development was chosen, each incremental project deliverable was
Italy N/A 1
Q15 If iterative development was chosen, each incremental project deliverable was
Netherlands 2 rather small 1
Q15 If iterative development was chosen, each incremental project deliverable was
Netherlands 4 rather large 2
Q15 If iterative development was chosen, each incremental project deliverable was
Pakistan 1 very small 1
Q15 If iterative development was chosen, each incremental project deliverable was
Philippines 4 rather large 1
Q15 If iterative development was chosen, each incremental project deliverable was
Poland no answer 1
Q15 If iterative development was chosen, each incremental project deliverable was
Poland N/A 24
Q15 If iterative development was chosen, each incremental project deliverable was
Poland 2 rather small 2
Q15 If iterative development was chosen, each incremental project deliverable was
Poland 3 neither small or large
10
Q15 If iterative development was chosen, each incremental project deliverable was
Poland 4 rather large 10
Q15 If iterative development was chosen, each incremental project deliverable was
Portugal 3 neither small or large
1
Q15 If iterative development was chosen, each incremental project deliverable was
Sweden 2 rather small 1
Q15 If iterative development was chosen, each incremental project deliverable was
Sweden 4 rather large 1
Q15 If iterative development was chosen, each incremental project deliverable was
UK N/A 1
Q15 If iterative development was chosen, each incremental project deliverable was
USA N/A 1
Q15 If iterative development was chosen, each incremental project deliverable was
USA 3 neither small or large
2
Q15 If iterative development was chosen, each incremental project deliverable was
USA 4 rather large 1
Q15 If iterative development was chosen, each incremental project deliverable was
Worldwide N/A 1
Q15 If iterative development was chosen, each incremental project deliverable was
Worldwide 3 neither small or large
1
Q17 Did the customer company designate a coordinator for source system data to ensure cooperation across the entire enterprise?
Byelorussia I don’t know 1
Q17 Did the customer company designate a coordinator for source system data to ensure cooperation across the entire enterprise?
EMEA yes 1
Q17 Did the customer company designate a coordinator for source system data to ensure cooperation across the entire enterprise?
EMEA no 1
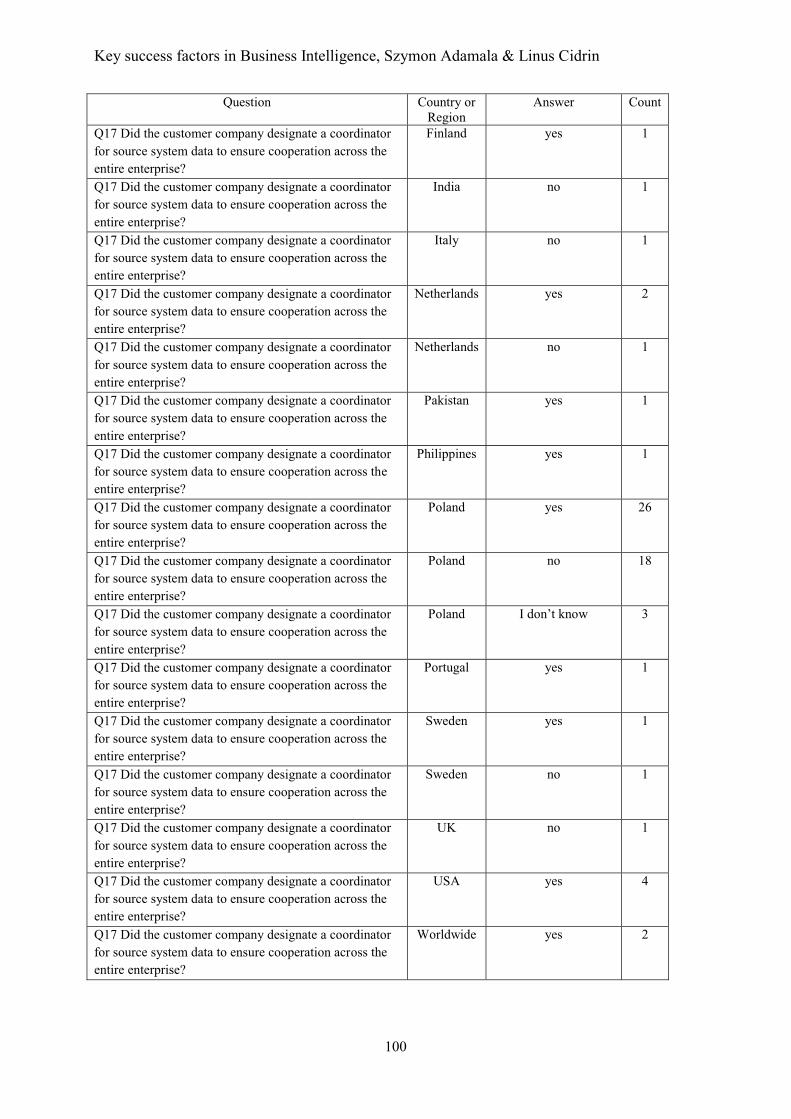
Key success factors in Business Intelligence, Szymon Adamala & Linus Cidrin
100
Question Country or Region
Answer Count
Q17 Did the customer company designate a coordinator for source system data to ensure cooperation across the entire enterprise?
Finland yes 1
Q17 Did the customer company designate a coordinator for source system data to ensure cooperation across the entire enterprise?
India no 1
Q17 Did the customer company designate a coordinator for source system data to ensure cooperation across the entire enterprise?
Italy no 1
Q17 Did the customer company designate a coordinator for source system data to ensure cooperation across the entire enterprise?
Netherlands yes 2
Q17 Did the customer company designate a coordinator for source system data to ensure cooperation across the entire enterprise?
Netherlands no 1
Q17 Did the customer company designate a coordinator for source system data to ensure cooperation across the entire enterprise?
Pakistan yes 1
Q17 Did the customer company designate a coordinator for source system data to ensure cooperation across the entire enterprise?
Philippines yes 1
Q17 Did the customer company designate a coordinator for source system data to ensure cooperation across the entire enterprise?
Poland yes 26
Q17 Did the customer company designate a coordinator for source system data to ensure cooperation across the entire enterprise?
Poland no 18
Q17 Did the customer company designate a coordinator for source system data to ensure cooperation across the entire enterprise?
Poland I don’t know 3
Q17 Did the customer company designate a coordinator for source system data to ensure cooperation across the entire enterprise?
Portugal yes 1
Q17 Did the customer company designate a coordinator for source system data to ensure cooperation across the entire enterprise?
Sweden yes 1
Q17 Did the customer company designate a coordinator for source system data to ensure cooperation across the entire enterprise?
Sweden no 1
Q17 Did the customer company designate a coordinator for source system data to ensure cooperation across the entire enterprise?
UK no 1
Q17 Did the customer company designate a coordinator for source system data to ensure cooperation across the entire enterprise?
USA yes 4
Q17 Did the customer company designate a coordinator for source system data to ensure cooperation across the entire enterprise?
Worldwide yes 2
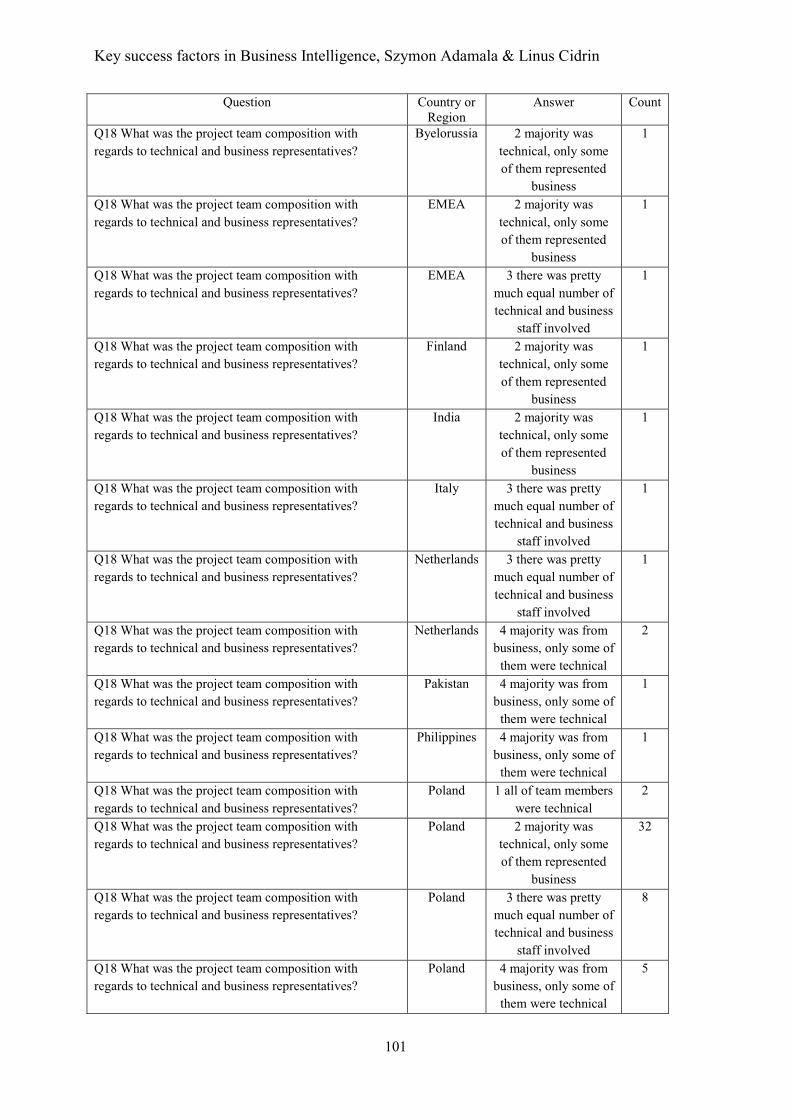
Key success factors in Business Intelligence, Szymon Adamala & Linus Cidrin
101
Question Country or Region
Answer Count
Q18 What was the project team composition with regards to technical and business representatives?
Byelorussia 2 majority was technical, only some of them represented
business
1
Q18 What was the project team composition with regards to technical and business representatives?
EMEA 2 majority was technical, only some of them represented
business
1
Q18 What was the project team composition with regards to technical and business representatives?
EMEA 3 there was pretty much equal number of technical and business
staff involved
1
Q18 What was the project team composition with regards to technical and business representatives?
Finland 2 majority was technical, only some of them represented
business
1
Q18 What was the project team composition with regards to technical and business representatives?
India 2 majority was technical, only some of them represented
business
1
Q18 What was the project team composition with regards to technical and business representatives?
Italy 3 there was pretty much equal number of technical and business
staff involved
1
Q18 What was the project team composition with regards to technical and business representatives?
Netherlands 3 there was pretty much equal number of technical and business
staff involved
1
Q18 What was the project team composition with regards to technical and business representatives?
Netherlands 4 majority was from business, only some of
them were technical
2
Q18 What was the project team composition with regards to technical and business representatives?
Pakistan 4 majority was from business, only some of
them were technical
1
Q18 What was the project team composition with regards to technical and business representatives?
Philippines 4 majority was from business, only some of
them were technical
1
Q18 What was the project team composition with regards to technical and business representatives?
Poland 1 all of team members were technical
2
Q18 What was the project team composition with regards to technical and business representatives?
Poland 2 majority was technical, only some of them represented
business
32
Q18 What was the project team composition with regards to technical and business representatives?
Poland 3 there was pretty much equal number of technical and business
staff involved
8
Q18 What was the project team composition with regards to technical and business representatives?
Poland 4 majority was from business, only some of
them were technical
5
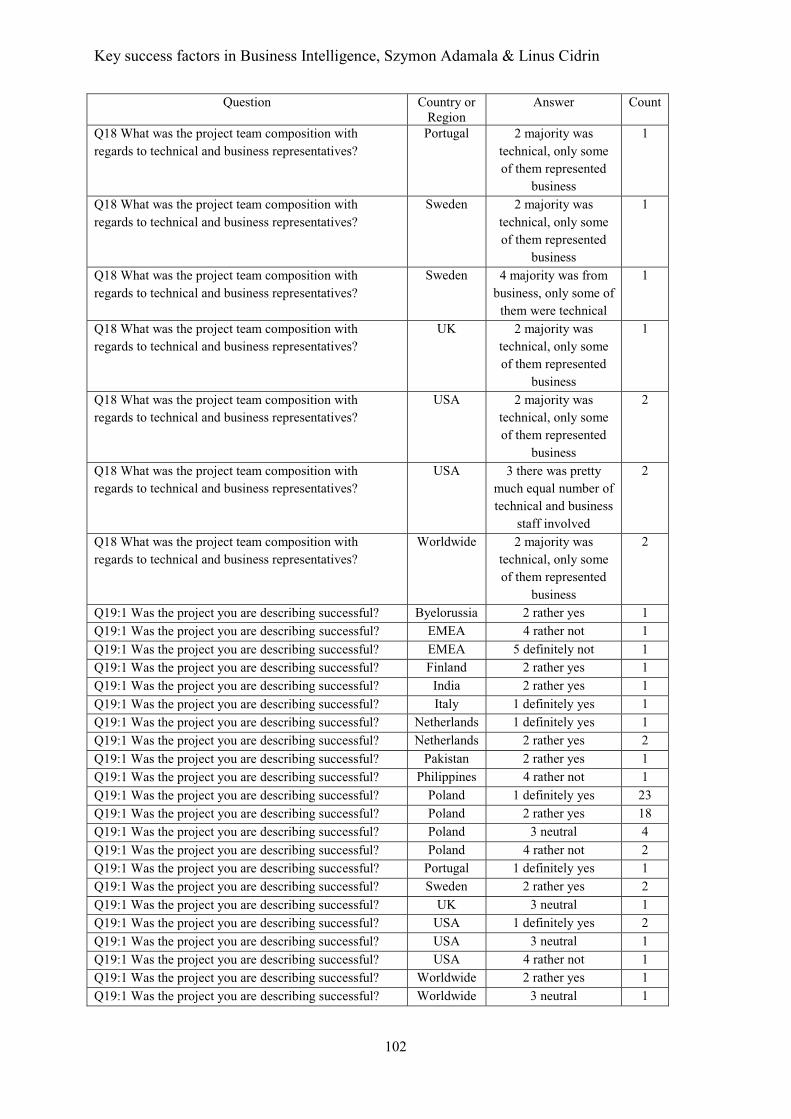
Key success factors in Business Intelligence, Szymon Adamala & Linus Cidrin
102
Question Country or Region
Answer Count
Q18 What was the project team composition with regards to technical and business representatives?
Portugal 2 majority was technical, only some of them represented
business
1
Q18 What was the project team composition with regards to technical and business representatives?
Sweden 2 majority was technical, only some of them represented
business
1
Q18 What was the project team composition with regards to technical and business representatives?
Sweden 4 majority was from business, only some of
them were technical
1
Q18 What was the project team composition with regards to technical and business representatives?
UK 2 majority was technical, only some of them represented
business
1
Q18 What was the project team composition with regards to technical and business representatives?
USA 2 majority was technical, only some of them represented
business
2
Q18 What was the project team composition with regards to technical and business representatives?
USA 3 there was pretty much equal number of technical and business
staff involved
2
Q18 What was the project team composition with regards to technical and business representatives?
Worldwide 2 majority was technical, only some of them represented
business
2
Q19:1 Was the project you are describing successful? Byelorussia 2 rather yes 1 Q19:1 Was the project you are describing successful? EMEA 4 rather not 1 Q19:1 Was the project you are describing successful? EMEA 5 definitely not 1 Q19:1 Was the project you are describing successful? Finland 2 rather yes 1 Q19:1 Was the project you are describing successful? India 2 rather yes 1 Q19:1 Was the project you are describing successful? Italy 1 definitely yes 1 Q19:1 Was the project you are describing successful? Netherlands 1 definitely yes 1 Q19:1 Was the project you are describing successful? Netherlands 2 rather yes 2 Q19:1 Was the project you are describing successful? Pakistan 2 rather yes 1 Q19:1 Was the project you are describing successful? Philippines 4 rather not 1 Q19:1 Was the project you are describing successful? Poland 1 definitely yes 23 Q19:1 Was the project you are describing successful? Poland 2 rather yes 18 Q19:1 Was the project you are describing successful? Poland 3 neutral 4 Q19:1 Was the project you are describing successful? Poland 4 rather not 2 Q19:1 Was the project you are describing successful? Portugal 1 definitely yes 1 Q19:1 Was the project you are describing successful? Sweden 2 rather yes 2 Q19:1 Was the project you are describing successful? UK 3 neutral 1 Q19:1 Was the project you are describing successful? USA 1 definitely yes 2 Q19:1 Was the project you are describing successful? USA 3 neutral 1 Q19:1 Was the project you are describing successful? USA 4 rather not 1 Q19:1 Was the project you are describing successful? Worldwide 2 rather yes 1 Q19:1 Was the project you are describing successful? Worldwide 3 neutral 1
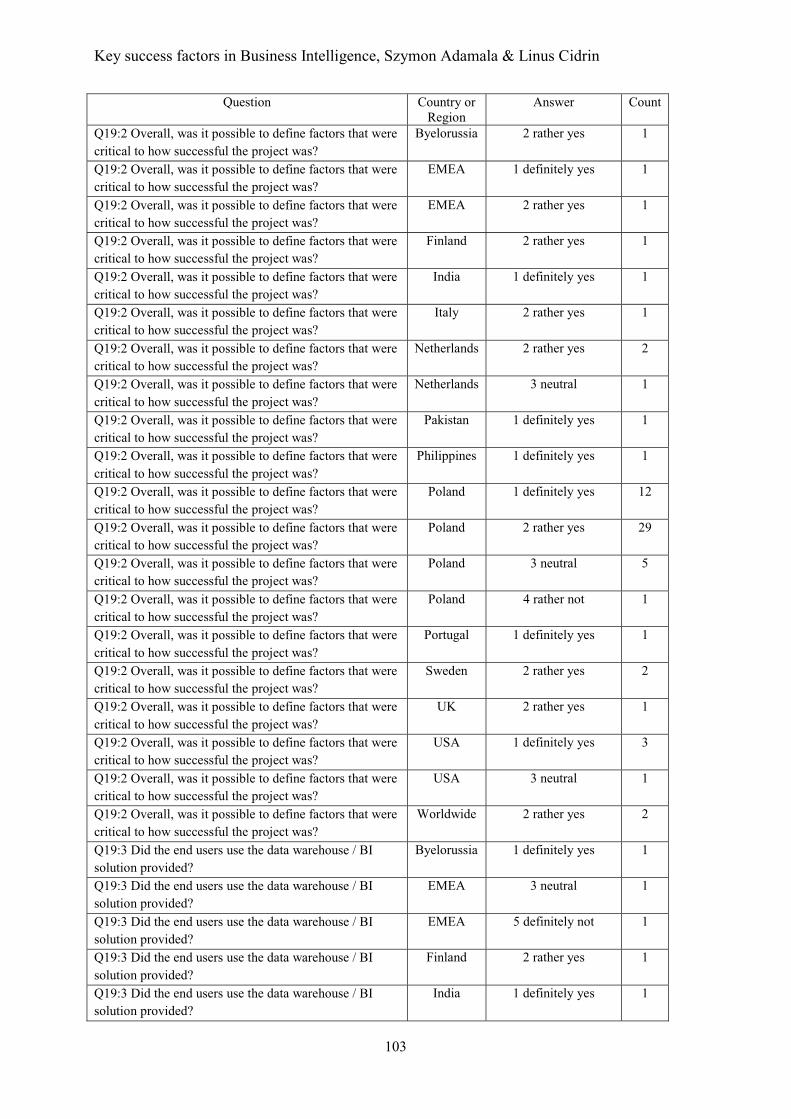
Key success factors in Business Intelligence, Szymon Adamala & Linus Cidrin
103
Question Country or Region
Answer Count
Q19:2 Overall, was it possible to define factors that were critical to how successful the project was?
Byelorussia 2 rather yes 1
Q19:2 Overall, was it possible to define factors that were critical to how successful the project was?
EMEA 1 definitely yes 1
Q19:2 Overall, was it possible to define factors that were critical to how successful the project was?
EMEA 2 rather yes 1
Q19:2 Overall, was it possible to define factors that were critical to how successful the project was?
Finland 2 rather yes 1
Q19:2 Overall, was it possible to define factors that were critical to how successful the project was?
India 1 definitely yes 1
Q19:2 Overall, was it possible to define factors that were critical to how successful the project was?
Italy 2 rather yes 1
Q19:2 Overall, was it possible to define factors that were critical to how successful the project was?
Netherlands 2 rather yes 2
Q19:2 Overall, was it possible to define factors that were critical to how successful the project was?
Netherlands 3 neutral 1
Q19:2 Overall, was it possible to define factors that were critical to how successful the project was?
Pakistan 1 definitely yes 1
Q19:2 Overall, was it possible to define factors that were critical to how successful the project was?
Philippines 1 definitely yes 1
Q19:2 Overall, was it possible to define factors that were critical to how successful the project was?
Poland 1 definitely yes 12
Q19:2 Overall, was it possible to define factors that were critical to how successful the project was?
Poland 2 rather yes 29
Q19:2 Overall, was it possible to define factors that were critical to how successful the project was?
Poland 3 neutral 5
Q19:2 Overall, was it possible to define factors that were critical to how successful the project was?
Poland 4 rather not 1
Q19:2 Overall, was it possible to define factors that were critical to how successful the project was?
Portugal 1 definitely yes 1
Q19:2 Overall, was it possible to define factors that were critical to how successful the project was?
Sweden 2 rather yes 2
Q19:2 Overall, was it possible to define factors that were critical to how successful the project was?
UK 2 rather yes 1
Q19:2 Overall, was it possible to define factors that were critical to how successful the project was?
USA 1 definitely yes 3
Q19:2 Overall, was it possible to define factors that were critical to how successful the project was?
USA 3 neutral 1
Q19:2 Overall, was it possible to define factors that were critical to how successful the project was?
Worldwide 2 rather yes 2
Q19:3 Did the end users use the data warehouse / BI solution provided?
Byelorussia 1 definitely yes 1
Q19:3 Did the end users use the data warehouse / BI solution provided?
EMEA 3 neutral 1
Q19:3 Did the end users use the data warehouse / BI solution provided?
EMEA 5 definitely not 1
Q19:3 Did the end users use the data warehouse / BI solution provided?
Finland 2 rather yes 1
Q19:3 Did the end users use the data warehouse / BI solution provided?
India 1 definitely yes 1
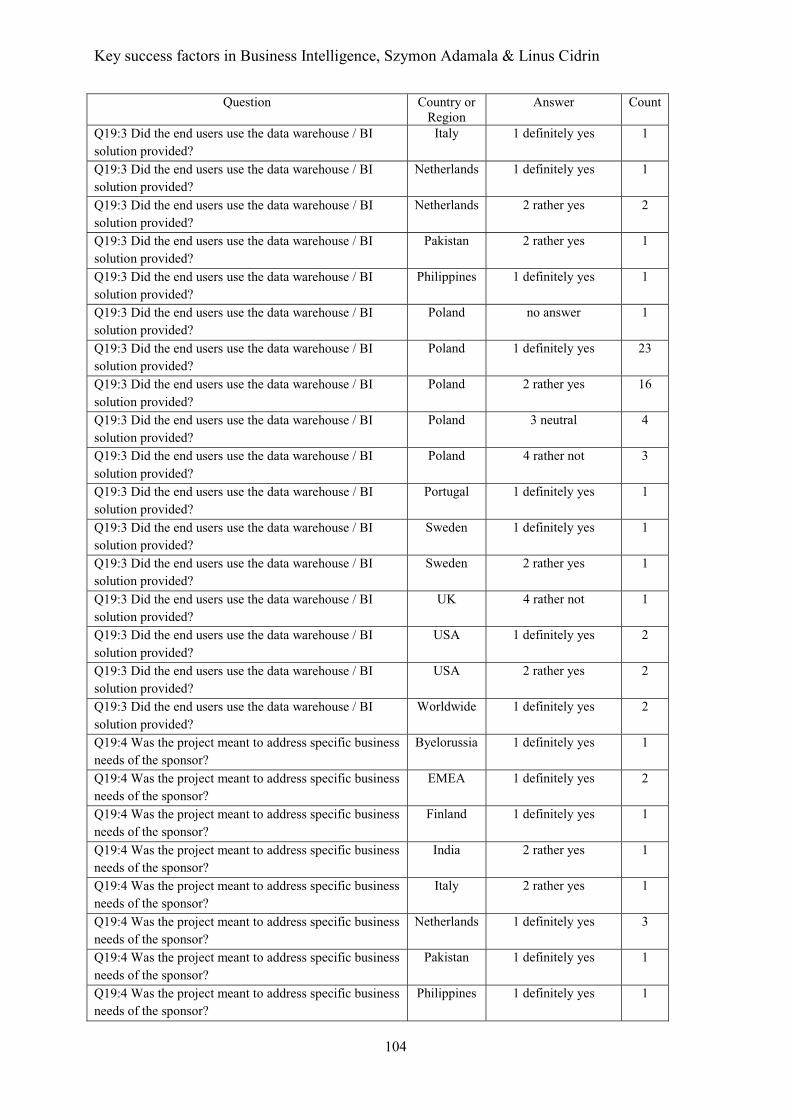
Key success factors in Business Intelligence, Szymon Adamala & Linus Cidrin
104
Question Country or Region
Answer Count
Q19:3 Did the end users use the data warehouse / BI solution provided?
Italy 1 definitely yes 1
Q19:3 Did the end users use the data warehouse / BI solution provided?
Netherlands 1 definitely yes 1
Q19:3 Did the end users use the data warehouse / BI solution provided?
Netherlands 2 rather yes 2
Q19:3 Did the end users use the data warehouse / BI solution provided?
Pakistan 2 rather yes 1
Q19:3 Did the end users use the data warehouse / BI solution provided?
Philippines 1 definitely yes 1
Q19:3 Did the end users use the data warehouse / BI solution provided?
Poland no answer 1
Q19:3 Did the end users use the data warehouse / BI solution provided?
Poland 1 definitely yes 23
Q19:3 Did the end users use the data warehouse / BI solution provided?
Poland 2 rather yes 16
Q19:3 Did the end users use the data warehouse / BI solution provided?
Poland 3 neutral 4
Q19:3 Did the end users use the data warehouse / BI solution provided?
Poland 4 rather not 3
Q19:3 Did the end users use the data warehouse / BI solution provided?
Portugal 1 definitely yes 1
Q19:3 Did the end users use the data warehouse / BI solution provided?
Sweden 1 definitely yes 1
Q19:3 Did the end users use the data warehouse / BI solution provided?
Sweden 2 rather yes 1
Q19:3 Did the end users use the data warehouse / BI solution provided?
UK 4 rather not 1
Q19:3 Did the end users use the data warehouse / BI solution provided?
USA 1 definitely yes 2
Q19:3 Did the end users use the data warehouse / BI solution provided?
USA 2 rather yes 2
Q19:3 Did the end users use the data warehouse / BI solution provided?
Worldwide 1 definitely yes 2
Q19:4 Was the project meant to address specific business needs of the sponsor?
Byelorussia 1 definitely yes 1
Q19:4 Was the project meant to address specific business needs of the sponsor?
EMEA 1 definitely yes 2
Q19:4 Was the project meant to address specific business needs of the sponsor?
Finland 1 definitely yes 1
Q19:4 Was the project meant to address specific business needs of the sponsor?
India 2 rather yes 1
Q19:4 Was the project meant to address specific business needs of the sponsor?
Italy 2 rather yes 1
Q19:4 Was the project meant to address specific business needs of the sponsor?
Netherlands 1 definitely yes 3
Q19:4 Was the project meant to address specific business needs of the sponsor?
Pakistan 1 definitely yes 1
Q19:4 Was the project meant to address specific business needs of the sponsor?
Philippines 1 definitely yes 1
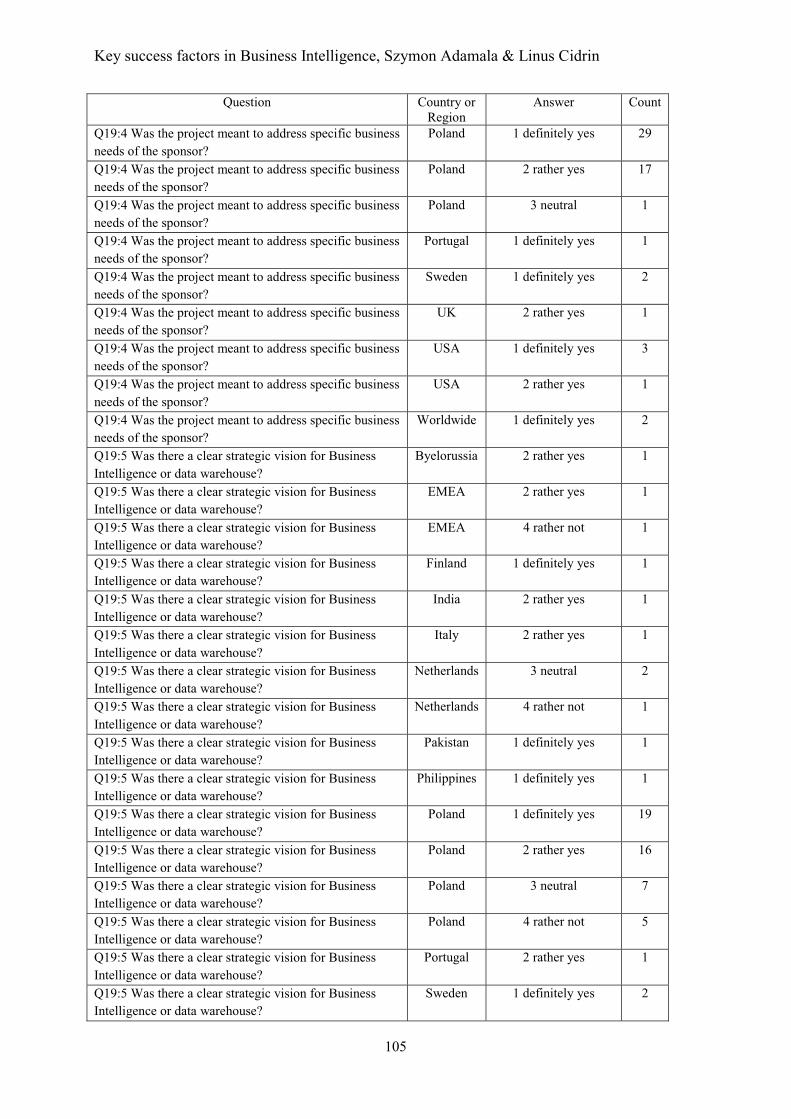
Key success factors in Business Intelligence, Szymon Adamala & Linus Cidrin
105
Question Country or Region
Answer Count
Q19:4 Was the project meant to address specific business needs of the sponsor?
Poland 1 definitely yes 29
Q19:4 Was the project meant to address specific business needs of the sponsor?
Poland 2 rather yes 17
Q19:4 Was the project meant to address specific business needs of the sponsor?
Poland 3 neutral 1
Q19:4 Was the project meant to address specific business needs of the sponsor?
Portugal 1 definitely yes 1
Q19:4 Was the project meant to address specific business needs of the sponsor?
Sweden 1 definitely yes 2
Q19:4 Was the project meant to address specific business needs of the sponsor?
UK 2 rather yes 1
Q19:4 Was the project meant to address specific business needs of the sponsor?
USA 1 definitely yes 3
Q19:4 Was the project meant to address specific business needs of the sponsor?
USA 2 rather yes 1
Q19:4 Was the project meant to address specific business needs of the sponsor?
Worldwide 1 definitely yes 2
Q19:5 Was there a clear strategic vision for Business Intelligence or data warehouse?
Byelorussia 2 rather yes 1
Q19:5 Was there a clear strategic vision for Business Intelligence or data warehouse?
EMEA 2 rather yes 1
Q19:5 Was there a clear strategic vision for Business Intelligence or data warehouse?
EMEA 4 rather not 1
Q19:5 Was there a clear strategic vision for Business Intelligence or data warehouse?
Finland 1 definitely yes 1
Q19:5 Was there a clear strategic vision for Business Intelligence or data warehouse?
India 2 rather yes 1
Q19:5 Was there a clear strategic vision for Business Intelligence or data warehouse?
Italy 2 rather yes 1
Q19:5 Was there a clear strategic vision for Business Intelligence or data warehouse?
Netherlands 3 neutral 2
Q19:5 Was there a clear strategic vision for Business Intelligence or data warehouse?
Netherlands 4 rather not 1
Q19:5 Was there a clear strategic vision for Business Intelligence or data warehouse?
Pakistan 1 definitely yes 1
Q19:5 Was there a clear strategic vision for Business Intelligence or data warehouse?
Philippines 1 definitely yes 1
Q19:5 Was there a clear strategic vision for Business Intelligence or data warehouse?
Poland 1 definitely yes 19
Q19:5 Was there a clear strategic vision for Business Intelligence or data warehouse?
Poland 2 rather yes 16
Q19:5 Was there a clear strategic vision for Business Intelligence or data warehouse?
Poland 3 neutral 7
Q19:5 Was there a clear strategic vision for Business Intelligence or data warehouse?
Poland 4 rather not 5
Q19:5 Was there a clear strategic vision for Business Intelligence or data warehouse?
Portugal 2 rather yes 1
Q19:5 Was there a clear strategic vision for Business Intelligence or data warehouse?
Sweden 1 definitely yes 2

Key success factors in Business Intelligence, Szymon Adamala & Linus Cidrin
106
Question Country or Region
Answer Count
Q19:5 Was there a clear strategic vision for Business Intelligence or data warehouse?
UK 4 rather not 1
Q19:5 Was there a clear strategic vision for Business Intelligence or data warehouse?
USA 1 definitely yes 2
Q19:5 Was there a clear strategic vision for Business Intelligence or data warehouse?
USA 2 rather yes 1
Q19:5 Was there a clear strategic vision for Business Intelligence or data warehouse?
USA 3 neutral 1
Q19:5 Was there a clear strategic vision for Business Intelligence or data warehouse?
Worldwide 2 rather yes 2
Q19:6 Were the business needs that project tried to solve aligned to the abovementioned strategic vision?
Byelorussia 2 rather yes 1
Q19:6 Were the business needs that project tried to solve aligned to the abovementioned strategic vision?
EMEA 2 rather yes 1
Q19:6 Were the business needs that project tried to solve aligned to the abovementioned strategic vision?
EMEA 5 definitely not 1
Q19:6 Were the business needs that project tried to solve aligned to the abovementioned strategic vision?
Finland 2 rather yes 1
Q19:6 Were the business needs that project tried to solve aligned to the abovementioned strategic vision?
India 2 rather yes 1
Q19:6 Were the business needs that project tried to solve aligned to the abovementioned strategic vision?
Italy 2 rather yes 1
Q19:6 Were the business needs that project tried to solve aligned to the abovementioned strategic vision?
Netherlands 3 neutral 3
Q19:6 Were the business needs that project tried to solve aligned to the abovementioned strategic vision?
Pakistan 3 neutral 1
Q19:6 Were the business needs that project tried to solve aligned to the abovementioned strategic vision?
Philippines 2 rather yes 1
Q19:6 Were the business needs that project tried to solve aligned to the abovementioned strategic vision?
Poland 1 definitely yes 12
Q19:6 Were the business needs that project tried to solve aligned to the abovementioned strategic vision?
Poland 2 rather yes 20
Q19:6 Were the business needs that project tried to solve aligned to the abovementioned strategic vision?
Poland 3 neutral 12
Q19:6 Were the business needs that project tried to solve aligned to the abovementioned strategic vision?
Poland 4 rather not 3
Q19:6 Were the business needs that project tried to solve aligned to the abovementioned strategic vision?
Portugal 2 rather yes 1
Q19:6 Were the business needs that project tried to solve aligned to the abovementioned strategic vision?
Sweden 2 rather yes 2
Q19:6 Were the business needs that project tried to solve aligned to the abovementioned strategic vision?
UK 4 rather not 1
Q19:6 Were the business needs that project tried to solve aligned to the abovementioned strategic vision?
USA 1 definitely yes 3
Q19:6 Were the business needs that project tried to solve aligned to the abovementioned strategic vision?
USA 4 rather not 1
Q19:6 Were the business needs that project tried to solve aligned to the abovementioned strategic vision?
Worldwide 1 definitely yes 1
Q19:6 Were the business needs that project tried to solve aligned to the abovementioned strategic vision?
Worldwide 3 neutral 1
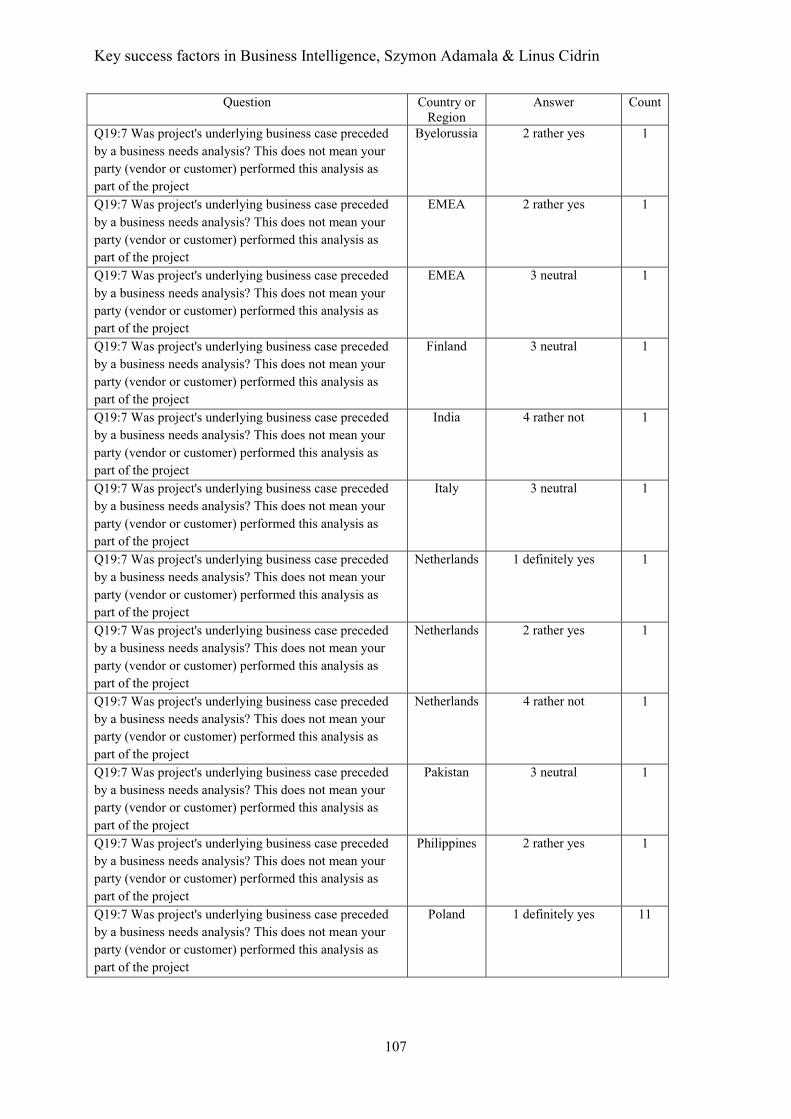
Key success factors in Business Intelligence, Szymon Adamala & Linus Cidrin
107
Question Country or Region
Answer Count
Q19:7 Was project's underlying business case preceded by a business needs analysis? This does not mean your party (vendor or customer) performed this analysis as part of the project
Byelorussia 2 rather yes 1
Q19:7 Was project's underlying business case preceded by a business needs analysis? This does not mean your party (vendor or customer) performed this analysis as part of the project
EMEA 2 rather yes 1
Q19:7 Was project's underlying business case preceded by a business needs analysis? This does not mean your party (vendor or customer) performed this analysis as part of the project
EMEA 3 neutral 1
Q19:7 Was project's underlying business case preceded by a business needs analysis? This does not mean your party (vendor or customer) performed this analysis as part of the project
Finland 3 neutral 1
Q19:7 Was project's underlying business case preceded by a business needs analysis? This does not mean your party (vendor or customer) performed this analysis as part of the project
India 4 rather not 1
Q19:7 Was project's underlying business case preceded by a business needs analysis? This does not mean your party (vendor or customer) performed this analysis as part of the project
Italy 3 neutral 1
Q19:7 Was project's underlying business case preceded by a business needs analysis? This does not mean your party (vendor or customer) performed this analysis as part of the project
Netherlands 1 definitely yes 1
Q19:7 Was project's underlying business case preceded by a business needs analysis? This does not mean your party (vendor or customer) performed this analysis as part of the project
Netherlands 2 rather yes 1
Q19:7 Was project's underlying business case preceded by a business needs analysis? This does not mean your party (vendor or customer) performed this analysis as part of the project
Netherlands 4 rather not 1
Q19:7 Was project's underlying business case preceded by a business needs analysis? This does not mean your party (vendor or customer) performed this analysis as part of the project
Pakistan 3 neutral 1
Q19:7 Was project's underlying business case preceded by a business needs analysis? This does not mean your party (vendor or customer) performed this analysis as part of the project
Philippines 2 rather yes 1
Q19:7 Was project's underlying business case preceded by a business needs analysis? This does not mean your party (vendor or customer) performed this analysis as part of the project
Poland 1 definitely yes 11
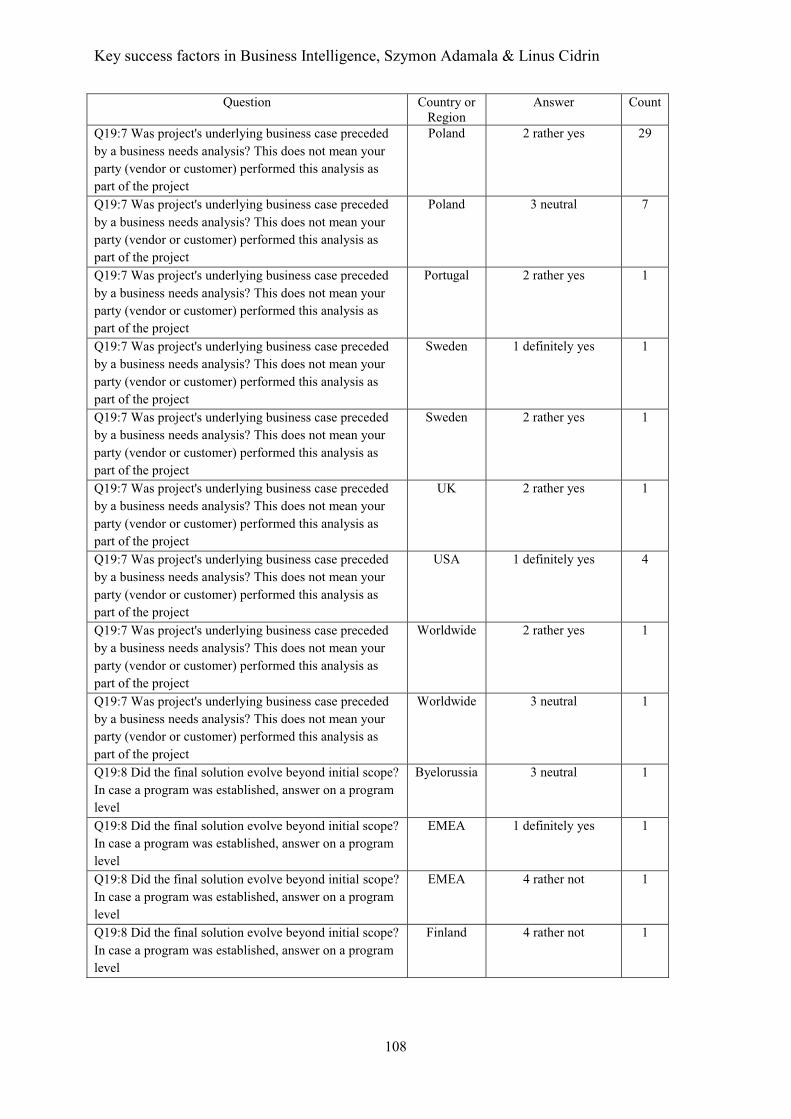
Key success factors in Business Intelligence, Szymon Adamala & Linus Cidrin
108
Question Country or Region
Answer Count
Q19:7 Was project's underlying business case preceded by a business needs analysis? This does not mean your party (vendor or customer) performed this analysis as part of the project
Poland 2 rather yes 29
Q19:7 Was project's underlying business case preceded by a business needs analysis? This does not mean your party (vendor or customer) performed this analysis as part of the project
Poland 3 neutral 7
Q19:7 Was project's underlying business case preceded by a business needs analysis? This does not mean your party (vendor or customer) performed this analysis as part of the project
Portugal 2 rather yes 1
Q19:7 Was project's underlying business case preceded by a business needs analysis? This does not mean your party (vendor or customer) performed this analysis as part of the project
Sweden 1 definitely yes 1
Q19:7 Was project's underlying business case preceded by a business needs analysis? This does not mean your party (vendor or customer) performed this analysis as part of the project
Sweden 2 rather yes 1
Q19:7 Was project's underlying business case preceded by a business needs analysis? This does not mean your party (vendor or customer) performed this analysis as part of the project
UK 2 rather yes 1
Q19:7 Was project's underlying business case preceded by a business needs analysis? This does not mean your party (vendor or customer) performed this analysis as part of the project
USA 1 definitely yes 4
Q19:7 Was project's underlying business case preceded by a business needs analysis? This does not mean your party (vendor or customer) performed this analysis as part of the project
Worldwide 2 rather yes 1
Q19:7 Was project's underlying business case preceded by a business needs analysis? This does not mean your party (vendor or customer) performed this analysis as part of the project
Worldwide 3 neutral 1
Q19:8 Did the final solution evolve beyond initial scope? In case a program was established, answer on a program level
Byelorussia 3 neutral 1
Q19:8 Did the final solution evolve beyond initial scope? In case a program was established, answer on a program level
EMEA 1 definitely yes 1
Q19:8 Did the final solution evolve beyond initial scope? In case a program was established, answer on a program level
EMEA 4 rather not 1
Q19:8 Did the final solution evolve beyond initial scope? In case a program was established, answer on a program level
Finland 4 rather not 1

Key success factors in Business Intelligence, Szymon Adamala & Linus Cidrin
109
Question Country or Region
Answer Count
Q19:8 Did the final solution evolve beyond initial scope? In case a program was established, answer on a program level
India 1 definitely yes 1
Q19:8 Did the final solution evolve beyond initial scope? In case a program was established, answer on a program level
Italy 3 neutral 1
Q19:8 Did the final solution evolve beyond initial scope? In case a program was established, answer on a program level
Netherlands 2 rather yes 1
Q19:8 Did the final solution evolve beyond initial scope? In case a program was established, answer on a program level
Netherlands 4 rather not 2
Q19:8 Did the final solution evolve beyond initial scope? In case a program was established, answer on a program level
Pakistan 4 rather not 1
Q19:8 Did the final solution evolve beyond initial scope? In case a program was established, answer on a program level
Philippines 1 definitely yes 1
Q19:8 Did the final solution evolve beyond initial scope? In case a program was established, answer on a program level
Poland 1 definitely yes 4
Q19:8 Did the final solution evolve beyond initial scope? In case a program was established, answer on a program level
Poland 2 rather yes 13
Q19:8 Did the final solution evolve beyond initial scope? In case a program was established, answer on a program level
Poland 3 neutral 17
Q19:8 Did the final solution evolve beyond initial scope? In case a program was established, answer on a program level
Poland 4 rather not 10
Q19:8 Did the final solution evolve beyond initial scope? In case a program was established, answer on a program level
Poland 5 definitely not 3
Q19:8 Did the final solution evolve beyond initial scope? In case a program was established, answer on a program level
Portugal 3 neutral 1
Q19:8 Did the final solution evolve beyond initial scope? In case a program was established, answer on a program level
Sweden 2 rather yes 1
Q19:8 Did the final solution evolve beyond initial scope? In case a program was established, answer on a program level
Sweden 4 rather not 1
Q19:8 Did the final solution evolve beyond initial scope? In case a program was established, answer on a program level
UK 2 rather yes 1
Q19:8 Did the final solution evolve beyond initial scope? In case a program was established, answer on a program level
USA 1 definitely yes 2
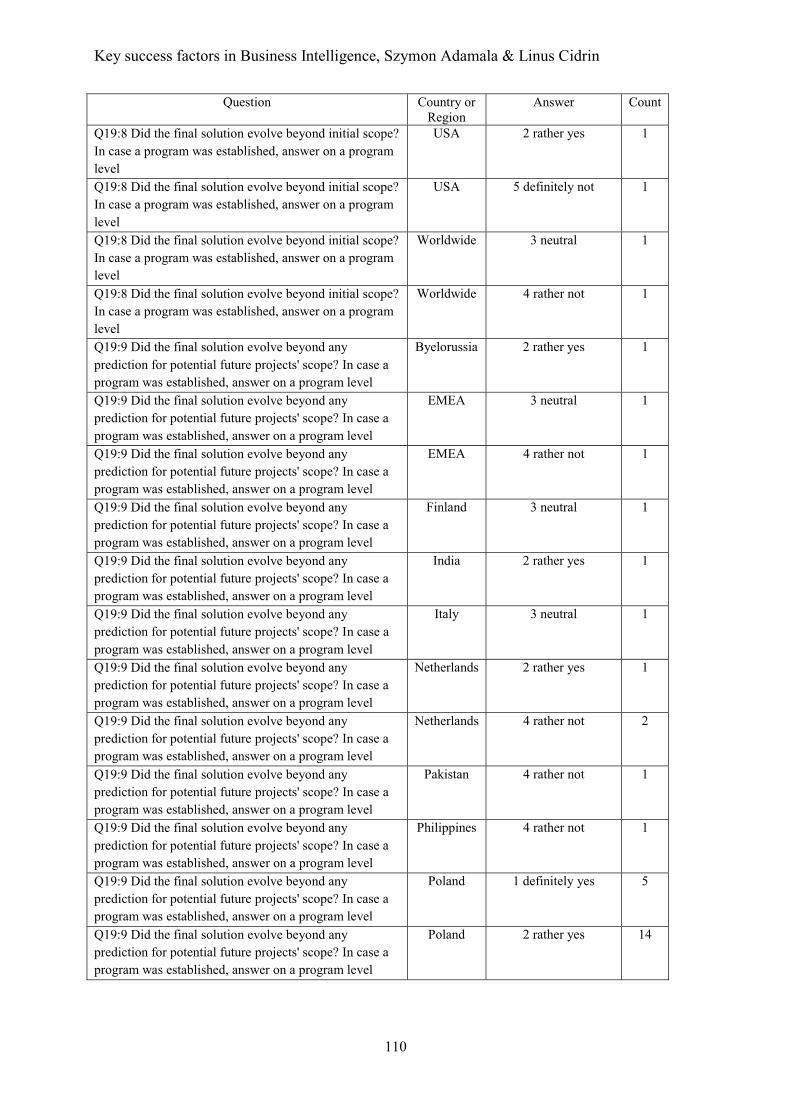
Key success factors in Business Intelligence, Szymon Adamala & Linus Cidrin
110
Question Country or Region
Answer Count
Q19:8 Did the final solution evolve beyond initial scope? In case a program was established, answer on a program level
USA 2 rather yes 1
Q19:8 Did the final solution evolve beyond initial scope? In case a program was established, answer on a program level
USA 5 definitely not 1
Q19:8 Did the final solution evolve beyond initial scope? In case a program was established, answer on a program level
Worldwide 3 neutral 1
Q19:8 Did the final solution evolve beyond initial scope? In case a program was established, answer on a program level
Worldwide 4 rather not 1
Q19:9 Did the final solution evolve beyond any prediction for potential future projects' scope? In case a program was established, answer on a program level
Byelorussia 2 rather yes 1
Q19:9 Did the final solution evolve beyond any prediction for potential future projects' scope? In case a program was established, answer on a program level
EMEA 3 neutral 1
Q19:9 Did the final solution evolve beyond any prediction for potential future projects' scope? In case a program was established, answer on a program level
EMEA 4 rather not 1
Q19:9 Did the final solution evolve beyond any prediction for potential future projects' scope? In case a program was established, answer on a program level
Finland 3 neutral 1
Q19:9 Did the final solution evolve beyond any prediction for potential future projects' scope? In case a program was established, answer on a program level
India 2 rather yes 1
Q19:9 Did the final solution evolve beyond any prediction for potential future projects' scope? In case a program was established, answer on a program level
Italy 3 neutral 1
Q19:9 Did the final solution evolve beyond any prediction for potential future projects' scope? In case a program was established, answer on a program level
Netherlands 2 rather yes 1
Q19:9 Did the final solution evolve beyond any prediction for potential future projects' scope? In case a program was established, answer on a program level
Netherlands 4 rather not 2
Q19:9 Did the final solution evolve beyond any prediction for potential future projects' scope? In case a program was established, answer on a program level
Pakistan 4 rather not 1
Q19:9 Did the final solution evolve beyond any prediction for potential future projects' scope? In case a program was established, answer on a program level
Philippines 4 rather not 1
Q19:9 Did the final solution evolve beyond any prediction for potential future projects' scope? In case a program was established, answer on a program level
Poland 1 definitely yes 5
Q19:9 Did the final solution evolve beyond any prediction for potential future projects' scope? In case a program was established, answer on a program level
Poland 2 rather yes 14
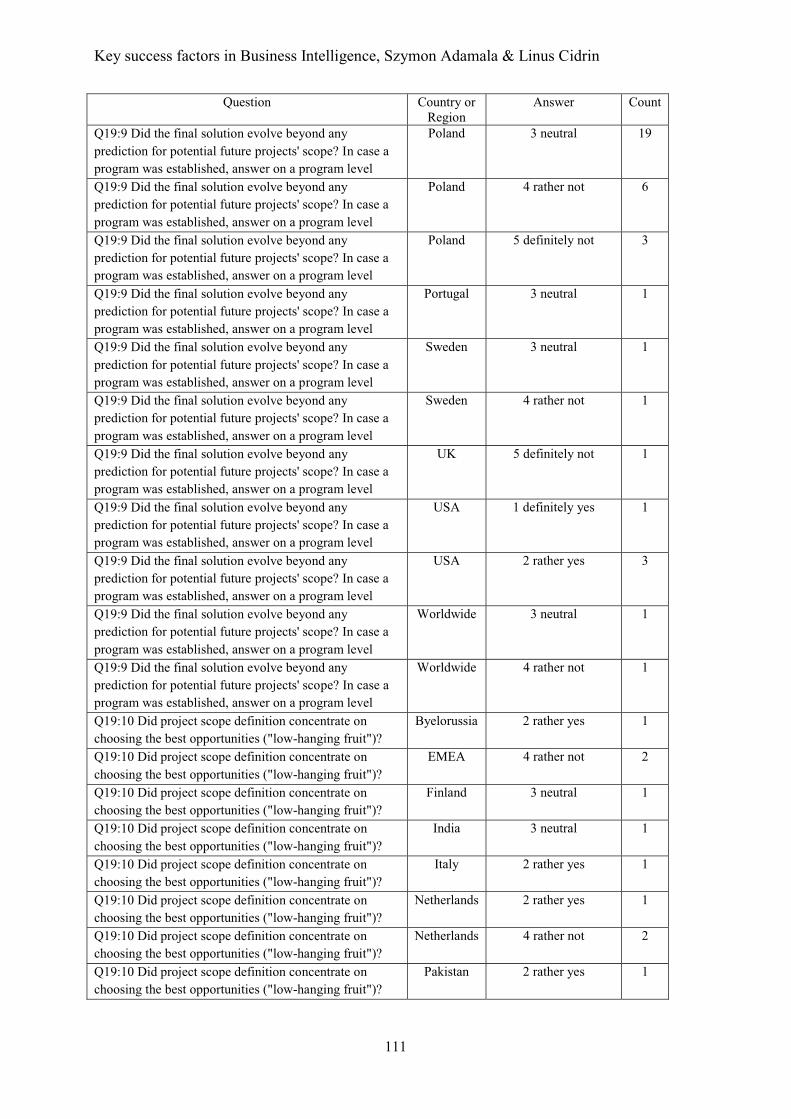
Key success factors in Business Intelligence, Szymon Adamala & Linus Cidrin
111
Question Country or Region
Answer Count
Q19:9 Did the final solution evolve beyond any prediction for potential future projects' scope? In case a program was established, answer on a program level
Poland 3 neutral 19
Q19:9 Did the final solution evolve beyond any prediction for potential future projects' scope? In case a program was established, answer on a program level
Poland 4 rather not 6
Q19:9 Did the final solution evolve beyond any prediction for potential future projects' scope? In case a program was established, answer on a program level
Poland 5 definitely not 3
Q19:9 Did the final solution evolve beyond any prediction for potential future projects' scope? In case a program was established, answer on a program level
Portugal 3 neutral 1
Q19:9 Did the final solution evolve beyond any prediction for potential future projects' scope? In case a program was established, answer on a program level
Sweden 3 neutral 1
Q19:9 Did the final solution evolve beyond any prediction for potential future projects' scope? In case a program was established, answer on a program level
Sweden 4 rather not 1
Q19:9 Did the final solution evolve beyond any prediction for potential future projects' scope? In case a program was established, answer on a program level
UK 5 definitely not 1
Q19:9 Did the final solution evolve beyond any prediction for potential future projects' scope? In case a program was established, answer on a program level
USA 1 definitely yes 1
Q19:9 Did the final solution evolve beyond any prediction for potential future projects' scope? In case a program was established, answer on a program level
USA 2 rather yes 3
Q19:9 Did the final solution evolve beyond any prediction for potential future projects' scope? In case a program was established, answer on a program level
Worldwide 3 neutral 1
Q19:9 Did the final solution evolve beyond any prediction for potential future projects' scope? In case a program was established, answer on a program level
Worldwide 4 rather not 1
Q19:10 Did project scope definition concentrate on choosing the best opportunities ("low-hanging fruit")?
Byelorussia 2 rather yes 1
Q19:10 Did project scope definition concentrate on choosing the best opportunities ("low-hanging fruit")?
EMEA 4 rather not 2
Q19:10 Did project scope definition concentrate on choosing the best opportunities ("low-hanging fruit")?
Finland 3 neutral 1
Q19:10 Did project scope definition concentrate on choosing the best opportunities ("low-hanging fruit")?
India 3 neutral 1
Q19:10 Did project scope definition concentrate on choosing the best opportunities ("low-hanging fruit")?
Italy 2 rather yes 1
Q19:10 Did project scope definition concentrate on choosing the best opportunities ("low-hanging fruit")?
Netherlands 2 rather yes 1
Q19:10 Did project scope definition concentrate on choosing the best opportunities ("low-hanging fruit")?
Netherlands 4 rather not 2
Q19:10 Did project scope definition concentrate on choosing the best opportunities ("low-hanging fruit")?
Pakistan 2 rather yes 1

Key success factors in Business Intelligence, Szymon Adamala & Linus Cidrin
112
Question Country or Region
Answer Count
Q19:10 Did project scope definition concentrate on choosing the best opportunities ("low-hanging fruit")?
Philippines 4 rather not 1
Q19:10 Did project scope definition concentrate on choosing the best opportunities ("low-hanging fruit")?
Poland 1 definitely yes 8
Q19:10 Did project scope definition concentrate on choosing the best opportunities ("low-hanging fruit")?
Poland 2 rather yes 17
Q19:10 Did project scope definition concentrate on choosing the best opportunities ("low-hanging fruit")?
Poland 3 neutral 19
Q19:10 Did project scope definition concentrate on choosing the best opportunities ("low-hanging fruit")?
Poland 4 rather not 3
Q19:10 Did project scope definition concentrate on choosing the best opportunities ("low-hanging fruit")?
Portugal 1 definitely yes 1
Q19:10 Did project scope definition concentrate on choosing the best opportunities ("low-hanging fruit")?
Sweden 3 neutral 1
Q19:10 Did project scope definition concentrate on choosing the best opportunities ("low-hanging fruit")?
Sweden 4 rather not 1
Q19:10 Did project scope definition concentrate on choosing the best opportunities ("low-hanging fruit")?
UK 4 rather not 1
Q19:10 Did project scope definition concentrate on choosing the best opportunities ("low-hanging fruit")?
USA 1 definitely yes 2
Q19:10 Did project scope definition concentrate on choosing the best opportunities ("low-hanging fruit")?
USA 2 rather yes 1
Q19:10 Did project scope definition concentrate on choosing the best opportunities ("low-hanging fruit")?
USA 3 neutral 1
Q19:10 Did project scope definition concentrate on choosing the best opportunities ("low-hanging fruit")?
Worldwide 2 rather yes 1
Q19:10 Did project scope definition concentrate on choosing the best opportunities ("low-hanging fruit")?
Worldwide 4 rather not 1
Q19:11 When an expert in a particular field was needed, was project team always granted access to an expert or enhanced by including one?
Byelorussia 3 neutral 1
Q19:11 When an expert in a particular field was needed, was project team always granted access to an expert or enhanced by including one?
EMEA 1 definitely yes 1
Q19:11 When an expert in a particular field was needed, was project team always granted access to an expert or enhanced by including one?
EMEA 2 rather yes 1
Q19:11 When an expert in a particular field was needed, was project team always granted access to an expert or enhanced by including one?
Finland 3 neutral 1
Q19:11 When an expert in a particular field was needed, was project team always granted access to an expert or enhanced by including one?
India 3 neutral 1
Q19:11 When an expert in a particular field was needed, was project team always granted access to an expert or enhanced by including one?
Italy 3 neutral 1
Q19:11 When an expert in a particular field was needed, was project team always granted access to an expert or enhanced by including one?
Netherlands 2 rather yes 3

Key success factors in Business Intelligence, Szymon Adamala & Linus Cidrin
113
Question Country or Region
Answer Count
Q19:11 When an expert in a particular field was needed, was project team always granted access to an expert or enhanced by including one?
Pakistan 2 rather yes 1
Q19:11 When an expert in a particular field was needed, was project team always granted access to an expert or enhanced by including one?
Philippines 2 rather yes 1
Q19:11 When an expert in a particular field was needed, was project team always granted access to an expert or enhanced by including one?
Poland 1 definitely yes 9
Q19:11 When an expert in a particular field was needed, was project team always granted access to an expert or enhanced by including one?
Poland 2 rather yes 31
Q19:11 When an expert in a particular field was needed, was project team always granted access to an expert or enhanced by including one?
Poland 3 neutral 6
Q19:11 When an expert in a particular field was needed, was project team always granted access to an expert or enhanced by including one?
Poland 4 rather not 1
Q19:11 When an expert in a particular field was needed, was project team always granted access to an expert or enhanced by including one?
Portugal 5 definitely not 1
Q19:11 When an expert in a particular field was needed, was project team always granted access to an expert or enhanced by including one?
Sweden 1 definitely yes 1
Q19:11 When an expert in a particular field was needed, was project team always granted access to an expert or enhanced by including one?
Sweden 2 rather yes 1
Q19:11 When an expert in a particular field was needed, was project team always granted access to an expert or enhanced by including one?
UK 2 rather yes 1
Q19:11 When an expert in a particular field was needed, was project team always granted access to an expert or enhanced by including one?
USA 1 definitely yes 2
Q19:11 When an expert in a particular field was needed, was project team always granted access to an expert or enhanced by including one?
USA 2 rather yes 2
Q19:11 When an expert in a particular field was needed, was project team always granted access to an expert or enhanced by including one?
Worldwide 2 rather yes 2
Q19:12 When an expert was assigned to a team or made available to a team, was it always the best expert available?
Byelorussia 3 neutral 1
Q19:12 When an expert was assigned to a team or made available to a team, was it always the best expert available?
EMEA 2 rather yes 2
Q19:12 When an expert was assigned to a team or made available to a team, was it always the best expert available?
Finland 3 neutral 1
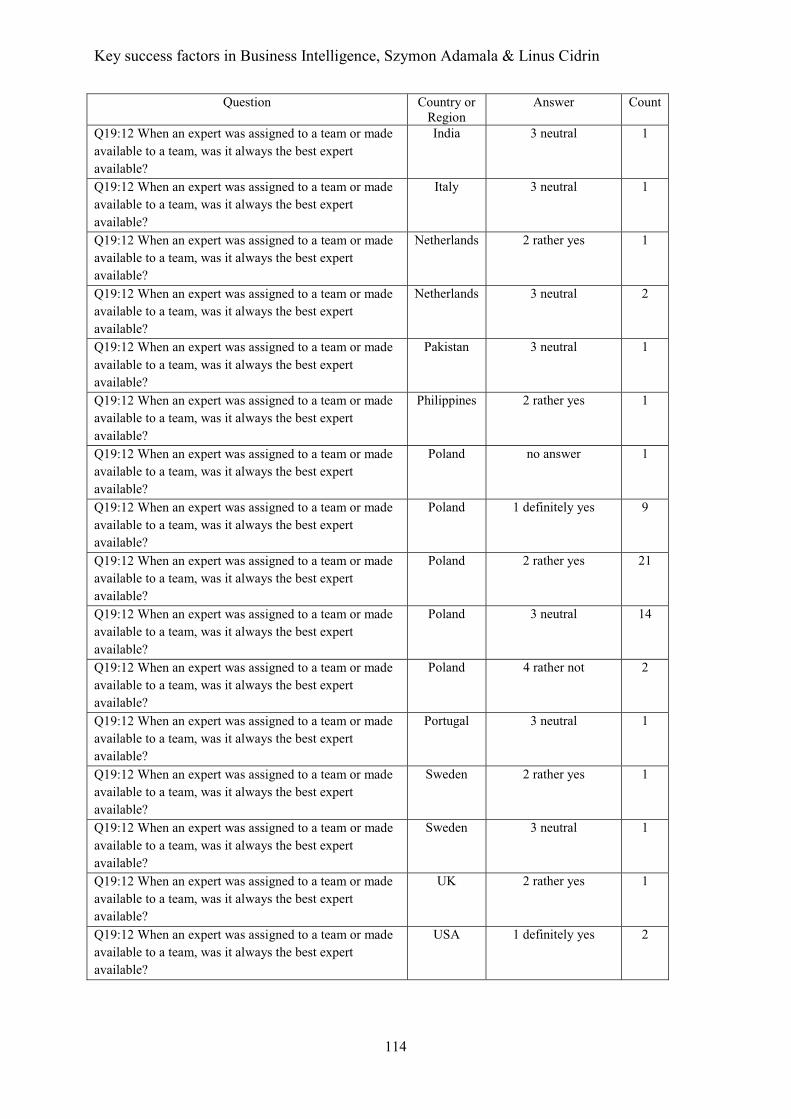
Key success factors in Business Intelligence, Szymon Adamala & Linus Cidrin
114
Question Country or Region
Answer Count
Q19:12 When an expert was assigned to a team or made available to a team, was it always the best expert available?
India 3 neutral 1
Q19:12 When an expert was assigned to a team or made available to a team, was it always the best expert available?
Italy 3 neutral 1
Q19:12 When an expert was assigned to a team or made available to a team, was it always the best expert available?
Netherlands 2 rather yes 1
Q19:12 When an expert was assigned to a team or made available to a team, was it always the best expert available?
Netherlands 3 neutral 2
Q19:12 When an expert was assigned to a team or made available to a team, was it always the best expert available?
Pakistan 3 neutral 1
Q19:12 When an expert was assigned to a team or made available to a team, was it always the best expert available?
Philippines 2 rather yes 1
Q19:12 When an expert was assigned to a team or made available to a team, was it always the best expert available?
Poland no answer 1
Q19:12 When an expert was assigned to a team or made available to a team, was it always the best expert available?
Poland 1 definitely yes 9
Q19:12 When an expert was assigned to a team or made available to a team, was it always the best expert available?
Poland 2 rather yes 21
Q19:12 When an expert was assigned to a team or made available to a team, was it always the best expert available?
Poland 3 neutral 14
Q19:12 When an expert was assigned to a team or made available to a team, was it always the best expert available?
Poland 4 rather not 2
Q19:12 When an expert was assigned to a team or made available to a team, was it always the best expert available?
Portugal 3 neutral 1
Q19:12 When an expert was assigned to a team or made available to a team, was it always the best expert available?
Sweden 2 rather yes 1
Q19:12 When an expert was assigned to a team or made available to a team, was it always the best expert available?
Sweden 3 neutral 1
Q19:12 When an expert was assigned to a team or made available to a team, was it always the best expert available?
UK 2 rather yes 1
Q19:12 When an expert was assigned to a team or made available to a team, was it always the best expert available?
USA 1 definitely yes 2

Key success factors in Business Intelligence, Szymon Adamala & Linus Cidrin
115
Question Country or Region
Answer Count
Q19:12 When an expert was assigned to a team or made available to a team, was it always the best expert available?
USA 2 rather yes 1
Q19:12 When an expert was assigned to a team or made available to a team, was it always the best expert available?
USA 4 rather not 1
Q19:12 When an expert was assigned to a team or made available to a team, was it always the best expert available?
Worldwide 2 rather yes 2
Q19:13 Were there data quality issues at source systems? Byelorussia 1 definitely yes 1 Q19:13 Were there data quality issues at source systems? EMEA 1 definitely yes 2 Q19:13 Were there data quality issues at source systems? Finland 2 rather yes 1 Q19:13 Were there data quality issues at source systems? India 1 definitely yes 1 Q19:13 Were there data quality issues at source systems? Italy 2 rather yes 1 Q19:13 Were there data quality issues at source systems? Netherlands 1 definitely yes 1 Q19:13 Were there data quality issues at source systems? Netherlands 2 rather yes 2 Q19:13 Were there data quality issues at source systems? Pakistan 2 rather yes 1 Q19:13 Were there data quality issues at source systems? Philippines 2 rather yes 1 Q19:13 Were there data quality issues at source systems? Poland 1 definitely yes 11 Q19:13 Were there data quality issues at source systems? Poland 2 rather yes 20 Q19:13 Were there data quality issues at source systems? Poland 3 neutral 4 Q19:13 Were there data quality issues at source systems? Poland 4 rather not 12 Q19:13 Were there data quality issues at source systems? Portugal 1 definitely yes 1 Q19:13 Were there data quality issues at source systems? Sweden 1 definitely yes 2 Q19:13 Were there data quality issues at source systems? UK 4 rather not 1 Q19:13 Were there data quality issues at source systems? USA 1 definitely yes 4 Q19:13 Were there data quality issues at source systems? Worldwide 3 neutral 2 Q19:14 If there were data quality issues at source systems, were they known before the start of BI initiative?
Byelorussia 4 rather not 1
Q19:14 If there were data quality issues at source systems, were they known before the start of BI initiative?
EMEA 1 definitely yes 1
Q19:14 If there were data quality issues at source systems, were they known before the start of BI initiative?
EMEA 5 definitely not 1
Q19:14 If there were data quality issues at source systems, were they known before the start of BI initiative?
Finland 3 neutral 1
Q19:14 If there were data quality issues at source systems, were they known before the start of BI initiative?
India 4 rather not 1
Q19:14 If there were data quality issues at source systems, were they known before the start of BI initiative?
Italy 4 rather not 1
Q19:14 If there were data quality issues at source systems, were they known before the start of BI initiative?
Netherlands 2 rather yes 1

Key success factors in Business Intelligence, Szymon Adamala & Linus Cidrin
116
Question Country or Region
Answer Count
Q19:14 If there were data quality issues at source systems, were they known before the start of BI initiative?
Netherlands 4 rather not 2
Q19:14 If there were data quality issues at source systems, were they known before the start of BI initiative?
Pakistan 1 definitely yes 1
Q19:14 If there were data quality issues at source systems, were they known before the start of BI initiative?
Philippines 4 rather not 1
Q19:14 If there were data quality issues at source systems, were they known before the start of BI initiative?
Poland no answer 2
Q19:14 If there were data quality issues at source systems, were they known before the start of BI initiative?
Poland 1 definitely yes 5
Q19:14 If there were data quality issues at source systems, were they known before the start of BI initiative?
Poland 2 rather yes 19
Q19:14 If there were data quality issues at source systems, were they known before the start of BI initiative?
Poland 3 neutral 11
Q19:14 If there were data quality issues at source systems, were they known before the start of BI initiative?
Poland 4 rather not 9
Q19:14 If there were data quality issues at source systems, were they known before the start of BI initiative?
Poland 5 definitely not 1
Q19:14 If there were data quality issues at source systems, were they known before the start of BI initiative?
Portugal 2 rather yes 1
Q19:14 If there were data quality issues at source systems, were they known before the start of BI initiative?
Sweden 3 neutral 1
Q19:14 If there were data quality issues at source systems, were they known before the start of BI initiative?
Sweden 5 definitely not 1
Q19:14 If there were data quality issues at source systems, were they known before the start of BI initiative?
UK 3 neutral 1
Q19:14 If there were data quality issues at source systems, were they known before the start of BI initiative?
USA 1 definitely yes 1
Q19:14 If there were data quality issues at source systems, were they known before the start of BI initiative?
USA 4 rather not 1
Q19:14 If there were data quality issues at source systems, were they known before the start of BI initiative?
USA 5 definitely not 2
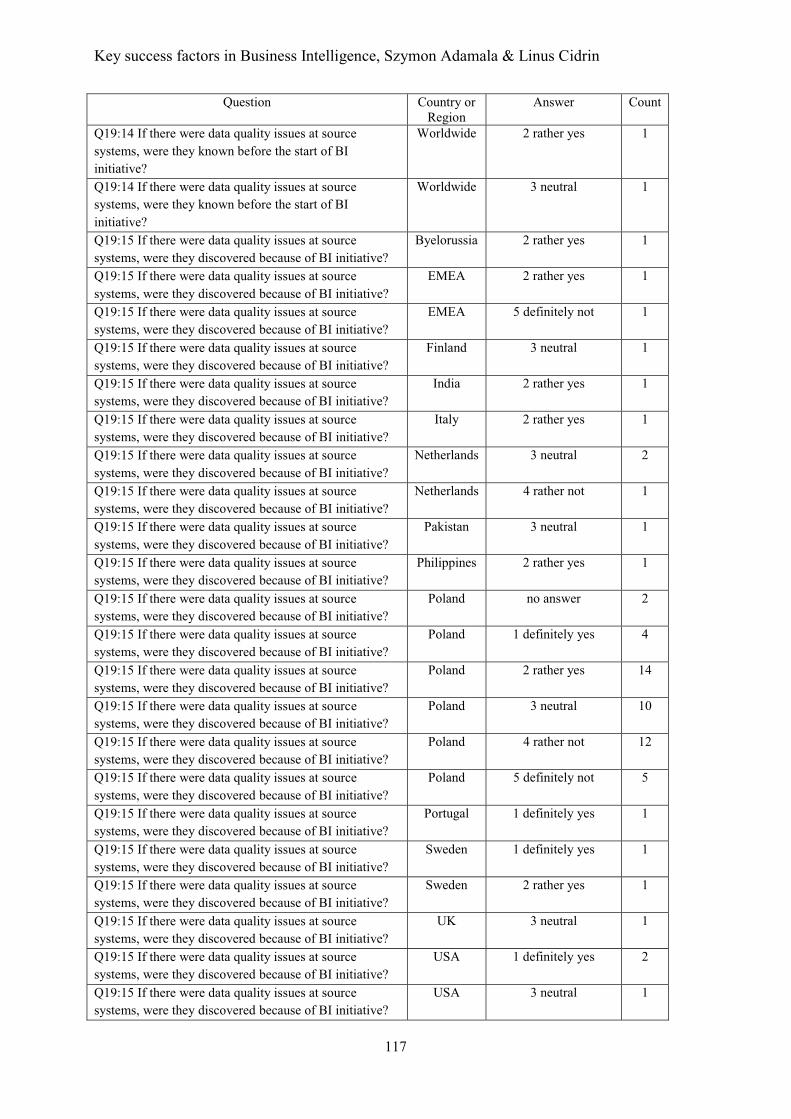
Key success factors in Business Intelligence, Szymon Adamala & Linus Cidrin
117
Question Country or Region
Answer Count
Q19:14 If there were data quality issues at source systems, were they known before the start of BI initiative?
Worldwide 2 rather yes 1
Q19:14 If there were data quality issues at source systems, were they known before the start of BI initiative?
Worldwide 3 neutral 1
Q19:15 If there were data quality issues at source systems, were they discovered because of BI initiative?
Byelorussia 2 rather yes 1
Q19:15 If there were data quality issues at source systems, were they discovered because of BI initiative?
EMEA 2 rather yes 1
Q19:15 If there were data quality issues at source systems, were they discovered because of BI initiative?
EMEA 5 definitely not 1
Q19:15 If there were data quality issues at source systems, were they discovered because of BI initiative?
Finland 3 neutral 1
Q19:15 If there were data quality issues at source systems, were they discovered because of BI initiative?
India 2 rather yes 1
Q19:15 If there were data quality issues at source systems, were they discovered because of BI initiative?
Italy 2 rather yes 1
Q19:15 If there were data quality issues at source systems, were they discovered because of BI initiative?
Netherlands 3 neutral 2
Q19:15 If there were data quality issues at source systems, were they discovered because of BI initiative?
Netherlands 4 rather not 1
Q19:15 If there were data quality issues at source systems, were they discovered because of BI initiative?
Pakistan 3 neutral 1
Q19:15 If there were data quality issues at source systems, were they discovered because of BI initiative?
Philippines 2 rather yes 1
Q19:15 If there were data quality issues at source systems, were they discovered because of BI initiative?
Poland no answer 2
Q19:15 If there were data quality issues at source systems, were they discovered because of BI initiative?
Poland 1 definitely yes 4
Q19:15 If there were data quality issues at source systems, were they discovered because of BI initiative?
Poland 2 rather yes 14
Q19:15 If there were data quality issues at source systems, were they discovered because of BI initiative?
Poland 3 neutral 10
Q19:15 If there were data quality issues at source systems, were they discovered because of BI initiative?
Poland 4 rather not 12
Q19:15 If there were data quality issues at source systems, were they discovered because of BI initiative?
Poland 5 definitely not 5
Q19:15 If there were data quality issues at source systems, were they discovered because of BI initiative?
Portugal 1 definitely yes 1
Q19:15 If there were data quality issues at source systems, were they discovered because of BI initiative?
Sweden 1 definitely yes 1
Q19:15 If there were data quality issues at source systems, were they discovered because of BI initiative?
Sweden 2 rather yes 1
Q19:15 If there were data quality issues at source systems, were they discovered because of BI initiative?
UK 3 neutral 1
Q19:15 If there were data quality issues at source systems, were they discovered because of BI initiative?
USA 1 definitely yes 2
Q19:15 If there were data quality issues at source systems, were they discovered because of BI initiative?
USA 3 neutral 1
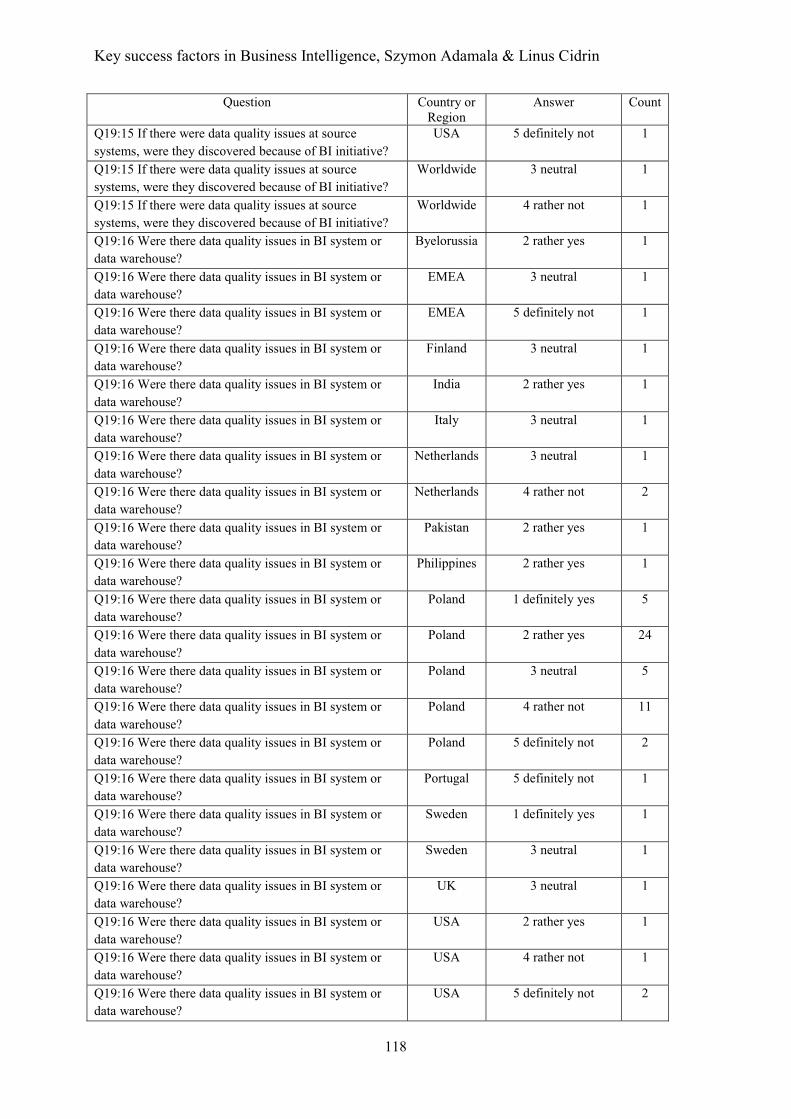
Key success factors in Business Intelligence, Szymon Adamala & Linus Cidrin
118
Question Country or Region
Answer Count
Q19:15 If there were data quality issues at source systems, were they discovered because of BI initiative?
USA 5 definitely not 1
Q19:15 If there were data quality issues at source systems, were they discovered because of BI initiative?
Worldwide 3 neutral 1
Q19:15 If there were data quality issues at source systems, were they discovered because of BI initiative?
Worldwide 4 rather not 1
Q19:16 Were there data quality issues in BI system or data warehouse?
Byelorussia 2 rather yes 1
Q19:16 Were there data quality issues in BI system or data warehouse?
EMEA 3 neutral 1
Q19:16 Were there data quality issues in BI system or data warehouse?
EMEA 5 definitely not 1
Q19:16 Were there data quality issues in BI system or data warehouse?
Finland 3 neutral 1
Q19:16 Were there data quality issues in BI system or data warehouse?
India 2 rather yes 1
Q19:16 Were there data quality issues in BI system or data warehouse?
Italy 3 neutral 1
Q19:16 Were there data quality issues in BI system or data warehouse?
Netherlands 3 neutral 1
Q19:16 Were there data quality issues in BI system or data warehouse?
Netherlands 4 rather not 2
Q19:16 Were there data quality issues in BI system or data warehouse?
Pakistan 2 rather yes 1
Q19:16 Were there data quality issues in BI system or data warehouse?
Philippines 2 rather yes 1
Q19:16 Were there data quality issues in BI system or data warehouse?
Poland 1 definitely yes 5
Q19:16 Were there data quality issues in BI system or data warehouse?
Poland 2 rather yes 24
Q19:16 Were there data quality issues in BI system or data warehouse?
Poland 3 neutral 5
Q19:16 Were there data quality issues in BI system or data warehouse?
Poland 4 rather not 11
Q19:16 Were there data quality issues in BI system or data warehouse?
Poland 5 definitely not 2
Q19:16 Were there data quality issues in BI system or data warehouse?
Portugal 5 definitely not 1
Q19:16 Were there data quality issues in BI system or data warehouse?
Sweden 1 definitely yes 1
Q19:16 Were there data quality issues in BI system or data warehouse?
Sweden 3 neutral 1
Q19:16 Were there data quality issues in BI system or data warehouse?
UK 3 neutral 1
Q19:16 Were there data quality issues in BI system or data warehouse?
USA 2 rather yes 1
Q19:16 Were there data quality issues in BI system or data warehouse?
USA 4 rather not 1
Q19:16 Were there data quality issues in BI system or data warehouse?
USA 5 definitely not 2
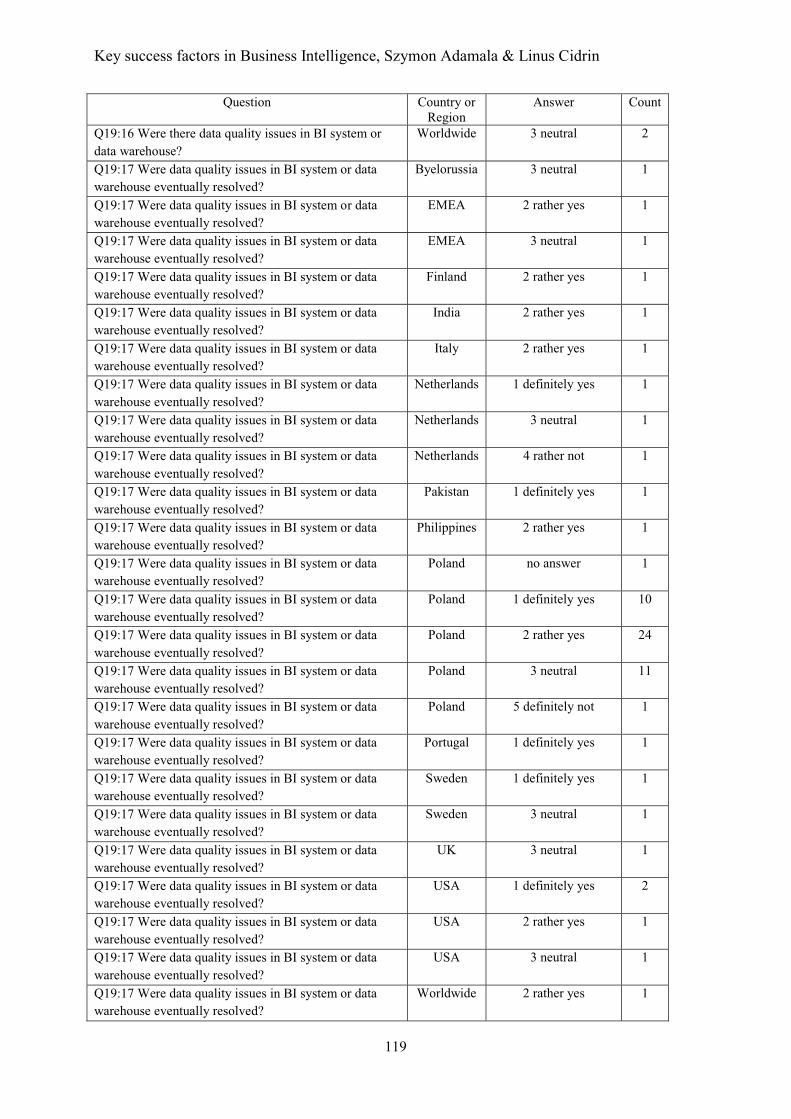
Key success factors in Business Intelligence, Szymon Adamala & Linus Cidrin
119
Question Country or Region
Answer Count
Q19:16 Were there data quality issues in BI system or data warehouse?
Worldwide 3 neutral 2
Q19:17 Were data quality issues in BI system or data warehouse eventually resolved?
Byelorussia 3 neutral 1
Q19:17 Were data quality issues in BI system or data warehouse eventually resolved?
EMEA 2 rather yes 1
Q19:17 Were data quality issues in BI system or data warehouse eventually resolved?
EMEA 3 neutral 1
Q19:17 Were data quality issues in BI system or data warehouse eventually resolved?
Finland 2 rather yes 1
Q19:17 Were data quality issues in BI system or data warehouse eventually resolved?
India 2 rather yes 1
Q19:17 Were data quality issues in BI system or data warehouse eventually resolved?
Italy 2 rather yes 1
Q19:17 Were data quality issues in BI system or data warehouse eventually resolved?
Netherlands 1 definitely yes 1
Q19:17 Were data quality issues in BI system or data warehouse eventually resolved?
Netherlands 3 neutral 1
Q19:17 Were data quality issues in BI system or data warehouse eventually resolved?
Netherlands 4 rather not 1
Q19:17 Were data quality issues in BI system or data warehouse eventually resolved?
Pakistan 1 definitely yes 1
Q19:17 Were data quality issues in BI system or data warehouse eventually resolved?
Philippines 2 rather yes 1
Q19:17 Were data quality issues in BI system or data warehouse eventually resolved?
Poland no answer 1
Q19:17 Were data quality issues in BI system or data warehouse eventually resolved?
Poland 1 definitely yes 10
Q19:17 Were data quality issues in BI system or data warehouse eventually resolved?
Poland 2 rather yes 24
Q19:17 Were data quality issues in BI system or data warehouse eventually resolved?
Poland 3 neutral 11
Q19:17 Were data quality issues in BI system or data warehouse eventually resolved?
Poland 5 definitely not 1
Q19:17 Were data quality issues in BI system or data warehouse eventually resolved?
Portugal 1 definitely yes 1
Q19:17 Were data quality issues in BI system or data warehouse eventually resolved?
Sweden 1 definitely yes 1
Q19:17 Were data quality issues in BI system or data warehouse eventually resolved?
Sweden 3 neutral 1
Q19:17 Were data quality issues in BI system or data warehouse eventually resolved?
UK 3 neutral 1
Q19:17 Were data quality issues in BI system or data warehouse eventually resolved?
USA 1 definitely yes 2
Q19:17 Were data quality issues in BI system or data warehouse eventually resolved?
USA 2 rather yes 1
Q19:17 Were data quality issues in BI system or data warehouse eventually resolved?
USA 3 neutral 1
Q19:17 Were data quality issues in BI system or data warehouse eventually resolved?
Worldwide 2 rather yes 1
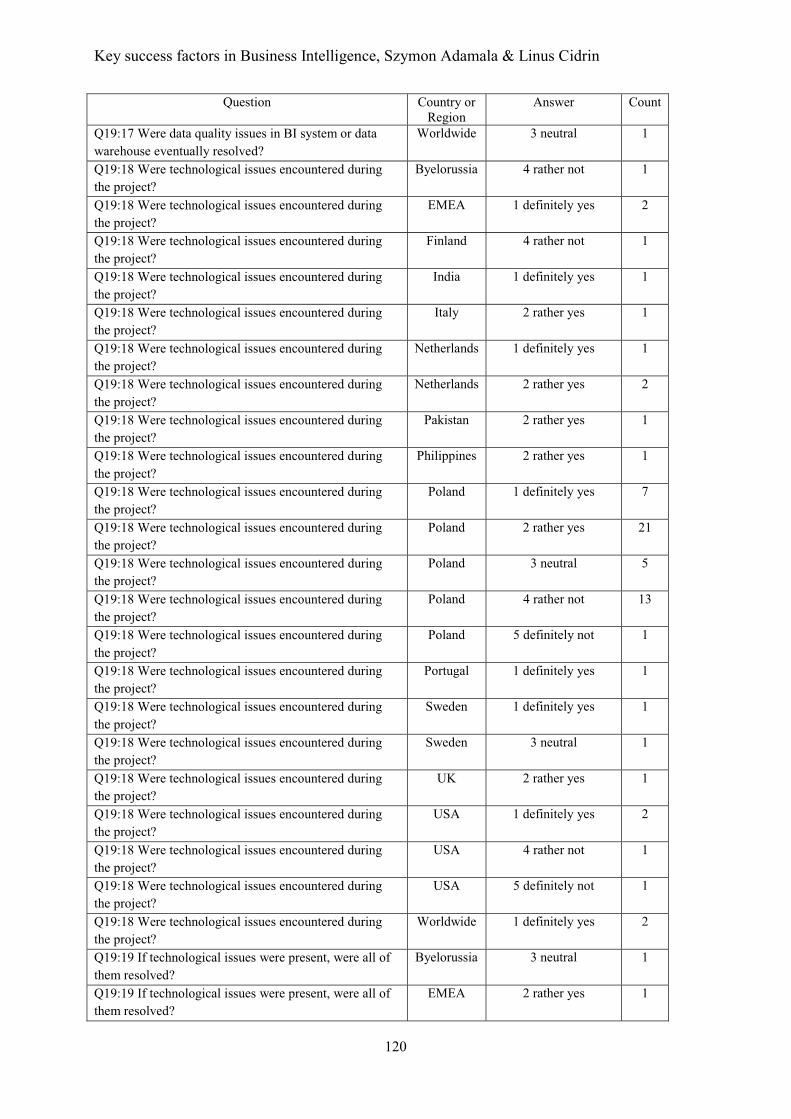
Key success factors in Business Intelligence, Szymon Adamala & Linus Cidrin
120
Question Country or Region
Answer Count
Q19:17 Were data quality issues in BI system or data warehouse eventually resolved?
Worldwide 3 neutral 1
Q19:18 Were technological issues encountered during the project?
Byelorussia 4 rather not 1
Q19:18 Were technological issues encountered during the project?
EMEA 1 definitely yes 2
Q19:18 Were technological issues encountered during the project?
Finland 4 rather not 1
Q19:18 Were technological issues encountered during the project?
India 1 definitely yes 1
Q19:18 Were technological issues encountered during the project?
Italy 2 rather yes 1
Q19:18 Were technological issues encountered during the project?
Netherlands 1 definitely yes 1
Q19:18 Were technological issues encountered during the project?
Netherlands 2 rather yes 2
Q19:18 Were technological issues encountered during the project?
Pakistan 2 rather yes 1
Q19:18 Were technological issues encountered during the project?
Philippines 2 rather yes 1
Q19:18 Were technological issues encountered during the project?
Poland 1 definitely yes 7
Q19:18 Were technological issues encountered during the project?
Poland 2 rather yes 21
Q19:18 Were technological issues encountered during the project?
Poland 3 neutral 5
Q19:18 Were technological issues encountered during the project?
Poland 4 rather not 13
Q19:18 Were technological issues encountered during the project?
Poland 5 definitely not 1
Q19:18 Were technological issues encountered during the project?
Portugal 1 definitely yes 1
Q19:18 Were technological issues encountered during the project?
Sweden 1 definitely yes 1
Q19:18 Were technological issues encountered during the project?
Sweden 3 neutral 1
Q19:18 Were technological issues encountered during the project?
UK 2 rather yes 1
Q19:18 Were technological issues encountered during the project?
USA 1 definitely yes 2
Q19:18 Were technological issues encountered during the project?
USA 4 rather not 1
Q19:18 Were technological issues encountered during the project?
USA 5 definitely not 1
Q19:18 Were technological issues encountered during the project?
Worldwide 1 definitely yes 2
Q19:19 If technological issues were present, were all of them resolved?
Byelorussia 3 neutral 1
Q19:19 If technological issues were present, were all of them resolved?
EMEA 2 rather yes 1
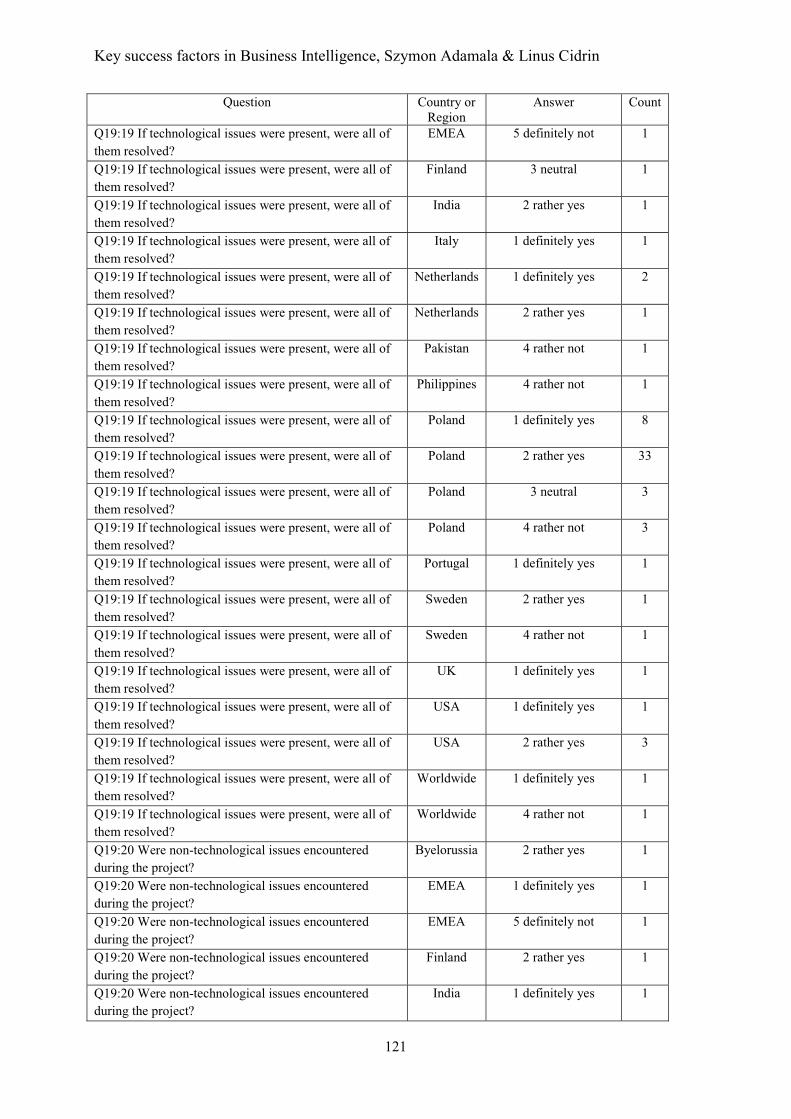
Key success factors in Business Intelligence, Szymon Adamala & Linus Cidrin
121
Question Country or Region
Answer Count
Q19:19 If technological issues were present, were all of them resolved?
EMEA 5 definitely not 1
Q19:19 If technological issues were present, were all of them resolved?
Finland 3 neutral 1
Q19:19 If technological issues were present, were all of them resolved?
India 2 rather yes 1
Q19:19 If technological issues were present, were all of them resolved?
Italy 1 definitely yes 1
Q19:19 If technological issues were present, were all of them resolved?
Netherlands 1 definitely yes 2
Q19:19 If technological issues were present, were all of them resolved?
Netherlands 2 rather yes 1
Q19:19 If technological issues were present, were all of them resolved?
Pakistan 4 rather not 1
Q19:19 If technological issues were present, were all of them resolved?
Philippines 4 rather not 1
Q19:19 If technological issues were present, were all of them resolved?
Poland 1 definitely yes 8
Q19:19 If technological issues were present, were all of them resolved?
Poland 2 rather yes 33
Q19:19 If technological issues were present, were all of them resolved?
Poland 3 neutral 3
Q19:19 If technological issues were present, were all of them resolved?
Poland 4 rather not 3
Q19:19 If technological issues were present, were all of them resolved?
Portugal 1 definitely yes 1
Q19:19 If technological issues were present, were all of them resolved?
Sweden 2 rather yes 1
Q19:19 If technological issues were present, were all of them resolved?
Sweden 4 rather not 1
Q19:19 If technological issues were present, were all of them resolved?
UK 1 definitely yes 1
Q19:19 If technological issues were present, were all of them resolved?
USA 1 definitely yes 1
Q19:19 If technological issues were present, were all of them resolved?
USA 2 rather yes 3
Q19:19 If technological issues were present, were all of them resolved?
Worldwide 1 definitely yes 1
Q19:19 If technological issues were present, were all of them resolved?
Worldwide 4 rather not 1
Q19:20 Were non-technological issues encountered during the project?
Byelorussia 2 rather yes 1
Q19:20 Were non-technological issues encountered during the project?
EMEA 1 definitely yes 1
Q19:20 Were non-technological issues encountered during the project?
EMEA 5 definitely not 1
Q19:20 Were non-technological issues encountered during the project?
Finland 2 rather yes 1
Q19:20 Were non-technological issues encountered during the project?
India 1 definitely yes 1

Key success factors in Business Intelligence, Szymon Adamala & Linus Cidrin
122
Question Country or Region
Answer Count
Q19:20 Were non-technological issues encountered during the project?
Italy 2 rather yes 1
Q19:20 Were non-technological issues encountered during the project?
Netherlands 1 definitely yes 1
Q19:20 Were non-technological issues encountered during the project?
Netherlands 2 rather yes 1
Q19:20 Were non-technological issues encountered during the project?
Netherlands 3 neutral 1
Q19:20 Were non-technological issues encountered during the project?
Pakistan 2 rather yes 1
Q19:20 Were non-technological issues encountered during the project?
Philippines 1 definitely yes 1
Q19:20 Were non-technological issues encountered during the project?
Poland 1 definitely yes 5
Q19:20 Were non-technological issues encountered during the project?
Poland 2 rather yes 27
Q19:20 Were non-technological issues encountered during the project?
Poland 3 neutral 5
Q19:20 Were non-technological issues encountered during the project?
Poland 4 rather not 10
Q19:20 Were non-technological issues encountered during the project?
Portugal 1 definitely yes 1
Q19:20 Were non-technological issues encountered during the project?
Sweden no answer 1
Q19:20 Were non-technological issues encountered during the project?
Sweden 2 rather yes 1
Q19:20 Were non-technological issues encountered during the project?
UK 1 definitely yes 1
Q19:20 Were non-technological issues encountered during the project?
USA 1 definitely yes 2
Q19:20 Were non-technological issues encountered during the project?
USA 2 rather yes 2
Q19:20 Were non-technological issues encountered during the project?
Worldwide 2 rather yes 2
Q19:21 If non-technological issues were present, were all of them resolved?
Byelorussia 2 rather yes 1
Q19:21 If non-technological issues were present, were all of them resolved?
EMEA 2 rather yes 1
Q19:21 If non-technological issues were present, were all of them resolved?
EMEA 4 rather not 1
Q19:21 If non-technological issues were present, were all of them resolved?
Finland 2 rather yes 1
Q19:21 If non-technological issues were present, were all of them resolved?
India 2 rather yes 1
Q19:21 If non-technological issues were present, were all of them resolved?
Italy 2 rather yes 1
Q19:21 If non-technological issues were present, were all of them resolved?
Netherlands 2 rather yes 1
Q19:21 If non-technological issues were present, were all of them resolved?
Netherlands 3 neutral 1
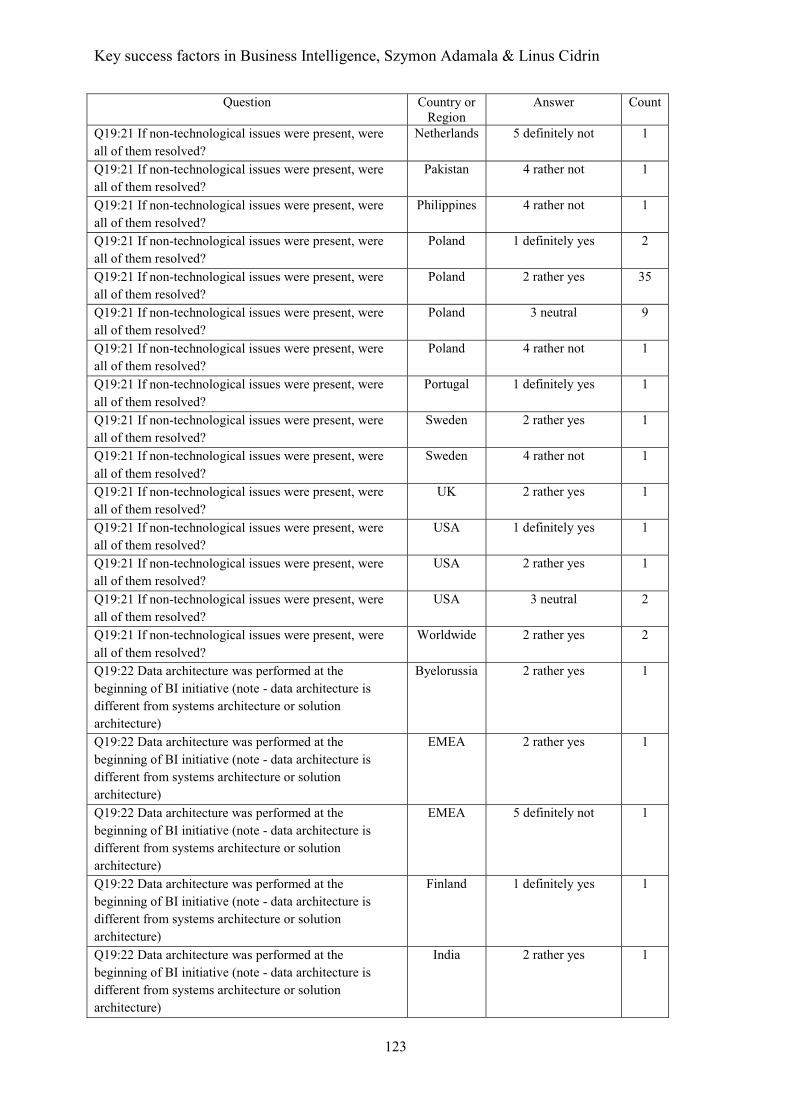
Key success factors in Business Intelligence, Szymon Adamala & Linus Cidrin
123
Question Country or Region
Answer Count
Q19:21 If non-technological issues were present, were all of them resolved?
Netherlands 5 definitely not 1
Q19:21 If non-technological issues were present, were all of them resolved?
Pakistan 4 rather not 1
Q19:21 If non-technological issues were present, were all of them resolved?
Philippines 4 rather not 1
Q19:21 If non-technological issues were present, were all of them resolved?
Poland 1 definitely yes 2
Q19:21 If non-technological issues were present, were all of them resolved?
Poland 2 rather yes 35
Q19:21 If non-technological issues were present, were all of them resolved?
Poland 3 neutral 9
Q19:21 If non-technological issues were present, were all of them resolved?
Poland 4 rather not 1
Q19:21 If non-technological issues were present, were all of them resolved?
Portugal 1 definitely yes 1
Q19:21 If non-technological issues were present, were all of them resolved?
Sweden 2 rather yes 1
Q19:21 If non-technological issues were present, were all of them resolved?
Sweden 4 rather not 1
Q19:21 If non-technological issues were present, were all of them resolved?
UK 2 rather yes 1
Q19:21 If non-technological issues were present, were all of them resolved?
USA 1 definitely yes 1
Q19:21 If non-technological issues were present, were all of them resolved?
USA 2 rather yes 1
Q19:21 If non-technological issues were present, were all of them resolved?
USA 3 neutral 2
Q19:21 If non-technological issues were present, were all of them resolved?
Worldwide 2 rather yes 2
Q19:22 Data architecture was performed at the beginning of BI initiative (note - data architecture is different from systems architecture or solution architecture)
Byelorussia 2 rather yes 1
Q19:22 Data architecture was performed at the beginning of BI initiative (note - data architecture is different from systems architecture or solution architecture)
EMEA 2 rather yes 1
Q19:22 Data architecture was performed at the beginning of BI initiative (note - data architecture is different from systems architecture or solution architecture)
EMEA 5 definitely not 1
Q19:22 Data architecture was performed at the beginning of BI initiative (note - data architecture is different from systems architecture or solution architecture)
Finland 1 definitely yes 1
Q19:22 Data architecture was performed at the beginning of BI initiative (note - data architecture is different from systems architecture or solution architecture)
India 2 rather yes 1
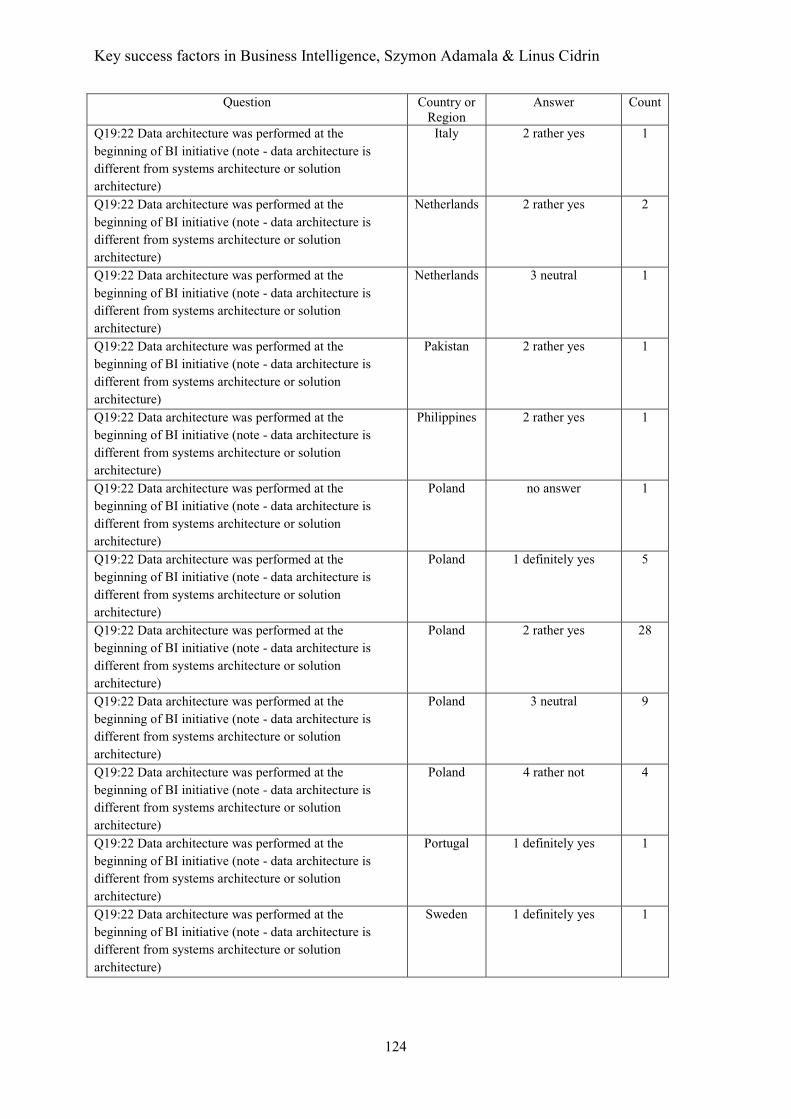
Key success factors in Business Intelligence, Szymon Adamala & Linus Cidrin
124
Question Country or Region
Answer Count
Q19:22 Data architecture was performed at the beginning of BI initiative (note - data architecture is different from systems architecture or solution architecture)
Italy 2 rather yes 1
Q19:22 Data architecture was performed at the beginning of BI initiative (note - data architecture is different from systems architecture or solution architecture)
Netherlands 2 rather yes 2
Q19:22 Data architecture was performed at the beginning of BI initiative (note - data architecture is different from systems architecture or solution architecture)
Netherlands 3 neutral 1
Q19:22 Data architecture was performed at the beginning of BI initiative (note - data architecture is different from systems architecture or solution architecture)
Pakistan 2 rather yes 1
Q19:22 Data architecture was performed at the beginning of BI initiative (note - data architecture is different from systems architecture or solution architecture)
Philippines 2 rather yes 1
Q19:22 Data architecture was performed at the beginning of BI initiative (note - data architecture is different from systems architecture or solution architecture)
Poland no answer 1
Q19:22 Data architecture was performed at the beginning of BI initiative (note - data architecture is different from systems architecture or solution architecture)
Poland 1 definitely yes 5
Q19:22 Data architecture was performed at the beginning of BI initiative (note - data architecture is different from systems architecture or solution architecture)
Poland 2 rather yes 28
Q19:22 Data architecture was performed at the beginning of BI initiative (note - data architecture is different from systems architecture or solution architecture)
Poland 3 neutral 9
Q19:22 Data architecture was performed at the beginning of BI initiative (note - data architecture is different from systems architecture or solution architecture)
Poland 4 rather not 4
Q19:22 Data architecture was performed at the beginning of BI initiative (note - data architecture is different from systems architecture or solution architecture)
Portugal 1 definitely yes 1
Q19:22 Data architecture was performed at the beginning of BI initiative (note - data architecture is different from systems architecture or solution architecture)
Sweden 1 definitely yes 1
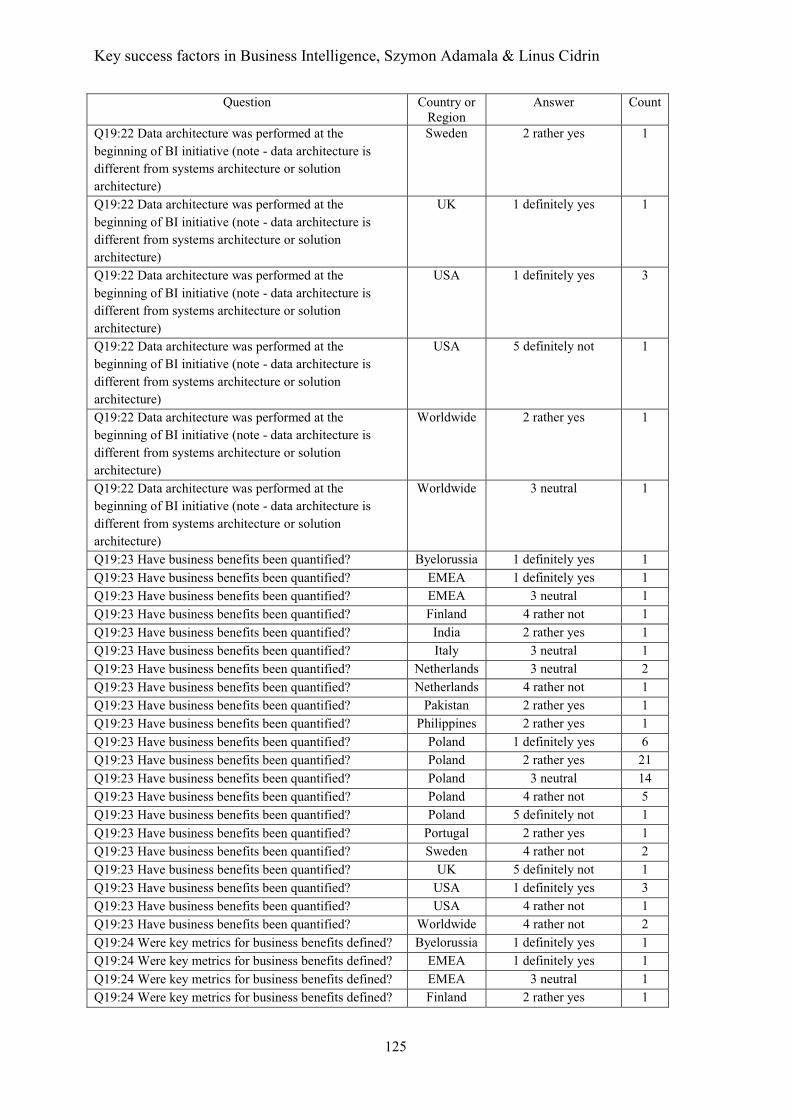
Key success factors in Business Intelligence, Szymon Adamala & Linus Cidrin
125
Question Country or Region
Answer Count
Q19:22 Data architecture was performed at the beginning of BI initiative (note - data architecture is different from systems architecture or solution architecture)
Sweden 2 rather yes 1
Q19:22 Data architecture was performed at the beginning of BI initiative (note - data architecture is different from systems architecture or solution architecture)
UK 1 definitely yes 1
Q19:22 Data architecture was performed at the beginning of BI initiative (note - data architecture is different from systems architecture or solution architecture)
USA 1 definitely yes 3
Q19:22 Data architecture was performed at the beginning of BI initiative (note - data architecture is different from systems architecture or solution architecture)
USA 5 definitely not 1
Q19:22 Data architecture was performed at the beginning of BI initiative (note - data architecture is different from systems architecture or solution architecture)
Worldwide 2 rather yes 1
Q19:22 Data architecture was performed at the beginning of BI initiative (note - data architecture is different from systems architecture or solution architecture)
Worldwide 3 neutral 1
Q19:23 Have business benefits been quantified? Byelorussia 1 definitely yes 1 Q19:23 Have business benefits been quantified? EMEA 1 definitely yes 1 Q19:23 Have business benefits been quantified? EMEA 3 neutral 1 Q19:23 Have business benefits been quantified? Finland 4 rather not 1 Q19:23 Have business benefits been quantified? India 2 rather yes 1 Q19:23 Have business benefits been quantified? Italy 3 neutral 1 Q19:23 Have business benefits been quantified? Netherlands 3 neutral 2 Q19:23 Have business benefits been quantified? Netherlands 4 rather not 1 Q19:23 Have business benefits been quantified? Pakistan 2 rather yes 1 Q19:23 Have business benefits been quantified? Philippines 2 rather yes 1 Q19:23 Have business benefits been quantified? Poland 1 definitely yes 6 Q19:23 Have business benefits been quantified? Poland 2 rather yes 21 Q19:23 Have business benefits been quantified? Poland 3 neutral 14 Q19:23 Have business benefits been quantified? Poland 4 rather not 5 Q19:23 Have business benefits been quantified? Poland 5 definitely not 1 Q19:23 Have business benefits been quantified? Portugal 2 rather yes 1 Q19:23 Have business benefits been quantified? Sweden 4 rather not 2 Q19:23 Have business benefits been quantified? UK 5 definitely not 1 Q19:23 Have business benefits been quantified? USA 1 definitely yes 3 Q19:23 Have business benefits been quantified? USA 4 rather not 1 Q19:23 Have business benefits been quantified? Worldwide 4 rather not 2 Q19:24 Were key metrics for business benefits defined? Byelorussia 1 definitely yes 1 Q19:24 Were key metrics for business benefits defined? EMEA 1 definitely yes 1 Q19:24 Were key metrics for business benefits defined? EMEA 3 neutral 1 Q19:24 Were key metrics for business benefits defined? Finland 2 rather yes 1

Key success factors in Business Intelligence, Szymon Adamala & Linus Cidrin
126
Question Country or Region
Answer Count
Q19:24 Were key metrics for business benefits defined? India 2 rather yes 1 Q19:24 Were key metrics for business benefits defined? Italy 2 rather yes 1 Q19:24 Were key metrics for business benefits defined? Netherlands 3 neutral 2 Q19:24 Were key metrics for business benefits defined? Netherlands 4 rather not 1 Q19:24 Were key metrics for business benefits defined? Pakistan 2 rather yes 1 Q19:24 Were key metrics for business benefits defined? Philippines 2 rather yes 1 Q19:24 Were key metrics for business benefits defined? Poland 1 definitely yes 5 Q19:24 Were key metrics for business benefits defined? Poland 2 rather yes 22 Q19:24 Were key metrics for business benefits defined? Poland 3 neutral 14 Q19:24 Were key metrics for business benefits defined? Poland 4 rather not 4 Q19:24 Were key metrics for business benefits defined? Poland 5 definitely not 2 Q19:24 Were key metrics for business benefits defined? Portugal 1 definitely yes 1 Q19:24 Were key metrics for business benefits defined? Sweden 4 rather not 2 Q19:24 Were key metrics for business benefits defined? UK 5 definitely not 1 Q19:24 Were key metrics for business benefits defined? USA 1 definitely yes 3 Q19:24 Were key metrics for business benefits defined? USA 4 rather not 1 Q19:24 Were key metrics for business benefits defined? Worldwide 2 rather yes 1 Q19:24 Were key metrics for business benefits defined? Worldwide 4 rather not 1 Q19:25 Was there a process in place to measure business benefits?
Byelorussia 1 definitely yes 1
Q19:25 Was there a process in place to measure business benefits?
EMEA 2 rather yes 1
Q19:25 Was there a process in place to measure business benefits?
EMEA 3 neutral 1
Q19:25 Was there a process in place to measure business benefits?
Finland 3 neutral 1
Q19:25 Was there a process in place to measure business benefits?
India 2 rather yes 1
Q19:25 Was there a process in place to measure business benefits?
Italy 2 rather yes 1
Q19:25 Was there a process in place to measure business benefits?
Netherlands 3 neutral 2
Q19:25 Was there a process in place to measure business benefits?
Netherlands 4 rather not 1
Q19:25 Was there a process in place to measure business benefits?
Pakistan 2 rather yes 1
Q19:25 Was there a process in place to measure business benefits?
Philippines 2 rather yes 1
Q19:25 Was there a process in place to measure business benefits?
Poland 1 definitely yes 5
Q19:25 Was there a process in place to measure business benefits?
Poland 2 rather yes 13
Q19:25 Was there a process in place to measure business benefits?
Poland 3 neutral 19
Q19:25 Was there a process in place to measure business benefits?
Poland 4 rather not 7
Q19:25 Was there a process in place to measure business benefits?
Poland 5 definitely not 3
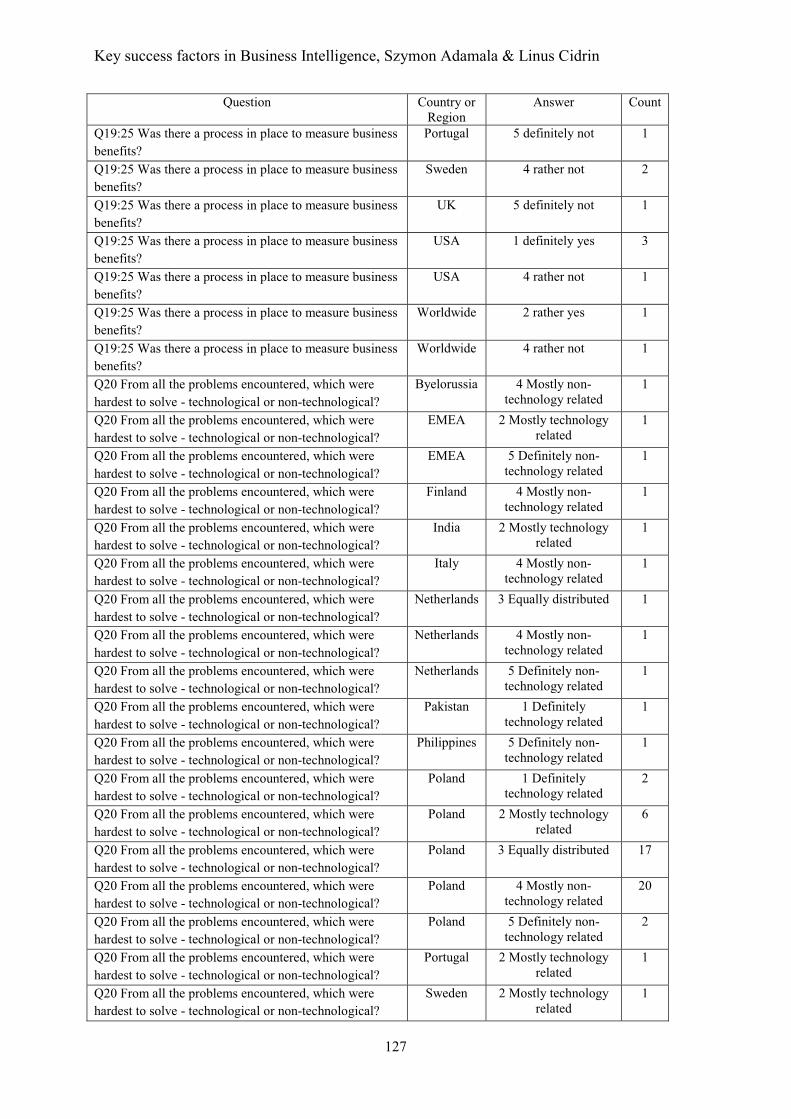
Key success factors in Business Intelligence, Szymon Adamala & Linus Cidrin
127
Question Country or Region
Answer Count
Q19:25 Was there a process in place to measure business benefits?
Portugal 5 definitely not 1
Q19:25 Was there a process in place to measure business benefits?
Sweden 4 rather not 2
Q19:25 Was there a process in place to measure business benefits?
UK 5 definitely not 1
Q19:25 Was there a process in place to measure business benefits?
USA 1 definitely yes 3
Q19:25 Was there a process in place to measure business benefits?
USA 4 rather not 1
Q19:25 Was there a process in place to measure business benefits?
Worldwide 2 rather yes 1
Q19:25 Was there a process in place to measure business benefits?
Worldwide 4 rather not 1
Q20 From all the problems encountered, which were hardest to solve - technological or non-technological?
Byelorussia 4 Mostly non-technology related
1
Q20 From all the problems encountered, which were hardest to solve - technological or non-technological?
EMEA 2 Mostly technology related
1
Q20 From all the problems encountered, which were hardest to solve - technological or non-technological?
EMEA 5 Definitely non-technology related
1
Q20 From all the problems encountered, which were hardest to solve - technological or non-technological?
Finland 4 Mostly non-technology related
1
Q20 From all the problems encountered, which were hardest to solve - technological or non-technological?
India 2 Mostly technology related
1
Q20 From all the problems encountered, which were hardest to solve - technological or non-technological?
Italy 4 Mostly non-technology related
1
Q20 From all the problems encountered, which were hardest to solve - technological or non-technological?
Netherlands 3 Equally distributed 1
Q20 From all the problems encountered, which were hardest to solve - technological or non-technological?
Netherlands 4 Mostly non-technology related
1
Q20 From all the problems encountered, which were hardest to solve - technological or non-technological?
Netherlands 5 Definitely non-technology related
1
Q20 From all the problems encountered, which were hardest to solve - technological or non-technological?
Pakistan 1 Definitely technology related
1
Q20 From all the problems encountered, which were hardest to solve - technological or non-technological?
Philippines 5 Definitely non-technology related
1
Q20 From all the problems encountered, which were hardest to solve - technological or non-technological?
Poland 1 Definitely technology related
2
Q20 From all the problems encountered, which were hardest to solve - technological or non-technological?
Poland 2 Mostly technology related
6
Q20 From all the problems encountered, which were hardest to solve - technological or non-technological?
Poland 3 Equally distributed 17
Q20 From all the problems encountered, which were hardest to solve - technological or non-technological?
Poland 4 Mostly non-technology related
20
Q20 From all the problems encountered, which were hardest to solve - technological or non-technological?
Poland 5 Definitely non-technology related
2
Q20 From all the problems encountered, which were hardest to solve - technological or non-technological?
Portugal 2 Mostly technology related
1
Q20 From all the problems encountered, which were hardest to solve - technological or non-technological?
Sweden 2 Mostly technology related
1
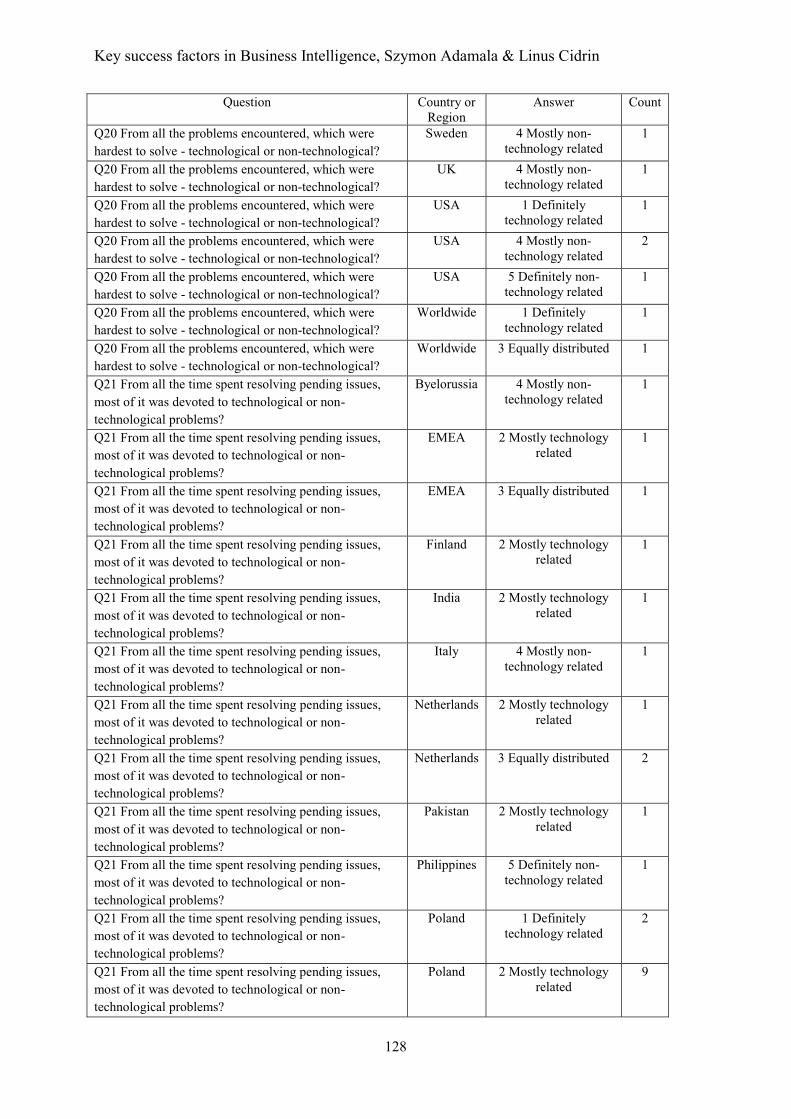
Key success factors in Business Intelligence, Szymon Adamala & Linus Cidrin
128
Question Country or Region
Answer Count
Q20 From all the problems encountered, which were hardest to solve - technological or non-technological?
Sweden 4 Mostly non-technology related
1
Q20 From all the problems encountered, which were hardest to solve - technological or non-technological?
UK 4 Mostly non-technology related
1
Q20 From all the problems encountered, which were hardest to solve - technological or non-technological?
USA 1 Definitely technology related
1
Q20 From all the problems encountered, which were hardest to solve - technological or non-technological?
USA 4 Mostly non-technology related
2
Q20 From all the problems encountered, which were hardest to solve - technological or non-technological?
USA 5 Definitely non-technology related
1
Q20 From all the problems encountered, which were hardest to solve - technological or non-technological?
Worldwide 1 Definitely technology related
1
Q20 From all the problems encountered, which were hardest to solve - technological or non-technological?
Worldwide 3 Equally distributed 1
Q21 From all the time spent resolving pending issues, most of it was devoted to technological or non-technological problems?
Byelorussia 4 Mostly non-technology related
1
Q21 From all the time spent resolving pending issues, most of it was devoted to technological or non-technological problems?
EMEA 2 Mostly technology related
1
Q21 From all the time spent resolving pending issues, most of it was devoted to technological or non-technological problems?
EMEA 3 Equally distributed 1
Q21 From all the time spent resolving pending issues, most of it was devoted to technological or non-technological problems?
Finland 2 Mostly technology related
1
Q21 From all the time spent resolving pending issues, most of it was devoted to technological or non-technological problems?
India 2 Mostly technology related
1
Q21 From all the time spent resolving pending issues, most of it was devoted to technological or non-technological problems?
Italy 4 Mostly non-technology related
1
Q21 From all the time spent resolving pending issues, most of it was devoted to technological or non-technological problems?
Netherlands 2 Mostly technology related
1
Q21 From all the time spent resolving pending issues, most of it was devoted to technological or non-technological problems?
Netherlands 3 Equally distributed 2
Q21 From all the time spent resolving pending issues, most of it was devoted to technological or non-technological problems?
Pakistan 2 Mostly technology related
1
Q21 From all the time spent resolving pending issues, most of it was devoted to technological or non-technological problems?
Philippines 5 Definitely non-technology related
1
Q21 From all the time spent resolving pending issues, most of it was devoted to technological or non-technological problems?
Poland 1 Definitely technology related
2
Q21 From all the time spent resolving pending issues, most of it was devoted to technological or non-technological problems?
Poland 2 Mostly technology related
9
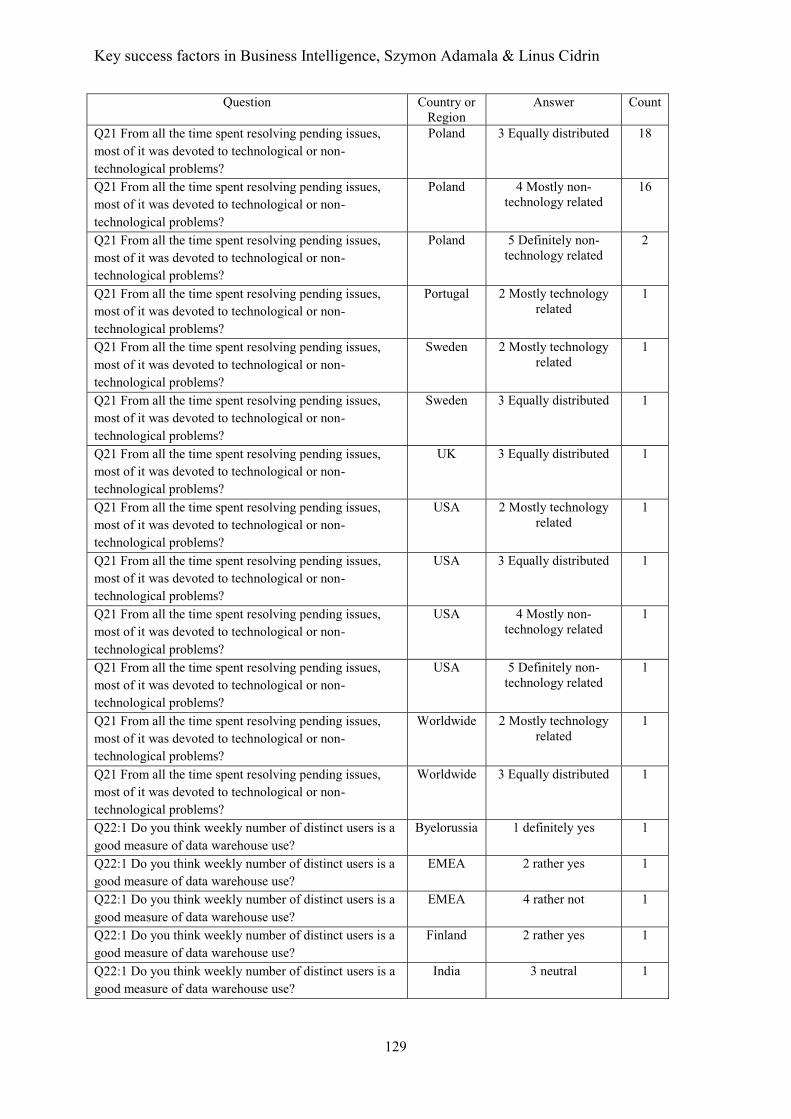
Key success factors in Business Intelligence, Szymon Adamala & Linus Cidrin
129
Question Country or Region
Answer Count
Q21 From all the time spent resolving pending issues, most of it was devoted to technological or non-technological problems?
Poland 3 Equally distributed 18
Q21 From all the time spent resolving pending issues, most of it was devoted to technological or non-technological problems?
Poland 4 Mostly non-technology related
16
Q21 From all the time spent resolving pending issues, most of it was devoted to technological or non-technological problems?
Poland 5 Definitely non-technology related
2
Q21 From all the time spent resolving pending issues, most of it was devoted to technological or non-technological problems?
Portugal 2 Mostly technology related
1
Q21 From all the time spent resolving pending issues, most of it was devoted to technological or non-technological problems?
Sweden 2 Mostly technology related
1
Q21 From all the time spent resolving pending issues, most of it was devoted to technological or non-technological problems?
Sweden 3 Equally distributed 1
Q21 From all the time spent resolving pending issues, most of it was devoted to technological or non-technological problems?
UK 3 Equally distributed 1
Q21 From all the time spent resolving pending issues, most of it was devoted to technological or non-technological problems?
USA 2 Mostly technology related
1
Q21 From all the time spent resolving pending issues, most of it was devoted to technological or non-technological problems?
USA 3 Equally distributed 1
Q21 From all the time spent resolving pending issues, most of it was devoted to technological or non-technological problems?
USA 4 Mostly non-technology related
1
Q21 From all the time spent resolving pending issues, most of it was devoted to technological or non-technological problems?
USA 5 Definitely non-technology related
1
Q21 From all the time spent resolving pending issues, most of it was devoted to technological or non-technological problems?
Worldwide 2 Mostly technology related
1
Q21 From all the time spent resolving pending issues, most of it was devoted to technological or non-technological problems?
Worldwide 3 Equally distributed 1
Q22:1 Do you think weekly number of distinct users is a good measure of data warehouse use?
Byelorussia 1 definitely yes 1
Q22:1 Do you think weekly number of distinct users is a good measure of data warehouse use?
EMEA 2 rather yes 1
Q22:1 Do you think weekly number of distinct users is a good measure of data warehouse use?
EMEA 4 rather not 1
Q22:1 Do you think weekly number of distinct users is a good measure of data warehouse use?
Finland 2 rather yes 1
Q22:1 Do you think weekly number of distinct users is a good measure of data warehouse use?
India 3 neutral 1
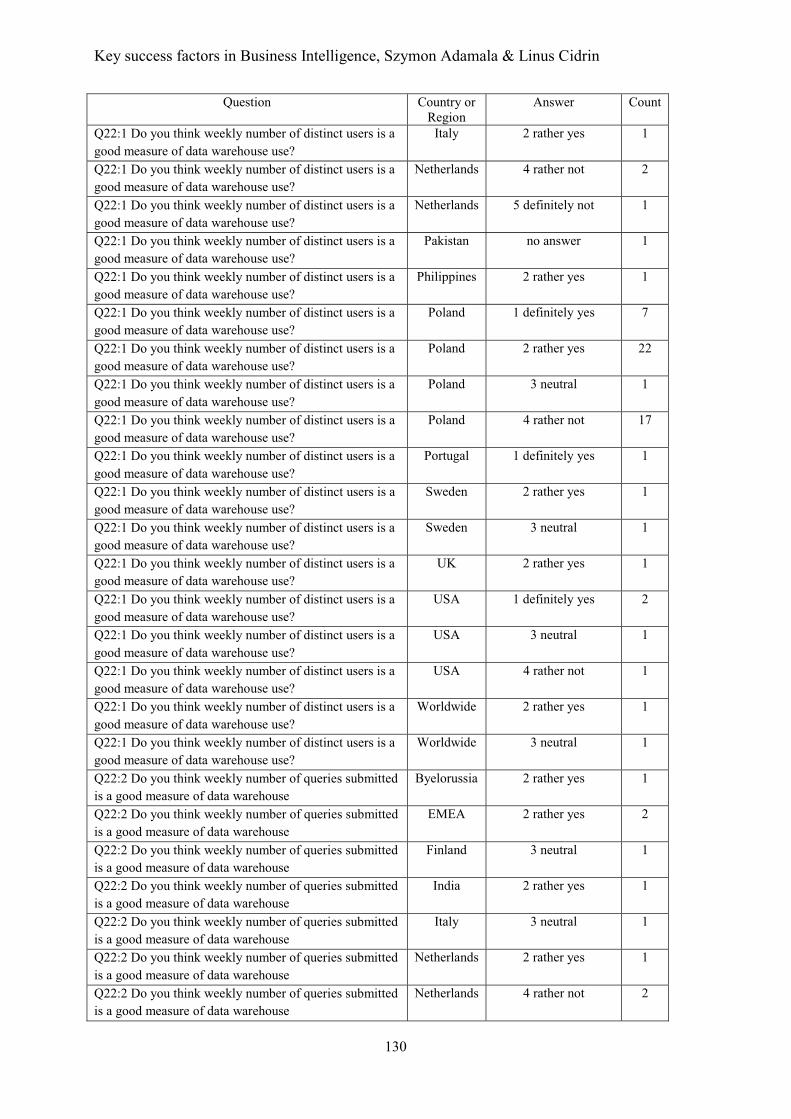
Key success factors in Business Intelligence, Szymon Adamala & Linus Cidrin
130
Question Country or Region
Answer Count
Q22:1 Do you think weekly number of distinct users is a good measure of data warehouse use?
Italy 2 rather yes 1
Q22:1 Do you think weekly number of distinct users is a good measure of data warehouse use?
Netherlands 4 rather not 2
Q22:1 Do you think weekly number of distinct users is a good measure of data warehouse use?
Netherlands 5 definitely not 1
Q22:1 Do you think weekly number of distinct users is a good measure of data warehouse use?
Pakistan no answer 1
Q22:1 Do you think weekly number of distinct users is a good measure of data warehouse use?
Philippines 2 rather yes 1
Q22:1 Do you think weekly number of distinct users is a good measure of data warehouse use?
Poland 1 definitely yes 7
Q22:1 Do you think weekly number of distinct users is a good measure of data warehouse use?
Poland 2 rather yes 22
Q22:1 Do you think weekly number of distinct users is a good measure of data warehouse use?
Poland 3 neutral 1
Q22:1 Do you think weekly number of distinct users is a good measure of data warehouse use?
Poland 4 rather not 17
Q22:1 Do you think weekly number of distinct users is a good measure of data warehouse use?
Portugal 1 definitely yes 1
Q22:1 Do you think weekly number of distinct users is a good measure of data warehouse use?
Sweden 2 rather yes 1
Q22:1 Do you think weekly number of distinct users is a good measure of data warehouse use?
Sweden 3 neutral 1
Q22:1 Do you think weekly number of distinct users is a good measure of data warehouse use?
UK 2 rather yes 1
Q22:1 Do you think weekly number of distinct users is a good measure of data warehouse use?
USA 1 definitely yes 2
Q22:1 Do you think weekly number of distinct users is a good measure of data warehouse use?
USA 3 neutral 1
Q22:1 Do you think weekly number of distinct users is a good measure of data warehouse use?
USA 4 rather not 1
Q22:1 Do you think weekly number of distinct users is a good measure of data warehouse use?
Worldwide 2 rather yes 1
Q22:1 Do you think weekly number of distinct users is a good measure of data warehouse use?
Worldwide 3 neutral 1
Q22:2 Do you think weekly number of queries submitted is a good measure of data warehouse
Byelorussia 2 rather yes 1
Q22:2 Do you think weekly number of queries submitted is a good measure of data warehouse
EMEA 2 rather yes 2
Q22:2 Do you think weekly number of queries submitted is a good measure of data warehouse
Finland 3 neutral 1
Q22:2 Do you think weekly number of queries submitted is a good measure of data warehouse
India 2 rather yes 1
Q22:2 Do you think weekly number of queries submitted is a good measure of data warehouse
Italy 3 neutral 1
Q22:2 Do you think weekly number of queries submitted is a good measure of data warehouse
Netherlands 2 rather yes 1
Q22:2 Do you think weekly number of queries submitted is a good measure of data warehouse
Netherlands 4 rather not 2
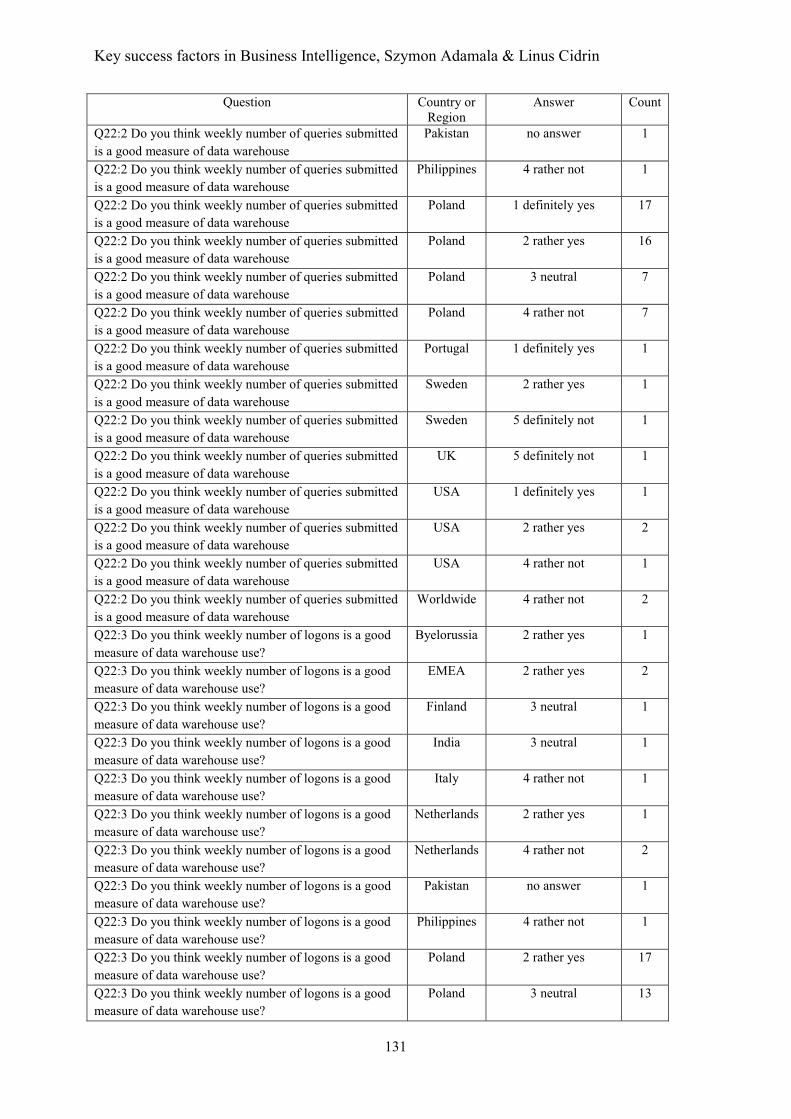
Key success factors in Business Intelligence, Szymon Adamala & Linus Cidrin
131
Question Country or Region
Answer Count
Q22:2 Do you think weekly number of queries submitted is a good measure of data warehouse
Pakistan no answer 1
Q22:2 Do you think weekly number of queries submitted is a good measure of data warehouse
Philippines 4 rather not 1
Q22:2 Do you think weekly number of queries submitted is a good measure of data warehouse
Poland 1 definitely yes 17
Q22:2 Do you think weekly number of queries submitted is a good measure of data warehouse
Poland 2 rather yes 16
Q22:2 Do you think weekly number of queries submitted is a good measure of data warehouse
Poland 3 neutral 7
Q22:2 Do you think weekly number of queries submitted is a good measure of data warehouse
Poland 4 rather not 7
Q22:2 Do you think weekly number of queries submitted is a good measure of data warehouse
Portugal 1 definitely yes 1
Q22:2 Do you think weekly number of queries submitted is a good measure of data warehouse
Sweden 2 rather yes 1
Q22:2 Do you think weekly number of queries submitted is a good measure of data warehouse
Sweden 5 definitely not 1
Q22:2 Do you think weekly number of queries submitted is a good measure of data warehouse
UK 5 definitely not 1
Q22:2 Do you think weekly number of queries submitted is a good measure of data warehouse
USA 1 definitely yes 1
Q22:2 Do you think weekly number of queries submitted is a good measure of data warehouse
USA 2 rather yes 2
Q22:2 Do you think weekly number of queries submitted is a good measure of data warehouse
USA 4 rather not 1
Q22:2 Do you think weekly number of queries submitted is a good measure of data warehouse
Worldwide 4 rather not 2
Q22:3 Do you think weekly number of logons is a good measure of data warehouse use?
Byelorussia 2 rather yes 1
Q22:3 Do you think weekly number of logons is a good measure of data warehouse use?
EMEA 2 rather yes 2
Q22:3 Do you think weekly number of logons is a good measure of data warehouse use?
Finland 3 neutral 1
Q22:3 Do you think weekly number of logons is a good measure of data warehouse use?
India 3 neutral 1
Q22:3 Do you think weekly number of logons is a good measure of data warehouse use?
Italy 4 rather not 1
Q22:3 Do you think weekly number of logons is a good measure of data warehouse use?
Netherlands 2 rather yes 1
Q22:3 Do you think weekly number of logons is a good measure of data warehouse use?
Netherlands 4 rather not 2
Q22:3 Do you think weekly number of logons is a good measure of data warehouse use?
Pakistan no answer 1
Q22:3 Do you think weekly number of logons is a good measure of data warehouse use?
Philippines 4 rather not 1
Q22:3 Do you think weekly number of logons is a good measure of data warehouse use?
Poland 2 rather yes 17
Q22:3 Do you think weekly number of logons is a good measure of data warehouse use?
Poland 3 neutral 13
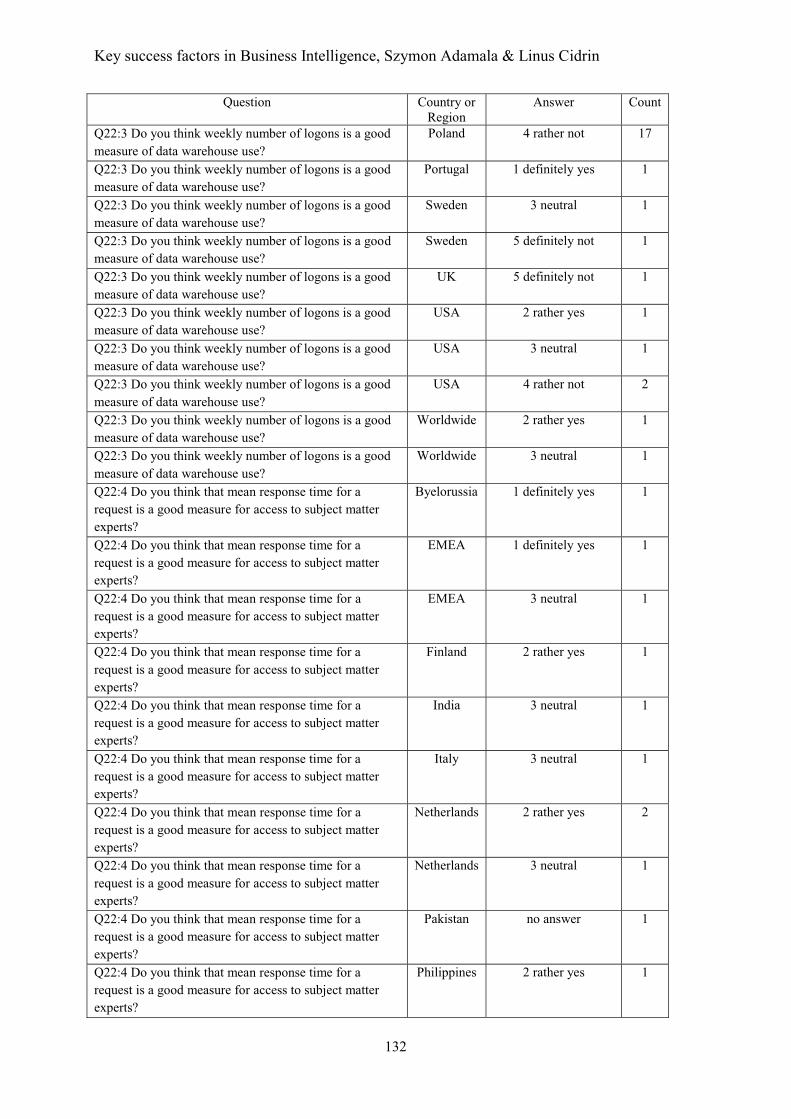
Key success factors in Business Intelligence, Szymon Adamala & Linus Cidrin
132
Question Country or Region
Answer Count
Q22:3 Do you think weekly number of logons is a good measure of data warehouse use?
Poland 4 rather not 17
Q22:3 Do you think weekly number of logons is a good measure of data warehouse use?
Portugal 1 definitely yes 1
Q22:3 Do you think weekly number of logons is a good measure of data warehouse use?
Sweden 3 neutral 1
Q22:3 Do you think weekly number of logons is a good measure of data warehouse use?
Sweden 5 definitely not 1
Q22:3 Do you think weekly number of logons is a good measure of data warehouse use?
UK 5 definitely not 1
Q22:3 Do you think weekly number of logons is a good measure of data warehouse use?
USA 2 rather yes 1
Q22:3 Do you think weekly number of logons is a good measure of data warehouse use?
USA 3 neutral 1
Q22:3 Do you think weekly number of logons is a good measure of data warehouse use?
USA 4 rather not 2
Q22:3 Do you think weekly number of logons is a good measure of data warehouse use?
Worldwide 2 rather yes 1
Q22:3 Do you think weekly number of logons is a good measure of data warehouse use?
Worldwide 3 neutral 1
Q22:4 Do you think that mean response time for a request is a good measure for access to subject matter experts?
Byelorussia 1 definitely yes 1
Q22:4 Do you think that mean response time for a request is a good measure for access to subject matter experts?
EMEA 1 definitely yes 1
Q22:4 Do you think that mean response time for a request is a good measure for access to subject matter experts?
EMEA 3 neutral 1
Q22:4 Do you think that mean response time for a request is a good measure for access to subject matter experts?
Finland 2 rather yes 1
Q22:4 Do you think that mean response time for a request is a good measure for access to subject matter experts?
India 3 neutral 1
Q22:4 Do you think that mean response time for a request is a good measure for access to subject matter experts?
Italy 3 neutral 1
Q22:4 Do you think that mean response time for a request is a good measure for access to subject matter experts?
Netherlands 2 rather yes 2
Q22:4 Do you think that mean response time for a request is a good measure for access to subject matter experts?
Netherlands 3 neutral 1
Q22:4 Do you think that mean response time for a request is a good measure for access to subject matter experts?
Pakistan no answer 1
Q22:4 Do you think that mean response time for a request is a good measure for access to subject matter experts?
Philippines 2 rather yes 1
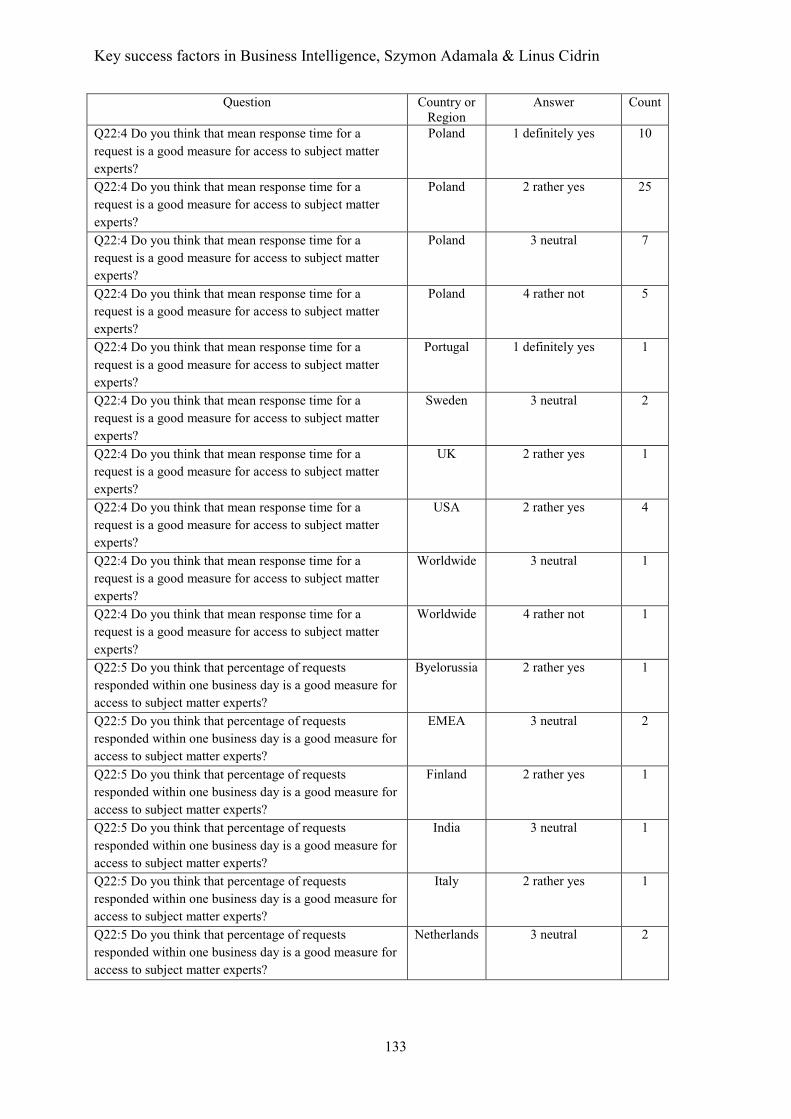
Key success factors in Business Intelligence, Szymon Adamala & Linus Cidrin
133
Question Country or Region
Answer Count
Q22:4 Do you think that mean response time for a request is a good measure for access to subject matter experts?
Poland 1 definitely yes 10
Q22:4 Do you think that mean response time for a request is a good measure for access to subject matter experts?
Poland 2 rather yes 25
Q22:4 Do you think that mean response time for a request is a good measure for access to subject matter experts?
Poland 3 neutral 7
Q22:4 Do you think that mean response time for a request is a good measure for access to subject matter experts?
Poland 4 rather not 5
Q22:4 Do you think that mean response time for a request is a good measure for access to subject matter experts?
Portugal 1 definitely yes 1
Q22:4 Do you think that mean response time for a request is a good measure for access to subject matter experts?
Sweden 3 neutral 2
Q22:4 Do you think that mean response time for a request is a good measure for access to subject matter experts?
UK 2 rather yes 1
Q22:4 Do you think that mean response time for a request is a good measure for access to subject matter experts?
USA 2 rather yes 4
Q22:4 Do you think that mean response time for a request is a good measure for access to subject matter experts?
Worldwide 3 neutral 1
Q22:4 Do you think that mean response time for a request is a good measure for access to subject matter experts?
Worldwide 4 rather not 1
Q22:5 Do you think that percentage of requests responded within one business day is a good measure for access to subject matter experts?
Byelorussia 2 rather yes 1
Q22:5 Do you think that percentage of requests responded within one business day is a good measure for access to subject matter experts?
EMEA 3 neutral 2
Q22:5 Do you think that percentage of requests responded within one business day is a good measure for access to subject matter experts?
Finland 2 rather yes 1
Q22:5 Do you think that percentage of requests responded within one business day is a good measure for access to subject matter experts?
India 3 neutral 1
Q22:5 Do you think that percentage of requests responded within one business day is a good measure for access to subject matter experts?
Italy 2 rather yes 1
Q22:5 Do you think that percentage of requests responded within one business day is a good measure for access to subject matter experts?
Netherlands 3 neutral 2
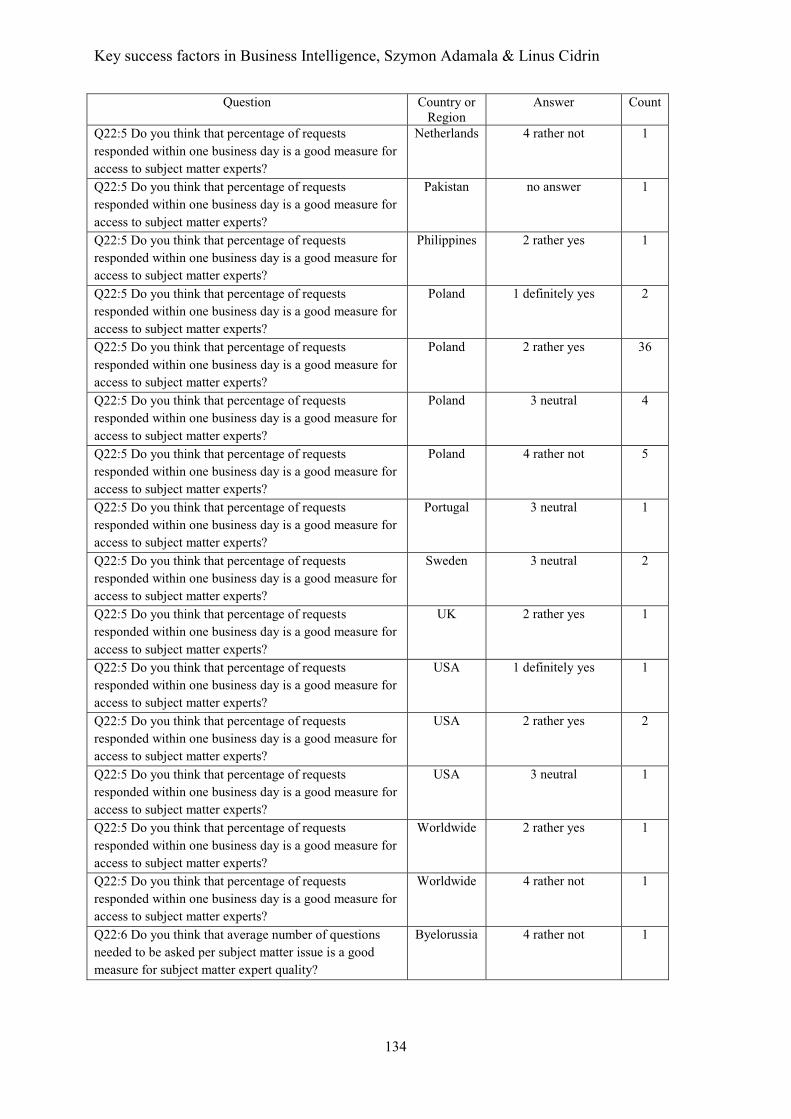
Key success factors in Business Intelligence, Szymon Adamala & Linus Cidrin
134
Question Country or Region
Answer Count
Q22:5 Do you think that percentage of requests responded within one business day is a good measure for access to subject matter experts?
Netherlands 4 rather not 1
Q22:5 Do you think that percentage of requests responded within one business day is a good measure for access to subject matter experts?
Pakistan no answer 1
Q22:5 Do you think that percentage of requests responded within one business day is a good measure for access to subject matter experts?
Philippines 2 rather yes 1
Q22:5 Do you think that percentage of requests responded within one business day is a good measure for access to subject matter experts?
Poland 1 definitely yes 2
Q22:5 Do you think that percentage of requests responded within one business day is a good measure for access to subject matter experts?
Poland 2 rather yes 36
Q22:5 Do you think that percentage of requests responded within one business day is a good measure for access to subject matter experts?
Poland 3 neutral 4
Q22:5 Do you think that percentage of requests responded within one business day is a good measure for access to subject matter experts?
Poland 4 rather not 5
Q22:5 Do you think that percentage of requests responded within one business day is a good measure for access to subject matter experts?
Portugal 3 neutral 1
Q22:5 Do you think that percentage of requests responded within one business day is a good measure for access to subject matter experts?
Sweden 3 neutral 2
Q22:5 Do you think that percentage of requests responded within one business day is a good measure for access to subject matter experts?
UK 2 rather yes 1
Q22:5 Do you think that percentage of requests responded within one business day is a good measure for access to subject matter experts?
USA 1 definitely yes 1
Q22:5 Do you think that percentage of requests responded within one business day is a good measure for access to subject matter experts?
USA 2 rather yes 2
Q22:5 Do you think that percentage of requests responded within one business day is a good measure for access to subject matter experts?
USA 3 neutral 1
Q22:5 Do you think that percentage of requests responded within one business day is a good measure for access to subject matter experts?
Worldwide 2 rather yes 1
Q22:5 Do you think that percentage of requests responded within one business day is a good measure for access to subject matter experts?
Worldwide 4 rather not 1
Q22:6 Do you think that average number of questions needed to be asked per subject matter issue is a good measure for subject matter expert quality?
Byelorussia 4 rather not 1
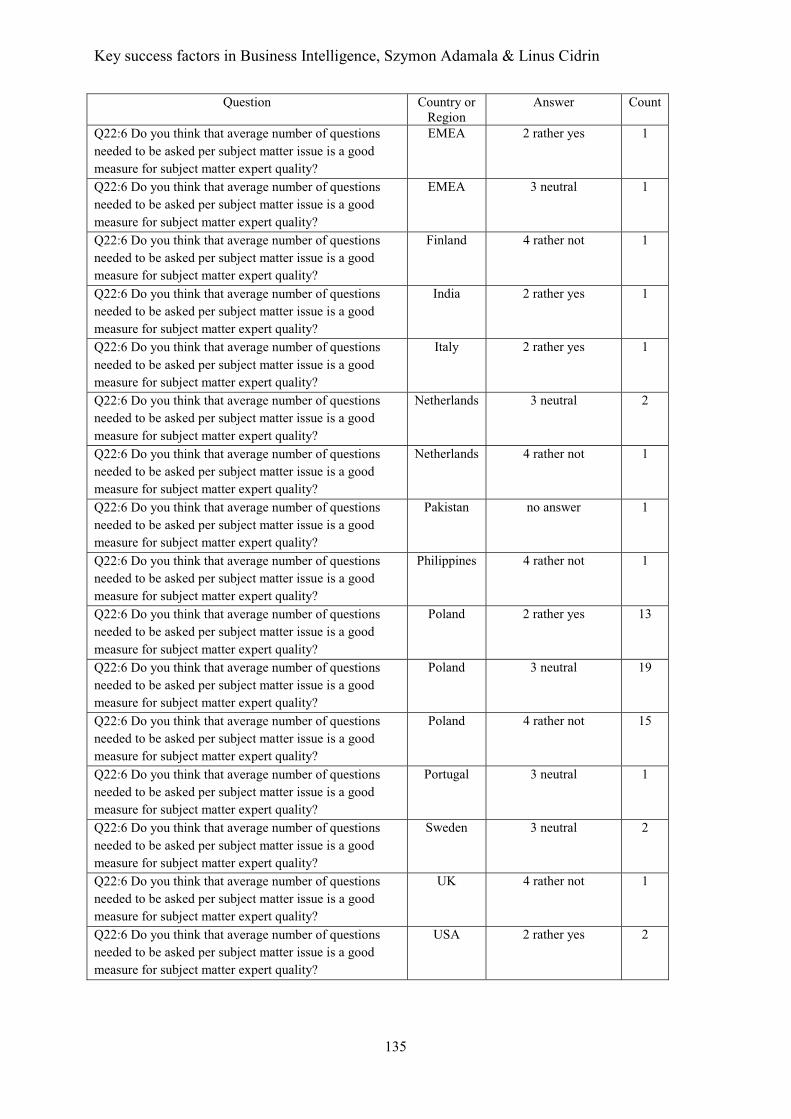
Key success factors in Business Intelligence, Szymon Adamala & Linus Cidrin
135
Question Country or Region
Answer Count
Q22:6 Do you think that average number of questions needed to be asked per subject matter issue is a good measure for subject matter expert quality?
EMEA 2 rather yes 1
Q22:6 Do you think that average number of questions needed to be asked per subject matter issue is a good measure for subject matter expert quality?
EMEA 3 neutral 1
Q22:6 Do you think that average number of questions needed to be asked per subject matter issue is a good measure for subject matter expert quality?
Finland 4 rather not 1
Q22:6 Do you think that average number of questions needed to be asked per subject matter issue is a good measure for subject matter expert quality?
India 2 rather yes 1
Q22:6 Do you think that average number of questions needed to be asked per subject matter issue is a good measure for subject matter expert quality?
Italy 2 rather yes 1
Q22:6 Do you think that average number of questions needed to be asked per subject matter issue is a good measure for subject matter expert quality?
Netherlands 3 neutral 2
Q22:6 Do you think that average number of questions needed to be asked per subject matter issue is a good measure for subject matter expert quality?
Netherlands 4 rather not 1
Q22:6 Do you think that average number of questions needed to be asked per subject matter issue is a good measure for subject matter expert quality?
Pakistan no answer 1
Q22:6 Do you think that average number of questions needed to be asked per subject matter issue is a good measure for subject matter expert quality?
Philippines 4 rather not 1
Q22:6 Do you think that average number of questions needed to be asked per subject matter issue is a good measure for subject matter expert quality?
Poland 2 rather yes 13
Q22:6 Do you think that average number of questions needed to be asked per subject matter issue is a good measure for subject matter expert quality?
Poland 3 neutral 19
Q22:6 Do you think that average number of questions needed to be asked per subject matter issue is a good measure for subject matter expert quality?
Poland 4 rather not 15
Q22:6 Do you think that average number of questions needed to be asked per subject matter issue is a good measure for subject matter expert quality?
Portugal 3 neutral 1
Q22:6 Do you think that average number of questions needed to be asked per subject matter issue is a good measure for subject matter expert quality?
Sweden 3 neutral 2
Q22:6 Do you think that average number of questions needed to be asked per subject matter issue is a good measure for subject matter expert quality?
UK 4 rather not 1
Q22:6 Do you think that average number of questions needed to be asked per subject matter issue is a good measure for subject matter expert quality?
USA 2 rather yes 2
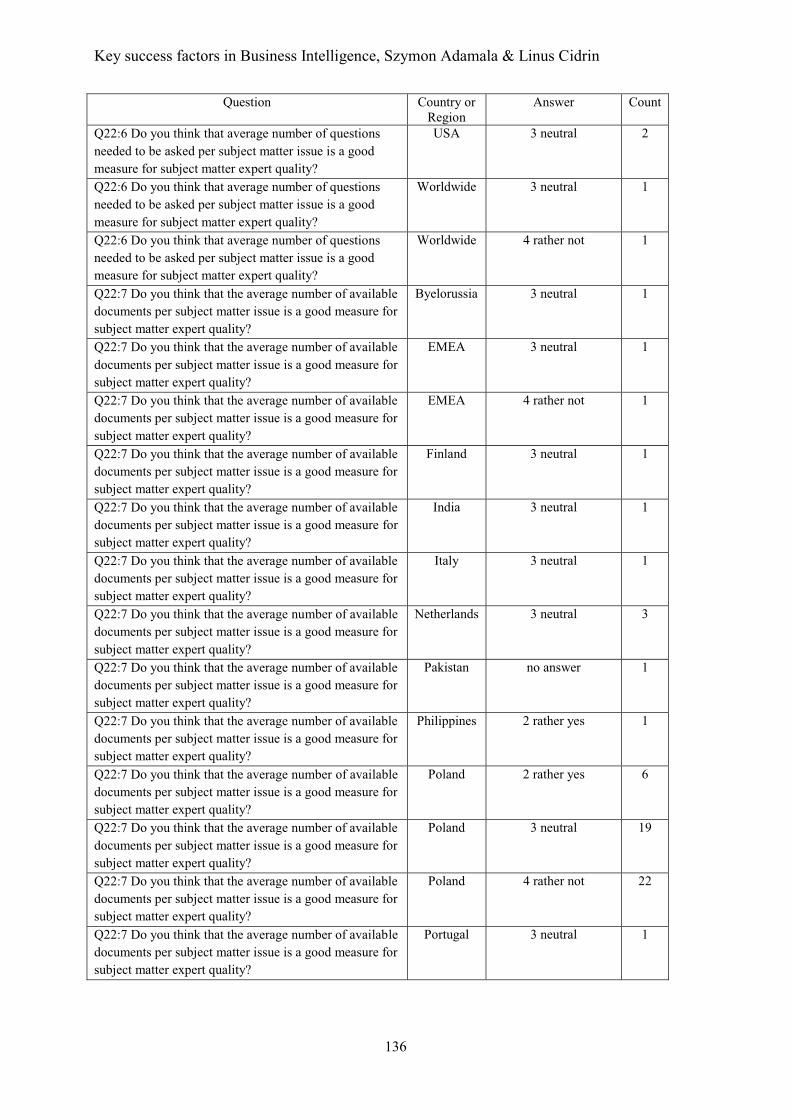
Key success factors in Business Intelligence, Szymon Adamala & Linus Cidrin
136
Question Country or Region
Answer Count
Q22:6 Do you think that average number of questions needed to be asked per subject matter issue is a good measure for subject matter expert quality?
USA 3 neutral 2
Q22:6 Do you think that average number of questions needed to be asked per subject matter issue is a good measure for subject matter expert quality?
Worldwide 3 neutral 1
Q22:6 Do you think that average number of questions needed to be asked per subject matter issue is a good measure for subject matter expert quality?
Worldwide 4 rather not 1
Q22:7 Do you think that the average number of available documents per subject matter issue is a good measure for subject matter expert quality?
Byelorussia 3 neutral 1
Q22:7 Do you think that the average number of available documents per subject matter issue is a good measure for subject matter expert quality?
EMEA 3 neutral 1
Q22:7 Do you think that the average number of available documents per subject matter issue is a good measure for subject matter expert quality?
EMEA 4 rather not 1
Q22:7 Do you think that the average number of available documents per subject matter issue is a good measure for subject matter expert quality?
Finland 3 neutral 1
Q22:7 Do you think that the average number of available documents per subject matter issue is a good measure for subject matter expert quality?
India 3 neutral 1
Q22:7 Do you think that the average number of available documents per subject matter issue is a good measure for subject matter expert quality?
Italy 3 neutral 1
Q22:7 Do you think that the average number of available documents per subject matter issue is a good measure for subject matter expert quality?
Netherlands 3 neutral 3
Q22:7 Do you think that the average number of available documents per subject matter issue is a good measure for subject matter expert quality?
Pakistan no answer 1
Q22:7 Do you think that the average number of available documents per subject matter issue is a good measure for subject matter expert quality?
Philippines 2 rather yes 1
Q22:7 Do you think that the average number of available documents per subject matter issue is a good measure for subject matter expert quality?
Poland 2 rather yes 6
Q22:7 Do you think that the average number of available documents per subject matter issue is a good measure for subject matter expert quality?
Poland 3 neutral 19
Q22:7 Do you think that the average number of available documents per subject matter issue is a good measure for subject matter expert quality?
Poland 4 rather not 22
Q22:7 Do you think that the average number of available documents per subject matter issue is a good measure for subject matter expert quality?
Portugal 3 neutral 1
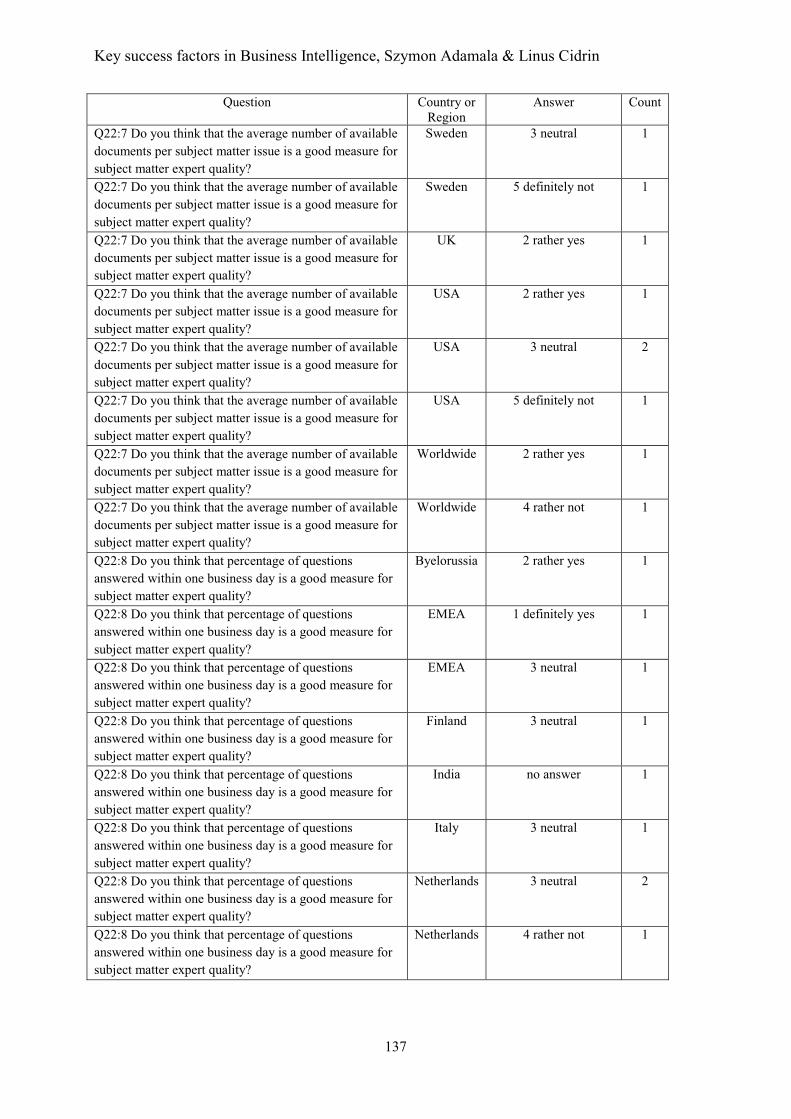
Key success factors in Business Intelligence, Szymon Adamala & Linus Cidrin
137
Question Country or Region
Answer Count
Q22:7 Do you think that the average number of available documents per subject matter issue is a good measure for subject matter expert quality?
Sweden 3 neutral 1
Q22:7 Do you think that the average number of available documents per subject matter issue is a good measure for subject matter expert quality?
Sweden 5 definitely not 1
Q22:7 Do you think that the average number of available documents per subject matter issue is a good measure for subject matter expert quality?
UK 2 rather yes 1
Q22:7 Do you think that the average number of available documents per subject matter issue is a good measure for subject matter expert quality?
USA 2 rather yes 1
Q22:7 Do you think that the average number of available documents per subject matter issue is a good measure for subject matter expert quality?
USA 3 neutral 2
Q22:7 Do you think that the average number of available documents per subject matter issue is a good measure for subject matter expert quality?
USA 5 definitely not 1
Q22:7 Do you think that the average number of available documents per subject matter issue is a good measure for subject matter expert quality?
Worldwide 2 rather yes 1
Q22:7 Do you think that the average number of available documents per subject matter issue is a good measure for subject matter expert quality?
Worldwide 4 rather not 1
Q22:8 Do you think that percentage of questions answered within one business day is a good measure for subject matter expert quality?
Byelorussia 2 rather yes 1
Q22:8 Do you think that percentage of questions answered within one business day is a good measure for subject matter expert quality?
EMEA 1 definitely yes 1
Q22:8 Do you think that percentage of questions answered within one business day is a good measure for subject matter expert quality?
EMEA 3 neutral 1
Q22:8 Do you think that percentage of questions answered within one business day is a good measure for subject matter expert quality?
Finland 3 neutral 1
Q22:8 Do you think that percentage of questions answered within one business day is a good measure for subject matter expert quality?
India no answer 1
Q22:8 Do you think that percentage of questions answered within one business day is a good measure for subject matter expert quality?
Italy 3 neutral 1
Q22:8 Do you think that percentage of questions answered within one business day is a good measure for subject matter expert quality?
Netherlands 3 neutral 2
Q22:8 Do you think that percentage of questions answered within one business day is a good measure for subject matter expert quality?
Netherlands 4 rather not 1
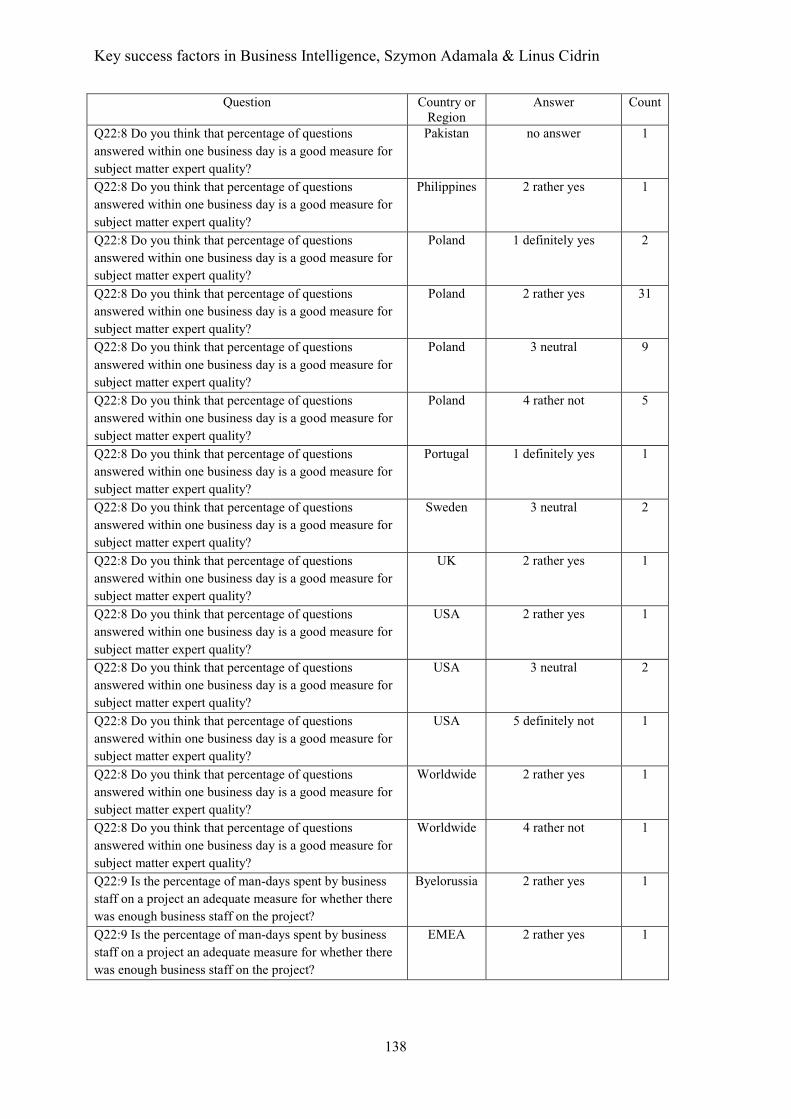
Key success factors in Business Intelligence, Szymon Adamala & Linus Cidrin
138
Question Country or Region
Answer Count
Q22:8 Do you think that percentage of questions answered within one business day is a good measure for subject matter expert quality?
Pakistan no answer 1
Q22:8 Do you think that percentage of questions answered within one business day is a good measure for subject matter expert quality?
Philippines 2 rather yes 1
Q22:8 Do you think that percentage of questions answered within one business day is a good measure for subject matter expert quality?
Poland 1 definitely yes 2
Q22:8 Do you think that percentage of questions answered within one business day is a good measure for subject matter expert quality?
Poland 2 rather yes 31
Q22:8 Do you think that percentage of questions answered within one business day is a good measure for subject matter expert quality?
Poland 3 neutral 9
Q22:8 Do you think that percentage of questions answered within one business day is a good measure for subject matter expert quality?
Poland 4 rather not 5
Q22:8 Do you think that percentage of questions answered within one business day is a good measure for subject matter expert quality?
Portugal 1 definitely yes 1
Q22:8 Do you think that percentage of questions answered within one business day is a good measure for subject matter expert quality?
Sweden 3 neutral 2
Q22:8 Do you think that percentage of questions answered within one business day is a good measure for subject matter expert quality?
UK 2 rather yes 1
Q22:8 Do you think that percentage of questions answered within one business day is a good measure for subject matter expert quality?
USA 2 rather yes 1
Q22:8 Do you think that percentage of questions answered within one business day is a good measure for subject matter expert quality?
USA 3 neutral 2
Q22:8 Do you think that percentage of questions answered within one business day is a good measure for subject matter expert quality?
USA 5 definitely not 1
Q22:8 Do you think that percentage of questions answered within one business day is a good measure for subject matter expert quality?
Worldwide 2 rather yes 1
Q22:8 Do you think that percentage of questions answered within one business day is a good measure for subject matter expert quality?
Worldwide 4 rather not 1
Q22:9 Is the percentage of man-days spent by business staff on a project an adequate measure for whether there was enough business staff on the project?
Byelorussia 2 rather yes 1
Q22:9 Is the percentage of man-days spent by business staff on a project an adequate measure for whether there was enough business staff on the project?
EMEA 2 rather yes 1
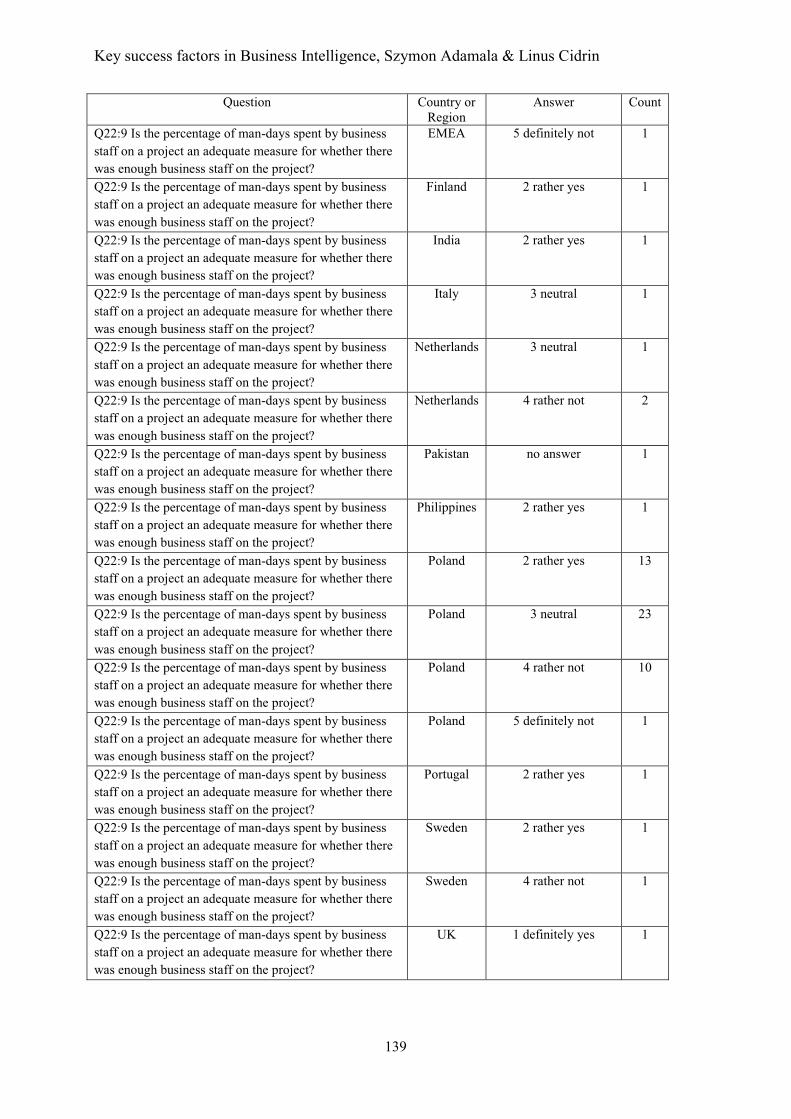
Key success factors in Business Intelligence, Szymon Adamala & Linus Cidrin
139
Question Country or Region
Answer Count
Q22:9 Is the percentage of man-days spent by business staff on a project an adequate measure for whether there was enough business staff on the project?
EMEA 5 definitely not 1
Q22:9 Is the percentage of man-days spent by business staff on a project an adequate measure for whether there was enough business staff on the project?
Finland 2 rather yes 1
Q22:9 Is the percentage of man-days spent by business staff on a project an adequate measure for whether there was enough business staff on the project?
India 2 rather yes 1
Q22:9 Is the percentage of man-days spent by business staff on a project an adequate measure for whether there was enough business staff on the project?
Italy 3 neutral 1
Q22:9 Is the percentage of man-days spent by business staff on a project an adequate measure for whether there was enough business staff on the project?
Netherlands 3 neutral 1
Q22:9 Is the percentage of man-days spent by business staff on a project an adequate measure for whether there was enough business staff on the project?
Netherlands 4 rather not 2
Q22:9 Is the percentage of man-days spent by business staff on a project an adequate measure for whether there was enough business staff on the project?
Pakistan no answer 1
Q22:9 Is the percentage of man-days spent by business staff on a project an adequate measure for whether there was enough business staff on the project?
Philippines 2 rather yes 1
Q22:9 Is the percentage of man-days spent by business staff on a project an adequate measure for whether there was enough business staff on the project?
Poland 2 rather yes 13
Q22:9 Is the percentage of man-days spent by business staff on a project an adequate measure for whether there was enough business staff on the project?
Poland 3 neutral 23
Q22:9 Is the percentage of man-days spent by business staff on a project an adequate measure for whether there was enough business staff on the project?
Poland 4 rather not 10
Q22:9 Is the percentage of man-days spent by business staff on a project an adequate measure for whether there was enough business staff on the project?
Poland 5 definitely not 1
Q22:9 Is the percentage of man-days spent by business staff on a project an adequate measure for whether there was enough business staff on the project?
Portugal 2 rather yes 1
Q22:9 Is the percentage of man-days spent by business staff on a project an adequate measure for whether there was enough business staff on the project?
Sweden 2 rather yes 1
Q22:9 Is the percentage of man-days spent by business staff on a project an adequate measure for whether there was enough business staff on the project?
Sweden 4 rather not 1
Q22:9 Is the percentage of man-days spent by business staff on a project an adequate measure for whether there was enough business staff on the project?
UK 1 definitely yes 1
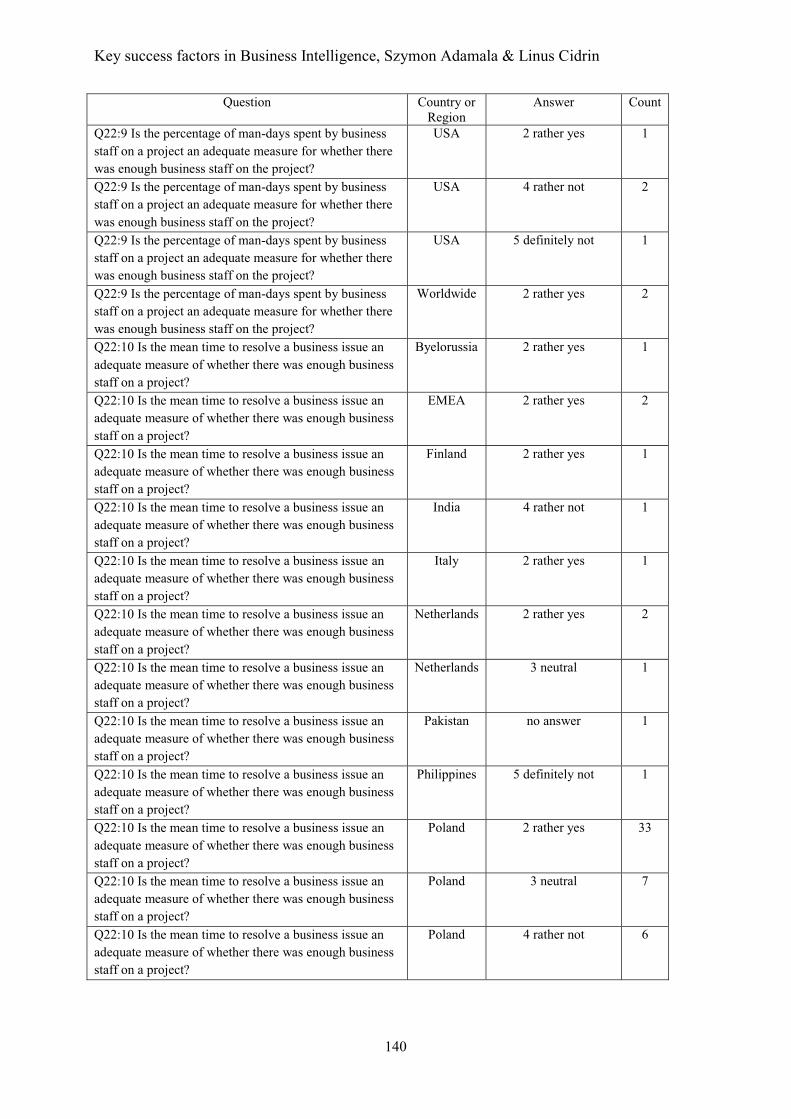
Key success factors in Business Intelligence, Szymon Adamala & Linus Cidrin
140
Question Country or Region
Answer Count
Q22:9 Is the percentage of man-days spent by business staff on a project an adequate measure for whether there was enough business staff on the project?
USA 2 rather yes 1
Q22:9 Is the percentage of man-days spent by business staff on a project an adequate measure for whether there was enough business staff on the project?
USA 4 rather not 2
Q22:9 Is the percentage of man-days spent by business staff on a project an adequate measure for whether there was enough business staff on the project?
USA 5 definitely not 1
Q22:9 Is the percentage of man-days spent by business staff on a project an adequate measure for whether there was enough business staff on the project?
Worldwide 2 rather yes 2
Q22:10 Is the mean time to resolve a business issue an adequate measure of whether there was enough business staff on a project?
Byelorussia 2 rather yes 1
Q22:10 Is the mean time to resolve a business issue an adequate measure of whether there was enough business staff on a project?
EMEA 2 rather yes 2
Q22:10 Is the mean time to resolve a business issue an adequate measure of whether there was enough business staff on a project?
Finland 2 rather yes 1
Q22:10 Is the mean time to resolve a business issue an adequate measure of whether there was enough business staff on a project?
India 4 rather not 1
Q22:10 Is the mean time to resolve a business issue an adequate measure of whether there was enough business staff on a project?
Italy 2 rather yes 1
Q22:10 Is the mean time to resolve a business issue an adequate measure of whether there was enough business staff on a project?
Netherlands 2 rather yes 2
Q22:10 Is the mean time to resolve a business issue an adequate measure of whether there was enough business staff on a project?
Netherlands 3 neutral 1
Q22:10 Is the mean time to resolve a business issue an adequate measure of whether there was enough business staff on a project?
Pakistan no answer 1
Q22:10 Is the mean time to resolve a business issue an adequate measure of whether there was enough business staff on a project?
Philippines 5 definitely not 1
Q22:10 Is the mean time to resolve a business issue an adequate measure of whether there was enough business staff on a project?
Poland 2 rather yes 33
Q22:10 Is the mean time to resolve a business issue an adequate measure of whether there was enough business staff on a project?
Poland 3 neutral 7
Q22:10 Is the mean time to resolve a business issue an adequate measure of whether there was enough business staff on a project?
Poland 4 rather not 6
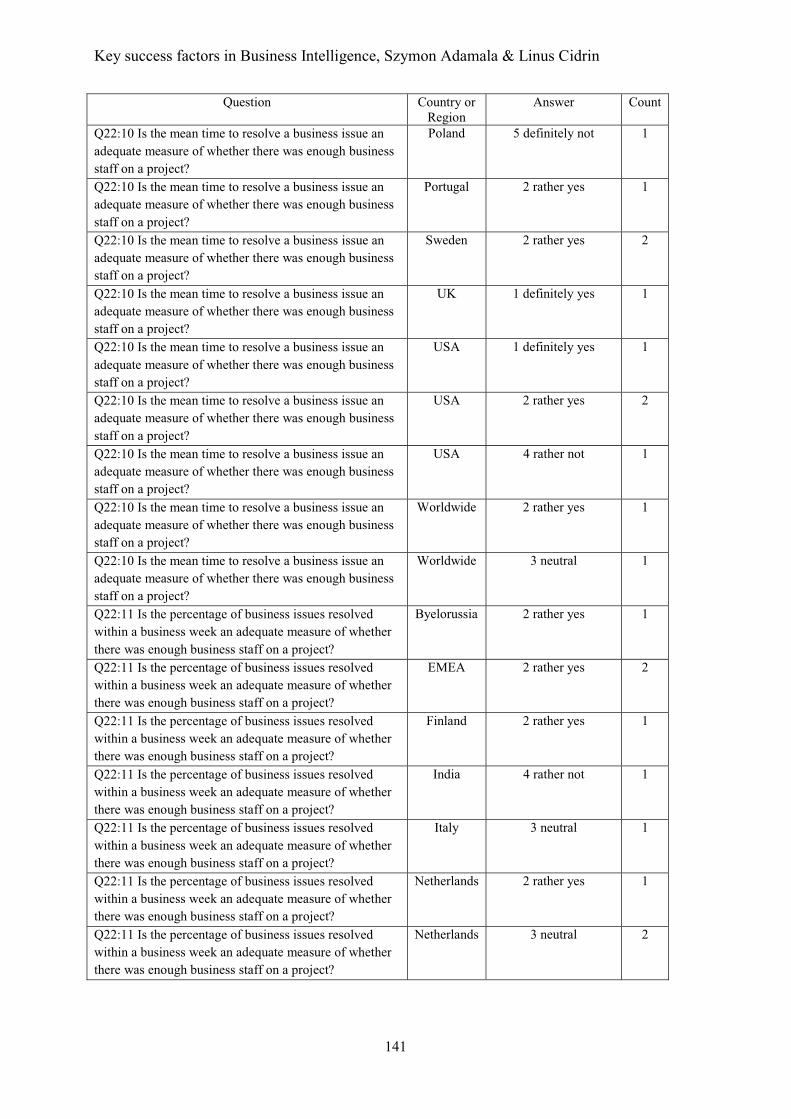
Key success factors in Business Intelligence, Szymon Adamala & Linus Cidrin
141
Question Country or Region
Answer Count
Q22:10 Is the mean time to resolve a business issue an adequate measure of whether there was enough business staff on a project?
Poland 5 definitely not 1
Q22:10 Is the mean time to resolve a business issue an adequate measure of whether there was enough business staff on a project?
Portugal 2 rather yes 1
Q22:10 Is the mean time to resolve a business issue an adequate measure of whether there was enough business staff on a project?
Sweden 2 rather yes 2
Q22:10 Is the mean time to resolve a business issue an adequate measure of whether there was enough business staff on a project?
UK 1 definitely yes 1
Q22:10 Is the mean time to resolve a business issue an adequate measure of whether there was enough business staff on a project?
USA 1 definitely yes 1
Q22:10 Is the mean time to resolve a business issue an adequate measure of whether there was enough business staff on a project?
USA 2 rather yes 2
Q22:10 Is the mean time to resolve a business issue an adequate measure of whether there was enough business staff on a project?
USA 4 rather not 1
Q22:10 Is the mean time to resolve a business issue an adequate measure of whether there was enough business staff on a project?
Worldwide 2 rather yes 1
Q22:10 Is the mean time to resolve a business issue an adequate measure of whether there was enough business staff on a project?
Worldwide 3 neutral 1
Q22:11 Is the percentage of business issues resolved within a business week an adequate measure of whether there was enough business staff on a project?
Byelorussia 2 rather yes 1
Q22:11 Is the percentage of business issues resolved within a business week an adequate measure of whether there was enough business staff on a project?
EMEA 2 rather yes 2
Q22:11 Is the percentage of business issues resolved within a business week an adequate measure of whether there was enough business staff on a project?
Finland 2 rather yes 1
Q22:11 Is the percentage of business issues resolved within a business week an adequate measure of whether there was enough business staff on a project?
India 4 rather not 1
Q22:11 Is the percentage of business issues resolved within a business week an adequate measure of whether there was enough business staff on a project?
Italy 3 neutral 1
Q22:11 Is the percentage of business issues resolved within a business week an adequate measure of whether there was enough business staff on a project?
Netherlands 2 rather yes 1
Q22:11 Is the percentage of business issues resolved within a business week an adequate measure of whether there was enough business staff on a project?
Netherlands 3 neutral 2
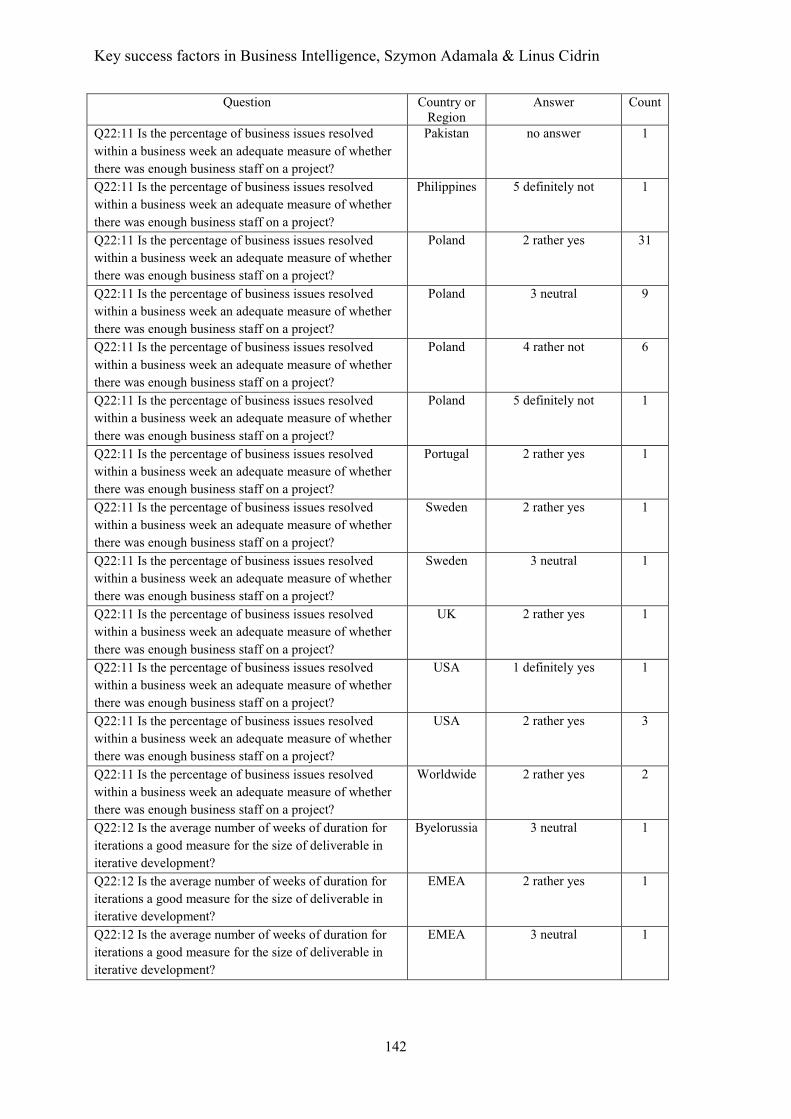
Key success factors in Business Intelligence, Szymon Adamala & Linus Cidrin
142
Question Country or Region
Answer Count
Q22:11 Is the percentage of business issues resolved within a business week an adequate measure of whether there was enough business staff on a project?
Pakistan no answer 1
Q22:11 Is the percentage of business issues resolved within a business week an adequate measure of whether there was enough business staff on a project?
Philippines 5 definitely not 1
Q22:11 Is the percentage of business issues resolved within a business week an adequate measure of whether there was enough business staff on a project?
Poland 2 rather yes 31
Q22:11 Is the percentage of business issues resolved within a business week an adequate measure of whether there was enough business staff on a project?
Poland 3 neutral 9
Q22:11 Is the percentage of business issues resolved within a business week an adequate measure of whether there was enough business staff on a project?
Poland 4 rather not 6
Q22:11 Is the percentage of business issues resolved within a business week an adequate measure of whether there was enough business staff on a project?
Poland 5 definitely not 1
Q22:11 Is the percentage of business issues resolved within a business week an adequate measure of whether there was enough business staff on a project?
Portugal 2 rather yes 1
Q22:11 Is the percentage of business issues resolved within a business week an adequate measure of whether there was enough business staff on a project?
Sweden 2 rather yes 1
Q22:11 Is the percentage of business issues resolved within a business week an adequate measure of whether there was enough business staff on a project?
Sweden 3 neutral 1
Q22:11 Is the percentage of business issues resolved within a business week an adequate measure of whether there was enough business staff on a project?
UK 2 rather yes 1
Q22:11 Is the percentage of business issues resolved within a business week an adequate measure of whether there was enough business staff on a project?
USA 1 definitely yes 1
Q22:11 Is the percentage of business issues resolved within a business week an adequate measure of whether there was enough business staff on a project?
USA 2 rather yes 3
Q22:11 Is the percentage of business issues resolved within a business week an adequate measure of whether there was enough business staff on a project?
Worldwide 2 rather yes 2
Q22:12 Is the average number of weeks of duration for iterations a good measure for the size of deliverable in iterative development?
Byelorussia 3 neutral 1
Q22:12 Is the average number of weeks of duration for iterations a good measure for the size of deliverable in iterative development?
EMEA 2 rather yes 1
Q22:12 Is the average number of weeks of duration for iterations a good measure for the size of deliverable in iterative development?
EMEA 3 neutral 1

Key success factors in Business Intelligence, Szymon Adamala & Linus Cidrin
143
Question Country or Region
Answer Count
Q22:12 Is the average number of weeks of duration for iterations a good measure for the size of deliverable in iterative development?
Finland 2 rather yes 1
Q22:12 Is the average number of weeks of duration for iterations a good measure for the size of deliverable in iterative development?
India 4 rather not 1
Q22:12 Is the average number of weeks of duration for iterations a good measure for the size of deliverable in iterative development?
Italy 3 neutral 1
Q22:12 Is the average number of weeks of duration for iterations a good measure for the size of deliverable in iterative development?
Netherlands 2 rather yes 1
Q22:12 Is the average number of weeks of duration for iterations a good measure for the size of deliverable in iterative development?
Netherlands 3 neutral 1
Q22:12 Is the average number of weeks of duration for iterations a good measure for the size of deliverable in iterative development?
Netherlands 4 rather not 1
Q22:12 Is the average number of weeks of duration for iterations a good measure for the size of deliverable in iterative development?
Pakistan no answer 1
Q22:12 Is the average number of weeks of duration for iterations a good measure for the size of deliverable in iterative development?
Philippines 5 definitely not 1
Q22:12 Is the average number of weeks of duration for iterations a good measure for the size of deliverable in iterative development?
Poland no answer 5
Q22:12 Is the average number of weeks of duration for iterations a good measure for the size of deliverable in iterative development?
Poland 1 definitely yes 1
Q22:12 Is the average number of weeks of duration for iterations a good measure for the size of deliverable in iterative development?
Poland 2 rather yes 15
Q22:12 Is the average number of weeks of duration for iterations a good measure for the size of deliverable in iterative development?
Poland 3 neutral 23
Q22:12 Is the average number of weeks of duration for iterations a good measure for the size of deliverable in iterative development?
Poland 4 rather not 3
Q22:12 Is the average number of weeks of duration for iterations a good measure for the size of deliverable in iterative development?
Portugal 3 neutral 1
Q22:12 Is the average number of weeks of duration for iterations a good measure for the size of deliverable in iterative development?
Sweden 2 rather yes 2
Q22:12 Is the average number of weeks of duration for iterations a good measure for the size of deliverable in iterative development?
UK 2 rather yes 1
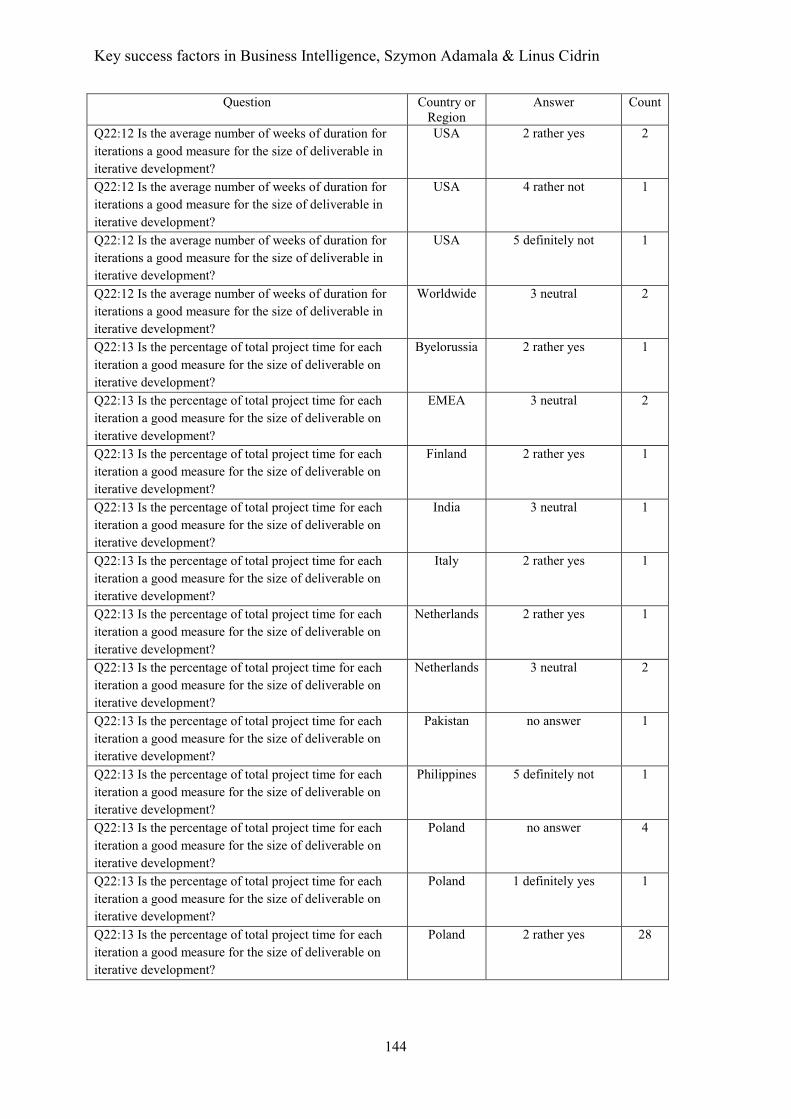
Key success factors in Business Intelligence, Szymon Adamala & Linus Cidrin
144
Question Country or Region
Answer Count
Q22:12 Is the average number of weeks of duration for iterations a good measure for the size of deliverable in iterative development?
USA 2 rather yes 2
Q22:12 Is the average number of weeks of duration for iterations a good measure for the size of deliverable in iterative development?
USA 4 rather not 1
Q22:12 Is the average number of weeks of duration for iterations a good measure for the size of deliverable in iterative development?
USA 5 definitely not 1
Q22:12 Is the average number of weeks of duration for iterations a good measure for the size of deliverable in iterative development?
Worldwide 3 neutral 2
Q22:13 Is the percentage of total project time for each iteration a good measure for the size of deliverable on iterative development?
Byelorussia 2 rather yes 1
Q22:13 Is the percentage of total project time for each iteration a good measure for the size of deliverable on iterative development?
EMEA 3 neutral 2
Q22:13 Is the percentage of total project time for each iteration a good measure for the size of deliverable on iterative development?
Finland 2 rather yes 1
Q22:13 Is the percentage of total project time for each iteration a good measure for the size of deliverable on iterative development?
India 3 neutral 1
Q22:13 Is the percentage of total project time for each iteration a good measure for the size of deliverable on iterative development?
Italy 2 rather yes 1
Q22:13 Is the percentage of total project time for each iteration a good measure for the size of deliverable on iterative development?
Netherlands 2 rather yes 1
Q22:13 Is the percentage of total project time for each iteration a good measure for the size of deliverable on iterative development?
Netherlands 3 neutral 2
Q22:13 Is the percentage of total project time for each iteration a good measure for the size of deliverable on iterative development?
Pakistan no answer 1
Q22:13 Is the percentage of total project time for each iteration a good measure for the size of deliverable on iterative development?
Philippines 5 definitely not 1
Q22:13 Is the percentage of total project time for each iteration a good measure for the size of deliverable on iterative development?
Poland no answer 4
Q22:13 Is the percentage of total project time for each iteration a good measure for the size of deliverable on iterative development?
Poland 1 definitely yes 1
Q22:13 Is the percentage of total project time for each iteration a good measure for the size of deliverable on iterative development?
Poland 2 rather yes 28
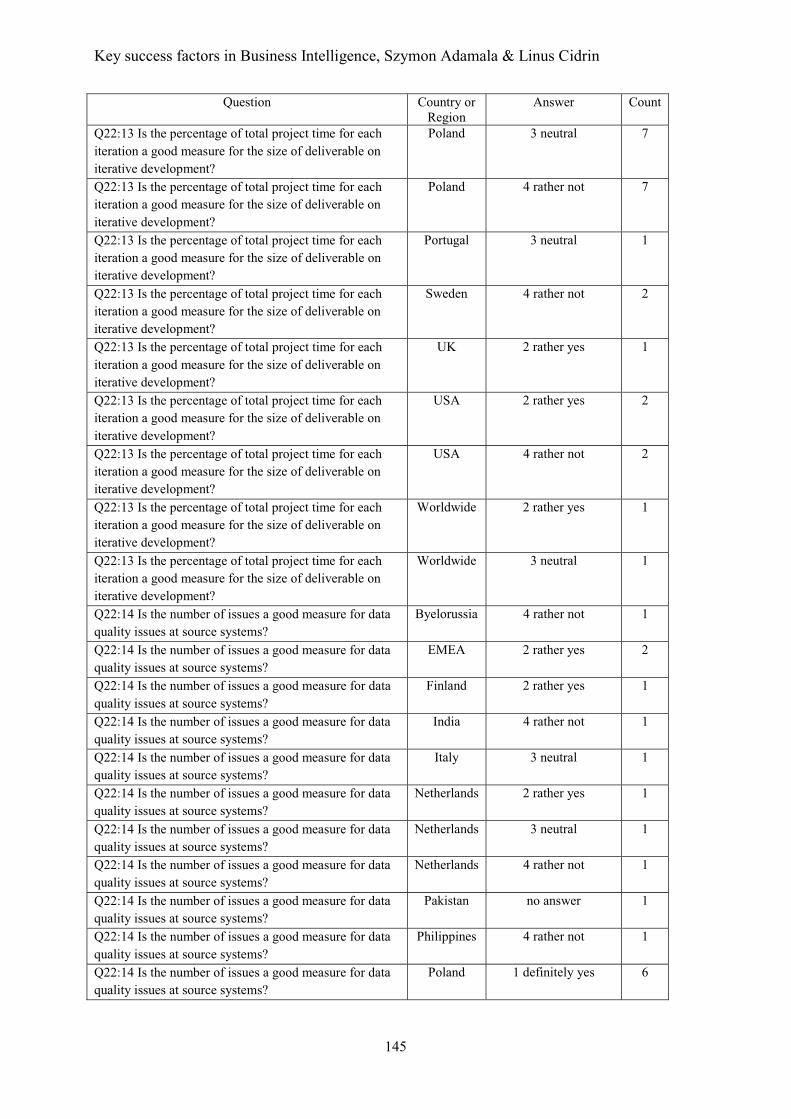
Key success factors in Business Intelligence, Szymon Adamala & Linus Cidrin
145
Question Country or Region
Answer Count
Q22:13 Is the percentage of total project time for each iteration a good measure for the size of deliverable on iterative development?
Poland 3 neutral 7
Q22:13 Is the percentage of total project time for each iteration a good measure for the size of deliverable on iterative development?
Poland 4 rather not 7
Q22:13 Is the percentage of total project time for each iteration a good measure for the size of deliverable on iterative development?
Portugal 3 neutral 1
Q22:13 Is the percentage of total project time for each iteration a good measure for the size of deliverable on iterative development?
Sweden 4 rather not 2
Q22:13 Is the percentage of total project time for each iteration a good measure for the size of deliverable on iterative development?
UK 2 rather yes 1
Q22:13 Is the percentage of total project time for each iteration a good measure for the size of deliverable on iterative development?
USA 2 rather yes 2
Q22:13 Is the percentage of total project time for each iteration a good measure for the size of deliverable on iterative development?
USA 4 rather not 2
Q22:13 Is the percentage of total project time for each iteration a good measure for the size of deliverable on iterative development?
Worldwide 2 rather yes 1
Q22:13 Is the percentage of total project time for each iteration a good measure for the size of deliverable on iterative development?
Worldwide 3 neutral 1
Q22:14 Is the number of issues a good measure for data quality issues at source systems?
Byelorussia 4 rather not 1
Q22:14 Is the number of issues a good measure for data quality issues at source systems?
EMEA 2 rather yes 2
Q22:14 Is the number of issues a good measure for data quality issues at source systems?
Finland 2 rather yes 1
Q22:14 Is the number of issues a good measure for data quality issues at source systems?
India 4 rather not 1
Q22:14 Is the number of issues a good measure for data quality issues at source systems?
Italy 3 neutral 1
Q22:14 Is the number of issues a good measure for data quality issues at source systems?
Netherlands 2 rather yes 1
Q22:14 Is the number of issues a good measure for data quality issues at source systems?
Netherlands 3 neutral 1
Q22:14 Is the number of issues a good measure for data quality issues at source systems?
Netherlands 4 rather not 1
Q22:14 Is the number of issues a good measure for data quality issues at source systems?
Pakistan no answer 1
Q22:14 Is the number of issues a good measure for data quality issues at source systems?
Philippines 4 rather not 1
Q22:14 Is the number of issues a good measure for data quality issues at source systems?
Poland 1 definitely yes 6
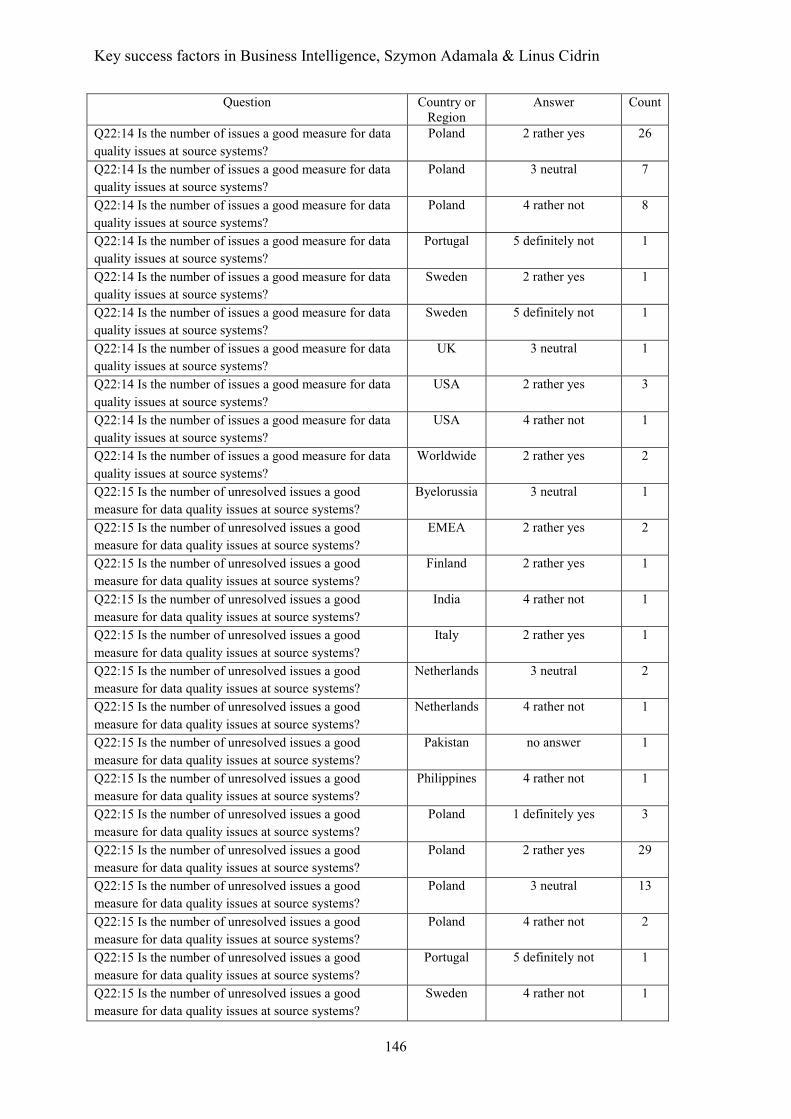
Key success factors in Business Intelligence, Szymon Adamala & Linus Cidrin
146
Question Country or Region
Answer Count
Q22:14 Is the number of issues a good measure for data quality issues at source systems?
Poland 2 rather yes 26
Q22:14 Is the number of issues a good measure for data quality issues at source systems?
Poland 3 neutral 7
Q22:14 Is the number of issues a good measure for data quality issues at source systems?
Poland 4 rather not 8
Q22:14 Is the number of issues a good measure for data quality issues at source systems?
Portugal 5 definitely not 1
Q22:14 Is the number of issues a good measure for data quality issues at source systems?
Sweden 2 rather yes 1
Q22:14 Is the number of issues a good measure for data quality issues at source systems?
Sweden 5 definitely not 1
Q22:14 Is the number of issues a good measure for data quality issues at source systems?
UK 3 neutral 1
Q22:14 Is the number of issues a good measure for data quality issues at source systems?
USA 2 rather yes 3
Q22:14 Is the number of issues a good measure for data quality issues at source systems?
USA 4 rather not 1
Q22:14 Is the number of issues a good measure for data quality issues at source systems?
Worldwide 2 rather yes 2
Q22:15 Is the number of unresolved issues a good measure for data quality issues at source systems?
Byelorussia 3 neutral 1
Q22:15 Is the number of unresolved issues a good measure for data quality issues at source systems?
EMEA 2 rather yes 2
Q22:15 Is the number of unresolved issues a good measure for data quality issues at source systems?
Finland 2 rather yes 1
Q22:15 Is the number of unresolved issues a good measure for data quality issues at source systems?
India 4 rather not 1
Q22:15 Is the number of unresolved issues a good measure for data quality issues at source systems?
Italy 2 rather yes 1
Q22:15 Is the number of unresolved issues a good measure for data quality issues at source systems?
Netherlands 3 neutral 2
Q22:15 Is the number of unresolved issues a good measure for data quality issues at source systems?
Netherlands 4 rather not 1
Q22:15 Is the number of unresolved issues a good measure for data quality issues at source systems?
Pakistan no answer 1
Q22:15 Is the number of unresolved issues a good measure for data quality issues at source systems?
Philippines 4 rather not 1
Q22:15 Is the number of unresolved issues a good measure for data quality issues at source systems?
Poland 1 definitely yes 3
Q22:15 Is the number of unresolved issues a good measure for data quality issues at source systems?
Poland 2 rather yes 29
Q22:15 Is the number of unresolved issues a good measure for data quality issues at source systems?
Poland 3 neutral 13
Q22:15 Is the number of unresolved issues a good measure for data quality issues at source systems?
Poland 4 rather not 2
Q22:15 Is the number of unresolved issues a good measure for data quality issues at source systems?
Portugal 5 definitely not 1
Q22:15 Is the number of unresolved issues a good measure for data quality issues at source systems?
Sweden 4 rather not 1
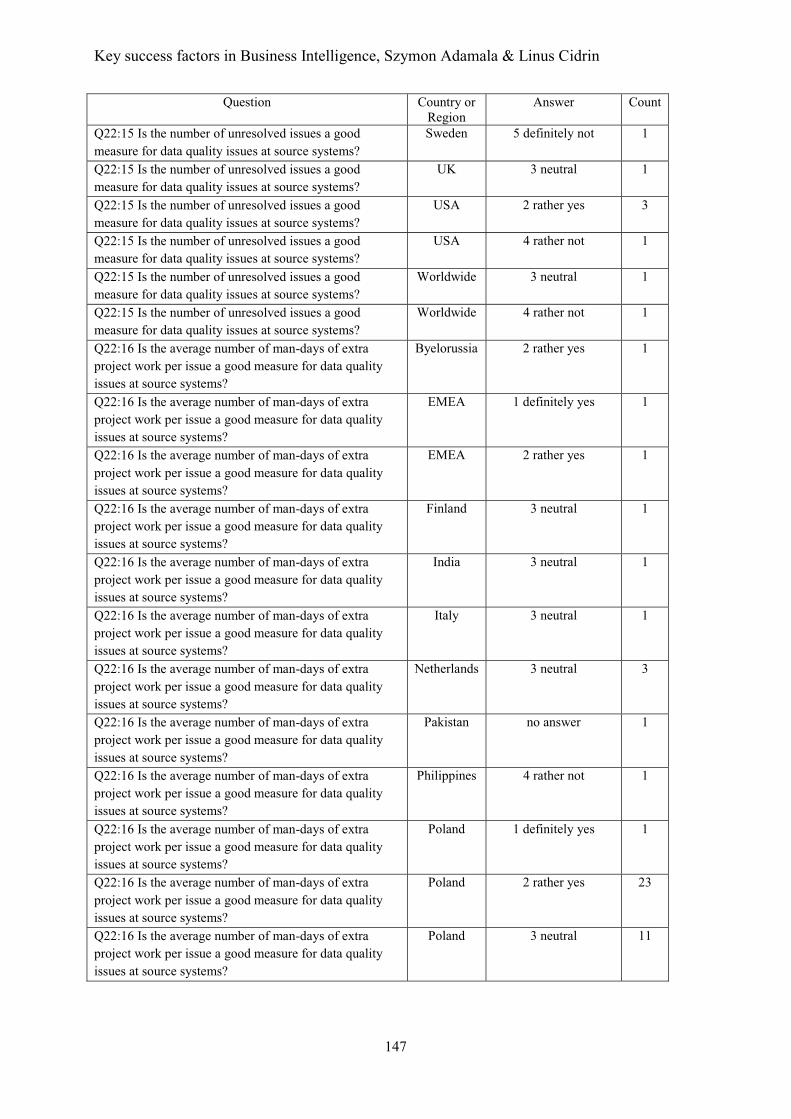
Key success factors in Business Intelligence, Szymon Adamala & Linus Cidrin
147
Question Country or Region
Answer Count
Q22:15 Is the number of unresolved issues a good measure for data quality issues at source systems?
Sweden 5 definitely not 1
Q22:15 Is the number of unresolved issues a good measure for data quality issues at source systems?
UK 3 neutral 1
Q22:15 Is the number of unresolved issues a good measure for data quality issues at source systems?
USA 2 rather yes 3
Q22:15 Is the number of unresolved issues a good measure for data quality issues at source systems?
USA 4 rather not 1
Q22:15 Is the number of unresolved issues a good measure for data quality issues at source systems?
Worldwide 3 neutral 1
Q22:15 Is the number of unresolved issues a good measure for data quality issues at source systems?
Worldwide 4 rather not 1
Q22:16 Is the average number of man-days of extra project work per issue a good measure for data quality issues at source systems?
Byelorussia 2 rather yes 1
Q22:16 Is the average number of man-days of extra project work per issue a good measure for data quality issues at source systems?
EMEA 1 definitely yes 1
Q22:16 Is the average number of man-days of extra project work per issue a good measure for data quality issues at source systems?
EMEA 2 rather yes 1
Q22:16 Is the average number of man-days of extra project work per issue a good measure for data quality issues at source systems?
Finland 3 neutral 1
Q22:16 Is the average number of man-days of extra project work per issue a good measure for data quality issues at source systems?
India 3 neutral 1
Q22:16 Is the average number of man-days of extra project work per issue a good measure for data quality issues at source systems?
Italy 3 neutral 1
Q22:16 Is the average number of man-days of extra project work per issue a good measure for data quality issues at source systems?
Netherlands 3 neutral 3
Q22:16 Is the average number of man-days of extra project work per issue a good measure for data quality issues at source systems?
Pakistan no answer 1
Q22:16 Is the average number of man-days of extra project work per issue a good measure for data quality issues at source systems?
Philippines 4 rather not 1
Q22:16 Is the average number of man-days of extra project work per issue a good measure for data quality issues at source systems?
Poland 1 definitely yes 1
Q22:16 Is the average number of man-days of extra project work per issue a good measure for data quality issues at source systems?
Poland 2 rather yes 23
Q22:16 Is the average number of man-days of extra project work per issue a good measure for data quality issues at source systems?
Poland 3 neutral 11
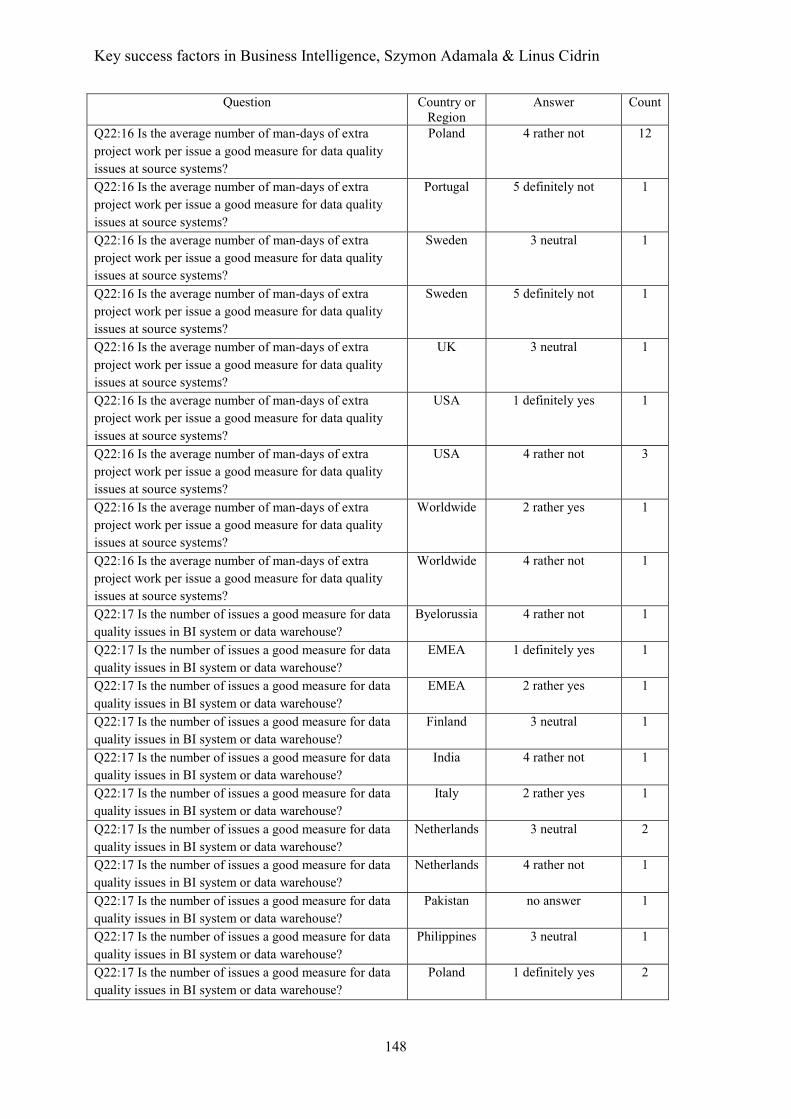
Key success factors in Business Intelligence, Szymon Adamala & Linus Cidrin
148
Question Country or Region
Answer Count
Q22:16 Is the average number of man-days of extra project work per issue a good measure for data quality issues at source systems?
Poland 4 rather not 12
Q22:16 Is the average number of man-days of extra project work per issue a good measure for data quality issues at source systems?
Portugal 5 definitely not 1
Q22:16 Is the average number of man-days of extra project work per issue a good measure for data quality issues at source systems?
Sweden 3 neutral 1
Q22:16 Is the average number of man-days of extra project work per issue a good measure for data quality issues at source systems?
Sweden 5 definitely not 1
Q22:16 Is the average number of man-days of extra project work per issue a good measure for data quality issues at source systems?
UK 3 neutral 1
Q22:16 Is the average number of man-days of extra project work per issue a good measure for data quality issues at source systems?
USA 1 definitely yes 1
Q22:16 Is the average number of man-days of extra project work per issue a good measure for data quality issues at source systems?
USA 4 rather not 3
Q22:16 Is the average number of man-days of extra project work per issue a good measure for data quality issues at source systems?
Worldwide 2 rather yes 1
Q22:16 Is the average number of man-days of extra project work per issue a good measure for data quality issues at source systems?
Worldwide 4 rather not 1
Q22:17 Is the number of issues a good measure for data quality issues in BI system or data warehouse?
Byelorussia 4 rather not 1
Q22:17 Is the number of issues a good measure for data quality issues in BI system or data warehouse?
EMEA 1 definitely yes 1
Q22:17 Is the number of issues a good measure for data quality issues in BI system or data warehouse?
EMEA 2 rather yes 1
Q22:17 Is the number of issues a good measure for data quality issues in BI system or data warehouse?
Finland 3 neutral 1
Q22:17 Is the number of issues a good measure for data quality issues in BI system or data warehouse?
India 4 rather not 1
Q22:17 Is the number of issues a good measure for data quality issues in BI system or data warehouse?
Italy 2 rather yes 1
Q22:17 Is the number of issues a good measure for data quality issues in BI system or data warehouse?
Netherlands 3 neutral 2
Q22:17 Is the number of issues a good measure for data quality issues in BI system or data warehouse?
Netherlands 4 rather not 1
Q22:17 Is the number of issues a good measure for data quality issues in BI system or data warehouse?
Pakistan no answer 1
Q22:17 Is the number of issues a good measure for data quality issues in BI system or data warehouse?
Philippines 3 neutral 1
Q22:17 Is the number of issues a good measure for data quality issues in BI system or data warehouse?
Poland 1 definitely yes 2
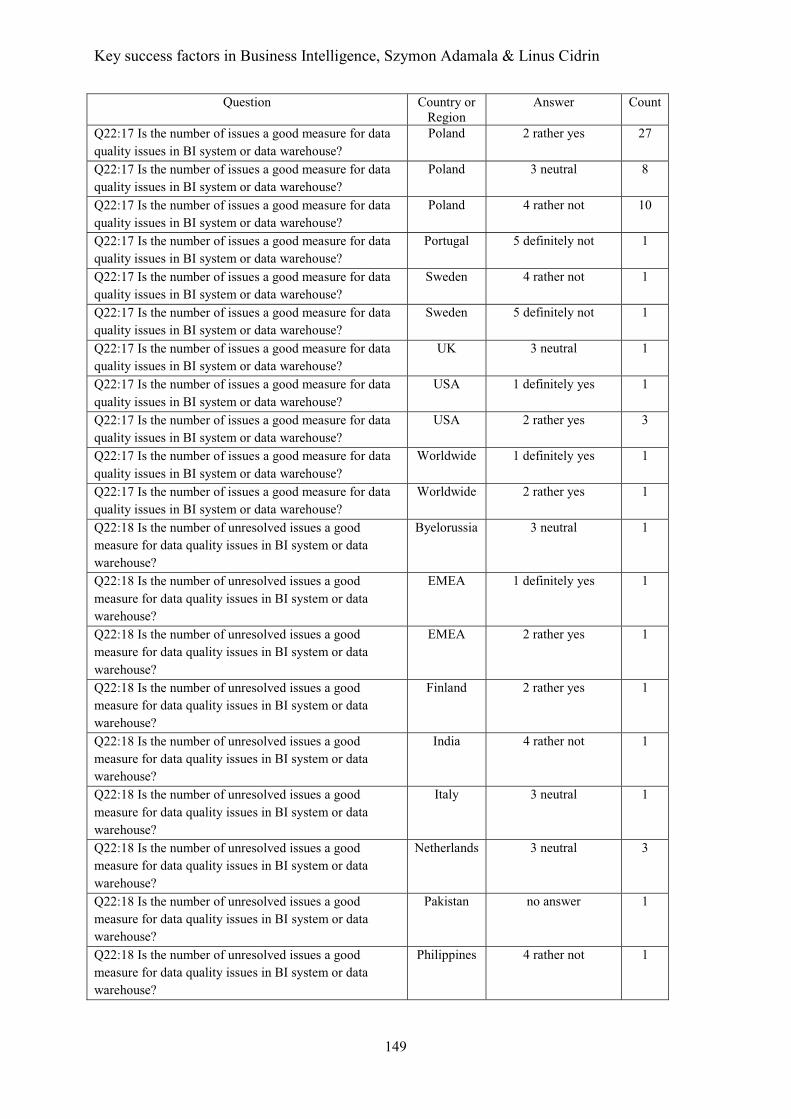
Key success factors in Business Intelligence, Szymon Adamala & Linus Cidrin
149
Question Country or Region
Answer Count
Q22:17 Is the number of issues a good measure for data quality issues in BI system or data warehouse?
Poland 2 rather yes 27
Q22:17 Is the number of issues a good measure for data quality issues in BI system or data warehouse?
Poland 3 neutral 8
Q22:17 Is the number of issues a good measure for data quality issues in BI system or data warehouse?
Poland 4 rather not 10
Q22:17 Is the number of issues a good measure for data quality issues in BI system or data warehouse?
Portugal 5 definitely not 1
Q22:17 Is the number of issues a good measure for data quality issues in BI system or data warehouse?
Sweden 4 rather not 1
Q22:17 Is the number of issues a good measure for data quality issues in BI system or data warehouse?
Sweden 5 definitely not 1
Q22:17 Is the number of issues a good measure for data quality issues in BI system or data warehouse?
UK 3 neutral 1
Q22:17 Is the number of issues a good measure for data quality issues in BI system or data warehouse?
USA 1 definitely yes 1
Q22:17 Is the number of issues a good measure for data quality issues in BI system or data warehouse?
USA 2 rather yes 3
Q22:17 Is the number of issues a good measure for data quality issues in BI system or data warehouse?
Worldwide 1 definitely yes 1
Q22:17 Is the number of issues a good measure for data quality issues in BI system or data warehouse?
Worldwide 2 rather yes 1
Q22:18 Is the number of unresolved issues a good measure for data quality issues in BI system or data warehouse?
Byelorussia 3 neutral 1
Q22:18 Is the number of unresolved issues a good measure for data quality issues in BI system or data warehouse?
EMEA 1 definitely yes 1
Q22:18 Is the number of unresolved issues a good measure for data quality issues in BI system or data warehouse?
EMEA 2 rather yes 1
Q22:18 Is the number of unresolved issues a good measure for data quality issues in BI system or data warehouse?
Finland 2 rather yes 1
Q22:18 Is the number of unresolved issues a good measure for data quality issues in BI system or data warehouse?
India 4 rather not 1
Q22:18 Is the number of unresolved issues a good measure for data quality issues in BI system or data warehouse?
Italy 3 neutral 1
Q22:18 Is the number of unresolved issues a good measure for data quality issues in BI system or data warehouse?
Netherlands 3 neutral 3
Q22:18 Is the number of unresolved issues a good measure for data quality issues in BI system or data warehouse?
Pakistan no answer 1
Q22:18 Is the number of unresolved issues a good measure for data quality issues in BI system or data warehouse?
Philippines 4 rather not 1

Key success factors in Business Intelligence, Szymon Adamala & Linus Cidrin
150
Question Country or Region
Answer Count
Q22:18 Is the number of unresolved issues a good measure for data quality issues in BI system or data warehouse?
Poland 1 definitely yes 2
Q22:18 Is the number of unresolved issues a good measure for data quality issues in BI system or data warehouse?
Poland 2 rather yes 30
Q22:18 Is the number of unresolved issues a good measure for data quality issues in BI system or data warehouse?
Poland 3 neutral 14
Q22:18 Is the number of unresolved issues a good measure for data quality issues in BI system or data warehouse?
Poland 5 definitely not 1
Q22:18 Is the number of unresolved issues a good measure for data quality issues in BI system or data warehouse?
Portugal 3 neutral 1
Q22:18 Is the number of unresolved issues a good measure for data quality issues in BI system or data warehouse?
Sweden 4 rather not 1
Q22:18 Is the number of unresolved issues a good measure for data quality issues in BI system or data warehouse?
Sweden 5 definitely not 1
Q22:18 Is the number of unresolved issues a good measure for data quality issues in BI system or data warehouse?
UK 3 neutral 1
Q22:18 Is the number of unresolved issues a good measure for data quality issues in BI system or data warehouse?
USA 1 definitely yes 1
Q22:18 Is the number of unresolved issues a good measure for data quality issues in BI system or data warehouse?
USA 2 rather yes 2
Q22:18 Is the number of unresolved issues a good measure for data quality issues in BI system or data warehouse?
USA 4 rather not 1
Q22:18 Is the number of unresolved issues a good measure for data quality issues in BI system or data warehouse?
Worldwide 2 rather yes 1
Q22:18 Is the number of unresolved issues a good measure for data quality issues in BI system or data warehouse?
Worldwide 4 rather not 1
Q22:19 Is the average number of man-days of extra project work per issue a good measure for data quality issues in BI system or data warehouse?
Byelorussia 2 rather yes 1
Q22:19 Is the average number of man-days of extra project work per issue a good measure for data quality issues in BI system or data warehouse?
EMEA 1 definitely yes 1
Q22:19 Is the average number of man-days of extra project work per issue a good measure for data quality issues in BI system or data warehouse?
EMEA 2 rather yes 1
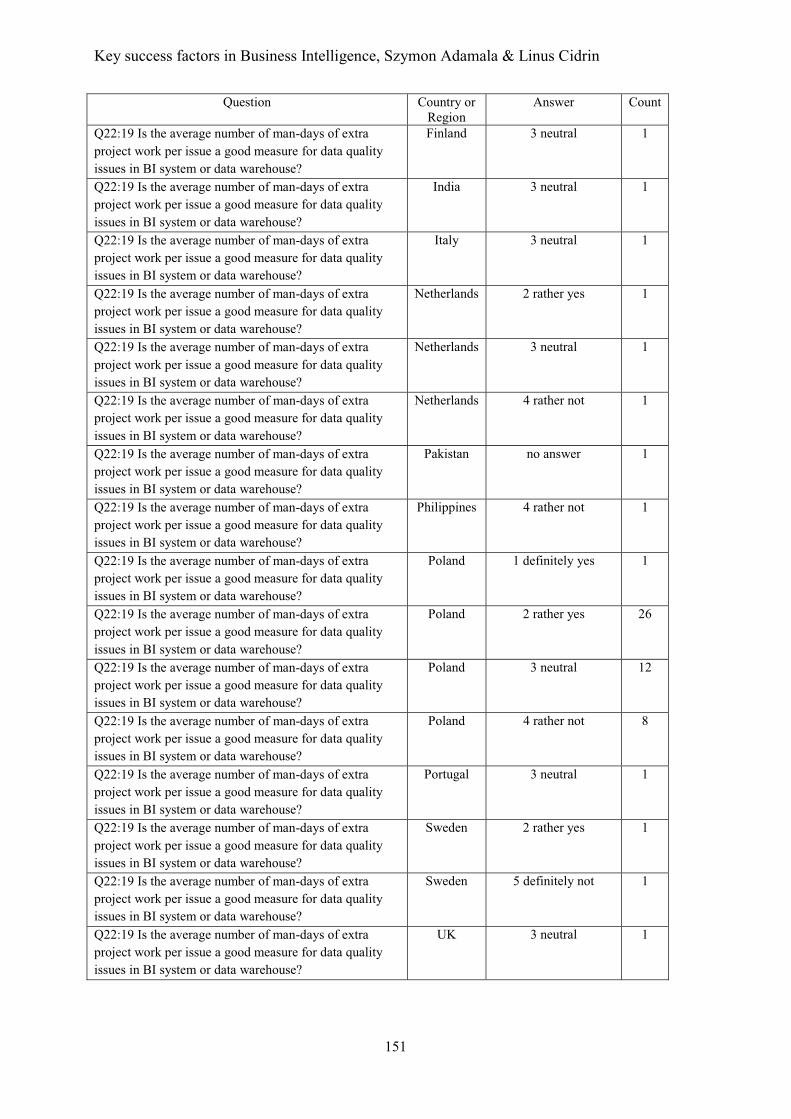
Key success factors in Business Intelligence, Szymon Adamala & Linus Cidrin
151
Question Country or Region
Answer Count
Q22:19 Is the average number of man-days of extra project work per issue a good measure for data quality issues in BI system or data warehouse?
Finland 3 neutral 1
Q22:19 Is the average number of man-days of extra project work per issue a good measure for data quality issues in BI system or data warehouse?
India 3 neutral 1
Q22:19 Is the average number of man-days of extra project work per issue a good measure for data quality issues in BI system or data warehouse?
Italy 3 neutral 1
Q22:19 Is the average number of man-days of extra project work per issue a good measure for data quality issues in BI system or data warehouse?
Netherlands 2 rather yes 1
Q22:19 Is the average number of man-days of extra project work per issue a good measure for data quality issues in BI system or data warehouse?
Netherlands 3 neutral 1
Q22:19 Is the average number of man-days of extra project work per issue a good measure for data quality issues in BI system or data warehouse?
Netherlands 4 rather not 1
Q22:19 Is the average number of man-days of extra project work per issue a good measure for data quality issues in BI system or data warehouse?
Pakistan no answer 1
Q22:19 Is the average number of man-days of extra project work per issue a good measure for data quality issues in BI system or data warehouse?
Philippines 4 rather not 1
Q22:19 Is the average number of man-days of extra project work per issue a good measure for data quality issues in BI system or data warehouse?
Poland 1 definitely yes 1
Q22:19 Is the average number of man-days of extra project work per issue a good measure for data quality issues in BI system or data warehouse?
Poland 2 rather yes 26
Q22:19 Is the average number of man-days of extra project work per issue a good measure for data quality issues in BI system or data warehouse?
Poland 3 neutral 12
Q22:19 Is the average number of man-days of extra project work per issue a good measure for data quality issues in BI system or data warehouse?
Poland 4 rather not 8
Q22:19 Is the average number of man-days of extra project work per issue a good measure for data quality issues in BI system or data warehouse?
Portugal 3 neutral 1
Q22:19 Is the average number of man-days of extra project work per issue a good measure for data quality issues in BI system or data warehouse?
Sweden 2 rather yes 1
Q22:19 Is the average number of man-days of extra project work per issue a good measure for data quality issues in BI system or data warehouse?
Sweden 5 definitely not 1
Q22:19 Is the average number of man-days of extra project work per issue a good measure for data quality issues in BI system or data warehouse?
UK 3 neutral 1
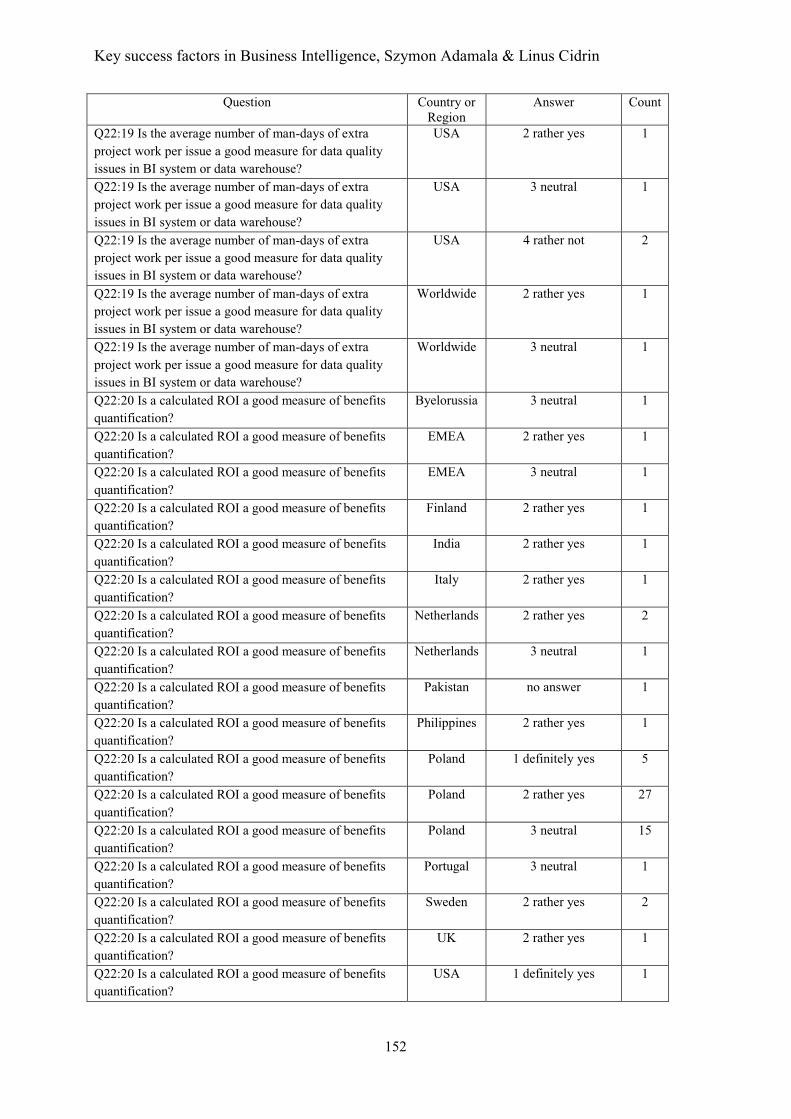
Key success factors in Business Intelligence, Szymon Adamala & Linus Cidrin
152
Question Country or Region
Answer Count
Q22:19 Is the average number of man-days of extra project work per issue a good measure for data quality issues in BI system or data warehouse?
USA 2 rather yes 1
Q22:19 Is the average number of man-days of extra project work per issue a good measure for data quality issues in BI system or data warehouse?
USA 3 neutral 1
Q22:19 Is the average number of man-days of extra project work per issue a good measure for data quality issues in BI system or data warehouse?
USA 4 rather not 2
Q22:19 Is the average number of man-days of extra project work per issue a good measure for data quality issues in BI system or data warehouse?
Worldwide 2 rather yes 1
Q22:19 Is the average number of man-days of extra project work per issue a good measure for data quality issues in BI system or data warehouse?
Worldwide 3 neutral 1
Q22:20 Is a calculated ROI a good measure of benefits quantification?
Byelorussia 3 neutral 1
Q22:20 Is a calculated ROI a good measure of benefits quantification?
EMEA 2 rather yes 1
Q22:20 Is a calculated ROI a good measure of benefits quantification?
EMEA 3 neutral 1
Q22:20 Is a calculated ROI a good measure of benefits quantification?
Finland 2 rather yes 1
Q22:20 Is a calculated ROI a good measure of benefits quantification?
India 2 rather yes 1
Q22:20 Is a calculated ROI a good measure of benefits quantification?
Italy 2 rather yes 1
Q22:20 Is a calculated ROI a good measure of benefits quantification?
Netherlands 2 rather yes 2
Q22:20 Is a calculated ROI a good measure of benefits quantification?
Netherlands 3 neutral 1
Q22:20 Is a calculated ROI a good measure of benefits quantification?
Pakistan no answer 1
Q22:20 Is a calculated ROI a good measure of benefits quantification?
Philippines 2 rather yes 1
Q22:20 Is a calculated ROI a good measure of benefits quantification?
Poland 1 definitely yes 5
Q22:20 Is a calculated ROI a good measure of benefits quantification?
Poland 2 rather yes 27
Q22:20 Is a calculated ROI a good measure of benefits quantification?
Poland 3 neutral 15
Q22:20 Is a calculated ROI a good measure of benefits quantification?
Portugal 3 neutral 1
Q22:20 Is a calculated ROI a good measure of benefits quantification?
Sweden 2 rather yes 2
Q22:20 Is a calculated ROI a good measure of benefits quantification?
UK 2 rather yes 1
Q22:20 Is a calculated ROI a good measure of benefits quantification?
USA 1 definitely yes 1
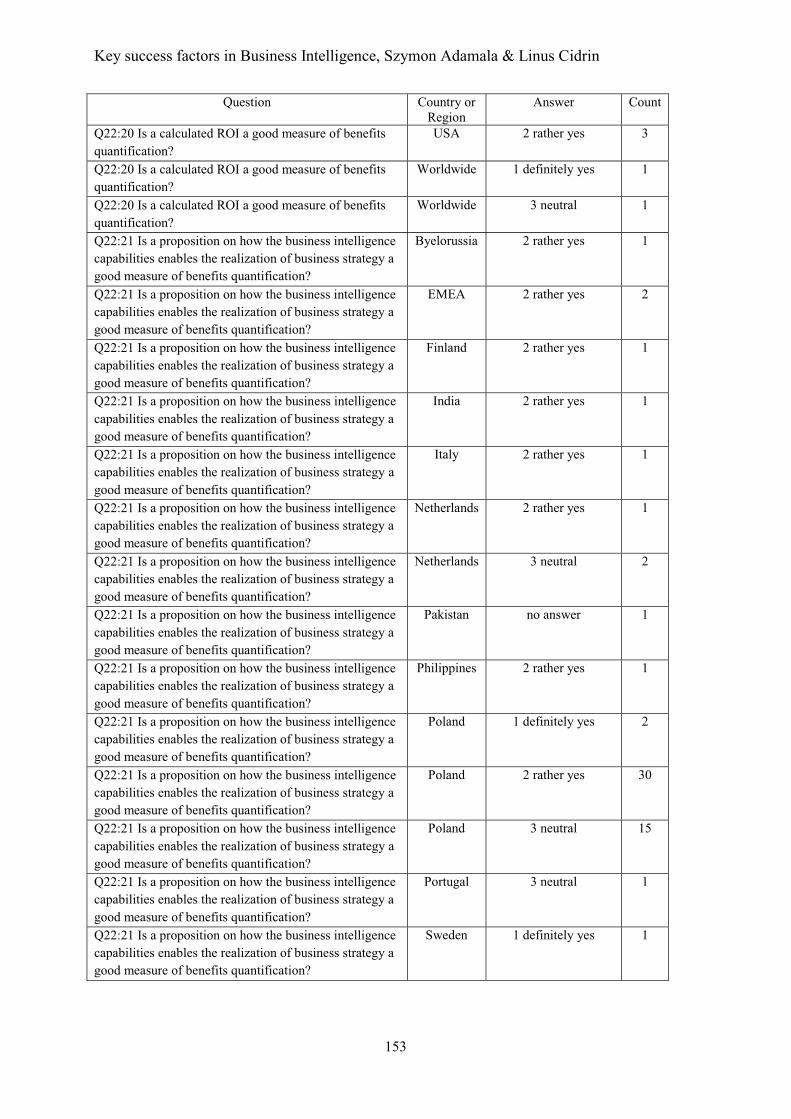
Key success factors in Business Intelligence, Szymon Adamala & Linus Cidrin
153
Question Country or Region
Answer Count
Q22:20 Is a calculated ROI a good measure of benefits quantification?
USA 2 rather yes 3
Q22:20 Is a calculated ROI a good measure of benefits quantification?
Worldwide 1 definitely yes 1
Q22:20 Is a calculated ROI a good measure of benefits quantification?
Worldwide 3 neutral 1
Q22:21 Is a proposition on how the business intelligence capabilities enables the realization of business strategy a good measure of benefits quantification?
Byelorussia 2 rather yes 1
Q22:21 Is a proposition on how the business intelligence capabilities enables the realization of business strategy a good measure of benefits quantification?
EMEA 2 rather yes 2
Q22:21 Is a proposition on how the business intelligence capabilities enables the realization of business strategy a good measure of benefits quantification?
Finland 2 rather yes 1
Q22:21 Is a proposition on how the business intelligence capabilities enables the realization of business strategy a good measure of benefits quantification?
India 2 rather yes 1
Q22:21 Is a proposition on how the business intelligence capabilities enables the realization of business strategy a good measure of benefits quantification?
Italy 2 rather yes 1
Q22:21 Is a proposition on how the business intelligence capabilities enables the realization of business strategy a good measure of benefits quantification?
Netherlands 2 rather yes 1
Q22:21 Is a proposition on how the business intelligence capabilities enables the realization of business strategy a good measure of benefits quantification?
Netherlands 3 neutral 2
Q22:21 Is a proposition on how the business intelligence capabilities enables the realization of business strategy a good measure of benefits quantification?
Pakistan no answer 1
Q22:21 Is a proposition on how the business intelligence capabilities enables the realization of business strategy a good measure of benefits quantification?
Philippines 2 rather yes 1
Q22:21 Is a proposition on how the business intelligence capabilities enables the realization of business strategy a good measure of benefits quantification?
Poland 1 definitely yes 2
Q22:21 Is a proposition on how the business intelligence capabilities enables the realization of business strategy a good measure of benefits quantification?
Poland 2 rather yes 30
Q22:21 Is a proposition on how the business intelligence capabilities enables the realization of business strategy a good measure of benefits quantification?
Poland 3 neutral 15
Q22:21 Is a proposition on how the business intelligence capabilities enables the realization of business strategy a good measure of benefits quantification?
Portugal 3 neutral 1
Q22:21 Is a proposition on how the business intelligence capabilities enables the realization of business strategy a good measure of benefits quantification?
Sweden 1 definitely yes 1
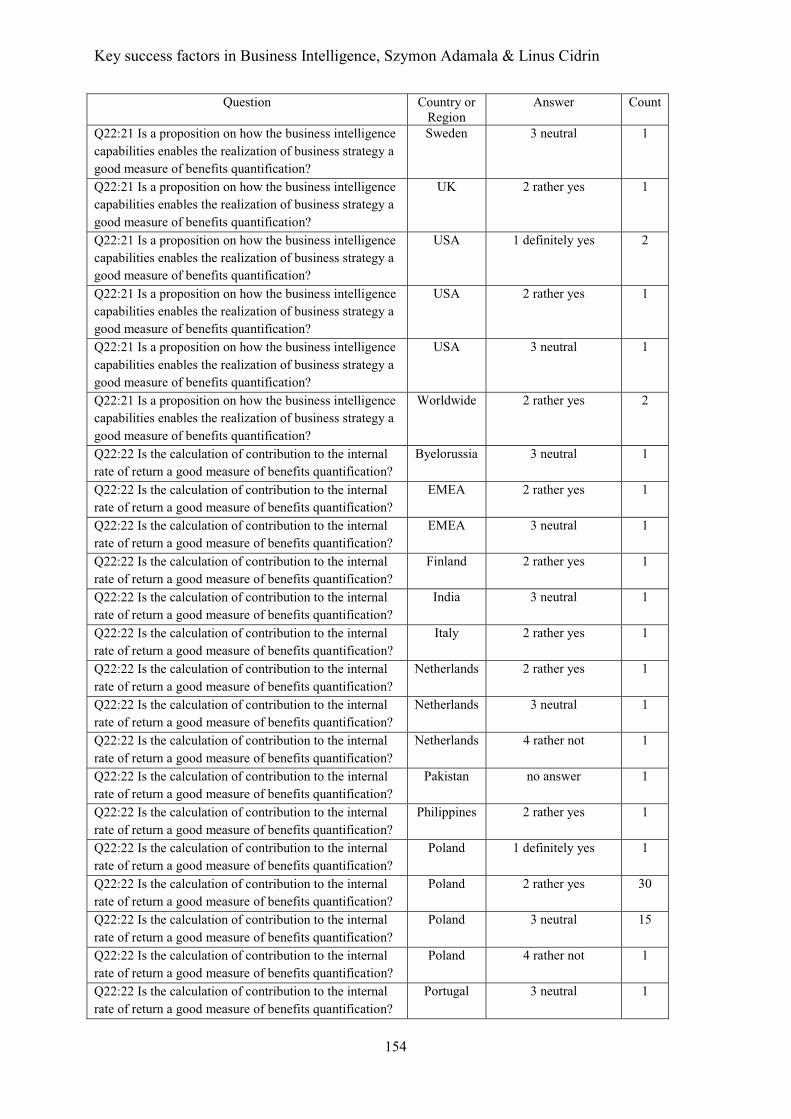
Key success factors in Business Intelligence, Szymon Adamala & Linus Cidrin
154
Question Country or Region
Answer Count
Q22:21 Is a proposition on how the business intelligence capabilities enables the realization of business strategy a good measure of benefits quantification?
Sweden 3 neutral 1
Q22:21 Is a proposition on how the business intelligence capabilities enables the realization of business strategy a good measure of benefits quantification?
UK 2 rather yes 1
Q22:21 Is a proposition on how the business intelligence capabilities enables the realization of business strategy a good measure of benefits quantification?
USA 1 definitely yes 2
Q22:21 Is a proposition on how the business intelligence capabilities enables the realization of business strategy a good measure of benefits quantification?
USA 2 rather yes 1
Q22:21 Is a proposition on how the business intelligence capabilities enables the realization of business strategy a good measure of benefits quantification?
USA 3 neutral 1
Q22:21 Is a proposition on how the business intelligence capabilities enables the realization of business strategy a good measure of benefits quantification?
Worldwide 2 rather yes 2
Q22:22 Is the calculation of contribution to the internal rate of return a good measure of benefits quantification?
Byelorussia 3 neutral 1
Q22:22 Is the calculation of contribution to the internal rate of return a good measure of benefits quantification?
EMEA 2 rather yes 1
Q22:22 Is the calculation of contribution to the internal rate of return a good measure of benefits quantification?
EMEA 3 neutral 1
Q22:22 Is the calculation of contribution to the internal rate of return a good measure of benefits quantification?
Finland 2 rather yes 1
Q22:22 Is the calculation of contribution to the internal rate of return a good measure of benefits quantification?
India 3 neutral 1
Q22:22 Is the calculation of contribution to the internal rate of return a good measure of benefits quantification?
Italy 2 rather yes 1
Q22:22 Is the calculation of contribution to the internal rate of return a good measure of benefits quantification?
Netherlands 2 rather yes 1
Q22:22 Is the calculation of contribution to the internal rate of return a good measure of benefits quantification?
Netherlands 3 neutral 1
Q22:22 Is the calculation of contribution to the internal rate of return a good measure of benefits quantification?
Netherlands 4 rather not 1
Q22:22 Is the calculation of contribution to the internal rate of return a good measure of benefits quantification?
Pakistan no answer 1
Q22:22 Is the calculation of contribution to the internal rate of return a good measure of benefits quantification?
Philippines 2 rather yes 1
Q22:22 Is the calculation of contribution to the internal rate of return a good measure of benefits quantification?
Poland 1 definitely yes 1
Q22:22 Is the calculation of contribution to the internal rate of return a good measure of benefits quantification?
Poland 2 rather yes 30
Q22:22 Is the calculation of contribution to the internal rate of return a good measure of benefits quantification?
Poland 3 neutral 15
Q22:22 Is the calculation of contribution to the internal rate of return a good measure of benefits quantification?
Poland 4 rather not 1
Q22:22 Is the calculation of contribution to the internal rate of return a good measure of benefits quantification?
Portugal 3 neutral 1
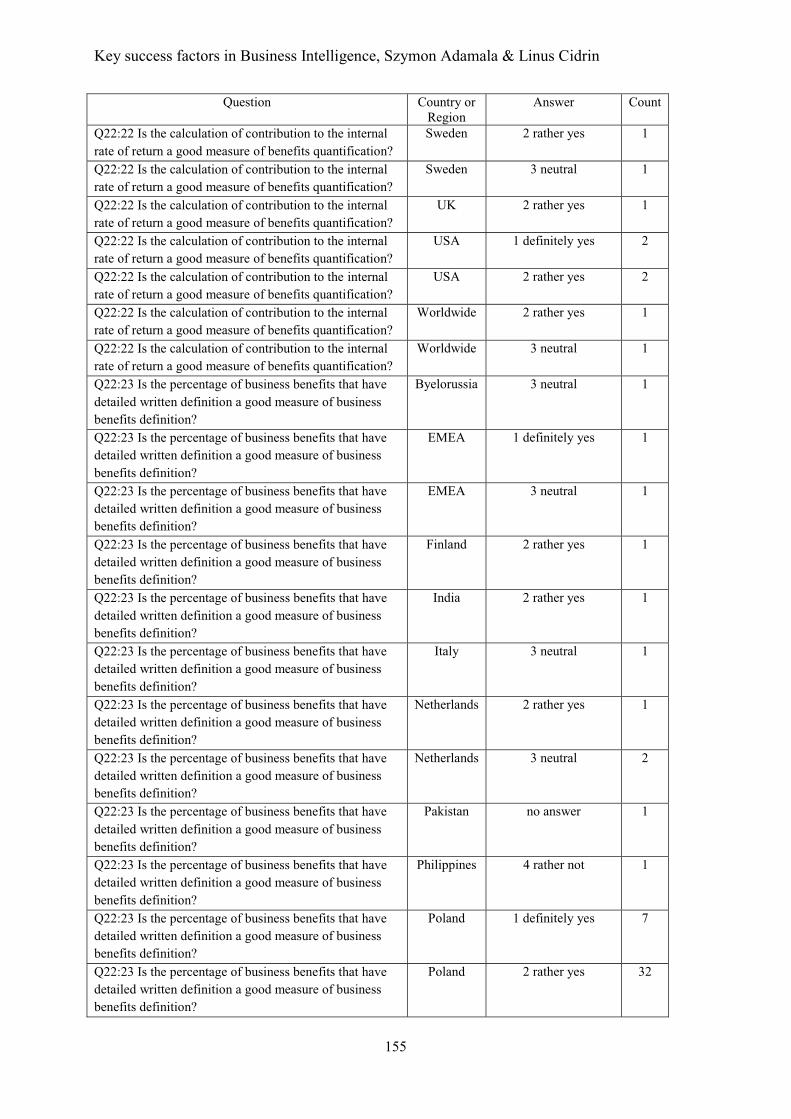
Key success factors in Business Intelligence, Szymon Adamala & Linus Cidrin
155
Question Country or Region
Answer Count
Q22:22 Is the calculation of contribution to the internal rate of return a good measure of benefits quantification?
Sweden 2 rather yes 1
Q22:22 Is the calculation of contribution to the internal rate of return a good measure of benefits quantification?
Sweden 3 neutral 1
Q22:22 Is the calculation of contribution to the internal rate of return a good measure of benefits quantification?
UK 2 rather yes 1
Q22:22 Is the calculation of contribution to the internal rate of return a good measure of benefits quantification?
USA 1 definitely yes 2
Q22:22 Is the calculation of contribution to the internal rate of return a good measure of benefits quantification?
USA 2 rather yes 2
Q22:22 Is the calculation of contribution to the internal rate of return a good measure of benefits quantification?
Worldwide 2 rather yes 1
Q22:22 Is the calculation of contribution to the internal rate of return a good measure of benefits quantification?
Worldwide 3 neutral 1
Q22:23 Is the percentage of business benefits that have detailed written definition a good measure of business benefits definition?
Byelorussia 3 neutral 1
Q22:23 Is the percentage of business benefits that have detailed written definition a good measure of business benefits definition?
EMEA 1 definitely yes 1
Q22:23 Is the percentage of business benefits that have detailed written definition a good measure of business benefits definition?
EMEA 3 neutral 1
Q22:23 Is the percentage of business benefits that have detailed written definition a good measure of business benefits definition?
Finland 2 rather yes 1
Q22:23 Is the percentage of business benefits that have detailed written definition a good measure of business benefits definition?
India 2 rather yes 1
Q22:23 Is the percentage of business benefits that have detailed written definition a good measure of business benefits definition?
Italy 3 neutral 1
Q22:23 Is the percentage of business benefits that have detailed written definition a good measure of business benefits definition?
Netherlands 2 rather yes 1
Q22:23 Is the percentage of business benefits that have detailed written definition a good measure of business benefits definition?
Netherlands 3 neutral 2
Q22:23 Is the percentage of business benefits that have detailed written definition a good measure of business benefits definition?
Pakistan no answer 1
Q22:23 Is the percentage of business benefits that have detailed written definition a good measure of business benefits definition?
Philippines 4 rather not 1
Q22:23 Is the percentage of business benefits that have detailed written definition a good measure of business benefits definition?
Poland 1 definitely yes 7
Q22:23 Is the percentage of business benefits that have detailed written definition a good measure of business benefits definition?
Poland 2 rather yes 32
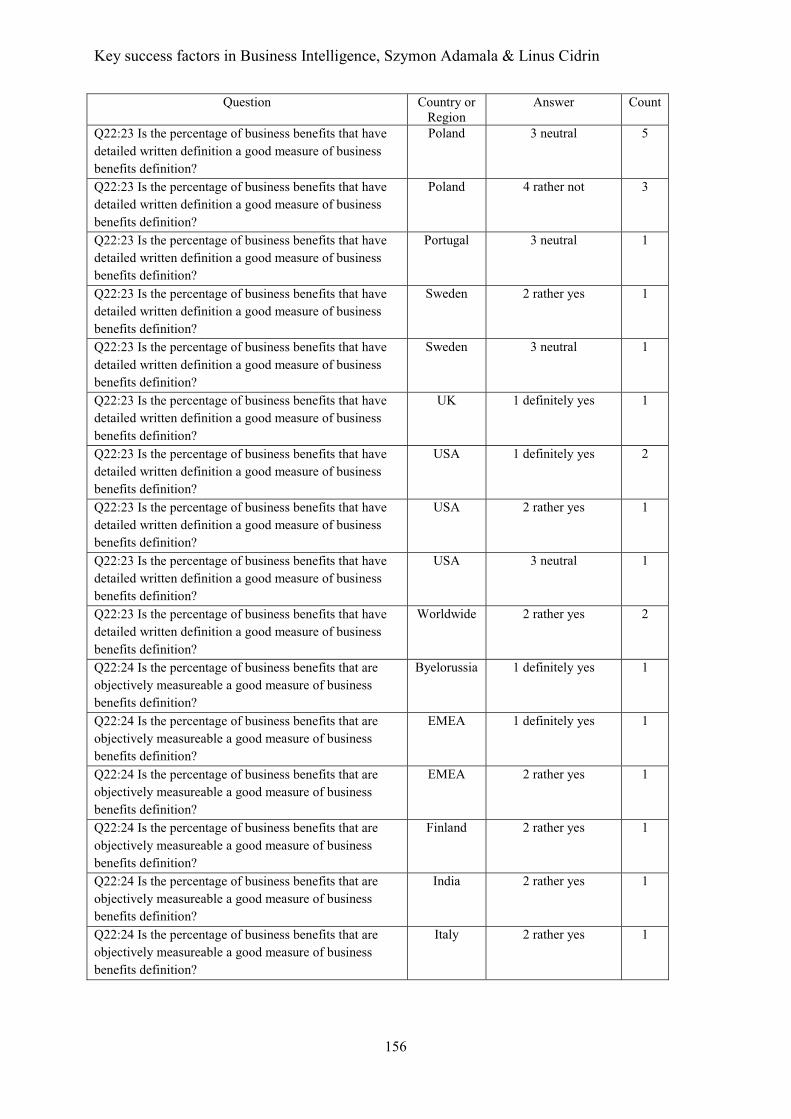
Key success factors in Business Intelligence, Szymon Adamala & Linus Cidrin
156
Question Country or Region
Answer Count
Q22:23 Is the percentage of business benefits that have detailed written definition a good measure of business benefits definition?
Poland 3 neutral 5
Q22:23 Is the percentage of business benefits that have detailed written definition a good measure of business benefits definition?
Poland 4 rather not 3
Q22:23 Is the percentage of business benefits that have detailed written definition a good measure of business benefits definition?
Portugal 3 neutral 1
Q22:23 Is the percentage of business benefits that have detailed written definition a good measure of business benefits definition?
Sweden 2 rather yes 1
Q22:23 Is the percentage of business benefits that have detailed written definition a good measure of business benefits definition?
Sweden 3 neutral 1
Q22:23 Is the percentage of business benefits that have detailed written definition a good measure of business benefits definition?
UK 1 definitely yes 1
Q22:23 Is the percentage of business benefits that have detailed written definition a good measure of business benefits definition?
USA 1 definitely yes 2
Q22:23 Is the percentage of business benefits that have detailed written definition a good measure of business benefits definition?
USA 2 rather yes 1
Q22:23 Is the percentage of business benefits that have detailed written definition a good measure of business benefits definition?
USA 3 neutral 1
Q22:23 Is the percentage of business benefits that have detailed written definition a good measure of business benefits definition?
Worldwide 2 rather yes 2
Q22:24 Is the percentage of business benefits that are objectively measureable a good measure of business benefits definition?
Byelorussia 1 definitely yes 1
Q22:24 Is the percentage of business benefits that are objectively measureable a good measure of business benefits definition?
EMEA 1 definitely yes 1
Q22:24 Is the percentage of business benefits that are objectively measureable a good measure of business benefits definition?
EMEA 2 rather yes 1
Q22:24 Is the percentage of business benefits that are objectively measureable a good measure of business benefits definition?
Finland 2 rather yes 1
Q22:24 Is the percentage of business benefits that are objectively measureable a good measure of business benefits definition?
India 2 rather yes 1
Q22:24 Is the percentage of business benefits that are objectively measureable a good measure of business benefits definition?
Italy 2 rather yes 1
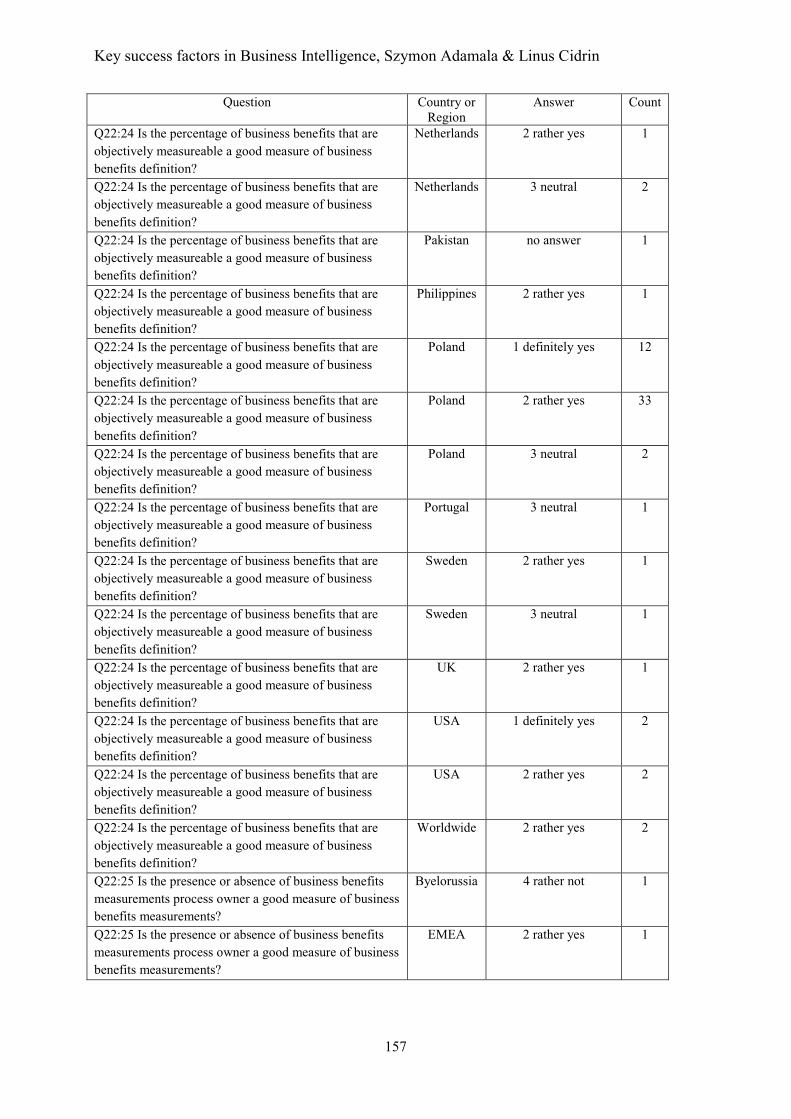
Key success factors in Business Intelligence, Szymon Adamala & Linus Cidrin
157
Question Country or Region
Answer Count
Q22:24 Is the percentage of business benefits that are objectively measureable a good measure of business benefits definition?
Netherlands 2 rather yes 1
Q22:24 Is the percentage of business benefits that are objectively measureable a good measure of business benefits definition?
Netherlands 3 neutral 2
Q22:24 Is the percentage of business benefits that are objectively measureable a good measure of business benefits definition?
Pakistan no answer 1
Q22:24 Is the percentage of business benefits that are objectively measureable a good measure of business benefits definition?
Philippines 2 rather yes 1
Q22:24 Is the percentage of business benefits that are objectively measureable a good measure of business benefits definition?
Poland 1 definitely yes 12
Q22:24 Is the percentage of business benefits that are objectively measureable a good measure of business benefits definition?
Poland 2 rather yes 33
Q22:24 Is the percentage of business benefits that are objectively measureable a good measure of business benefits definition?
Poland 3 neutral 2
Q22:24 Is the percentage of business benefits that are objectively measureable a good measure of business benefits definition?
Portugal 3 neutral 1
Q22:24 Is the percentage of business benefits that are objectively measureable a good measure of business benefits definition?
Sweden 2 rather yes 1
Q22:24 Is the percentage of business benefits that are objectively measureable a good measure of business benefits definition?
Sweden 3 neutral 1
Q22:24 Is the percentage of business benefits that are objectively measureable a good measure of business benefits definition?
UK 2 rather yes 1
Q22:24 Is the percentage of business benefits that are objectively measureable a good measure of business benefits definition?
USA 1 definitely yes 2
Q22:24 Is the percentage of business benefits that are objectively measureable a good measure of business benefits definition?
USA 2 rather yes 2
Q22:24 Is the percentage of business benefits that are objectively measureable a good measure of business benefits definition?
Worldwide 2 rather yes 2
Q22:25 Is the presence or absence of business benefits measurements process owner a good measure of business benefits measurements?
Byelorussia 4 rather not 1
Q22:25 Is the presence or absence of business benefits measurements process owner a good measure of business benefits measurements?
EMEA 2 rather yes 1

Key success factors in Business Intelligence, Szymon Adamala & Linus Cidrin
158
Question Country or Region
Answer Count
Q22:25 Is the presence or absence of business benefits measurements process owner a good measure of business benefits measurements?
EMEA 3 neutral 1
Q22:25 Is the presence or absence of business benefits measurements process owner a good measure of business benefits measurements?
Finland 4 rather not 1
Q22:25 Is the presence or absence of business benefits measurements process owner a good measure of business benefits measurements?
India 3 neutral 1
Q22:25 Is the presence or absence of business benefits measurements process owner a good measure of business benefits measurements?
Italy 3 neutral 1
Q22:25 Is the presence or absence of business benefits measurements process owner a good measure of business benefits measurements?
Netherlands 2 rather yes 1
Q22:25 Is the presence or absence of business benefits measurements process owner a good measure of business benefits measurements?
Netherlands 3 neutral 1
Q22:25 Is the presence or absence of business benefits measurements process owner a good measure of business benefits measurements?
Netherlands 4 rather not 1
Q22:25 Is the presence or absence of business benefits measurements process owner a good measure of business benefits measurements?
Pakistan no answer 1
Q22:25 Is the presence or absence of business benefits measurements process owner a good measure of business benefits measurements?
Philippines 4 rather not 1
Q22:25 Is the presence or absence of business benefits measurements process owner a good measure of business benefits measurements?
Poland no answer 1
Q22:25 Is the presence or absence of business benefits measurements process owner a good measure of business benefits measurements?
Poland 1 definitely yes 3
Q22:25 Is the presence or absence of business benefits measurements process owner a good measure of business benefits measurements?
Poland 2 rather yes 30
Q22:25 Is the presence or absence of business benefits measurements process owner a good measure of business benefits measurements?
Poland 3 neutral 8
Q22:25 Is the presence or absence of business benefits measurements process owner a good measure of business benefits measurements?
Poland 4 rather not 4
Q22:25 Is the presence or absence of business benefits measurements process owner a good measure of business benefits measurements?
Poland 5 definitely not 1
Q22:25 Is the presence or absence of business benefits measurements process owner a good measure of business benefits measurements?
Portugal 3 neutral 1
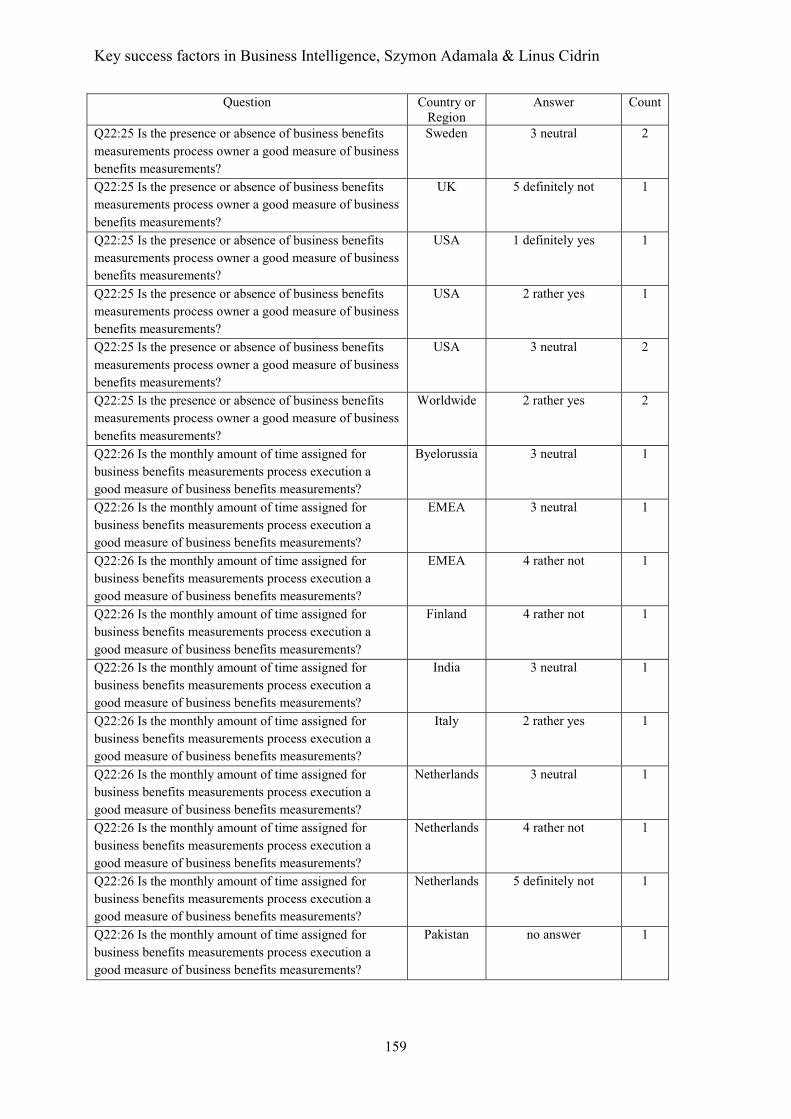
Key success factors in Business Intelligence, Szymon Adamala & Linus Cidrin
159
Question Country or Region
Answer Count
Q22:25 Is the presence or absence of business benefits measurements process owner a good measure of business benefits measurements?
Sweden 3 neutral 2
Q22:25 Is the presence or absence of business benefits measurements process owner a good measure of business benefits measurements?
UK 5 definitely not 1
Q22:25 Is the presence or absence of business benefits measurements process owner a good measure of business benefits measurements?
USA 1 definitely yes 1
Q22:25 Is the presence or absence of business benefits measurements process owner a good measure of business benefits measurements?
USA 2 rather yes 1
Q22:25 Is the presence or absence of business benefits measurements process owner a good measure of business benefits measurements?
USA 3 neutral 2
Q22:25 Is the presence or absence of business benefits measurements process owner a good measure of business benefits measurements?
Worldwide 2 rather yes 2
Q22:26 Is the monthly amount of time assigned for business benefits measurements process execution a good measure of business benefits measurements?
Byelorussia 3 neutral 1
Q22:26 Is the monthly amount of time assigned for business benefits measurements process execution a good measure of business benefits measurements?
EMEA 3 neutral 1
Q22:26 Is the monthly amount of time assigned for business benefits measurements process execution a good measure of business benefits measurements?
EMEA 4 rather not 1
Q22:26 Is the monthly amount of time assigned for business benefits measurements process execution a good measure of business benefits measurements?
Finland 4 rather not 1
Q22:26 Is the monthly amount of time assigned for business benefits measurements process execution a good measure of business benefits measurements?
India 3 neutral 1
Q22:26 Is the monthly amount of time assigned for business benefits measurements process execution a good measure of business benefits measurements?
Italy 2 rather yes 1
Q22:26 Is the monthly amount of time assigned for business benefits measurements process execution a good measure of business benefits measurements?
Netherlands 3 neutral 1
Q22:26 Is the monthly amount of time assigned for business benefits measurements process execution a good measure of business benefits measurements?
Netherlands 4 rather not 1
Q22:26 Is the monthly amount of time assigned for business benefits measurements process execution a good measure of business benefits measurements?
Netherlands 5 definitely not 1
Q22:26 Is the monthly amount of time assigned for business benefits measurements process execution a good measure of business benefits measurements?
Pakistan no answer 1
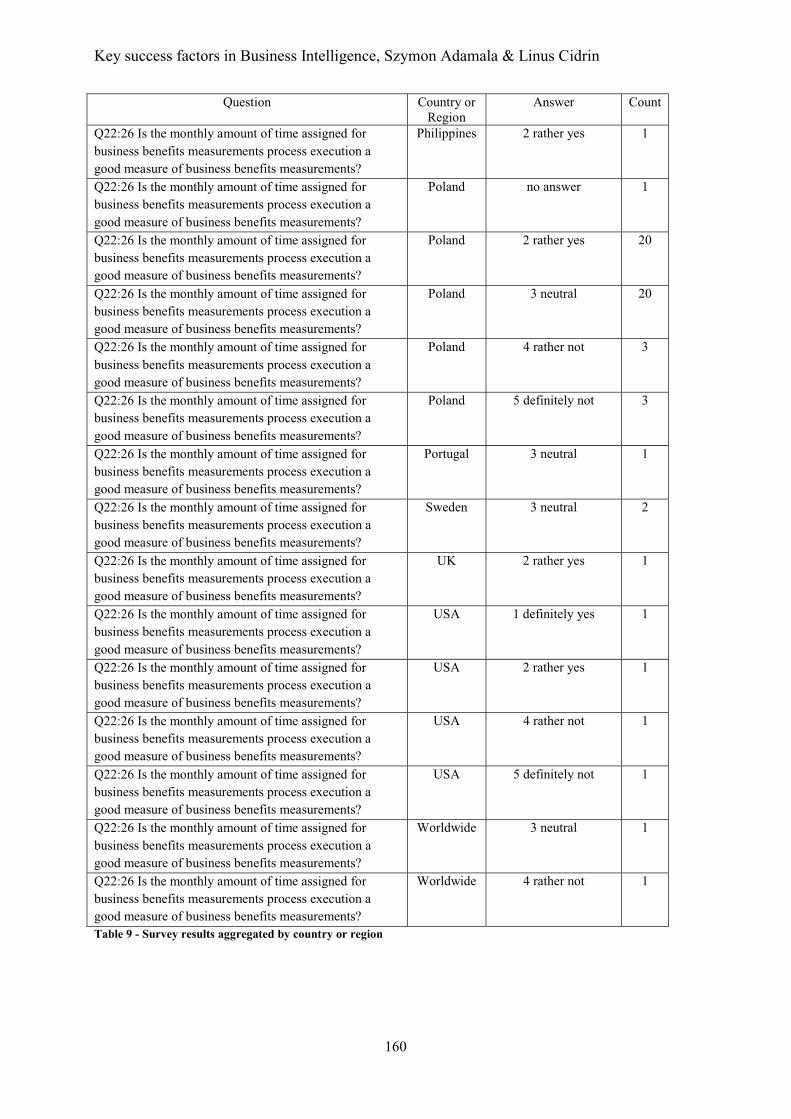
Key success factors in Business Intelligence, Szymon Adamala & Linus Cidrin
160
Question Country or Region
Answer Count
Q22:26 Is the monthly amount of time assigned for business benefits measurements process execution a good measure of business benefits measurements?
Philippines 2 rather yes 1
Q22:26 Is the monthly amount of time assigned for business benefits measurements process execution a good measure of business benefits measurements?
Poland no answer 1
Q22:26 Is the monthly amount of time assigned for business benefits measurements process execution a good measure of business benefits measurements?
Poland 2 rather yes 20
Q22:26 Is the monthly amount of time assigned for business benefits measurements process execution a good measure of business benefits measurements?
Poland 3 neutral 20
Q22:26 Is the monthly amount of time assigned for business benefits measurements process execution a good measure of business benefits measurements?
Poland 4 rather not 3
Q22:26 Is the monthly amount of time assigned for business benefits measurements process execution a good measure of business benefits measurements?
Poland 5 definitely not 3
Q22:26 Is the monthly amount of time assigned for business benefits measurements process execution a good measure of business benefits measurements?
Portugal 3 neutral 1
Q22:26 Is the monthly amount of time assigned for business benefits measurements process execution a good measure of business benefits measurements?
Sweden 3 neutral 2
Q22:26 Is the monthly amount of time assigned for business benefits measurements process execution a good measure of business benefits measurements?
UK 2 rather yes 1
Q22:26 Is the monthly amount of time assigned for business benefits measurements process execution a good measure of business benefits measurements?
USA 1 definitely yes 1
Q22:26 Is the monthly amount of time assigned for business benefits measurements process execution a good measure of business benefits measurements?
USA 2 rather yes 1
Q22:26 Is the monthly amount of time assigned for business benefits measurements process execution a good measure of business benefits measurements?
USA 4 rather not 1
Q22:26 Is the monthly amount of time assigned for business benefits measurements process execution a good measure of business benefits measurements?
USA 5 definitely not 1
Q22:26 Is the monthly amount of time assigned for business benefits measurements process execution a good measure of business benefits measurements?
Worldwide 3 neutral 1
Q22:26 Is the monthly amount of time assigned for business benefits measurements process execution a good measure of business benefits measurements?
Worldwide 4 rather not 1
Table 9 - Survey results aggregated by country or region
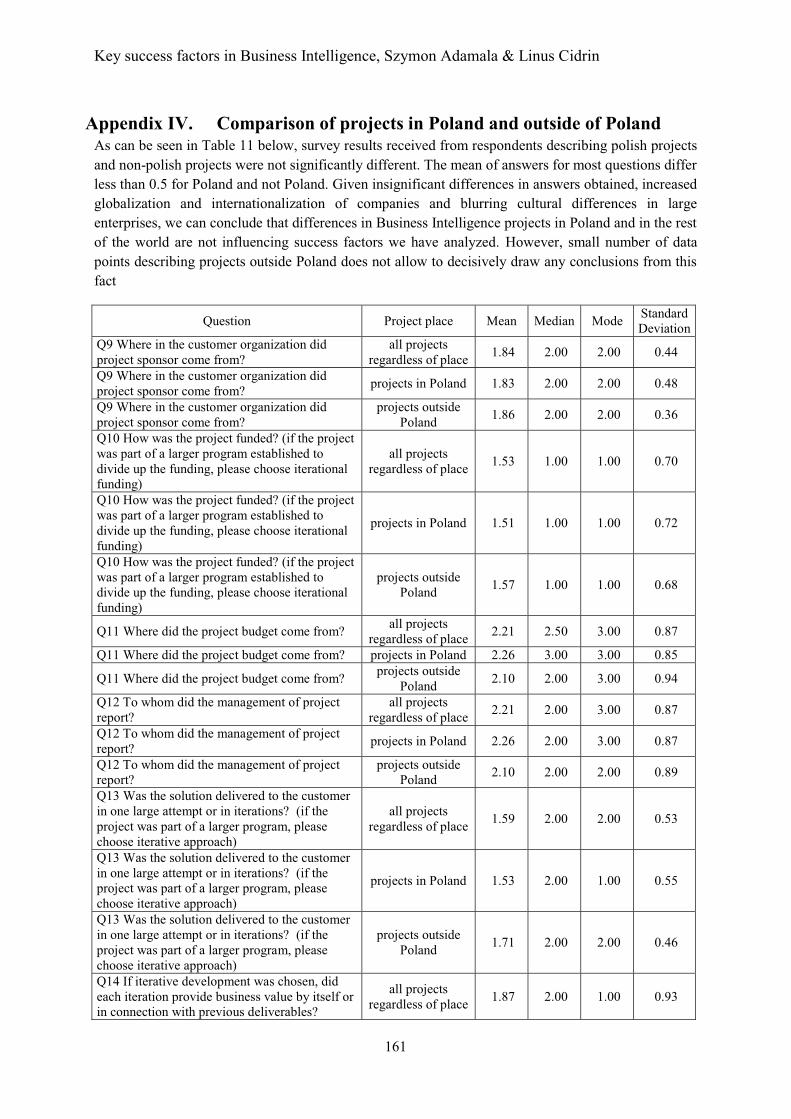
Key success factors in Business Intelligence, Szymon Adamala & Linus Cidrin
161
Appendix IV. Comparison of projects in Poland and outside of Poland As can be seen in Table 11 below, survey results received from respondents describing polish projects and non-polish projects were not significantly different. The mean of answers for most questions differ less than 0.5 for Poland and not Poland. Given insignificant differences in answers obtained, increased globalization and internationalization of companies and blurring cultural differences in large enterprises, we can conclude that differences in Business Intelligence projects in Poland and in the rest of the world are not influencing success factors we have analyzed. However, small number of data points describing projects outside Poland does not allow to decisively draw any conclusions from this fact
Question Project place Mean Median Mode Standard Deviation
Q9 Where in the customer organization did project sponsor come from?
all projects regardless of place 1.84 2.00 2.00 0.44
Q9 Where in the customer organization did project sponsor come from? projects in Poland 1.83 2.00 2.00 0.48
Q9 Where in the customer organization did project sponsor come from?
projects outside Poland 1.86 2.00 2.00 0.36
Q10 How was the project funded? (if the project was part of a larger program established to divide up the funding, please choose iterational funding)
all projects regardless of place 1.53 1.00 1.00 0.70
Q10 How was the project funded? (if the project was part of a larger program established to divide up the funding, please choose iterational funding)
projects in Poland 1.51 1.00 1.00 0.72
Q10 How was the project funded? (if the project was part of a larger program established to divide up the funding, please choose iterational funding)
projects outside Poland 1.57 1.00 1.00 0.68
Q11 Where did the project budget come from? all projects regardless of place 2.21 2.50 3.00 0.87
Q11 Where did the project budget come from? projects in Poland 2.26 3.00 3.00 0.85
Q11 Where did the project budget come from? projects outside Poland 2.10 2.00 3.00 0.94
Q12 To whom did the management of project report?
all projects regardless of place 2.21 2.00 3.00 0.87
Q12 To whom did the management of project report? projects in Poland 2.26 2.00 3.00 0.87
Q12 To whom did the management of project report?
projects outside Poland 2.10 2.00 2.00 0.89
Q13 Was the solution delivered to the customer in one large attempt or in iterations? (if the project was part of a larger program, please choose iterative approach)
all projects regardless of place 1.59 2.00 2.00 0.53
Q13 Was the solution delivered to the customer in one large attempt or in iterations? (if the project was part of a larger program, please choose iterative approach)
projects in Poland 1.53 2.00 1.00 0.55
Q13 Was the solution delivered to the customer in one large attempt or in iterations? (if the project was part of a larger program, please choose iterative approach)
projects outside Poland 1.71 2.00 2.00 0.46
Q14 If iterative development was chosen, did each iteration provide business value by itself or in connection with previous deliverables?
all projects regardless of place 1.87 2.00 1.00 0.93
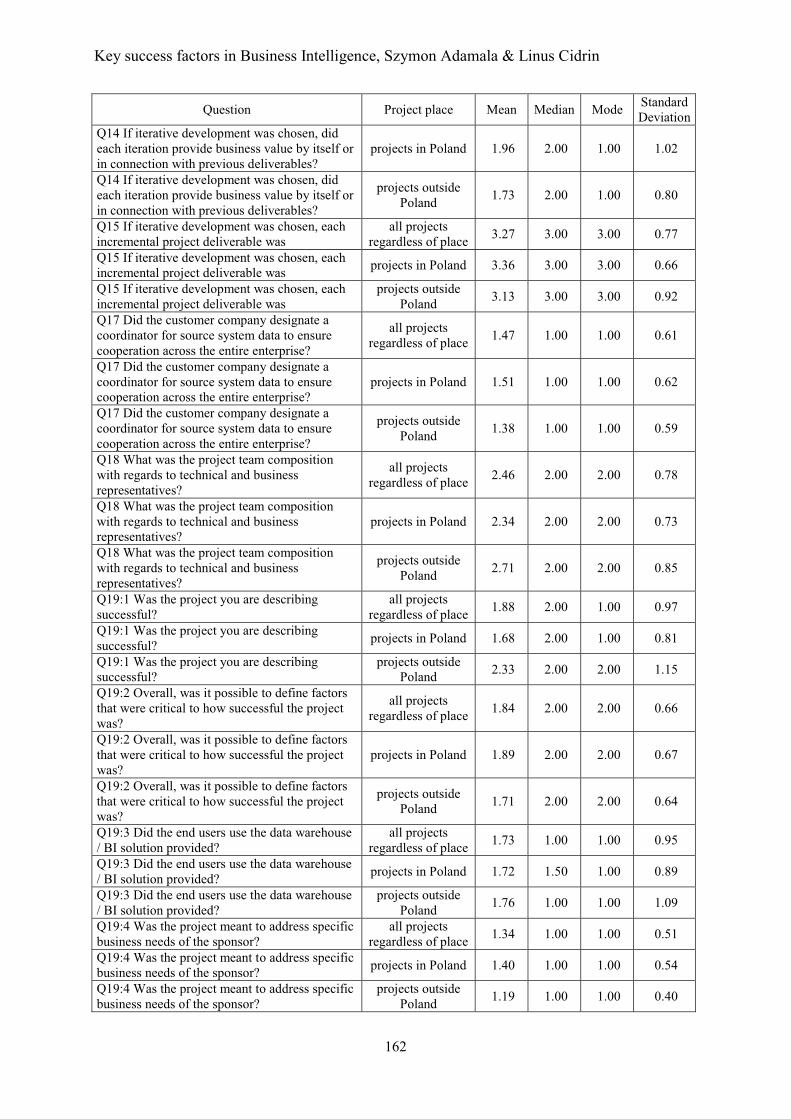
Key success factors in Business Intelligence, Szymon Adamala & Linus Cidrin
162
Question Project place Mean Median Mode Standard Deviation
Q14 If iterative development was chosen, did each iteration provide business value by itself or in connection with previous deliverables?
projects in Poland 1.96 2.00 1.00 1.02
Q14 If iterative development was chosen, did each iteration provide business value by itself or in connection with previous deliverables?
projects outside Poland 1.73 2.00 1.00 0.80
Q15 If iterative development was chosen, each incremental project deliverable was
all projects regardless of place 3.27 3.00 3.00 0.77
Q15 If iterative development was chosen, each incremental project deliverable was projects in Poland 3.36 3.00 3.00 0.66
Q15 If iterative development was chosen, each incremental project deliverable was
projects outside Poland 3.13 3.00 3.00 0.92
Q17 Did the customer company designate a coordinator for source system data to ensure cooperation across the entire enterprise?
all projects regardless of place 1.47 1.00 1.00 0.61
Q17 Did the customer company designate a coordinator for source system data to ensure cooperation across the entire enterprise?
projects in Poland 1.51 1.00 1.00 0.62
Q17 Did the customer company designate a coordinator for source system data to ensure cooperation across the entire enterprise?
projects outside Poland 1.38 1.00 1.00 0.59
Q18 What was the project team composition with regards to technical and business representatives?
all projects regardless of place 2.46 2.00 2.00 0.78
Q18 What was the project team composition with regards to technical and business representatives?
projects in Poland 2.34 2.00 2.00 0.73
Q18 What was the project team composition with regards to technical and business representatives?
projects outside Poland 2.71 2.00 2.00 0.85
Q19:1 Was the project you are describing successful?
all projects regardless of place 1.88 2.00 1.00 0.97
Q19:1 Was the project you are describing successful? projects in Poland 1.68 2.00 1.00 0.81
Q19:1 Was the project you are describing successful?
projects outside Poland 2.33 2.00 2.00 1.15
Q19:2 Overall, was it possible to define factors that were critical to how successful the project was?
all projects regardless of place 1.84 2.00 2.00 0.66
Q19:2 Overall, was it possible to define factors that were critical to how successful the project was?
projects in Poland 1.89 2.00 2.00 0.67
Q19:2 Overall, was it possible to define factors that were critical to how successful the project was?
projects outside Poland 1.71 2.00 2.00 0.64
Q19:3 Did the end users use the data warehouse / BI solution provided?
all projects regardless of place 1.73 1.00 1.00 0.95
Q19:3 Did the end users use the data warehouse / BI solution provided? projects in Poland 1.72 1.50 1.00 0.89
Q19:3 Did the end users use the data warehouse / BI solution provided?
projects outside Poland 1.76 1.00 1.00 1.09
Q19:4 Was the project meant to address specific business needs of the sponsor?
all projects regardless of place 1.34 1.00 1.00 0.51
Q19:4 Was the project meant to address specific business needs of the sponsor? projects in Poland 1.40 1.00 1.00 0.54
Q19:4 Was the project meant to address specific business needs of the sponsor?
projects outside Poland 1.19 1.00 1.00 0.40
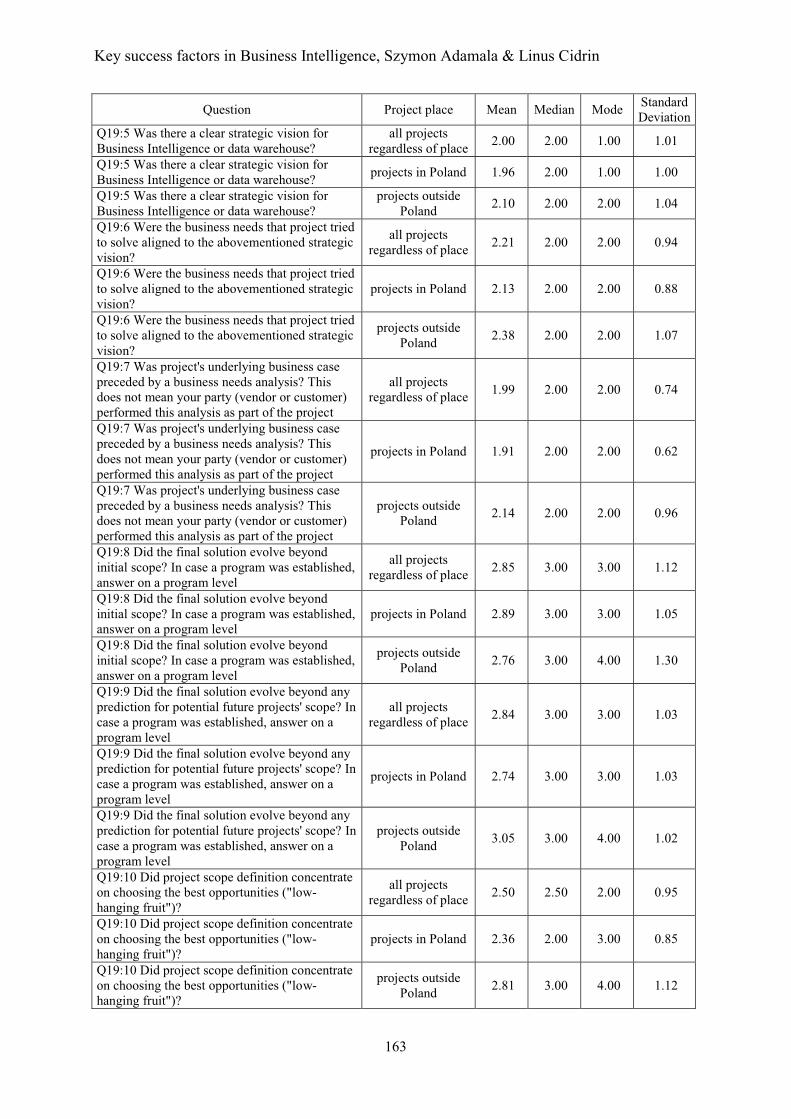
Key success factors in Business Intelligence, Szymon Adamala & Linus Cidrin
163
Question Project place Mean Median Mode Standard Deviation
Q19:5 Was there a clear strategic vision for Business Intelligence or data warehouse?
all projects regardless of place 2.00 2.00 1.00 1.01
Q19:5 Was there a clear strategic vision for Business Intelligence or data warehouse? projects in Poland 1.96 2.00 1.00 1.00
Q19:5 Was there a clear strategic vision for Business Intelligence or data warehouse?
projects outside Poland 2.10 2.00 2.00 1.04
Q19:6 Were the business needs that project tried to solve aligned to the abovementioned strategic vision?
all projects regardless of place 2.21 2.00 2.00 0.94
Q19:6 Were the business needs that project tried to solve aligned to the abovementioned strategic vision?
projects in Poland 2.13 2.00 2.00 0.88
Q19:6 Were the business needs that project tried to solve aligned to the abovementioned strategic vision?
projects outside Poland 2.38 2.00 2.00 1.07
Q19:7 Was project's underlying business case preceded by a business needs analysis? This does not mean your party (vendor or customer) performed this analysis as part of the project
all projects regardless of place 1.99 2.00 2.00 0.74
Q19:7 Was project's underlying business case preceded by a business needs analysis? This does not mean your party (vendor or customer) performed this analysis as part of the project
projects in Poland 1.91 2.00 2.00 0.62
Q19:7 Was project's underlying business case preceded by a business needs analysis? This does not mean your party (vendor or customer) performed this analysis as part of the project
projects outside Poland 2.14 2.00 2.00 0.96
Q19:8 Did the final solution evolve beyond initial scope? In case a program was established, answer on a program level
all projects regardless of place 2.85 3.00 3.00 1.12
Q19:8 Did the final solution evolve beyond initial scope? In case a program was established, answer on a program level
projects in Poland 2.89 3.00 3.00 1.05
Q19:8 Did the final solution evolve beyond initial scope? In case a program was established, answer on a program level
projects outside Poland 2.76 3.00 4.00 1.30
Q19:9 Did the final solution evolve beyond any prediction for potential future projects' scope? In case a program was established, answer on a program level
all projects regardless of place 2.84 3.00 3.00 1.03
Q19:9 Did the final solution evolve beyond any prediction for potential future projects' scope? In case a program was established, answer on a program level
projects in Poland 2.74 3.00 3.00 1.03
Q19:9 Did the final solution evolve beyond any prediction for potential future projects' scope? In case a program was established, answer on a program level
projects outside Poland 3.05 3.00 4.00 1.02
Q19:10 Did project scope definition concentrate on choosing the best opportunities ("low-hanging fruit")?
all projects regardless of place 2.50 2.50 2.00 0.95
Q19:10 Did project scope definition concentrate on choosing the best opportunities ("low-hanging fruit")?
projects in Poland 2.36 2.00 3.00 0.85
Q19:10 Did project scope definition concentrate on choosing the best opportunities ("low-hanging fruit")?
projects outside Poland 2.81 3.00 4.00 1.12
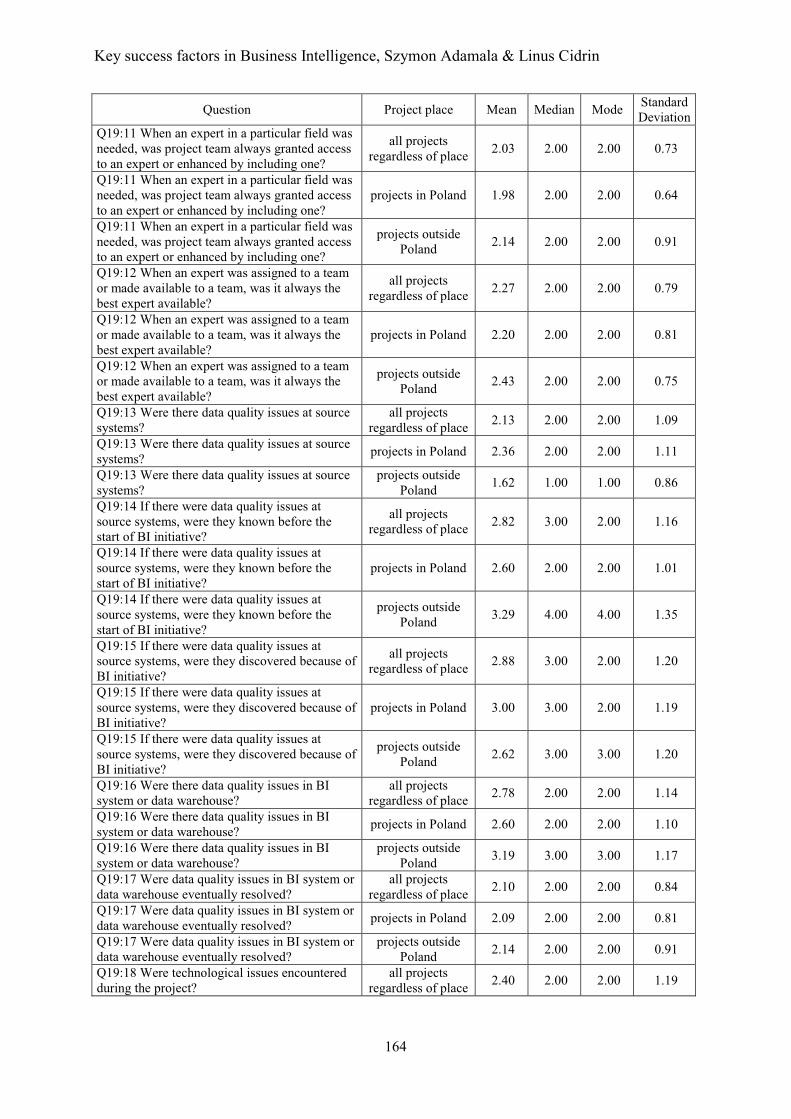
Key success factors in Business Intelligence, Szymon Adamala & Linus Cidrin
164
Question Project place Mean Median Mode Standard Deviation
Q19:11 When an expert in a particular field was needed, was project team always granted access to an expert or enhanced by including one?
all projects regardless of place 2.03 2.00 2.00 0.73
Q19:11 When an expert in a particular field was needed, was project team always granted access to an expert or enhanced by including one?
projects in Poland 1.98 2.00 2.00 0.64
Q19:11 When an expert in a particular field was needed, was project team always granted access to an expert or enhanced by including one?
projects outside Poland 2.14 2.00 2.00 0.91
Q19:12 When an expert was assigned to a team or made available to a team, was it always the best expert available?
all projects regardless of place 2.27 2.00 2.00 0.79
Q19:12 When an expert was assigned to a team or made available to a team, was it always the best expert available?
projects in Poland 2.20 2.00 2.00 0.81
Q19:12 When an expert was assigned to a team or made available to a team, was it always the best expert available?
projects outside Poland 2.43 2.00 2.00 0.75
Q19:13 Were there data quality issues at source systems?
all projects regardless of place 2.13 2.00 2.00 1.09
Q19:13 Were there data quality issues at source systems? projects in Poland 2.36 2.00 2.00 1.11
Q19:13 Were there data quality issues at source systems?
projects outside Poland 1.62 1.00 1.00 0.86
Q19:14 If there were data quality issues at source systems, were they known before the start of BI initiative?
all projects regardless of place 2.82 3.00 2.00 1.16
Q19:14 If there were data quality issues at source systems, were they known before the start of BI initiative?
projects in Poland 2.60 2.00 2.00 1.01
Q19:14 If there were data quality issues at source systems, were they known before the start of BI initiative?
projects outside Poland 3.29 4.00 4.00 1.35
Q19:15 If there were data quality issues at source systems, were they discovered because of BI initiative?
all projects regardless of place 2.88 3.00 2.00 1.20
Q19:15 If there were data quality issues at source systems, were they discovered because of BI initiative?
projects in Poland 3.00 3.00 2.00 1.19
Q19:15 If there were data quality issues at source systems, were they discovered because of BI initiative?
projects outside Poland 2.62 3.00 3.00 1.20
Q19:16 Were there data quality issues in BI system or data warehouse?
all projects regardless of place 2.78 2.00 2.00 1.14
Q19:16 Were there data quality issues in BI system or data warehouse? projects in Poland 2.60 2.00 2.00 1.10
Q19:16 Were there data quality issues in BI system or data warehouse?
projects outside Poland 3.19 3.00 3.00 1.17
Q19:17 Were data quality issues in BI system or data warehouse eventually resolved?
all projects regardless of place 2.10 2.00 2.00 0.84
Q19:17 Were data quality issues in BI system or data warehouse eventually resolved? projects in Poland 2.09 2.00 2.00 0.81
Q19:17 Were data quality issues in BI system or data warehouse eventually resolved?
projects outside Poland 2.14 2.00 2.00 0.91
Q19:18 Were technological issues encountered during the project?
all projects regardless of place 2.40 2.00 2.00 1.19
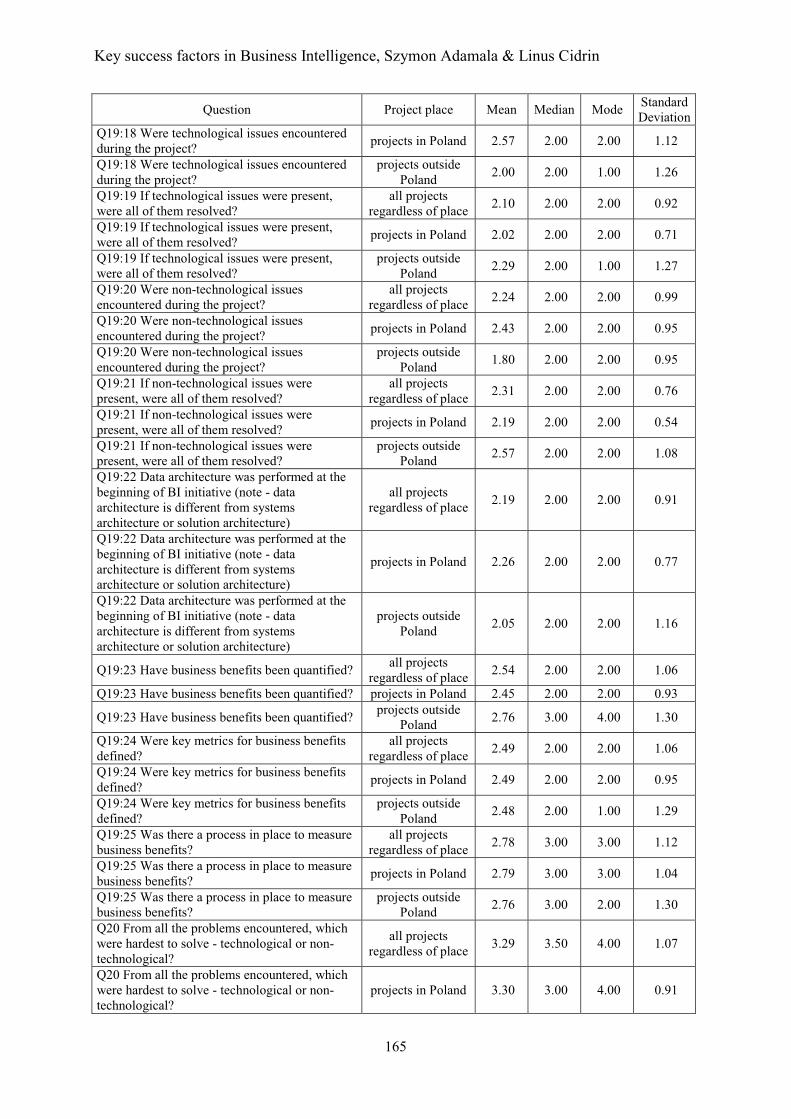
Key success factors in Business Intelligence, Szymon Adamala & Linus Cidrin
165
Question Project place Mean Median Mode Standard Deviation
Q19:18 Were technological issues encountered during the project? projects in Poland 2.57 2.00 2.00 1.12
Q19:18 Were technological issues encountered during the project?
projects outside Poland 2.00 2.00 1.00 1.26
Q19:19 If technological issues were present, were all of them resolved?
all projects regardless of place 2.10 2.00 2.00 0.92
Q19:19 If technological issues were present, were all of them resolved? projects in Poland 2.02 2.00 2.00 0.71
Q19:19 If technological issues were present, were all of them resolved?
projects outside Poland 2.29 2.00 1.00 1.27
Q19:20 Were non-technological issues encountered during the project?
all projects regardless of place 2.24 2.00 2.00 0.99
Q19:20 Were non-technological issues encountered during the project? projects in Poland 2.43 2.00 2.00 0.95
Q19:20 Were non-technological issues encountered during the project?
projects outside Poland 1.80 2.00 2.00 0.95
Q19:21 If non-technological issues were present, were all of them resolved?
all projects regardless of place 2.31 2.00 2.00 0.76
Q19:21 If non-technological issues were present, were all of them resolved? projects in Poland 2.19 2.00 2.00 0.54
Q19:21 If non-technological issues were present, were all of them resolved?
projects outside Poland 2.57 2.00 2.00 1.08
Q19:22 Data architecture was performed at the beginning of BI initiative (note - data architecture is different from systems architecture or solution architecture)
all projects regardless of place 2.19 2.00 2.00 0.91
Q19:22 Data architecture was performed at the beginning of BI initiative (note - data architecture is different from systems architecture or solution architecture)
projects in Poland 2.26 2.00 2.00 0.77
Q19:22 Data architecture was performed at the beginning of BI initiative (note - data architecture is different from systems architecture or solution architecture)
projects outside Poland 2.05 2.00 2.00 1.16
Q19:23 Have business benefits been quantified? all projects regardless of place 2.54 2.00 2.00 1.06
Q19:23 Have business benefits been quantified? projects in Poland 2.45 2.00 2.00 0.93
Q19:23 Have business benefits been quantified? projects outside Poland 2.76 3.00 4.00 1.30
Q19:24 Were key metrics for business benefits defined?
all projects regardless of place 2.49 2.00 2.00 1.06
Q19:24 Were key metrics for business benefits defined? projects in Poland 2.49 2.00 2.00 0.95
Q19:24 Were key metrics for business benefits defined?
projects outside Poland 2.48 2.00 1.00 1.29
Q19:25 Was there a process in place to measure business benefits?
all projects regardless of place 2.78 3.00 3.00 1.12
Q19:25 Was there a process in place to measure business benefits? projects in Poland 2.79 3.00 3.00 1.04
Q19:25 Was there a process in place to measure business benefits?
projects outside Poland 2.76 3.00 2.00 1.30
Q20 From all the problems encountered, which were hardest to solve - technological or non-technological?
all projects regardless of place 3.29 3.50 4.00 1.07
Q20 From all the problems encountered, which were hardest to solve - technological or non-technological?
projects in Poland 3.30 3.00 4.00 0.91

Key success factors in Business Intelligence, Szymon Adamala & Linus Cidrin
166
Question Project place Mean Median Mode Standard Deviation
Q20 From all the problems encountered, which were hardest to solve - technological or non-technological?
projects outside Poland 3.29 4.00 4.00 1.38
Q21 From all the time spent resolving pending issues, most of it was devoted to technological or non-technological problems?
all projects regardless of place 3.07 3.00 3.00 0.95
Q21 From all the time spent resolving pending issues, most of it was devoted to technological or non-technological problems?
projects in Poland 3.15 3.00 3.00 0.93
Q21 From all the time spent resolving pending issues, most of it was devoted to technological or non-technological problems?
projects outside Poland 2.90 3.00 2.00 1.00
Q22:1 Do you think weekly number of distinct users is a good measure of data warehouse use?
all projects regardless of place 2.58 2.00 2.00 1.14
Q22:1 Do you think weekly number of distinct users is a good measure of data warehouse use? projects in Poland 2.60 2.00 2.00 1.14
Q22:1 Do you think weekly number of distinct users is a good measure of data warehouse use?
projects outside Poland 2.55 2.00 2.00 1.19
Q22:2 Do you think weekly number of queries submitted is a good measure of data warehouse
all projects regardless of place 2.33 2.00 2.00 1.17
Q22:2 Do you think weekly number of queries submitted is a good measure of data warehouse projects in Poland 2.09 2.00 1.00 1.06
Q22:2 Do you think weekly number of queries submitted is a good measure of data warehouse
projects outside Poland 2.90 2.50 2.00 1.25
Q22:3 Do you think weekly number of logons is a good measure of data warehouse use?
all projects regardless of place 3.03 3.00 2.00 0.94
Q22:3 Do you think weekly number of logons is a good measure of data warehouse use? projects in Poland 3.00 3.00 2.00 0.86
Q22:3 Do you think weekly number of logons is a good measure of data warehouse use?
projects outside Poland 3.10 3.00 2.00 1.12
Q22:4 Do you think that mean response time for a request is a good measure for access to subject matter experts?
all projects regardless of place 2.19 2.00 2.00 0.86
Q22:4 Do you think that mean response time for a request is a good measure for access to subject matter experts?
projects in Poland 2.15 2.00 2.00 0.88
Q22:4 Do you think that mean response time for a request is a good measure for access to subject matter experts?
projects outside Poland 2.30 2.00 2.00 0.80
Q22:5 Do you think that percentage of requests responded within one business day is a good measure for access to subject matter experts?
all projects regardless of place 2.36 2.00 2.00 0.73
Q22:5 Do you think that percentage of requests responded within one business day is a good measure for access to subject matter experts?
projects in Poland 2.26 2.00 2.00 0.71
Q22:5 Do you think that percentage of requests responded within one business day is a good measure for access to subject matter experts?
projects outside Poland 2.60 3.00 3.00 0.75
Q22:6 Do you think that average number of questions needed to be asked per subject matter issue is a good measure for subject matter expert quality?
all projects regardless of place 3.04 3.00 3.00 0.77
Q22:6 Do you think that average number of questions needed to be asked per subject matter issue is a good measure for subject matter expert quality?
projects in Poland 3.04 3.00 3.00 0.78
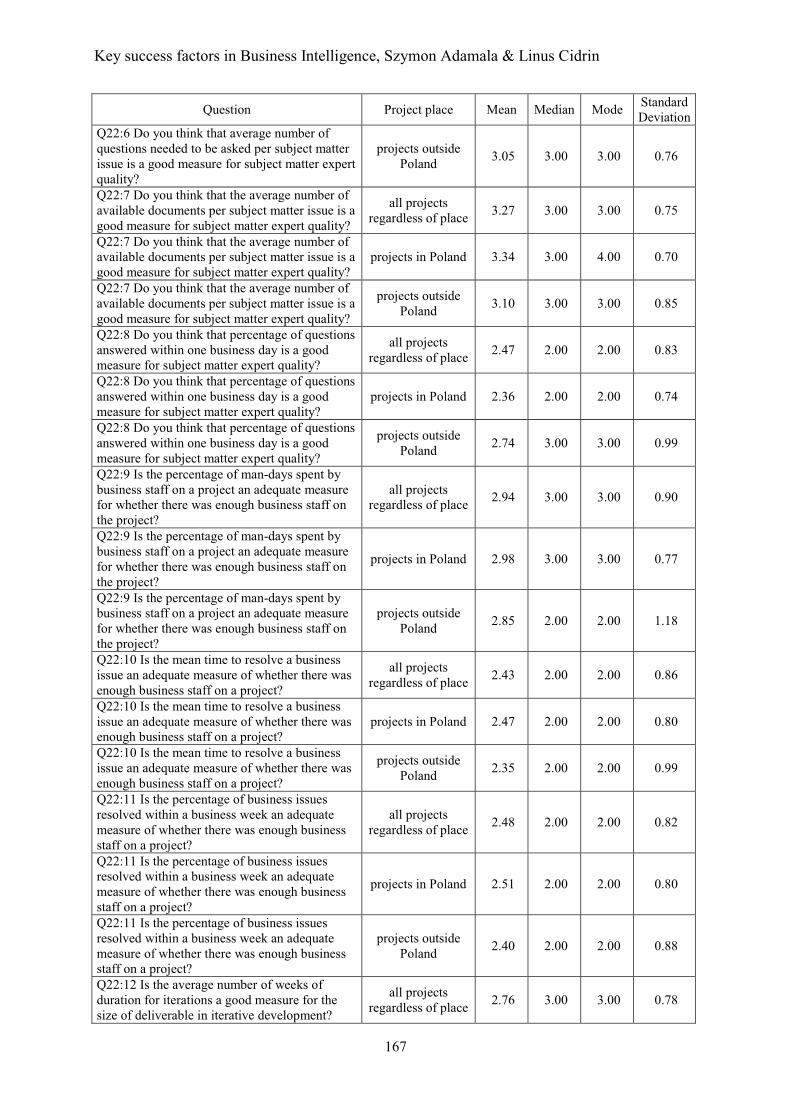
Key success factors in Business Intelligence, Szymon Adamala & Linus Cidrin
167
Question Project place Mean Median Mode Standard Deviation
Q22:6 Do you think that average number of questions needed to be asked per subject matter issue is a good measure for subject matter expert quality?
projects outside Poland 3.05 3.00 3.00 0.76
Q22:7 Do you think that the average number of available documents per subject matter issue is a good measure for subject matter expert quality?
all projects regardless of place 3.27 3.00 3.00 0.75
Q22:7 Do you think that the average number of available documents per subject matter issue is a good measure for subject matter expert quality?
projects in Poland 3.34 3.00 4.00 0.70
Q22:7 Do you think that the average number of available documents per subject matter issue is a good measure for subject matter expert quality?
projects outside Poland 3.10 3.00 3.00 0.85
Q22:8 Do you think that percentage of questions answered within one business day is a good measure for subject matter expert quality?
all projects regardless of place 2.47 2.00 2.00 0.83
Q22:8 Do you think that percentage of questions answered within one business day is a good measure for subject matter expert quality?
projects in Poland 2.36 2.00 2.00 0.74
Q22:8 Do you think that percentage of questions answered within one business day is a good measure for subject matter expert quality?
projects outside Poland 2.74 3.00 3.00 0.99
Q22:9 Is the percentage of man-days spent by business staff on a project an adequate measure for whether there was enough business staff on the project?
all projects regardless of place 2.94 3.00 3.00 0.90
Q22:9 Is the percentage of man-days spent by business staff on a project an adequate measure for whether there was enough business staff on the project?
projects in Poland 2.98 3.00 3.00 0.77
Q22:9 Is the percentage of man-days spent by business staff on a project an adequate measure for whether there was enough business staff on the project?
projects outside Poland 2.85 2.00 2.00 1.18
Q22:10 Is the mean time to resolve a business issue an adequate measure of whether there was enough business staff on a project?
all projects regardless of place 2.43 2.00 2.00 0.86
Q22:10 Is the mean time to resolve a business issue an adequate measure of whether there was enough business staff on a project?
projects in Poland 2.47 2.00 2.00 0.80
Q22:10 Is the mean time to resolve a business issue an adequate measure of whether there was enough business staff on a project?
projects outside Poland 2.35 2.00 2.00 0.99
Q22:11 Is the percentage of business issues resolved within a business week an adequate measure of whether there was enough business staff on a project?
all projects regardless of place 2.48 2.00 2.00 0.82
Q22:11 Is the percentage of business issues resolved within a business week an adequate measure of whether there was enough business staff on a project?
projects in Poland 2.51 2.00 2.00 0.80
Q22:11 Is the percentage of business issues resolved within a business week an adequate measure of whether there was enough business staff on a project?
projects outside Poland 2.40 2.00 2.00 0.88
Q22:12 Is the average number of weeks of duration for iterations a good measure for the size of deliverable in iterative development?
all projects regardless of place 2.76 3.00 3.00 0.78
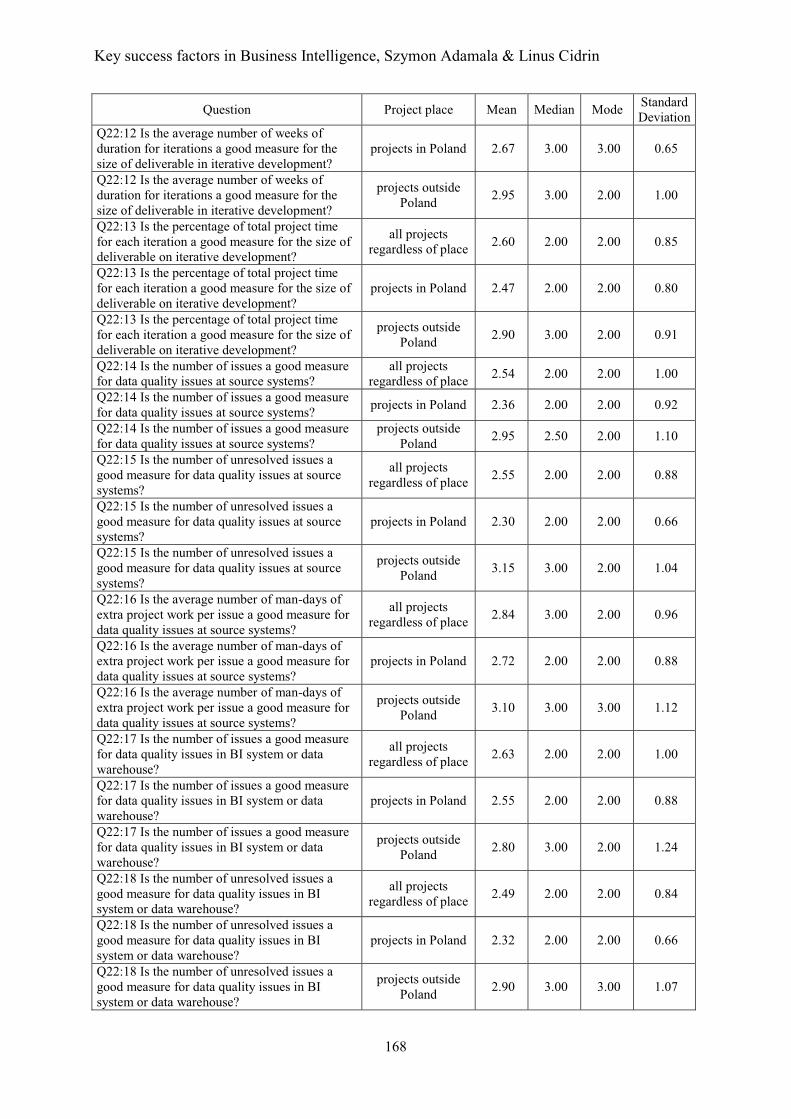
Key success factors in Business Intelligence, Szymon Adamala & Linus Cidrin
168
Question Project place Mean Median Mode Standard Deviation
Q22:12 Is the average number of weeks of duration for iterations a good measure for the size of deliverable in iterative development?
projects in Poland 2.67 3.00 3.00 0.65
Q22:12 Is the average number of weeks of duration for iterations a good measure for the size of deliverable in iterative development?
projects outside Poland 2.95 3.00 2.00 1.00
Q22:13 Is the percentage of total project time for each iteration a good measure for the size of deliverable on iterative development?
all projects regardless of place 2.60 2.00 2.00 0.85
Q22:13 Is the percentage of total project time for each iteration a good measure for the size of deliverable on iterative development?
projects in Poland 2.47 2.00 2.00 0.80
Q22:13 Is the percentage of total project time for each iteration a good measure for the size of deliverable on iterative development?
projects outside Poland 2.90 3.00 2.00 0.91
Q22:14 Is the number of issues a good measure for data quality issues at source systems?
all projects regardless of place 2.54 2.00 2.00 1.00
Q22:14 Is the number of issues a good measure for data quality issues at source systems? projects in Poland 2.36 2.00 2.00 0.92
Q22:14 Is the number of issues a good measure for data quality issues at source systems?
projects outside Poland 2.95 2.50 2.00 1.10
Q22:15 Is the number of unresolved issues a good measure for data quality issues at source systems?
all projects regardless of place 2.55 2.00 2.00 0.88
Q22:15 Is the number of unresolved issues a good measure for data quality issues at source systems?
projects in Poland 2.30 2.00 2.00 0.66
Q22:15 Is the number of unresolved issues a good measure for data quality issues at source systems?
projects outside Poland 3.15 3.00 2.00 1.04
Q22:16 Is the average number of man-days of extra project work per issue a good measure for data quality issues at source systems?
all projects regardless of place 2.84 3.00 2.00 0.96
Q22:16 Is the average number of man-days of extra project work per issue a good measure for data quality issues at source systems?
projects in Poland 2.72 2.00 2.00 0.88
Q22:16 Is the average number of man-days of extra project work per issue a good measure for data quality issues at source systems?
projects outside Poland 3.10 3.00 3.00 1.12
Q22:17 Is the number of issues a good measure for data quality issues in BI system or data warehouse?
all projects regardless of place 2.63 2.00 2.00 1.00
Q22:17 Is the number of issues a good measure for data quality issues in BI system or data warehouse?
projects in Poland 2.55 2.00 2.00 0.88
Q22:17 Is the number of issues a good measure for data quality issues in BI system or data warehouse?
projects outside Poland 2.80 3.00 2.00 1.24
Q22:18 Is the number of unresolved issues a good measure for data quality issues in BI system or data warehouse?
all projects regardless of place 2.49 2.00 2.00 0.84
Q22:18 Is the number of unresolved issues a good measure for data quality issues in BI system or data warehouse?
projects in Poland 2.32 2.00 2.00 0.66
Q22:18 Is the number of unresolved issues a good measure for data quality issues in BI system or data warehouse?
projects outside Poland 2.90 3.00 3.00 1.07
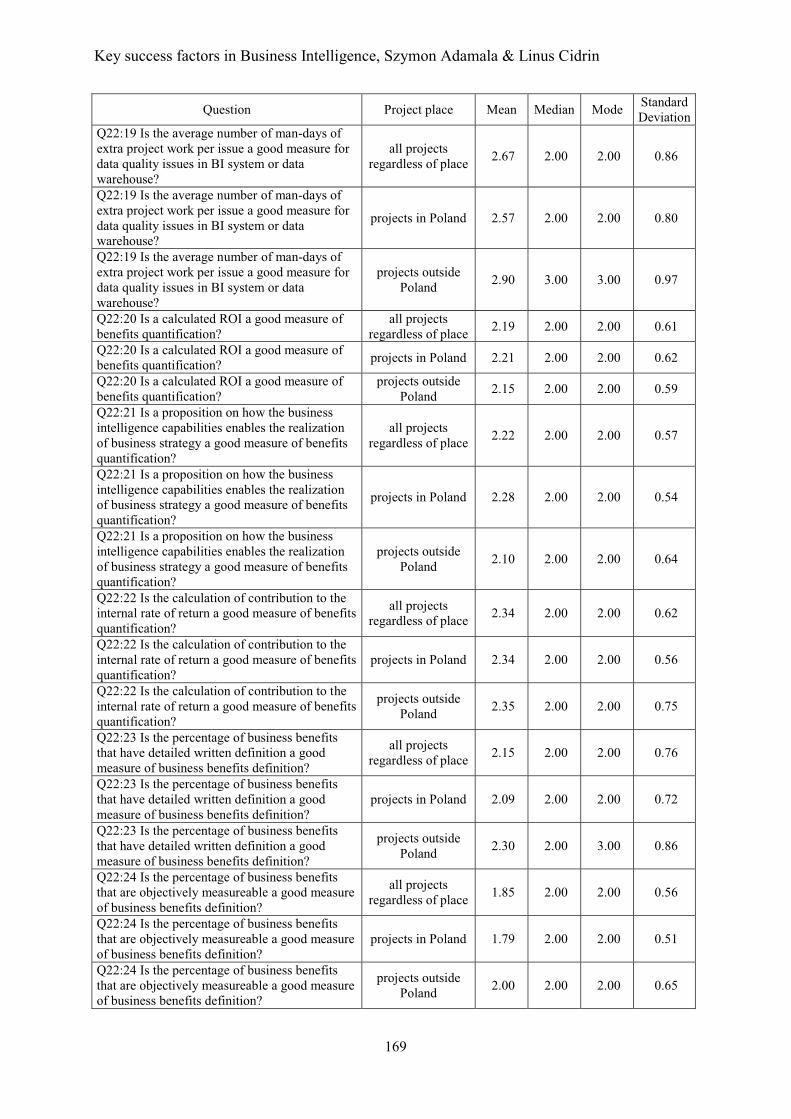
Key success factors in Business Intelligence, Szymon Adamala & Linus Cidrin
169
Question Project place Mean Median Mode Standard Deviation
Q22:19 Is the average number of man-days of extra project work per issue a good measure for data quality issues in BI system or data warehouse?
all projects regardless of place 2.67 2.00 2.00 0.86
Q22:19 Is the average number of man-days of extra project work per issue a good measure for data quality issues in BI system or data warehouse?
projects in Poland 2.57 2.00 2.00 0.80
Q22:19 Is the average number of man-days of extra project work per issue a good measure for data quality issues in BI system or data warehouse?
projects outside Poland 2.90 3.00 3.00 0.97
Q22:20 Is a calculated ROI a good measure of benefits quantification?
all projects regardless of place 2.19 2.00 2.00 0.61
Q22:20 Is a calculated ROI a good measure of benefits quantification? projects in Poland 2.21 2.00 2.00 0.62
Q22:20 Is a calculated ROI a good measure of benefits quantification?
projects outside Poland 2.15 2.00 2.00 0.59
Q22:21 Is a proposition on how the business intelligence capabilities enables the realization of business strategy a good measure of benefits quantification?
all projects regardless of place 2.22 2.00 2.00 0.57
Q22:21 Is a proposition on how the business intelligence capabilities enables the realization of business strategy a good measure of benefits quantification?
projects in Poland 2.28 2.00 2.00 0.54
Q22:21 Is a proposition on how the business intelligence capabilities enables the realization of business strategy a good measure of benefits quantification?
projects outside Poland 2.10 2.00 2.00 0.64
Q22:22 Is the calculation of contribution to the internal rate of return a good measure of benefits quantification?
all projects regardless of place 2.34 2.00 2.00 0.62
Q22:22 Is the calculation of contribution to the internal rate of return a good measure of benefits quantification?
projects in Poland 2.34 2.00 2.00 0.56
Q22:22 Is the calculation of contribution to the internal rate of return a good measure of benefits quantification?
projects outside Poland 2.35 2.00 2.00 0.75
Q22:23 Is the percentage of business benefits that have detailed written definition a good measure of business benefits definition?
all projects regardless of place 2.15 2.00 2.00 0.76
Q22:23 Is the percentage of business benefits that have detailed written definition a good measure of business benefits definition?
projects in Poland 2.09 2.00 2.00 0.72
Q22:23 Is the percentage of business benefits that have detailed written definition a good measure of business benefits definition?
projects outside Poland 2.30 2.00 3.00 0.86
Q22:24 Is the percentage of business benefits that are objectively measureable a good measure of business benefits definition?
all projects regardless of place 1.85 2.00 2.00 0.56
Q22:24 Is the percentage of business benefits that are objectively measureable a good measure of business benefits definition?
projects in Poland 1.79 2.00 2.00 0.51
Q22:24 Is the percentage of business benefits that are objectively measureable a good measure of business benefits definition?
projects outside Poland 2.00 2.00 2.00 0.65
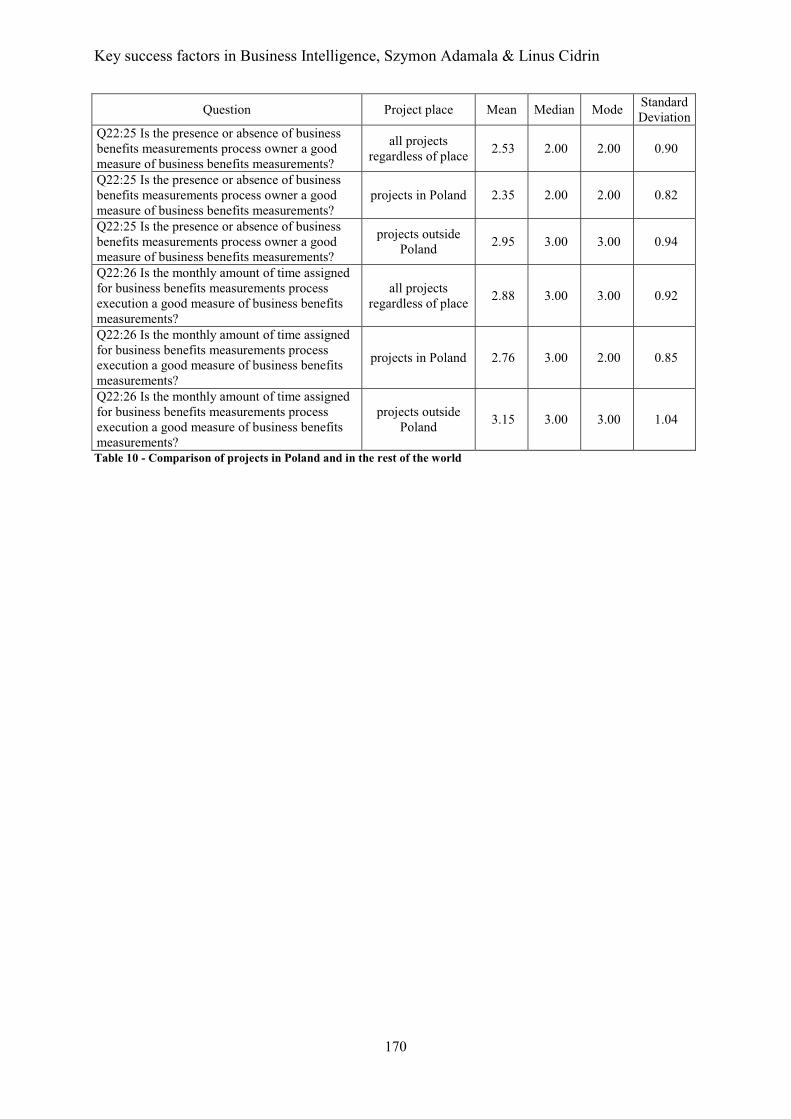
Key success factors in Business Intelligence, Szymon Adamala & Linus Cidrin
170
Question Project place Mean Median Mode Standard Deviation
Q22:25 Is the presence or absence of business benefits measurements process owner a good measure of business benefits measurements?
all projects regardless of place 2.53 2.00 2.00 0.90
Q22:25 Is the presence or absence of business benefits measurements process owner a good measure of business benefits measurements?
projects in Poland 2.35 2.00 2.00 0.82
Q22:25 Is the presence or absence of business benefits measurements process owner a good measure of business benefits measurements?
projects outside Poland 2.95 3.00 3.00 0.94
Q22:26 Is the monthly amount of time assigned for business benefits measurements process execution a good measure of business benefits measurements?
all projects regardless of place 2.88 3.00 3.00 0.92
Q22:26 Is the monthly amount of time assigned for business benefits measurements process execution a good measure of business benefits measurements?
projects in Poland 2.76 3.00 2.00 0.85
Q22:26 Is the monthly amount of time assigned for business benefits measurements process execution a good measure of business benefits measurements?
projects outside Poland 3.15 3.00 3.00 1.04
Table 10 - Comparison of projects in Poland and in the rest of the world
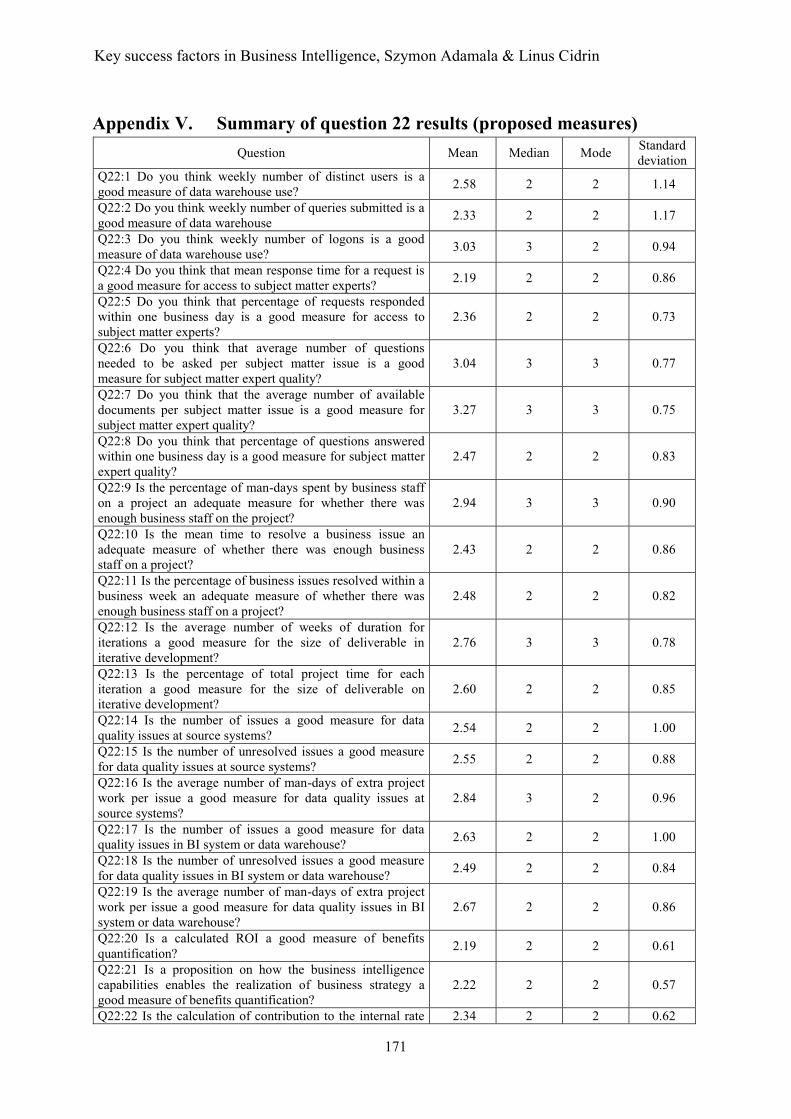
Key success factors in Business Intelligence, Szymon Adamala & Linus Cidrin
171
Appendix V. Summary of question 22 results (proposed measures) Question Mean Median Mode Standard
deviation Q22:1 Do you think weekly number of distinct users is a good measure of data warehouse use? 2.58 2 2 1.14
Q22:2 Do you think weekly number of queries submitted is a good measure of data warehouse 2.33 2 2 1.17
Q22:3 Do you think weekly number of logons is a good measure of data warehouse use? 3.03 3 2 0.94
Q22:4 Do you think that mean response time for a request is a good measure for access to subject matter experts? 2.19 2 2 0.86
Q22:5 Do you think that percentage of requests responded within one business day is a good measure for access to subject matter experts?
2.36 2 2 0.73
Q22:6 Do you think that average number of questions needed to be asked per subject matter issue is a good measure for subject matter expert quality?
3.04 3 3 0.77
Q22:7 Do you think that the average number of available documents per subject matter issue is a good measure for subject matter expert quality?
3.27 3 3 0.75
Q22:8 Do you think that percentage of questions answered within one business day is a good measure for subject matter expert quality?
2.47 2 2 0.83
Q22:9 Is the percentage of man-days spent by business staff on a project an adequate measure for whether there was enough business staff on the project?
2.94 3 3 0.90
Q22:10 Is the mean time to resolve a business issue an adequate measure of whether there was enough business staff on a project?
2.43 2 2 0.86
Q22:11 Is the percentage of business issues resolved within a business week an adequate measure of whether there was enough business staff on a project?
2.48 2 2 0.82
Q22:12 Is the average number of weeks of duration for iterations a good measure for the size of deliverable in iterative development?
2.76 3 3 0.78
Q22:13 Is the percentage of total project time for each iteration a good measure for the size of deliverable on iterative development?
2.60 2 2 0.85
Q22:14 Is the number of issues a good measure for data quality issues at source systems? 2.54 2 2 1.00
Q22:15 Is the number of unresolved issues a good measure for data quality issues at source systems? 2.55 2 2 0.88
Q22:16 Is the average number of man-days of extra project work per issue a good measure for data quality issues at source systems?
2.84 3 2 0.96
Q22:17 Is the number of issues a good measure for data quality issues in BI system or data warehouse? 2.63 2 2 1.00
Q22:18 Is the number of unresolved issues a good measure for data quality issues in BI system or data warehouse? 2.49 2 2 0.84
Q22:19 Is the average number of man-days of extra project work per issue a good measure for data quality issues in BI system or data warehouse?
2.67 2 2 0.86
Q22:20 Is a calculated ROI a good measure of benefits quantification? 2.19 2 2 0.61
Q22:21 Is a proposition on how the business intelligence capabilities enables the realization of business strategy a good measure of benefits quantification?
2.22 2 2 0.57
Q22:22 Is the calculation of contribution to the internal rate 2.34 2 2 0.62

Key success factors in Business Intelligence, Szymon Adamala & Linus Cidrin
172
Question Mean Median Mode Standard deviation
of return a good measure of benefits quantification? Q22:23 Is the percentage of business benefits that have detailed written definition a good measure of business benefits definition?
2.15 2 2 0.76
Q22:24 Is the percentage of business benefits that are objectively measureable a good measure of business benefits definition?
1.85 2 2 0.56
Q22:25 Is the presence or absence of business benefits measurements process owner a good measure of business benefits measurements?
2.53 2 2 0.90
Q22:26 Is the monthly amount of time assigned for business benefits measurements process execution a good measure of business benefits measurements?
2.88 3 3 0.92
Table 11 - Simple statistics for question 22