Steel & Scrap Market Overview. International Ferrous Scrap Trade Million Metric Tons Year.
Upload
hoangxuyenCategory
view
215download
0
2013
KeyStatiSticS
NoteAll data provided by the International Steel Statistics Bureau (ISSB) unless stated otherwise. Tel: +44 (0)20 7343 3900 www.issb.co.uk
Contents
UK steel production
Annual crude steel production and numbers employed 1992 - 2012 3
UK steelmaking materials & production 2012 3
Raw material costs: iron ore & hard coking coal 2007 - 2013 4
Scrap: mill receipts, net exports & price - from 2007 4
EU industrial electricity prices for extra large users July 2007 - June 2012 5
UK, EU and US forward wholesale gas prices 2006 - 2012 by quarter 5
Energy per tonne of steel produced 1973 - 2012 5
UK steel deliveries
UK steel mill home and export deliveries 1992 - 2012 6
UK steel mill deliveries to UK consumers andstockholders 2007 - 2013 by quarter 6
UK apparent demand & domestic share- steel industry products 2000 - 2012 7
UK steel requirement 2002 - 2012 7
UK steel trade
UK steel mill exports 2012 8
UK trade balance: steel mill products 1992 - 2012 8
UK steel industry contribution to balance of trade 2002 - 2012 9
Exchange rate/steel exports & imports 2003 - 2013 by quarter 9
UK steel market statistics
Home deliveries 2009 - 2012 10
Imports 2009 - 2012 10
UK demand 2009 - 2012 11
Exports 2009 - 2012 11
% total imports to total home market 2009 - 2012 11
UK steel market
UK demand for steel mill products 1972-2012 12
UK imports of steel mill products by country of origin 2012 12
Steel in the World
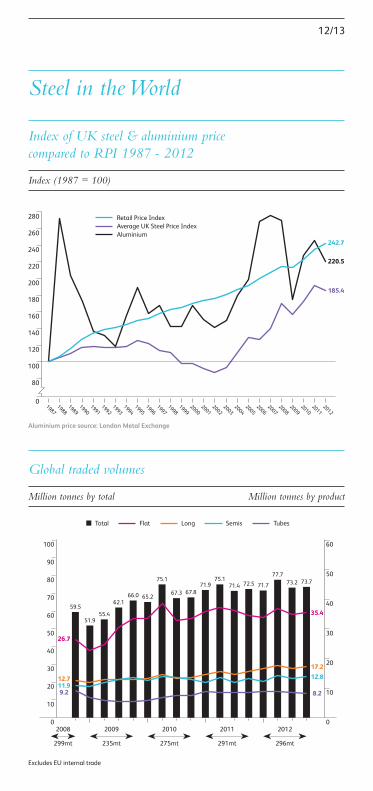
Index of UK steel price compared to RPI 1987 - 2012 13
Global traded volumes 2008 - 2012 by quarter 13
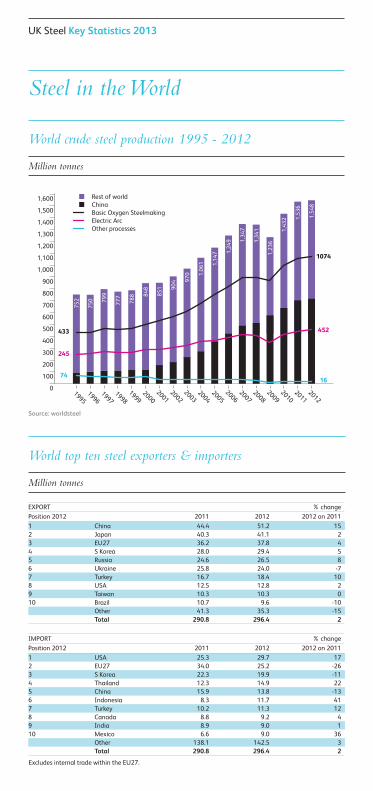
World crude steel production 1995 - 2012 14
Top ten steel trading countries 2011 - 2012 (exports and imports) 14
Global steel consumption by region 2002 & 2012 15
Crude steel production 2012 15
UK Steel Key Statistics 2013
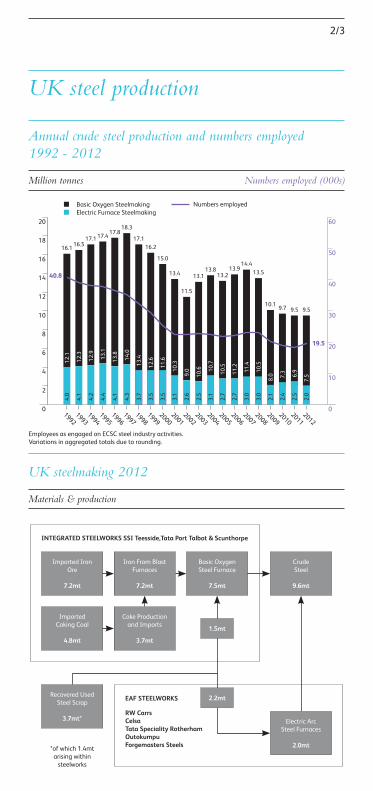
INTEGRATED STEELWORKS SSI Teesside,Tata Port Talbot & Scunthorpe
*of which 1.4mtarising within
steelworks
2.2mt
UK steelmaking 2012
Materials & production
EAF STEELWORKS
RW CarrsCelsaTata Speciality RotherhamOutokumpuForgemasters Steels
1.5mt
Iron From Blast Furnaces
7.2mt
Coke Productionand Imports
3.7mt
Recovered Used Steel Scrap
3.7mt*
ImportedCoking Coal
4.8mt
Imported IronOre
7.2mt
CrudeSteel
9.6mt
Basic OxygenSteel Furnace
7.5mt
Electric ArcSteel Furnaces
2.0mt
UK steel production12
.1
16.1
10.5
13.5
11.4
14.413.9
11.2
10.5
13.2
10.7
13.8
10.6
18
16
14
12
10
8
6
4
2
20
13.1
9.0
11.5
10.3
13.4
11.6
15.0
12.6
16.2
13.4
17.1
14.0
18.3
13.8
17.8
13.1
17.4
12.9
17.1
12.3
16.5
8.0
10.1
7.3
9.7
Employees as engaged on ECSC steel industry activities.Variations in aggregated totals due to rounding.
Annual crude steel production and numbers employed1992 - 2012 Million tonnes Numbers employed (000s)
40.8
19.5
Basic Oxygen SteelmakingElectric Furnace Steelmaking
Numbers employed
4.0
3.0
3.0
2.7
2.7
3.1
2.5
2.6
3.1
3.5
3.5
3.7
4.3
4.1
4.4
4.2
4.1
2.1
2.4
2.0
7.5
9.5
19921993
19941995
19961997
19981999
20002001
20022003
20042005
20062007
20082009
20102011
2012
2.5
6.9
9.5
10
20
30
40
50
60
00
2/3
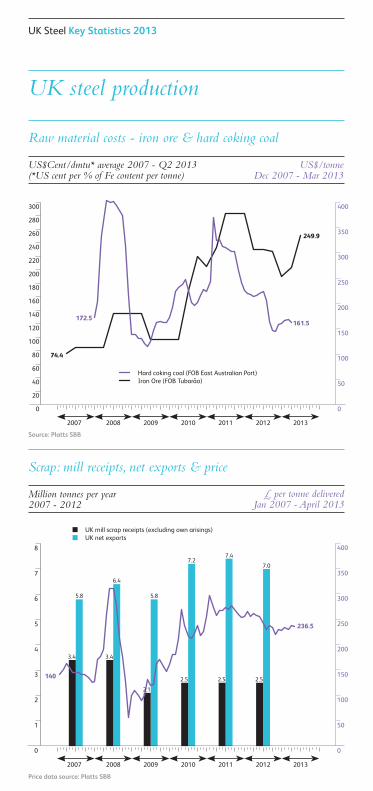
UK steel production
Scrap: mill receipts, net exports & price
Million tonnes per year2007 - 2012
100
150
200
250
300
50
350
400
0
£ per tonne deliveredJan 2007 - April 2013
Price data source: Platts SBB
140
236.5
Raw material costs - iron ore & hard coking coal
US$Cent/dmtu* average 2007 - Q2 2013 US$/tonne(*US cent per % of Fe content per tonne) Dec 2007 - Mar 2013
2008 2009 2010 2012
Source: Platts SBB
74.4
249.9
172.5161.5
2007 2013
8
4
3
2
1
5
6
7
0
UK mill scrap receipts (excluding own arisings)UK net exports
5.8
3.4
6.4
2.5
7.2
3.4
5.8
2.5
7.4
2011
300
140
100
60
40
20
160
120
80
180
200
220
240
260
280
0
400
350
250
150
100
50
300
200
0
5% up on 2011
2008 2009 2010 20122007 20132011
2.5
7.0
Hard coking coal (FOB East Australian Port)Iron Ore (FOB Tubarão)
2.1
UK Steel Key Statistics 2013
19731975
19801985
19901995
20002010
2005
35
30
25
20
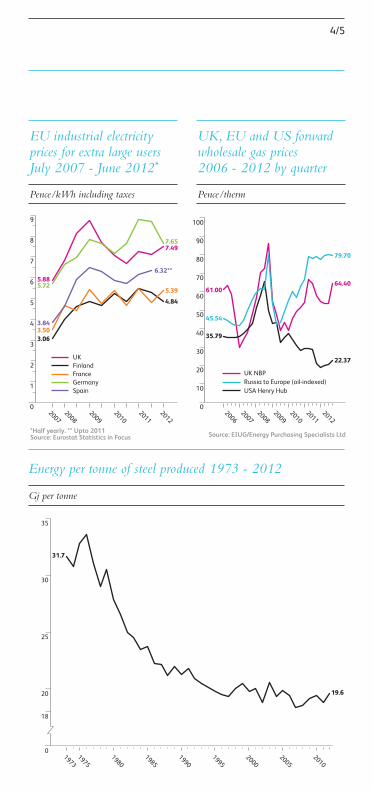
Energy per tonne of steel produced 1973 - 2012
Gj per tonne
31.7
19.6
UK, EU and US forward wholesale gas prices2006 - 2012 by quarter
Pence/therm
UK NBPRussia to Europe (oil-indexed)USA Henry Hub
Source: EIUG/Energy Purchasing Specialists Ltd
20062007
20082009
20102011
64.40
79.70
22.37
35.79
61.00
45.54
*Half yearly. ** Upto 2011Source: Eurostat Statistics in Focus
EU industrial electricity prices for extra large usersJuly 2007 - June 2012*
Pence/kWh including taxes
20072008
20092010
7
5
4
3
2
1
0
6
8
9
3.50
5.885.72
3.06
3.84
0
18
20112012
2012
Spain
UK
GermanyFranceFinland
5.39
7.497.65
4.84
6.32**
90
70
60
50
40
20
0
80
100
30
10
4/5
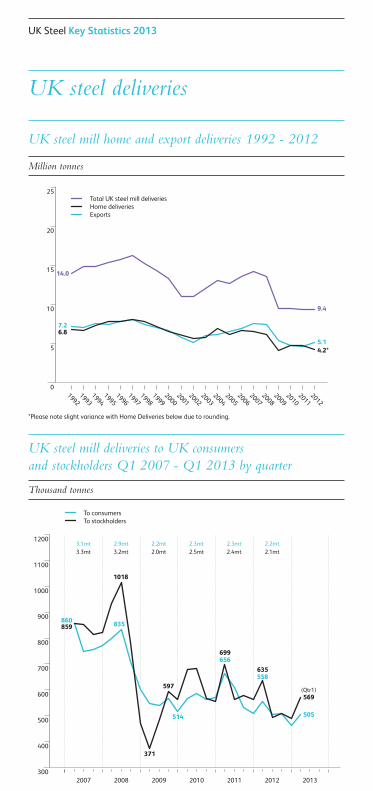
UK steel deliveries
Total UK steel mill deliveriesHome deliveriesExports
5
10
15
20
25
20101992
19931994
19951996
19971998
19992000
20012002
20032004
20052008
20062007
2009
14.0
UK steel mill home and export deliveries 1992 - 2012
Million tonnes
6.87.2
9.4
4.2*5.1
20122011
To consumersTo stockholders
2.3mt3.1mt3.3mt
2.9mt3.2mt
2.2mt2.0mt
2.3mt2.5mt 2.4mt
UK steel mill deliveries to UK consumersand stockholders Q1 2007 - Q1 2013 by quarter
Thousand tonnes
20122007 2008 2009 2010 2011 2013
400
500
600
700
800
900
1000
1100
1200
300
2.2mt2.1mt
860
1018
505
597
371
859
569(Qtr1)
699
835
656
514
635558
0
*Please note slight variance with Home Deliveries below due to rounding.
UK Steel Key Statistics 2013
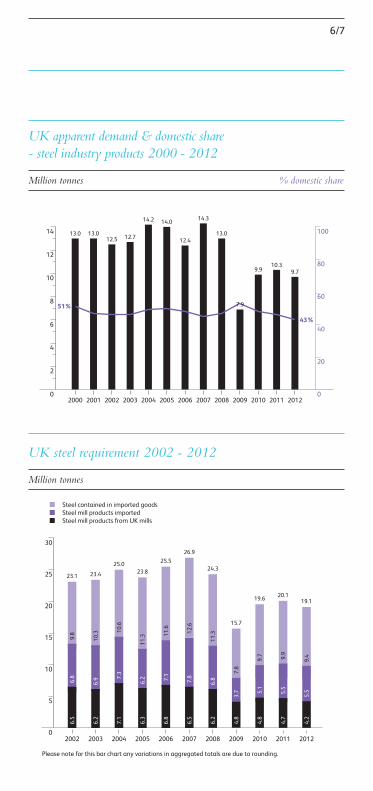
Steel contained in imported goodsSteel mill products importedSteel mill products from UK mills
2012
19.1
9.4
5.5
4.2
UK steel requirement 2002 - 2012
Million tonnes
24.3
11.3
15.7
19.6
9.7
5.1
4.8
7.8
3.7
6.8
6.2
23.1
6.5
9.8
6.8
23.4
6.2
10.3
6.9
25.0
7.1
10.6
7.3
23.8
6.3
11.3
6.2
25.5
6.8
11.6
7.1
26.9
6.5
12.6
7.8
15
10
25
20
5
0
Please note for this bar chart any variations in aggregated totals are due to rounding.
2008200720062005200420032002 2009 2010 2011
30
20.1
9.9
5.5
4.7
4.8
4.8
UK apparent demand & domestic share- steel industry products 2000 - 2012
Million tonnes % domestic share
0
60
40
20
100
809.9
10.3
12.5 12.7
14.2
12.4
14.3
13.0
9.7
13.0
2000
51%
43%
0
14
2
12
8
10
6
4
2001 2002 2003 2004 2005 2006 2007 2008 2009 2010 2011 2012
13.0
14.0
7.9
6/7
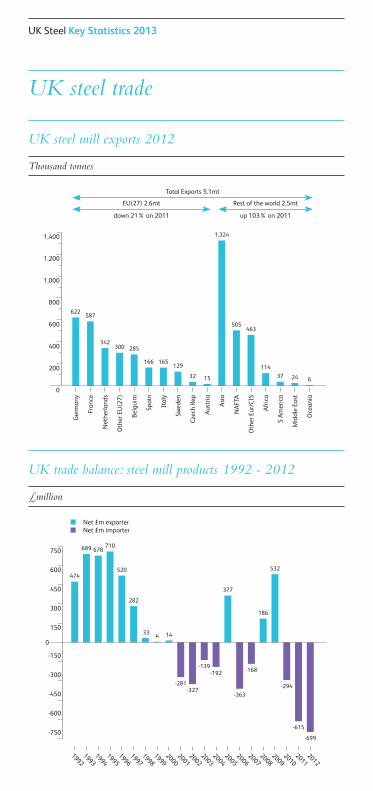
UK steel trade
Total Exports 5.1mt
EU(27) 2.6mt
down 21% on 2011
Rest of the world 2.5mt
up 103% on 2011
Fran
ce
587
Bel
guim
285
Swed
en
129
Ital
y
165
Ger
man
y
Cze
ch R
ep
32
622
Spai
n
166
Oth
er E
U(2
7)
300
Net
herla
nds
342
Asi
a
1,324
Oce
ania
NA
FTA
Oth
er E
ur/C
IS
Afr
ica
S A
mer
ica
Mid
dle
East
505463
114
37 24 6
UK steel mill exports 2012 Thousand tonnes
Aus
tria
15
Net £m exporterNet £m importer
UK trade balance: steel mill products 1992 - 2012 £million
20101992
19931994
19951996
19971998
19992000
20012002
20032004
20052008
20062007
20092012
2011
750
600
450
300
150
0
-150
-300
-450
-600
-750-615
689
474
710
282
678
14
520
334
-281-327
-139
-294
186
-192
377
-363
-168
532
200
400
600
1,000
800
0
1,400
1,200
-699
UK Steel Key Statistics 2013
ImportExportBalance
1,000
1,500
2,000
2,500
3,000
3,500
4,000
5,500
4,500
5,000
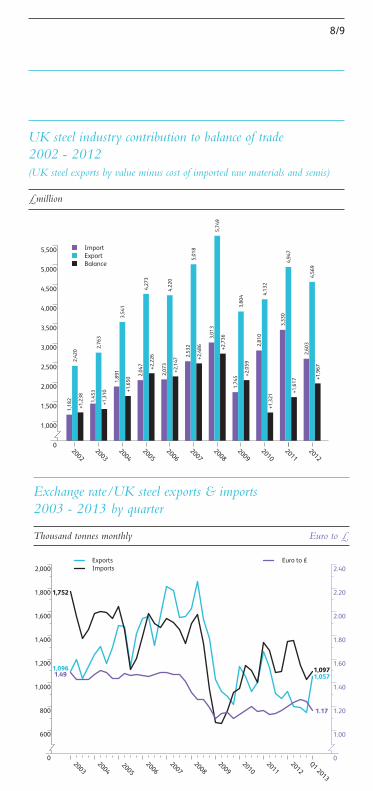
UK steel industry contribution to balance of trade2002 - 2012(UK steel exports by value minus cost of imported raw materials and semis)
£million
20062003
20042005
20072010
20082009
2011
2,81
04,
132
+1,3
21
3,01
35,
749
+2,7
36
2,60
34,
569
+1,9
67
2012
2,53
25,
018
+2,4
86
1,74
53,
804
+2,0
59
2,07
34,
220
+2,1
47
1,89
13,
541
+1,6
50
1,45
32,
763
+1,3
10
1,18
22,
420
+1,2
38
2,04
74,
273
+2,2
26
20032004
20052006
Exchange rate/UK steel exports & imports2003 - 2013 by quarter
Thousand tonnes monthly Euro to £
2002
3,33
04,
947
+1,6
17
ExportsImports
Euro to £
1.17
1,0571,097
1.491,096
1,752
600
800
1,000
1,200
1,400
1,600
1,800
2,000
0
1.00
1.20
1.40
1.60
1.80
2.00
2.20
2.40
0
0
20072008
20102012
20092011
Q1 2013
8/9
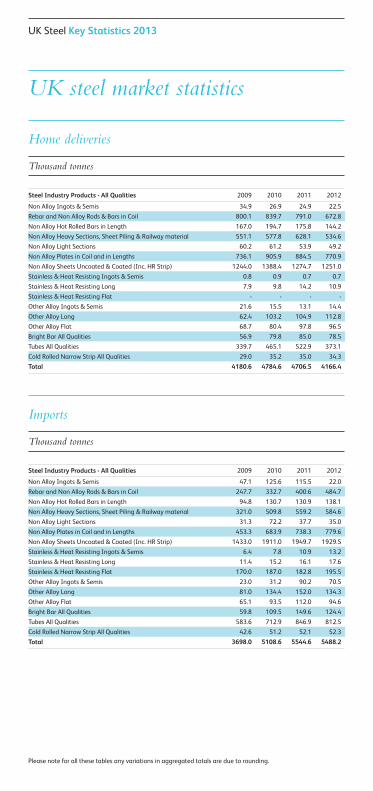
UK steel market statistics
Steel Industry Products - All Qualities 2009 2010 2011 2012
Non Alloy Ingots & Semis 34.9 26.9 24.9 22.5
Rebar and Non Alloy Rods & Bars in Coil 800.1 839.7 791.0 672.8
Non Alloy Hot Rolled Bars in Length 167.0 194.7 175.8 144.2
Non Alloy Heavy Sections, Sheet Piling & Railway material 551.1 577.8 628.1 534.6
Non Alloy Light Sections 60.2 61.2 53.9 49.2
Non Alloy Plates in Coil and in Lengths 736.1 905.9 884.5 770.9
Non Alloy Sheets Uncoated & Coated (Inc. HR Strip) 1244.0 1388.4 1274.7 1251.0
Stainless & Heat Resisting Ingots & Semis 0.8 0.9 0.7 0.7
Stainless & Heat Resisting Long 7.9 9.8 14.2 10.9
Stainless & Heat Resisting Flat - - - -
Other Alloy Ingots & Semis 21.6 15.5 13.1 14.4
Other Alloy Long 62.4 103.2 104.9 112.8
Other Alloy Flat 68.7 80.4 97.8 96.5
Bright Bar All Qualities 56.9 79.8 85.0 78.5
Tubes All Qualities 339.7 465.1 522.9 373.1
Cold Rolled Narrow Strip All Qualities 29.0 35.2 35.0 34.3
Total 4180.6 4784.6 4706.5 4166.4
Home deliveries Thousand tonnes
Please note for all these tables any variations in aggregated totals are due to rounding.
Steel Industry Products - All Qualities 2009 2010 2011 2012
Non Alloy Ingots & Semis 47.1 125.6 115.5 22.0
Rebar and Non Alloy Rods & Bars in Coil 247.7 332.7 400.6 484.7
Non Alloy Hot Rolled Bars in Length 94.8 130.7 130.9 138.1
Non Alloy Heavy Sections, Sheet Piling & Railway material 321.0 509.8 559.2 584.6
Non Alloy Light Sections 31.3 72.2 37.7 35.0
Non Alloy Plates in Coil and in Lengths 453.3 683.9 738.3 779.6
Non Alloy Sheets Uncoated & Coated (Inc. HR Strip) 1433.0 1911.0 1949.7 1929.5
Stainless & Heat Resisting Ingots & Semis 6.4 7.8 10.9 13.2
Stainless & Heat Resisting Long 11.4 15.2 16.1 17.6
Stainless & Heat Resisting Flat 170.0 187.0 182.8 195.5
Other Alloy Ingots & Semis 23.0 31.2 90.2 70.5
Other Alloy Long 81.0 134.4 152.0 134.3
Other Alloy Flat 65.1 93.5 112.0 94.6
Bright Bar All Qualities 59.8 109.5 149.6 124.4
Tubes All Qualities 583.6 712.9 846.9 812.5
Cold Rolled Narrow Strip All Qualities 42.6 51.2 52.1 52.3
Total 3698.0 5108.6 5544.6 5488.2
Imports Thousand tonnes
UK Steel Key Statistics 2013
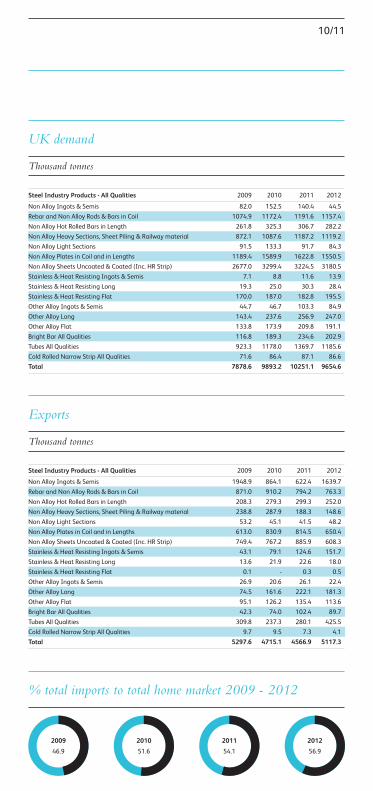
% total imports to total home market 2009 - 2012
2009
46.9
Steel Industry Products - All Qualities 2009 2010 2011 2012
Non Alloy Ingots & Semis 82.0 152.5 140.4 44.5
Rebar and Non Alloy Rods & Bars in Coil 1074.9 1172.4 1191.6 1157.4
Non Alloy Hot Rolled Bars in Length 261.8 325.3 306.7 282.2
Non Alloy Heavy Sections, Sheet Piling & Railway material 872.1 1087.6 1187.2 1119.2
Non Alloy Light Sections 91.5 133.3 91.7 84.3
Non Alloy Plates in Coil and in Lengths 1189.4 1589.9 1622.8 1550.5
Non Alloy Sheets Uncoated & Coated (Inc. HR Strip) 2677.0 3299.4 3224.5 3180.5
Stainless & Heat Resisting Ingots & Semis 7.1 8.8 11.6 13.9
Stainless & Heat Resisting Long 19.3 25.0 30.3 28.4
Stainless & Heat Resisting Flat 170.0 187.0 182.8 195.5
Other Alloy Ingots & Semis 44.7 46.7 103.3 84.9
Other Alloy Long 143.4 237.6 256.9 247.0
Other Alloy Flat 133.8 173.9 209.8 191.1
Bright Bar All Qualities 116.8 189.3 234.6 202.9
Tubes All Qualities 923.3 1178.0 1369.7 1185.6
Cold Rolled Narrow Strip All Qualities 71.6 86.4 87.1 86.6
Total 7878.6 9893.2 10251.1 9654.6
UK demand Thousand tonnes
Steel Industry Products - All Qualities 2009 2010 2011 2012
Non Alloy Ingots & Semis 1948.9 864.1 622.4 1639.7
Rebar and Non Alloy Rods & Bars in Coil 871.0 910.2 794.2 763.3
Non Alloy Hot Rolled Bars in Length 208.3 279.3 299.3 252.0
Non Alloy Heavy Sections, Sheet Piling & Railway material 238.8 287.9 188.3 148.6
Non Alloy Light Sections 53.2 45.1 41.5 48.2
Non Alloy Plates in Coil and in Lengths 613.0 830.9 814.5 650.4
Non Alloy Sheets Uncoated & Coated (Inc. HR Strip) 749.4 767.2 885.9 608.3
Stainless & Heat Resisting Ingots & Semis 43.1 79.1 124.6 151.7
Stainless & Heat Resisting Long 13.6 21.9 22.6 18.0
Stainless & Heat Resisting Flat 0.1 - 0.3 0.5
Other Alloy Ingots & Semis 26.9 20.6 26.1 22.4
Other Alloy Long 74.5 161.6 222.1 181.3
Other Alloy Flat 95.1 126.2 135.4 113.6
Bright Bar All Qualities 42.3 74.0 102.4 89.7
Tubes All Qualities 309.8 237.3 280.1 425.5
Cold Rolled Narrow Strip All Qualities 9.7 9.5 7.3 4.1
Total 5297.6 4715.1 4566.9 5117.3
Exports Thousand tonnes
2010
51.6
2011
54.1
2012
56.9
10/11
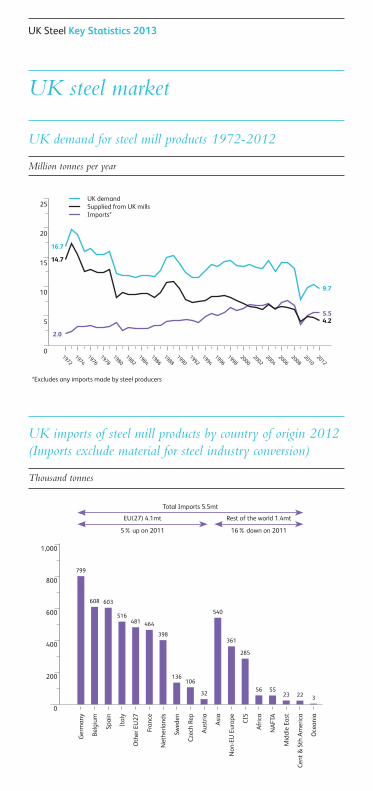
2.0
14.7
16.7
UK steel market
15
10
25
20
5
0
UK demand for steel mill products 1972-2012 Million tonnes per year
9.7
4.25.5
19721974
19841982
19801978
19761986
19881998
19961994
19921990
20002002
20102008
20062004
*Excludes any imports made by steel producers
UK demandSupplied from UK millsImports*
2012
3
Oce
ania
Total Imports 5.5mt
EU(27) 4.1mt
5% up on 2011
Rest of the world 1.4mt
16% down on 2011
Ger
man
y
Spai
n
Ital
y
Oth
er E
U27
Fran
ce
Net
herla
nds
Swed
en
Cze
ch R
ep
Aus
tria
Asi
a
CIS
Afr
ica
NA
FTA
Cent
& S
th A
mer
ica
225556
285
540
Non
-EU
Eur
ope
361
32
106136
398
464481516
603
799
Bel
gium
608
UK imports of steel mill products by country of origin 2012(Imports exclude material for steel industry conversion)
Thousand tonnes
Mid
dle
East
23
1,000
600
400
0
800
200
UK Steel Key Statistics 2013
12/13
Index of UK steel & aluminium pricecompared to RPI 1987 - 2012 Index (1987 = 100)
242.7
20082006
20002007
20052004
20031987
20022001
19991998
20121997
19961995
19941993
19921991
19901989
19882009
20102011
185.4
Retail Price Index
AluminiumAverage UK Steel Price Index
140
120
180
160
100
200
220
280
240
80
0
260
220.5
73.2
Global traded volumes
Million tonnes by total Million tonnes by product
2008
299mt
2009 2010 2011 20120
100
80
40
60
20
90
50
70
30
10
0
60
50
30
40
20
10
235mt 275mt 291mt 296mt
Excludes EU internal trade
59.5
51.955.4
62.166.0 65.2
75.1
67.3 67.871.9
75.171.4 72.5 71.7
77.7
35.4
17.2
12.8
8.2
SemisLong TubesFlatTotal
26.7
12.711.99.2
73.7
Steel in the World
Aluminium price source: London Metal Exchange
799
750
1,23
6
1,14
7
1,06
1
970
904
851
848
788
777
1,24
9 1,34
7
1,34
1 1,43
2 1,53
6
World top ten steel exporters & importers
Million tonnes
EXPORT % change
Position 2012 2011 2012 2012 on 2011
1 China 44.4 51.2 152 Japan 40.3 41.1 23 EU27 36.2 37.8 44 S Korea 28.0 29.4 55 Russia 24.6 26.5 86 Ukraine 25.8 24.0 -77 Turkey 16.7 18.4 108 USA 12.5 12.8 29 Taiwan 10.3 10.3 010 Brazil 10.7 9.6 -10
Other 41.3 35.3 -15Total 290.8 296.4 2
IMPORT % change
Position 2012 2011 2012 2012 on 2011
1 USA 25.3 29.7 172 EU27 34.0 25.2 -263 S Korea 22.3 19.9 -114 Thailand 12.3 14.9 225 China 15.9 13.8 -136 Indonesia 8.3 11.7 417 Turkey 10.2 11.3 128 Canada 8.8 9.2 49 India 8.9 9.0 110 Mexico 6.6 9.0 36
Other 138.1 142.5 3Total 290.8 296.4 2
Excludes internal trade within the EU27.
Steel in the World
World crude steel production 1995 - 2012 Million tonnes
Rest of worldChinaBasic Oxygen SteelmakingElectric ArcOther processes
452
1074
16
245
433
74
20091995
19961997
19981999
20002001
20022003
20042005
20062007
2008
Source: worldsteel
20102012
1,300
1,200
1,100
1,000
900
800
700
600
500
400
300
200
100
1,400
1,600
1,500
0
1,54
8
2011
752
UK Steel Key Statistics 2013
EU PRODUCERS Total Basic Oxygen Electric Arc Open Hearth
Germany 42.7 28.9 13.8
Italy 27.2 9.3 17.9
France 15.6 9.5 6.1
Spain 13.6 3.4 10.2
UK 9.6 7.5 2.1
Poland 8.4 4.2 4.1
Austria 7.4 6.7 0.7
Belgium 7.3 4.6 2.7
Other EU 37.2 24.2 13.0
Total EU27 169.0 98.5 70.5
WORLD PRODUCERS
China 716.5 643.5 72.5
Total EU27 169.0 98.5 70.5
Japan 107.2 82.3 24.9
USA 88.7 36.3 52.4
India (est) 77.6 24.2 52.4 1.0
Russia (est) 70.4 44.7 19.0 6.8
S Korea 69.1 43.1 26.0
Turkey 35.9 9.3 26.6
Brazil 34.2 26.1 8.1
Ukraine (est) 33.0 22.9 1.5 8.6
Taiwan (est) 20.7 10.5 10.1
Mexico 18.1 5.0 13.1
Iran 14.5 2.2 12.3
Canada 13.5 7.8 5.7
South Africa (est) 6.9 3.9 3.0
Total World 1,542.2 1,073.8 451.5 16.4
Source: worldsteel
Crude steel production 2012 Million tonnes
Region/Country 2002 2012 % Change 2012 on 2002
EU27 162.4 140.0 -14
Non-EU Europe 16.3 34.8 113
CIS 34.0 55.9 64
NAFTA 137.5 130.7 -5
Central & South America 26.9 47.4 76
Africa 18.4 27.3 48
Middle East 23.5 49.2 109
Asia Exc China 208.1 275.0 32
China 191.3 646.0 238
Oceania 7.0 7.0 0
Total World 825.4 1413.3 71
Global steel consumption by region 2002 - 2012Based on apparent consumption of finished steel
Million tonnes
Source: worldsteel
(est) - estimated
14/15

UK SteelBroadway House, Tothill Street, London SW1H 9NQ
T: 020 7654 1518E: [email protected]: www.eef.org.uk/uksteel