Key Performance Indicators Vital Signs Q1 - Home | WMATA · KPI: Customer Satisfaction QUALITY...
30
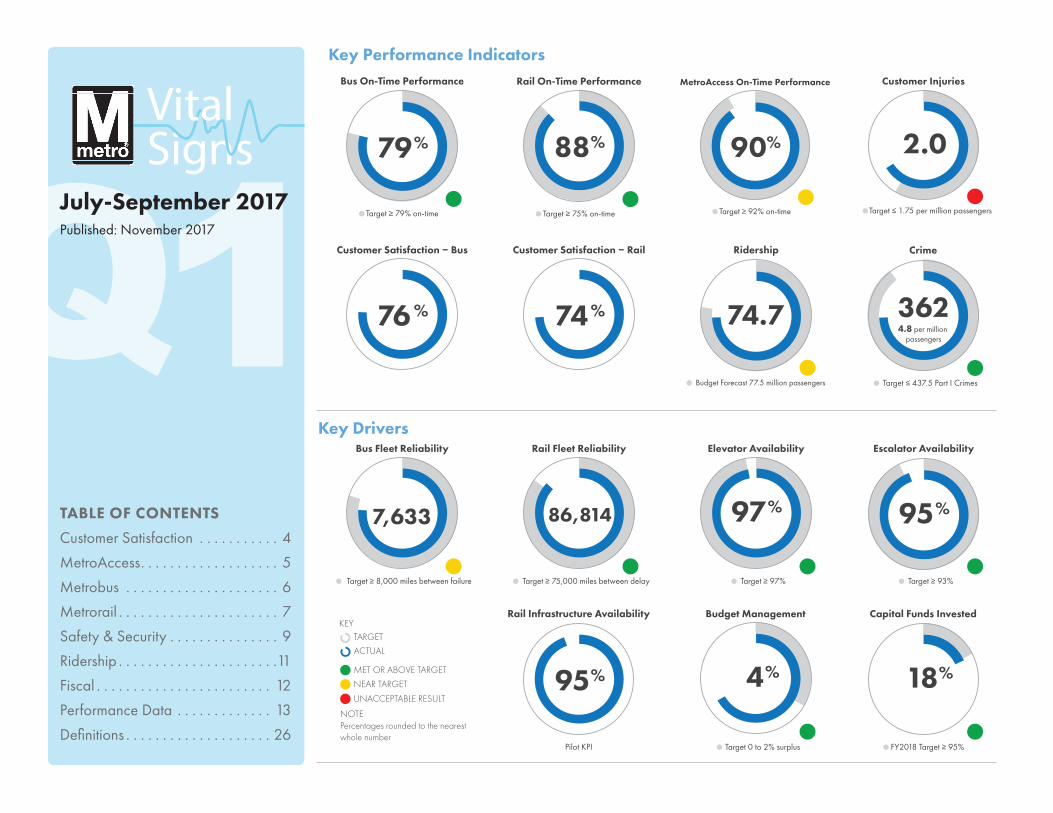
1 TABLE OF CONTENTS Customer Satisfaction 4 MetroAccess 5 Metrobus 6 Metrorail 7 Safety & Security 9 Ridership 11 Fiscal 12 Performance Data 13 Definitions 26 Signs Vital Key Performance Indicators Q July-September 2017 Published: November 2017 Key Drivers 76 % Customer Satisfaction ‒ Bus 74 % Customer Satisfaction ‒ Rail 90 % Target ≥ 92% on-time MetroAccess On-Time Performance 79 % Target ≥ 79% on-time Bus On-Time Performance 88 % Target ≥ 75% on-time Rail On-Time Performance Pilot KPI Rail Infrastructure Availability 95 % 4.9 Target ≤ 437.5 Part I Crimes Crime 4.8 per million passengers 362 4.9 Target ≤ 1.75 per million passengers Customer Injuries 2.0 74.7 Budget Forecast 77.5 million passengers Ridership Target 0 to 2% surplus Budget Management 4 % FY2018 Target ≥ 95% Capital Funds Invested 18 % KEY NOTE Percentages rounded to the nearest whole number TARGET ACTUAL MET OR ABOVE TARGET NEAR TARGET UNACCEPTABLE RESULT 7,633 Target ≥ 8,000 miles between failure Bus Fleet Reliability 86,814 Target ≥ 75,000 miles between delay Rail Fleet Reliability Target ≥ 97% Elevator Availability 97 % Target ≥ 93% Escalator Availability 95 %
Transcript of Key Performance Indicators Vital Signs Q1 - Home | WMATA · KPI: Customer Satisfaction QUALITY...
1TABLE OF CONTENTS
Customer Satisfaction . . . . . . . . . . . 4
MetroAccess . . . . . . . . . . . . . . . . . . . 5
Metrobus . . . . . . . . . . . . . . . . . . . . . 6
Metrorail . . . . . . . . . . . . . . . . . . . . . . 7
Safety & Security . . . . . . . . . . . . . . . 9
Ridership . . . . . . . . . . . . . . . . . . . . . .11
Fiscal . . . . . . . . . . . . . . . . . . . . . . . . 12
Performance Data . . . . . . . . . . . . . 13
Definitions . . . . . . . . . . . . . . . . . . . . 26
SignsVital
Key Performance Indicators
QJuly-September 2017Published: November 2017
Key Drivers
76 %
Customer Satisfaction ‒ Bus
74 %
Customer Satisfaction ‒ Rail
90%
Target ≥ 92% on-time
MetroAccess On-Time Performance
79%
Target ≥ 79% on-time
Bus On-Time Performance
88%
Target ≥ 75% on-time
Rail On-Time Performance
Pilot KPI
Rail Infrastructure Availability
95 %
4.9
Target ≤ 437.5 Part I Crimes
Crime
4.8 per million passengers
362
4.9
Target ≤ 1.75 per million passengers
Customer Injuries
2.0
74.7
Budget Forecast 77.5 million passengers
Ridership
Target 0 to 2% surplus
Budget Management
4%
FY2018 Target ≥ 95%
Capital Funds Invested
18%
KEY
NOTEPercentages rounded to the nearestwhole number
TARGET
ACTUAL
MET OR ABOVE TARGET
NEAR TARGET
UNACCEPTABLE RESULT
7,633
Target ≥ 8,000 miles between failure
Bus Fleet Reliability
86,814
Target ≥ 75,000 miles between delay
Rail Fleet Reliability
Target ≥ 97%
Elevator Availability
97%
Target ≥ 93%
Escalator Availability
95%
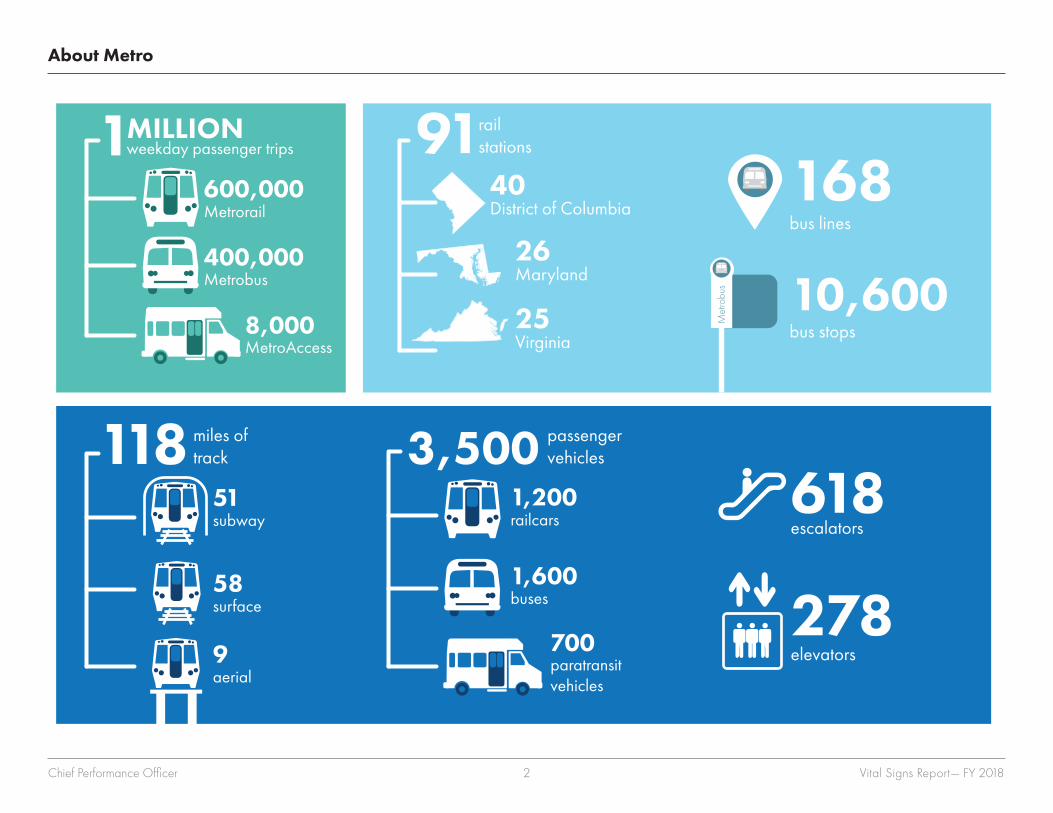
1MILLIONweekday passenger trips
Metrobus
MetroAccess
Metrorail600,000
rail stations91
400,000
8,000
District of Columbia40
Virginia25
Maryland26
bus lines
168
bus stops10,600
miles oftrack118 passenger
vehicles3,500escalators618
elevators278buses
paratransitvehicles
railcars1,200
1,600
700
Met
robu
s
subway51
surface58
aerial9
About MetroAbout Metro
Chief Performance Officer 2 Vital Signs Report— FY 2018
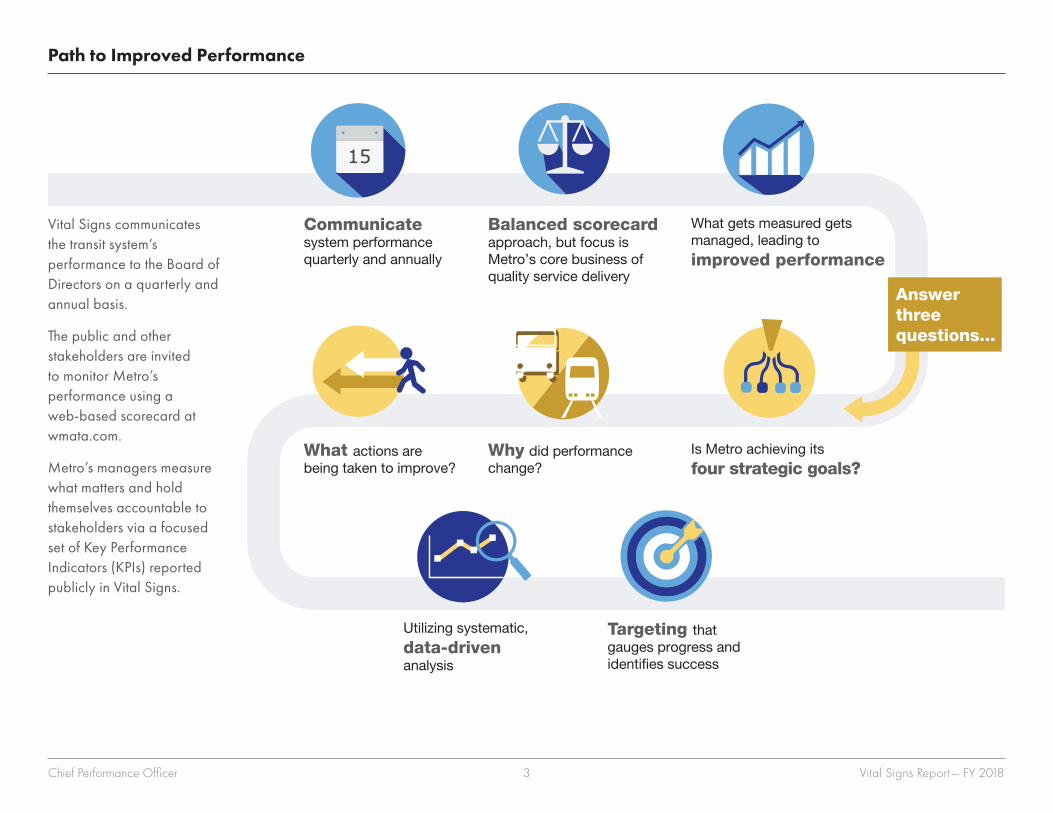
Path to Improved Performance
Utilizing systematic, data-driven analysis
Targeting that gauges progress and identifies success
Why did performance change?
Balanced scorecard approach, but focus is Metro’s core business of quality service delivery
What gets measured gets managed, leading toimproved performance
Communicatesystem performancequarterly and annually
Is Metro achieving itsfour strategic goals?
What actions are being taken to improve?
Answerthreequestions...
Vital Signs communicates the transit system’s performance to the Board of Directors on a quarterly and annual basis .
The public and other stakeholders are invited to monitor Metro’s performance using a web‑based scorecard at wmata .com .
Metro’s managers measure what matters and hold themselves accountable to stakeholders via a focused set of Key Performance Indicators (KPIs) reported publicly in Vital Signs .
Chief Performance Officer 3 Vital Signs Report— FY 2018
0.6
0.7
0.8
Q1/FY2017 Q1/FY2018
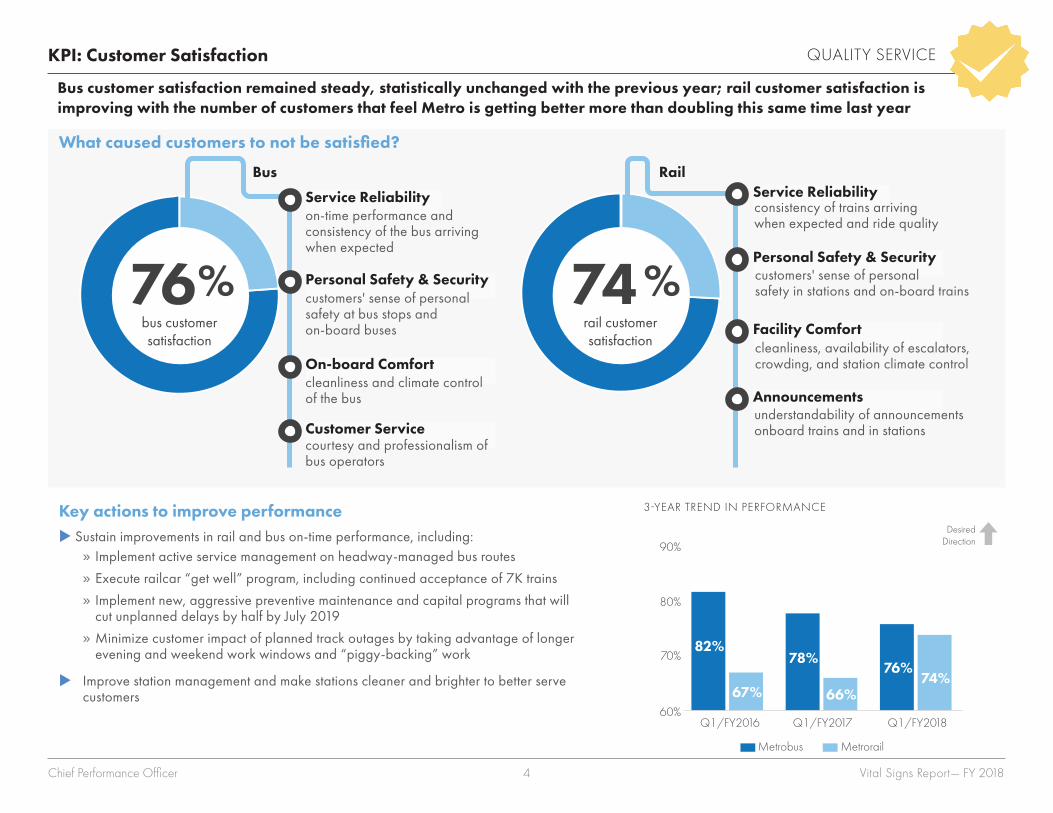
66%74%
Q1/FY2016
90%
60%
25%
80%75%
70%
67%
82%78%
76%
Metrobus Metrorail
DesiredDirection
KPI: Customer Satisfaction QUALITY SERVICE
76%bus customersatisfaction
74%rail customersatisfaction
Bus customer satisfaction remained steady, statistically unchanged with the previous year; rail customer satisfaction is improving with the number of customers that feel Metro is getting better more than doubling this same time last year
Key actions to improve performance X Sustain improvements in rail and bus on‑time performance, including:»» Implement active service management on headway‑managed bus routes
»» Execute railcar “get well” program, including continued acceptance of 7K trains
»» Implement new, aggressive preventive maintenance and capital programs that will cut unplanned delays by half by July 2019
»» Minimize customer impact of planned track outages by taking advantage of longer evening and weekend work windows and “piggy‑backing” work
X Improve station management and make stations cleaner and brighter to better serve customers
3-YEAR TREND IN PERFORMANCE
What caused customers to not be satisfied?
Service Reliabilityon‑time performance and consistency of the bus arriving when expected
Service Reliability
Personal Safety & SecurityPersonal Safety & Security
On-board Comfort
Customer Service
Facility Comfort
Announcements
Bus
customers' sense of personal safety at bus stops and on‑board buses
cleanliness and climate control of the bus
courtesy and professionalism of bus operators
Rail
consistency of trains arriving when expected and ride quality
customers' sense of personal safety in stations and on‑board trains
cleanliness, availability of escalators, crowding, and station climate control
understandability of announcements onboard trains and in stations
Chief Performance Officer 4 Vital Signs Report— FY 2018
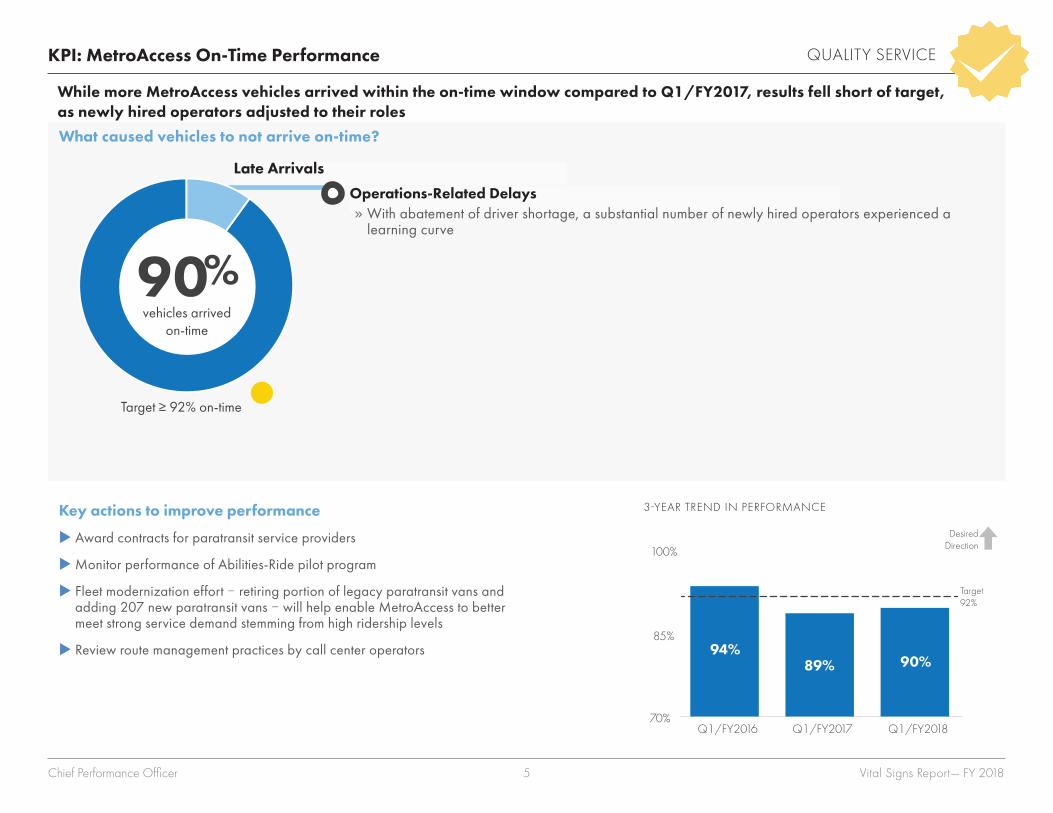
»» 13% of vehicles arrived at pick‑up location after the end of the 30 minute on‑time window
0.70
0.85
1.00
89% 90%
100%
70%
25%
85%
75% Target92%
94%
DesiredDirection
Q1/FY2017 Q1/FY2018Q1/FY2016
KPI: MetroAccess On-Time Performance QUALITY SERVICE
While more MetroAccess vehicles arrived within the on-time window compared to Q1/FY2017, results fell short of target, as newly hired operators adjusted to their roles
Key actions to improve performance
X Award contracts for paratransit service providers
XMonitor performance of Abilities‑Ride pilot program
X Fleet modernization effort ‒ retiring portion of legacy paratransit vans and adding 207 new paratransit vans ‒ will help enable MetroAccess to better meet strong service demand stemming from high ridership levels
X Review route management practices by call center operators
3-YEAR TREND IN PERFORMANCE
Target ≥ 92% on-time
90%vehicles arrived
on-time
What caused vehicles to not arrive on-time?
Late Arrivals
Operations-Related Delays»» With abatement of driver shortage, a substantial number of newly hired operators experienced a learning curve
Chief Performance Officer 5 Vital Signs Report— FY 2018
»» 7% of buses arrived early driven primarily by Midday period service the larget service delivery period early arrivals
»» Late Night period service 5% of total service delivered early arrivals increased 3%, the largest increase out of all service periods
»» 15% of buses arrived at stops greater than 7 minutes behind schedule, down 1% compared to Q1/2016
»» Down as crime and customer injuries decreased across MetroBus
Collisions »» Down 22% compared Q1/2016 with a 20% reduction in preventable collisions
0.65
0.75
76%79%
85%
65%
25%
75%
75% Target79%
78%
DesiredDirection
Q1/FY2017 Q1/FY2018Q1/FY2016
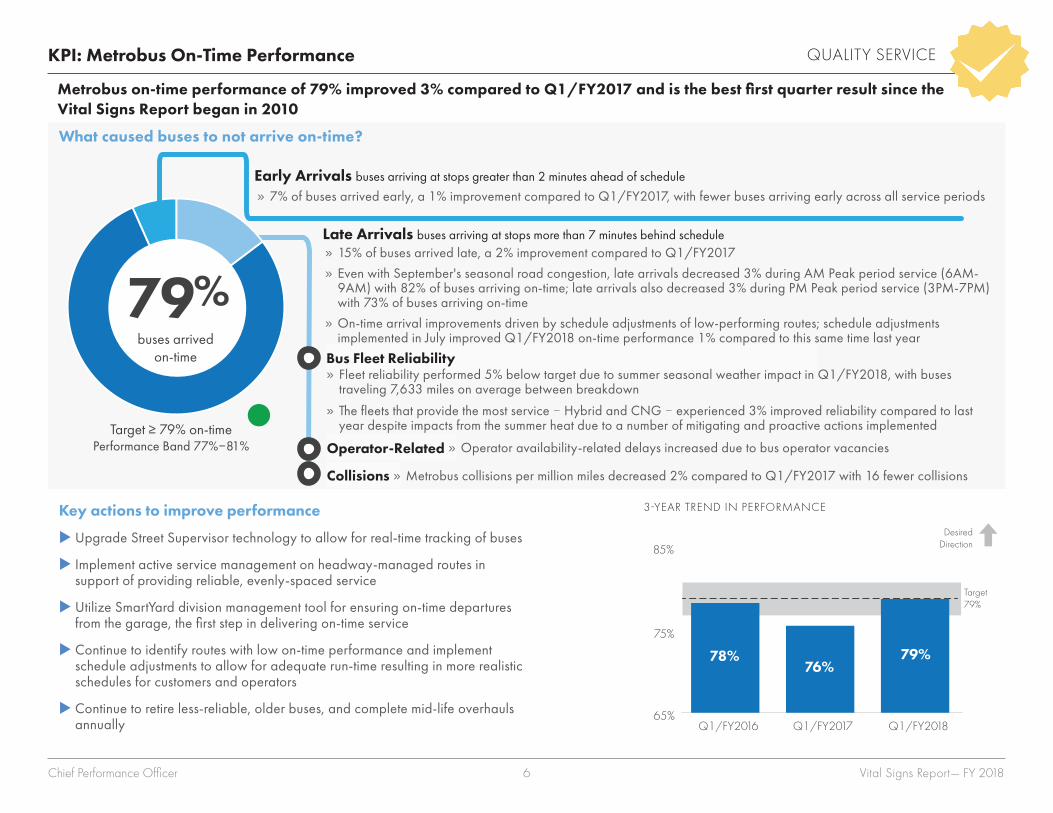
KPI: Metrobus On-Time Performance QUALITY SERVICE
Metrobus on-time performance of 79% improved 3% compared to Q1/FY2017 and is the best first quarter result since the Vital Signs Report began in 2010
Key actions to improve performance
X Upgrade Street Supervisor technology to allow for real‑time tracking of buses
X Implement active service management on headway‑managed routes in support of providing reliable, evenly‑spaced service
X Utilize SmartYard division management tool for ensuring on‑time departures from the garage, the first step in delivering on‑time service
X Continue to identify routes with low on‑time performance and implement schedule adjustments to allow for adequate run‑time resulting in more realistic schedules for customers and operators
X Continue to retire less‑reliable, older buses, and complete mid‑life overhauls annually
3-YEAR TREND IN PERFORMANCE
What caused buses to not arrive on-time?
Target ≥ 79% on-timePerformance Band 77%81%
79%buses arrived
on-time
Early Arrivals buses arriving at stops greater than 2 minutes ahead of schedule
Late Arrivals buses arriving at stops more than 7 minutes behind schedule
Bus Fleet Reliability»» Fleet reliability performed 5% below target due to summer seasonal weather impact in Q1/FY2018, with buses traveling 7,633 miles on average between breakdown
»» The fleets that provide the most service ‒ Hybrid and CNG ‒ experienced 3% improved reliability compared to last year despite impacts from the summer heat due to a number of mitigating and proactive actions implemented
»» 7% of buses arrived early, a 1% improvement compared to Q1/FY2017, with fewer buses arriving early across all service periods
Collisions »» Metrobus collisions per million miles decreased 2% compared to Q1/FY2017 with 16 fewer collisions
»» 15% of buses arrived late, a 2% improvement compared to Q1/FY2017
»» Even with September's seasonal road congestion, late arrivals decreased 3% during AM Peak period service (6AM‑9AM) with 82% of buses arriving on‑time; late arrivals also decreased 3% during PM Peak period service (3PM‑7PM) with 73% of buses arriving on‑time
»» On‑time arrival improvements driven by schedule adjustments of low‑performing routes; schedule adjustments implemented in July improved Q1/FY2018 on‑time performance 1% compared to this same time last year
Operator-Related »» Operator availability‑related delays increased due to bus operator vacancies
Chief Performance Officer 6 Vital Signs Report— FY 2018
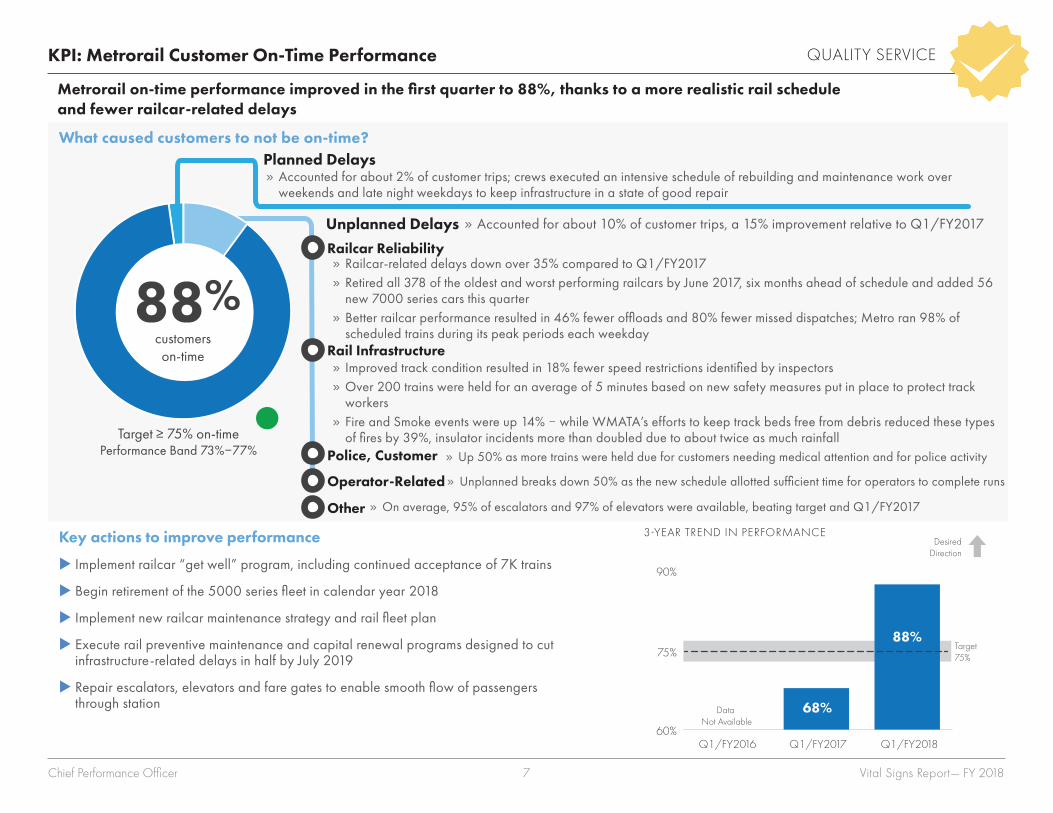
Target ≥ 75% on-timePerformance Band 73%77%
88%customerson-time
0.60
0.75
68%
88%
Data Not Available
90%
60%
25%
75%
75% 88%
Target75%
DesiredDirection
Q1/FY2017 Q1/FY2018Q1/FY2016
Metrorail on-time performance improved in the first quarter to 88%, thanks to a more realistic rail schedule and fewer railcar-related delays
Key actions to improve performance
X Implement railcar “get well” program, including continued acceptance of 7K trains
X Begin retirement of the 5000 series fleet in calendar year 2018
X Implement new railcar maintenance strategy and rail fleet plan
X Execute rail preventive maintenance and capital renewal programs designed to cut infrastructure‑related delays in half by July 2019
X Repair escalators, elevators and fare gates to enable smooth flow of passengers through station
What caused customers to not be on-time?
3-YEAR TREND IN PERFORMANCE
Railcar Reliability»» Railcar‑related delays down over 35% compared to Q1/FY2017»» Retired all 378 of the oldest and worst performing railcars by June 2017, six months ahead of schedule and added 56 new 7000 series cars this quarter»» Better railcar performance resulted in 46% fewer offloads and 80% fewer missed dispatches; Metro ran 98% of scheduled trains during its peak periods each weekday
Rail Infrastructure
Police, Customer
Operator-Related
Unplanned Delays
Planned Delays
»» Accounted for about 10% of customer trips, a 15% improvement relative to Q1/FY2017
»» Improved track condition resulted in 18% fewer speed restrictions identified by inspectors»» Over 200 trains were held for an average of 5 minutes based on new safety measures put in place to protect track workers»» Fire and Smoke events were up 14% ‒ while WMATA’s efforts to keep track beds free from debris reduced these types of fires by 39%, insulator incidents more than doubled due to about twice as much rainfall
»» Up 50% as more trains were held due for customers needing medical attention and for police activity
»» Unplanned breaks down 50% as the new schedule allotted sufficient time for operators to complete runs
»» Accounted for about 2% of customer trips; crews executed an intensive schedule of rebuilding and maintenance work over weekends and late night weekdays to keep infrastructure in a state of good repair
Other »» On average, 95% of escalators and 97% of elevators were available, beating target and Q1/FY2017
KPI: Metrorail Customer On-Time Performance QUALITY SERVICE
Chief Performance Officer 7 Vital Signs Report— FY 2018
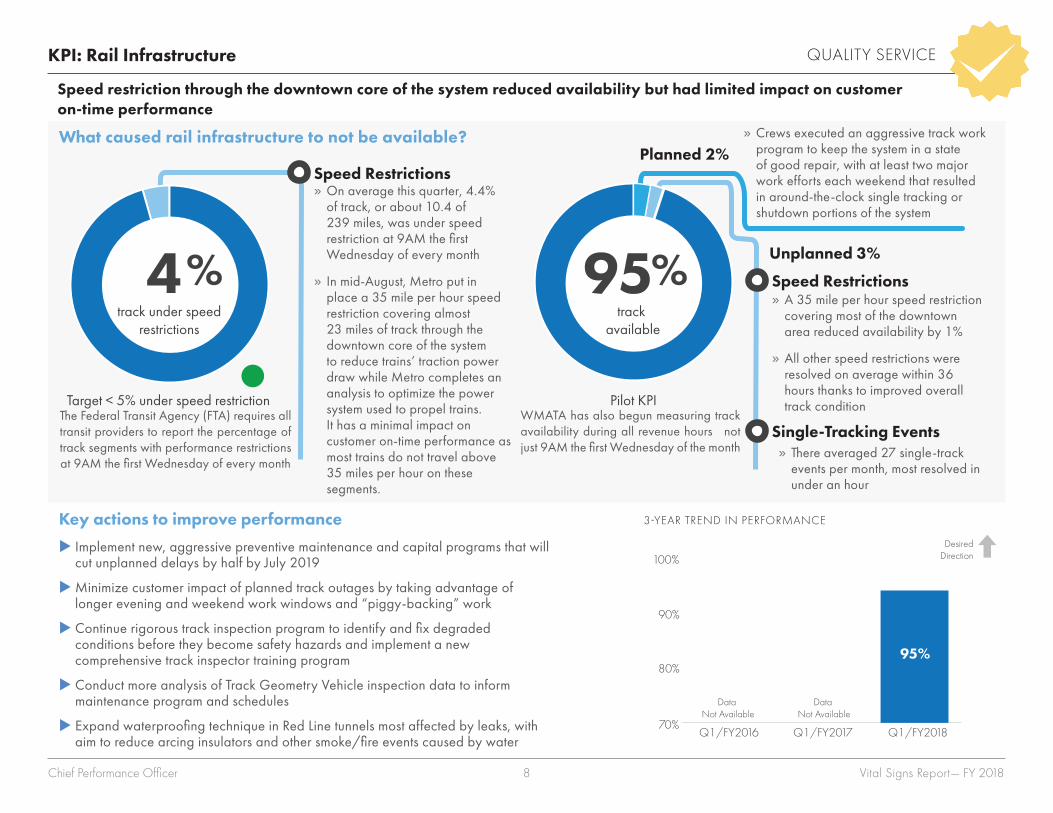
KPI: Rail Infrastructure QUALITY SERVICE
90%infrastructure
available
Target < 5% under speed restriction
track under speedrestrictions
Pilot KPI
95%track
available
4%
0.7
0.8
0.9
1.0
95%
100%
70%
25%
90%75%
80%
Data Not Available
Data Not Available
DesiredDirection
Q1/FY2017 Q1/FY2018Q1/FY2016
Speed restriction through the downtown core of the system reduced availability but had limited impact on customer on-time performance
Key actions to improve performance
X Implement new, aggressive preventive maintenance and capital programs that will cut unplanned delays by half by July 2019
XMinimize customer impact of planned track outages by taking advantage of longer evening and weekend work windows and “piggy‑backing” work
X Continue rigorous track inspection program to identify and fix degraded conditions before they become safety hazards and implement a new comprehensive track inspector training program
X Conduct more analysis of Track Geometry Vehicle inspection data to inform maintenance program and schedules
X Expand waterproofing technique in Red Line tunnels most affected by leaks, with aim to reduce arcing insulators and other smoke/fire events caused by water
What caused rail infrastructure to not be available?
3-YEAR TREND IN PERFORMANCE
»» On average this quarter, 4 .4% of track, or about 10 .4 of 239 miles, was under speed restriction at 9AM the first Wednesday of every month
»» In mid‑August, Metro put in place a 35 mile per hour speed restriction covering almost 23 miles of track through the downtown core of the system to reduce trains’ traction power draw while Metro completes an analysis to optimize the power system used to propel trains . It has a minimal impact on customer on‑time performance as most trains do not travel above 35 miles per hour on these segments .
Speed Restrictions
»» A 35 mile per hour speed restriction covering most of the downtown area reduced availability by 1%
»» All other speed restrictions were resolved on average within 36 hours thanks to improved overall track condition
Speed Restrictions
Single-Tracking Events»» There averaged 27 single‑track events per month, most resolved in under an hour
Unplanned 3%
Planned 2%
The Federal Transit Agency (FTA) requires all transit providers to report the percentage of track segments with performance restrictions at 9AM the first Wednesday of every month
WMATA has also begun measuring track availability during all revenue hours not just 9AM the first Wednesday of the month
»» Crews executed an aggressive track work program to keep the system in a state of good repair, with at least two major work efforts each weekend that resulted in around‑the‑clock single tracking or shutdown portions of the system
Chief Performance Officer 8 Vital Signs Report— FY 2018
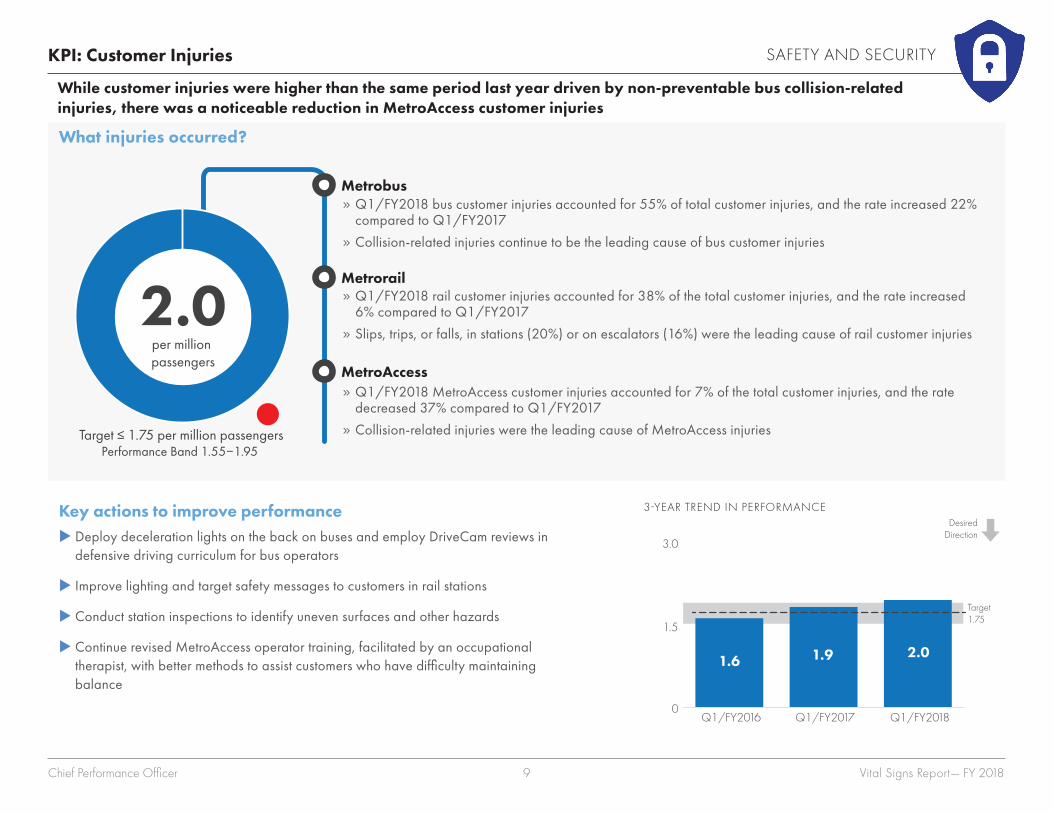
KPI: Customer Injuries SAFETY AND SECURITY
Target ≤ 1.75 per million passengersPerformance Band 1.551.95
2.0per million passengers
0
1
2
3
1.9 2.01.6
3.0
0
25%
1.5
Target1.75
DesiredDirection
Q1/FY2017 Q1/FY2018Q1/FY2016
While customer injuries were higher than the same period last year driven by non-preventable bus collision-related injuries, there was a noticeable reduction in MetroAccess customer injuries
Key actions to improve performance X Deploy deceleration lights on the back on buses and employ DriveCam reviews in defensive driving curriculum for bus operators
X Improve lighting and target safety messages to customers in rail stations
X Conduct station inspections to identify uneven surfaces and other hazards
X Continue revised MetroAccess operator training, facilitated by an occupational therapist, with better methods to assist customers who have difficulty maintaining balance
What injuries occurred?
3-YEAR TREND IN PERFORMANCE
»» Q1/FY2018 bus customer injuries accounted for 55% of total customer injuries, and the rate increased 22% compared to Q1/FY2017
»» Collision‑related injuries continue to be the leading cause of bus customer injuries
»» Q1/FY2018 rail customer injuries accounted for 38% of the total customer injuries, and the rate increased 6% compared to Q1/FY2017
»» Slips, trips, or falls, in stations (20%) or on escalators (16%) were the leading cause of rail customer injuries
Metrobus
Metrorail
MetroAccess»» Q1/FY2018 MetroAccess customer injuries accounted for 7% of the total customer injuries, and the rate decreased 37% compared to Q1/FY2017
»» Collision‑related injuries were the leading cause of MetroAccess injuries
Chief Performance Officer 9 Vital Signs Report— FY 2018
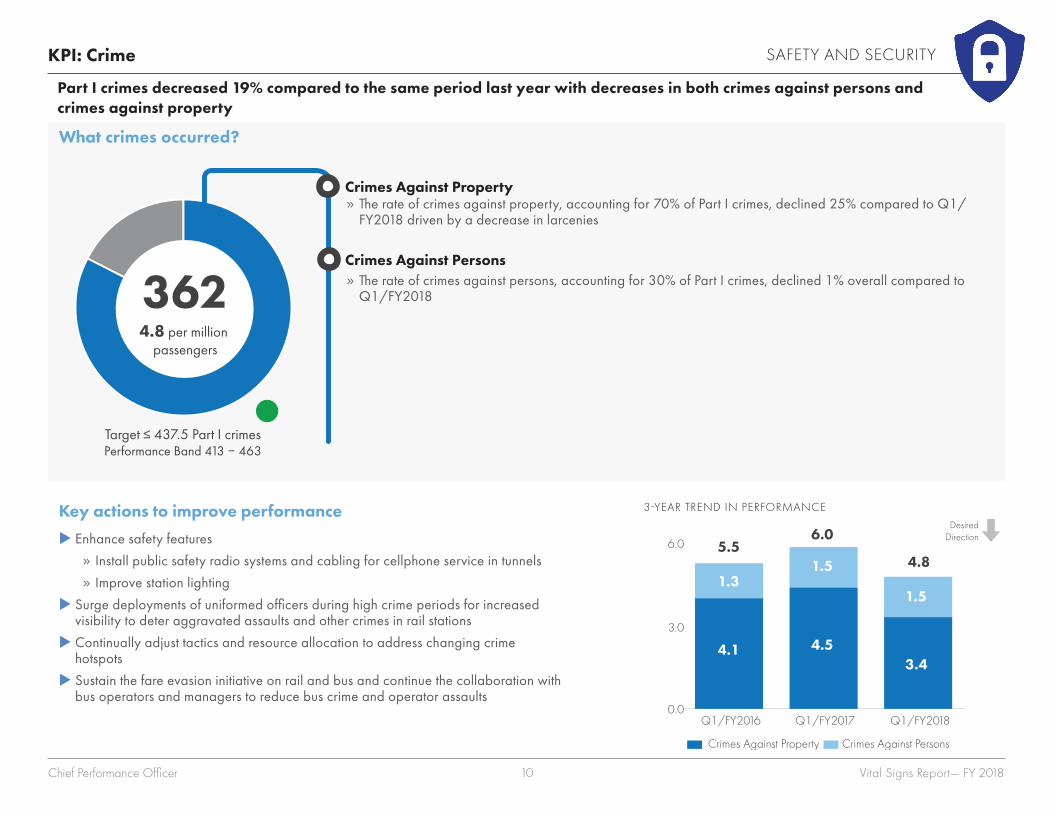
KPI: Crime SAFETY AND SECURITY
3624.8 per million
passengers
Target ≤ 437.5 Part I crimesPerformance Band 413 463
Target1,750
0
3
6 5.56.0
4.86.0
0.0
25%
3.0
1.5
1.51.3
4.53.4
4.1
Crimes Against Property Crimes Against Persons
Target1,750
DesiredDirection
Q1/FY2017 Q1/FY2018Q1/FY2016
Part I crimes decreased 19% compared to the same period last year with decreases in both crimes against persons and crimes against property
Key actions to improve performance
X Enhance safety features
»» Install public safety radio systems and cabling for cellphone service in tunnels
»» Improve station lighting
X Surge deployments of uniformed officers during high crime periods for increased visibility to deter aggravated assaults and other crimes in rail stations
X Continually adjust tactics and resource allocation to address changing crime hotspots
X Sustain the fare evasion initiative on rail and bus and continue the collaboration with bus operators and managers to reduce bus crime and operator assaults
What crimes occurred?
3-YEAR TREND IN PERFORMANCE
»» The rate of crimes against property, accounting for 70% of Part I crimes, declined 25% compared to Q1/FY2018 driven by a decrease in larcenies
»» The rate of crimes against persons, accounting for 30% of Part I crimes, declined 1% overall compared to Q1/FY2018
Crimes Against Property
Crimes Against Persons
Chief Performance Officer 10 Vital Signs Report— FY 2018
»» Metrorail’s average weekday ridership FYTD was 593,000, a year‑over‑year decrease of 10%»» Off‑peak hours, including weekends, saw greater ridership decreases, declining 16% compared to an 8% decline in peak period ridership
»» MetroAccess averaged 8,000 trips per weekday, and is up 3 .6% compared to the same period last year
»» Average weekday bus ridership was 413,000, a 5% decrease from the first 6 months of 2016»» Bus trips where passengers connect to Metrorail are only about a quarter of total bus trips but accounted for 60% of the ridership decline (declining 11% compared to 3% for bus‑only trips)
Rail
Bus
MetroAccess
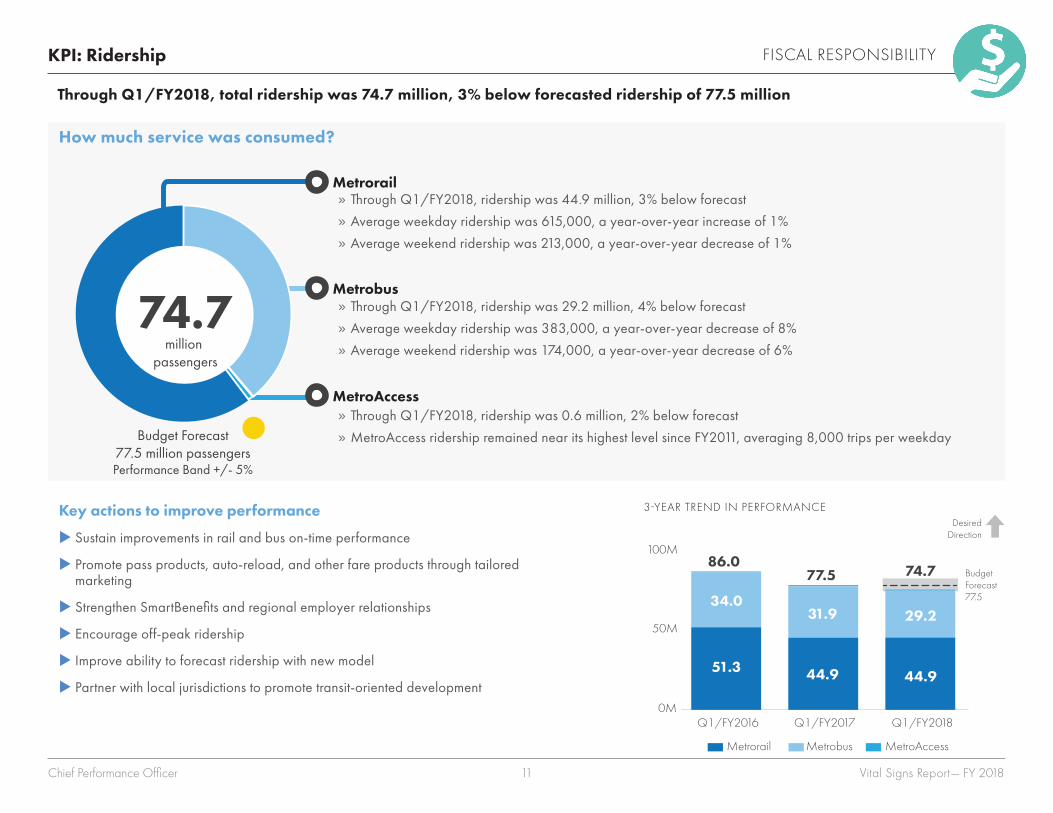
KPI: Ridership FISCAL RESPONSIBILITY
0
25
50
75
100
31.9 29.2
100M
0 0M
50M
BudgetForecast77.534.0
51.3 44.9 44.9
Metrorail Metrobus MetroAccess
86.077.5 74.7
DesiredDirection
Q1/FY2017 Q1/FY2018Q1/FY2016
Through Q1/FY2018, total ridership was 74.7 million, 3% below forecasted ridership of 77.5 million
How much service was consumed?
3-YEAR TREND IN PERFORMANCE
ridership
74.7
Budget Forecast77.5 million passengersPerformance Band +/- 5%
million passengers
»» Through Q1/FY2018, ridership was 44 .9 million, 3% below forecast
»» Average weekday ridership was 615,000, a year‑over‑year increase of 1%
»» Average weekend ridership was 213,000, a year‑over‑year decrease of 1%
Metrorail
Metrobus
MetroAccess
»» Through Q1/FY2018, ridership was 29 .2 million, 4% below forecast
»» Average weekday ridership was 383,000, a year‑over‑year decrease of 8%
»» Average weekend ridership was 174,000, a year‑over‑year decrease of 6%
»» Through Q1/FY2018, ridership was 0 .6 million, 2% below forecast
»» MetroAccess ridership remained near its highest level since FY2011, averaging 8,000 trips per weekday
Key actions to improve performance
X Sustain improvements in rail and bus on‑time performance
X Promote pass products, auto‑reload, and other fare products through tailored marketing
X Strengthen SmartBenefits and regional employer relationships
X Encourage off‑peak ridership
X Improve ability to forecast ridership with new model
X Partner with local jurisdictions to promote transit‑oriented development
Chief Performance Officer 11 Vital Signs Report— FY 2018
Railcar
Stations & Passenger Facilities
Bus & Paratransit
Rail Systems
Track & Structures Rehabilitation
Business Support
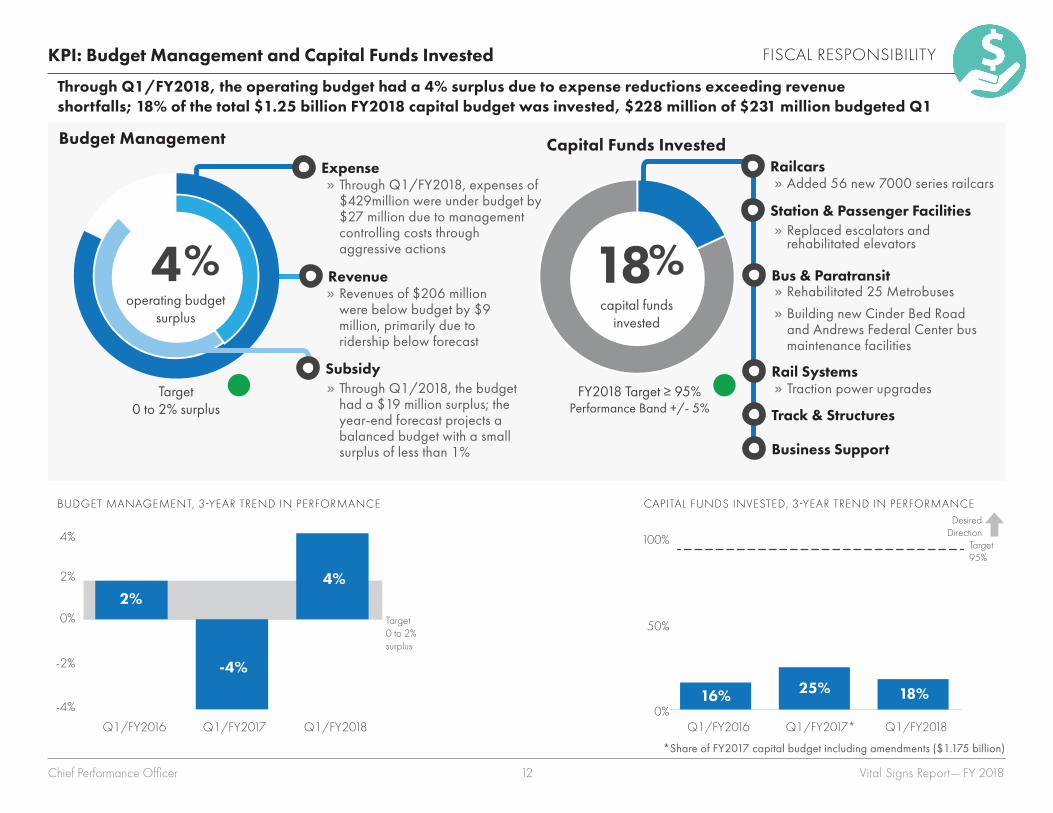
KPI: Budget Management and Capital Funds Invested FISCAL RESPONSIBILITY
Target0 to 2% surplus
4%operating budget
surplus
FY2018 Target ≥ 95%Performance Band +/- 5%
18%capital funds
invested
0.00
0.25
0.50
0.75
1.00
50%
0%
25%
100% Target95%
16% 25% 18%
DesiredDirection
Q1/FY2017* Q1/FY2018Q1/FY2016
Through Q1/FY2018, the operating budget had a 4% surplus due to expense reductions exceeding revenue shortfalls; 18% of the total $1.25 billion FY2018 capital budget was invested, $228 million of $231 million budgeted Q1
CAPITAL FUNDS INVESTED, 3-YEAR TREND IN PERFORMANCE
-4
-2
0
2
4
4%
4%
0%
-4%
2%
-2%
2%
-4%
Target0 to 2% surplus
Q1/FY2017 Q1/FY2018Q1/FY2016
BUDGET MANAGEMENT, 3-YEAR TREND IN PERFORMANCE
»» Through Q1/FY2018, expenses of $429million were under budget by $27 million due to management controlling costs through aggressive actions
Expense
»» Revenues of $206 million were below budget by $9 million, primarily due to ridership below forecast
Revenue
»» Through Q1/2018, the budget had a $19 million surplus; the year‑end forecast projects a balanced budget with a small surplus of less than 1%
Subsidy
»» Added 56 new 7000 series railcarsRailcars
»» Replaced escalators and rehabilitated elevators
Station & Passenger Facilities
»» Rehabilitated 25 Metrobuses
»» Building new Cinder Bed Road and Andrews Federal Center bus maintenance facilities
Bus & Paratransit
»» Traction power upgradesRail Systems
Track & Structures
Business Support
Budget Management Capital Funds Invested
*Share of FY2017 capital budget including amendments ($1 .175 billion)
Chief Performance Officer 12 Vital Signs Report— FY 2018
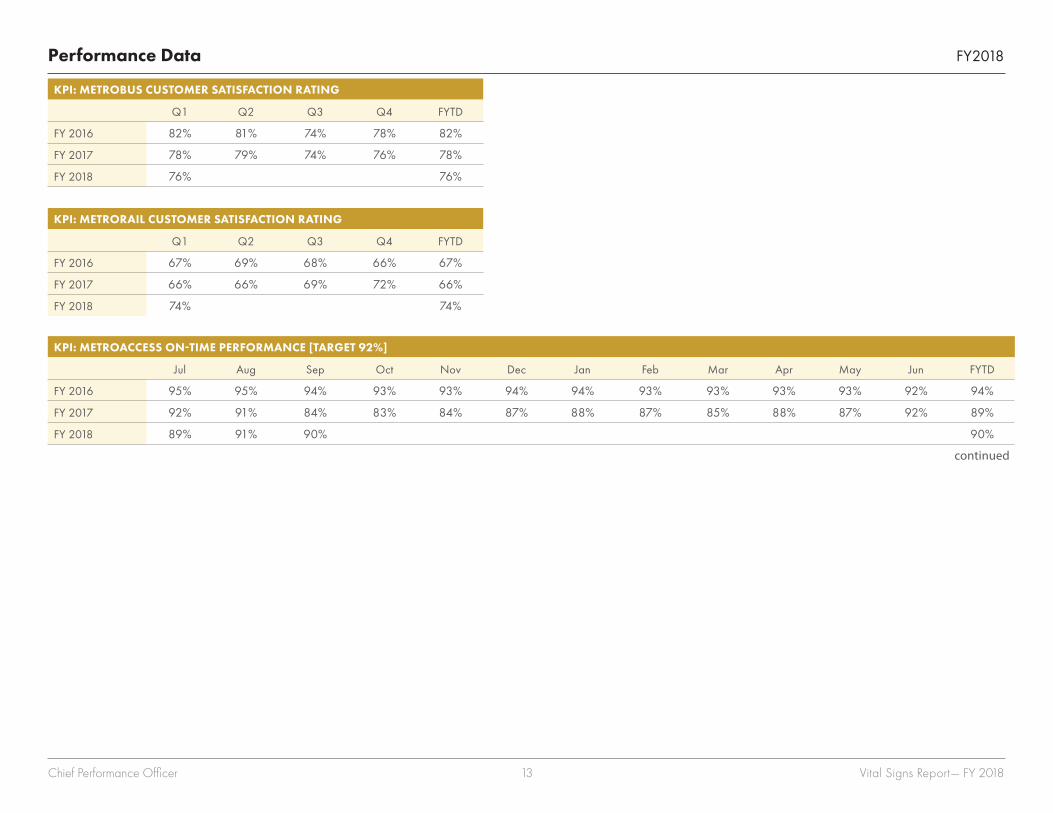
Performance Data FY2018
KPI: METROBUS CUSTOMER SATISFACTION RATING
Q1 Q2 Q3 Q4 FYTD
FY 2016 82% 81% 74% 78% 82%
FY 2017 78% 79% 74% 76% 78%
FY 2018 76% 76%
KPI: METRORAIL CUSTOMER SATISFACTION RATING
Q1 Q2 Q3 Q4 FYTD
FY 2016 67% 69% 68% 66% 67%
FY 2017 66% 66% 69% 72% 66%
FY 2018 74% 74%
KPI: METROACCESS ON-TIME PERFORMANCE [TARGET 92%]
Jul Aug Sep Oct Nov Dec Jan Feb Mar Apr May Jun FYTD
FY 2016 95% 95% 94% 93% 93% 94% 94% 93% 93% 93% 93% 92% 94%
FY 2017 92% 91% 84% 83% 84% 87% 88% 87% 85% 88% 87% 92% 89%
FY 2018 89% 91% 90% 90%
continued
Chief Performance Officer 13 Vital Signs Report— FY 2018
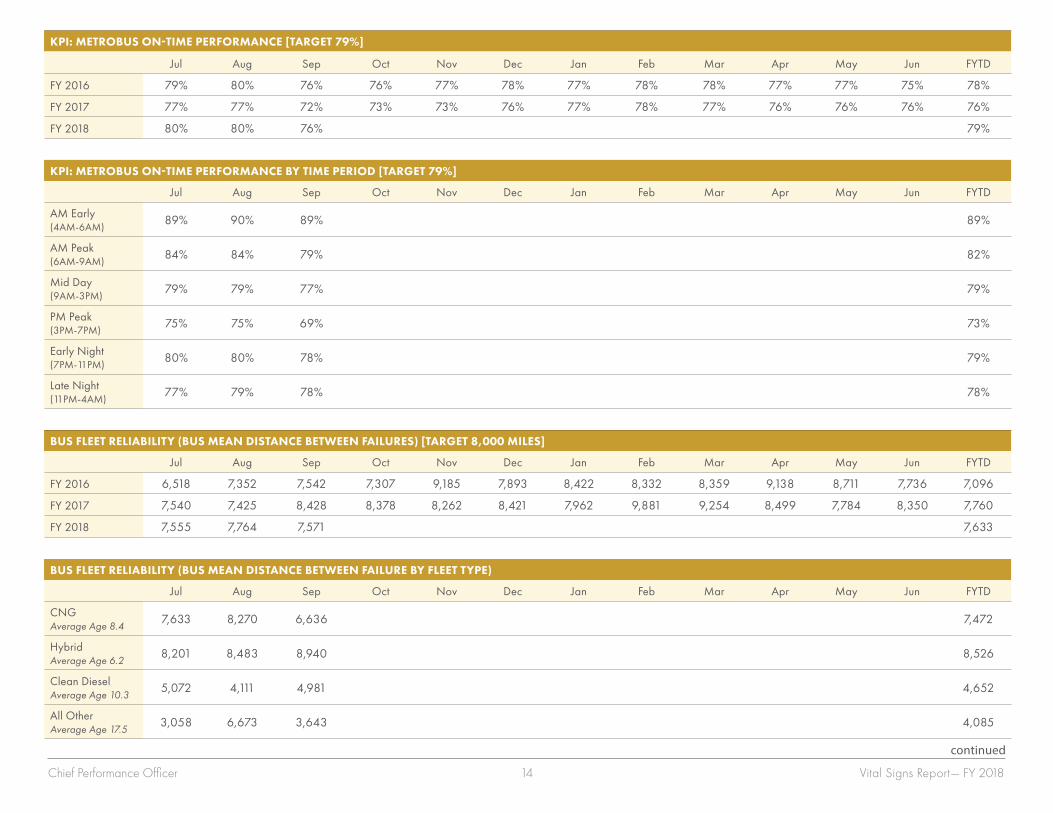
KPI: METROBUS ON-TIME PERFORMANCE [TARGET 79%]
Jul Aug Sep Oct Nov Dec Jan Feb Mar Apr May Jun FYTD
FY 2016 79% 80% 76% 76% 77% 78% 77% 78% 78% 77% 77% 75% 78%
FY 2017 77% 77% 72% 73% 73% 76% 77% 78% 77% 76% 76% 76% 76%
FY 2018 80% 80% 76% 79%
KPI: METROBUS ON-TIME PERFORMANCE BY TIME PERIOD [TARGET 79%]
Jul Aug Sep Oct Nov Dec Jan Feb Mar Apr May Jun FYTD
AM Early (4AM‑6AM)
89% 90% 89% 89%
AM Peak (6AM‑9AM)
84% 84% 79% 82%
Mid Day (9AM‑3PM)
79% 79% 77% 79%
PM Peak (3PM‑7PM)
75% 75% 69% 73%
Early Night (7PM‑11PM)
80% 80% 78% 79%
Late Night (11PM‑4AM)
77% 79% 78% 78%
BUS FLEET RELIABILITY (BUS MEAN DISTANCE BETWEEN FAILURES) [TARGET 8,000 MILES]
Jul Aug Sep Oct Nov Dec Jan Feb Mar Apr May Jun FYTD
FY 2016 6,518 7,352 7,542 7,307 9,185 7,893 8,422 8,332 8,359 9,138 8,711 7,736 7,096
FY 2017 7,540 7,425 8,428 8,378 8,262 8,421 7,962 9,881 9,254 8,499 7,784 8,350 7,760
FY 2018 7,555 7,764 7,571 7,633
BUS FLEET RELIABILITY (BUS MEAN DISTANCE BETWEEN FAILURE BY FLEET TYPE)
Jul Aug Sep Oct Nov Dec Jan Feb Mar Apr May Jun FYTD
CNG Average Age 8.4
7,633 8,270 6,636 7,472
Hybrid Average Age 6.2
8,201 8,483 8,940 8,526
Clean Diesel Average Age 10.3
5,072 4,111 4,981 4,652
All Other Average Age 17.5
3,058 6,673 3,643 4,085
continued
Chief Performance Officer 14 Vital Signs Report— FY 2018
KPI: BUS ON-TIME PERFORMANCE [TARGET 79%]
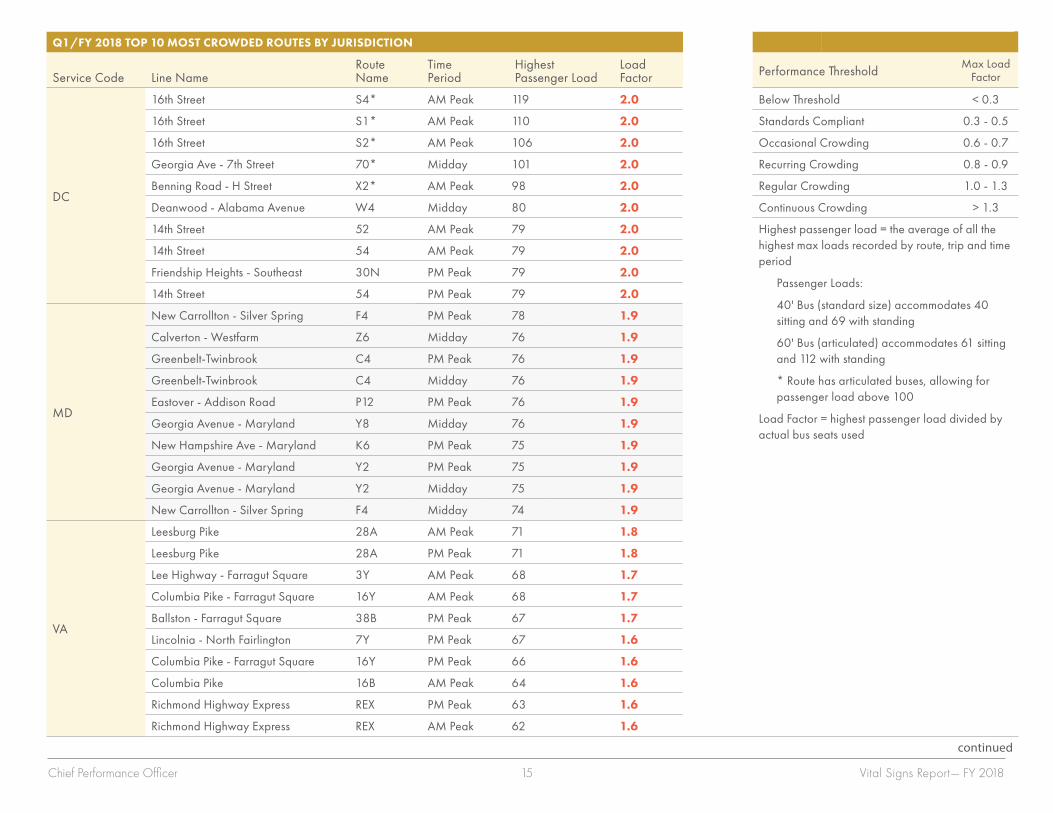
Q1/FY 2018 TOP 10 MOST CROWDED ROUTES BY JURISDICTION
Service Code Line NameRoute Name
Time Period
Highest Passenger Load
Load Factor Performance Threshold Max Load
Factor
DC
16th Street S4* AM Peak 119 2.0 Below Threshold < 0 .3
16th Street S1* AM Peak 110 2.0 Standards Compliant 0 .3 ‑ 0 .5
16th Street S2* AM Peak 106 2.0 Occasional Crowding 0 .6 ‑ 0 .7
Georgia Ave ‑ 7th Street 70* Midday 101 2.0 Recurring Crowding 0 .8 ‑ 0 .9
Benning Road ‑ H Street X2* AM Peak 98 2.0 Regular Crowding 1 .0 ‑ 1 .3
Deanwood ‑ Alabama Avenue W4 Midday 80 2.0 Continuous Crowding > 1 .3
14th Street 52 AM Peak 79 2.0 Highest passenger load = the average of all the highest max loads recorded by route, trip and time period
Passenger Loads:
40' Bus (standard size) accommodates 40 sitting and 69 with standing
60' Bus (articulated) accommodates 61 sitting and 112 with standing
* Route has articulated buses, allowing for passenger load above 100
Load Factor = highest passenger load divided by actual bus seats used
14th Street 54 AM Peak 79 2.0
Friendship Heights ‑ Southeast 30N PM Peak 79 2.0
14th Street 54 PM Peak 79 2.0
MD
New Carrollton ‑ Silver Spring F4 PM Peak 78 1.9
Calverton ‑ Westfarm Z6 Midday 76 1.9
Greenbelt‑Twinbrook C4 PM Peak 76 1.9
Greenbelt‑Twinbrook C4 Midday 76 1.9
Eastover ‑ Addison Road P12 PM Peak 76 1.9
Georgia Avenue ‑ Maryland Y8 Midday 76 1.9
New Hampshire Ave ‑ Maryland K6 PM Peak 75 1.9
Georgia Avenue ‑ Maryland Y2 PM Peak 75 1.9
Georgia Avenue ‑ Maryland Y2 Midday 75 1.9
New Carrollton ‑ Silver Spring F4 Midday 74 1.9
VA
Leesburg Pike 28A AM Peak 71 1.8
Leesburg Pike 28A PM Peak 71 1.8
Lee Highway ‑ Farragut Square 3Y AM Peak 68 1.7
Columbia Pike ‑ Farragut Square 16Y AM Peak 68 1.7
Ballston ‑ Farragut Square 38B PM Peak 67 1.7
Lincolnia ‑ North Fairlington 7Y PM Peak 67 1.6
Columbia Pike ‑ Farragut Square 16Y PM Peak 66 1.6
Columbia Pike 16B AM Peak 64 1.6
Richmond Highway Express REX PM Peak 63 1.6
Richmond Highway Express REX AM Peak 62 1.6
continued
Chief Performance Officer 15 Vital Signs Report— FY 2018
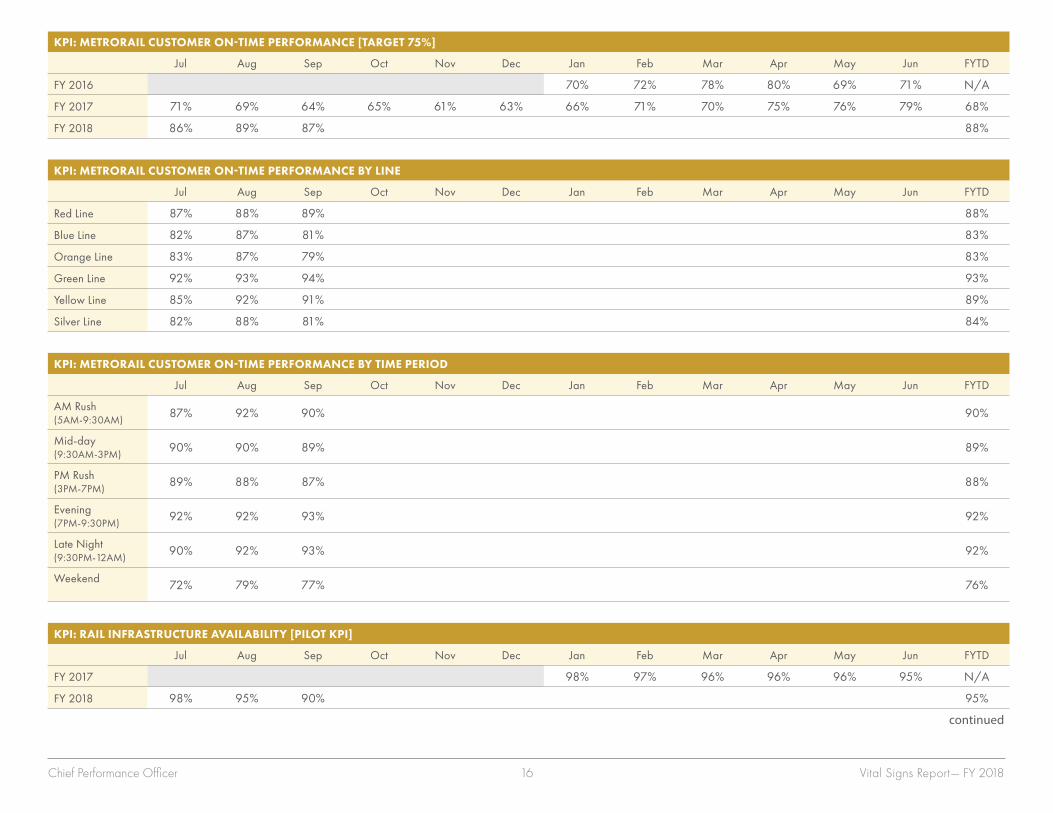
KPI: METRORAIL CUSTOMER ON-TIME PERFORMANCE [TARGET 75%]
Jul Aug Sep Oct Nov Dec Jan Feb Mar Apr May Jun FYTD
FY 2016 70% 72% 78% 80% 69% 71% N/A
FY 2017 71% 69% 64% 65% 61% 63% 66% 71% 70% 75% 76% 79% 68%
FY 2018 86% 89% 87% 88%
KPI: METRORAIL CUSTOMER ON-TIME PERFORMANCE BY LINE
Jul Aug Sep Oct Nov Dec Jan Feb Mar Apr May Jun FYTD
Red Line 87% 88% 89% 88%
Blue Line 82% 87% 81% 83%
Orange Line 83% 87% 79% 83%
Green Line 92% 93% 94% 93%
Yellow Line 85% 92% 91% 89%
Silver Line 82% 88% 81% 84%
KPI: METRORAIL CUSTOMER ON-TIME PERFORMANCE BY TIME PERIOD
Jul Aug Sep Oct Nov Dec Jan Feb Mar Apr May Jun FYTD
AM Rush (5AM‑9:30AM)
87% 92% 90% 90%
Mid‑day (9:30AM‑3PM)
90% 90% 89% 89%
PM Rush (3PM‑7PM)
89% 88% 87% 88%
Evening (7PM‑9:30PM)
92% 92% 93% 92%
Late Night (9:30PM‑12AM)
90% 92% 93% 92%
Weekend 72% 79% 77% 76%
KPI: RAIL INFRASTRUCTURE AVAILABILITY [PILOT KPI]
Jul Aug Sep Oct Nov Dec Jan Feb Mar Apr May Jun FYTD
FY 2017 98% 97% 96% 96% 96% 95% N/A
FY 2018 98% 95% 90% 95%
continued
Chief Performance Officer 16 Vital Signs Report— FY 2018
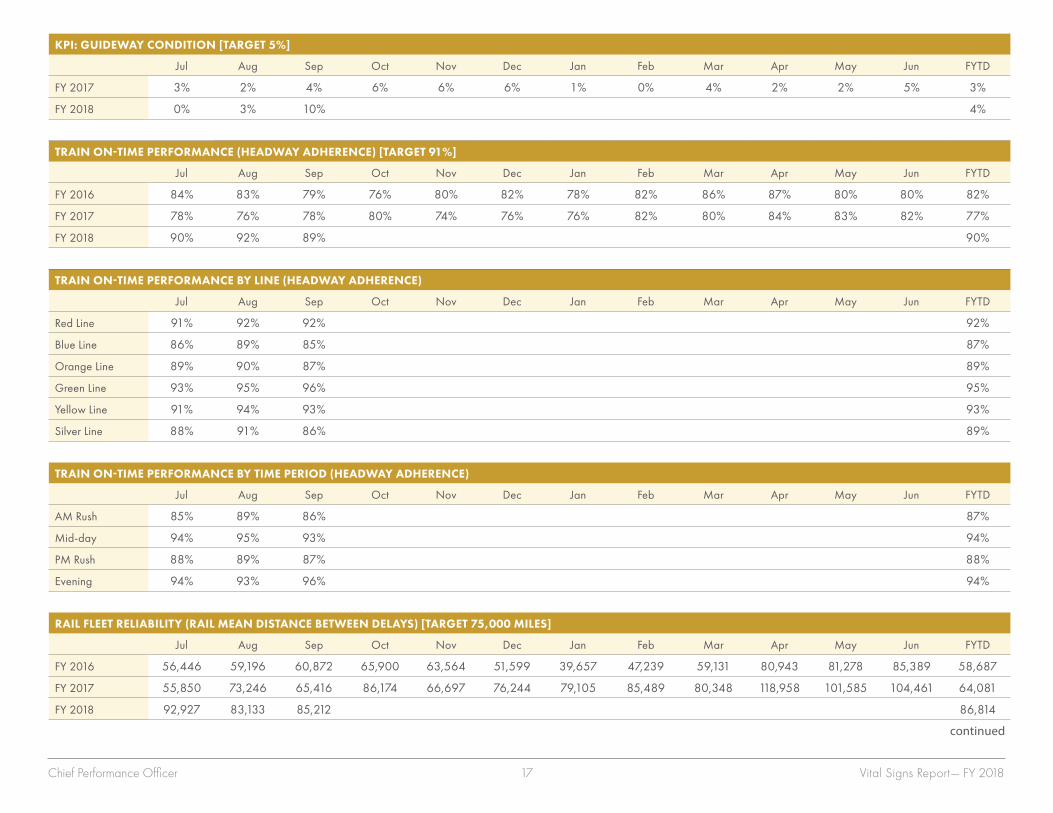
KPI: GUIDEWAY CONDITION [TARGET 5%]
Jul Aug Sep Oct Nov Dec Jan Feb Mar Apr May Jun FYTD
FY 2017 3% 2% 4% 6% 6% 6% 1% 0% 4% 2% 2% 5% 3%
FY 2018 0% 3% 10% 4%
TRAIN ON-TIME PERFORMANCE (HEADWAY ADHERENCE) [TARGET 91%]
Jul Aug Sep Oct Nov Dec Jan Feb Mar Apr May Jun FYTD
FY 2016 84% 83% 79% 76% 80% 82% 78% 82% 86% 87% 80% 80% 82%
FY 2017 78% 76% 78% 80% 74% 76% 76% 82% 80% 84% 83% 82% 77%
FY 2018 90% 92% 89% 90%
TRAIN ON-TIME PERFORMANCE BY LINE (HEADWAY ADHERENCE)
Jul Aug Sep Oct Nov Dec Jan Feb Mar Apr May Jun FYTD
Red Line 91% 92% 92% 92%
Blue Line 86% 89% 85% 87%
Orange Line 89% 90% 87% 89%
Green Line 93% 95% 96% 95%
Yellow Line 91% 94% 93% 93%
Silver Line 88% 91% 86% 89%
TRAIN ON-TIME PERFORMANCE BY TIME PERIOD (HEADWAY ADHERENCE)
Jul Aug Sep Oct Nov Dec Jan Feb Mar Apr May Jun FYTD
AM Rush 85% 89% 86% 87%
Mid‑day 94% 95% 93% 94%
PM Rush 88% 89% 87% 88%
Evening 94% 93% 96% 94%
RAIL FLEET RELIABILITY (RAIL MEAN DISTANCE BETWEEN DELAYS) [TARGET 75,000 MILES]
Jul Aug Sep Oct Nov Dec Jan Feb Mar Apr May Jun FYTD
FY 2016 56,446 59,196 60,872 65,900 63,564 51,599 39,657 47,239 59,131 80,943 81,278 85,389 58,687
FY 2017 55,850 73,246 65,416 86,174 66,697 76,244 79,105 85,489 80,348 118,958 101,585 104,461 64,081
FY 2018 92,927 83,133 85,212 86,814
continued
Chief Performance Officer 17 Vital Signs Report— FY 2018
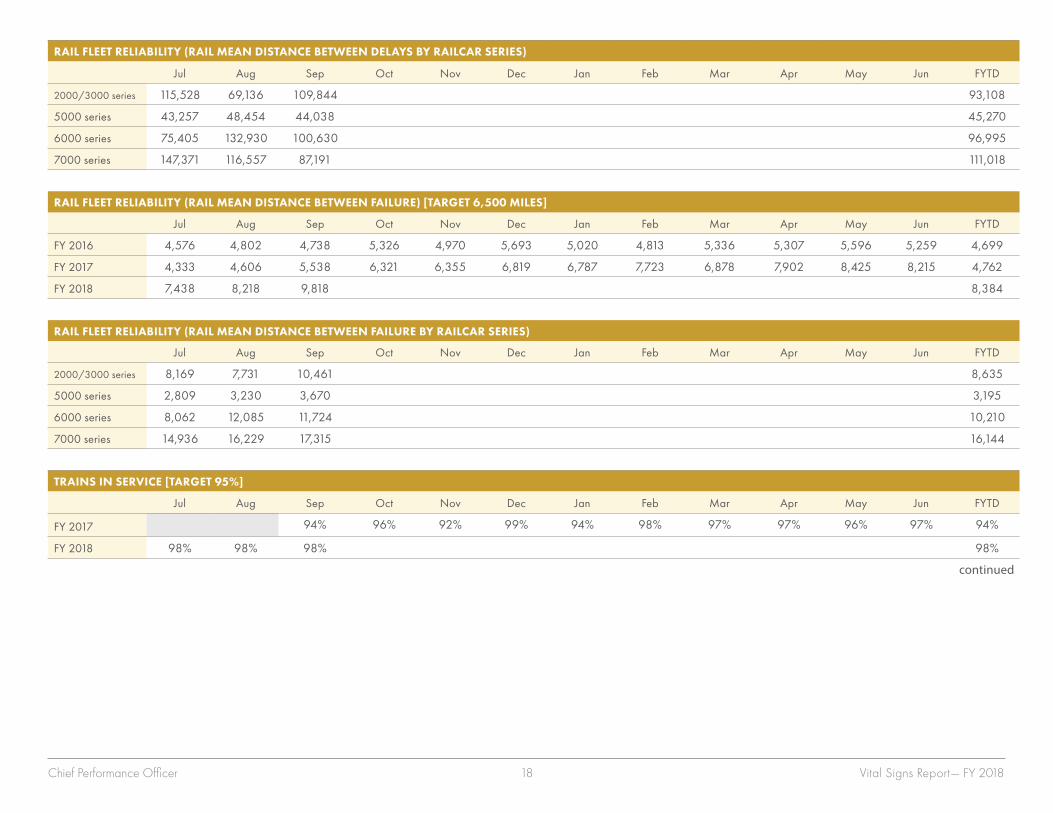
RAIL FLEET RELIABILITY (RAIL MEAN DISTANCE BETWEEN DELAYS BY RAILCAR SERIES)
Jul Aug Sep Oct Nov Dec Jan Feb Mar Apr May Jun FYTD
2000/3000 series 115,528 69,136 109,844 93,108
5000 series 43,257 48,454 44,038 45,270
6000 series 75,405 132,930 100,630 96,995
7000 series 147,371 116,557 87,191 111,018
RAIL FLEET RELIABILITY (RAIL MEAN DISTANCE BETWEEN FAILURE) [TARGET 6,500 MILES]
Jul Aug Sep Oct Nov Dec Jan Feb Mar Apr May Jun FYTD
FY 2016 4,576 4,802 4,738 5,326 4,970 5,693 5,020 4,813 5,336 5,307 5,596 5,259 4,699
FY 2017 4,333 4,606 5,538 6,321 6,355 6,819 6,787 7,723 6,878 7,902 8,425 8,215 4,762
FY 2018 7,438 8,218 9,818 8,384
RAIL FLEET RELIABILITY (RAIL MEAN DISTANCE BETWEEN FAILURE BY RAILCAR SERIES)
Jul Aug Sep Oct Nov Dec Jan Feb Mar Apr May Jun FYTD
2000/3000 series 8,169 7,731 10,461 8,635
5000 series 2,809 3,230 3,670 3,195
6000 series 8,062 12,085 11,724 10,210
7000 series 14,936 16,229 17,315 16,144
TRAINS IN SERVICE [TARGET 95%]
Jul Aug Sep Oct Nov Dec Jan Feb Mar Apr May Jun FYTD
FY 2017 94% 96% 92% 99% 94% 98% 97% 97% 96% 97% 94%
FY 2018 98% 98% 98% 98%
continued
Chief Performance Officer 18 Vital Signs Report— FY 2018
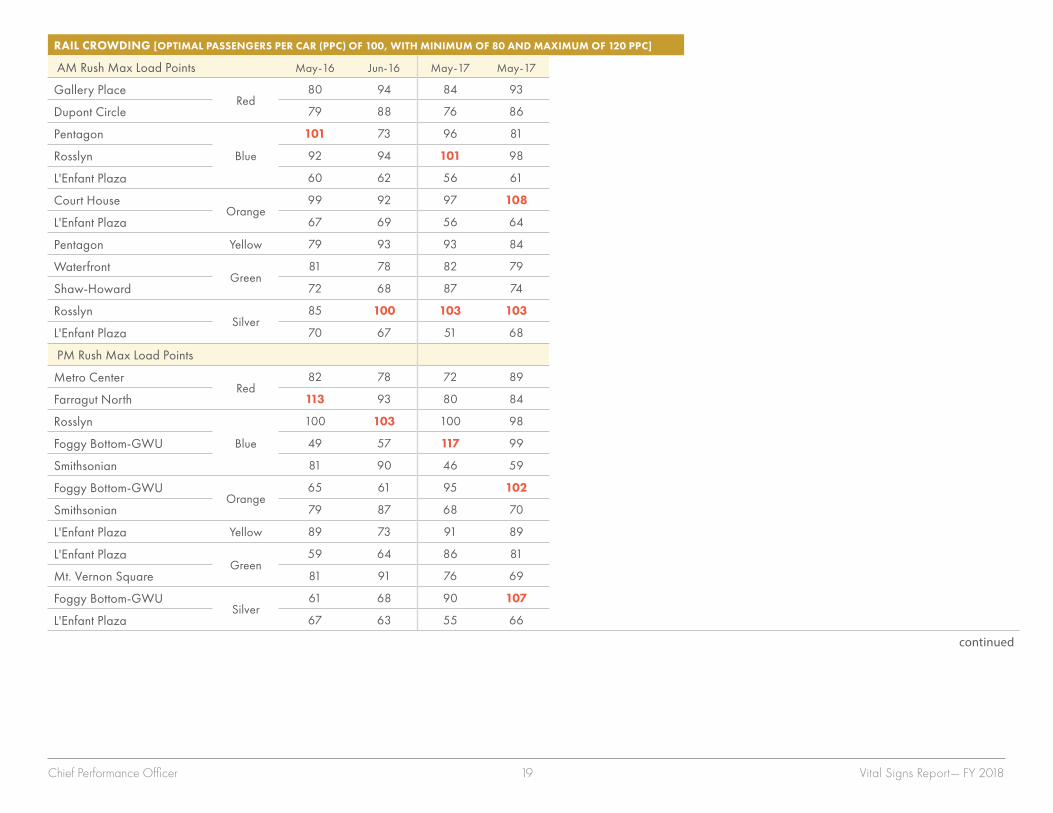
RAIL CROWDING [OPTIMAL PASSENGERS PER CAR (PPC) OF 100, WITH MINIMUM OF 80 AND MAXIMUM OF 120 PPC]
AM Rush Max Load Points May‑16 Jun‑16 May‑17 May‑17
Gallery PlaceRed
80 94 84 93
Dupont Circle 79 88 76 86
Pentagon
Blue
101 73 96 81
Rosslyn 92 94 101 98
L'Enfant Plaza 60 62 56 61
Court HouseOrange
99 92 97 108
L'Enfant Plaza 67 69 56 64
Pentagon Yellow 79 93 93 84
WaterfrontGreen
81 78 82 79
Shaw‑Howard 72 68 87 74
RosslynSilver
85 100 103 103
L'Enfant Plaza 70 67 51 68
PM Rush Max Load Points
Metro CenterRed
82 78 72 89
Farragut North 113 93 80 84
Rosslyn
Blue
100 103 100 98
Foggy Bottom‑GWU 49 57 117 99
Smithsonian 81 90 46 59
Foggy Bottom‑GWUOrange
65 61 95 102
Smithsonian 79 87 68 70
L'Enfant Plaza Yellow 89 73 91 89
L'Enfant PlazaGreen
59 64 86 81
Mt . Vernon Square 81 91 76 69
Foggy Bottom‑GWUSilver
61 68 90 107
L'Enfant Plaza 67 63 55 66
continued
Chief Performance Officer 19 Vital Signs Report— FY 2018
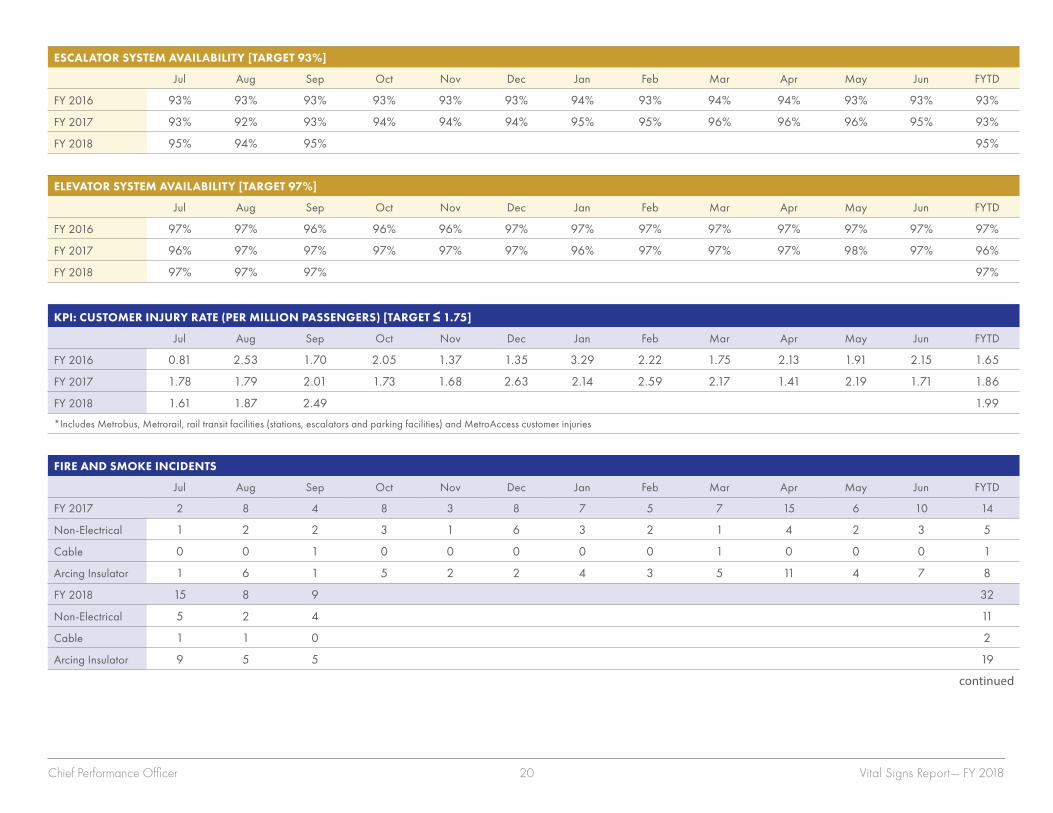
ESCALATOR SYSTEM AVAILABILITY [TARGET 93%]
Jul Aug Sep Oct Nov Dec Jan Feb Mar Apr May Jun FYTD
FY 2016 93% 93% 93% 93% 93% 93% 94% 93% 94% 94% 93% 93% 93%
FY 2017 93% 92% 93% 94% 94% 94% 95% 95% 96% 96% 96% 95% 93%
FY 2018 95% 94% 95% 95%
ELEVATOR SYSTEM AVAILABILITY [TARGET 97%]
Jul Aug Sep Oct Nov Dec Jan Feb Mar Apr May Jun FYTD
FY 2016 97% 97% 96% 96% 96% 97% 97% 97% 97% 97% 97% 97% 97%
FY 2017 96% 97% 97% 97% 97% 97% 96% 97% 97% 97% 98% 97% 96%
FY 2018 97% 97% 97% 97%
KPI: CUSTOMER INJURY RATE (PER MILLION PASSENGERS) [TARGET ≤ 1.75]
Jul Aug Sep Oct Nov Dec Jan Feb Mar Apr May Jun FYTD
FY 2016 0 .81 2 .53 1 .70 2 .05 1 .37 1 .35 3 .29 2 .22 1 .75 2 .13 1 .91 2 .15 1 .65
FY 2017 1 .78 1 .79 2 .01 1 .73 1 .68 2 .63 2 .14 2 .59 2 .17 1 .41 2 .19 1 .71 1 .86
FY 2018 1 .61 1 .87 2 .49 1 .99
*Includes Metrobus, Metrorail, rail transit facilities (stations, escalators and parking facilities) and MetroAccess customer injuries
FIRE AND SMOKE INCIDENTS
Jul Aug Sep Oct Nov Dec Jan Feb Mar Apr May Jun FYTD
FY 2017 2 8 4 8 3 8 7 5 7 15 6 10 14
Non‑Electrical 1 2 2 3 1 6 3 2 1 4 2 3 5
Cable 0 0 1 0 0 0 0 0 1 0 0 0 1
Arcing Insulator 1 6 1 5 2 2 4 3 5 11 4 7 8
FY 2018 15 8 9 32
Non‑Electrical 5 2 4 11
Cable 1 1 0 2
Arcing Insulator 9 5 5 19
continued
Chief Performance Officer 20 Vital Signs Report— FY 2018
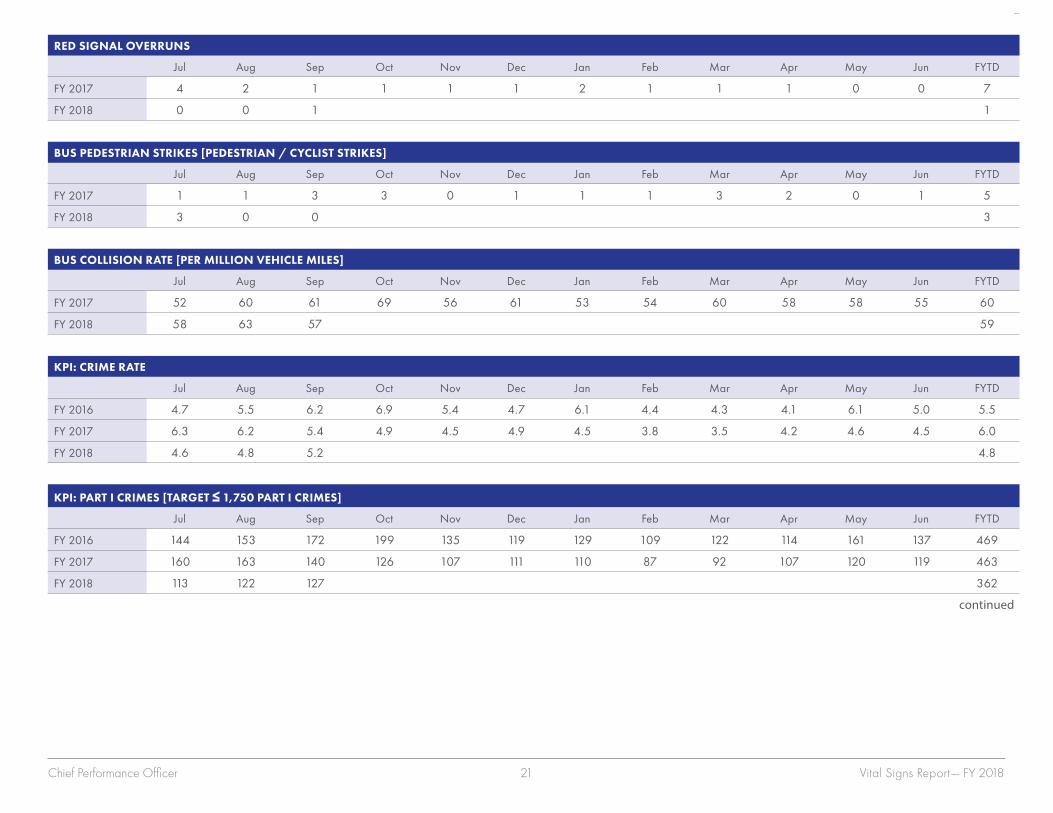
RED SIGNAL OVERRUNS
Jul Aug Sep Oct Nov Dec Jan Feb Mar Apr May Jun FYTD
FY 2017 4 2 1 1 1 1 2 1 1 1 0 0 7
FY 2018 0 0 1 1
BUS PEDESTRIAN STRIKES [PEDESTRIAN / CYCLIST STRIKES]
Jul Aug Sep Oct Nov Dec Jan Feb Mar Apr May Jun FYTD
FY 2017 1 1 3 3 0 1 1 1 3 2 0 1 5
FY 2018 3 0 0 3
BUS COLLISION RATE [PER MILLION VEHICLE MILES]
Jul Aug Sep Oct Nov Dec Jan Feb Mar Apr May Jun FYTD
FY 2017 52 60 61 69 56 61 53 54 60 58 58 55 60
FY 2018 58 63 57 59
KPI: CRIME RATE
Jul Aug Sep Oct Nov Dec Jan Feb Mar Apr May Jun FYTD
FY 2016 4 .7 5 .5 6 .2 6 .9 5 .4 4 .7 6 .1 4 .4 4 .3 4 .1 6 .1 5 .0 5 .5
FY 2017 6 .3 6 .2 5 .4 4 .9 4 .5 4 .9 4 .5 3 .8 3 .5 4 .2 4 .6 4 .5 6 .0
FY 2018 4 .6 4 .8 5 .2 4 .8
KPI: PART I CRIMES [TARGET ≤ 1,750 PART I CRIMES]
Jul Aug Sep Oct Nov Dec Jan Feb Mar Apr May Jun FYTD
FY 2016 144 153 172 199 135 119 129 109 122 114 161 137 469
FY 2017 160 163 140 126 107 111 110 87 92 107 120 119 463
FY 2018 113 122 127 362
continued
Chief Performance Officer 21 Vital Signs Report— FY 2018
83
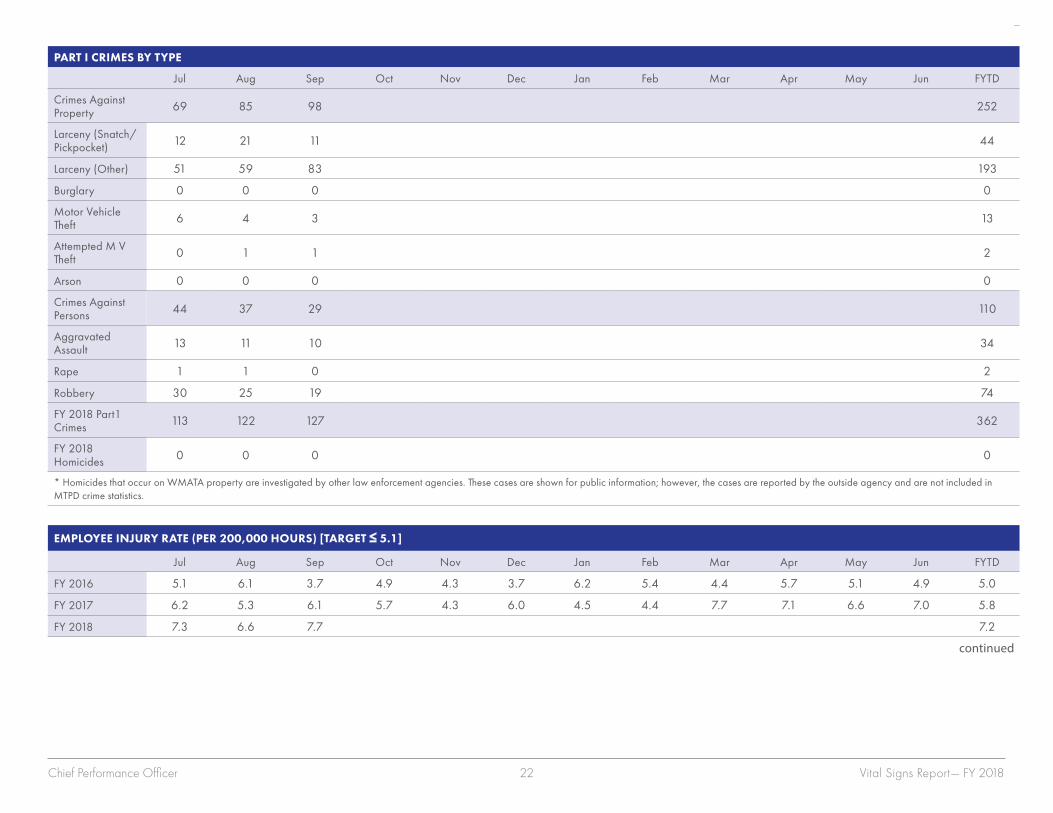
PART I CRIMES BY TYPE
Jul Aug Sep Oct Nov Dec Jan Feb Mar Apr May Jun FYTD
Crimes Against Property 69 85 98 252
Larceny (Snatch/Pickpocket) 12 21 11 44
Larceny (Other) 51 59 83 193
Burglary 0 0 0 0
Motor Vehicle Theft 6 4 3 13
Attempted M V Theft 0 1 1 2
Arson 0 0 0 0
Crimes Against Persons 44 37 29 110
Aggravated Assault 13 11 10 34
Rape 1 1 0 2
Robbery 30 25 19 74
FY 2018 Part1 Crimes 113 122 127 362
FY 2018 Homicides 0 0 0 0
* Homicides that occur on WMATA property are investigated by other law enforcement agencies . These cases are shown for public information; however, the cases are reported by the outside agency and are not included in MTPD crime statistics .
EMPLOYEE INJURY RATE (PER 200,000 HOURS) [TARGET ≤ 5.1]
Jul Aug Sep Oct Nov Dec Jan Feb Mar Apr May Jun FYTD
FY 2016 5 .1 6 .1 3 .7 4 .9 4 .3 3 .7 6 .2 5 .4 4 .4 5 .7 5 .1 4 .9 5 .0
FY 2017 6 .2 5 .3 6 .1 5 .7 4 .3 6 .0 4 .5 4 .4 7 .7 7 .1 6 .6 7 .0 5 .8
FY 2018 7 .3 6 .6 7 .7 7 .2
continued
Chief Performance Officer 22 Vital Signs Report— FY 2018
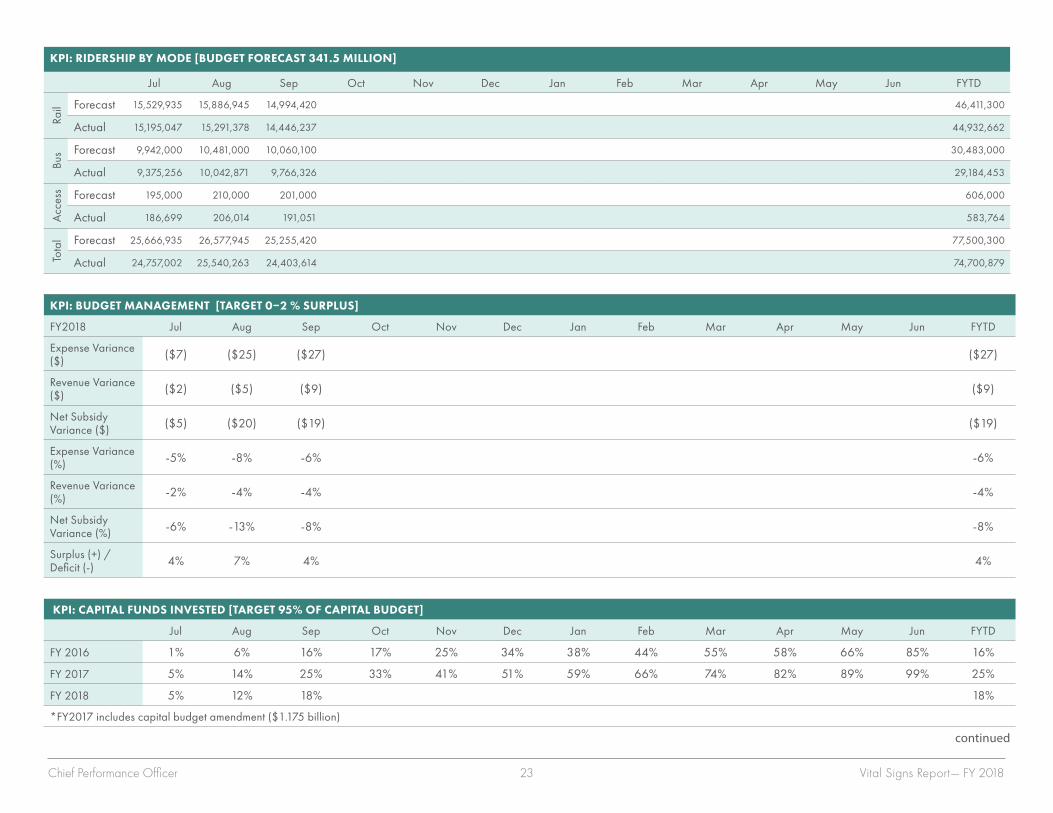
KPI: BUDGET MANAGEMENT [TARGET 0–2 % SURPLUS]
FY2018 Jul Aug Sep Oct Nov Dec Jan Feb Mar Apr May Jun FYTD
Expense Variance ($) ($7) ($25) ($27) ($27)
Revenue Variance ($) ($2) ($5) ($9) ($9)
Net Subsidy Variance ($) ($5) ($20) ($19) ($19)
Expense Variance (%) ‑5% ‑8% ‑6% ‑6%
Revenue Variance (%) ‑2% ‑4% ‑4% ‑4%
Net Subsidy Variance (%) ‑6% ‑13% ‑8% ‑8%
Surplus (+) / Deficit (‑) 4% 7% 4% 4%
KPI: CAPITAL FUNDS INVESTED [TARGET 95% OF CAPITAL BUDGET]
Jul Aug Sep Oct Nov Dec Jan Feb Mar Apr May Jun FYTD
FY 2016 1% 6% 16% 17% 25% 34% 38% 44% 55% 58% 66% 85% 16%
FY 2017 5% 14% 25% 33% 41% 51% 59% 66% 74% 82% 89% 99% 25%
FY 2018 5% 12% 18% 18%
*FY2017 includes capital budget amendment ($1 .175 billion)
continued
KPI: RIDERSHIP BY MODE [BUDGET FORECAST 341.5 MILLION]
Jul Aug Sep Oct Nov Dec Jan Feb Mar Apr May Jun FYTD
Rail Forecast 15,529,935 15,886,945 14,994,420 46,411,300
Actual 15,195,047 15,291,378 14,446,237 44,932,662
Bus Forecast 9,942,000 10,481,000 10,060,100 30,483,000
Actual 9,375,256 10,042,871 9,766,326 29,184,453
Acc
ess Forecast 195,000 210,000 201,000 606,000
Actual 186,699 206,014 191,051 583,764
Tota
l Forecast 25,666,935 26,577,945 25,255,420 77,500,300
Actual 24,757,002 25,540,263 24,403,614 74,700,879
Chief Performance Officer 23 Vital Signs Report— FY 2018

VACANCY RATE [TARGET 5%]
Jul Aug Sep Oct Nov Dec Jan Feb Mar Apr May Jun FYTD
FY 2016 7% 6% 7% 7% 7% 7% 7% 7% 7% 7% 7% 7% 7%
FY 2017 5% 5% 5% 5% 5% 5% 5% 5% 5% 5% 6% 7% 5%
FY 2018 7% 8% 8% 8%
OPERATIONS CRITICAL VACANCY RATE [TARGET 9%]
Jul Aug Sep Oct Nov Dec Jan Feb Mar Apr May Jun FYTD
FY 2016 11% 11% 12% 12% 10% 11% N/A
FY 2017 10% 10% 10% 8% 8% 8% 7% 7% 7% 8% 8% 11% 10%
FY 2018 13% 12% 13% 13%
WATER USAGE (GALLONS PER VEHICLE MILE) [TARGET 0.84]
Jul Aug Sep Oct Nov Dec Jan Feb Mar Apr May Jun FYTD
FY 2016 1 .21 1 .30 1 .47 0 .97 0 .57 0 .52 0 .70 0 .73 0 .60 0 .69 0 .64 0 .94 1 .32
FY 2017 1 .37 1 .29 1 .56 1 .05 0 .61 0 .50 0 .69 0 .52 0 .64 0 .66 0 .67 1 .13 1 .40
FY 2018 1 .25 1 .39 1 .39 1 .35
ENERGY USAGE (BTU/VEHICLE MILE) [TARGET 39,399]
Jul Aug Sep Oct Nov Dec Jan Feb Mar Apr May Jun FYTD
FY 2016 40,193 41,349 39,798 39,262 37,639 42,240 47,371 43,640 37,952 38,660 37,365 39,565 40,449
FY 2017 42,404 39,734 44,477 37,665 38,352 40,112 45,493 42,813 39,927 40,877 36,782 41,244 42,148
FY 2018 41,548 38,877 39,939 40,097
GREENHOUSE GAS EMISSIONS PER VEHICLE MILE [TARGET 4.00]
Jul Aug Sep Oct Nov Dec Jan Feb Mar Apr May Jun FYTD
FY 2016 4 .15 4 .18 4 .18 4 .06 3 .79 4 .31 4 .47 4 .14 3 .56 3 .75 3 .57 3 .79 4 .12
FY 2017 4 .11 3 .80 4 .34 3 .63 3 .66 3 .81 4 .54 4 .34 3 .95 4 .22 3 .77 4 .29 4 .15
FY 2018 4 .34 4 .03 4 .22
continued
Chief Performance Officer 24 Vital Signs Report— FY 2018
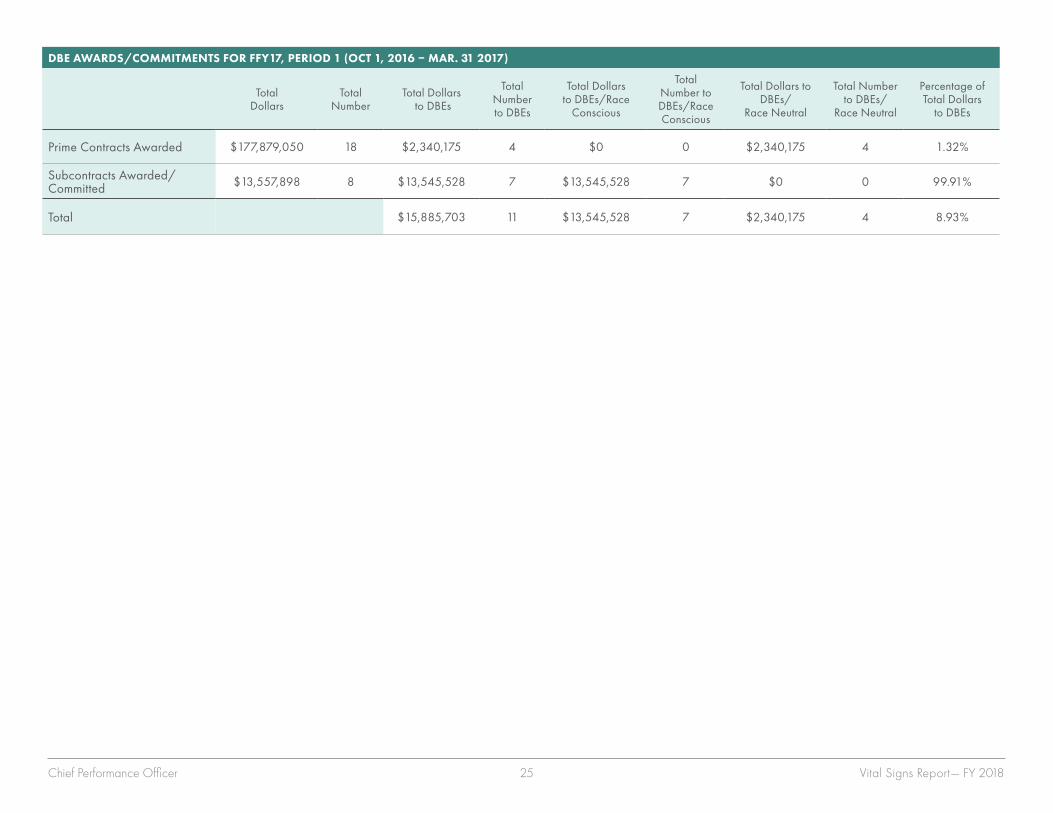
DBE AWARDS/COMMITMENTS FOR FFY17, PERIOD 1 (OCT 1, 2016 – MAR. 31 2017)
Total Dollars
Total Number
Total Dollars to DBEs
Total Number to DBEs
Total Dollars to DBEs/Race
Conscious
Total Number to DBEs/Race Conscious
Total Dollars to DBEs/
Race Neutral
Total Number to DBEs/
Race Neutral
Percentage of Total Dollars
to DBEs
Prime Contracts Awarded $177,879,050 18 $2,340,175 4 $0 0 $2,340,175 4 1 .32%
Subcontracts Awarded/Committed $13,557,898 8 $13,545,528 7 $13,545,528 7 $0 0 99 .91%
Total $15,885,703 11 $13,545,528 7 $2,340,175 4 8 .93%
Chief Performance Officer 25 Vital Signs Report— FY 2018
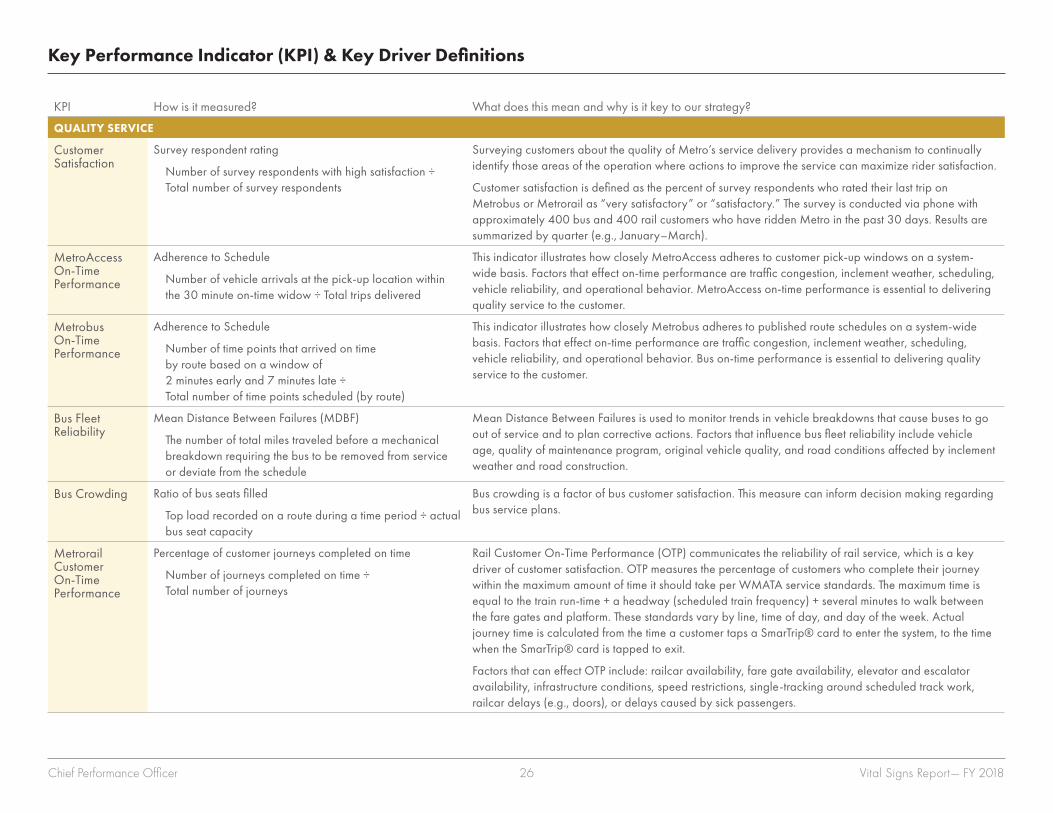
KPI How is it measured? What does this mean and why is it key to our strategy?
QUALITY SERVICE
Customer Satisfaction
Survey respondent rating
Number of survey respondents with high satisfaction ÷ Total number of survey respondents
Surveying customers about the quality of Metro’s service delivery provides a mechanism to continually identify those areas of the operation where actions to improve the service can maximize rider satisfaction .
Customer satisfaction is defined as the percent of survey respondents who rated their last trip on Metrobus or Metrorail as “very satisfactory” or “satisfactory .” The survey is conducted via phone with approximately 400 bus and 400 rail customers who have ridden Metro in the past 30 days . Results are summarized by quarter (e .g ., January–March) .
MetroAccess On‑Time Performance
Adherence to Schedule
Number of vehicle arrivals at the pick‑up location within the 30 minute on‑time widow ÷ Total trips delivered
This indicator illustrates how closely MetroAccess adheres to customer pick‑up windows on a system‑wide basis . Factors that effect on‑time performance are traffic congestion, inclement weather, scheduling, vehicle reliability, and operational behavior . MetroAccess on‑time performance is essential to delivering quality service to the customer .
Metrobus On‑Time Performance
Adherence to Schedule
Number of time points that arrived on time by route based on a window of 2 minutes early and 7 minutes late ÷ Total number of time points scheduled (by route)
This indicator illustrates how closely Metrobus adheres to published route schedules on a system‑wide basis . Factors that effect on‑time performance are traffic congestion, inclement weather, scheduling, vehicle reliability, and operational behavior . Bus on‑time performance is essential to delivering quality service to the customer .
Bus Fleet Reliability
Mean Distance Between Failures (MDBF)
The number of total miles traveled before a mechanical breakdown requiring the bus to be removed from service or deviate from the schedule
Mean Distance Between Failures is used to monitor trends in vehicle breakdowns that cause buses to go out of service and to plan corrective actions . Factors that influence bus fleet reliability include vehicle age, quality of maintenance program, original vehicle quality, and road conditions affected by inclement weather and road construction .
Bus Crowding Ratio of bus seats filled
Top load recorded on a route during a time period ÷ actual bus seat capacity
Bus crowding is a factor of bus customer satisfaction . This measure can inform decision making regarding bus service plans .
Metrorail Customer On‑Time Performance
Percentage of customer journeys completed on time
Number of journeys completed on time ÷ Total number of journeys
Rail Customer On‑Time Performance (OTP) communicates the reliability of rail service, which is a key driver of customer satisfaction . OTP measures the percentage of customers who complete their journey within the maximum amount of time it should take per WMATA service standards . The maximum time is equal to the train run‑time + a headway (scheduled train frequency) + several minutes to walk between the fare gates and platform . These standards vary by line, time of day, and day of the week . Actual journey time is calculated from the time a customer taps a SmarTrip® card to enter the system, to the time when the SmarTrip® card is tapped to exit .
Factors that can effect OTP include: railcar availability, fare gate availability, elevator and escalator availability, infrastructure conditions, speed restrictions, single‑tracking around scheduled track work, railcar delays (e .g ., doors), or delays caused by sick passengers .
Key Performance Indicator (KPI) & Key Driver Definitions
Chief Performance Officer 26 Vital Signs Report— FY 2018
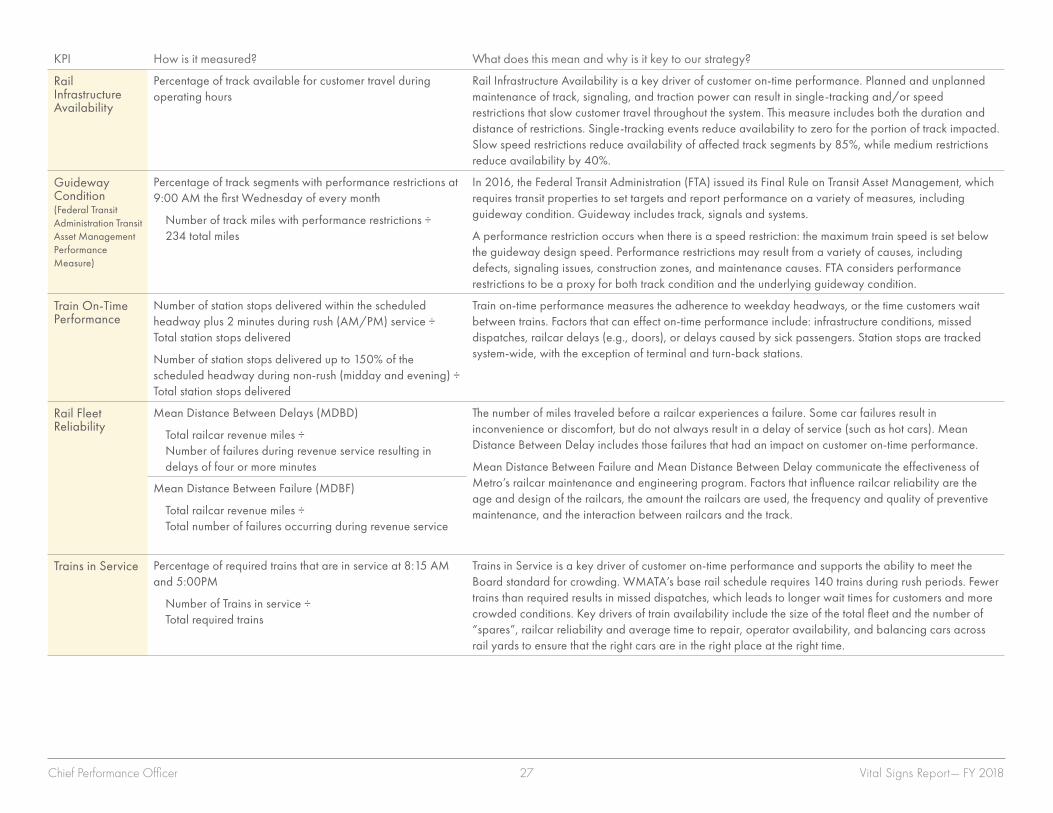
KPI How is it measured? What does this mean and why is it key to our strategy?
Rail Infrastructure Availability
Percentage of track available for customer travel during operating hours
Rail Infrastructure Availability is a key driver of customer on‑time performance . Planned and unplanned maintenance of track, signaling, and traction power can result in single‑tracking and/or speed restrictions that slow customer travel throughout the system . This measure includes both the duration and distance of restrictions . Single‑tracking events reduce availability to zero for the portion of track impacted . Slow speed restrictions reduce availability of affected track segments by 85%, while medium restrictions reduce availability by 40% .
Guideway Condition (Federal Transit Administration Transit Asset Management Performance Measure)
Percentage of track segments with performance restrictions at 9:00 AM the first Wednesday of every month
Number of track miles with performance restrictions ÷ 234 total miles
In 2016, the Federal Transit Administration (FTA) issued its Final Rule on Transit Asset Management, which requires transit properties to set targets and report performance on a variety of measures, including guideway condition . Guideway includes track, signals and systems .
A performance restriction occurs when there is a speed restriction: the maximum train speed is set below the guideway design speed . Performance restrictions may result from a variety of causes, including defects, signaling issues, construction zones, and maintenance causes . FTA considers performance restrictions to be a proxy for both track condition and the underlying guideway condition .
Train On‑Time Performance
Number of station stops delivered within the scheduled headway plus 2 minutes during rush (AM/PM) service ÷ Total station stops delivered
Number of station stops delivered up to 150% of the scheduled headway during non‑rush (midday and evening) ÷ Total station stops delivered
Train on‑time performance measures the adherence to weekday headways, or the time customers wait between trains . Factors that can effect on‑time performance include: infrastructure conditions, missed dispatches, railcar delays (e .g ., doors), or delays caused by sick passengers . Station stops are tracked system‑wide, with the exception of terminal and turn‑back stations .
Rail Fleet Reliability
Mean Distance Between Delays (MDBD)
Total railcar revenue miles ÷ Number of failures during revenue service resulting in delays of four or more minutes
The number of miles traveled before a railcar experiences a failure . Some car failures result in inconvenience or discomfort, but do not always result in a delay of service (such as hot cars) . Mean Distance Between Delay includes those failures that had an impact on customer on‑time performance .
Mean Distance Between Failure and Mean Distance Between Delay communicate the effectiveness of Metro’s railcar maintenance and engineering program . Factors that influence railcar reliability are the age and design of the railcars, the amount the railcars are used, the frequency and quality of preventive maintenance, and the interaction between railcars and the track .
Mean Distance Between Failure (MDBF)
Total railcar revenue miles ÷ Total number of failures occurring during revenue service
Trains in Service Percentage of required trains that are in service at 8:15 AM and 5:00PM
Number of Trains in service ÷ Total required trains
Trains in Service is a key driver of customer on‑time performance and supports the ability to meet the Board standard for crowding . WMATA’s base rail schedule requires 140 trains during rush periods . Fewer trains than required results in missed dispatches, which leads to longer wait times for customers and more crowded conditions . Key drivers of train availability include the size of the total fleet and the number of “spares”, railcar reliability and average time to repair, operator availability, and balancing cars across rail yards to ensure that the right cars are in the right place at the right time .
Chief Performance Officer 27 Vital Signs Report— FY 2018
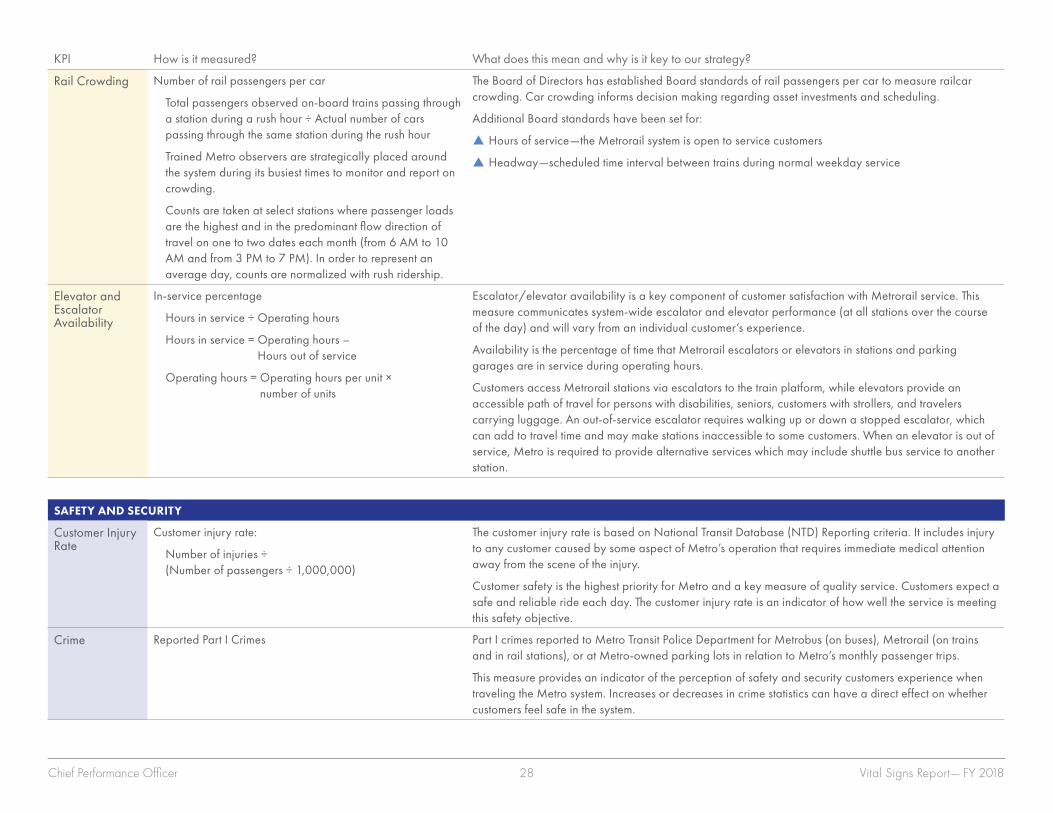
KPI How is it measured? What does this mean and why is it key to our strategy?
Rail Crowding Number of rail passengers per car
Total passengers observed on‑board trains passing through a station during a rush hour ÷ Actual number of cars passing through the same station during the rush hour
Trained Metro observers are strategically placed around the system during its busiest times to monitor and report on crowding .
Counts are taken at select stations where passenger loads are the highest and in the predominant flow direction of travel on one to two dates each month (from 6 AM to 10 AM and from 3 PM to 7 PM) . In order to represent an average day, counts are normalized with rush ridership .
The Board of Directors has established Board standards of rail passengers per car to measure railcar crowding . Car crowding informs decision making regarding asset investments and scheduling .
Additional Board standards have been set for:
S Hours of service—the Metrorail system is open to service customers
S Headway—scheduled time interval between trains during normal weekday service
Elevator and Escalator Availability
In‑service percentage
Hours in service ÷ Operating hours
Hours in service = Operating hours – Hours out of service
Operating hours = Operating hours per unit × number of units
Escalator/elevator availability is a key component of customer satisfaction with Metrorail service . This measure communicates system‑wide escalator and elevator performance (at all stations over the course of the day) and will vary from an individual customer’s experience .
Availability is the percentage of time that Metrorail escalators or elevators in stations and parking garages are in service during operating hours .
Customers access Metrorail stations via escalators to the train platform, while elevators provide an accessible path of travel for persons with disabilities, seniors, customers with strollers, and travelers carrying luggage . An out‑of‑service escalator requires walking up or down a stopped escalator, which can add to travel time and may make stations inaccessible to some customers . When an elevator is out of service, Metro is required to provide alternative services which may include shuttle bus service to another station .
SAFETY AND SECURITY
Customer Injury Rate
Customer injury rate:
Number of injuries ÷ (Number of passengers ÷ 1,000,000)
The customer injury rate is based on National Transit Database (NTD) Reporting criteria . It includes injury to any customer caused by some aspect of Metro’s operation that requires immediate medical attention away from the scene of the injury .
Customer safety is the highest priority for Metro and a key measure of quality service . Customers expect a safe and reliable ride each day . The customer injury rate is an indicator of how well the service is meeting this safety objective .
Crime Reported Part I Crimes Part I crimes reported to Metro Transit Police Department for Metrobus (on buses), Metrorail (on trains and in rail stations), or at Metro‑owned parking lots in relation to Metro’s monthly passenger trips .
This measure provides an indicator of the perception of safety and security customers experience when traveling the Metro system . Increases or decreases in crime statistics can have a direct effect on whether customers feel safe in the system .
Chief Performance Officer 28 Vital Signs Report— FY 2018
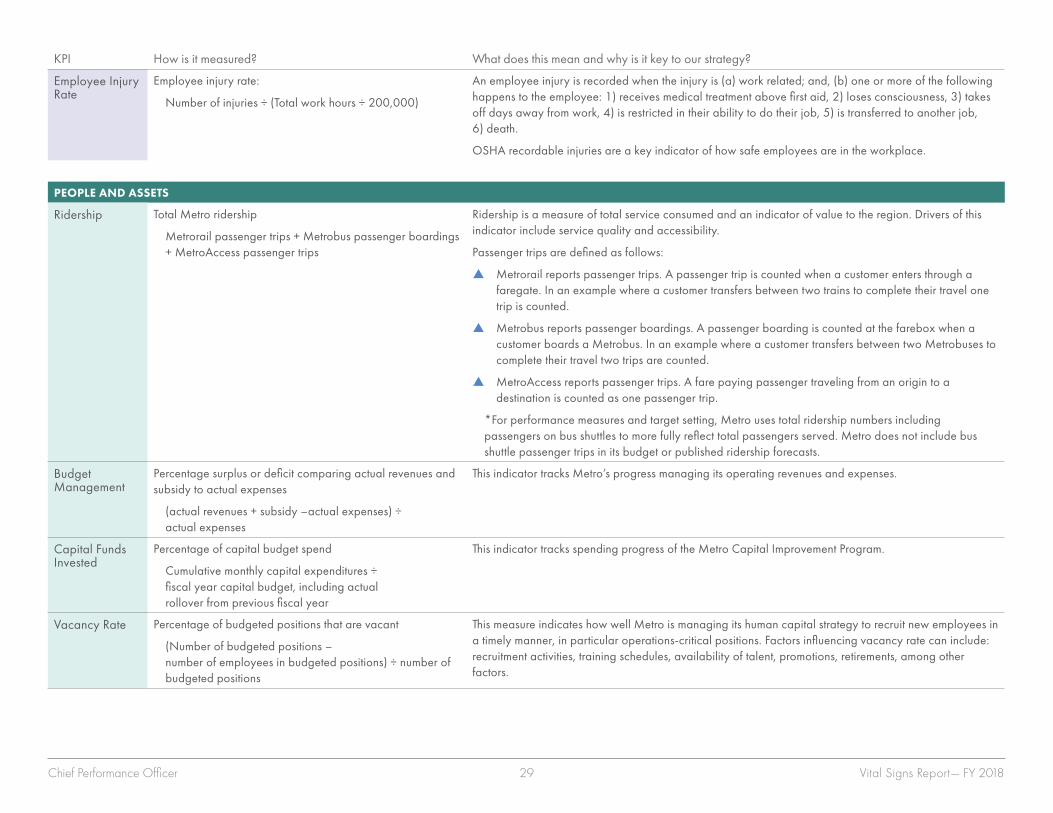
KPI How is it measured? What does this mean and why is it key to our strategy?
Employee Injury Rate
Employee injury rate:
Number of injuries ÷ (Total work hours ÷ 200,000)
An employee injury is recorded when the injury is (a) work related; and, (b) one or more of the following happens to the employee: 1) receives medical treatment above first aid, 2) loses consciousness, 3) takes off days away from work, 4) is restricted in their ability to do their job, 5) is transferred to another job, 6) death .
OSHA recordable injuries are a key indicator of how safe employees are in the workplace .
PEOPLE AND ASSETS
Ridership Total Metro ridership
Metrorail passenger trips + Metrobus passenger boardings + MetroAccess passenger trips
Ridership is a measure of total service consumed and an indicator of value to the region . Drivers of this indicator include service quality and accessibility .
Passenger trips are defined as follows:
S Metrorail reports passenger trips . A passenger trip is counted when a customer enters through a faregate . In an example where a customer transfers between two trains to complete their travel one trip is counted .
S Metrobus reports passenger boardings . A passenger boarding is counted at the farebox when a customer boards a Metrobus . In an example where a customer transfers between two Metrobuses to complete their travel two trips are counted .
S MetroAccess reports passenger trips . A fare paying passenger traveling from an origin to a destination is counted as one passenger trip .
*For performance measures and target setting, Metro uses total ridership numbers including passengers on bus shuttles to more fully reflect total passengers served . Metro does not include bus shuttle passenger trips in its budget or published ridership forecasts .
Budget Management
Percentage surplus or deficit comparing actual revenues and subsidy to actual expenses
(actual revenues + subsidy –actual expenses) ÷ actual expenses
This indicator tracks Metro’s progress managing its operating revenues and expenses .
Capital Funds Invested
Percentage of capital budget spend
Cumulative monthly capital expenditures ÷ fiscal year capital budget, including actual rollover from previous fiscal year
This indicator tracks spending progress of the Metro Capital Improvement Program .
Vacancy Rate Percentage of budgeted positions that are vacant
(Number of budgeted positions – number of employees in budgeted positions) ÷ number of budgeted positions
This measure indicates how well Metro is managing its human capital strategy to recruit new employees in a timely manner, in particular operations‑critical positions . Factors influencing vacancy rate can include: recruitment activities, training schedules, availability of talent, promotions, retirements, among other factors .
Chief Performance Officer 29 Vital Signs Report— FY 2018
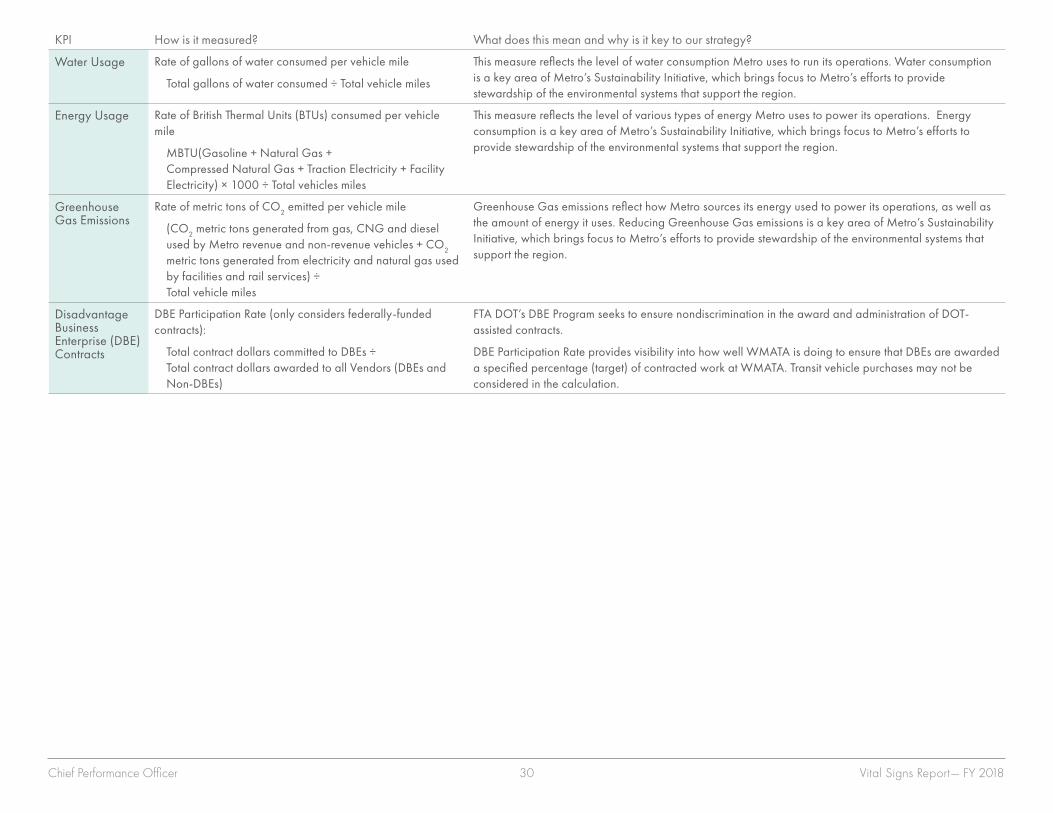
KPI How is it measured? What does this mean and why is it key to our strategy?
Water Usage Rate of gallons of water consumed per vehicle mile
Total gallons of water consumed ÷ Total vehicle miles
This measure reflects the level of water consumption Metro uses to run its operations . Water consumption is a key area of Metro’s Sustainability Initiative, which brings focus to Metro’s efforts to provide stewardship of the environmental systems that support the region .
Energy Usage Rate of British Thermal Units (BTUs) consumed per vehicle mile
MBTU(Gasoline + Natural Gas + Compressed Natural Gas + Traction Electricity + Facility Electricity) × 1000 ÷ Total vehicles miles
This measure reflects the level of various types of energy Metro uses to power its operations . Energy consumption is a key area of Metro’s Sustainability Initiative, which brings focus to Metro’s efforts to provide stewardship of the environmental systems that support the region .
Greenhouse Gas Emissions
Rate of metric tons of CO2 emitted per vehicle mile
(CO2 metric tons generated from gas, CNG and diesel used by Metro revenue and non‑revenue vehicles + CO2 metric tons generated from electricity and natural gas used by facilities and rail services) ÷ Total vehicle miles
Greenhouse Gas emissions reflect how Metro sources its energy used to power its operations, as well as the amount of energy it uses . Reducing Greenhouse Gas emissions is a key area of Metro’s Sustainability Initiative, which brings focus to Metro’s efforts to provide stewardship of the environmental systems that support the region .
Disadvantage Business Enterprise (DBE) Contracts
DBE Participation Rate (only considers federally‑funded contracts):
Total contract dollars committed to DBEs ÷ Total contract dollars awarded to all Vendors (DBEs and Non‑DBEs)
FTA DOT’s DBE Program seeks to ensure nondiscrimination in the award and administration of DOT‑assisted contracts .
DBE Participation Rate provides visibility into how well WMATA is doing to ensure that DBEs are awarded a specified percentage (target) of contracted work at WMATA . Transit vehicle purchases may not be considered in the calculation .
Chief Performance Officer 30 Vital Signs Report— FY 2018