Key Issues
28
Financial Strategy 6.1 Key Issues 3 ways to increase the value of money Asset turnover model Financial objectives and the strategic profit model ROI model Gross margin return on investment Monitoring retail performance Direct product profitability
-
Upload
ifeoma-waters -
Category
Documents
-
view
25 -
download
0
description
Key Issues. 3 ways to increase the value of money Asset turnover model Financial objectives and the strategic profit model ROI model Gross margin return on investment Monitoring retail performance Direct product profitability. How much will your own portfolio be worth if … - PowerPoint PPT Presentation
Transcript of Key Issues

Financial Strategy 6.1
Key Issues
3 ways to increase the value of money Asset turnover model Financial objectives and the strategic profit
model ROI model Gross margin return on investment Monitoring retail performance Direct product profitability

Financial Strategy 6.2
Value of An Investment
How much will your ownHow much will your ownportfolio be worth if …portfolio be worth if …
You start investing 10 years after graduation, & invest $2000 per year @ 10%, every year ‘til you retire?
You start now, & invest $2000 per year @ 10%, but only for 10 years, then stop?

Financial Strategy 6.3
A Simplified Cash Flow Diagram
Cash Inventory
AccountsReceivable
Sales

Financial Strategy 6.4
Increasing the Value of Money
MarginMargin
Leveraging Our InvestmentLeveraging Our Investment
Adding Stock Turnover (“turns”)Adding Stock Turnover (“turns”)
You have $1000. You’ve found a no-risk investment for which you will You have $1000. You’ve found a no-risk investment for which you will get a certain 20 percent ROI in 4 months. Your parents have offered to get a certain 20 percent ROI in 4 months. Your parents have offered to lend you $10,000 more, for 1 year. By how much can you grow your lend you $10,000 more, for 1 year. By how much can you grow your $1000 in a one-year period? And what’s your ROI?$1000 in a one-year period? And what’s your ROI?

Financial Strategy 6.5
Increasing the Value of Money
Margin Margin (no leverage or turnover)(no leverage or turnover)
Leverage Leverage (no turnover)(no turnover)
Turnover Turnover (no leverage)(no leverage)
Margin, Leverage, TurnoverMargin, Leverage, Turnover
Strategic Profit ModelROI = Margin x Leverage x Turnover = 20% x 11.0 x 3.64 = 800%
Strategic Element ResultROI (/ Investment)
Investment = $1000( = profit)

Financial Strategy 6.6
Components of Gross Margin
Gross Sales
Less ReturnsLess customer allowances Net
Sales
COGS
Gross Margin

Financial Strategy 6.7
Increase VolumeIncrease VolumeIncrease PriceIncrease PriceDecrease COGSDecrease COGSDecrease ExpensesDecrease Expenses
Retail Profit Accelerators:How Can Retailers Increase Profits?
Sales $1,000,000 $1,050,000 $1,050,000COGS 700,000 735,000 700,000Gross margin 300,000 315,000 350,000Expenses 280,000 280,000 280,000Profit 20,000 35,000 70,000Profit increase $ --- 15,000 50,000Profit increase % --- 75% 250%
Sales $1,000,000 $1,000,000COGS 665,000 700,000Gross margin 335,000 300,000Expenses 280,000 266,000Profit 55,000 34,000Profit increase $ 35,000 14,000Profit increase % 175% 70%
BaseBasePeriodPeriod
IncreaseIncreaseUnit Volume 5%Unit Volume 5%
IncreaseIncreasePrices 5%Prices 5%
DecreaseDecreaseCOGS 5%COGS 5%
DecreaseDecreaseExpenses 5%Expenses 5%

Financial Strategy 6.8
Developing Financial Objectives
• The Objectives ThemselvesThe Objectives Themselves
• The Plan to Meet the ObjectivesThe Plan to Meet the Objectives
Profits?Profits?How should they be measured?How should they be measured?

Financial Strategy 6.9
Who is Most Successful?
StoreStore
JCPenneyDayton’s
Toys R UsHome Depot
Circuit CityThe Limited
Wal-MartKmartCostco
JCPenneyDayton’s
Toys R UsHome Depot
Circuit CityThe Limited
Wal-MartKmartCostco
Total SalesTotal SalesGrowth %Growth %
-19
1135
1817358
26
-19
1135
1817358
26
Comp StoreComp StoreGrowth %Growth %
-222
11
13
104
14
-222
11
13
104
14
GrossGrossMargin %Margin %
33263028
262921259
33263028
262921259
InventoryInventoryTurnoverTurnover
3.44.63.15.6
4.76.04.53.0
11.8
3.44.63.15.6
4.76.04.53.0
11.8
Sales perSales perSq Ft $Sq Ft $
137198na348
1,083302279na670
137198na348
1,083302279na670
1994 Data

Financial Strategy 6.10
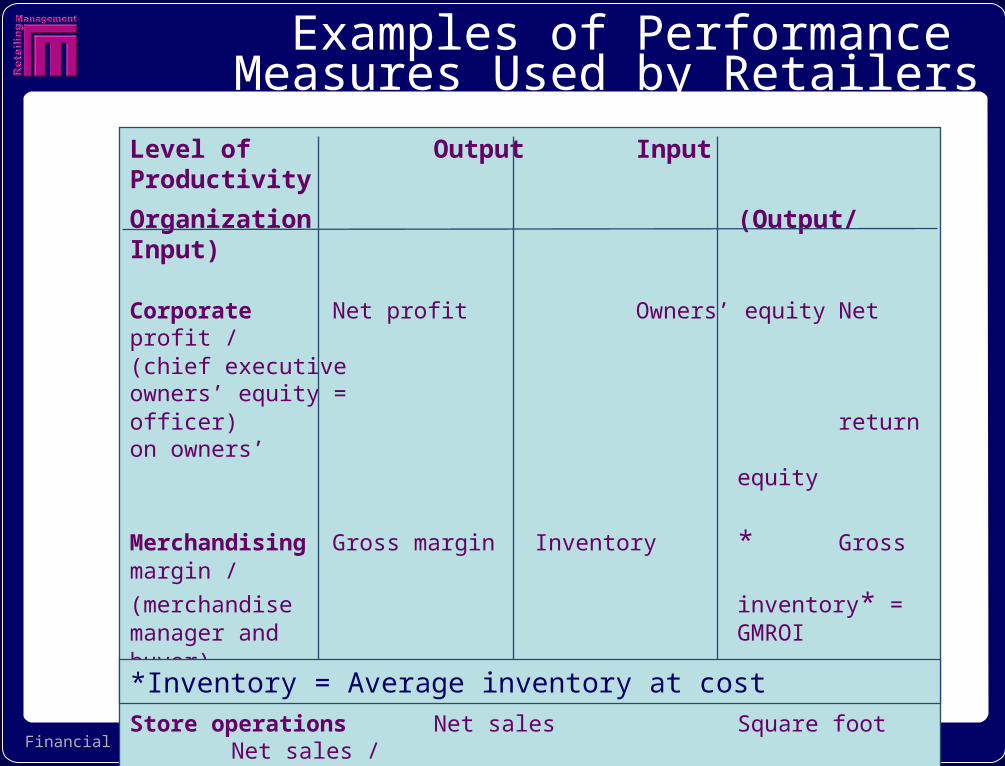
Examples of Performance Measures Used by Retailers
Level of Output Input Productivity
Organization (Output/Input)
Corporate Net sales Square feet of Return on assets(measures of store spaceentire corporation)
Net profits Number of Asset turnoveremployees
Growth in sales, Inventory Sales per employeeprofits
Advertising Sales per squareexpenditures foot
Financial Strategy 6.11
Examples of Performance Measures Used by Retailers
Level of Output Input Productivity
Organization (Output/Input)
Corporate Net profit Owners’ equity Net profit /(chief executive owners’ equity =officer) return on owners’
equity
Merchandising Gross margin Inventory * Gross margin /
(merchandise inventory* = manager and GMROIbuyer)
Store operations Net sales Square foot Net sales /(director of stores, square footstore manager)
*Inventory = Average inventory at cost

Financial Strategy 6.12
* Effective tax rates often differ among corporations due to different tax breaks and advantages.
Source: Levy & Weitz
Income Statements: Wal-Mart vs Tiffany(2000, in millions)
Which has the higher net margin?
Wal-Mart Tiffany
Net sales $ 139,208 $ 1,173
Less: Cost of goods sold $ 108,725 $ 515
Gross margin $ 30,483 $ 658
Less: Operating expense $ 22,363 $ 493
Less: Interest expense $ 950 $ 9
Total expense $ 23,313 $ 502
Net profit, pretax $ 7,170 $ 156
Less: Taxes* $ 2,740 $ 66
Tax rate 38.21% 42.31%
Net profit after tax $ 4,430 $ 90

Financial Strategy 6.13
Net Sales$139,208
$1,173
Net Sales$139,208
$1,173
Cost ofgoods sold$108,725
$515
Cost ofgoods sold$108,725
$515
Operatingexpenses$22,363
$493
Operatingexpenses$22,363
$493
Interestexpenses
$950$9
Interestexpenses
$950$9
Grossmargin
$30,493$658
Grossmargin
$30,493$658
Totalexpenses$23,313
$502
Totalexpenses$23,313
$502
Net profitbefore tax
$7,170$156
Net profitbefore tax
$7,170$156
Taxes$2,740
$66
Taxes$2,740
$66
Net profitafter taxes
$4,430$90
Net profitafter taxes
$4,430$90
Net sales$139,208
$1,173
Net sales$139,208
$1,173
Net profitmargin
3.18% 7.68%
Net profitmargin
3.18% 7.68%
--
-
+
Top Number = Wal-MartBottom Number = Tiffany
Profit Margin Model: Wal-Mart vs Tiffany(2000, in millions)

Financial Strategy 6.14
Return on Assets Model
Net Profit X Asset = Return onNet Profit X Asset = Return on Margin Turnover Margin Turnover AssetsAssets
Provo Bakery 10% X 9 times = Provo Bakery 10% X 9 times = 90%90%
Zales JewelryZales Jewelry 90% X 1 time = 90% X 1 time = 90%90%

Financial Strategy 6.15
Low Low MarginMargin
High High MarginMargin
Low TurnoverLow Turnover
High TurnoverHigh Turnover
FailureFailure
ROA: Turnover vs Margin
UnattainableUnattainable

Financial Strategy 6.16
Accountsreceivable
$1,118$108
Accountsreceivable
$1,118$108
Merchandiseinventory$17,076
$481
Merchandiseinventory$17,076
$481
Cash $1,878$189
Cash $1,878$189
Other currentassets$1,059
$37
Other currentassets$1,059
$37
Total currentassets
$21,123$816
Total currentassets
$21,123$816
Fixed assets$28,864
$241
Fixed assets$28,864
$241
Net sales$139,208
$1,173
Net sales$139,208
$1,173
Total assets$49,996$1,057
Total assets$49,996$1,057
Assetturnover
2.781.11
Assetturnover
2.781.11
+
+
+
+
Asset Turnover Model: Wal-Mart vs Tiffany(2000, in millions)
Top Number = Wal-MartBottom Number = Tiffany
From income statement
From balance sheet
The sales $ generatedby each $ of assets
What does thisrepresent?

Financial Strategy 6.17
Financial Objectives:The Strategic Profit Model
Return onInvestment
LeverageRatio
Return onAssets= x
Net Profit Net Worth
Net Profit Total Assets
Total AssetsNet Worth
Return onAssets
=
Net Profit Total Assets
and so ...
Net ProfitMargin
AssetTurnover
x
Net Sales Total Assets
Net ProfitNet Sales
The $ salesgenerated
by each $ of assets
The net profitgenerated
by each $ of sales

Financial Strategy 6.18
The Strategic Profit Model:The Financial Objective & Financial Program
Return onInvestment
= x
Net Profit Net Worth
AssetTurnover
Net Sales Total Assets
LeverageRatio
Total AssetsNet Worth
Net ProfitMargin
Net ProfitNet Sales
x
The FinancialObjective
The Financial Program(The SPM)
Rate of Return on Assets
Implications for Profitability?Implications for Profitability?

Financial Strategy 6.19
The Cougar Boutique
AssetsCurrent Cash & other $ 50,000 Inventory 500,000 Accounts receivable200,000 Total 750,000Fixed 250,000
Total Assets $1,000,000
LiabilitiesCurrent Accounts payable $ 300,000 Notes payable 25,000 Other 25,000 Total 350,000Long term 125,000 Total liabilities 475,000 Net worth 525,000Total liab. & NW $1,000,000
Dollars PercentNet sales $2,500,000 100Less: cost of sales 2,000,000 80Gross margin 500,000 20Less: expenses Variable $250,000 Fixed 200,000 Total 450,000 18Net profit $50,000 2
Income Statement
What is the ROI?
Balance SheetBalance Sheet

Financial Strategy 6.20
The Cougar Boutique: ROI
Simple Way:Simple Way:
Diagnostic Way, Using the SPM:Diagnostic Way, Using the SPM:

Financial Strategy 6.21
ROI Model, IncludingThe Strategic Profit Model
Net SalesNet Sales
Cost ofgoods sold
Cost ofgoods sold
Variableexpenses
Variableexpenses
Fixedexpenses
Fixedexpenses
Grossmargin
Grossmargin
Totalexpenses
Totalexpenses
Net profitNet profit
Net SalesNet Sales
Net profitmargin
Net profitmargin
Assetturnover
Assetturnover
Return onassets
Return onassets
-
-
+
InventoryInventory
Accountsreceivable
Accountsreceivable
Other currentassets
Other currentassets
Total currentassets
Total currentassets
Fixedassets
Fixedassets
Net salesNet sales
Totalassets
Totalassets
+
+ +
x
FinancialLeverage
FinancialLeverage
x Return onNet Worth
Return onNet Worth
=
Net SalesNet Sales
Cost ofgoods sold
Cost ofgoods sold
Variableexpenses
Variableexpenses
Fixedexpenses
Fixedexpenses
Grossmargin
Grossmargin
Totalexpenses
Totalexpenses
Net profitNet profit
Net SalesNet Sales
Net profitmargin
Net profitmargin
Assetturnover
Assetturnover
Return onassets
Return onassets
InventoryInventory
Accountsreceivable
Accountsreceivable
Other currentassets
Other currentassets
Total currentassets
Total currentassets
Fixedassets
Fixedassets
Net salesNet sales
Totalassets
Totalassets
Income StatementBalance SheetStrategic Profit Model
FinancialLeverage
FinancialLeverage
Return onNet Worth
Return onNet Worth
Which is … the income statement? Balance sheet? SPM?Which is … the income statement? Balance sheet? SPM?

Financial Strategy 6.22
Effect of Changes in the SPM on ROI
Basic Example:
9.5% = 2% x 2.5 x 1.9
Profit Margin Increased:
23.75% = 5% x 2.5 x 1.9
Leverage Increased:
15% = 2% x 2.5 x 3
ROA Reduced:
3.8% = 2% x 1 x 1.9
Return onInvestment
= xAsset
TurnoverLeverage
RatioNet Profit
Margin x

Financial Strategy 6.23
Big Lots:24.6% 13.1 1.5 1.2
Albertson’s:18.9% 2.1 4.2 2.1
The Dress Barn:32.4% 7.4 2.9 1.5
Land’s End:40.2% 6.8 3.1 1.9
The Limited:32.3% 6.7 2.2 2.2
The Gap:25.5% 6.6 2.4 1.6
SPM Examples
Return onInvestment
= xAsset
TurnoverLeverage
RatioNet ProfitMargin % x
1998 data
Financial Strategy 6.24
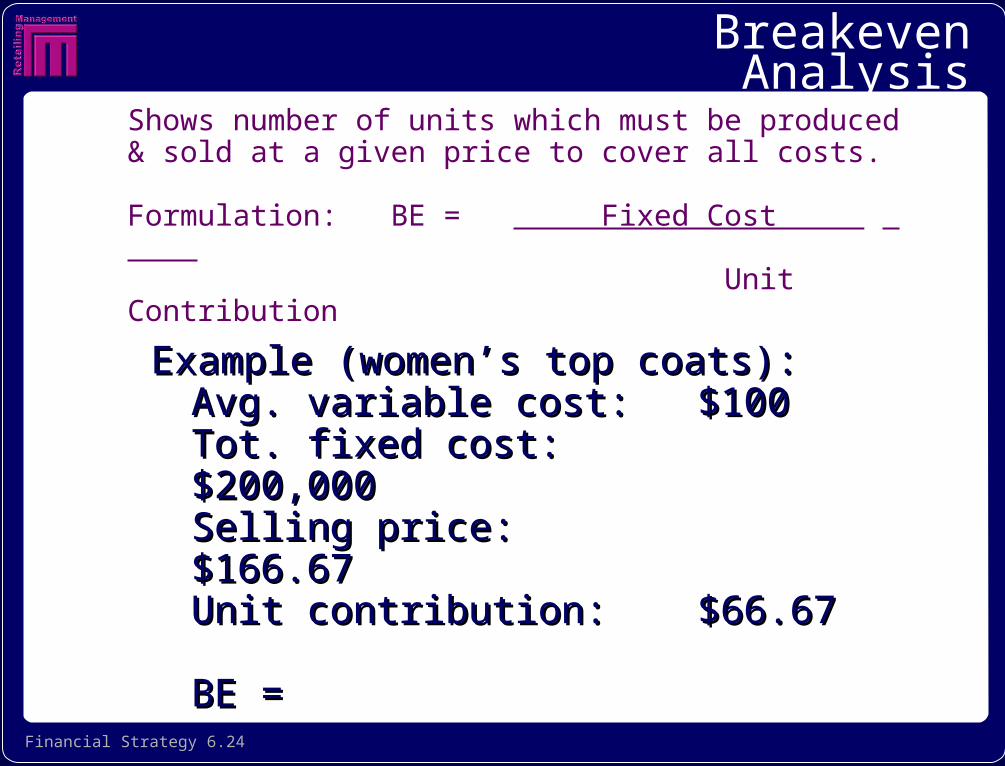
Breakeven AnalysisShows number of units which must be produced & sold at a given price to cover all costs.
Formulation: BE = Fixed Cost . Unit Contribution
Example (women’s top coats):Example (women’s top coats):Avg. variable cost: Avg. variable cost: $100$100Tot. fixed cost: Tot. fixed cost: $200,000$200,000Selling price:Selling price: $166.67$166.67Unit contribution:Unit contribution: $66.67$66.67
BE =BE =

Financial Strategy 6.25
Store Level
DepartmentLevel
CustomerFeedback
Market ShareAnalysis
OperatingRatios
Sales Variance(Actual vs Planned)
Sales-to-ExpenseRatios
Analysis of Alloca-tion of Costs
Direct ProductProfitability
Controlling (Monitoring) Performance

Financial Strategy 6.26
E.g., Computing DPP
Dollars per CaseRetail $ l8.70Less: Cost 14.96Gross margin 3.74Plus: Discounts and allowances Payment discount 0.30 Merchandising allowance 0.50 Backhaul allowance 0.00Less: Direct handling costs Warehouse direct labor 0.41 Warehouse inventory expense 0.18 Warehouse operating expense 0.12 Transportation to stores 0.14 Retail direct labor 1.78 Retail inventory expense 0.15 Retail operating expense 0.81Direct product profit $ 0.95

Financial Strategy 6.27
Using DPP to CalculateReturn on Shelf Space
Item A
Item B
Gross margin per case $9.33
$8.02
Less direct costs per case 4.22
3.80
Plus discounts and allowances per case 0.21 2.02
DPP per case 5.32
6.24
Multiplied by cases per week 4.20
3.10
DPP per week 22.34
19.34
Divided by square feet of shelf facing 1.68 0.84
DPP per week per square foot of shelf space 13.30 23.03

Financial Strategy 6.28
Direct Product Profitability
High DPPHigh DPPper unitper unit
Low DPPLow DPP
High UnitHigh UnitVolumeVolume
Low UnitLow UnitVolumeVolume
The per-unit profit of products:unit price less all direct unit costs