Key Issue in the P-C Insurance Industry: Overview & Outlook Focus on PA, VA and WV Markets PAMIC...
121
Key Issue in the P-C Insurance Industry: Overview & Outlook Focus on PA, VA and WV Markets PAMIC VAMIC WVAMIC Convention The Greenbrier White Sulphur Springs, WV August 10, 2010 Robert P. Hartwig, Ph.D., CPCU, President & Economist Insurance Information Institute 110 William Street New York, NY 10038 Tel: 212.346.5520 Cell: 917.453.1885 [email protected]
-
Upload
darcy-fisher -
Category
Documents
-
view
216 -
download
0
Transcript of Key Issue in the P-C Insurance Industry: Overview & Outlook Focus on PA, VA and WV Markets PAMIC...

Key Issue in the P-C Insurance Industry: Overview & OutlookFocus on PA, VA and WV Markets
PAMIC VAMIC WVAMIC ConventionThe Greenbrier
White Sulphur Springs, WV
August 10, 2010Robert P. Hartwig, Ph.D., CPCU, President & Economist
Insurance Information Institute 110 William Street New York, NY 10038Tel: 212.346.5520 Cell: 917.453.1885 [email protected] www.iii.org
2
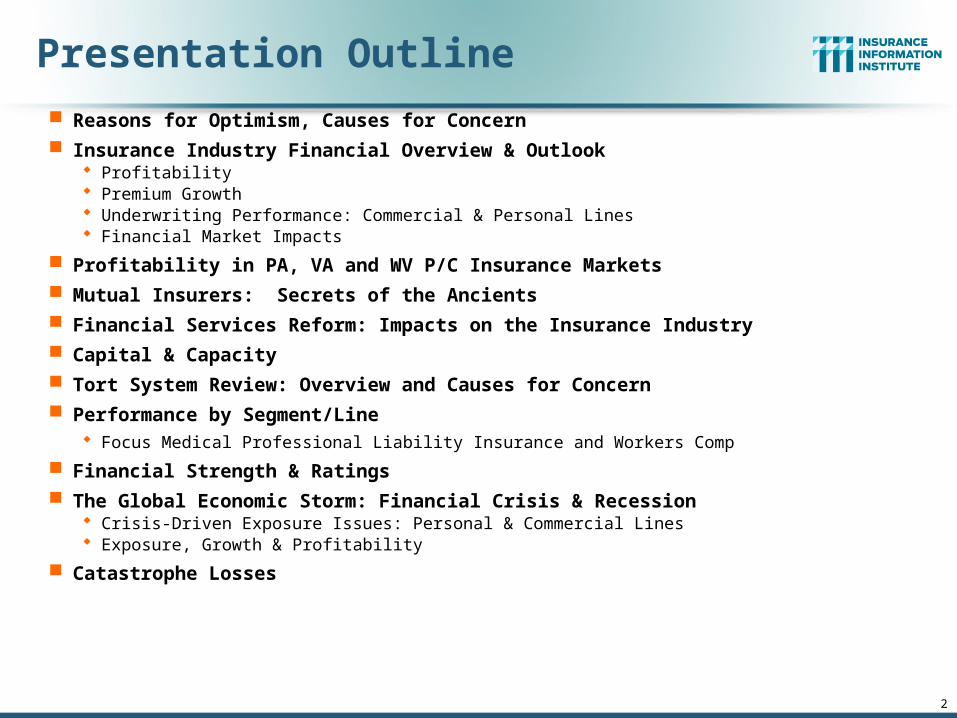
Presentation Outline
Reasons for Optimism, Causes for Concern
Insurance Industry Financial Overview & Outlook Profitability Premium Growth Underwriting Performance: Commercial & Personal Lines Financial Market Impacts
Profitability in PA, VA and WV P/C Insurance Markets
Mutual Insurers: Secrets of the Ancients
Financial Services Reform: Impacts on the Insurance Industry
Capital & Capacity
Tort System Review: Overview and Causes for Concern
Performance by Segment/Line Focus Medical Professional Liability Insurance and Workers Comp
Financial Strength & Ratings
The Global Economic Storm: Financial Crisis & Recession Crisis-Driven Exposure Issues: Personal & Commercial Lines Exposure, Growth & Profitability
Catastrophe Losses

3
Reasons for Optimism, Causes for Concern in the P/C Insurance Industry
Economic Recovery in US is Self-Sustaining: No Double Dip Recession
European Debt Crisis Will Pass; Concerns are Overblown Volatility will remain a reality, however
Era of Mass P/C Insurance Exposure Destruction Has Ended But restoration of destroyed exposure will take 3+ years in US
No Secondary Spike in Unemployment or Swoon in Payrolls/WC Exposure But job and wage growth remains sluggish
Exposure Growth Will Begin in Earnest in 2nd Half 2010, Accelerate in 2011
Increase in Demand for Commercial Insurance is in its Earliest Stages and Will Accelerate in 2011 Includes workers comp, commercial auto, marine, many liability coverages, D&O
Laggards: Property, inland marine, aviation
Personal Lines: Auto leads, homeowners lags
P/C Insurance Industry Will See Growth in 2011 for the First Time Since 2006
Investment Environment Is/Remains Much More Favorable Volatility, however, will persist and yields remain low
Both are critical issues in long-tailed commercial lines like WC, Med Mal, D&O
Source: Insurance Information Institute.

4
P/C Insurance Industry Capacity as of 3/31/10 Is at Record Levels and Has Recovered 100%+ of the Capital Lost During the Financial Crisis As of 12/31/09 capacity was within 2% of pre-crisis high
Record Capacity, Depressed Exposures Mean that Generally Soft Market Conditions Will Persist through 2010 and Potentially into 2011
There is No Catalyst for a Robust Hard Market at the Current Time
High Global First Half 2010 CAT Losses Insufficient to Trigger Hard Market Localized insurance and reinsurance impacts are occurring, especially earthquake coverage in
Latin/South America, Offshore Energy Markets, European Wind Cover
Inflation Outlook for US and Major European Economies and Japan is Tame Will temper claims inflation
Financial Strength & Ratings of Global (Re)Insurance Industries Remained Strong Throughout the Financial Crisis in Sharp Contrast With Banks
Insurers Avoided the Most Draconian Outcomes in Financial Services Reform Legislation
Tort Environment in US is Beginning to Deteriorate; No Tort Reform in US
Major Transformation of US Economy Underway with Major Opportunities for Insurers through 2020 in Health, Tech, Natural Resources, Energy
Source: Insurance Information Institute.
Reasons for Optimism, Causes for Concern in the P/C Insurance Industry

5
Profitability
Historically Volatile

P/C Net Income After Taxes1991–2010:Q1 ($ Millions)
$1
4,1
78
$5
,84
0
$1
9,3
16
$1
0,8
70
$2
0,5
98
$2
4,4
04 $3
6,8
19
$3
0,7
73
$2
1,8
65
$3
,04
6
$3
0,0
29
$6
2,4
96
$3
,04
3
$8
,85
6
$2
8,3
11
-$6,970
$6
5,7
77
$4
4,1
55
$2
0,5
59
$3
8,5
01
-$10,000
$0
$10,000
$20,000
$30,000
$40,000
$50,000
$60,000
$70,000
$80,000
91 92 93 94 95 96 97 98 99 00 01 02 03 04 05 06 07 08 09 10:Q1
2005 ROE*= 9.6% 2006 ROE = 12.7% 2007 ROE = 10.9% 2008 ROE = 0.3% 2009 ROAS1 = 5.8% 2010:Q1 ROAS = 6.7%
* ROE figures are GAAP; 1Return on avg. surplus. Excluding Mortgage & Financial Guaranty insurers yields an 8.3% ROAS for 2010:Q1, 7.3% for 2009 and 4.4% for 2008. 2009 net income was $34.5 billion and $20.8 billion in 2008 excluding M&FG.Sources: A.M. Best, ISO, Insurance Information Institute
P-C Industry 2010:Q1 profits rose vs. -$1.3B in 2009:Q1, due mainly to $1B in realized capital
gains vs. -$8B in previous realized capital losses

7
ROE: P/C vs. All Industries1987–2009*
* Excludes Mortgage & Financial Guarantee in 2008 and 2009.Sources: ISO, Fortune; Insurance Information Institute.
-5%
0%
5%
10%
15%
20%
87 88 89 90 91 92 93 94 95 96 97 98 99 00 01 02 03 04 05 06 07 08 09
US P/C Insurers All US Industries
P/C Profitability IsCyclical and Volatile
Hugo
Andrew
Northridge
Lowest CAT Losses in 15 Years
Sept. 11
Katrina, Rita, Wilma
4 Hurricanes
Financial Crisis*
(Percent)

8
ROE vs. Equity Cost of Capital:U.S. P/C Insurance:1991-2010*
* Return on average surplus in 2008/09 excluding mortgage and financial guaranty insurers.Source: The Geneva Association, Insurance Information Institute
-2%
0%
2%
4%
6%
8%
10%
12%
14%
16%
18%
91 92 93 94 95 96 97 98 99 00 01 02 03 04 05 06 07 08* 09* 10*
ROE Cost of Capital
-13
.2 p
ts +1
.7 p
ts
+2
.3 p
ts
-9.0
pts
-6.4
pts
-3.2
pts
The P/C Insurance Industry WellShort of Its Cost of Capital in 2008 but
Narrowed the Gap in 2009 and Early 2010
US P/C Insurers Missed Their Cost of Capital by an Average 6.7 Points from
1991 to 2002, but on Target or Better 2003-07, Fell Short in 2008/09
The Cost of Capital is the Rate of Return Insurers Need to
Attract and Retain Capital to the Business
(Percent)
-2.1
pts

A 100 Combined Ratio Isn’t What ItOnce Was: 90-95 Is Where It’s At Now
Combined Ratio / ROE
* 2009 and 2010:Q1 figures are return on average statutory surplus. 2008, 2009 and 2010:Q1figures exclude mortgage and financial guarantee insurersSource: Insurance Information Institute from A.M. Best and ISO data.
97.5
100.6 100.1 100.7
92.6
99.5 99.0101.0
8.3%7.3%
9.6%
15.9%
14.3%
12.7%
4.4%
8.9%
80
85
90
95
100
105
110
1978 1979 2003 2005 2006 2008* 2009* 2010:Q1*0%
3%
6%
9%
12%
15%
18%
Combined Ratio ROE*
Combined Ratios Must Be Lower in Today’s DepressedInvestment Environment to Generate Risk Appropriate ROEs
A combined ratio of about 100 generated a 7% ROE in 2009,10% in 2005 and 16% in 1979

11
Profitability in PA, VA, WV P/C Insurance Markets
Analysis by Line and Nearby State Comparisons

12
RNW All Lines: PA, VA, WV vs. U.S., 1999-2008
Sources: NAIC.
-5%
0%
5%
10%
15%
20%
25%
99 00 01 02 03 04 05 06 07 08
US All Lines PA All Lines VA All Lines WV All Lines
P/C insurer profitability in PA and WV is below that of the
US overall while VA is above
US: 7.0%
PA: 6.3%
VA: 10.6%
WV: 6.7%
(Percent)

13
RNW PP Auto: PA, VA, WV vs. U.S., 1999-2008
Sources: NAIC.
-5%
0%
5%
10%
15%
20%
99 00 01 02 03 04 05 06 07 08
US PP Auto PA PP Auto VA PP Auto WV PP Auto
Pvt. Passenger Auto profitability in PA has been somewhat below the US in recent years, VA is above
Average 1999-2008
US: 7.5%
PA: 6.5%
VA: 10.3%
WV: 5.7%

Avg. Expenditure on Private Passenger Auto Insurance, Mid-Atlantic States, 2007*
$1,140
$922
$820 $819$795
$661
$591
$500
$600
$700
$800
$900
$1,000
$1,100
$1,200
DC MD PA WV US VA NC
*Latest available.Source: NAIC; Insurance Information Institute.
Average auto insurance expenditures in PA and WV ranked 17th and 18th highest;
VA ranked 35th

15
RNW Comm. Auto: PA, VA, WV vs. U.S.,1999-2008
Sources: NAIC.
-5%
0%
5%
10%
15%
20%
99 00 01 02 03 04 05 06 07 08
US Comm Auto PA Comm Auto VA Comm Auto WV Comm Auto
(Percent)Commercial Auto
profitability in PA and WV is generally below the US
average, VA is above
Average 1999-2008
US: 7.9%
PA: 7.0%
VA: 10.9%
WV: 6.4%
16
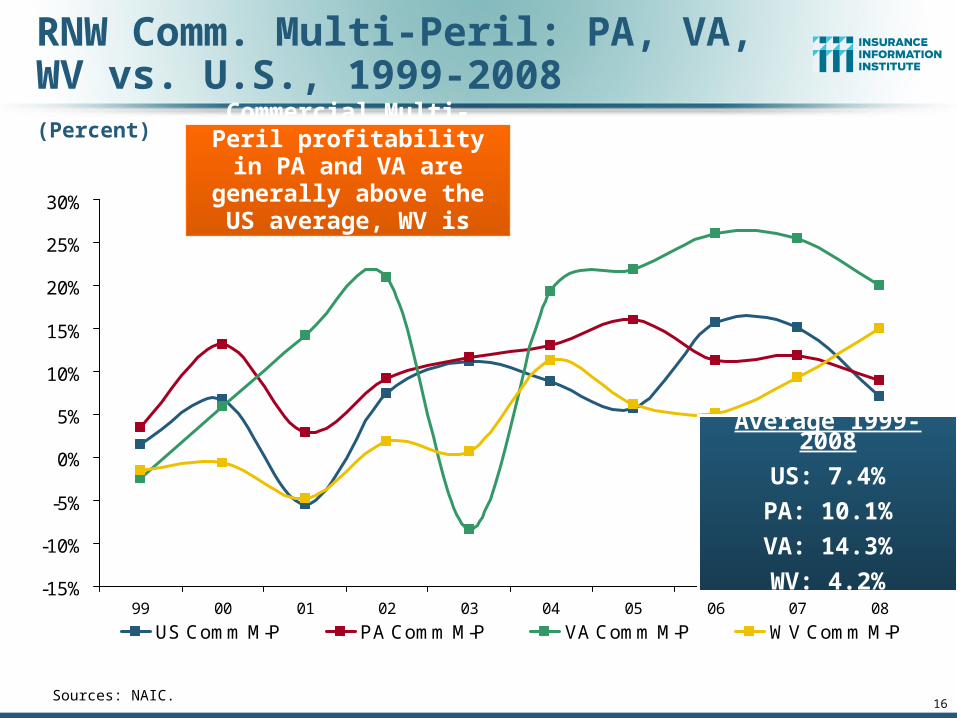
RNW Comm. Multi-Peril: PA, VA, WV vs. U.S., 1999-2008
Sources: NAIC.
-15%
-10%
-5%
0%
5%
10%
15%
20%
25%
30%
99 00 01 02 03 04 05 06 07 08
US Comm M-P PA Comm M-P VA Comm M-P WV Comm M-P
(Percent)
Average 1999-2008
US: 7.4%
PA: 10.1%
VA: 14.3%
WV: 4.2%
Commercial Multi-Peril profitability in PA and VA are generally above the
US average, WV is above

17
RNW Homeowners: PA, VA, WV vs. U.S., 1999-2008
Sources: NAIC.
-60%
-50%
-40%
-30%
-20%
-10%
0%
10%
20%
30%
40%
50%
99 00 01 02 03 04 05 06 07 08
US HO PA HO VA HO WV HO
(Percent)Homeowners profitability is
above average and less volatile in PA; Below average in WV and
below average and volatile in VA due to coastal risk
Average 1999-2008
US: 4.8%
PA: 14.0%
VA: 3.7%
WV: 5.9%

Avg. Expenditure on Homeowners Insurance, Mid-Atlantic States, 2007*
$822
$692 $692 $683$674
$646
$500
$550
$600
$650
$700
$750
$800
$850
US MD PA VA NC WV
*Latest available.Source: NAIC; Insurance Information Institute.
Average homeowners insurance expenditures in PA and VA ranked 31st in the US; WV ranked 38th

19
RNW Workers Comp: PA, VA vs. U.S., 1999-2008
Sources: NAIC.
-2%
0%
2%
4%
6%
8%
10%
12%
99 00 01 02 03 04 05 06 07 08
US WComp PA WComp VA WComp
(Percent) Workers comp profitability in PA and
VA are not too different from the US overall
Average 1999-2008
US: 6.4%
PA: 6.0%
VA: 7.3%
WV: 3.2%
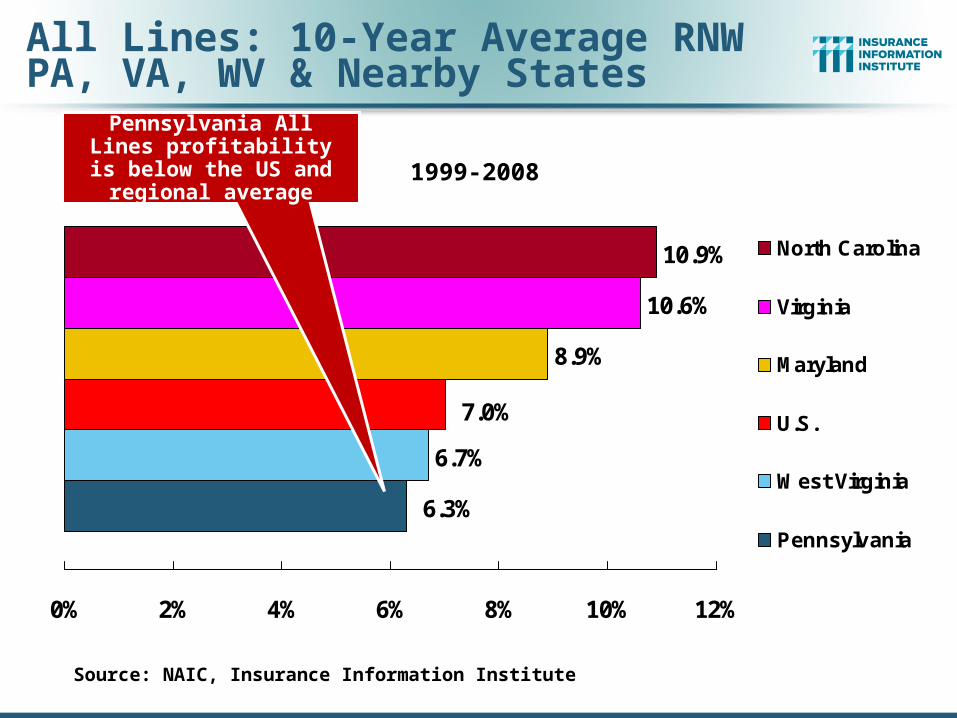
All Lines: 10-Year Average RNW PA, VA, WV & Nearby States
6.7%
8.9%
10.6%
10.9%
6.3%
7.0%
0% 2% 4% 6% 8% 10% 12%
North Carolina
Virginia
Maryland
U.S.
West Virginia
Pennsylvania
Source: NAIC, Insurance Information Institute
1999-2008
Pennsylvania All Lines profitability is below the US
and regional average

PP Auto: 10-Year Average RNW PA, VA, WV & Nearby States
5.7%
8.3%
10.3%
6.5%
6.5%
7.5%
0% 2% 4% 6% 8% 10% 12%
North Carolina
Virginia
Maryland
U.S.
West Virginia
Pennsylvania
Source: NAIC, Insurance Information Institute
1999-2008
Pennsylvania PP Auto profitability is below the US and regional
average

28
Lessons from History: What Types of Business Live a Very
Long Time and Why?
Longevity in the Business World Requires Focus, Long-Term ObjectivesYou Want the Same from Your Insurer

Number of Firms More than 500 Years Old, by Industry*
35
28
19
75 4
2 2 2 2 10
5
10
15
20
25
30
35
40
Total Number
Source: http://en.wikipedia.org/wiki/List_of_oldest_companies
The brewery industry
appears to have the greatest
longevity with 35 firms 500+
years old.
BENEATH THE SURFACE Most of these companies are:
1.Family Owned2.Highly focused on one specific business3.Have some geographic focus (product or client)

Benefits & Characteristics of Working with Firms that Stand the Test of Time
1. Business Model: Highly Focused Firms tend to remain true to core business Avoid businesses they don’t understand Some diversification is usually good, but leads to an exponential increase in
complexity and unforeseen interactions across units
2. Ownership Structure: There Exists Some Concept of Mutuality Some of the world’s oldest firms are family owned (artisans, craftsman) Many of the world’s oldest institutions are religious Others have some form of cooperative arrangement (agricultural) Such organizations also exhibit altruistic behavior, a proven survival trait In a mutual arrangement implies less cyclicality, volatility
3. Communal Interest: A Concern for the Greater Common Good Perpetuation of the species (i.e., the industry) is evident in behaviors Concept of mutuality extends beyond organization to communal interest A strong willingness to work for the common good
Benefits & Characteristics of Working with Firms that Stand the Test of Time (cont’d)
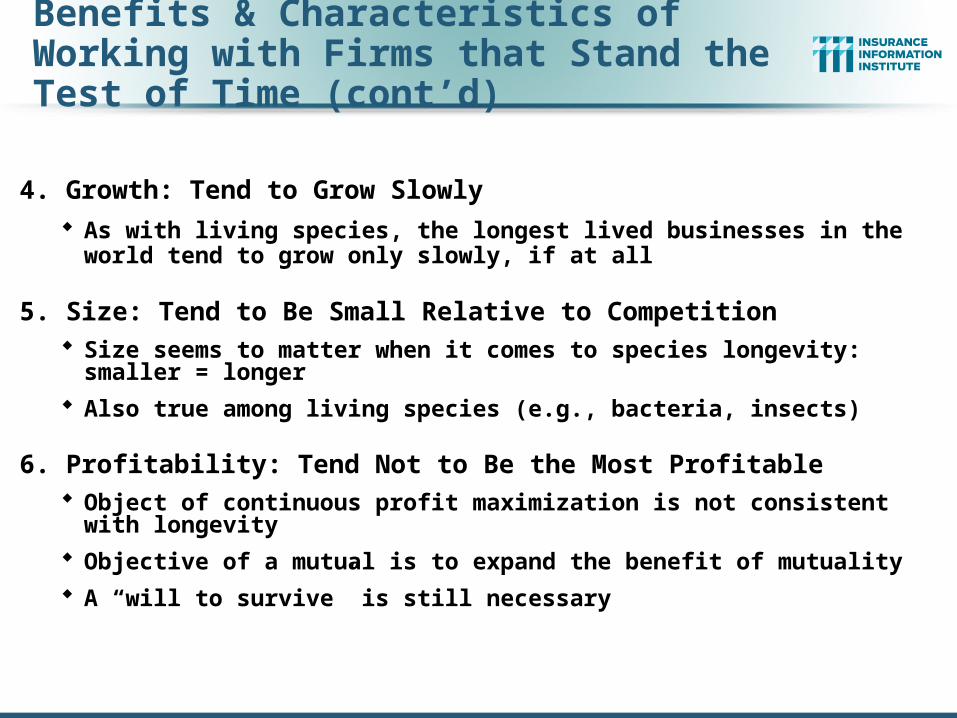
4. Growth: Tend to Grow Slowly
As with living species, the longest lived businesses in the world tend to grow only slowly, if at all
5. Size: Tend to Be Small Relative to Competition Size seems to matter when it comes to species longevity: smaller = longer
Also true among living species (e.g., bacteria, insects)
6. Profitability: Tend Not to Be the Most Profitable Object of continuous profit maximization is not consistent with longevity
Objective of a mutual is to expand the benefit of mutuality
A “will to survive” is still necessary

32
100-year-old Insurers: Mutual vs. Stock vs. Reciprocal
62.4%
35.9%
1.4%0.3%
Source: National Association of Insurance Commissioners (NAIC) Annual Statement Database, via Highline Data LLC.
The vast majority (62.4%) of 100-year-old insurers are mutual insurers, while stock insurers account for 35.9% of the total.
Mutual, 62.4%,(179)
Stock, 35.9%,(103)
Reciprocal, 1.4%,(4)
Other, 0.3%,(1)

33
Attributes Found in Insurance Organizations that Reach 100+
Years
Secrets of the Ancients

Attributes Inherent in Long-Lived Insurance Companies1. Management Acts as a Steward of the Enterprise
Objective is to pass a healthy firm safely and securely to the next generation of management and policyholders
2. Management Financial Incentives In line with the goal of providing the protection purchased
There is typically no 3rd party (shareholders) to compensate (60%+ mutuals)
Objective of public company is to maximize profits
CEO (total) comp is a smaller multiple relative to average employee
3. Nimble: Environment for Small Insurers Can & Does Change Not always first to change, but adaptation occurs within reasonable
timeframe
4. Customer Focus & Relationship Driven Customer is the #1 priority
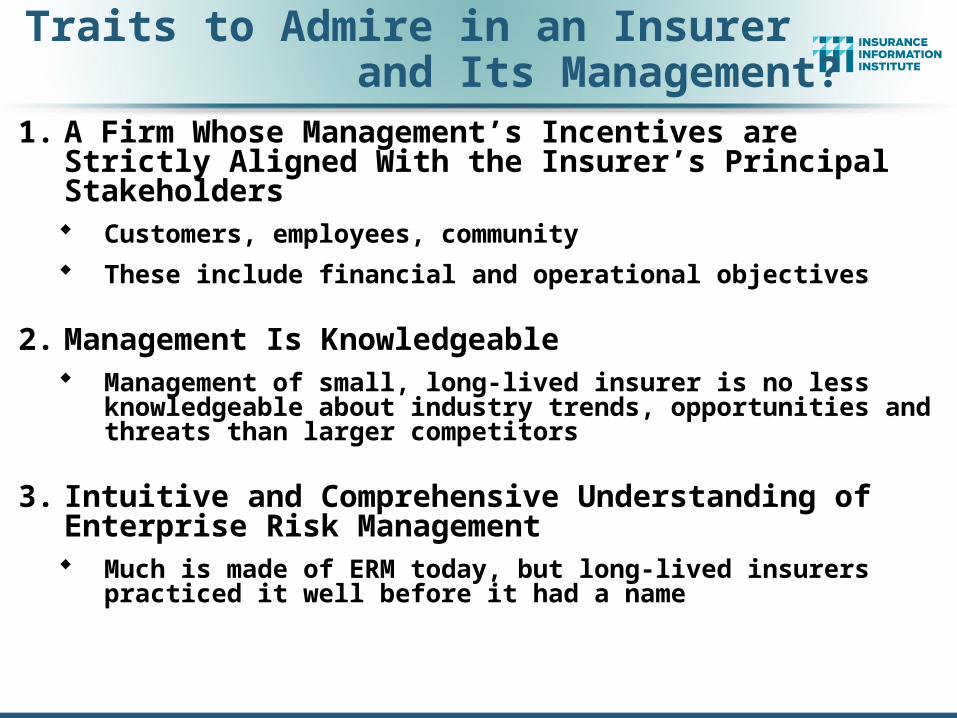
Traits to Admire in an Insurer and Its Management?1. A Firm Whose Management’s Incentives are Strictly
Aligned With the Insurer’s Principal Stakeholders Customers, employees, community
These include financial and operational objectives
2. Management Is Knowledgeable Management of small, long-lived insurer is no less
knowledgeable about industry trends, opportunities and threats than larger competitors
3. Intuitive and Comprehensive Understanding of Enterprise Risk Management Much is made of ERM today, but long-lived insurers practiced it
well before it had a name

What Do I Admire in an Insurer and Its Management?4. CEO is Willing to Seek Advice and Counsel
No imperial CEOs; Self-aggrandizement is rare
CEO is a listener and consensus builder
5. Commitment to Core Constituencies Customer is the #1 priority
6. Lack of a “Wandering Eye” Disciplined enough to stick with the business you know, but also
adapting to changing business conditions and seizing opportunities as necessary

Financial Services Reform
37
Insurers Are Impacted, But Not Significantly
38
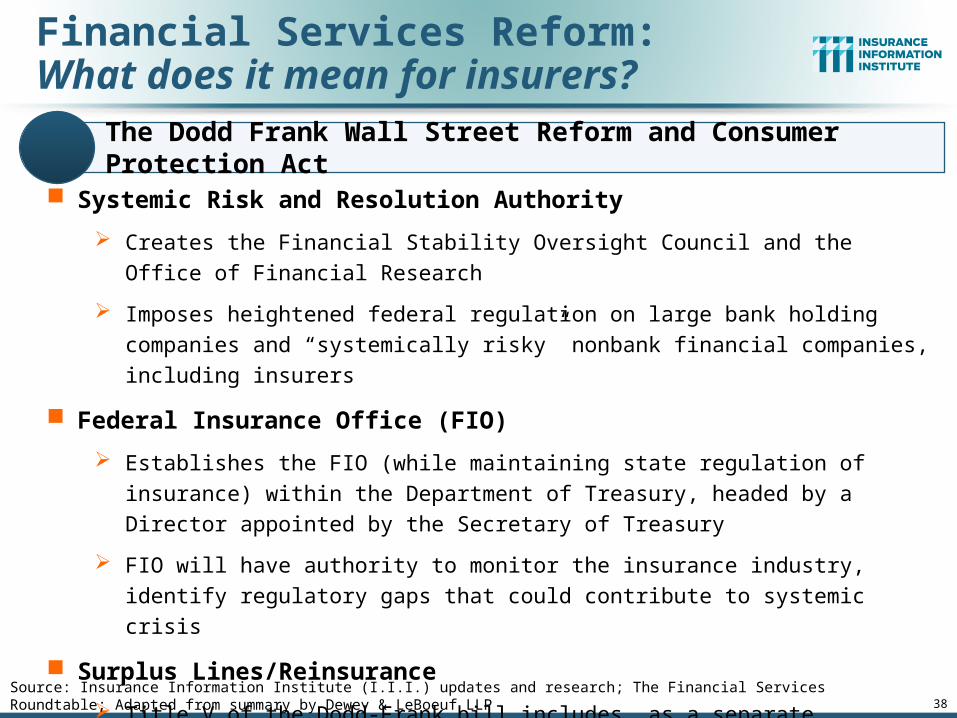
Financial Services Reform:What does it mean for insurers?
Systemic Risk and Resolution Authority
Creates the Financial Stability Oversight Council and the Office of Financial Research
Imposes heightened federal regulation on large bank holding companies and
“systemically risky” nonbank financial companies, including insurers
Federal Insurance Office (FIO)
Establishes the FIO (while maintaining state regulation of insurance) within the
Department of Treasury, headed by a Director appointed by the Secretary of Treasury
FIO will have authority to monitor the insurance industry, identify regulatory gaps that
could contribute to systemic crisis
Surplus Lines/Reinsurance
Title V of the Dodd-Frank bill includes, as a separate subtitle, the Nonadmitted and
Reinsurance Reform Act (NRRA), which eliminates regulatory inefficiencies
associated with surplus lines insurance and reinsurance
The Dodd Frank Wall Street Reform and Consumer Protection Act
Source: Insurance Information Institute (I.I.I.) updates and research; The Financial Services Roundtable; Adapted from summary by Dewey & LeBoeuf LLP

39
Systemic Risk: Oversight & Resolution Authority
Financial Stability Oversight Council created to oversee systemic risk
of large financial holding companies) [a.k.a. TOO BIG TOO FAIL]
P/C insurers potentially could be determined to present systemic risk to the
financial system and thus be supervised by the Federal Reserve.
Such supervision would subject such insurers to prudential standards, if the
Council determines that financial distress at the company would pose a threat to
the U.S. financial system.
Orderly Liquidation
The legislation provides an “Orderly Liquidation Authority” mechanism whereby
the FDIC would have enhance powers to resolve distress at financial institutions.
Insurance holding companies and any non-insurance subsidiaries of insurers
may be subject to this authority.
Issues Related to Systemic Risk & Resolution Authority
Source: Insurance Information Institute (I.I.I.) updates/research; The Financial Services Roundtable; Adapted from summary by Dewey & LeBoeuf LLP

40
Systemic Risk: Oversight & Resolution Authority
Orderly Liquidation (cont.)
Insurers are generally exempt from the liquidation authority, but the FDIC would
have “backup authority” to place an insurer into orderly liquidation under state
law if the state regulator has not done so within 60 days of a systemic risk
determination.
Liquidation Fund Assessments
The liquidation fund would be funded by assessments on large financial
companies, potentially including insurers.
But the insurance industry already has a funding system (state guaranty funds) to
pay for the unwinding of failed companies. Therefore, contributions to these state
guaranty funds must be considered.
Issues Related to Systemic Risk & Resolution Authority
Source: Insurance Information Institute (I.I.I.) updates/research; The Financial Services Roundtable; Adapted from summary by Dewey & LeBoeuf LLP

New Rulemakings Under The Dodd Frank Wall Street Reform and Consumer Protection Act
24
6156
31
54
2
17
4
95
9
0
10
20
30
40
50
60
70
80
90
100
Bureau ofConsumerFinancialProtection
CFTC FinancialStability
OversightCouncil
FDIC FederalReserve
FTC OCC Office ofFinancialResearch
SEC Treasury
A total of at least 243 new rulemakings are expected under the Dodd-Frank financial reform by Federal Agency*
* Total eliminates double counting for joint rule-makings and this estimate only includes explicit rule-makings in the bill, and thus likely represents a significant underestimate.Source: Wall Street Journal, July 14, 2010; Davis Polk & Wardwell. 46

Source: James Madison Institute, February 2008.
ME
NH
MA
CT
PA
WV
VA
NC
LA
TX
OK
NE
ND
MN
MI
IL
IA
ID
WA
OR
AZ
HI
NJRI C
DE
AL
VT
NY
MD
SC
GA
TN
AL
FL
MS
ARNM
KYMOKS
SDWI
IN
OH
MT
CA
NV
UT
WY
CO
AK
= A= B= C= D= F= NG
Source: Heartland Institute, May 2010
A- A-
A-
B-
B-
B-
B-
B-
B-B-
B-B-
B-
B-
B-
B-
B- C-
C-
C-
C -
C-
D-D-
A
A
A
A
B+
B+
B+
B
B
B
B
B
B
C+
C+
C
D+
D+D+
D
NG
NG
D F
F
2010 Property and Casualty InsuranceReport Card
Not Graded: District of ColumbiaMississippiLouisiana
Shifting Legal Liability & Tort Environment
54
Is the Tort PendulumSwinging Against Insurers?

55
Important Issues & Threats Facing Insurers: 2010–2015
Source: Insurance Information Institute
Bottom Line: Tort “crisis” is on the horizon and will be recognized as such by 2012–2014
No tort reform (or protection of recent reforms) is forthcoming from the current Congress or Administration
Erosion of recent reforms is a certainty (already happening)
Innumerable legislative initiatives will create opportunities to undermine existing reforms and develop new theories and channels of liability
Torts twice the overall rate of inflation
Influence personal and commercial lines, esp. auto liability
Historically extremely costly to p/c insurance industry
Leads to reserve deficiency, rate pressure
Emerging Tort Threat
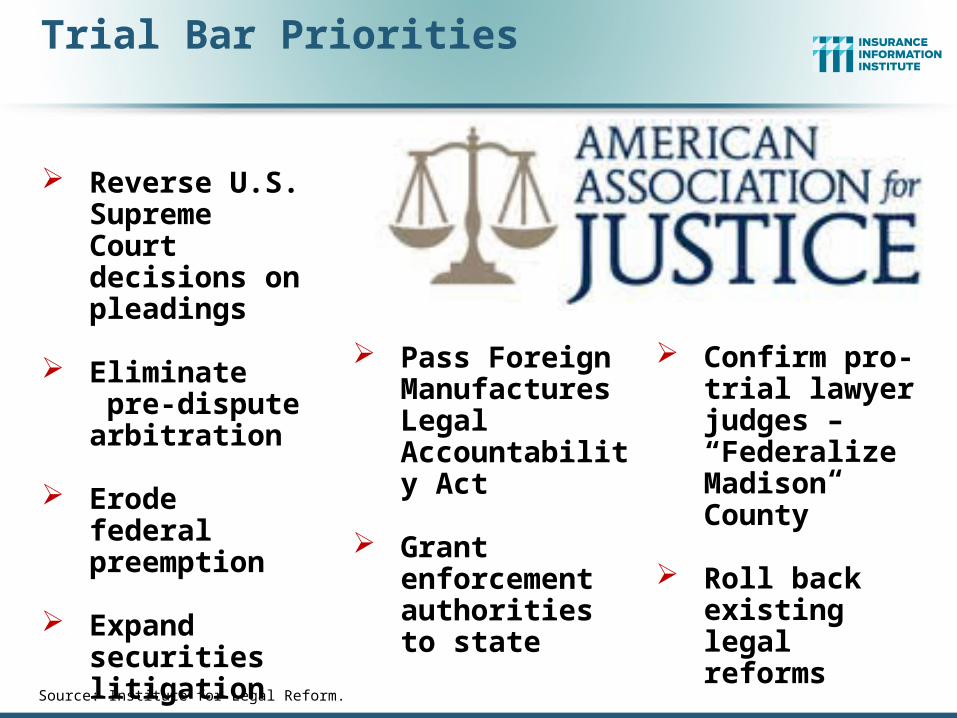
Reverse U.S. Supreme Court decisions on pleadings
Eliminate pre-dispute arbitration
Erode federal preemption
Expand securities litigation
Pass Foreign Manufactures Legal Accountability Act
Grant enforcement authorities to state AGs
Confirm pro-trial lawyer judges – “Federalize Madison County”
Roll back existing legal reforms
Source: Institute for Legal Reform.
Trial Bar Priorities

59
Over the Last Three Decades, Total Tort Costs* as a % of GDP Appear Somewhat Cyclical
$0
$50
$100
$150
$200
$250
$300
80 82 84 86 88 90 92 94 96 98 00 02 04 06 08E 10E
To
rt S
ys
tem
Co
sts
1.50%
1.75%
2.00%
2.25%
2.50%
To
rt Co
sts
as
% o
f GD
P
Tort Sytem Costs Tort Costs as % of GDP
($ Billions)
* Excludes the tobacco settlement, medical malpracticeSources: Tillinghast-Towers Perrin, 2008 Update on US Tort Cost Trends, Appendix 1A; I.I.I. calculations/estimates for 2009 and 2010
2009–2010 Growth in Tort Costs as % of GDP is Due in
Part to Shrinking GDP

Business Leaders Ranking of Liability Systems in 2009*
Best States
1. Delaware
2. North Dakota
3. Nebraska
4. Indiana
5. Iowa
6. Virginia
7. Utah
8. Colorado
9. Massachusetts
10. South Dakota
Worst States
41. New Mexico
42. Florida
43. Montana
44. Arkansas
45. Illinois
46. California
47. Alabama
48. Mississippi
49. Louisiana
50. West Virginia
Source: US Chamber of Commerce 2009 State Liability Systems Ranking Study; Insurance Info. Institute.
New in 2009
North Dakota Massachusetts South Dakota
Drop-offs
Maine Vermont Kansas
Newly Notorious
New Mexico Montana Arkansas
Rising Above
Texas South Carolina Hawaii
Midwest/West has mix of good and bad states.
61
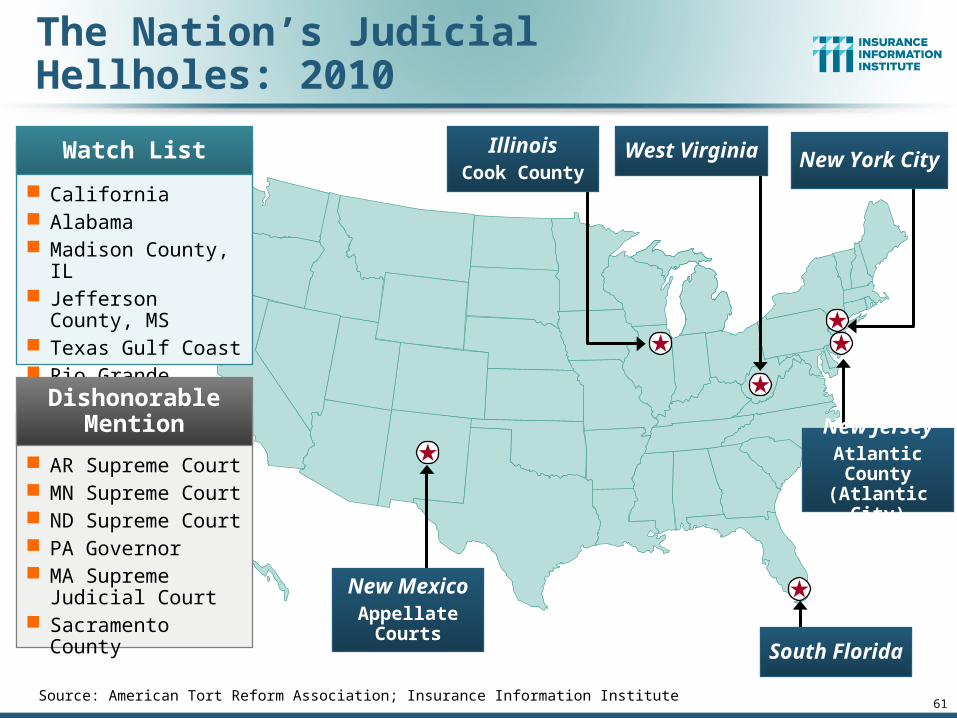
The Nation’s Judicial Hellholes: 2010
Source: American Tort Reform Association; Insurance Information Institute
South Florida
West VirginiaIllinoisCook County
New MexicoAppellate
Courts
Watch List
California Alabama Madison County, IL Jefferson County, MS Texas Gulf Coast Rio Grande Valley,
TX
Dishonorable Mention
AR Supreme Court MN Supreme Court ND Supreme Court PA Governor MA Supreme
Judicial Court Sacramento County
New JerseyAtlantic County (Atlantic City)
New York City

Average Jury Awards 1999 - 2008
$725$747 $756
$800 $799
$1,018 $1,022
$950
$1,077$1,046
$500
$600
$700
$800
$900
$1,000
$1,100
$1,200
1999 2000 2001 2002 2003 2004 2005 2006 2007 2008
Source: Jury Verdict Research; Insurance Information Institute.
Financial Strength & Ratings
75
Industry Has Weathered the Storms Well

P/C Insurer Impairments, 1969–20098
15
12
71
19
34
91
31
21
99
16
14
13
36
49
31 3
45
04
85
56
05
84
12
91
61
23
11
8 19
49 50
47
35
18
14 15
7 65
0
10
20
30
40
50
60
70
69
70
71
72
73
74
75
76
77
78
79
80
81
82
83
84
85
86
87
88
89
90
91
92
93
94
95
96
97
98
99
00
01
02
03
04
05
06
07
08
09
Source: A.M. Best; Insurance Information Institute.
The Number of Impairments Varies Significantly Over the P/C Insurance Cycle, With Peaks Occurring Well into Hard Markets
5 of the 11 are Florida companies (1 of these
5 is a title insurer)

79
Reasons for US P/C Insurer Impairments, 1969–2008
38.1%
14.3%8.1%
7.6%
7.9%
7.0%
9.1%
4.2%
3.7%
Source: A.M. Best: 1969-2008 Impairment Review, Special Report, Apr. 6, 2009
Deficient Loss Reserves and Inadequate Pricing Are the Leading Cause of Insurer Impairments, Underscoring the Importance of Discipline.
Investment Catastrophe Losses Play a Much Smaller Role
Deficient Loss Reserves/In-adequate Pricing
Reinsurance Failure
Rapid GrowthAlleged Fraud
Catastrophe Losses
Affiliate Impairment
Investment Problems
Misc.
Sig. Change in Business

P/C Premium Growth Primarily Driven by the
Industry’s Underwriting Cycle, Not the Economy
80

81
-5%
0%
5%
10%
15%
20%
25%
71 72 73 74 75 76 77 78 79 80 81 82 83 84 85 86 87 88 89 90 91 92 93 94 95 96 97 98 99 00 01 02 03 04 05 06 07 08 0910
F
Soft Market Appears to Persistin 2010. Relief in 2011?
(Percent)1975-78 1984-87 2000-03
Shaded areas denote “hard market” periodsSources: A.M. Best (historical and forecast), ISO, Insurance Information Institute.
Net Written Premiums Fell 0.7% in 2007 (First Decline Since 1943) by 2.0% in 2008, and 4.2% in 2009, the First 3-Year Decline Since 1930-33.
NWP down 1.3% in 10:Q1 vs. 09:Q1

82
Average Expenditures on Auto Insurance
$651$668
$691$705
$726
$786
$830$842
$831$816
$795$816
$844
$878
$690$685$703
$600
$650
$700
$750
$800
$850
$900
$950
94 95 96 97 98 99 00 01 02 03 04 05 06 07 08* 09* 10*
Countrywide Auto Insurance Expenditures Increased2.6% in 2008 and 3.5% Pace in 2009 (est.) and 4% in 2010 (est.)
* Insurance Information Institute Estimates/ForecastsSource: NAIC, Insurance Information Institute estimates 2008-2010 based on CPI data.

84
Average Premium forHome Insurance Policies**
* Insurance Information Institute Estimates/Forecasts **Excludes state-run insurers.Source: NAIC, Insurance Information Institute estimates 2008-2010 based on CPI data.
$508$536
$593
$668
$822 $835$854
$879
$804
$764
$729
$500
$550
$600
$650
$700
$750
$800
$850
$900
$950
00 01 02 03 04 05 06 07 08* 09* 10*
85
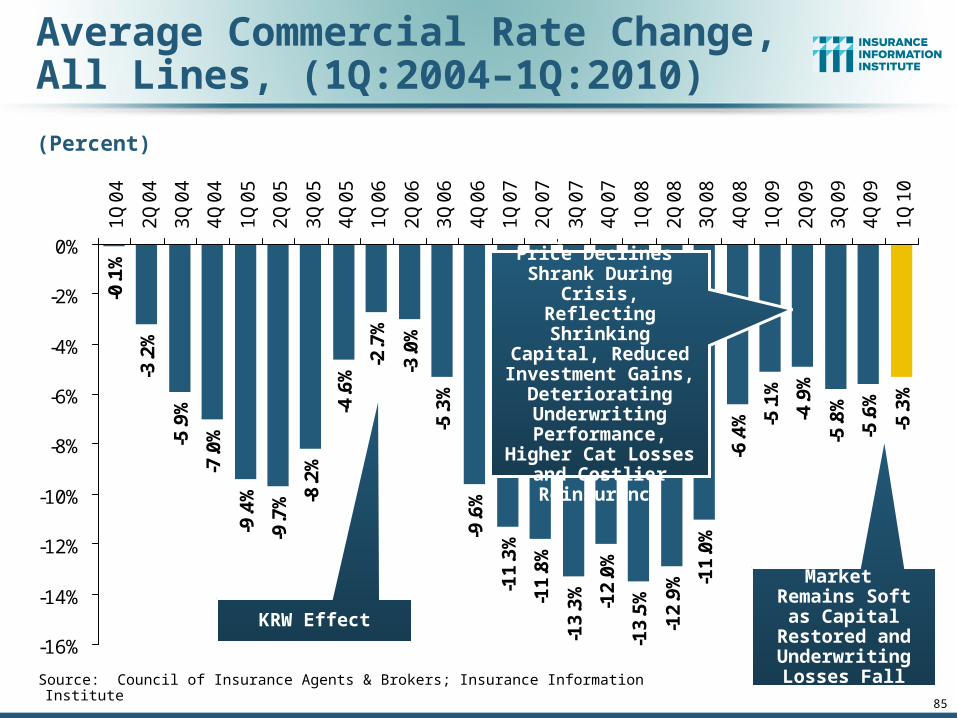
Average Commercial Rate Change,All Lines, (1Q:2004–1Q:2010)
-3.2
%
-5.9
%
-7.0
%
-9.4
%
-9.7
% -8.2
%
-4.6
%
-2.7
%
-3.0
%
-5.3
%
-9.6
%
-11
.3%
-11
.8%
-13
.3%
-12
.0%
-13
.5%
-12
.9% -1
1.0
%
-6.4
% -5.1
%
-4.9
%
-5.8
%
-5.6
%
-5.3
%
-0.1
%
-16%
-14%
-12%
-10%
-8%
-6%
-4%
-2%
0%
1Q
04
2Q
04
3Q
04
4Q
04
1Q
05
2Q
05
3Q
05
4Q
05
1Q
06
2Q
06
3Q
06
4Q
06
1Q
07
2Q
07
3Q
07
4Q
07
1Q
08
2Q
08
3Q
08
4Q
08
1Q
09
2Q
09
3Q
09
4Q
09
1Q
10
Source: Council of Insurance Agents & Brokers; Insurance Information Institute
KRW Effect
Magnitude of Price Declines Shrank
During Crisis, Reflecting Shrinking
Capital, Reduced Investment Gains,
Deteriorating Underwriting
Performance, Higher Cat Losses and
Costlier Reinsurance
(Percent)
Market Remains Soft as Capital Restored and Underwriting Losses Fall
87
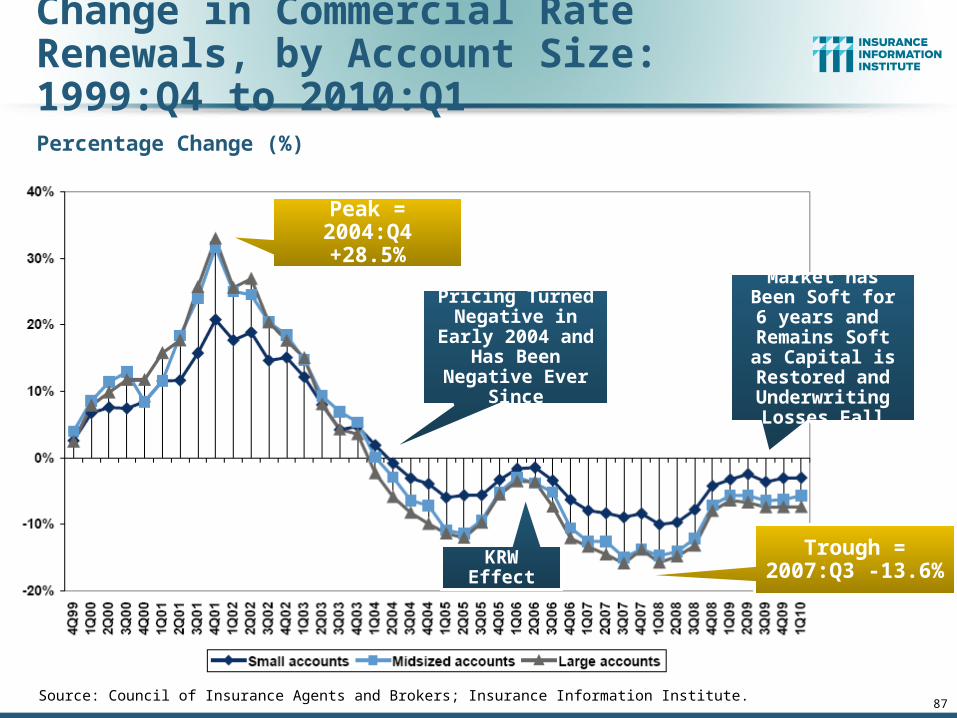
Change in Commercial Rate Renewals, by Account Size: 1999:Q4 to 2010:Q1
Source: Council of Insurance Agents and Brokers; Insurance Information Institute.
Percentage Change (%)
Market has Been Soft for 6 years
and Remains Soft as Capital is Restored and Underwriting Losses Fall
Peak = 2004:Q4 +28.5%
KRW Effect
Trough = 2007:Q3 -13.6%
Pricing Turned Negative in Early
2004 and Has Been Negative
Ever Since

Capital/PolicyholderSurplus (US)
89
Shrinkage, but Not Enoughto Trigger Hard Market

91
Policyholder Surplus, 2006:Q4–2010:Q1E
Sources: ISO, A.M .Best.
($ Billions)
$487.1$496.6
$512.8$521.8
$478.5
$455.6
$437.1
$463.0
$490.8
$511.5
$540.7
$505.0$515.6$517.9
$420
$440
$460
$480
$500
$520
$540
$560
06:Q4 07:Q1 07:Q2 07:Q3 07:Q4 08:Q1 08:Q2 08:Q3 08:Q4 09:Q1 09:Q2 09:Q3 09:Q410:Q1E
2007:Q3Previous Surplus Peak
Quarterly Surplus Changes Since 2007:Q3 Peak
08:Q2: -$16.6B (-3.2%) 08:Q3: -$43.3B (-8.3%) 08:Q4: -$66.2B (-12.9%)09:Q1: -$84.7B (-16.2%)
09:Q2: -$58.8B (-11.2%)09:Q3: -$31.8B (-5.9%)09:Q4: -$10.3B (-2.0%)10:Q1: +$18.9B (+3.6%)
Surplus set a new record in 2010: Q1*
*Includes $22.5B of paid-in capital from a holding company parent for one insurer’s investment in a non-insurance business

94
Ratio of Insured Loss to Surplus for Largest Capital Events Since 1989*
* Ratio is for end-of-quarter surplus immediately prior to event. Date shown is end of quarter prior to event** Date of maximum capital erosion; As of 9/30/09 (latest available) ratio = 5.9%Source: PCS; Insurance Information Institute
3.3%
9.6%
6.9%
10.9%
6.2%
13.8%
16.2%
0%
3%
6%
9%
12%
15%
18%
6/30/1989Hurricane
Hugo
6/30/1992HurricaneAndrew
12/31/93NorthridgeEarthquake
6/30/01 Sept.11 Attacks
6/30/04Florida
Hurricanes
6/30/05Hurricane
Katrina
FinancialCrisis as of3/31/09**
The Financial Crisis at its Peak Ranks as the Largest
“Capital Event” Overthe Past 20+ Years
(Percent)

Merger & Acquisition
96
Barriers to Consolidation Will Diminish in 2010
97
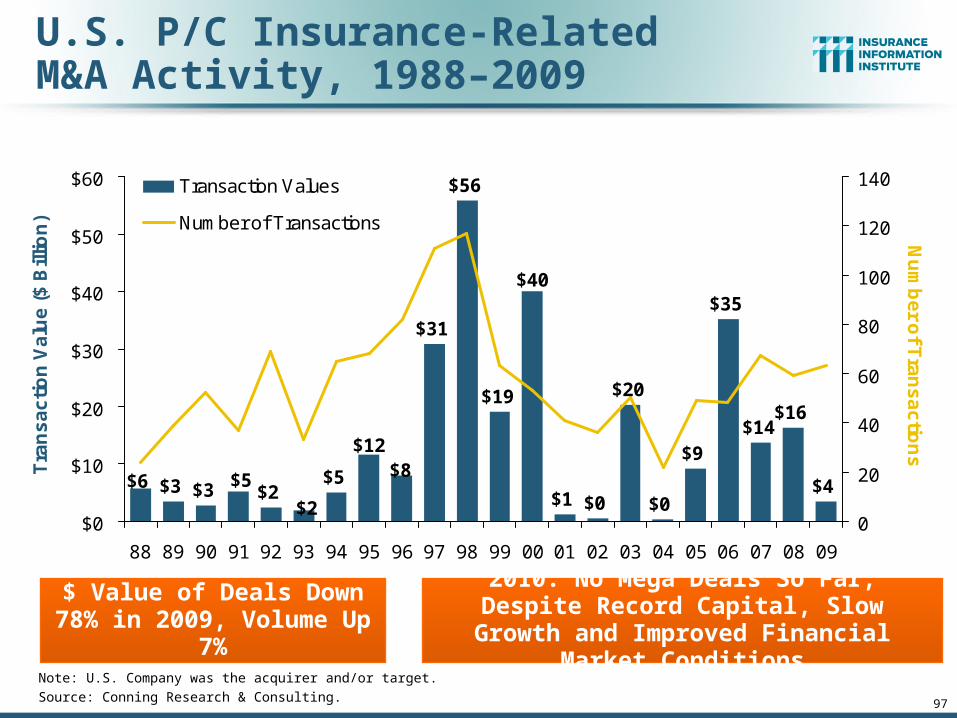
U.S. P/C Insurance-RelatedM&A Activity, 1988–2009
$2$5
$19
$1 $0
$20
$0
$9
$35
$14$16
$4
$56
$31
$8$12
$2$3 $3 $5$6
$40
$0
$10
$20
$30
$40
$50
$60
88 89 90 91 92 93 94 95 96 97 98 99 00 01 02 03 04 05 06 07 08 09
Tra
ns
ac
tio
n V
alu
e (
$ B
illio
n)
0
20
40
60
80
100
120
140
Nu
mb
er o
f Tra
ns
ac
tion
s
Transaction Values
Number of Transactions
Note: U.S. Company was the acquirer and/or target.
Source: Conning Research & Consulting.
2010: No Mega Deals So Far, Despite Record Capital, Slow Growth and Improved
Financial Market Conditions
$ Value of Deals Down 78% in 2009, Volume Up 7%

Investment Performance
98
Investments Are a PrincipleSource of Declining Profitability

Property/Casualty Insurance Industry Investment Gain: 1994–2010:Q11
$35.4
$42.8$47.2
$52.3
$44.4
$36.0
$45.3$48.9
$59.4$55.7
$64.0
$31.7
$39.0
$12.6
$58.0
$51.9$56.9
$0
$10
$20
$30
$40
$50
$60
$70
94 95 96 97 98 99 00 01 02 03 04 05* 06 07 08 09 10:Q1
In 2008, Investment Gains Fell by 50% Due to Lower Yields andNearly $20B of Realized Capital Losses
2009 Saw Smaller Realized Capital Losses But Declining Investment Income
1 Investment gains consist primarily of interest, stock dividends and realized capital gains and losses.* 2005 figure includes special one-time dividend of $3.2B.Sources: ISO; Insurance Information Institute.
($ Billions) 2009:Q1 gain was
$3.7B

101
Treasury Yield Curves: Pre-Crisis (July 2007) vs. July 2010
0.16% 0.16% 0.20% 0.29%0.62%
2.43%
3.01%
4.82% 4.96% 5.04% 4.96% 4.82% 4.82% 4.88% 5.00% 4.93% 5.00%5.19%
1.76%
0.98%
3.99%3.80%
0%
1%
2%
3%
4%
5%
6%
1M 3M 6M 1Y 2Y 3Y 5Y 7Y 10Y 20Y 30Y
July 2010 Yield Curve*Pre-Crisis (July 2007)
Treasury yield curve is near its most depressed level in at least 45 years. Investment
income is falling as a result
Stock Dividend Cuts Have Further Pressured Investment Income
Sources: Board of Governors of the United States Federal Reserve Bank; Insurance Information Institute.

102
-1.8
%
-1.8
%
-2.0
%
-3.6
%
-3.3
%
-3.3
%
-3.7
%
-4.3
%
-5.2
%
-5.7
%
-7.3%
-1.9
%
-2.1
%
-3.1
%
-8%-7%-6%-5%-4%-3%-2%-1%0%
Perso
nal L
ines
Pvt Pass
Aut
o
Pers P
rop
Comm
ercia
l
Comm
l Auto
Credit
Comm
Pro
p
Comm
Cas
Fidelity
/Sure
ty
War
rant
y
Surplu
s Line
s
Med
Mal
WC
Reinsu
ranc
e**
Lower Investment Earnings Place a Greater Burden on Underwriting and Pricing Discipline
*Based on 2008 Invested Assets and Earned Premiums**US domestic reinsurance onlySource: A.M. Best; Insurance Information Institute.
Reduction in Combined Ratio Necessary to Offset 1% Decline in Investment Yield to Maintain Constant ROE, by Line*

104
Underwriting Trends – Financial Crisis Does Not
Directly Impact Underwriting Performance: Cycle, Catastrophes
Were 2008’s Drivers

105
P/C Insurance Industry Combined Ratio, 2001–2010:Q1*
* Excludes Mortgage & Financial Guaranty insurers in 2008, 2009 and 2010. Including M&FG, 2008=105.1, 2009=100.7, 2010:Q1=101.1 Sources: A.M. Best, ISO.
95.7
99.3 99.0101.0
92.6
100.898.4
100.1
107.5
115.8
90
100
110
120
2001 2002 2003 2004 2005 2006 2007 2008 2009* 2010:Q1
Best Combined
Ratio Since 1949 (87.6)
As Recently as 2001, Insurers Paid Out
Nearly $1.16 for Every $1 in Earned
Premiums
Relatively Low CAT Losses, Reserve Releases
Cyclical Deterioration
Heavy Use of Reinsurance Lowered Net
Losses
Relatively Low CAT Losses, Reserve Releases
Lower CAT
Losses, More
Reserve Releases
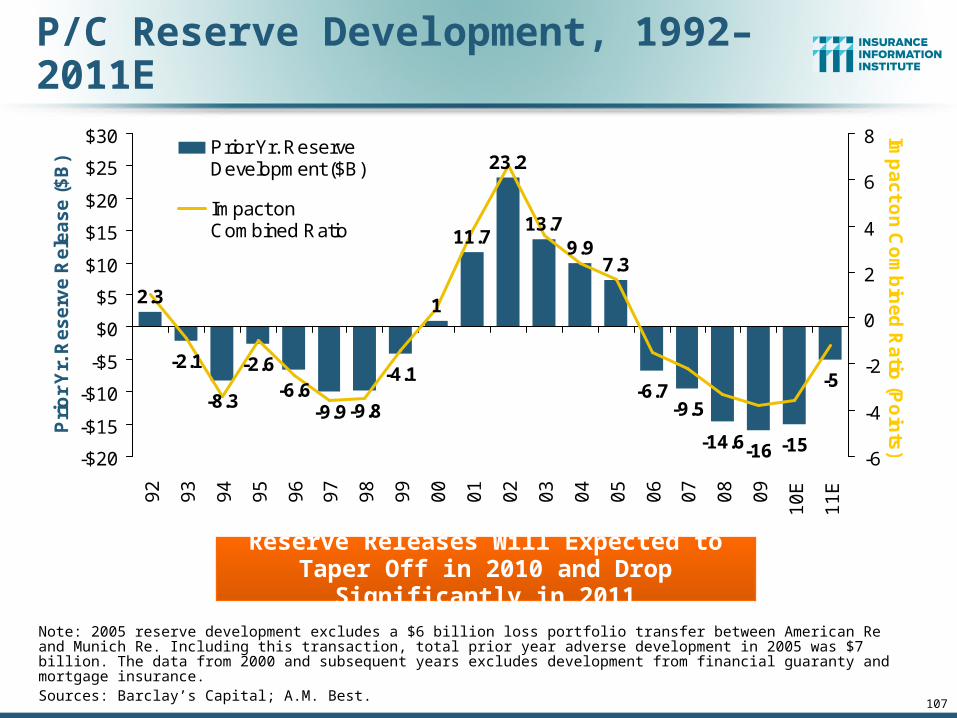
107
2.3
-2.1
-8.3
-2.6-6.6
-9.9 -9.8
-4.1
1
11.7
23.2
13.79.9
7.3
-6.7-9.5
-14.6-16 -15
-5
-$20
-$15
-$10
-$5
$0
$5
$10
$15
$20
$25
$309
2
93
94
95
96
97
98
99
00
01
02
03
04
05
06
07
08
09
10
E
11
E
Pri
or
Yr.
Re
se
rve
Re
lea
se
($
B)
-6
-4
-2
0
2
4
6
8 Imp
ac
t on
Co
mb
ine
d R
atio
(Po
ints
)
Prior Yr. ReserveDevelopment ($B)
Impact onCombined Ratio(Points)
P/C Reserve Development, 1992–2011E
Reserve Releases Will Expected to Taper Off in 2010 and Drop Significantly in 2011
Note: 2005 reserve development excludes a $6 billion loss portfolio transfer between American Re and Munich Re. Including this transaction, total prior year adverse development in 2005 was $7 billion. The data from 2000 and subsequent years excludes development from financial guaranty and mortgage insurance. Sources: Barclay’s Capital; A.M. Best.
108
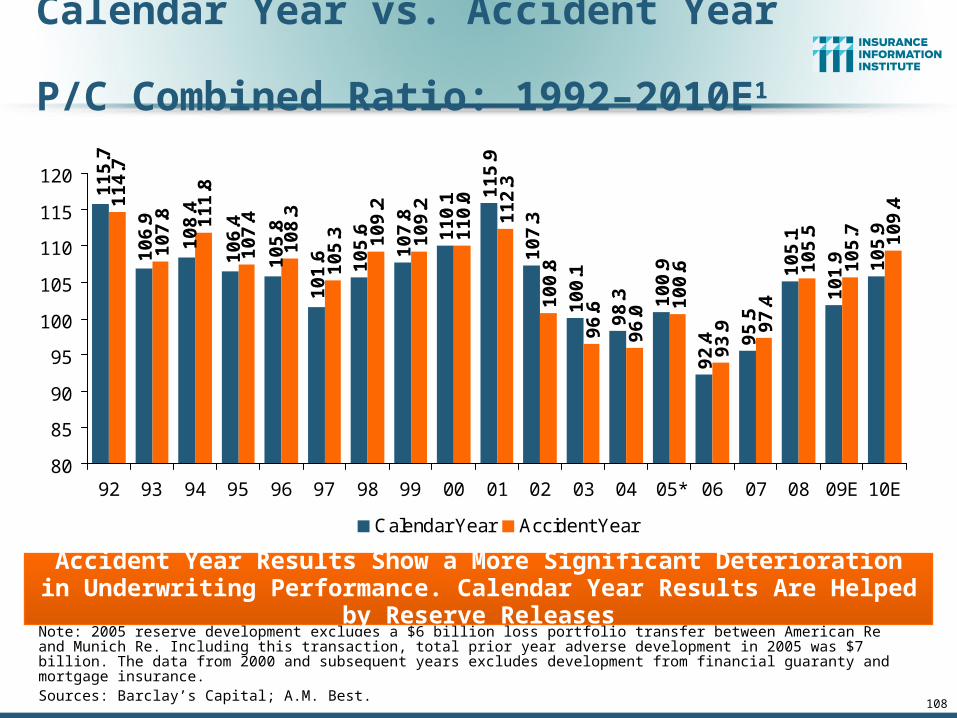
Calendar Year vs. Accident Year P/C Combined Ratio: 1992–2010E1
Note: 2005 reserve development excludes a $6 billion loss portfolio transfer between American Re and Munich Re. Including this transaction, total prior year adverse development in 2005 was $7 billion. The data from 2000 and subsequent years excludes development from financial guaranty and mortgage insurance. Sources: Barclay’s Capital; A.M. Best.
10
5.6
10
7.8
11
0.1 1
15
.9
10
7.3
10
0.1
98
.3 10
0.9
92
.4 95
.5
10
5.1
10
1.9 10
5.9
11
4.7
10
7.8 11
1.8
10
7.4
10
8.3
10
5.3 10
9.2
10
9.2
11
0.0
11
2.3
10
0.8
96
.6
96
.0
10
0.6
93
.9 97
.4
10
5.5
10
5.7 10
9.4
11
5.7
10
6.9
10
8.4
10
6.4
10
5.8
10
1.6
80
85
90
95
100
105
110
115
120
92 93 94 95 96 97 98 99 00 01 02 03 04 05* 06 07 08 09E 10E
Calendar Year Accident Year
Accident Year Results Show a More Significant Deterioration in Underwriting Performance. Calendar Year Results Are Helped by Reserve Releases

109
Number of Years with Underwriting Profits by Decade, 1920s–2000s
0 0
3
54
8
10
76
0
2
4
6
8
10
12
1920s 1930s 1940s 1950s 1960s 1970s 1980s 1990s 2000s*
* 2000 through 2009. 2009 combined ratio excluding mortgage and financial guaranty insurers was 99.3, which would bring the 2000s total to 4 years with an underwriting profit.Note: Data for 1920–1934 based on stock companies only.Sources: Insurance Information Institute research from A.M. Best Data.
Number of Years with Underwriting Profits
Underwriting Profits Were Common Before the 1980s (40 of the 60 Years Before 1980 Had Combined Ratios Below 100) –
But Then They Vanished. Not a Single Underwriting Profit Was Recorded in the 25 Years from 1979 Through 2003

110
Performance by Segment:Commercial/Personal Lines &
Reinsurance
115
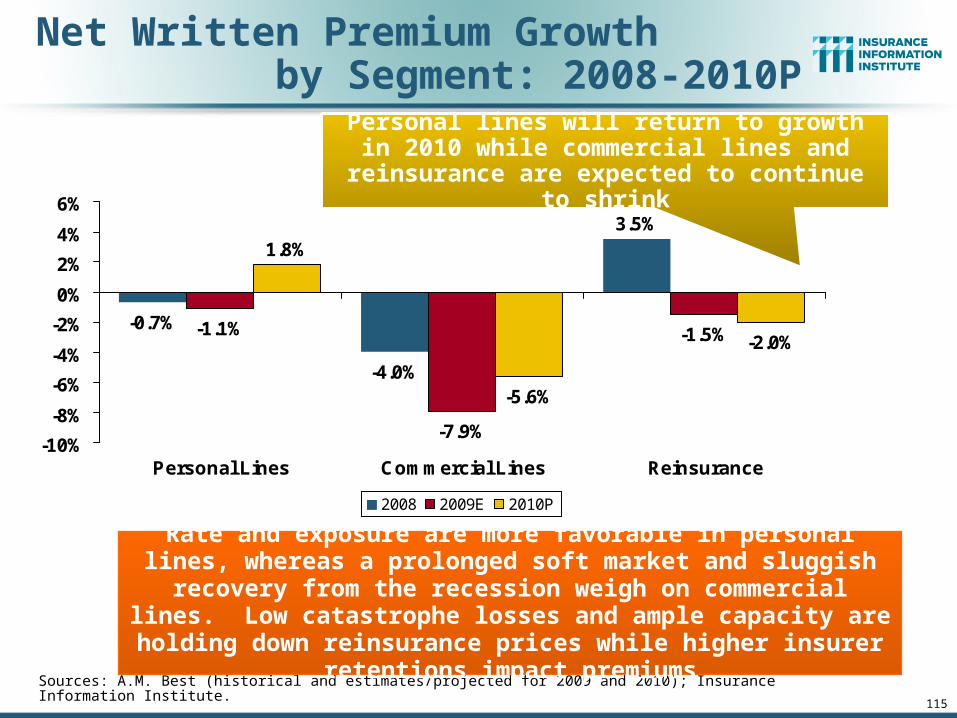
Net Written Premium Growth by Segment: 2008-2010P
Sources: A.M. Best (historical and estimates/projected for 2009 and 2010); Insurance Information Institute.
-1.1%
-7.9%
-1.5%
1.8%
-5.6%
-2.0%
3.5%
-4.0%
-0.7%
-10%
-8%
-6%
-4%
-2%
0%
2%
4%
6%
Personal Lines Commercial Lines Reinsurance
2008 2009E 2010P
Rate and exposure are more favorable in personal lines, whereas a prolonged soft market and sluggish recovery from the recession weigh on commercial lines. Low catastrophe losses and ample
capacity are holding down reinsurance prices while higher insurer retentions impact premiums
Personal lines will return to growth in 2010 while commercial lines and reinsurance are
expected to continue to shrink

Homeowners Insurance Combined Ratio: 1990–2010P
11
3.0
11
7.7
15
8.4
11
3.6
10
1.0 10
9.4
10
8.2
11
1.4 1
21
.7
10
9.3
98
.3
94
.2 10
0.1
89
.4 95
.7
11
7.0
10
5.5
10
5.0
11
8.4
11
2.7 12
1.7
80
90
100
110
120
130
140
150
160
170
90 91 92 93 94 95 96 97 98 99 00 01 02 03 04 05 06 07 08 09E 10P
Homeowners Line Is Expected to Be Marginally Profitable Overall in 2010, but in Many States Could Be Quite Profitable. Volatility Due to
Catastrophe Losses Will Persist
Sources: A.M. Best; Insurance Information Institute.
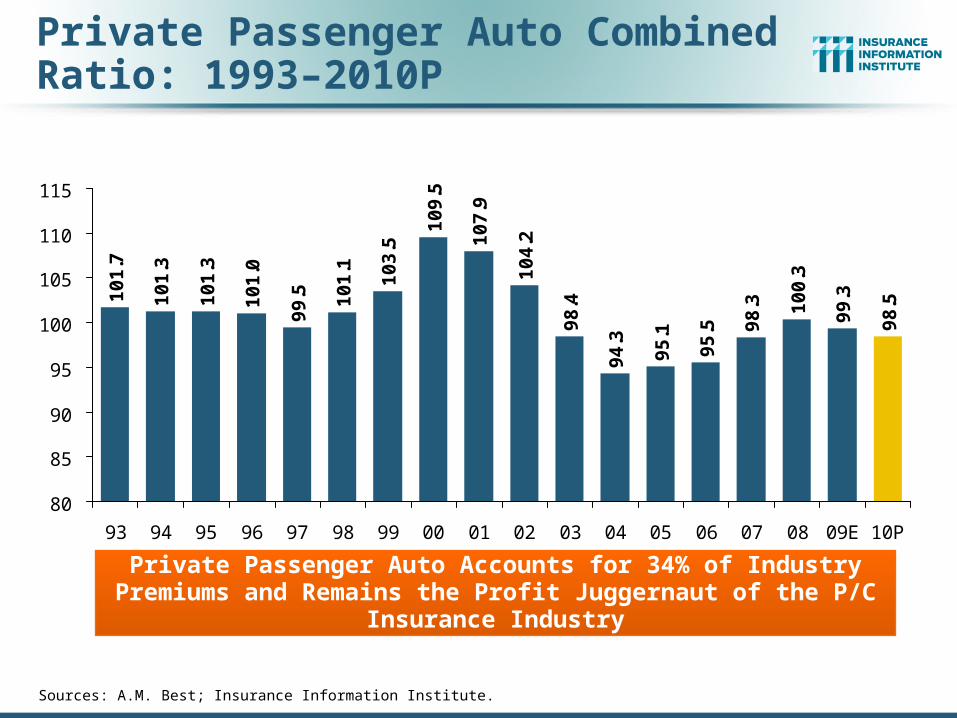
Private Passenger Auto Combined Ratio: 1993–2010P
10
1.7
10
1.3
10
1.3
10
1.0
10
9.5
10
7.9
10
4.2
98
.4
94
.3
95
.1
95
.5 98
.3 10
0.3
99
.3
98
.5
99
.5 10
1.1
10
3.5
80
85
90
95
100
105
110
115
93 94 95 96 97 98 99 00 01 02 03 04 05 06 07 08 09E 10P
Private Passenger Auto Accounts for 34% of Industry Premiums and Remains the Profit Juggernaut of the P/C Insurance Industry
Sources: A.M. Best; Insurance Information Institute.

Commercial Auto Combined Ratio: 1993–2010P
11
2.1
11
2.0
11
3.0
11
5.9
10
2.7
95
.2
92
.9
92
.1
92
.4 94
.2 96
.8
97
.0
98
.5
11
8.1
11
5.7
11
6.2
80
85
90
95
100
105
110
115
120
125
95 96 97 98 99 00 01 02 03 04 05 06 07 08 09E 10P
Commercial Auto is Expected to Remain Reasonably Profitable in 2010
Sources: A.M. Best; Insurance Information Institute.
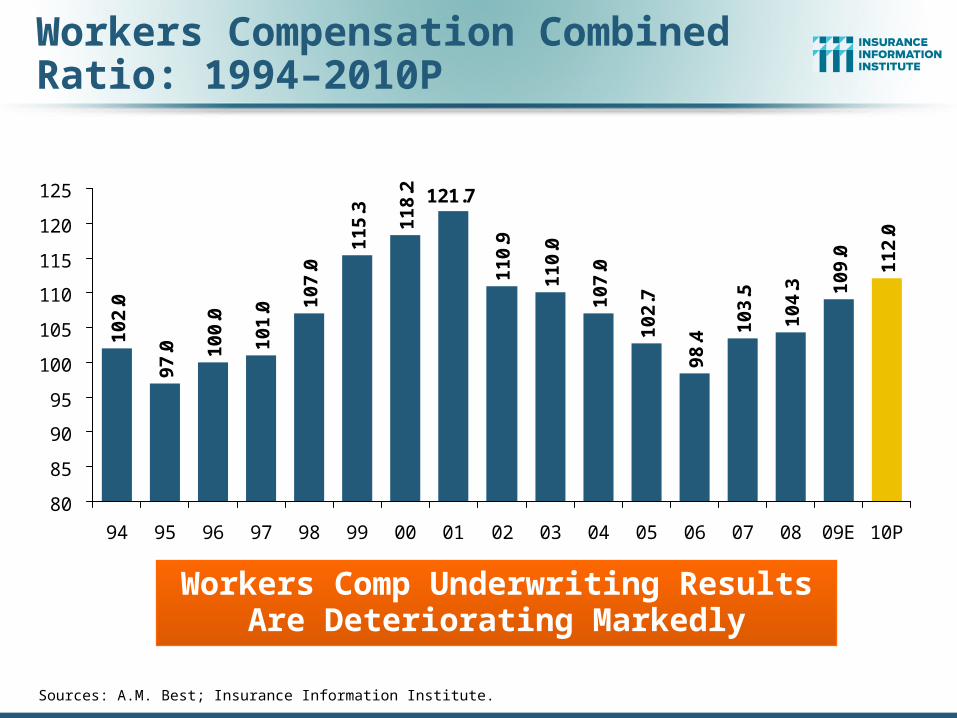
Workers Compensation Combined Ratio: 1994–2010P
10
2.0
97
.0 10
0.0
10
1.0
11
0.9
11
0.0
10
7.0
10
2.7
98
.4
10
3.5
10
4.3 1
09
.0
11
2.0
121.7
10
7.0
11
5.3
11
8.2
80
85
90
95
100
105
110
115
120
125
94 95 96 97 98 99 00 01 02 03 04 05 06 07 08 09E 10P
Workers Comp Underwriting Results Are Deteriorating Markedly
Sources: A.M. Best; Insurance Information Institute.

126
Wage & Salary Disbursement (Private Employment) vs. WC NWP ($ Billions)
Wage & Salary Disbursements (Payroll Base) vs. Workers Comp Net Written Premiums
* Average Wage and Salary data as of 10/1/2009. Shaded areas indicate recessions. **Estimated “official” end of recession June 2009.Source: US Bureau of Economic Analysis; Federal Reserve Bank of St. Louis at http://research.stlouisfed.org/fred2/series/WASCUR ; I.I.I. Fact Books
Weakening Payrolls Have Eroded $2B+ in Workers Comp Premiums; Nearly 29% of NPW Has Been Eroded Away by the Soft Market and Weak Economy
7/90-3/91 3/01-11/01
$0
$1,000
$2,000
$3,000
$4,000
$5,000
$6,000
$7,000
90 91 92 93 94 95 96 97 98 99 00 01 02 03 04 05 06 07 08 09*
$0
$10
$20
$30
$40
$50
$60
Wage & SalaryDisbursements
WC NPW
WC net premiums written were down $13.7B or 28.7%
to $34.1B in 2009 after peaking at $47.8B in 2005
12/07-6/09**
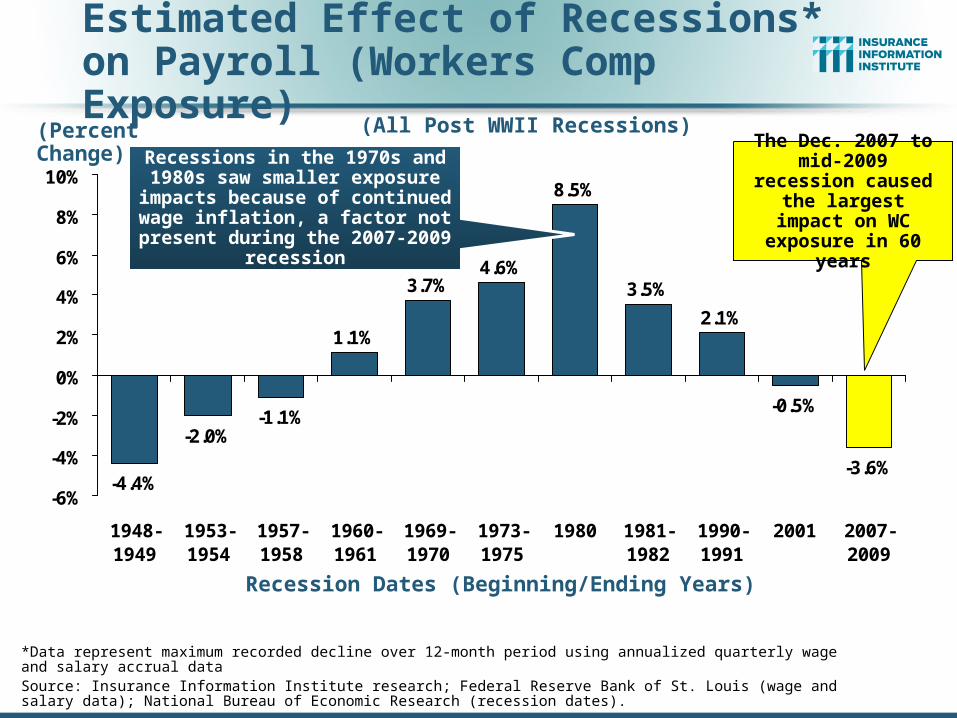
Estimated Effect of Recessions* on Payroll (Workers Comp Exposure)
*Data represent maximum recorded decline over 12-month period using annualized quarterly wage and salary accrual dataSource: Insurance Information Institute research; Federal Reserve Bank of St. Louis (wage and salary data); National Bureau of Economic Research (recession dates).
-4.4%
-2.0%-1.1%
1.1%
3.7%4.6%
8.5%
3.5%
2.1%
-0.5%
-3.6%
-6%
-4%
-2%
0%
2%
4%
6%
8%
10%
1948-1949
1953-1954
1957-1958
1960-1961
1969-1970
1973-1975
1980 1981-1982
1990-1991
2001 2007-2009
Recessions in the 1970s and 1980s saw smaller exposure impacts
because of continued wage inflation, a factor not present
during the 2007-2009 recession
The Dec. 2007 to mid-2009 recession
caused the largest impact on WC
exposure in 60 years
(Percent Change)
(All Post WWII Recessions)
Recession Dates (Beginning/Ending Years)

Where Will the Growth in WC Exposure Come From?
141
Industry and Occupation Growth Analysis

142
Fastest Growing Occupations, 2008–2018:Health/Science/Tech Dominate
Sources: US Bureau of Labor Statistics: Occupational Outlook Handbook, 2010-2011 Edition; Insurance Information Institute
OccupationsPercent change
Number of
new jobs(in thousands)
Wages (May 2008 median) Education/training category
Biomedical engineers 72 11.6 $ 77,400 Bachelor's degree
Network systems and data communications analysts
53 155.8 71,100 Bachelor's degree
Home health aides 50 460.9 20,460 Short-term on-the-job training
Personal and home care aides 46 375.8 19,180 Short-term on-the-job training
Financial examiners 41 11.1 70,930 Bachelor's degree
Medical scientists, except epidemiologists
40 44.2 72,590 Doctoral degree
Physician assistants 39 29.2 81,230 Master's degree
Skin care specialists 38 14.7 28,730 Postsecondary vocational award
Biochemists and biophysicists 37 8.7 82,840 Doctoral degree
Athletic trainers 37 6.0 39,640 Bachelor's degree
Physical therapist aides 36 16.7 23,760 Short-term on-the-job training
Dental hygienists 36 62.9 66,570 Associate degree
Veterinary technologists and technicians
36 28.5 28,900 Associate degree
Dental assistants 36 105.6 32,380 Moderate-term on-the-job training
Computer software engineers, applications
34 175.1 85,430 Bachelor's degree
Medical assistants 34 163.9 28,300 Moderate-term on-the-job training
Physical therapist assistants 33 21.2 46,140 Associate degree
Veterinarians 33 19.7 79,050 First professional degree
Self-enrichment education teachers
32 81.3 35,720 Work experience in a related occupation
Compliance officers, except agriculture, construction, health and safety, and transportation
31 80.8 48,890 Long-term on-the-job training
SOURCE: BLS Occupational Employment Statistics and Division of Occupational Outlook
WC exposure growth the fastest in the health, science and tech areas

143
Occupations with Largest Numerical Growth, 2008–2018: Health, Services Dominate
Sources: US Bureau of Labor Statistics: Occupational Outlook Handbook, 2010-2011 Edition; Insurance Information Institute
Dollar growth in WC exposures should grow the most (at current rate levels) in the health and services industries
Occupations
Number of
new jobs(in thousands) Percent change
Wages (May 2008 median) Education/training category
Registered nurses 581.5 22 $ 62,450 Associate degree
Home health aides 460.9 50 20,460 Short-term on-the-job training
Customer service representatives 399.5 18 29,860 Moderate-term on-the-job training
Combined food preparation and serving workers, including fast food
394.3 15 16,430 Short-term on-the-job training
Personal and home care aides 375.8 46 19,180 Short-term on-the-job training
Retail salespersons 374.7 8 20,510 Short-term on-the-job training
Office clerks, general 358.7 12 25,320 Short-term on-the-job training
Accountants and auditors 279.4 22 59,430 Bachelor's degree
Nursing aides, orderlies, and attendants
276.0 19 23,850 Postsecondary vocational award
Postsecondary teachers 256.9 15 58,830 Doctoral degree
Construction laborers 255.9 20 28,520 Moderate-term on-the-job training
Elementary school teachers, except special education
244.2 16 49,330 Bachelor's degree
Truck drivers, heavy and tractor-trailer
232.9 13 37,270 Short-term on-the-job training
Landscaping and groundskeeping workers
217.1 18 23,150 Short-term on-the-job training
Bookkeeping, accounting, and auditing clerks
212.4 10 32,510 Moderate-term on-the-job training
Executive secretaries and administrative assistants
204.4 13 40,030 Work experience in a related occupation
Management analysts 178.3 24 73,570 Bachelor's or higher degree, plus work experience
Computer software engineers, applications
175.1 34 85,430 Bachelor's degree
Receptionists and information clerks
172.9 15 24,550 Short-term on-the-job training
Carpenters 165.4 13 38,940 Long-term on-the-job trainingSOURCE: BLS Occupational Employment Statistics and Division of Occupational Outlook

147
The Economic Storm
What the Financial Crisis and Recession Mean for the Industry’s
Exposure Base, Growth and Profitability

148
US Real GDP Growth*
* Estimates/Forecasts from Blue Chip Economic Indicators.Source: US Department of Commerce, Blue Economic Indicators 7/10; Insurance Information Institute.
2.7
%
0.9
%
3.2
%
2.3
%
2.9
%
-0.7
%
0.6
%
-4.0
%
-6.8
% -4.9
%
-0.7
%
1.6
%
5.0
%
3.7
%
2.4
%
2.7
%
2.8
%
2.8
%
3.0
%
3.1
%
3.2
%
4.1
%
1.1
%
1.8
%
2.5
% 3.6
%
3.1
%
-8%
-6%
-4%
-2%
0%
2%
4%
6%
2
00
0
2
00
1
2
00
2
2
00
3
2
00
4
2
00
5
2
00
6
07
:1Q
07
:2Q
07
:3Q
07
:4Q
08
:1Q
08
:2Q
08
:3Q
08
:4Q
09
:1Q
09
:2Q
09
:3Q
09
:4Q
10
:1Q
10
:2Q
10
:3Q
10
:4Q
11
:1Q
11
:2Q
11
:3Q
11
:4Q
Demand for Energy and Commercial Insurance Have Been Impacted by Sluggish Economic Conditions
Real GDP Growth (%)
Recession began in Dec. 2007. Economic toll of credit
crunch, housing slump, labor market contraction has
been severe but modest recovery is underway
The Q4:2008 decline was the steepest since the Q1:1982 drop of 6.8%
Economic growth up sharply in late 2009 with rebuilding
of inventories and stimulus. More moderate growth
expected in 2010/11
152
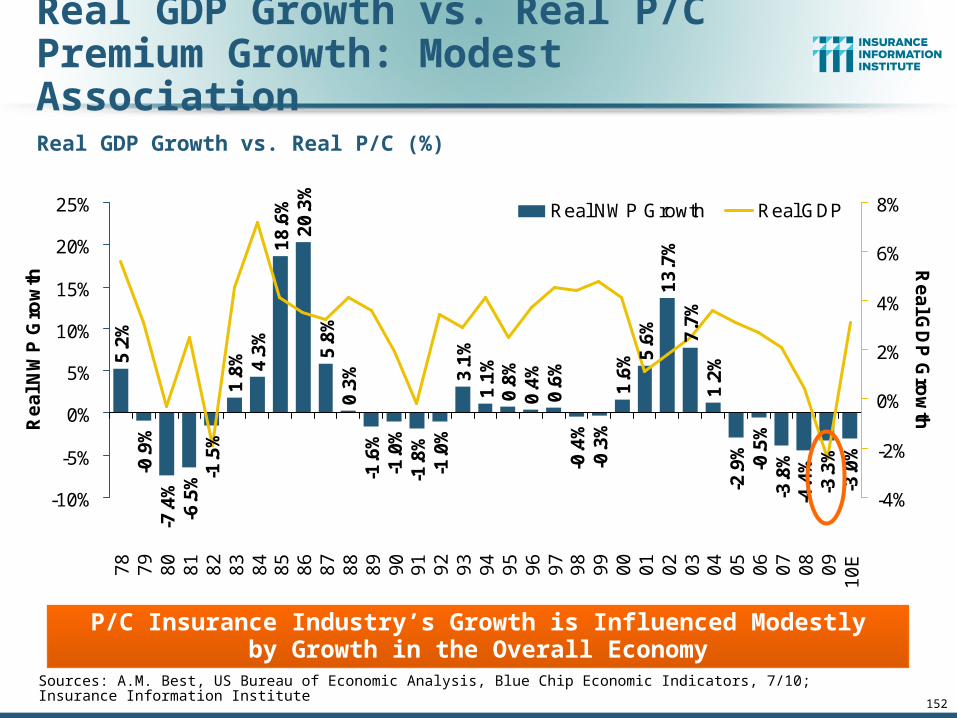
Real GDP Growth vs. Real P/CPremium Growth: Modest Association
Sources: A.M. Best, US Bureau of Economic Analysis, Blue Chip Economic Indicators, 7/10; Insurance Information Institute
4.3
%1
8.6
%2
0.3
%5
.8%
0.3
%-1
.6%
-1.0
%-1
.8%
-1.0
%3
.1%
1.1
%0
.8%
0.4
%0
.6%
-0.4
%-0
.3%
1.6
% 5.6
%1
3.7
%7
.7%
1.2
%-2
.9%
-0.5
%-3
.8%
-4.4
%-3
.3%
-3.0
%
5.2
%-0
.9%
-7.4
%-6
.5% -1
.5%
1.8
%
-10%
-5%
0%
5%
10%
15%
20%
25%
78
79
80
81
82
83
84
85
86
87
88
89
90
91
92
93
94
95
96
97
98
99
00
01
02
03
04
05
06
07
08
09
10
E
Re
al N
WP
Gro
wth
-4%
-2%
0%
2%
4%
6%
8%
Re
al G
DP
Gro
wth
Real NWP Growth Real GDP
P/C Insurance Industry’s Growth is Influenced Modestlyby Growth in the Overall Economy
Real GDP Growth vs. Real P/C (%)
153
Regional Differences Will Significantly Impact P/C Markets
Recovery in Some Areas Will Begin Years Ahead of Others
and Speed of Recovery Will Differ by Orders of Magnitude

154
State Economic Growth Varied Tremendously in 2008
US Bureau of Economic Analysis
Highest Quintile
Fourth Quintile
Third Quintile
Second Quintile
Lowest Quintile
Far West0.6
Rocky Mountain2.2
Southwest1.7
Plains2.0 Great Lakes
-0.4
New England1.0
Mideast1.3
Southeast0.0
US = 0.7
WA2.0
OR1.6
CA0.4
NV-0.6
ID0.0
MT1.8
WY4.4
UT1.4 CO
2.9
AZ-0.6 NM
2.0
TX2.0
OK2.7
KS2.2
NE1.3
SD3.5
ND7.3 MN
2.0
IA2.1
MO1.3
WI0.7
IL0.3
MI-1.5
IN-0.6
OH-0.7
NY1.6
PA1.1
NJ0.6
MD1.3
DE-1.6
DC3.0VA
1.3
WV2.5
KY-0.1
NC0.1
SC0.6
TN0.5
AR0.7
LA0.3
MS1.7
AL0.7
GA-0.6
FL-1.6
AK-2.0
HI0.7
ME1.4
NH1.8
VT1.7 MA
1.9
RI-0.9CT
-0.4
Mountain, Plains States Growing the Fastest
Percent Change in Real GDP by State, 2007–2008

155
Fastest Growing States in 2008:Plains, Mountain States Lead
2.1% 2.0%
7.3%
4.4%
3.5%2.9% 2.7% 2.5%
0%
1%
2%
3%
4%
5%
6%
7%
8%
ND WY SD CO OK WV IA TX, MN,NM, WA
Source: US Bureau of Economic Analysis; Insurance Information Institute.
Real State GDP Growth (%)
Natural Resource and Agricultural States Have Done Better Than Most Others Recently, Helping Insurance Exposure in Those Areas

156
Slowest Growing States in 2008: Diversity of States Suffering
Source: US Bureau of Economic Analysis; Insurance Information Institute.
States in the North, South, East and West All Represented Among Hardest Hit, But for Differing Reasons
Real State GDP Growth (%)
-0.9%
-1.5%-1.6% -1.6%
-1.7%
-2.0%
-0.1%
-0.4%-0.6% -0.6% -0.6% -0.6%
-2.5%
-2.0%
-1.5%
-1.0%
-0.5%
0.0%KY CT AZ GA IN NV RI MI DE FL OH AK

157
Labor Market Trends
Massive Job Losses Sapped the Economy and Commercial/Personal
Lines Exposure, But Trend is Improving

158
Unemployment and Underemployment Rates: Rocketed Up in 2008-09; Stabilizing in 2010?
2
4
6
8
10
12
14
16
18
Jan 00 Jan 01 Jan 02 Jan 03 Jan 04 Jan 05 Jan 06 Jan 07 Jan 08 Jan 09 Jan 10
Traditional Unemployment Rate U-3
Unemployment + Underemployment Rate U-6
Jul10
Unemployment rate was 9.5% in
July
Unemployment peaked at 10.1%
in Oct. 2009, highest monthly rate since 1983.
Peak rate in the last 30 years: 10.8% in Nov -
Dec 1982
Source: US Bureau of Labor Statistics; Insurance Information Institute.
U-6 went from 8.0% in March
2007 to 17.5% in Oct 2009; Stood at 16.5% in July
2010
January 2000 through July 2010, Seasonally Adjusted (%)
Recession ended in
November 2001
Unemployment kept rising for
19 more months
Recession began in
December 2007

159
US Unemployment Rate
4.5
%
4.5
%
4.6
%
4.8
%
4.9
% 5.4
% 6.1
%
6.9
%
8.1
%
9.3
%
9.6
% 10
.0%
9.7
%
9.6
%
9.6
%
9.4
%
9.2
%
9.0
%
8.8
%9.5
%
4.0%
5.0%
6.0%
7.0%
8.0%
9.0%
10.0%
11.0%
07
:Q1
07
:Q2
07
:Q3
07
:Q4
08
:Q1
08
:Q2
08
:Q3
08
:Q4
09
:Q1
09
:Q2
09
:Q3
09
:Q4
10
:Q1
10
:Q2
10
:Q3
10
:Q4
11
:Q1
11
:Q2
11
:Q3
11
:Q4
Rising unemployment eroded payrolls
and workers comp’s exposure base.
Unemployment likely peaked at 10% in late 2009.
* = actual; = forecastsSources: US Bureau of Labor Statistics; Blue Chip Economic Indicators (7/10); Insurance Information Institute
2007:Q1 to 2011:Q4F*
Unemployment forecasts remain stubbornly high
through 2011
161
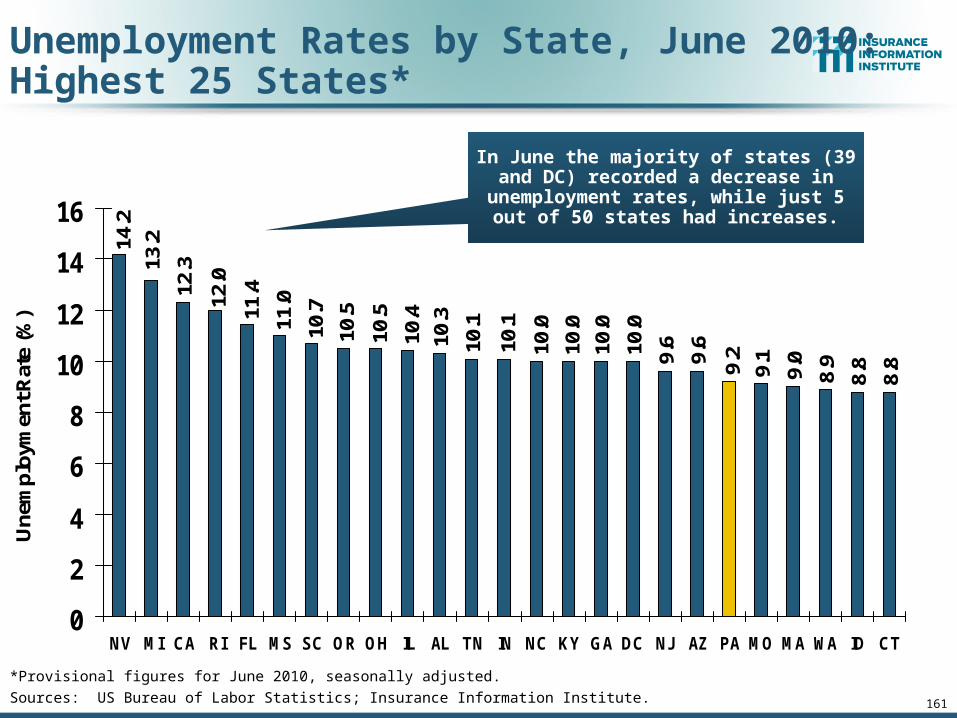
Unemployment Rates by State, June 2010:Highest 25 States*
10.0
10.0
10.1
10.0
10.0
10.1
9.2
9.0
9.1
8.89.
6
8.8
8.99.
610.711
.4
10.3
10.4
10.5
10.511
.0
13.2
12.3
12.0
14.2
0
2
4
6
8
10
12
14
16
NV MI CA RI FL MS SC OR OH IL AL TN IN NC KY GA DC NJ AZ PA MO MA WA ID CT
Une
mpl
oym
ent R
ate
(%)
*Provisional figures for June 2010, seasonally adjusted.
Sources: US Bureau of Labor Statistics; Insurance Information Institute.
In June the majority of states (39 and DC) recorded a decrease in unemployment rates, while just 5 out of 50 states had
increases.

162
6.8
6.5
6.3
6.0
6.8
6.87.
17.
2
4.54.
85.
9
7.0
7.0
3.6
6.8
8.08.2
7.37.57.
97.
98.08.
5
8.2
8.28.
5
0
2
4
6
8
10
WV DE TX NY NM ME CO WI AK AR MT UT MD VA LA WY OK MN IA KS HI VT NH NE SD ND
Une
mpl
oym
ent R
ate
(%)
Unemployment Rates By State, June 2010: Lowest 25 States*
*Provisional figures for June 2010, seasonally adjusted.Sources: US Bureau of Labor Statistics; Insurance Information Institute.
In June the majority of states (39 and DC) recorded a decrease in unemployment rates, while just 5 out of 50 states had
increases.

163
Monthly Change Employment*-7
2
-14
4-1
22
-16
0-1
37
-16
1
-12
8-1
75
-32
1
-38
0-5
97
-68
1-7
79
-72
6
-75
3-5
28 -3
87
-51
5 -34
6 -21
2-2
25
-22
46
4
-10
9
14 39
20
8 31
3 43
2
-22
1-1
31
-1,000
-800
-600
-400
-200
0
200
400
600
Jan
08
Fe
b 0
8
Ma
r 0
8
Ap
r 0
8M
ay
08
Jun
08
Jul 0
8
Au
g 0
8
Se
p 0
8O
ct 0
8
No
v 0
8
De
c 0
8Ja
n 0
9
Fe
b 0
9M
ar
09
Ap
r 0
9
Ma
y 0
9Ju
n 0
9
Jul 0
9A
ug
09
Se
p 0
9
Oct
09
No
v 0
9
De
c 0
9
Jan
10
Fe
b 1
0
Ma
r 1
0A
pr
10
Ma
y 1
0
Jun
10
Jul 1
0
Monthly Losses in Dec. 08–Mar. 09 Were
the Largest in the Post-WW II Period
*Estimate based on Reuters poll of economists.Source: US Bureau of Labor Statistics: http://www.bls.gov/ces/home.htm; Insurance Information Institute
Job Losses Since the Recession Began in Dec. 2007 Peaked at 8.4 Mill in Dec. 09; Stands at 7.7 Million Through June 2010;
14.6 Million People are Now Defined as Unemployed
January 2008 through July 2010* (Thousands)
May’s gain of 432,000 jobs was distorted by the hiring of 411,000 temporary Census workers. Census job losses totaled 225,000 in June and
143,000 in July, distorting figures in both months. Private sector employment was up 31,000 in May,
51,000 in June and 71,000 in July.

Insurance Industry Employment Trends: 1990-2010
Robert P. Hartwig, Ph.D., CPCU, President & EconomistInsurance Information Institute 110 William Street New York, NY 10038
Tel: 212.346.5520 Cell: 917.453.1885 [email protected] www.iii.org

173
Insurance Industry Employment Trends
Soft Market, Difficult Economy, Outsourcing, Productivity
Enhancements and Consolidation Have Contributed
to Industry’s Job Losses
174
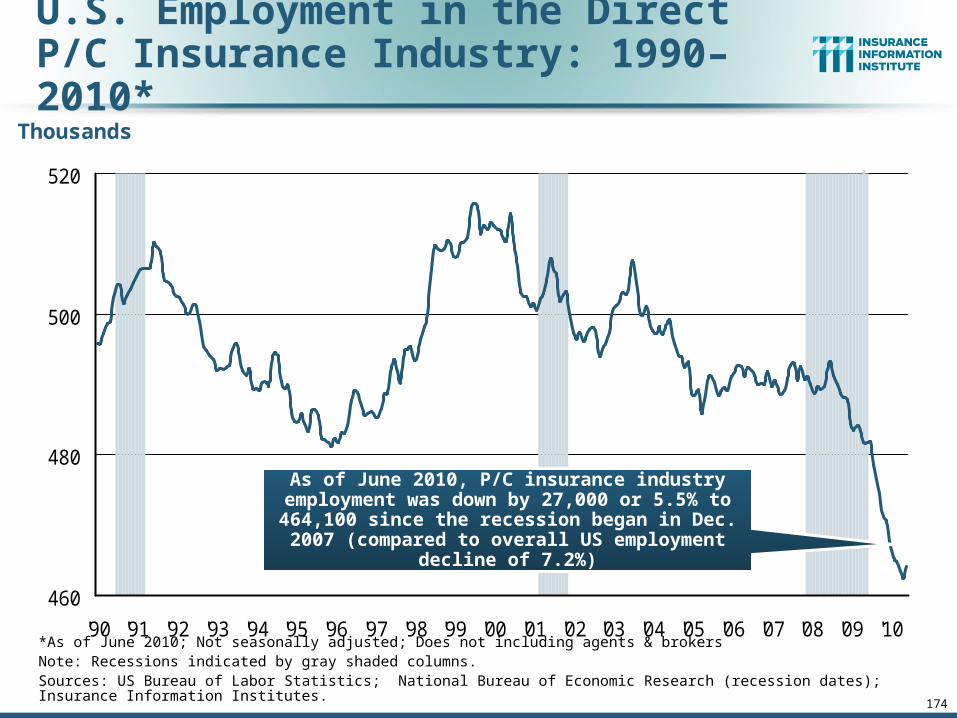
U.S. Employment in the DirectP/C Insurance Industry: 1990–2010*
*As of June 2010; Not seasonally adjusted; Does not including agents & brokersNote: Recessions indicated by gray shaded columns.Sources: US Bureau of Labor Statistics; National Bureau of Economic Research (recession dates); Insurance Information Institutes.
Thousands
460
480
500
520
'90 '91 '92 '93 '94 '95 '96 '97 '98 '99 '00 '01 '02 '03 '04 '05 '06 '07 '08 '09 '10
As of June 2010, P/C insurance industry employment was down by 27,000 or 5.5% to 464,100 since the
recession began in Dec. 2007 (compared to overall US employment decline of 7.2%)

175
U.S. Employment in the DirectLife Insurance Industry: 1990–2010*
*As of June 2010; Not seasonally adjusted; Does not including agents & brokersNote: Recessions indicated by gray shaded columns.Sources: US Bureau of Labor Statistics; National Bureau of Economic Research (recession dates); Insurance Information Institutes.
Thousands
300
325
350
375
400
425
450
475
500
525
550
575
'90 '91 '92 '93 '94 '95 '96 '97 '98 '99 '00 '01 '02 '03 '04 '05 '06 '07 '08 '09 '10
As of June 2010, Life insurance industry employment was down by 9,300 or 2.6% to 345,000 since the recession began in
Dec. 2007 (compared to overall US employment decline of 7.2%)

176
U.S. Employment in the Direct Health-Medical Insurance Industry: 1990–2010*
*As of June 2010; Not seasonally adjusted; Does not including agents & brokersNote: Recessions indicated by gray shaded columns.Sources: US Bureau of Labor Statistics; National Bureau of Economic Research (recession dates); Insurance Information Institutes.
Thousands
175
200
225
250
275
300
325
350
375
400
425
450
'90 '91 '92 '93 '94 '95 '96 '97 '98 '99 '00 '01 '02 '03 '04 '05 '06 '07 '08 '09 '10
As of June 2010, Health-Medical insurance industry employment was
down by 7,300 or 1.7% to 434,600 since the recession began in Dec.
2007 (compared to overall US employment decline of 7.2%)
177
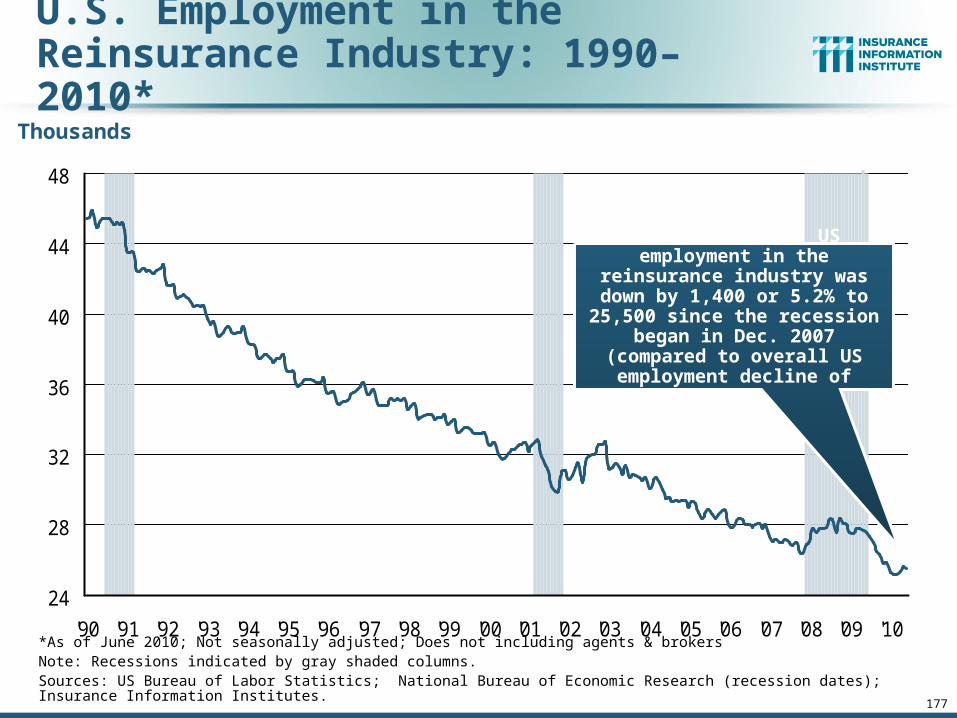
U.S. Employment in the Reinsurance Industry: 1990–2010*
Thousands
24
28
32
36
40
44
48
'90 '91 '92 '93 '94 '95 '96 '97 '98 '99 '00 '01 '02 '03 '04 '05 '06 '07 '08 '09 '10*As of June 2010; Not seasonally adjusted; Does not including agents & brokersNote: Recessions indicated by gray shaded columns.Sources: US Bureau of Labor Statistics; National Bureau of Economic Research (recession dates); Insurance Information Institutes.
As of June 2010, US employment in the reinsurance industry was down by 1,400 or 5.2% to 25,500
since the recession began in Dec. 2007 (compared to overall US employment decline of 7.2%)

178
U.S. Employment in Insurance Agencies & Brokerages: 1990–2010*
Thousands
500
550
600
650
700
'90 '91 '92 '93 '94 '95 '96 '97 '98 '99 '00 '01 '02 '03 '04 '05 '06 '07 '08 '09 '10*As of June 2010; Not seasonally adjusted. Includes all types of insurance.Note: Recessions indicated by gray shaded columns.Sources: US Bureau of Labor Statistics; National Bureau of Economic Research (recession dates); Insurance Information Institutes.
As of June 2010, employment at insurance agencies and
brokerages was down by 48,800 or 7.2% to 630,800 since the
recession began in Dec. 2007 (compared to overall US
employment decline of 7.2%)

179
U.S. Employment in Insurance Claims Adjusting: 1990–2010*
Thousands
40
45
50
55
60
Jan-
90
Sep
-90
May
-91
Jan-
92
Sep
-92
May
-93
Jan-
94
Sep
-94
May
-95
Jan-
96
Sep
-96
May
-97
Jan-
98
Sep
-98
May
-99
Jan-
00
Sep
-00
May
-01
Jan-
02
Sep
-02
May
-03
Jan-
04
Sep
-04
May
-05
Jan-
06
Sep
-06
May
-07
Jan-
08
Sep
-08
May
-09
Jan-
10
*As of June 2010; Not seasonally adjusted.Note: Recessions indicated by gray shaded columns.Sources: US Bureau of Labor Statistics; National Bureau of Economic Research (recession dates); Insurance Information Institutes.
As of June 2010, claims adjusting employment was down by 8,500 or 16.3%
to 43,500 since the recession began in Dec. 2007 (compared to overall US
employment decline of 7.2%)
Katrina, Rita, Wilma

Crisis-Driven Exposure Drivers
181
Economic Obstaclesto Growth in P/C Insurance

182
16.9
16.5
16.1
13.1
10.3
11.7
13.1
16.9
16.617
.117.5
17.8
17.4
9
10
11
12
13
14
15
16
17
18
19
99 00 01 02 03 04 05 06 07 08 09 10F 11F
(Millions of Units)
Auto/Light Truck Sales, 1999-2011F
Source: U.S. Department of Commerce; Blue Chip Economic Indicators (7/10); Insurance Information Institute.
Car/Light Truck Sales Will Recover from the 2009 Low Point, but High Unemployment, Tight Credit Are Still Restraining Sales;
Gas Prices Could Once Again Become a Factor, Too
New auto/light truck sales fell to the lowest level since the late 1960s. Forecast for
2010-11 is still far below 1999-2007 average of 17
million units
Sharply lower auto sales will have a smaller effect on auto insurance
exposure level than problems in the housing market will on home insurers
“Cash for Clunkers” generated about $300M in net new personal auto premiums
183
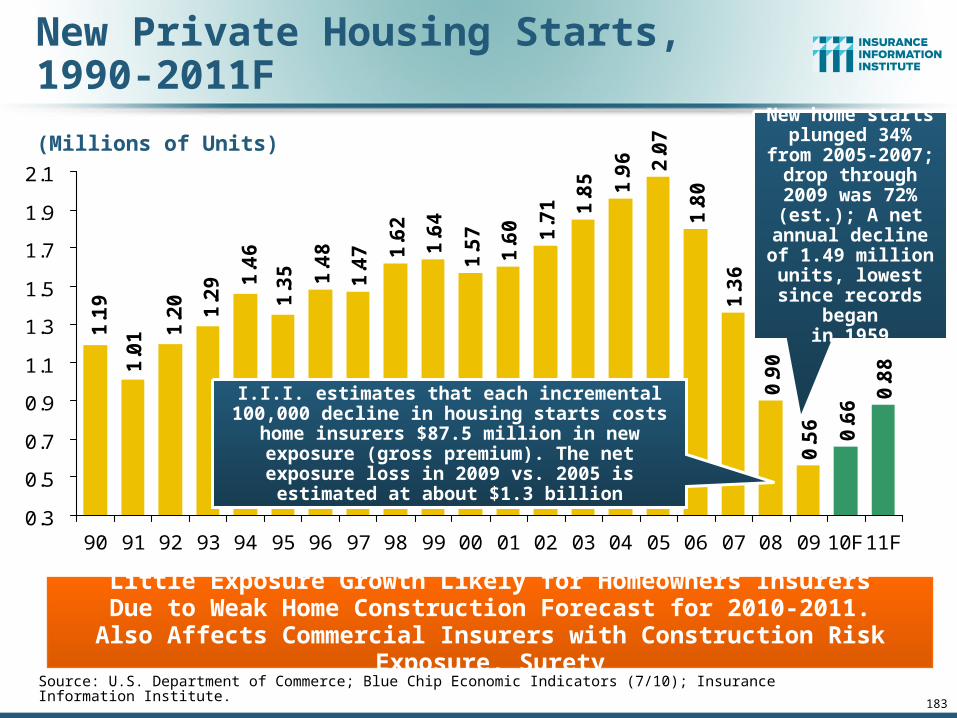
(Millions of Units)
New Private Housing Starts, 1990-2011F
1.4
8
1.4
7 1.6
2
1.6
4
1.5
7
1.6
0 1.7
1 1.8
5 1.9
6 2.0
7
1.8
0
1.3
6
0.9
0
0.5
6 0.6
6
0.8
8
1.3
51.4
6
1.2
9
1.2
0
1.0
11.1
9
0.3
0.5
0.7
0.9
1.1
1.3
1.5
1.7
1.9
2.1
90 91 92 93 94 95 96 97 98 99 00 01 02 03 04 05 06 07 08 09 10F11F
Source: U.S. Department of Commerce; Blue Chip Economic Indicators (7/10); Insurance Information Institute.
Little Exposure Growth Likely for Homeowners InsurersDue to Weak Home Construction Forecast for 2010-2011.
Also Affects Commercial Insurers with Construction Risk Exposure, Surety
New home starts plunged 34% from 2005-2007; drop
through 2009 was 72% (est.); A net annual decline of 1.49 million units,
lowest since records began
in 1959
I.I.I. estimates that each incremental 100,000 decline in housing starts costs home insurers
$87.5 million in new exposure (gross premium). The net exposure loss in 2009 vs. 2005 is
estimated at about $1.3 billion
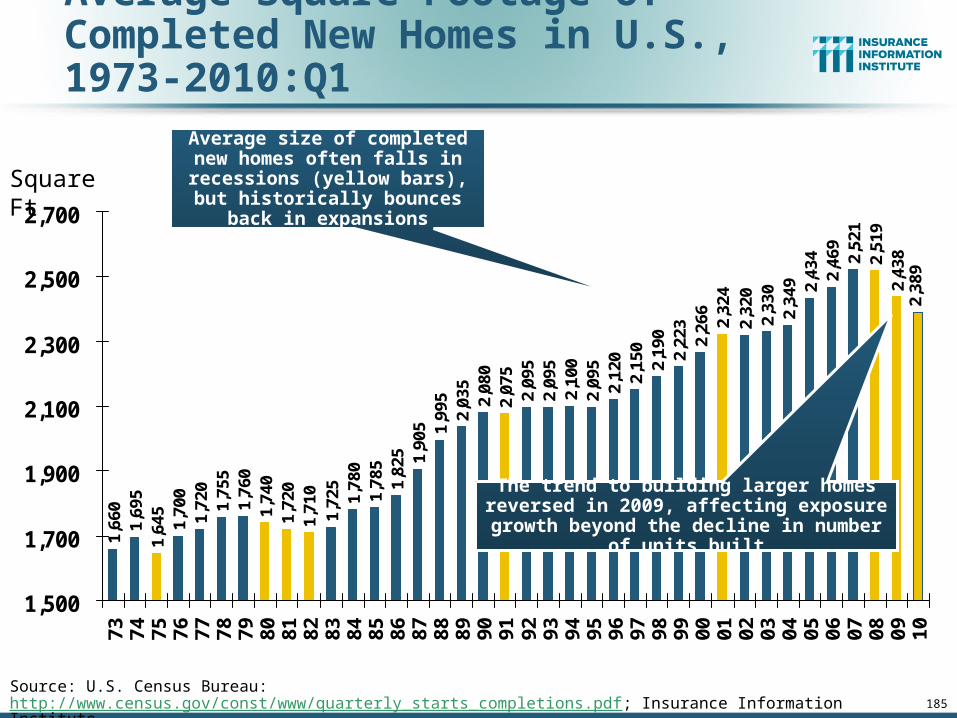
Average Square Footage of Completed New Homes in U.S., 1973-2010:Q1
1,66
01,
695
1,64
51,
700
1,72
01,
755
1,76
01,
740
1,72
01,
710
1,72
51,
780
1,78
51,
825 1,90
5 1,99
52,
035
2,08
02,
075
2,09
52,
095
2,10
02,
095
2,12
02,
150
2,19
02,
223
2,26
62,
324
2,32
02,
330
2,34
9 2,43
42,
469
2,52
12,
519
2,43
82,
389
1,500
1,700
1,900
2,100
2,300
2,500
2,700
73 74 75 76 77 78 79 80 81 82 83 84 85 86 87 88 89 90 91 92 93 94 95 96 97 98 99 00 01 02 03 04 05 06 07 08 09 10
Source: U.S. Census Bureau: http://www.census.gov/const/www/quarterly_starts_completions.pdf; Insurance Information Institute.
Square Ft
The trend to building larger homes reversed in 2009, affecting exposure growth beyond
the decline in number of units built
Average size of completed new homes often falls in recessions (yellow bars), but historically bounces back in expansions
185

188
43,6
9448
,125
69,3
0062
,436
64,0
04 71,2
77 81,2
3582
,446
63,8
5363
,235
64,8
5371
,549
70,6
4362
,304
52,3
7451
,959
53,5
4954
,027
44,3
6737
,884
35,4
7240
,099
38,5
4035
,037
34,3
1739
,201
19,6
95 28,3
2243
,546
60,8
3714
,607
0
10,000
20,000
30,000
40,000
50,000
60,000
70,000
80,000
90,000
80 81 82 83 84 85 86 87 88 89 90 91 92 93 94 95 96 97 98 99 00 01 02 03 04 05 06 07 08 0910
:Q1
Business Bankruptcy Filings,1980-2010:Q1
Source: American Bankruptcy Institute; Insurance Information Institute
Significant Exposure Implications for All Commercial Lines
There were 60,837 business bankruptcies in 2009, up 40% from 2008 and the most since 1993. 2010:Q1 bankruptcies totaled 14,607, up 18% from Q1:2009
% Change Surrounding Recessions
1980-82 58.6%1980-87 88.7%1990-91 10.3%2000-01 13.0%2006-09 208.9%*

189
Private Sector Business Starts,1993:Q2 – 2009:Q3*
175
186
174
180
186
192
188
187 18
918
6 190 19
419
119
9 204
202
195
196
196
206
206
201
192
198
206
206
203
211
205
212
200 20
520
420
419
720
320
920
1
192
192
193
201 20
420
221
0 212
209
216 22
0 223
220
220
210
221
212
204
218
209
207
199
191 19
317
117
716
9
203
150
160
170
180
190
200
210
220
230
93 94 95 96 97 98 99 00 01 02 03 04 05 06 07 08 09
Business Starts Are Down Nearly 20% in the Current Downturn, Holding Back Most Types of Commercial Insurance Exposure
*Latest available as of June 7, 2010, seasonally adjustedSource: Bureau of Labor Statistics, http://www.bls.gov/news.release/cewbd.t07.htm.
(Thousands)
169,000 businesses started in 2009:Q3, actually declining during
form the prior quarter. The figure is the lowest level since 1993.
193
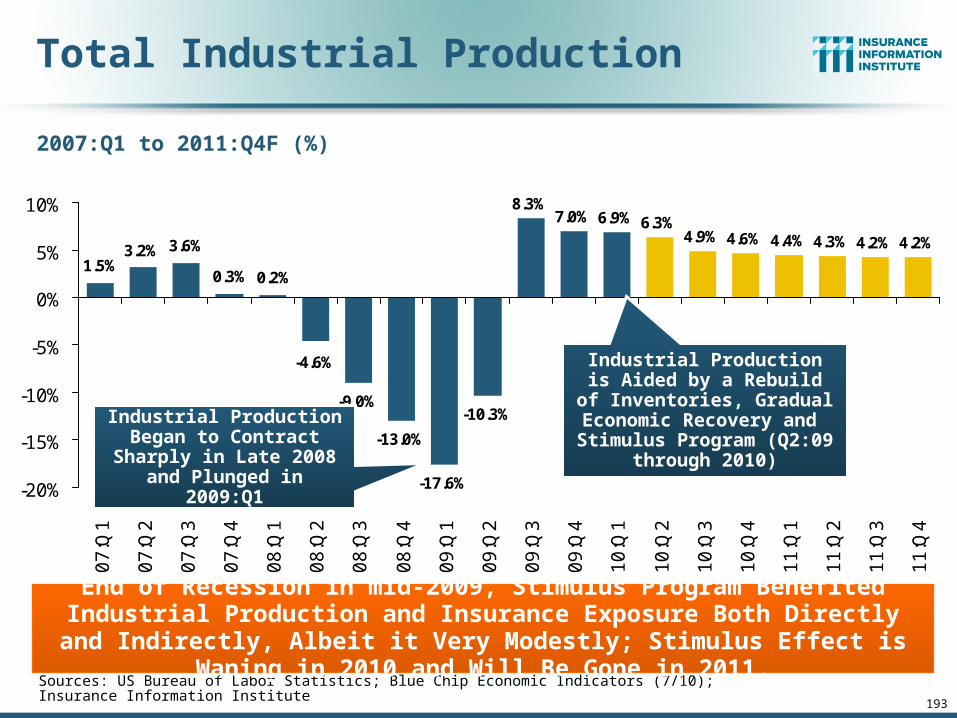
Total Industrial Production
Sources: US Bureau of Labor Statistics; Blue Chip Economic Indicators (7/10); Insurance Information Institute
-9.0%
-13.0%
-17.6%
-10.3%
8.3%7.0% 6.9% 6.3%
4.9% 4.6% 4.4% 4.3% 4.2% 4.2%
1.5%3.2% 3.6%
0.3% 0.2%
-4.6%
-20%
-15%
-10%
-5%
0%
5%
10%
07
:Q1
07
:Q2
07
:Q3
07
:Q4
08
:Q1
08
:Q2
08
:Q3
08
:Q4
09
:Q1
09
:Q2
09
:Q3
09
:Q4
10
:Q1
10
:Q2
10
:Q3
10
:Q4
11
:Q1
11
:Q2
11
:Q3
11
:Q4
End of Recession in mid-2009, Stimulus Program Benefited Industrial Production and Insurance Exposure Both Directly and Indirectly, Albeit it
Very Modestly; Stimulus Effect is Waning in 2010 and Will Be Gone in 2011.
2007:Q1 to 2011:Q4F (%)
Industrial Production is Aided by a Rebuild of Inventories, Gradual Economic Recovery
and Stimulus Program (Q2:09 through 2010)
Industrial Production Began to Contract Sharply in Late 2008 and Plunged
in 2009:Q1

66%
68%
70%
72%
74%
76%
78%
80%
82%
Ma
r 0
1
Ju
n 0
1
Se
p 0
1
De
c 0
1
Ma
r 0
2
Ju
n 0
2
Se
p 0
2
De
c 0
2
Ma
r 0
3
Ju
n 0
3
Se
p 0
3
De
c 0
3
Ma
r 0
4
Ju
n 0
4
Se
p 0
4
De
c 0
4
Ma
r 0
5
Ju
n 0
5
Se
p 0
5
De
c 0
5
Ma
r 0
6
Ju
n 0
6
Se
p 0
6
De
c 0
6
Ma
r 0
7
Ju
n 0
7
Se
p 0
7
De
c 0
7
Ma
r 0
8
Ju
n 0
8
Se
p 0
8
De
c 0
8
Ma
r 0
9
Ju
n 0
9
Se
p 0
9
De
c 0
9
Ma
r 1
0
Recovery in Capacity Utilization is a Positive Sign for Energy & Insurance
Source: Federal Reserve Board statistical releases at http://www.federalreserve.gov/releases/g17/Current/default.htm. 194
Percent of Manufacturing Capacity
Hurricane Katrina
March 2001-November 2001
recession
“Full Capacity”
The closer the economy is to operating at “full
capacity,” the greater the demand for insurance
Manufacturing capacity stood at
74.7% in May 2010, above the June 2009 low of 68.3% but well below the pre-crisis
peak of 80%+
Recession began December 2007

197
Year-Over-Year Change in Quarterly USState Tax Revenues, Inflation Adjusted
Source: US Census Bureau; Nelson A. Rockefeller Institute of Government: http://www.rockinst.org/.
2.4
%4
.7%
5.6
% 9.9
%9
.5%
4.4
%1
.8%
0.4
%-1
.3%
-1.7
%-3
.0%
-7.6
%-1
0.7
%0
.0%
1.6
%-0
.6%
0.1
% 4.0
%4
.7%
5.7
% 8.2
%3
.4% 6.0
%7
.0%
12
.4%
6.6
%4
.2%
3.7
% 6.3
%2
.6%
1.3
%3
.2% 5.5
%3
.1%
3.6
%2
.6% 5.4
%2
.8%
-3.9
%
-10
.9%
-4.1
%
-16
.4%-11
.6%
2.4
%
-25%
-20%
-15%
-10%
-5%
0%
5%
10%
15%
20%
1Q
99
2Q
99
3Q
99
4Q
99
1Q
00
2Q
00
3Q
00
4Q
00
1Q
01
2Q
01
3Q
01
4Q
01
1Q
02
2Q
02
3Q
02
4Q
02
1Q
03
2Q
03
3Q
03
4Q
03
1Q
04
2Q
04
3Q
04
4Q
04
1Q
05
2Q
05
3Q
05
4Q
05
1Q
06
2Q
06
3Q
06
4Q
06
1Q
07
2Q
07
3Q
07
4Q
07
1Q
08
2Q
08
3Q
08
4Q
08
1Q
09
2Q
09
3Q
09
4Q
09
States Revenues Were Down 4.4% in Q4 2009, the 5th Consecutive Quarter of Revenue Decline. This Will Impact Public Infrastructure
Spending Significantly and Related Insurance Exposures and Demand.
Nationwide, state-tax collections for fiscal year 2009 declined by a record
$63 billion, or 8.2 percent from the previous year. That loss is roughly twice the amount states gained in fiscal relief
from the federal stimulus package

200
Mounting Pressure on Claim Cost Severities?
Inflation Trends:Concerns Over Stimulus Spending
and Monetary Policy

201
Annual Inflation Rates(CPI-U, %), 1990–2011F
2.8 2.6
1.51.9
3.3 3.4
1.3
2.5 2.3
3.0
3.8
2.8
3.8
-0.4
1.7 1.5
2.92.4
3.23.0
5.14.9
-1.0
0.0
1.0
2.0
3.0
4.0
5.0
6.0
90 91 92 93 94 95 96 97 98 99 00 01 02 03 04 05 06 07 08 09 10F11F
Sources: US Bureau of Labor Statistics; Blue Chip Economic Indicators, July 10, 2010 (forecasts).
There is So Much Slack in the US Economy Inflation Should Not Be a Concern Through 2010/11, but Deficits and Monetary Policy Remain Longer
Run Concerns
Annual Inflation Rates (%) Inflation peaked at 5.6% in August 2008 on high energy and commodity crisis. The recession and the collapse of the
commodity bubble have reduced inflationary pressures

P/C Insurers Experience Inflation More Intensely than 2009 CPI Suggests
Source: CPI is Blue Chip Economic Indicator 2009 estimate, 12/09; Legal services, medical care and motor vehicle body work are avg. monthly year-over-year change from BLS; BI and no-fault figures from ISO Fast Track data for 4 quarters ending 09:Q3. Tort costs is 2009 Towers-Perrin estimate. WC figure is I.I.I. estimate based on historical NCCI data.
-0.4%
2.7% 3.0% 3.1%3.8%
4.3%
5.5%6.2%
-2%
0%
2%
4%
6%
8%
OverallCPI
LegalServices
US TortCosts
MedicalCare
MotorVehicleBodyWork
BodilyInjury
Severity
WC MedSeverity
No-FaultClaim
Severity
(Percent)
Healthcare and Legal/Tort Costs Are a Major P/C Insurance Cost Driver. These Are Expected to Increase Above the Overall Inflation Rate (CPI) Indefinitely
202
213
Catastrophic Loss –Catastrophe Losses Trends Are
Trending Adversely

214
$8
.3
$7
.4
$2
.6 $1
0.1
$8
.3
$4
.6
$2
6.5
$5
.9 $1
2.9 $
27
.5
$6
1.9
$9
.2
$6
.7
$2
7.1
$1
0.6
$6
.1
$1
00
.0
$7
.5
$2
.7
$4
.7
$2
2.9
$5
.5 $1
6.9
$0
$20
$40
$60
$80
$100
$120
89 90 91 92 93 94 95 96 97 98 99 00 01 02 03 04 05 06 07 08 09 10*20??
US Insured Catastrophe Losses
*Through June 30, 2010.Note: 2001 figure includes $20.3B for 9/11 losses reported through 12/31/01. Includes only business and personal property claims, business interruption and auto claims. Non-prop/BI losses = $12.2B.Sources: Property Claims Service/ISO; Munich Re; Insurance Information Institute.
2010 CAT Losses Are Running Below 2009, So Far Figures Do Not Include an Estimate of Deepwater Horizon Loss
$100 Billion CAT Year is Coming Eventually
First Half 2010 CAT
Losses Were Down 19% or $1.4B from
first half 2009
($ Billions)
2000s: A Decade of Disaster
2000s: $193B (up 117%)
1990s: $89B

Geophysical events(earthquake, tsunami, volcanic activity)
Meteorological events (storm)
Hydrological events(flood, mass movement)
Climatological events(extreme temperature, drought, wildfire)
Selection of significant natural catastrophes (see table)
© 2010 Münchener Rückversicherungs-Gesellschaft, Geo Risks Research, NatCatSERVICE – As at 16 June 2010
Global natural catastrophes
1
2
3
4
5
7
6
8 911 10
12
Severe winter weather in the Eastern US produced insured
losses of produced at least $1B in insured losses and $2B
in economic losses
The 12 Jan. Haiti quake killed 225,500 people, caused $8B+ in economic damage, but little in the way of
insured losses
Chilean earthquake (mag. 8.8) on 27 Feb. produced at least $4 billion in insured losses, $20
billion in economic losses. Most costly insurance event in 2010
Winter Storm Xynthia produced
at least $2B in insured losses
and $4B in economic losses
Global Natural Catastrophes: January – June 2010
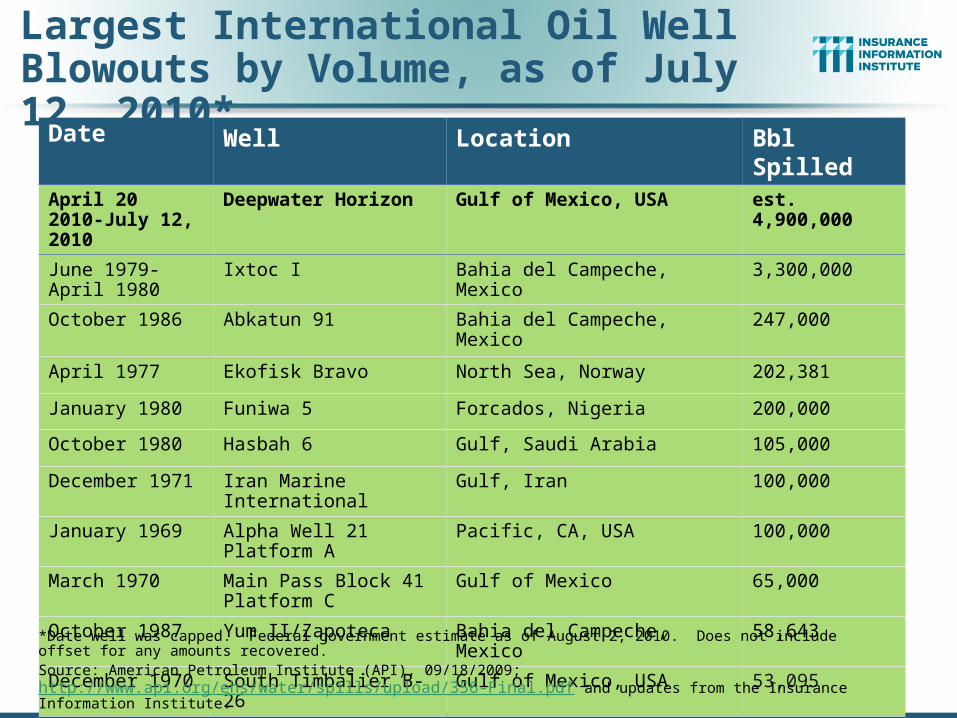
Largest International Oil Well Blowouts by Volume, as of July 12, 2010*
Date Well Location Bbl Spilled
April 20 2010-July 12, 2010
Deepwater Horizon Gulf of Mexico, USA est. 4,900,000
June 1979-April 1980
Ixtoc I Bahia del Campeche, Mexico 3,300,000
October 1986 Abkatun 91 Bahia del Campeche, Mexico 247,000
April 1977 Ekofisk Bravo North Sea, Norway 202,381
January 1980 Funiwa 5 Forcados, Nigeria 200,000
October 1980 Hasbah 6 Gulf, Saudi Arabia 105,000
December 1971 Iran Marine International Gulf, Iran 100,000
January 1969 Alpha Well 21 Platform A Pacific, CA, USA 100,000
March 1970 Main Pass Block 41 Platform C
Gulf of Mexico 65,000
October 1987 Yum II/Zapoteca Bahia del Campeche, Mexico 58,643
December 1970 South Timbalier B-26 Gulf of Mexico, USA 53,095
*Date well was capped. Federal government estimate as of August 2, 2010. Does not include offset for any amounts recovered.
Source: American Petroleum Institute (API), 09/18/2009; http://www.api.org/ehs/water/spills/upload/356-Final.pdf and updates from the Insurance Information Institute.

*Forecast as of June 2, 2010.Source: Colorado State University, Department of Atmospheric Sciences; Insurance Information Institute.
Probabilty of Landfall of at Least One Major Hurricane (CAT 3-4-5) in 2010*
The Probability of a Major Hurricane Making Landfall Somewhere Along the US Coast is Greatly Elevated in 2010, Including a 50%
Chance Along the Oil Spill-Impacted Gulf Coast
Region Average Over Last Century
2010 Forecast*
Entire U.S. Coastline 52% 76%
U.S. East Coast Incl. FL Peninsula
31% 51%
Gulf Coast from FL Panhandle to Brownsville, TX
30% 50%
Caribbean 42% 65%

50
100
150
200
250
1980 1982 1984 1986 1988 1990 1992 1994 1996 1998 2000 2002 2004 2006 2008 2010
First Half 201095 Events
Number of events in first half of 2010 is close to the annual totals from five of past ten years.
Nu
mb
er
Geophysical (earthquake, tsunami, volcanic activity)
Climatological (temperature extremes, drought, wildfire)
Meteorological (storm)
Hydrological (flood, mass movement)
Natural Disasters in the United States, 1980 – 2010Number of Events (Annual Totals 1980 – 2009 vs. First Half 2010)
Source: MR NatCatSERVICE 219© 2010 Munich Re
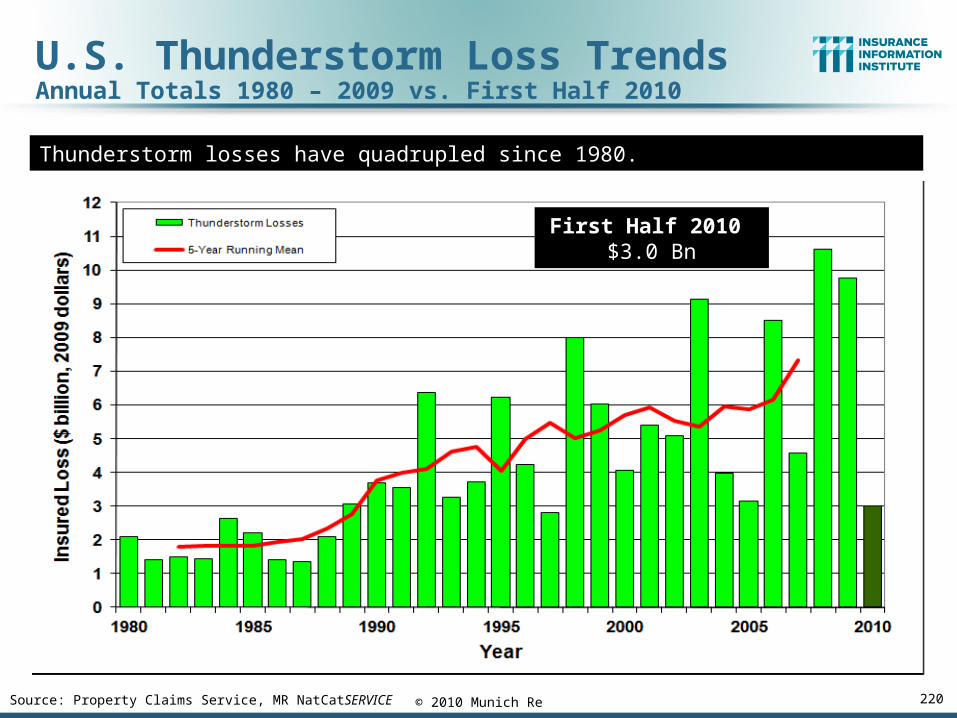
Thunderstorm losses have quadrupled since 1980.
First Half 2010 $3.0 Bn
U.S. Thunderstorm Loss TrendsAnnual Totals 1980 – 2009 vs. First Half 2010
Source: Property Claims Service, MR NatCatSERVICE 220© 2010 Munich Re

Source: Property Claims Service, MR NatCatSERVICE 221© 2010 Munich Re
Average annual winter storm losses have increased over 50% since 1980.
First Half 2010 $2.4 Bn
U.S. Winter Storm Loss TrendsAnnual totals 1980 – 2009 vs. First Half 2010
Severe winter storms in early 2010 caused major
damage to energy infrastructure

224
Top 12 Most Costly Disastersin US History
(Insured Losses, 2009, $ Billions)
Sources: PCS; Insurance Information Institute inflation adjustments.
$11.3 $12.5
$18.2$22.8 $23.8
$45.3
$8.5$8.1$7.3$6.2$5.2$4.2
$0$5
$10$15$20$25$30$35$40$45$50
Jeanne(2004)
Frances(2004)
Rita (2005)
Hugo(1989)
Ivan (2004)
Charley(2004)
Wilma(2005)
Ike (2008)
Northridge(1994)
9/11Attacks(2001)
Andrew(1992)
Katrina(2005)
8 of the 12 Most Expensive Disasters in US History Have Occurred Since 2004;
8 of the Top 12 Disasters Affected FL
Hurricane Katrina Remains, By Far, the Most Expensive Insurance Event in US
and World History
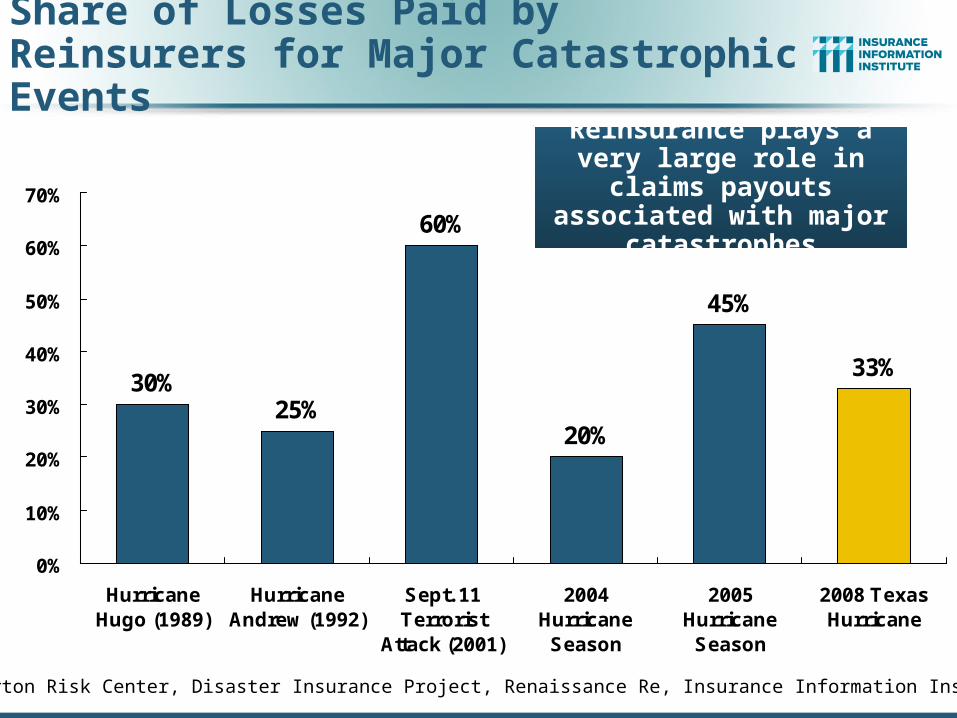
Share of Losses Paid by Reinsurers for Major Catastrophic Events
30%25%
60%
20%
45%
33%
0%
10%
20%
30%
40%
50%
60%
70%
HurricaneHugo (1989)
HurricaneAndrew (1992)
Sept. 11Terrorist
Attack (2001)
2004Hurricane
Season
2005Hurricane
Season
2008 TexasHurricane
Source: Wharton Risk Center, Disaster Insurance Project, Renaissance Re, Insurance Information Institute.
Reinsurance plays a very large role in claims payouts
associated with major catastrophes
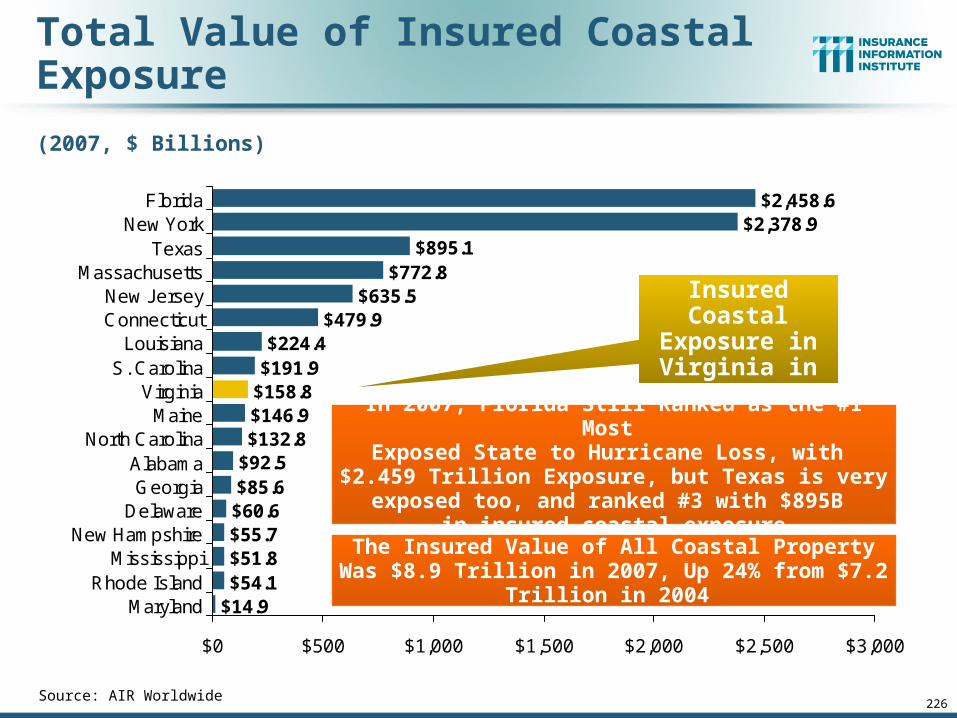
226
Total Value of Insured Coastal Exposure
(2007, $ Billions)
Source: AIR Worldwide
$224.4$191.9
$158.8$146.9$132.8
$92.5$85.6$60.6$55.7$51.8$54.1
$14.9
$479.9$635.5
$772.8$895.1
$2,378.9$2,458.6
$0 $500 $1,000 $1,500 $2,000 $2,500 $3,000
FloridaNew York
TexasMassachusetts
New JerseyConnecticut
LouisianaS. Carolina
VirginiaMaine
North CarolinaAlabamaGeorgia
DelawareNew Hampshire
MississippiRhode Island
Maryland
$159B Insured Coastal
Exposure in Virginia in 2007
In 2007, Florida Still Ranked as the #1 Most Exposed State to Hurricane Loss, with
$2.459 Trillion Exposure, but Texas is very exposed too, and ranked #3 with $895B
in insured coastal exposure
The Insured Value of All Coastal Property Was $8.9 Trillion in 2007, Up 24% from $7.2 Trillion in 2004

www.iii.org
Thank you for your timeand your attention!
Twitter: twitter.com/bob_hartwig
Insurance Information Institute Online: