Key Indices 30-Sep-12 31-Aug-12 % Change Rs v/s USD
34
Key Indices 30-Sep-12 31-Aug-12 % Change Nifty 5703.30 5258.50 8.46% Sensex 18762.74 17429.56 7.65% BSE 100 5701.39 5251.07 8.58% Dow Jones 13437.13 13090.84 2.65% Nikkei 8870.16 8839.91 0.34% Hang Seng 20840.38 19482.57 6.97% Nasdaq 3116.23 3066.97 1.61% KOSPI 1996.21 1905.12 4.78% On the macro front, there are signs of improvement. The first quarter current account deficit (CAD) narrowed to 3.9% of GDP from 4.5% in Q4FY12 because of an improved trade balance and steady remittances. The government has maintained its borrowing target at Rs.2 trillion, hoping that the divestment program as well as the telecom spectrum sale goes through. An expected urea price hike could further reduce the subsidy burden and improve the fiscal. Inflation figures of August 2012, however, came as a surprise. At 7.6%, inflation was 70 bps higher than the previous reading of 6.9%. Core inflation, which had been reasonably subdued till now, rose to 5.6%. In spite of this, RBI in its policy meeting on Sep 17th 2012 decided to cut the CRR by 25 bps though it left the benchmark repo rate unchanged. This move will infuse INR.17000 crores of liquidity in the system. Outlook for equities: Indian equities rallied 8% in September and outperformed the developed equity markets (US, Japan, Germany and France), which were down by almost 1%-3%. FIIs continued their equity buying with $3.8bn net purchases in September, taking the YTD net purchases to $16.1bn. DIIs continued to be net sellers to the extent of $7.2bn. Strong inflows become a case for a stronger currency leading to further FII flows due to positive sentiments, which builds’ up into positive circularity. The BSE Sensex, which has rallied smartly in the past couple of months, currently trades at a P/E of 14.5x one year forward earnings. For long term investors valuations are still attractive. Credible policy implementation from the government could result in the rally sustaining and gaining momentum. In the short to medium term, the market would also take cues from the upcoming results season and the RBI policy scheduled in this month. Market Outlook The Indian Government, after faltering for a couple of years on economic and policy decision-making, has come out and made aggressive policy changes. These include fuel price subsidy adjustments, allowing FDI in retail and aviations, announcing a SEB restructuring plan, reducing withholding tax on FII debt investments and committing to more aggressive PSU divestment. The markets welcomed the political resolve shown by the government even though it faced political opposition from its own allies in the ruling coalition. Continuing with its reform agenda the cabinet also cleared an increase in FDI limits in Insurance from 26% to 49% and allowed a 26% FDI investment in the Pension sector, both of which would require parliament approval. The proposed National Investment Board is another key reform step and would offer a single window of clearance for large infrastructure projects. If all this is accompanied with a lower interest rate regime, it would help push new investments, both in industry and infrastructure, as project level returns would increase. We expect investment cycle to recover in the second half of FY13, largely on improvement in public capex and the stabilising of private corporate capex. 4000 4500 5000 5500 6000 14000 16000 18000 20000 22000 Aug-11 Sep-11 Oct-11 Nov-11 Dec-11 Jan-12 Feb-12 Mar-12 Apr-12 May-12 Jun-12 Jul-12 Aug-12 Sep-12 Sensex Nifty (2500) (1500) (500) 500 1500 2500 3500 4500 5500 Aug 11 Sept 11 Oct 11 Nov 11 Dec 11 Jan 12 Feb 12 Mar 12 Apr 12 May 12 Jun 12 Jul 12 Aug 12 Sep 12 In US $ MN FII MF 42.00 44.00 46.00 48.00 50.00 52.00 54.00 56.00 58.00 Aug-11 Sep-11 Oct-11 Nov-11 Dec-11 Jan-12 Feb-12 Mar-12 Apr-12 May-12 Jun-12 Jul-12 Aug-12 Sep-12 Rs v/s USD
Transcript of Key Indices 30-Sep-12 31-Aug-12 % Change Rs v/s USD

Key Indices 30-Sep-12 31-Aug-12 % Change
Nifty 5703.30 5258.50 8.46%
Sensex 18762.74 17429.56 7.65%
BSE 100 5701.39 5251.07 8.58%
Dow Jones 13437.13 13090.84 2.65%
Nikkei 8870.16 8839.91 0.34%
Hang Seng 20840.38 19482.57 6.97%
Nasdaq 3116.23 3066.97 1.61%
KOSPI 1996.21 1905.12 4.78%
On the macro front, there are signs of improvement. The first quarter current account deficit (CAD) narrowed to 3.9% of GDP
from 4.5% in Q4FY12 because of an improved trade balance and steady remittances. The government has maintained its
borrowing target at Rs.2 trillion, hoping that the divestment program as well as the telecom spectrum sale goes through. An
expected urea price hike could further reduce the subsidy burden and improve the fiscal. Inflation figures of August 2012,
however, came as a surprise. At 7.6%, inflation was 70 bps higher than the previous reading of 6.9%. Core inflation, which had
been reasonably subdued till now, rose to 5.6%. In spite of this, RBI in its policy meeting on Sep 17th 2012 decided to cut the
CRR by 25 bps though it left the benchmark repo rate unchanged. This move will infuse INR.17000 crores of liquidity in the
system.
Outlook for equities:
Indian equities rallied 8% in September and outperformed the developed equity markets (US, Japan, Germany and France),
which were down by almost 1%-3%. FIIs continued their equity buying with $3.8bn net purchases in September, taking the YTD
net purchases to $16.1bn. DIIs continued to be net sellers to the extent of $7.2bn. Strong inflows become a case for a stronger
currency leading to further FII flows due to positive sentiments, which builds’ up into positive circularity.
The BSE Sensex, which has rallied smartly in the past couple of months, currently trades at a P/E of 14.5x one year forward
earnings. For long term investors valuations are still attractive. Credible policy implementation from the government could result
in the rally sustaining and gaining momentum. In the short to medium term, the market would also take cues from the upcoming
results season and the RBI policy scheduled in this month.
Market Outlook
The Indian Government, after faltering for a couple of years on economic and policy decision-making, has come out and made
aggressive policy changes. These include fuel price subsidy adjustments, allowing FDI in retail and aviations, announcing a SEB
restructuring plan, reducing withholding tax on FII debt investments and committing to more aggressive PSU divestment. The
markets welcomed the political resolve shown by the government even though it faced political opposition from its own allies in
the ruling coalition. Continuing with its reform agenda the cabinet also cleared an increase in FDI limits in Insurance from 26% to
49% and allowed a 26% FDI investment in the Pension sector, both of which would require parliament approval. The proposed
National Investment Board is another key reform step and would offer a single window of clearance for large infrastructure
projects. If all this is accompanied with a lower interest rate regime, it would help push new investments, both in industry and
infrastructure, as project level returns would increase. We expect investment cycle to recover in the second half of FY13, largely
on improvement in public capex and the stabilising of private corporate capex.
4000
4500
5000
5500
6000
14000
16000
18000
20000
22000A
ug
-11
Se
p-1
1
Oct
-11
No
v-1
1
De
c-1
1
Jan
-12
Fe
b-1
2
Ma
r-1
2
Ap
r-1
2
Ma
y-1
2
Jun
-12
Jul-
12
Au
g-1
2
Se
p-1
2
Sensex Nifty
(2500)
(1500)
(500)
500
1500
2500
3500
4500
5500
Aug 1
1
Se
pt
11
Oc
t 1
1
No
v 1
1
De
c 1
1
Ja
n 1
2
Fe
b 1
2
Ma
r 1
2
Ap
r 1
2
Ma
y 1
2
Ju
n 1
2
Ju
l 12
Aug
12
Sep
12
In U
S $
MN
FII MF
42.00
44.00
46.00
48.00
50.00
52.00
54.00
56.00
58.00A
ug
-11
Sep
-11
Oct-
11
No
v-1
1
Dec-1
1
Jan-1
2
Feb
-12
Mar-
12
Ap
r-12
May-1
2
Jun-1
2
Jul-12
Aug
-12
Sep
-12
Rs v/s USD
Key Indices 30-Sep-12 31-Aug-12 % Change
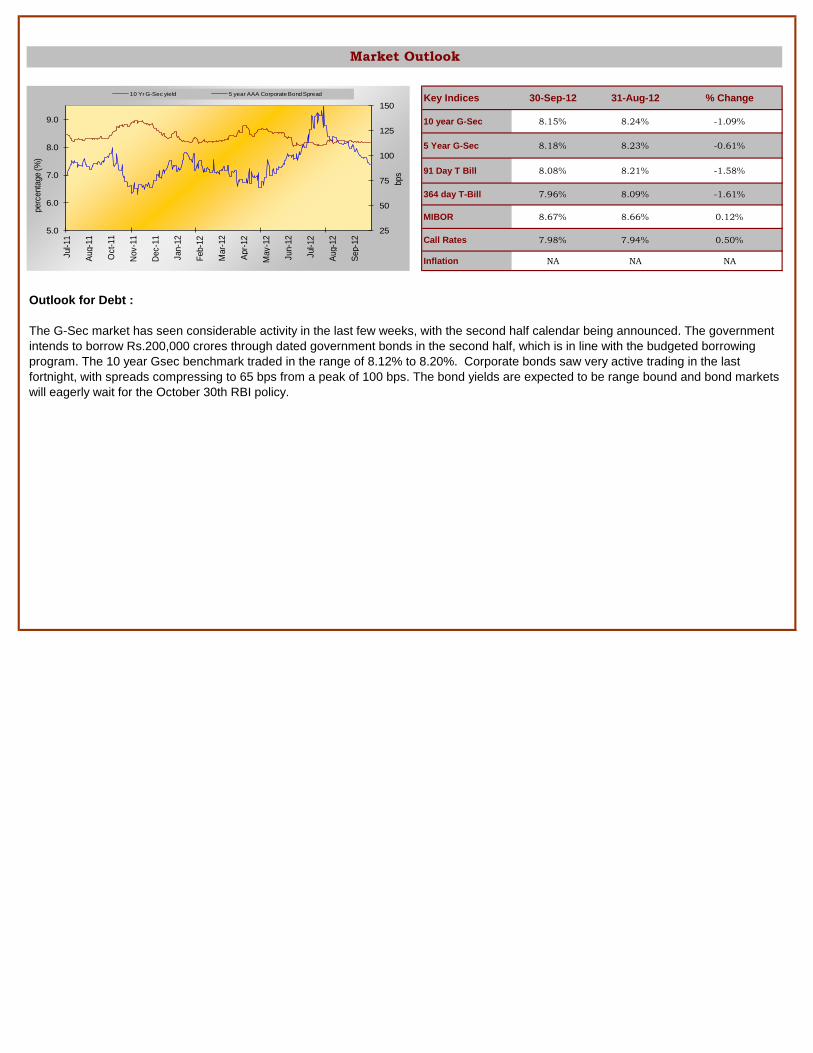
10 year G-Sec 8.15% 8.24% -1.09%
5 Year G-Sec 8.18% 8.23% -0.61%
91 Day T Bill 8.08% 8.21% -1.58%
364 day T-Bill 7.96% 8.09% -1.61%
MIBOR 8.67% 8.66% 0.12%
Call Rates 7.98% 7.94% 0.50%
Inflation NA NA NA
Market Outlook
Outlook for Debt :
The G-Sec market has seen considerable activity in the last few weeks, with the second half calendar being announced. The government
intends to borrow Rs.200,000 crores through dated government bonds in the second half, which is in line with the budgeted borrowing
program. The 10 year Gsec benchmark traded in the range of 8.12% to 8.20%. Corporate bonds saw very active trading in the last
fortnight, with spreads compressing to 65 bps from a peak of 100 bps. The bond yields are expected to be range bound and bond markets
will eagerly wait for the October 30th RBI policy.
25
50
75
100
125
150
5.0
6.0
7.0
8.0
9.0
Jul-11
Aug-1
1
Oct-
11
Nov-1
1
Dec-1
1
Jan-1
2
Feb-1
2
Mar-
12
Apr-
12
May-1
2
Jun-1
2
Jul-12
Aug-1
2
Sep-1
2
10 Yr G-Sec yield 5 year AAA Corporate Bond Spread
bps
perc
enta
ge (%
)
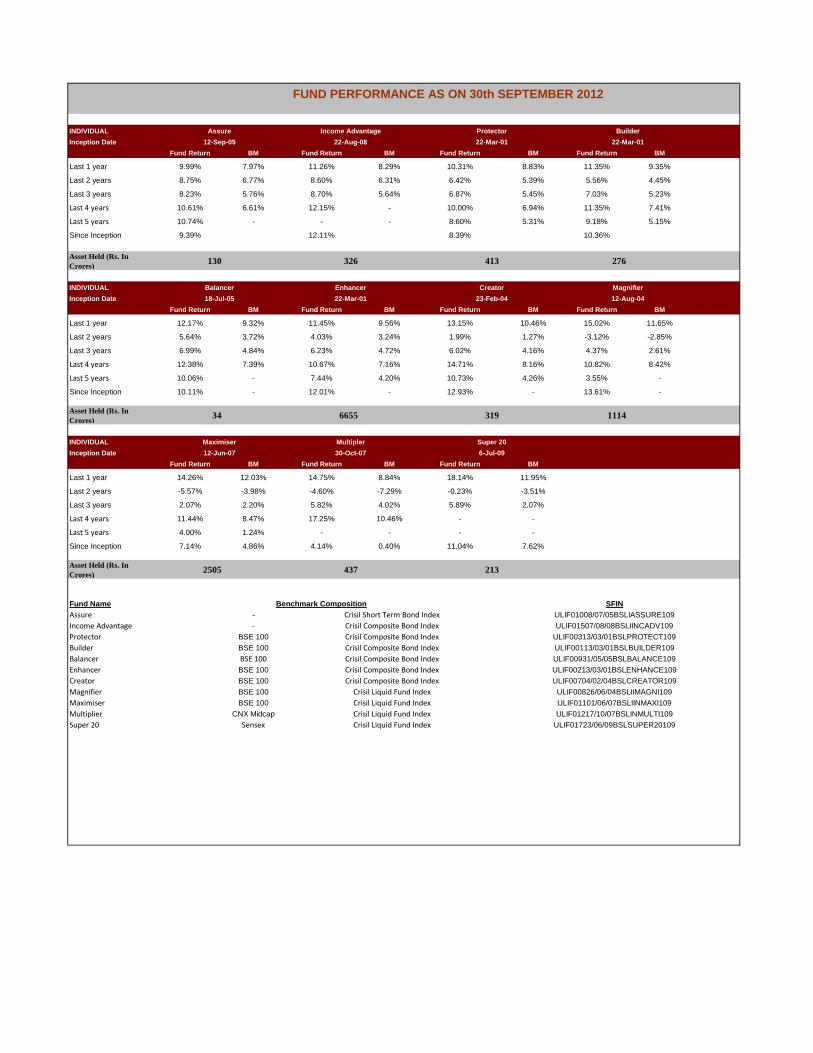
FUND PERFORMANCE AS ON 30th SEPTEMBER 2012
INDIVIDUAL
Inception Date
Fund Return BM Fund Return BM Fund Return BM Fund Return BM
Last 1 year 9.99% 7.97% 11.26% 8.29% 10.31% 8.83% 11.35% 9.35%
Last 2 years 8.75% 6.77% 8.60% 6.31% 6.42% 5.39% 5.56% 4.45%
Last 3 years 8.23% 5.76% 8.70% 5.64% 6.87% 5.45% 7.03% 5.23%
Last 4 years 10.61% 6.61% 12.15% - 10.00% 6.94% 11.35% 7.41%
Last 5 years 10.74% - - - 8.60% 5.31% 9.18% 5.15%
Since Inception 9.39% 12.11% 8.39% 10.36%
Asset Held (Rs. In
Crores)130 326 413 276
INDIVIDUAL
Inception Date
Fund Return BM Fund Return BM Fund Return BM Fund Return BM
Last 1 year 12.17% 9.32% 11.45% 9.56% 13.15% 10.46% 15.02% 11.65%
Last 2 years 5.64% 3.72% 4.03% 3.24% 1.99% 1.27% -3.12% -2.85%
Last 3 years 6.99% 4.84% 6.23% 4.72% 6.02% 4.16% 4.37% 2.61%
Last 4 years 12.38% 7.39% 10.67% 7.16% 14.71% 8.16% 10.82% 8.42%
Last 5 years 10.06% - 7.44% 4.20% 10.73% 4.26% 3.55% -
Since Inception 10.11% - 12.01% - 12.93% - 13.61% -
Asset Held (Rs. In
Crores)34 6655 319 1114
INDIVIDUAL
Inception Date
Fund Return BM Fund Return BM Fund Return BM
Last 1 year 14.26% 12.03% 14.75% 8.84% 18.14% 11.95%
Last 2 years -5.57% -3.98% -4.60% -7.29% -0.23% -3.51%
Last 3 years 2.07% 2.20% 5.82% 4.02% 5.89% 2.07%
Last 4 years 11.44% 8.47% 17.25% 10.46% - -
Last 5 years 4.00% 1.24% - - - -
Since Inception 7.14% 4.86% 4.14% 0.40% 11.04% 7.62%
Asset Held (Rs. In
Crores)2505 437 213
Fund Name
Assure -
Income Advantage -
Protector BSE 100
Builder BSE 100
Balancer BSE 100
Enhancer BSE 100
Creator BSE 100
Magnifier BSE 100
Maximiser BSE 100
Multiplier CNX Midcap
Super 20 Sensex
12-Sep-05 22-Aug-08 22-Mar-01 22-Mar-01
Assure Income Advantage Protector Builder
Balancer Enhancer Creator Magnifier
Benchmark Composition SFIN
18-Jul-05 22-Mar-01 23-Feb-04 12-Aug-04
Maximiser Multipler Super 20
12-Jun-07 30-Oct-07 6-Jul-09
Crisil Short Term Bond Index ULIF01008/07/05BSLIASSURE109
Crisil Composite Bond Index ULIF01507/08/08BSLIINCADV109
Crisil Composite Bond Index ULIF00313/03/01BSLPROTECT109
Crisil Composite Bond Index ULIF00113/03/01BSLBUILDER109
Crisil Composite Bond Index ULIF00931/05/05BSLBALANCE109
Crisil Composite Bond Index ULIF00213/03/01BSLENHANCE109
Crisil Composite Bond Index ULIF00704/02/04BSLCREATOR109
Crisil Liquid Fund Index ULIF00826/06/04BSLIIMAGNI109
Crisil Liquid Fund Index ULIF01101/06/07BSLIINMAXI109
Crisil Liquid Fund Index ULIF01217/10/07BSLINMULTI109
Crisil Liquid Fund Index ULIF01723/06/09BSLSUPER20109

FUND PERFORMANCE AS ON 30th SEPTEMBER 2012
INDIVIDUAL
Inception Date
Fund Return BM Fund Return BM Fund Return BM Fund Return BM
Last 1 year 11.14% - 10.37% - 10.92% - 10.41% -
Last 2 years -3.30% - -3.03% - -2.28% - -2.56% -
Last 3 years 3.72% - 4.19% - 3.96% - 4.39% -
Last 4 years 8.38% - 14.15% - - - - -
Since Inception 3.74% - 13.62% - 7.83% - 4.72% -
Asset Held (Rs. In Crores) 413 706 841 639
INDIVIDUAL
Inception Date
Fund Return BM Fund Return BM Fund Return BM Fund Return BM
Last 1 year 10.58% - 15.05% - 13.19% - 15.08% -
Last 2 years -2.53% - -1.15% - - - - -
Since Inception 4.97% - -1.08% - 2.13% - 3.30% -
Asset Held (Rs. In Crores) 822 506 599 63
INDIVIDUAL
Inception Date
Fund Return BM Fund Return BM Fund Return BM
Last 1 year 11.44% - 11.46% - 10.81% -
Last 2 years -0.30% - -0.13% - 0.45% -
Since Inception 4.94% - 4.58% - 1.42% -
Asset Held (Rs. In Crores) 58 25 7
PENSION
Inception Date
Fund Return BM Fund Return BM Fund Return BM
Last 1 year 10.11% 8.83% 10.91% 9.35% 11.96% 9.80%
Last 2 years 6.21% 5.39% 5.39% 4.45% 3.74% 2.75%
Last 3 years 6.67% 5.45% 6.78% 5.23% 6.44% 4.59%
Last 4 years 10.46% 6.94% 12.64% 7.41% 12.98% 7.77%
Last 5 years 9.06% 5.31% 10.41% 5.15% 9.54% 4.67%
Since Inception 8.14% - 10.37% - 12.13% -
Asset Held (Rs. In Crores) 14 37 171
Fund Name
Platinum Plus I -
Platinum Plus II -
Platinum Plus III -
Platinum Plus IV -
Platinum Premier -
Platinum Advantage -
Titanium I -
Titanium II -
Titanium III -
Pension Nourish BSE 100
Pension Growth BSE 100
Pension Enrich BSE 100
17-Mar-08 8-Sep-08 15-May-09 15-Sep-09
Platinum Plus I Platinum Plus II Platinum Plus III Platinum Plus IV
Platinum Premier Platinum Advantage Foresight 5 Pay Foresight Single Pay
15-Feb-10 20-Sep-10 22-Feb-11 22-Feb-11
16-Dec-09 16-Mar-10 16-Jun-10
12-Mar-03 18-Mar-03 12-Mar-03
Titanium I Titanium II Titanium III
Nourish Growth Enrich
Benchmark Composition SFIN
- ULIF01325/02/08BSLIIPLAT1109
- ULIF01425/02/08BSLIIPLAT2109
- ULIF01628/04/09BSLIIPLAT3109
- ULIF01816/09/09BSLIIPLAT4109
- ULIF02203/02/10BSLPLATPR1109
- ULIF02408/09/10BSLPLATADV109
- ULIF01911/12/09BSLITITAN1109
- ULIF02011/12/09BSLITITAN2109
Crisil Composite Bond Index ULIF00404/03/03BSLIENRICH109
- ULIF02111/12/09BSLITITAN3109
Crisil Composite Bond Index ULIF00604/03/03BSLNOURISH109
Crisil Composite Bond Index ULIF00504/03/03BSLIGROWTH109
Learning Curve:
Understanding ULIPs
Unit-Linked Insurance Plans (ULIPs) have been one of the most significant innovations in the life
insurance industry. ULIPs are the most transparent, long-term & flexible retail life insurance products
available today. It provides both, insurance protection and wealth creation opportunities. ULIP premium
payments are appropriated partly towards providing you life cover and partly invested in the fund
option of your choice – debt or equity.
In ULIPs, the protection element and the savings element are distinguishable. It allows policyholders
manage their life insurance policies depending on their changing needs and gives them the flexibility of
altering premium amounts or adding top-ups. It also permits them to avail of liquidity, in case of an
emergency, by allowing need-based partial withdrawals.
Of the premiums paid, the allocation charges, mortality charges and policy administration charges are
deducted. The balance amount is invested in a fund of the policyholder’s choice. Units are allocated
towards the invested amount. Each allocated unit has a price attached to it called the NAV (Net Asset
Value) which is calculated and disclosed by the insurance company on a daily basis. Fund management
charges are adjusted from the fund’s NAV on a daily basis. The policyholder can track the fund
investments and performance.
There is a wide range of funds available under ULIPs which gives policyholders an opportunity to
adequately diversify their investments. These funds have different asset allocations ranging from 100%
debt to 100% equity to meet the objective and risk appetite of the policyholders. Equity funds have the
potential to deliver high returns as they have higher risks as compared to fixed income funds. ULIPs
allow for switching between funds and redirect future premiums as the investment objectives may
change over time. Insurance companies also offer funds which guarantee the highest NAV for a fixed
period of time based on CPPI (Constant proportion portfolio insurance)
ULIPs help create wealth over a longer period of time. During the initial years of the policy, the cost
structure is high and hence there are more units deducted. However, overall charges reduce
substantially over time thus allowing more amount to be allocated in the chosen funds. This way the
investment grows over a period of time leading to a growth in fund value.
Insurance companies have products to offer value to their policyholders with multiple options as
mentioned below:
• Self Managed option where the policyholder can decide to choose the fund based on his risk
taking capacity
• Lifecycle option where the portfolio allocation automatically changes the exposure to debt and
equity depending upon their life stage and risk profile
• Systematic Transfer option that helps safeguarding policyholders’ investments from equity
market volatility through rupee cost averaging where the premium is initially allocated to the
liquid fund and gradually moved to an equity fund in equal monthly installments.
At Birla Sun Life Insurance we offer all these options to our policyholders to choose from and are
committed to maximizing policyholders’ long-term wealth by consistently generating superior risk-
adjusted returns by following a disciplined long-term investment approach.
BSLI BENCHMARK BSLI BENCHMARK BSLI BENCHMARK
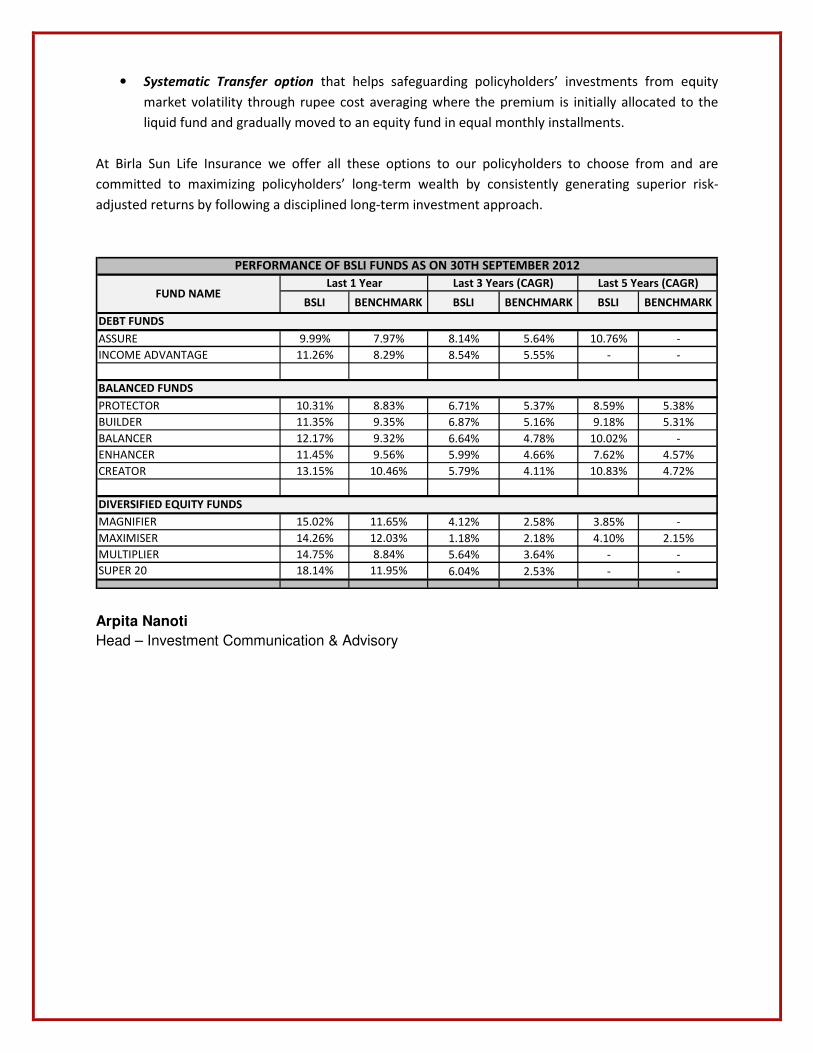
ASSURE 9.99% 7.97% 8.14% 5.64% 10.76% -
INCOME ADVANTAGE 11.26% 8.29% 8.54% 5.55% - -
PROTECTOR 10.31% 8.83% 6.71% 5.37% 8.59% 5.38%
BUILDER 11.35% 9.35% 6.87% 5.16% 9.18% 5.31%
BALANCER 12.17% 9.32% 6.64% 4.78% 10.02% -
ENHANCER 11.45% 9.56% 5.99% 4.66% 7.62% 4.57%
CREATOR 13.15% 10.46% 5.79% 4.11% 10.83% 4.72%
MAGNIFIER 15.02% 11.65% 4.12% 2.58% 3.85% -
MAXIMISER 14.26% 12.03% 1.18% 2.18% 4.10% 2.15%
MULTIPLIER 14.75% 8.84% 5.64% 3.64% - -
SUPER 20 18.14% 11.95% 6.04% 2.53% - -
DEBT FUNDS
BALANCED FUNDS
DIVERSIFIED EQUITY FUNDS
Last 1 Year
PERFORMANCE OF BSLI FUNDS AS ON 30TH SEPTEMBER 2012
FUND NAMELast 3 Years (CAGR) Last 5 Years (CAGR)
Arpita Nanoti
Head – Investment Communication & Advisory
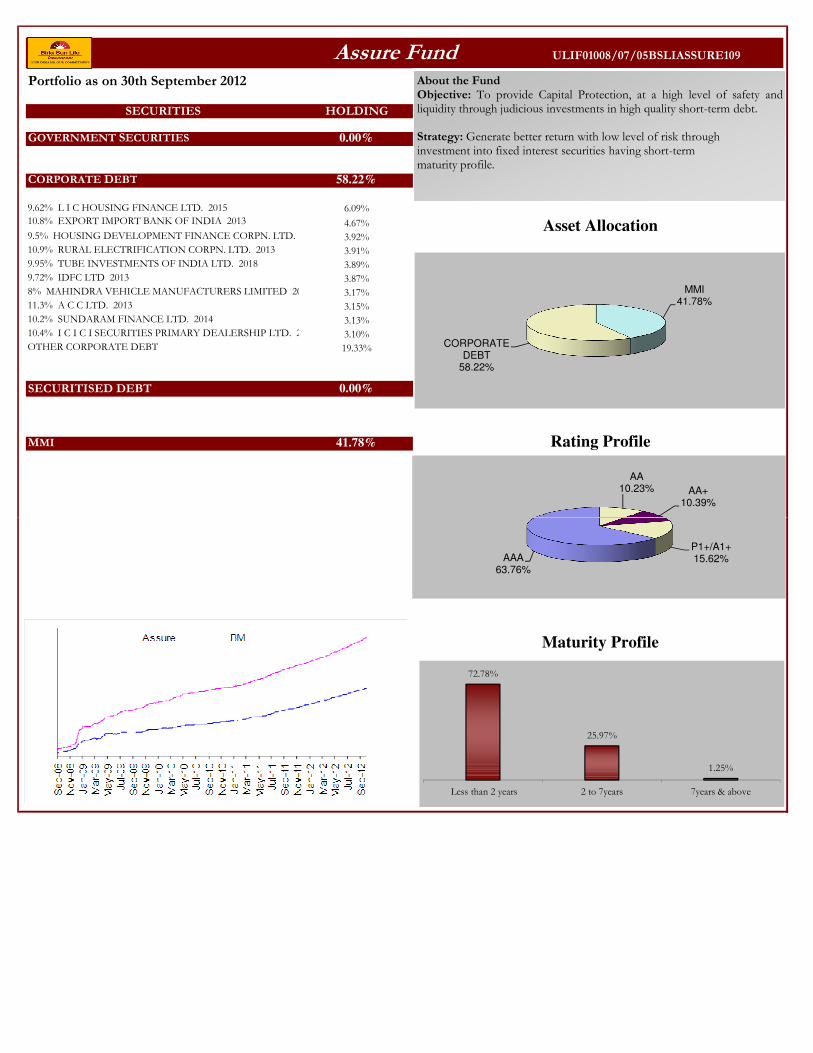
SECURITIES HOLDING
GOVERNMENT SECURITIES 0.00%
CORPORATE DEBT 58.22%
9.62% L I C HOUSING FINANCE LTD. 2015 6.09%
10.8% EXPORT IMPORT BANK OF INDIA 2013 4.67%
9.5% HOUSING DEVELOPMENT FINANCE CORPN. LTD. 2017 3.92%
10.9% RURAL ELECTRIFICATION CORPN. LTD. 2013 3.91%
9.95% TUBE INVESTMENTS OF INDIA LTD. 2018 3.89%
9.72% IDFC LTD 2013 3.87%
8% MAHINDRA VEHICLE MANUFACTURERS LIMITED 2015 3.17%
11.3% A C C LTD. 2013 3.15%
10.2% SUNDARAM FINANCE LTD. 2014 3.13%
10.4% I C I C I SECURITIES PRIMARY DEALERSHIP LTD. 2013 3.10%
OTHER CORPORATE DEBT 19.33%
SECURITISED DEBT 0.00%
MMI 41.78% Rating Profile
Assure Fund ULIF01008/07/05BSLIASSURE109
Portfolio as on 30th September 2012
Asset Allocation
About the FundObjective: To provide Capital Protection, at a high level of safety andliquidity through judicious investments in high quality short-term debt.
Strategy: Generate better return with low level of risk throughinvestment into fixed interest securities having short-termmaturity profile.
MMI41.78%
CORPORATE DEBT
58.22%
AA10.23% AA+
10.39%
Maturity Profile
72.78%
25.97%
1.25%
Less than 2 years 2 to 7years 7years & above
P1+/A1+15.62%AAA
63.76%
SECURITIES HOLDING
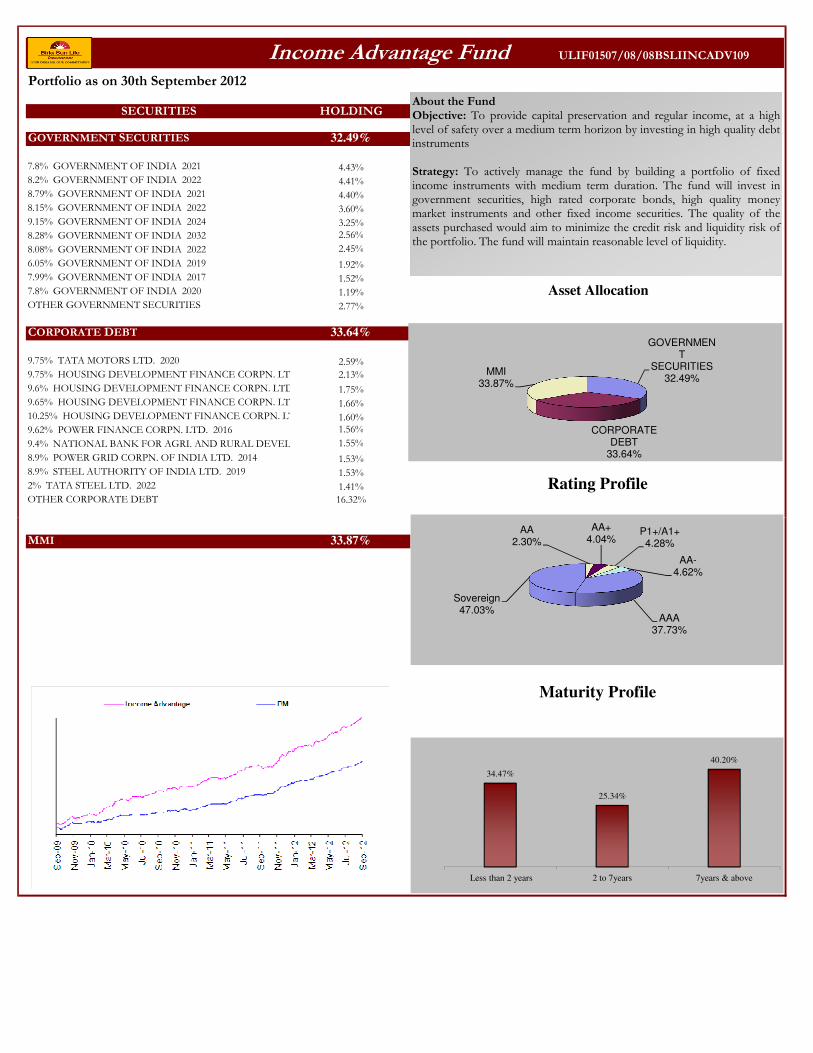
GOVERNMENT SECURITIES 32.49%
7.8% GOVERNMENT OF INDIA 2021 4.43%
8.2% GOVERNMENT OF INDIA 2022 4.41%
8.79% GOVERNMENT OF INDIA 2021 4.40%
8.15% GOVERNMENT OF INDIA 2022 3.60%
9.15% GOVERNMENT OF INDIA 2024 3.25%
8.28% GOVERNMENT OF INDIA 2032 2.56%
8.08% GOVERNMENT OF INDIA 2022 2.45%
6.05% GOVERNMENT OF INDIA 2019 1.92%
7.99% GOVERNMENT OF INDIA 2017 1.52%
7.8% GOVERNMENT OF INDIA 2020 1.19%
OTHER GOVERNMENT SECURITIES 2.77%
CORPORATE DEBT 33.64%
9.75% TATA MOTORS LTD. 2020 2.59%
9.75% HOUSING DEVELOPMENT FINANCE CORPN. LTD. 2016 2.13%
9.6% HOUSING DEVELOPMENT FINANCE CORPN. LTD. 2016 1.75%
9.65% HOUSING DEVELOPMENT FINANCE CORPN. LTD. 2016 1.66%
10.25% HOUSING DEVELOPMENT FINANCE CORPN. LTD. 2017 1.60%
9.62% POWER FINANCE CORPN. LTD. 2016 1.56%
9.4% NATIONAL BANK FOR AGRI. AND RURAL DEVELOPMENT 20161.55%
8.9% POWER GRID CORPN. OF INDIA LTD. 2014 1.53%
8.9% STEEL AUTHORITY OF INDIA LTD. 2019 1.53%
2% TATA STEEL LTD. 2022 1.41%
OTHER CORPORATE DEBT 16.32%
Asset Allocation
Income Advantage Fund ULIF01507/08/08BSLIINCADV109
Portfolio as on 30th September 2012
Rating Profile
About the FundObjective: To provide capital preservation and regular income, at a highlevel of safety over a medium term horizon by investing in high quality debtinstruments
Strategy: To actively manage the fund by building a portfolio of fixedincome instruments with medium term duration. The fund will invest ingovernment securities, high rated corporate bonds, high quality moneymarket instruments and other fixed income securities. The quality of theassets purchased would aim to minimize the credit risk and liquidity risk ofthe portfolio. The fund will maintain reasonable level of liquidity.
GOVERNMENT
SECURITIES32.49%
CORPORATE DEBT
33.64%
MMI33.87%
MMI 33.87%
Maturity Profile
AA2.30%
AA+4.04%
P1+/A1+4.28%
AA-4.62%
AAA37.73%
Sovereign47.03%
34.47%
25.34%
40.20%
Less than 2 years 2 to 7years 7years & above

SECURITIES HOLDING
GOVERNMENT SECURITIES 29.24%
7.8% GOVERNMENT OF INDIA 2021 3.58%
8.15% GOVERNMENT OF INDIA 2022 2.79%
7.99% GOVERNMENT OF INDIA 2017 2.40%
7.5% GOVERNMENT OF INDIA 2034 2.24%
11.5% GOVERNMENT OF INDIA 2015 2.09%
8.13% GOVERNMENT OF INDIA 2022 2.01%
8.24% GOVERNMENT OF INDIA 2027 1.76%
8.79% GOVERNMENT OF INDIA 2021 1.62%
6.9% GOVERNMENT OF INDIA 2019 1.58%
7.95% GOVERNMENT OF INDIA 2032 1.48%
OTHER GOVERNMENT SECURITIES 7.68%
CORPORATE DEBT 47.49%
8.6% POWER FINANCE CORPN. LTD. 2014 3.13%
10.85% RURAL ELECTRIFICATION CORPN. LTD. 2018 2.89%
8.75% INDIAN RAILWAY FINANCE CORPN. LTD. 2013 2.42%
8.9% STEEL AUTHORITY OF INDIA LTD. 2019 1.93%
8.64% POWER GRID CORPN. OF INDIA LTD. 2014 1.93%
8.8% POWER GRID CORPN. OF INDIA LTD. 2013 1.82%
9.45% RURAL ELECTRIFICATION CORPN. LTD. 2013 1.77%
11.4% POWER FINANCE CORPN. LTD. 2013 1.49%
11.25% POWER FINANCE CORPN. LTD. 2018 1.47%
8.85% TATA SONS LTD. 2016 1.46%
OTHER CORPORATE DEBT 27.18%
EQUITY 9.89%
I T C LTD. 0.59%
Asset Allocation
Rating Profile
Protector Fund ULIF00313/03/01BSLPROTECT109
Portfolio as on 30th September 2012 About the FundObjective: To generate persistent return through active management of fixed income portfolioand focus on creating long-term equity portfolio, which will enhance yield of composite portfoliowith minimum risk appetite.
Strategy: To invest in fixed income securities with marginal exposure to equity up to 10% at lowlevel of risk. This fund is suitable for those who want to protect their capital and earn steady returnon investment through higher exposure to debt securities.
AA-1.21%
AA2.76%
P1+/A1+5.07%
AA+5.35%
Sovereign
AAA49.43%
Equities9.89%
MMI13.37%
G-Secs29.24%
NCD47.49%
I T C LTD. 0.59%
RELIANCE INDUSTRIES LTD. 0.59%
I C I C I BANK LTD. 0.57%
INFOSYS LTD. 0.57%
HOUSING DEVELOPMENT FINANCE CORPN. LTD. 0.42%
LARSEN AND TOUBRO LTD. 0.38%
H D F C BANK LTD. 0.37%
STATE BANK OF INDIA 0.31%
OIL AND NATURAL GAS CORPN. LTD. 0.28%
TATA CONSULTANCY SERVICES LTD. 0.25%
OTHER EQUITY 5.56%
MMI 13.37%
Maturity Profile
Sectoral Allocation
1.18%
1.68%
1.91%
2.08%
2.45%
3.57%
4.80%
5.81%
6.79%
6.84%
7.56%
10.58%
11.34%
11.63%
21.79%
CEMENT
OTHERS
TELECOM
DIVERSIFIED
AUTO ANCILLIARY
AUTOMOBILE
POWER
CAPITAL GOODS
PHARMA
METAL
FINANCIAL SERVICES
FMCG
OIL AND GAS
SOFTWARE / IT
BANKING
45.07%
28.25% 26.68%
Less than 2 years 2 to 7years 7years & above
Sovereign36.17%

SECURITIES HOLDING
GOVERNMENT SECURITIES 25.03%
8.2% GOVERNMENT OF INDIA 2022 5.75%
7.8% GOVERNMENT OF INDIA 2021 4.39%
8.15% GOVERNMENT OF INDIA 2022 2.89%
8.28% GOVERNMENT OF INDIA 2027 1.71%
8.32% GOVERNMENT OF INDIA 2032 1.69%
8.79% GOVERNMENT OF INDIA 2021 1.68%
7.95% GOVERNMENT OF INDIA 2032 1.46%
8.3% GOVERNMENT OF INDIA 2040 1.15%
7.59% GOVERNMENT OF INDIA 2015 1.07%
8.08% GOVERNMENT OF INDIA 2022 0.89%
OTHER GOVERNMENT SECURITIES 2.35%
CORPORATE DEBT 46.13%
8.65% RURAL ELECTRIFICATION CORPN. LTD. 2019 3.92%
11.45% RELIANCE INDUSTRIES LTD. 2013 3.42%
8.6% POWER FINANCE CORPN. LTD. 2014 2.88%
8.75% INDIAN RAILWAY FINANCE CORPN. LTD. 2013 2.78%
8.85% TATA SONS LTD. 2016 2.35%
10.25% TECH MAHINDRA LTD. 2014 2.21%
8.5% INDIAN RAILWAY FINANCE CORPN. LTD. 2020 1.89%
9.35% RURAL ELECTRIFICATION CORPN. LTD. 2022 1.85%
9.47% POWER GRID CORPN. OF INDIA LTD. 2014 1.82%
8.9% STEEL AUTHORITY OF INDIA LTD. 2019 1.44%
OTHER CORPORATE DEBT 21.56%
EQUITY 19.74%
I T C LTD. 1.31%
INFOSYS LTD. 1.17%
Rating Profile
Asset Allocation
Builder Fund ULIF00113/03/01BSLBUILDER109
Portfolio as on 30th September 2012
AA-1.54%
AA+2.58%
AA4.16%
Sovereign
AAA56.55%
MMI9.10%
Equities19.74%
G-Secs25.03%
NCD46.13%
About the FundObjective: To build your capital and generate better returns at moderate level of risk, overa medium or long-term period through a balance of investment in equity and debt.
Strategy: Generate better return with moderate level of risk through active management offixed income portfolio and focus on creating long term equity portfolio which will enhanceyield of composite portfolio with low level of risk appetite.
INFOSYS LTD. 1.17%
I C I C I BANK LTD. 1.08%
H D F C BANK LTD. 1.00%
RELIANCE INDUSTRIES LTD. 0.93%
LARSEN AND TOUBRO LTD. 0.89%
HOUSING DEVELOPMENT FINANCE CORPN. LTD. 0.84%
STATE BANK OF INDIA 0.64%
MCLEOD RUSSEL INDIA LTD. 0.52%
GUJARAT MINERAL DEVELPMENMT CORPORTAION 0.50%
OTHER EQUITY 10.87%
MMI 9.10%
Sectoral Allocation
Maturity Profile
1.24%
2.14%
2.27%
3.13%
3.95%
5.68%
5.75%
6.46%
6.99%
8.49%
9.36%
12.34%
13.24%
18.95%
FERTILISERS
TELECOM
CEMENT
DIVERSIFIED
AUTO ANCILLIARY
CAPITAL GOODS
AUTOMOBILE
PHARMA
FINANCIAL SERVICES
METAL
OIL AND GAS
SOFTWARE / IT
FMCG
BANKING
35.51%
26.11%
38.38%
Less than 2 years 2 to 7years 7years & above
Sovereign35.17%
56.55%
1.24%FERTILISERS
Less than 2 years 2 to 7years 7years & above

SECURITIES HOLDING
GOVERNMENT SECURITIES 22.30%
8.2% GOVERNMENT OF INDIA 2022 5.03%
7.8% GOVERNMENT OF INDIA 2021 2.73%
7.95% GOVERNMENT OF INDIA 2032 2.55%
5.64% GOVERNMENT OF INDIA 2019 2.47%
7.46% GOVERNMENT OF INDIA 2017 2.17%
8.79% GOVERNMENT OF INDIA 2021 1.53%
6.9% GOVERNMENT OF INDIA 2019 1.39%
7% GOVERNMENT OF INDIA 2022 1.34%
7.99% GOVERNMENT OF INDIA 2017 1.18%
8.08% GOVERNMENT OF INDIA 2022 1.18%
OTHER GOVERNMENT SECURITIES 0.73%
CORPORATE DEBT 37.36%
9% EXPORT IMPORT BANK OF INDIA 2019 7.53%
9.43% RURAL ELECTRIFICATION CORPN. LTD. 2014 3.61%
10.05% NATIONAL BANK FOR AGRI. AND RURAL DEVELOPMENT 20143.03%
9.4% NATIONAL BANK FOR AGRI. AND RURAL DEVELOPMENT 20163.02%
7.05% CANARA BANK 2014 2.90%
9.47% POWER GRID CORPN. OF INDIA LTD. 2022 2.30%
11.45% RELIANCE INDUSTRIES LTD. 2013 1.53%
11.4% POWER FINANCE CORPN. LTD. 2013 1.53%
11.3% A C C LTD. 2013 1.53%
9.35% POWER GRID CORPN. OF INDIA LTD. 2021 1.52%
OTHER CORPORATE DEBT 8.85%
EQUITY 24.40%
I C I C I BANK LTD. 1.69%
Balancer Fund ULIF00931/05/05BSLBALANCE109
Portfolio as on 30th September 2012
Rating Profile
Asset Allocation
About the FundObjective: To achieve value creation of the policyholder at an average risk level overmedium to long-term period.
Strategy: To invest predominantly in debt securities with an additional exposure toequity, maintaining medium term duration profile of the portfolio.
P1+/A1+12.59%
Sovereign
AAA54.73%
MMI15.94%
G-Secs22.30%
Equities24.40%
NCD37.36%
I C I C I BANK LTD. 1.69%
INFOSYS LTD. 1.45%
RELIANCE INDUSTRIES LTD. 1.38%
STATE BANK OF INDIA 1.13%
LARSEN AND TOUBRO LTD. 1.02%
I T C LTD. 1.00%
H D F C BANK LTD. 0.96%
HOUSING DEVELOPMENT FINANCE CORPN. LTD. 0.83%
HINDUSTAN UNILEVER LTD. 0.66%
AXIS BANK LTD. 0.66%
OTHER EQUITY 13.62%
MMI 15.94%
Maturity Profile
Sectoral Allocation
1.27%
1.42%
2.66%
2.67%
3.42%
4.72%
5.20%
5.47%
5.48%
5.64%
7.49%
9.52%
10.21%
11.42%
23.40%
CONSTRUCTION
OTHERS
TELECOM
DIVERSIFIED
AUTO ANCILLIARY
POWER
CAPITAL GOODS
METAL
AUTOMOBILE
PHARMA
FINANCIAL SERVICES
FMCG
OIL AND GAS
SOFTWARE / IT
BANKING
42.30%
31.23%26.47%
Less than 2 years 2 to 7years 7years & above
Sovereign32.68%
54.73%
1.27%CONSTRUCTIONLess than 2 years 2 to 7years 7years & above
SECURITIES HOLDING
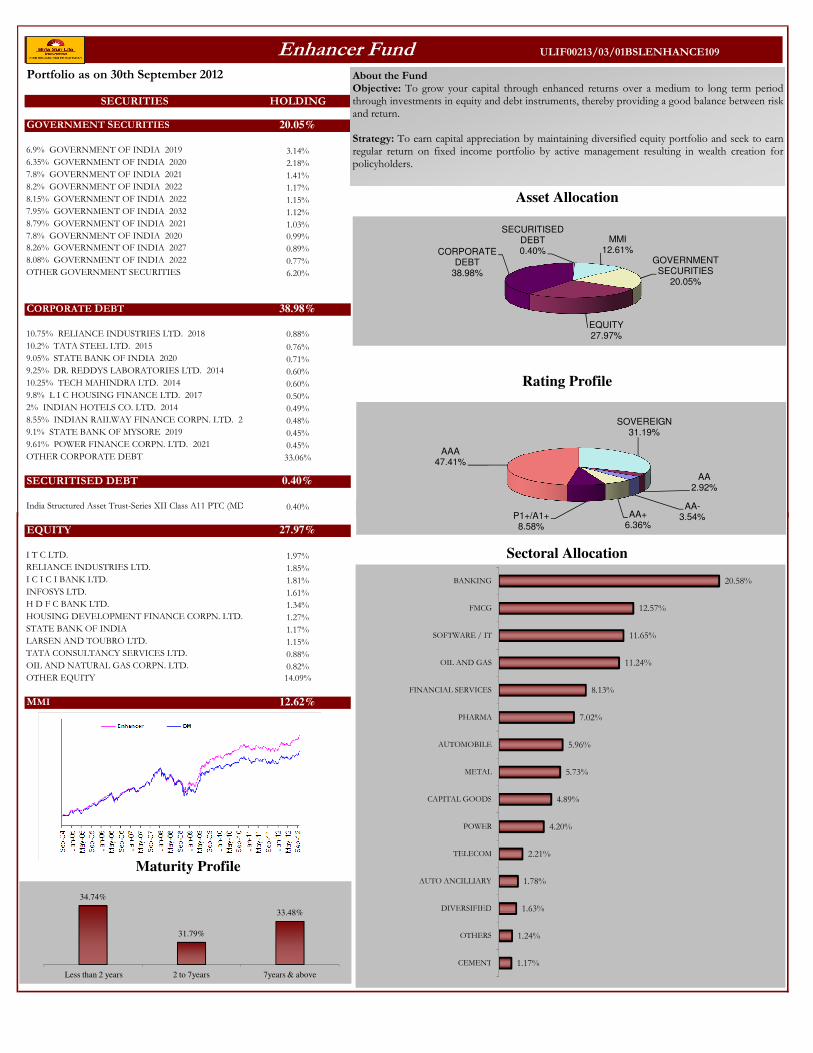
GOVERNMENT SECURITIES 20.05%
6.9% GOVERNMENT OF INDIA 2019 3.14%
6.35% GOVERNMENT OF INDIA 2020 2.18%
7.8% GOVERNMENT OF INDIA 2021 1.41%
8.2% GOVERNMENT OF INDIA 2022 1.17%
8.15% GOVERNMENT OF INDIA 2022 1.15%
7.95% GOVERNMENT OF INDIA 2032 1.12%
8.79% GOVERNMENT OF INDIA 2021 1.03%
7.8% GOVERNMENT OF INDIA 2020 0.99%
8.26% GOVERNMENT OF INDIA 2027 0.89%
8.08% GOVERNMENT OF INDIA 2022 0.77%
OTHER GOVERNMENT SECURITIES 6.20%
CORPORATE DEBT 38.98%
10.75% RELIANCE INDUSTRIES LTD. 2018 0.88%
10.2% TATA STEEL LTD. 2015 0.76%
9.05% STATE BANK OF INDIA 2020 0.71%
9.25% DR. REDDYS LABORATORIES LTD. 2014 0.60%
10.25% TECH MAHINDRA LTD. 2014 0.60%
9.8% L I C HOUSING FINANCE LTD. 2017 0.50%
2% INDIAN HOTELS CO. LTD. 2014 0.49%
8.55% INDIAN RAILWAY FINANCE CORPN. LTD. 2019 0.48%
9.1% STATE BANK OF MYSORE 2019 0.45%
9.61% POWER FINANCE CORPN. LTD. 2021 0.45%
OTHER CORPORATE DEBT 33.06%
SECURITISED DEBT 0.40%
India Structured Asset Trust-Series XII Class A11 PTC (MD 15/04/2015)0.40%
Enhancer Fund ULIF00213/03/01BSLENHANCE109
Portfolio as on 30th September 2012
Asset Allocation
Rating Profile
About the FundObjective: To grow your capital through enhanced returns over a medium to long term periodthrough investments in equity and debt instruments, thereby providing a good balance between riskand return.
Strategy: To earn capital appreciation by maintaining diversified equity portfolio and seek to earnregular return on fixed income portfolio by active management resulting in wealth creation forpolicyholders.
SECURITISED DEBT0.40%
MMI12.61%
GOVERNMENT SECURITIES
20.05%
EQUITY27.97%
CORPORATE DEBT
38.98%
SOVEREIGN31.19%
AA2.92%
AA-3.54%AA+P1+/A1+
AAA47.41%
EQUITY 27.97%
I T C LTD. 1.97%
RELIANCE INDUSTRIES LTD. 1.85%
I C I C I BANK LTD. 1.81%
INFOSYS LTD. 1.61%
H D F C BANK LTD. 1.34%
HOUSING DEVELOPMENT FINANCE CORPN. LTD. 1.27%
STATE BANK OF INDIA 1.17%
LARSEN AND TOUBRO LTD. 1.15%
TATA CONSULTANCY SERVICES LTD. 0.88%
OIL AND NATURAL GAS CORPN. LTD. 0.82%
OTHER EQUITY 14.09%
MMI 12.62%
Maturity Profile
Sectoral Allocation
1.17%
1.24%
1.63%
1.78%
2.21%
4.20%
4.89%
5.73%
5.96%
7.02%
8.13%
11.24%
11.65%
12.57%
20.58%
CEMENT
OTHERS
DIVERSIFIED
AUTO ANCILLIARY
TELECOM
POWER
CAPITAL GOODS
METAL
AUTOMOBILE
PHARMA
FINANCIAL SERVICES
OIL AND GAS
SOFTWARE / IT
FMCG
BANKING
34.74%
31.79%
33.48%
Less than 2 years 2 to 7years 7years & above
AA-3.54%AA+
6.36%P1+/A1+8.58%

SECURITIES HOLDING
GOVERNMENT SECURITIES 17.54%
8.15% GOVERNMENT OF INDIA 2022 5.48%
7.8% GOVERNMENT OF INDIA 2021 1.98%
8.28% GOVERNMENT OF INDIA 2027 1.56%
8.24% GOVERNMENT OF INDIA 2027 1.28%
7.99% GOVERNMENT OF INDIA 2017 1.03%
8.28% GOVERNMENT OF INDIA 2032 0.92%
5.64% GOVERNMENT OF INDIA 2019 0.85%
8.83% GOVERNMENT OF INDIA 2041 0.81%
8.32% GOVERNMENT OF INDIA 2032 0.62%
7.46% GOVERNMENT OF INDIA 2017 0.61%
OTHER GOVERNMENT SECURITIES 2.41%
CORPORATE DEBT 25.07%
8.6% POWER FINANCE CORPN. LTD. 2014 3.43%
10.1% POWER GRID CORPN. OF INDIA LTD. 2013 1.58%
11.45% RELIANCE INDUSTRIES LTD. 2013 1.58%
9.47% POWER GRID CORPN. OF INDIA LTD. 2013 1.57%
9.5% NATIONAL BANK FOR AGRI. AND RURAL DEVELOPMENT 20121.57%
8.45% INDIAN RAILWAY FINANCE CORPN. LTD. 2018 1.54%
8.9% STEEL AUTHORITY OF INDIA LTD. 2019 1.41%
11.4% POWER FINANCE CORPN. LTD. 2013 1.13%
8.75% INDIAN RAILWAY FINANCE CORPN. LTD. 2013 1.10%
9.55% HINDALCO INDUSTRIES LTD. 2022 0.96%
OTHER CORPORATE DEBT 9.21%
EQUITY 47.59%
RELIANCE INDUSTRIES LTD. 2.92%
I C I C I BANK LTD. 2.82%
INFOSYS LTD. 2.64%
I T C LTD. 2.53%
HOUSING DEVELOPMENT FINANCE CORPN. LTD.
Asset Allocation
Rating Profile
Creator Fund ULIF00704/02/04BSLCREATOR109
Portfolio as on 30th September 2012About the FundObjective: To achieve optimum balance between growth and stability to provide long-termcapital appreciation with balanced level of risk by investing in fixed income securities andhigh quality equity security.
Strategy: To ensure capital appreciation by simultaneously investing into fixed incomesecurities and maintaining diversified equity portfolio. Active fund management is carriedout to enhance policyholder’s wealth in long run.
AA2.03%
AA+4.12%
AA-4.49%
P1+/A1+8.46%
Sovereign37.68%
AAA43.22%
MMI9.80%
G-Secs17.54%
NCD25.07%
Equities47.59%
HOUSING DEVELOPMENT FINANCE CORPN. LTD. 2.11%
H D F C BANK LTD. 1.78%
LARSEN AND TOUBRO LTD. 1.78%
STATE BANK OF INDIA 1.47%
OIL AND NATURAL GAS CORPN. LTD. 1.39%
TATA CONSULTANCY SERVICES LTD. 1.23%
OTHER EQUITY 26.92%
MMI 9.80%Sectoral Allocation
Maturity Profile
0.95%
1.13%
1.25%
1.99%
2.03%
2.49%
3.63%
4.07%
6.59%
6.88%
7.20%
7.81%
9.24%
11.46%
11.58%
21.70%
OTHERS
CEMENT
CONSTRUCTION
TELECOM
DIVERSIFIED
AUTO ANCILLIARY
AUTOMOBILE
POWER
CAPITAL GOODS
METAL
PHARMA
FINANCIAL SERVICES
FMCG
SOFTWARE / IT
OIL AND GAS
BANKING
47.67%
19.54%
32.79%
Less than 2 years 2 to 7years 7years & above
Sovereign37.68%
SECURITIES HOLDING
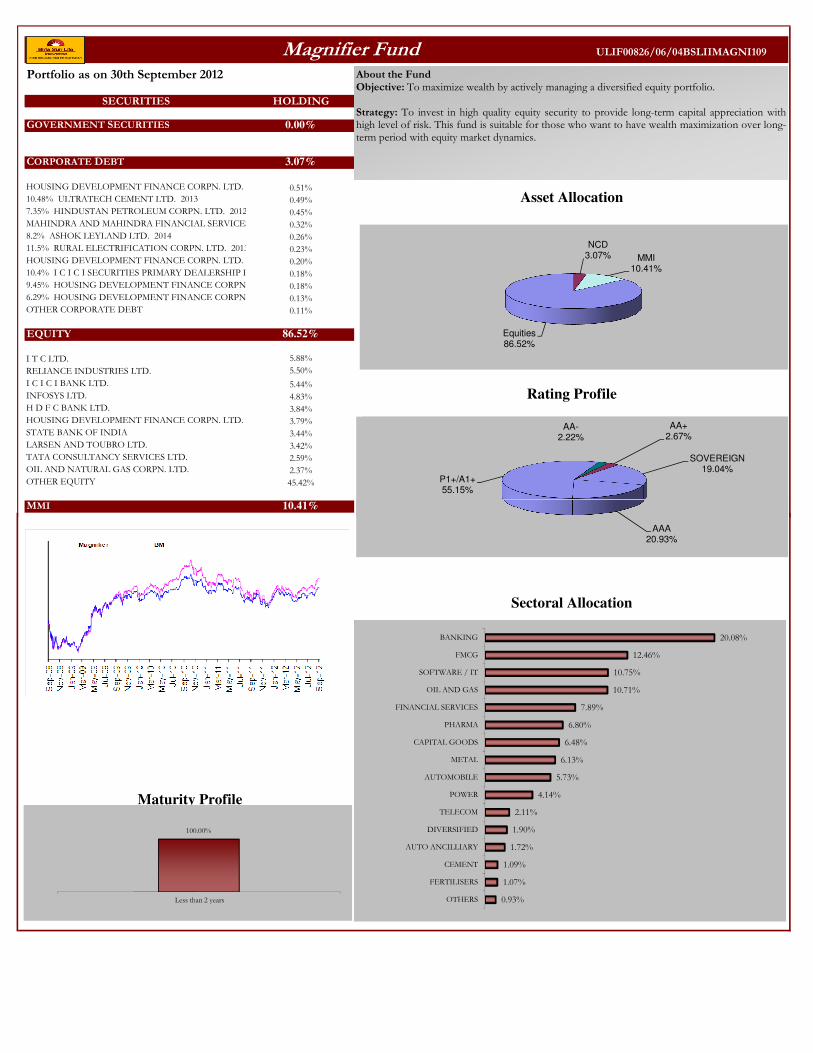
GOVERNMENT SECURITIES 0.00%
CORPORATE DEBT 3.07%
HOUSING DEVELOPMENT FINANCE CORPN. LTD. 2013 0.51%
10.48% ULTRATECH CEMENT LTD. 2013 0.49%
7.35% HINDUSTAN PETROLEUM CORPN. LTD. 2012 0.45%
MAHINDRA AND MAHINDRA FINANCIAL SERVICES LTD. 20120.32%
8.2% ASHOK LEYLAND LTD. 2014 0.26%
11.5% RURAL ELECTRIFICATION CORPN. LTD. 2013 0.23%
HOUSING DEVELOPMENT FINANCE CORPN. LTD. 2013 0.20%
10.4% I C I C I SECURITIES PRIMARY DEALERSHIP LTD. 2013 0.18%
9.45% HOUSING DEVELOPMENT FINANCE CORPN. LTD. 20130.18%
6.29% HOUSING DEVELOPMENT FINANCE CORPN. LTD. 20130.13%
OTHER CORPORATE DEBT 0.11%
EQUITY 86.52%
I T C LTD. 5.88%
RELIANCE INDUSTRIES LTD. 5.50%
I C I C I BANK LTD. 5.44%
INFOSYS LTD. 4.83%
H D F C BANK LTD. 3.84%
HOUSING DEVELOPMENT FINANCE CORPN. LTD. 3.79%
STATE BANK OF INDIA 3.44%
LARSEN AND TOUBRO LTD. 3.42%
TATA CONSULTANCY SERVICES LTD. 2.59%
OIL AND NATURAL GAS CORPN. LTD. 2.37%
OTHER EQUITY 45.42%
MMI 10.41%
Asset Allocation
Magnifier Fund ULIF00826/06/04BSLIIMAGNI109
Portfolio as on 30th September 2012
Rating Profile
About the FundObjective: To maximize wealth by actively managing a diversified equity portfolio.
Strategy: To invest in high quality equity security to provide long-term capital appreciation withhigh level of risk. This fund is suitable for those who want to have wealth maximization over long-term period with equity market dynamics.
NCD3.07% MMI
10.41%
Equities86.52%
AA-9.27%
AA+11.16%
SOVEREIGN79.56%
AA-2.22%
AA+2.67%
SOVEREIGN19.04%
P1+/A1+55.15%
Maturity Profile
Sectoral Allocation
0.93%
1.07%
1.09%
1.72%
1.90%
2.11%
4.14%
5.73%
6.13%
6.48%
6.80%
7.89%
10.71%
10.75%
12.46%
20.08%
OTHERS
FERTILISERS
CEMENT
AUTO ANCILLIARY
DIVERSIFIED
TELECOM
POWER
AUTOMOBILE
METAL
CAPITAL GOODS
PHARMA
FINANCIAL SERVICES
OIL AND GAS
SOFTWARE / IT
FMCG
BANKING
SOVEREIGN79.56%
AAA20.93%
100.00%
Less than 2 years

SECURITIES HOLDING
GOVERNMENT SECURITIES 0.00%
CORPORATE DEBT 0.00%
EQUITY 97.80%
I C I C I BANK LTD. 6.30%
RELIANCE INDUSTRIES LTD. 5.95%
I T C LTD. 5.45%
INFOSYS LTD. 4.49%
H D F C BANK LTD. 4.23%
HOUSING DEVELOPMENT FINANCE CORPN. LTD. 4.21%
LARSEN AND TOUBRO LTD. 4.04%
STATE BANK OF INDIA 3.78%
TATA CONSULTANCY SERVICES LTD. 3.21%
OIL AND NATURAL GAS CORPN. LTD. 2.59%
OTHER EQUITY 53.54%
MMI 2.20%
Maximiser Fund ULIF01101/06/07BSLIINMAXI109
Portfolio as on 30th September 2012
Asset Allocation
Rating Profile
About the FundObjective: To Provide long-term capital appreciation by actively managing a welldiversified equity portfolio of fundamentally strong blue chip companies and provide acushion against the volatility in the equities through investment in money marketinstruments.Strategy: Active Fund Management with potentially 100% equity exposure. MaintainingHigh Quality Diversified Portfolio with Dynamic blend of Growth and Value Stocks- sothat portfolio doesnot suffer from style bias. Focus on large-caps and quality mid-caps toensure liquidity and reduce risk.
MMI2.20%
Equities97.80%
P1+/A1+36.78%
SOVEREIGN63.22%
Sectoral Allocation
Maturity Profile
1.66%
1.91%
1.93%
2.25%
2.25%
2.31%
5.35%
6.14%
6.55%
7.06%
8.87%
10.82%
10.97%
11.29%
20.64%
TELECOM
DIVERSIFIED
CEMENT
POWER
OTHERS
AUTO ANCILLIARY
AUTOMOBILE
CAPITAL GOODS
METAL
PHARMA
FINANCIAL SERVICES
SOFTWARE / IT
FMCG
OIL AND GAS
BANKING
P1+/A1+36.78%
100.00%
Less than 2 years
SECURITIES HOLDING
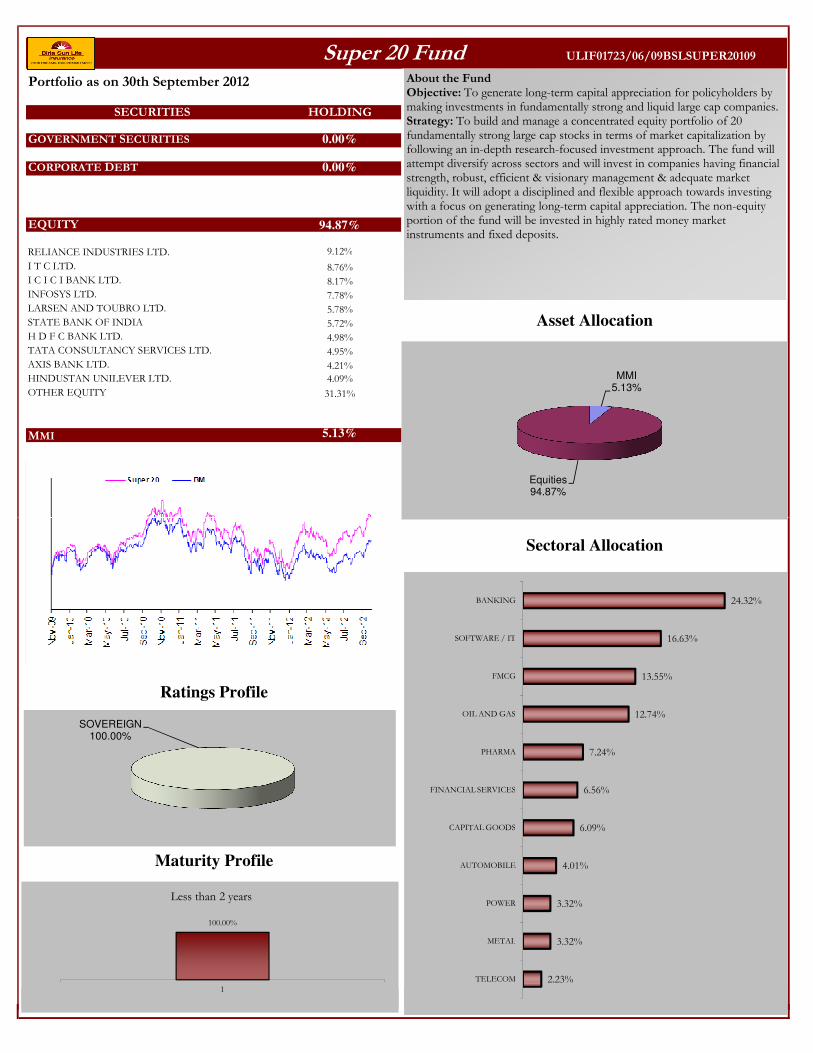
GOVERNMENT SECURITIES 0.00%
CORPORATE DEBT 0.00%
EQUITY 94.87%
RELIANCE INDUSTRIES LTD. 9.12%
I T C LTD. 8.76%
I C I C I BANK LTD. 8.17%
INFOSYS LTD. 7.78%
LARSEN AND TOUBRO LTD. 5.78%
STATE BANK OF INDIA 5.72%
H D F C BANK LTD. 4.98%
TATA CONSULTANCY SERVICES LTD. 4.95%
AXIS BANK LTD. 4.21%
HINDUSTAN UNILEVER LTD. 4.09%
OTHER EQUITY 31.31%
MMI 5.13%
Super 20 Fund ULIF01723/06/09BSLSUPER20109
Portfolio as on 30th September 2012
Asset Allocation
About the FundObjective: To generate long-term capital appreciation for policyholders by making investments in fundamentally strong and liquid large cap companies.Strategy: To build and manage a concentrated equity portfolio of 20 fundamentally strong large cap stocks in terms of market capitalization by following an in-depth research-focused investment approach. The fund will attempt diversify across sectors and will invest in companies having financial strength, robust, efficient & visionary management & adequate market liquidity. It will adopt a disciplined and flexible approach towards investing with a focus on generating long-term capital appreciation. The non-equity portion of the fund will be invested in highly rated money market instruments and fixed deposits.
MMI5.13%
Equities94.87%
Ratings Profile
Maturity Profile
Sectoral Allocation
2.23%
3.32%
3.32%
4.01%
6.09%
6.56%
7.24%
12.74%
13.55%
16.63%
24.32%
TELECOM
METAL
POWER
AUTOMOBILE
CAPITAL GOODS
FINANCIAL SERVICES
PHARMA
OIL AND GAS
FMCG
SOFTWARE / IT
BANKING
100.00%
1
Less than 2 years
SOVEREIGN100.00%
1

SECURITIES HOLDING
GOVERNMENT SECURITIES 0.00%
CORPORATE DEBT 0.69%
9.5% NATIONAL BANK FOR AGRI. AND RURAL DEVELOPMENT 2012 0.69%
Asset AllocationEQUITY 85.35%
GLAXOSMITHKLINE CONSUMER HEALTHCARE LTD. 4.19%
GUJARAT MINERAL DEVELPMENMT CORPORTAION 3.47%
HINDUSTAN PETROLEUM CORPN. LTD. 3.46%
APOLLO TYRES LTD. 2.96%
COAL INDIA LTD 2.92%
CADILA HEALTHCARE LTD. 2.59%
EXIDE INDUSTRIES LTD. 2.58%
HINDUSTAN ZINC LTD. 2.51%
FEDERAL BANK LTD. 2.48%
CIPLA LTD. 2.42%
OTHER EQUITY 55.77%
MMI 13.97%
Multiplier Fund ULIF01217/10/07BSLINMULTI109
Portfolio as on 30th September 2012
Asset Allocation
Sectoral Allocation
About the FundObjective: To provide long-term wealth maximisation by actively managing a well-diversified equityportfolio, predominantly comprising of companies whose market capitalization is between Rs. 10billion to Rs.250 billion. Further, the fund would also seek to provide a cushion against the suddenvolatility in the equities through some investments in short-term money market instruments
Strategy: Active Fund Management with potentially 100% equity Exposure Research based investmentapproach with a dedicated & experienced in-house research team. Identify undervalued Stocks in thegrowth phase. Focus on niche players with competitive advantage, in the sunrise industry & potentialof being tomorrow’s large cap. Emphasis on early identification of stocks.
MMI13.97%
Equities85.35%
NCD0.69%
11.90%
12.79%
FMCG
BANKING
Maturity Profile
Rating Profile
1.08%
1.17%
1.28%
1.48%
1.50%
1.73%
1.82%
2.18%
2.34%
2.45%
2.64%
3.30%
4.71%
8.26%
8.63%
9.68%
10.42%
10.65%
11.90%
AUTOMOBILE
CONSTRUCTION
DIVERSIFIED
TELECOM
MEDIA AND ENTERTAINMENT
AGRI RELATED
SUGAR
HOTELS
CEMENT
FERTILISERS
FINANCIAL SERVICES
POWER
SOFTWARE / IT
AUTO ANCILLIARY
CAPITAL GOODS
PHARMA
METAL
OIL AND GAS
FMCG
AAA6.05%
SOVEREIGN16.47%
P1+/A1+77.48%
100.00%
1
Less than 2 years

SECURITIES HOLDING
GOVERNMENT SECURITIES 11.33%
7.83% GOVERNMENT OF INDIA 2018 4.87%
5.69% GOVERNMENT OF INDIA 2018 3.20%
8.24% GOVERNMENT OF INDIA 2018 2.91%
7.46% GOVERNMENT OF INDIA 2017 0.35%
CORPORATE DEBT 20.46%
NATIONAL BANK FOR AGRI. AND RURAL DEVELOPMENT 20174.62%
10.85% RURAL ELECTRIFICATION CORPN. LTD. 2018 3.15%
11.25% POWER FINANCE CORPN. LTD. 2018 2.67%
10.6% INDIAN RAILWAY FINANCE CORPN. LTD. 2018 2.62%
9.25% POWER GRID CORPN. OF INDIA LTD. 2017 1.96%
9.64% POWER GRID CORPN. OF INDIA LTD. 2018 1.24%
9.35% POWER GRID CORPN. OF INDIA LTD. 2018 1.23%
9.3% POWER GRID CORPN. OF INDIA LTD. 2018 1.23%
9.07% RURAL ELECTRIFICATION CORPN. LTD. 2018 1.22%
NATIONAL BANK FOR AGRI. AND RURAL DEVELOPMENT 20180.33%
OTHER CORPORATE DEBT 0.18%
EQUITY 64.71%
I T C LTD. 4.26%
I C I C I BANK LTD. 4.20%
RELIANCE INDUSTRIES LTD. 4.15%
HOUSING DEVELOPMENT FINANCE CORPN. LTD. 3.91%
INFOSYS LTD. 3.84%
Platinum Plus Fund - 1 ULIF01325/02/08BSLIIPLAT1109
Portfolio as on 30th September 2012
Asset Allocation
About the FundObjective: To optimize the participation in an actively managed welldiversified equity portfolio of fundamentally strong blue chip companieswhile using debt instruments & derivatives to lock-in capital appreciations
Strategy: To have an optimum mix of equities & fixed income instruments,with up to 100% exposure in both equities & fixed income assets & up to40% in Money Market
GOVERNMENT SECURITIES
11.33%
MMI3.50%
CORPORATE DEBT
20.46%
EQUITY64.71%
INFOSYS LTD. 3.84%
LARSEN AND TOUBRO LTD. 3.00%
H D F C BANK LTD. 2.70%
TATA CONSULTANCY SERVICES LTD. 2.34%
STATE BANK OF INDIA 2.28%
OIL AND NATURAL GAS CORPN. LTD. 1.97%
OTHER EQUITY 32.06%
MMI 3.50%
Rating Profile
Maturity Profile
Sectoral Allocation
0.21%
99.79%
Less than 2 years 2 to 7years0.99%
1.78%
2.73%
3.47%
4.64%
5.11%
6.57%
6.87%
9.15%
9.55%
12.98%
13.95%
22.20%
OTHERS
CEMENT
TELECOM
POWER
CAPITAL GOODS
METAL
PHARMA
AUTOMOBILE
FMCG
FINANCIAL SERVICES
SOFTWARE / IT
OIL AND GAS
BANKING
Sovereign35.64%
AAA64.36%
Less than 2 years 2 to 7years0.99%OTHERS
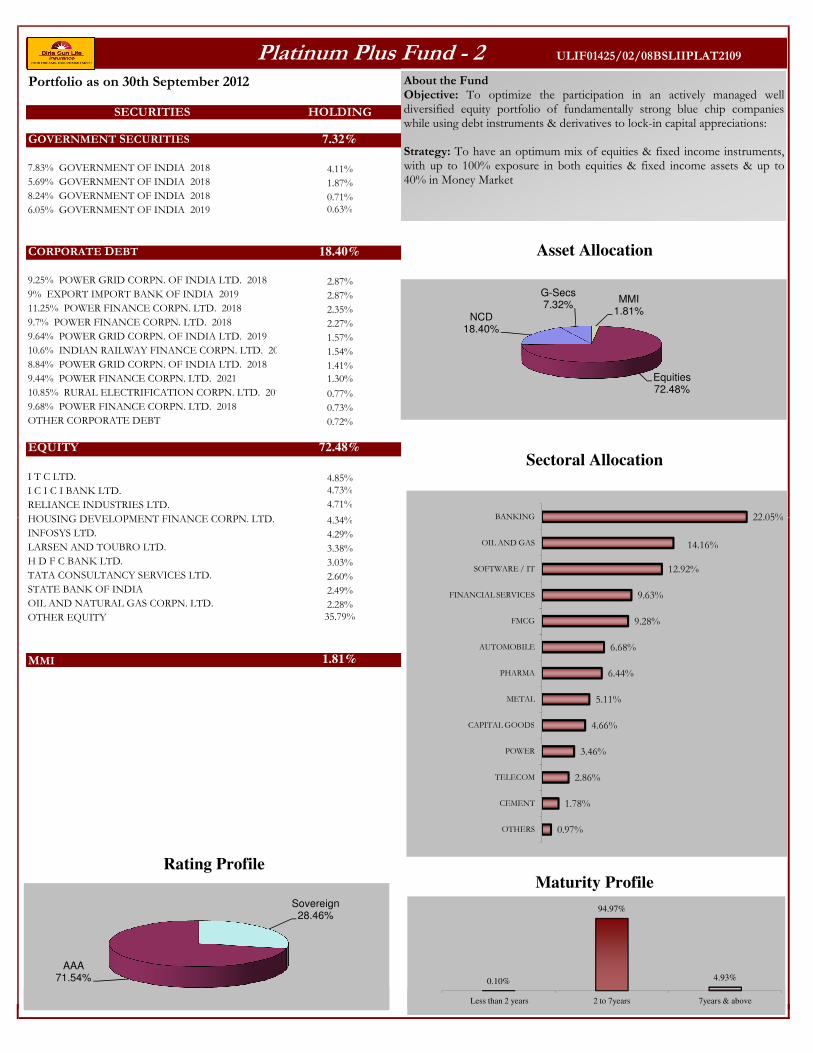
SECURITIES HOLDING
GOVERNMENT SECURITIES 7.32%
7.83% GOVERNMENT OF INDIA 2018 4.11%
5.69% GOVERNMENT OF INDIA 2018 1.87%
8.24% GOVERNMENT OF INDIA 2018 0.71%
6.05% GOVERNMENT OF INDIA 2019 0.63%
CORPORATE DEBT 18.40%
9.25% POWER GRID CORPN. OF INDIA LTD. 2018 2.87%
9% EXPORT IMPORT BANK OF INDIA 2019 2.87%
11.25% POWER FINANCE CORPN. LTD. 2018 2.35%
9.7% POWER FINANCE CORPN. LTD. 2018 2.27%
9.64% POWER GRID CORPN. OF INDIA LTD. 2019 1.57%
10.6% INDIAN RAILWAY FINANCE CORPN. LTD. 2018 1.54%
8.84% POWER GRID CORPN. OF INDIA LTD. 2018 1.41%
9.44% POWER FINANCE CORPN. LTD. 2021 1.30%
10.85% RURAL ELECTRIFICATION CORPN. LTD. 2018 0.77%
9.68% POWER FINANCE CORPN. LTD. 2018 0.73%
OTHER CORPORATE DEBT 0.72%
EQUITY 72.48%
I T C LTD. 4.85%
I C I C I BANK LTD. 4.73%
RELIANCE INDUSTRIES LTD. 4.71%
HOUSING DEVELOPMENT FINANCE CORPN. LTD. 4.34%
Platinum Plus Fund - 2 ULIF01425/02/08BSLIIPLAT2109
Portfolio as on 30th September 2012
Asset Allocation
Sectoral Allocation
About the FundObjective: To optimize the participation in an actively managed welldiversified equity portfolio of fundamentally strong blue chip companieswhile using debt instruments & derivatives to lock-in capital appreciations:
Strategy: To have an optimum mix of equities & fixed income instruments,with up to 100% exposure in both equities & fixed income assets & up to40% in Money Market
22.05%BANKING
MMI1.81%
Equities72.48%
NCD18.40%
G-Secs7.32%
HOUSING DEVELOPMENT FINANCE CORPN. LTD. 4.34%
INFOSYS LTD. 4.29%
LARSEN AND TOUBRO LTD. 3.38%
H D F C BANK LTD. 3.03%
TATA CONSULTANCY SERVICES LTD. 2.60%
STATE BANK OF INDIA 2.49%
OIL AND NATURAL GAS CORPN. LTD. 2.28%
OTHER EQUITY 35.79%
MMI 1.81%
Rating ProfileMaturity Profile
0.10%
94.97%
4.93%
Less than 2 years 2 to 7years 7years & above
0.97%
1.78%
2.86%
3.46%
4.66%
5.11%
6.44%
6.68%
9.28%
9.63%
12.92%
14.16%
22.05%
OTHERS
CEMENT
TELECOM
POWER
CAPITAL GOODS
METAL
PHARMA
AUTOMOBILE
FMCG
FINANCIAL SERVICES
SOFTWARE / IT
OIL AND GAS
BANKING
Sovereign28.46%
AAA71.54%
Less than 2 years 2 to 7years 7years & above
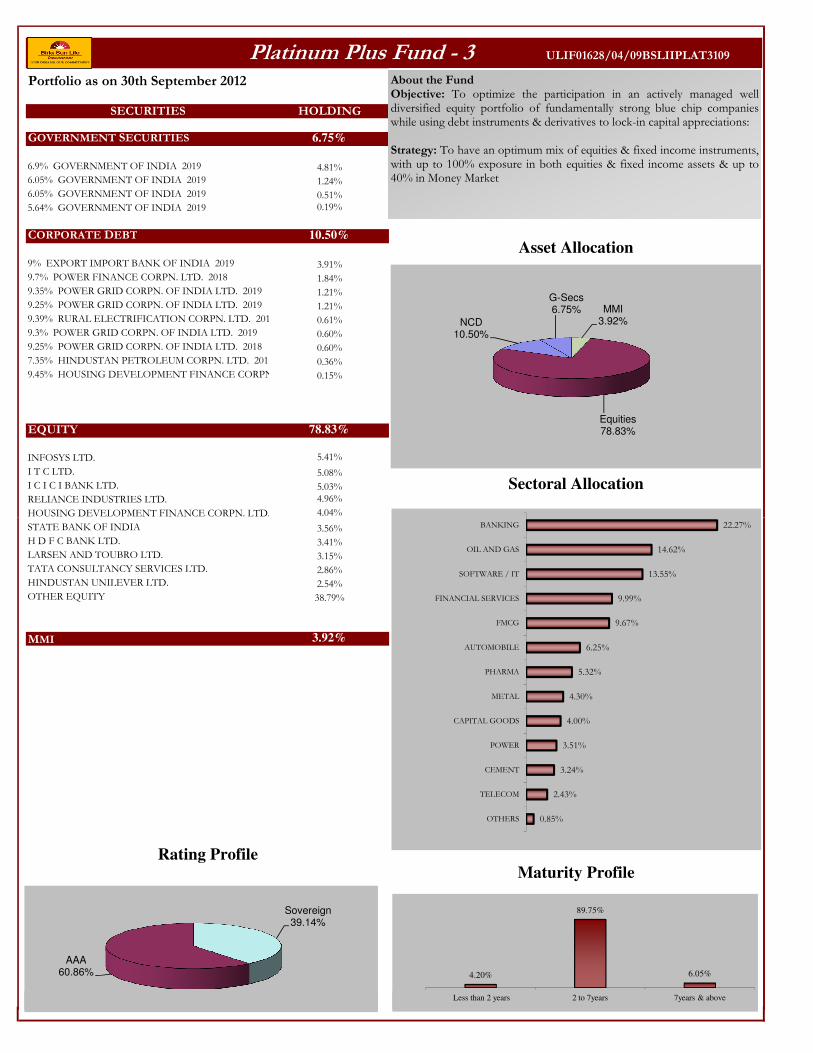
SECURITIES HOLDING
GOVERNMENT SECURITIES 6.75%
6.9% GOVERNMENT OF INDIA 2019 4.81%
6.05% GOVERNMENT OF INDIA 2019 1.24%
6.05% GOVERNMENT OF INDIA 2019 0.51%
5.64% GOVERNMENT OF INDIA 2019 0.19%
CORPORATE DEBT 10.50%
9% EXPORT IMPORT BANK OF INDIA 2019 3.91%
9.7% POWER FINANCE CORPN. LTD. 2018 1.84%
9.35% POWER GRID CORPN. OF INDIA LTD. 2019 1.21%
9.25% POWER GRID CORPN. OF INDIA LTD. 2019 1.21%
9.39% RURAL ELECTRIFICATION CORPN. LTD. 2019 0.61%
9.3% POWER GRID CORPN. OF INDIA LTD. 2019 0.60%
9.25% POWER GRID CORPN. OF INDIA LTD. 2018 0.60%
7.35% HINDUSTAN PETROLEUM CORPN. LTD. 2012 0.36%
9.45% HOUSING DEVELOPMENT FINANCE CORPN. LTD. 20130.15%
EQUITY 78.83%
INFOSYS LTD. 5.41%
I T C LTD. 5.08%
I C I C I BANK LTD. 5.03%
RELIANCE INDUSTRIES LTD. 4.96%
HOUSING DEVELOPMENT FINANCE CORPN. LTD. 4.04%
Platinum Plus Fund - 3 ULIF01628/04/09BSLIIPLAT3109
Portfolio as on 30th September 2012
Asset Allocation
Sectoral Allocation
About the FundObjective: To optimize the participation in an actively managed welldiversified equity portfolio of fundamentally strong blue chip companieswhile using debt instruments & derivatives to lock-in capital appreciations:
Strategy: To have an optimum mix of equities & fixed income instruments,with up to 100% exposure in both equities & fixed income assets & up to40% in Money Market
MMI3.92%
Equities78.83%
NCD10.50%
G-Secs6.75%
HOUSING DEVELOPMENT FINANCE CORPN. LTD. 4.04%
STATE BANK OF INDIA 3.56%
H D F C BANK LTD. 3.41%
LARSEN AND TOUBRO LTD. 3.15%
TATA CONSULTANCY SERVICES LTD. 2.86%
HINDUSTAN UNILEVER LTD. 2.54%
OTHER EQUITY 38.79%
MMI 3.92%
Rating ProfileMaturity Profile
4.20%
89.75%
6.05%
Less than 2 years 2 to 7years 7years & above
0.85%
2.43%
3.24%
3.51%
4.00%
4.30%
5.32%
6.25%
9.67%
9.99%
13.55%
14.62%
22.27%
OTHERS
TELECOM
CEMENT
POWER
CAPITAL GOODS
METAL
PHARMA
AUTOMOBILE
FMCG
FINANCIAL SERVICES
SOFTWARE / IT
OIL AND GAS
BANKING
Sovereign39.14%
AAA60.86%
Less than 2 years 2 to 7years 7years & above

SECURITIES HOLDING
GOVERNMENT SECURITIES 6.34%
6.9% GOVERNMENT OF INDIA 2019 5.61%
6.05% GOVERNMENT OF INDIA 2019 0.70%
6.05% GOVERNMENT OF INDIA 2019 0.03%
CORPORATE DEBT 5.84%
NATIONAL BANK FOR AGRI. AND RURAL DEVELOPMENT 20191.83%
9.25% POWER GRID CORPN. OF INDIA LTD. 2019 1.59%
NATIONAL HOUSING BANK 2019 1.34%
9.39% RURAL ELECTRIFICATION CORPN. LTD. 2019 0.80%
RURAL ELECTRIFICATION CORPN. LTD. 2020 0.28%
EQUITY 80.52%
INFOSYS LTD. 5.62%
I C I C I BANK LTD. 5.23%
RELIANCE INDUSTRIES LTD. 5.15%
I T C LTD. 5.09%
HOUSING DEVELOPMENT FINANCE CORPN. LTD. 4.01%
STATE BANK OF INDIA 3.73%
H D F C BANK LTD. 3.46%
LARSEN AND TOUBRO LTD. 3.27%
TATA CONSULTANCY SERVICES LTD. 2.88%
OIL AND NATURAL GAS CORPN. LTD. 2.61%
OTHER EQUITY 39.46%
Platinum Plus Fund - 4 ULIF01816/09/09BSLIIPLAT4109
Portfolio as on 30th September 2012
Asset Allocation
Sectoral Allocation
About the FundObjective: To optimize the participation in an actively managed welldiversified equity portfolio of fundamentally strong blue chip companieswhile using debt instruments & derivatives to lock-in capital appreciations:
Strategy: To have an optimum mix of equities & fixed income instruments,with up to 100% exposure in both equities & fixed income assets & up to40% in Money Market
NCD5.84% G-Secs
6.34%MMI7.31%
Equities80.52%
MMI 7.31%
Rating ProfileMaturity Profile
32.30%
58.16%
9.54%
Less than 2 years 2 to 7years 7years & above
0.85%
2.31%
3.08%
3.57%
4.06%
4.34%
5.48%
5.69%
9.55%
10.07%
13.64%
14.87%
22.49%
OTHERS
TELECOM
CEMENT
POWER
CAPITAL GOODS
METAL
PHARMA
AUTOMOBILE
FMCG
FINANCIAL SERVICES
SOFTWARE / IT
OIL AND GAS
BANKING
AAA32.21%
P1+/A1+32.82%
Sovereign34.97%
Less than 2 years 2 to 7years 7years & above32.82%

SECURITIES HOLDING
GOVERNMENT SECURITIES 4.20%
8.19% GOVERNMENT OF INDIA 2020 3.64%
6.35% GOVERNMENT OF INDIA 2020 0.57%
CORPORATE DEBT 7.53%
9.35% POWER GRID CORPN. OF INDIA LTD. 2020 2.48%
9.3% POWER GRID CORPN. OF INDIA LTD. 2020 1.24%
9.25% POWER GRID CORPN. OF INDIA LTD. 2020 1.11%
9.75% RURAL ELECTRIFICATION CORPN. LTD. 2021 1.02%
9.64% POWER GRID CORPN. OF INDIA LTD. 2020 0.63%
9.2% POWER GRID CORPN. OF INDIA LTD. 2020 0.62%
9.48% RURAL ELECTRIFICATION CORPN. LTD. 2021 0.44%
EQUITY 83.59%
INFOSYS LTD. 5.88%
I C I C I BANK LTD. 5.46%
RELIANCE INDUSTRIES LTD. 5.16%
I T C LTD. 5.13%
STATE BANK OF INDIA 4.08%
HOUSING DEVELOPMENT FINANCE CORPN. LTD. 4.07%
H D F C BANK LTD. 3.59%
LARSEN AND TOUBRO LTD. 3.42%
TATA CONSULTANCY SERVICES LTD. 2.92%
OIL AND NATURAL GAS CORPN. LTD. 2.72%
OTHER EQUITY 41.16%
Platinum Premier Fund ULIF02203/02/10BSLPLATPR1109
Portfolio as on 30th September 2012
Asset Allocation
Sectoral Allocation
About the FundObjective: To optimize the participation in an actively managed well diversified equity portfolio of fundamentally strong blue chip companies while using debt instruments & derivatives to lock-in capital appreciations.
Strategy: To dynamically manage the allocation between equities and fixed income instruments, while using derivatives when necessary and for hedging purposes only. The equity investment strategy will revolve around building and actively managing a well-diversified equity portfolio of value & growth driven fundamentally strong blue chip companies by following a research-focused investment approach. On the fixed income side, investments will be made in government securities, high rated corporate bonds and money market instruments.
G-Secs4.20% NCD
7.53%
MMI4.67%
Equities83.59%
OTHER EQUITY 41.16%
MMI 4.67%
Rating Profile Maturity Profile
22.75%
77.25%
Less than 2 years 7years & above
0.82%
2.23%
2.68%
3.59%
4.09%
4.29%
5.46%
6.41%
9.33%
9.94%
13.31%
14.65%23.20%
OTHERS
TELECOM
CEMENT
POWER
CAPITAL GOODS
METAL
PHARMA
AUTOMOBILE
FMCG
FINANCIAL SERVICES
SOFTWARE / IT
OIL AND GAS
BANKING
P1+/A1+23.20%
Sovereign27.52%
AAA49.29%
Less than 2 years 7years & above

SECURITIES HOLDING
GOVERNMENT SECURITIES 0.88%
6.05% GOVERNMENT OF INDIA 2019 0.88%
CORPORATE DEBT 6.09%
9.48% RURAL ELECTRIFICATION CORPN. LTD. 2021 2.40%
NATIONAL HOUSING BANK 2019 1.93%
RURAL ELECTRIFICATION CORPN. LTD. 2020 1.76%
EQUITY 90.35%
HOUSING DEVELOPMENT FINANCE CORPN. LTD. 5.87%
I C I C I BANK LTD. 5.79%
RELIANCE INDUSTRIES LTD. 5.57%
I T C LTD. 5.41%
INFOSYS LTD. 5.02%
LARSEN AND TOUBRO LTD. 4.47%
H D F C BANK LTD. 3.89%
STATE BANK OF INDIA 3.15%
TATA CONSULTANCY SERVICES LTD. 3.15%
OIL AND NATURAL GAS CORPN. LTD. 2.79%
OTHER EQUITY 45.23%
MMI 2.67%
Platinum Advantage Fund ULIF02408/09/10BSLPLATADV109
Portfolio as on 30th September 2012
Asset Allocation
Sectoral Allocation
About the FundObjective: To optimize the participation in an actively managed well-diversified equity portfolio of fundamentally strong blue chip companieswhile using debt instruments and derivatives to lock-in capital appreciations.The use of derivatives will be for hedging purposes only and as approved bythe IRDA.
Strategy: To dynamically manage the allocation between equities and fixedincome instruments, while using derivatives when necessary and for hedgingpurposes only. The equity investment strategy will revolve around buildingand actively managing a well-diversified equity portfolio of value & growthdriven fundamentally strong blue-chip companies by following a research-focused investment approach. On the fixed income side, investments will bemade in government securities, high rated corporate bonds and moneymarket instruments.
NCD6.09% MMI
2.67%
Equities90.35%
G-Sec's0.88%
Rating Profile Maturity Profile
25.78%29.95%
44.27%
Less than 2 years 2 to 7years 7years & above
1.03%
1.12%
1.40%
2.58%
3.36%
4.89%
4.95%
6.12%
6.97%
8.67%
10.26%
12.37%
13.96%
22.31%
AUTO ANCILLIARY
DIVERSIFIED
CEMENT
TELECOM
POWER
METAL
CAPITAL GOODS
PHARMA
AUTOMOBILE
FMCG
FINANCIAL SERVICES
SOFTWARE / IT
OIL AND GAS
BANKING
Sovereign10.62%
P1+/A1+16.05%
AAA73.33%
Less than 2 years 2 to 7years 7years & aboveAAA73.33%

SECURITIES HOLDING
GOVERNMENT SECURITIES 7.90%
7.61% GOVERNMENT OF INDIA 2015 4.27%
7.17% GOVERNMENT OF INDIA 2015 2.37%
6.49% GOVERNMENT OF INDIA 2015 1.27%
CORPORATE DEBT 25.45%
9.85% HOUSING DEVELOPMENT FINANCE CORPN. LTD. 20155.29%
9.37% NATIONAL HOUSING BANK 2015 4.89%
8.8% POWER GRID CORPN. OF INDIA LTD. 2014 4.10%
8.95% POWER FINANCE CORPN. LTD. 2015 2.59%
8.6% POWER FINANCE CORPN. LTD. 2014 2.58%
8.64% POWER GRID CORPN. OF INDIA LTD. 2015 2.15%
9.46% NATIONAL BANK FOR AGRI. AND RURAL DEVELOPMENT 20152.10%
9.43% RURAL ELECTRIFICATION CORPN. LTD. 2014 1.74%
EQUITY 65.09%
INFOSYS LTD. 4.17%
RELIANCE INDUSTRIES LTD. 3.81%
I T C LTD. 3.72%
I C I C I BANK LTD. 3.24%
HOUSING DEVELOPMENT FINANCE CORPN. LTD. 3.14%
H D F C BANK LTD. 2.77%
STATE BANK OF INDIA 2.48%
LARSEN AND TOUBRO LTD. 2.27%
Titanium Fund - 1 ULIF01911/12/09BSLITITAN1109
Portfolio as on 30th September 2012
Asset Allocation
Sectoral Allocation
About the FundObjective: To optimize the participation in an actively managed well-diversified equity portfolio of fundamentally strong blue chip companies while using debt instruments and derivatives to ensure capital protection after five years.
Strategy: To dynamically manage the allocation between equities and fixed income instruments, while using derivatives when necessary and for hedging purposes only. The equity investment strategy will revolve around building and actively managing a well-diversified equity portfolio of value & growth driven fundamentally strong blue-chip companies by following a research-focused investment approach. On the fixed income side, investments will be made in government securities, high rated corporate bonds and money market instruments.
G-Secs7.90% MMI
1.56%
NCD25.45%Equities
65.09%
LARSEN AND TOUBRO LTD. 2.27%
TATA MOTORS LTD. 2.24%
HINDUSTAN UNILEVER LTD. 2.15%
OTHER EQUITY 35.10%
MMI 1.56%
Maturity ProfileRating Profile
27.46%
72.54%
Less than 2 years 2 to 7years
1.56%
1.92%
1.99%
3.05%
3.49%
4.39%
6.19%
9.02%
9.06%
9.63%
13.74%
13.79%
22.18%
TELECOM
POWER
CEMENT
DIVERSIFIED
CAPITAL GOODS
PHARMA
METAL
FMCG
FINANCIAL SERVICES
AUTOMOBILE
SOFTWARE / IT
OIL AND GAS
BANKING
Sovereign23.70%
AAA76.30%
Less than 2 years 2 to 7years
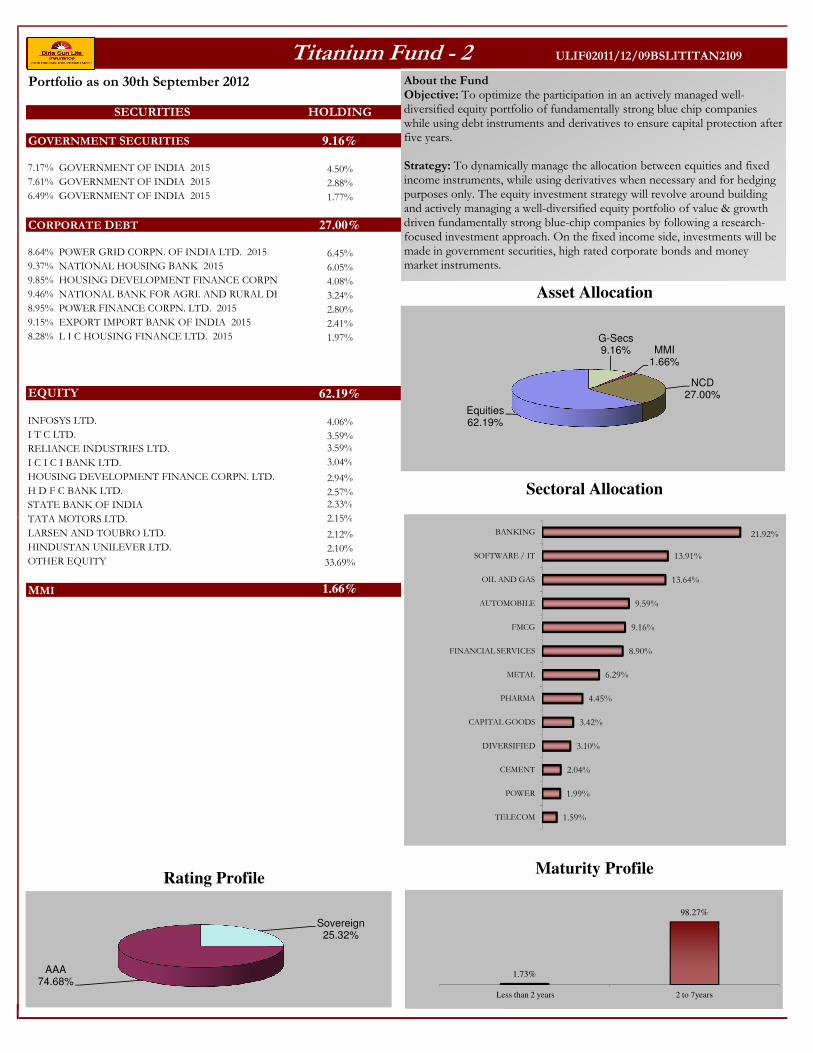
SECURITIES HOLDING
GOVERNMENT SECURITIES 9.16%
7.17% GOVERNMENT OF INDIA 2015 4.50%
7.61% GOVERNMENT OF INDIA 2015 2.88%
6.49% GOVERNMENT OF INDIA 2015 1.77%
CORPORATE DEBT 27.00%
8.64% POWER GRID CORPN. OF INDIA LTD. 2015 6.45%
9.37% NATIONAL HOUSING BANK 2015 6.05%
9.85% HOUSING DEVELOPMENT FINANCE CORPN. LTD. 20154.08%
9.46% NATIONAL BANK FOR AGRI. AND RURAL DEVELOPMENT 20153.24%
8.95% POWER FINANCE CORPN. LTD. 2015 2.80%
9.15% EXPORT IMPORT BANK OF INDIA 2015 2.41%
8.28% L I C HOUSING FINANCE LTD. 2015 1.97%
EQUITY 62.19%
INFOSYS LTD. 4.06%
I T C LTD. 3.59%
RELIANCE INDUSTRIES LTD. 3.59%
I C I C I BANK LTD. 3.04%
HOUSING DEVELOPMENT FINANCE CORPN. LTD. 2.94%
H D F C BANK LTD. 2.57%
STATE BANK OF INDIA 2.33%
TATA MOTORS LTD. 2.15%
Titanium Fund - 2 ULIF02011/12/09BSLITITAN2109
Portfolio as on 30th September 2012
Asset Allocation
Sectoral Allocation
About the FundObjective: To optimize the participation in an actively managed well-diversified equity portfolio of fundamentally strong blue chip companies while using debt instruments and derivatives to ensure capital protection after five years.
Strategy: To dynamically manage the allocation between equities and fixed income instruments, while using derivatives when necessary and for hedging purposes only. The equity investment strategy will revolve around building and actively managing a well-diversified equity portfolio of value & growth driven fundamentally strong blue-chip companies by following a research-focused investment approach. On the fixed income side, investments will be made in government securities, high rated corporate bonds and money market instruments.
G-Secs9.16% MMI
1.66%
NCD27.00%
Equities62.19%
TATA MOTORS LTD. 2.15%
LARSEN AND TOUBRO LTD. 2.12%
HINDUSTAN UNILEVER LTD. 2.10%
OTHER EQUITY 33.69%
MMI 1.66%
Maturity ProfileRating Profile
1.73%
98.27%
Less than 2 years 2 to 7years
1.59%
1.99%
2.04%
3.10%
3.42%
4.45%
6.29%
8.90%
9.16%
9.59%
13.64%
13.91%
21.92%
TELECOM
POWER
CEMENT
DIVERSIFIED
CAPITAL GOODS
PHARMA
METAL
FINANCIAL SERVICES
FMCG
AUTOMOBILE
OIL AND GAS
SOFTWARE / IT
BANKING
Sovereign25.32%
AAA74.68%

SECURITIES HOLDING
GOVERNMENT SECURITIES 11.69%
6.49% GOVERNMENT OF INDIA 2015 10.97%
7.17% GOVERNMENT OF INDIA 2015 0.72%
CORPORATE DEBT 33.33%
9.37% NATIONAL HOUSING BANK 2015 5.89%
9.15% EXPORT IMPORT BANK OF INDIA 2015 5.87%
8.64% POWER GRID CORPN. OF INDIA LTD. 2015 5.44%
9.85% HOUSING DEVELOPMENT FINANCE CORPN. LTD. 20154.47%
8.95% POWER FINANCE CORPN. LTD. 2015 4.38%
8.8% STATE BANK OF HYDERABAD 2016 4.36%
9.46% NATIONAL BANK FOR AGRI. AND RURAL DEVELOPMENT 20151.48%
8.28% L I C HOUSING FINANCE LTD. 2015 1.44%
EQUITY 46.87%
INFOSYS LTD. 3.20%
RELIANCE INDUSTRIES LTD. 2.85%
I T C LTD. 2.80%
I C I C I BANK LTD. 2.20%
H D F C BANK LTD. 2.17%
HOUSING DEVELOPMENT FINANCE CORPN. LTD. 2.11%
STATE BANK OF INDIA 1.62%
TATA MOTORS LTD. 1.57%
LARSEN AND TOUBRO LTD. 1.51%
GRASIM INDUSTRIES LTD. 1.50%
Titanium Fund - 3 ULIF02111/12/09BSLITITAN3109
Portfolio as on 30th September 2012
Asset Allocation
Sectoral Allocation
About the FundObjective: To optimize the participation in an actively managed well-diversified equity portfolio of fundamentally strong blue chip companies while using debt instruments and derivatives to ensure capital protection after five years.
Strategy: To dynamically manage the allocation between equities and fixed income instruments, while using derivatives when necessary and for hedging purposes only. The equity investment strategy will revolve around building and actively managing a well-diversified equity portfolio of value & growth driven fundamentally strong blue-chip companies by following a research-focused investment approach. On the fixed income side, investments will be made in government securities, high rated corporate bonds and money market instruments.
G-Secs11.69%
MMI8.11%
NCD33.33%
Equities46.87%
GRASIM INDUSTRIES LTD. 1.50%
OTHER EQUITY 25.34%
MMI 8.11%
Maturity ProfileRating Profile
12.88%
87.12%
Less than 2 years 2 to 7years
1.65%
1.88%
2.05%
3.20%
3.23%
4.69%
6.01%
8.57%
9.16%
9.75%
13.98%
14.13%
21.71%
TELECOM
CEMENT
POWER
DIVERSIFIED
CAPITAL GOODS
PHARMA
METAL
FINANCIAL SERVICES
FMCG
AUTOMOBILE
SOFTWARE / IT
OIL AND GAS
BANKING
Sovereign25.96%
AAA74.04%
Less than 2 years 2 to 7years
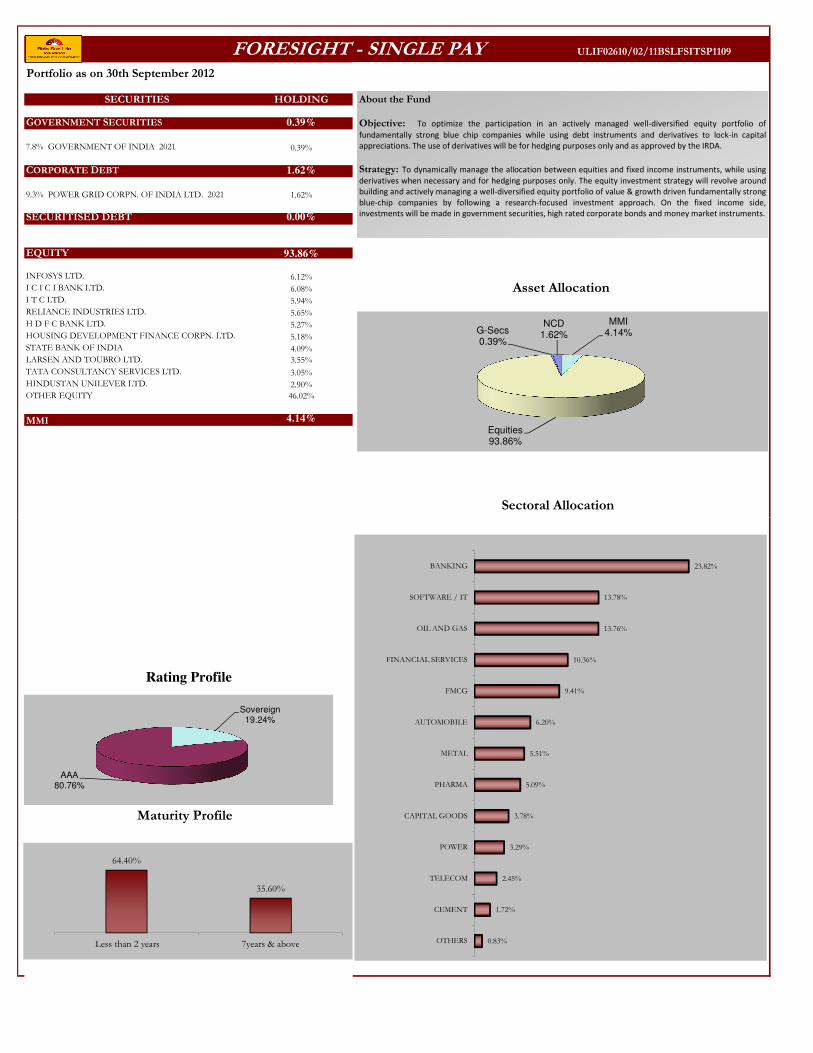
SECURITIES HOLDING
GOVERNMENT SECURITIES 0.39%
7.8% GOVERNMENT OF INDIA 2021 0.39%
CORPORATE DEBT 1.62%
9.3% POWER GRID CORPN. OF INDIA LTD. 2021 1.62%
SECURITISED DEBT 0.00%
EQUITY 93.86%
INFOSYS LTD. 6.12%
I C I C I BANK LTD. 6.08%
I T C LTD. 5.94%
RELIANCE INDUSTRIES LTD. 5.65%
H D F C BANK LTD. 5.27%
HOUSING DEVELOPMENT FINANCE CORPN. LTD. 5.18%
STATE BANK OF INDIA 4.09%
LARSEN AND TOUBRO LTD. 3.55%
TATA CONSULTANCY SERVICES LTD. 3.05%
HINDUSTAN UNILEVER LTD. 2.90%
OTHER EQUITY 46.02%
MMI 4.14%
FORESIGHT - SINGLE PAY ULIF02610/02/11BSLFSITSP1109
Portfolio as on 30th September 2012
About the Fund
Objective: To optimize the participation in an actively managed well-diversified equity portfolio of
fundamentally strong blue chip companies while using debt instruments and derivatives to lock-in capital
appreciations. The use of derivatives will be for hedging purposes only and as approved by the IRDA.
Strategy: To dynamically manage the allocation between equities and fixed income instruments, while using
derivatives when necessary and for hedging purposes only. The equity investment strategy will revolve around
building and actively managing a well-diversified equity portfolio of value & growth driven fundamentally strong
blue-chip companies by following a research-focused investment approach. On the fixed income side,
investments will be made in government securities, high rated corporate bonds and money market instruments.
MMI4.14%
Equities93.86%
G-Secs0.39%
NCD1.62%
Asset Allocation
Sectoral Allocation
Rating Profile
0.83%
1.72%
2.45%
3.29%
3.78%
5.09%
5.51%
6.20%
9.41%
10.36%
13.76%
13.78%
23.82%
OTHERS
CEMENT
TELECOM
POWER
CAPITAL GOODS
PHARMA
METAL
AUTOMOBILE
FMCG
FINANCIAL SERVICES
OIL AND GAS
SOFTWARE / IT
BANKING
64.40%
35.60%
Less than 2 years 7years & above
Maturity Profile
Sovereign19.24%
AAA80.76%

SECURITIES HOLDING
GOVERNMENT SECURITIES 3.24%
7.94% GOVERNMENT OF INDIA 2021 2.44%
7.8% GOVERNMENT OF INDIA 2021 0.73%
8.79% GOVERNMENT OF INDIA 2021 0.07%
CORPORATE DEBT 6.54%
9.64% POWER GRID CORPN. OF INDIA LTD. 2021 2.60%
9.3% POWER GRID CORPN. OF INDIA LTD. 2021 1.53%
9.04% EXPORT IMPORT BANK OF INDIA 2022 0.84%
9.35% POWER GRID CORPN. OF INDIA LTD. 2021 0.68%
9.9% HOUSING DEVELOPMENT FINANCE CORPN. LTD. 2021 0.44%
9.61% POWER FINANCE CORPN. LTD. 2021 0.38%
RURAL ELECTRIFICATION CORPN. LTD. 2020 0.08%
SECURITISED DEBT 0.00%
EQUITY 79.08%
INFOSYS LTD. 5.39%
RELIANCE INDUSTRIES LTD. 4.83%
I C I C I BANK LTD. 4.72%
I T C LTD. 4.59%
HOUSING DEVELOPMENT FINANCE CORPN. LTD. 3.90%
H D F C BANK LTD. 3.82%
STATE BANK OF INDIA 3.53%
LARSEN AND TOUBRO LTD. 3.12%
TATA CONSULTANCY SERVICES LTD. 2.65%
HINDUSTAN UNILEVER LTD. 2.60%
OTHER EQUITY 39.94%
MMI 11.13%
FORESIGHT - 5 PAY ULIF02510/02/11BSLFSIT5P1109
Portfolio as on 30th September 2012
About the Fund
Objective: To optimize the participation in an actively managed well-diversified equity portfolio of
fundamentally strong blue chip companies while using debt instruments and derivatives to lock-in capital
appreciations. The use of derivatives will be for hedging purposes only and as approved by the IRDA.
Strategy: To dynamically manage the allocation between equities and fixed income instruments, while using
derivatives when necessary and for hedging purposes only. The equity investment strategy will revolve around
building and actively managing a well-diversified equity portfolio of value & growth driven fundamentally strong
blue-chip companies by following a research-focused investment approach. On the fixed income side,
investments will be made in government securities, high rated corporate bonds and money market instruments.
NCD6.54%
MMI11.13%
Equities79.08%
G-Secs3.24%
Asset Allocation
Sectoral AllocationMMI 11.13%
Maturity Profile
Rating Profile
0.80%
1.67%
2.46%
3.44%
3.94%
5.24%
5.74%
6.40%
9.09%
9.83%
14.09%
14.34%
22.97%
OTHERS
CEMENT
TELECOM
POWER
CAPITAL GOODS
PHARMA
METAL
AUTOMOBILE
FMCG
FINANCIAL SERVICES
OIL AND GAS
SOFTWARE / IT
BANKING
50.98%
49.02%
Less than 2 years 7years & above
P1+/A1+24.38%
Sovereign25.05%
AAA50.57%

SECURITIES HOLDING
GOVERNMENT SECURITIES 30.09%
8.2% GOVERNMENT OF INDIA 2022 5.70%
8.79% GOVERNMENT OF INDIA 2021 5.54%
9.15% GOVERNMENT OF INDIA 2024 5.32%
8.15% GOVERNMENT OF INDIA 2022 4.66%
7.59% GOVERNMENT OF INDIA 2016 4.07%
7.95% GOVERNMENT OF INDIA 2032 2.72%
7.46% GOVERNMENT OF INDIA 2017 2.09%
CORPORATE DEBT 51.94%
9.4% POWER FINANCE CORPN. LTD. 2013 5.02%
7.6% HOUSING DEVELOPMENT FINANCE CORPN. LTD. 2017 4.10%
11.5% RURAL ELECTRIFICATION CORPN. LTD. 2013 3.68%
10.48% ULTRATECH CEMENT LTD. 2013 3.65%
8.8% POWER GRID CORPN. OF INDIA LTD. 2013 3.58%
9.25% EXPORT IMPORT BANK OF INDIA 2012 3.58%
7.55% NATIONAL HOUSING BANK 2013 3.55%
11.95% HOUSING DEVELOPMENT FINANCE CORPN. LTD. 2018 2.44%
10.7% INDIAN RAILWAY FINANCE CORPN. LTD. 2023 2.44%
11.45% RELIANCE INDUSTRIES LTD. 2013 2.21%
OTHER CORPORATE DEBT 17.69%
EQUITY 9.71%
RELIANCE INDUSTRIES LTD. 0.60%
I C I C I BANK LTD. 0.58%
INFOSYS LTD. 0.55%
I T C LTD. 0.55%
HOUSING DEVELOPMENT FINANCE CORPN. LTD. 0.42%
Pension Nourish Fund ULIF00604/03/03BSLNOURISH109
Portfolio as on 30th September 2012
Asset Allocation
Rating Profile
About the FundObjective: To generate persistent return through active management of fixed incomeportfolio and focus on creating long-term equity portfolio, which will enhance yield ofcomposite portfolio with minimum risk appetite.
Strategy: To invest in fixed income securities with marginal exposure to equity up to 10%at low level of risk. This fund is suitable for those who want to protect their capital and earnsteady return on investment through higher exposure to debt securities.
AA1.02%
AA-1.78%
AA+2.52%
P1+/A1+4.13%
SovereignAAA
55.37%
MMI8.26% Equities
9.71%
G-Secs30.09%
NCD51.94%
HOUSING DEVELOPMENT FINANCE CORPN. LTD. 0.42%
LARSEN AND TOUBRO LTD. 0.38%
H D F C BANK LTD. 0.37%
STATE BANK OF INDIA 0.31%
OIL AND NATURAL GAS CORPN. LTD. 0.27%
TATA CONSULTANCY SERVICES LTD. 0.25%
OTHER EQUITY 5.43%
MMI 8.26%
Maturity Profile
Sectoral Allocation
1.23%
1.68%
1.95%
2.12%
2.24%
3.69%
4.88%
5.16%
6.90%
7.06%
7.66%
10.15%
11.45%
11.70%
22.15%
CEMENT
OTHERS
TELECOM
DIVERSIFIED
AUTO ANCILLIARY
AUTOMOBILE
POWER
CAPITAL GOODS
PHARMA
METAL
FINANCIAL SERVICES
FMCG
OIL AND GAS
SOFTWARE / IT
BANKING
43.32%
24.37%
32.32%
Less than 2 years 2 to 7years 7years & above
Sovereign35.17%
55.37%

SECURITIES HOLDING
GOVERNMENT SECURITIES 25.07%
8.79% GOVERNMENT OF INDIA 2021 8.29%
8.15% GOVERNMENT OF INDIA 2022 3.62%
7.95% GOVERNMENT OF INDIA 2032 2.93%
7.8% GOVERNMENT OF INDIA 2021 2.73%
7.59% GOVERNMENT OF INDIA 2016 1.98%
7.46% GOVERNMENT OF INDIA 2017 1.83%
8.08% GOVERNMENT OF INDIA 2022 1.06%
5.64% GOVERNMENT OF INDIA 2019 1.05%
8.2% GOVERNMENT OF INDIA 2022 0.93%
8.28% GOVERNMENT OF INDIA 2032 0.66%
CORPORATE DEBT 47.55%
10.48% ULTRATECH CEMENT LTD. 2013 5.45%
8.8% POWER GRID CORPN. OF INDIA LTD. 2013 5.36%
7.75% RURAL ELECTRIFICATION CORPN. LTD. 2012 4.81%
11.5% RURAL ELECTRIFICATION CORPN. LTD. 2013 4.13%
11.95% HOUSING DEVELOPMENT FINANCE CORPN. LTD. 2018 3.05%
10.05% NATIONAL BANK FOR AGRI. AND RURAL DEVELOPMENT 20142.73%
9.4% NATIONAL BANK FOR AGRI. AND RURAL DEVELOPMENT 20162.72%
9.3% STATE BANK OF INDIA 2021 2.71%
10.75% RELIANCE INDUSTRIES LTD. 2018 2.61%
8.6% POWER FINANCE CORPN. LTD. 2014 2.14%
OTHER CORPORATE DEBT 11.84%
EQUITY 19.80%
RELIANCE INDUSTRIES LTD. 1.19%
I C I C I BANK LTD. 1.15%
INFOSYS LTD. 1.13%
I T C LTD. 1.12%
HOUSING DEVELOPMENT FINANCE CORPN. LTD. 0.85%
Pension Growth Fund ULIF00504/03/03BSLIGROWTH109
Portfolio as on 30th September 2012
Asset Allocation
Rating Profile
About the FundObjective: To build your capital and generate better returns at moderate level of risk, over amedium or long-term period through a balance of investment in equity and debt.
Strategy: Generate better return with moderate level of risk through active management of fixedincome portfolio and focus on creating long term equity portfolio which will enhance yield ofcomposite portfolio with low level of risk appetite.
AA2.26%
Sovereign34.53%
AAA63.22%
MMI7.58%
EQUITY19.80%
GOVERNMENT SECURITIES
25.07%
CORPORATE DEBT
47.55%
HOUSING DEVELOPMENT FINANCE CORPN. LTD. 0.85%
LARSEN AND TOUBRO LTD. 0.75%
H D F C BANK LTD. 0.75%
STATE BANK OF INDIA 0.62%
OIL AND NATURAL GAS CORPN. LTD. 0.55%
TATA CONSULTANCY SERVICES LTD. 0.49%
OTHER EQUITY 11.21%
MMI 7.58%
Maturity Profile
Sectoral Allocation
0.93%
1.24%
1.93%
2.07%
2.47%
2.62%
3.62%
4.41%
4.92%
6.74%
6.85%
7.57%
10.20%
11.28%
11.54%
21.62%
OTHERS
CONSTRUCTION
TELECOM
DIVERSIFIED
AUTO ANCILLIARY
CEMENT
AUTOMOBILE
POWER
CAPITAL GOODS
PHARMA
METAL
FINANCIAL SERVICES
FMCG
OIL AND GAS
SOFTWARE / IT
BANKING
43.77%
24.61%31.62%
Less than 2 years 2 to 7years 7years & above
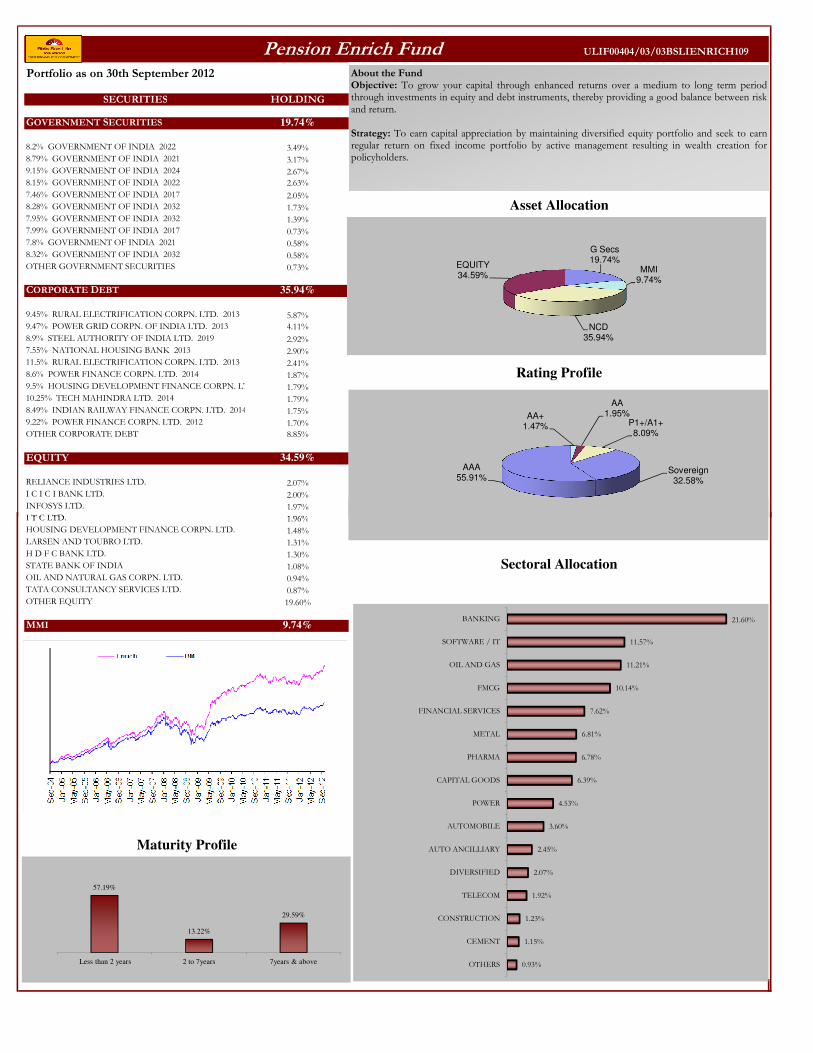
SECURITIES HOLDING
GOVERNMENT SECURITIES 19.74%
8.2% GOVERNMENT OF INDIA 2022 3.49%
8.79% GOVERNMENT OF INDIA 2021 3.17%
9.15% GOVERNMENT OF INDIA 2024 2.67%
8.15% GOVERNMENT OF INDIA 2022 2.63%
7.46% GOVERNMENT OF INDIA 2017 2.05%
8.28% GOVERNMENT OF INDIA 2032 1.73%
7.95% GOVERNMENT OF INDIA 2032 1.39%
7.99% GOVERNMENT OF INDIA 2017 0.73%
7.8% GOVERNMENT OF INDIA 2021 0.58%
8.32% GOVERNMENT OF INDIA 2032 0.58%
OTHER GOVERNMENT SECURITIES 0.73%
CORPORATE DEBT 35.94%
9.45% RURAL ELECTRIFICATION CORPN. LTD. 2013 5.87%
9.47% POWER GRID CORPN. OF INDIA LTD. 2013 4.11%
8.9% STEEL AUTHORITY OF INDIA LTD. 2019 2.92%
7.55% NATIONAL HOUSING BANK 2013 2.90%
11.5% RURAL ELECTRIFICATION CORPN. LTD. 2013 2.41%
8.6% POWER FINANCE CORPN. LTD. 2014 1.87%
9.5% HOUSING DEVELOPMENT FINANCE CORPN. LTD. 2017 1.79%
10.25% TECH MAHINDRA LTD. 2014 1.79%
8.49% INDIAN RAILWAY FINANCE CORPN. LTD. 2014 1.75%
9.22% POWER FINANCE CORPN. LTD. 2012 1.70%
OTHER CORPORATE DEBT 8.85%
EQUITY 34.59%
RELIANCE INDUSTRIES LTD. 2.07%
I C I C I BANK LTD. 2.00%
INFOSYS LTD. 1.97%
I T C LTD. 1.96%
Pension Enrich Fund ULIF00404/03/03BSLIENRICH109
Portfolio as on 30th September 2012
Asset Allocation
Rating Profile
About the FundObjective: To grow your capital through enhanced returns over a medium to long term periodthrough investments in equity and debt instruments, thereby providing a good balance between riskand return.
Strategy: To earn capital appreciation by maintaining diversified equity portfolio and seek to earnregular return on fixed income portfolio by active management resulting in wealth creation forpolicyholders.
AA+1.47%
AA1.95%
P1+/A1+8.09%
Sovereign32.58%
AAA55.91%
G Secs19.74%
MMI9.74%
NCD35.94%
EQUITY34.59%
I T C LTD. 1.96%
HOUSING DEVELOPMENT FINANCE CORPN. LTD. 1.48%
LARSEN AND TOUBRO LTD. 1.31%
H D F C BANK LTD. 1.30%
STATE BANK OF INDIA 1.08%
OIL AND NATURAL GAS CORPN. LTD. 0.94%
TATA CONSULTANCY SERVICES LTD. 0.87%
OTHER EQUITY 19.60%
MMI 9.74%
Maturity Profile
Sectoral Allocation
0.93%
1.15%
1.23%
1.92%
2.07%
2.45%
3.60%
4.53%
6.39%
6.78%
6.81%
7.62%
10.14%
11.21%
11.57%
21.60%
OTHERS
CEMENT
CONSTRUCTION
TELECOM
DIVERSIFIED
AUTO ANCILLIARY
AUTOMOBILE
POWER
CAPITAL GOODS
PHARMA
METAL
FINANCIAL SERVICES
FMCG
OIL AND GAS
SOFTWARE / IT
BANKING
57.19%
13.22%
29.59%
Less than 2 years 2 to 7years 7years & above

SECURITIES HOLDING
GOVERNMENT SECURITIES 0.00%
CORPORATE DEBT 0.00%
SECURITISED DEBT 0.00%
EQUITY 0.00%
MMI 100.00%
STATE BANK OF BIKANER AND JAIPUR CD (MD 26/12/2012) 8.88%
CBLO - 01OCT2012 8.18%
VIJAYA BANK CD ( MD 06/03/2013) 7.29%
HDFC BANK LIMITED CD (MD 21/06/2013) 7.10%
CHOLAMANDALAM INVST AND FINANCE CP (MD 15/10/2012) 7.04%
AFCONS INFRASTRUCTURE LTD. CP (MD 09/11/2012) 6.99%
CANARA BANK CD (MD 14/12/2012) 5.94%
BANK OF INDIA CD (MD 28/03/2013) 5.58%
ORIENTAL BANK OF COMMERCE CD (MD 20/03/2013) 5.13%
RANBAXY LABORATORIES LTD CP (MD 22/10/2012) 4.02%
Cash and Other MMI 33.86%
Liquid PlusPortfolio as on 30th September 2012
About the Fund Objective: To provide reasonable & stable returns, at a high level of safety and liquidity for capital conservation for the Policyholder by investing in low maturity debt & money market instruments Strategy: The strategy of this BSLI Fund Option is to make judicious investments in high quality debt and money market instruments to protect capital of the policyholder & generate steady returns at very low level of risk
100.00%
Less than 2 years
Sovereign 9.05%
P1+/A1+ 90.95%
MMI 100.00%
Asset Allocation
Rating Profile
Maturity Profile
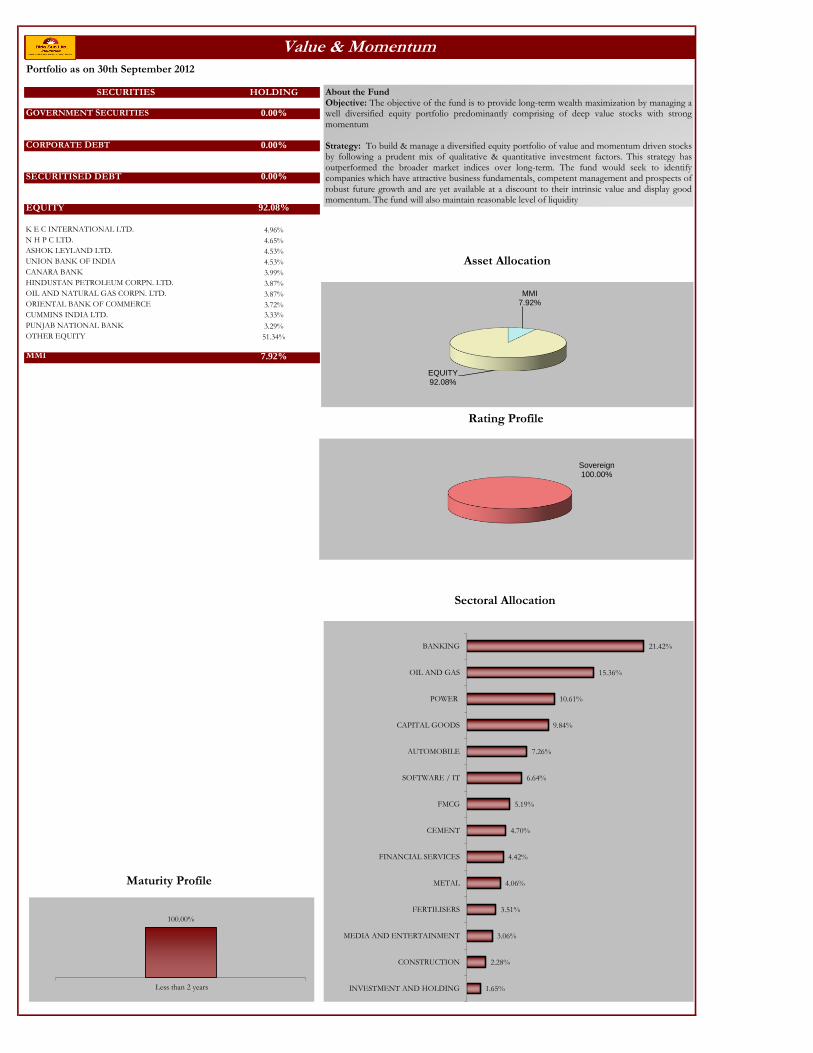
SECURITIES HOLDING
GOVERNMENT SECURITIES 0.00%
CORPORATE DEBT 0.00%
SECURITISED DEBT 0.00%
EQUITY 92.08%
K E C INTERNATIONAL LTD. 4.96%
N H P C LTD. 4.65%
ASHOK LEYLAND LTD. 4.53%
UNION BANK OF INDIA 4.53%
CANARA BANK 3.99%
HINDUSTAN PETROLEUM CORPN. LTD. 3.87%
OIL AND NATURAL GAS CORPN. LTD. 3.87%
ORIENTAL BANK OF COMMERCE 3.72%
CUMMINS INDIA LTD. 3.33%
PUNJAB NATIONAL BANK 3.29%
OTHER EQUITY 51.34%
MMI 7.92%
Value & MomentumPortfolio as on 30th September 2012
About the Fund Objective: The objective of the fund is to provide long-term wealth maximization by managing a well diversified equity portfolio predominantly comprising of deep value stocks with strong momentum Strategy: To build & manage a diversified equity portfolio of value and momentum driven stocks by following a prudent mix of qualitative & quantitative investment factors. This strategy has outperformed the broader market indices over long-term. The fund would seek to identify companies which have attractive business fundamentals, competent management and prospects of robust future growth and are yet available at a discount to their intrinsic value and display good momentum. The fund will also maintain reasonable level of liquidity
1.65%
2.28%
3.06%
3.51%
4.06%
4.42%
4.70%
5.19%
6.64%
7.26%
9.84%
10.61%
15.36%
21.42%
INVESTMENT AND HOLDING
CONSTRUCTION
MEDIA AND ENTERTAINMENT
FERTILISERS
METAL
FINANCIAL SERVICES
CEMENT
FMCG
SOFTWARE / IT
AUTOMOBILE
CAPITAL GOODS
POWER
OIL AND GAS
BANKING
100.00%
Less than 2 years
Sovereign 100.00%
MMI 7.92%
EQUITY 92.08%
Asset Allocation
Rating Profile
Sectoral Allocation
Maturity Profile
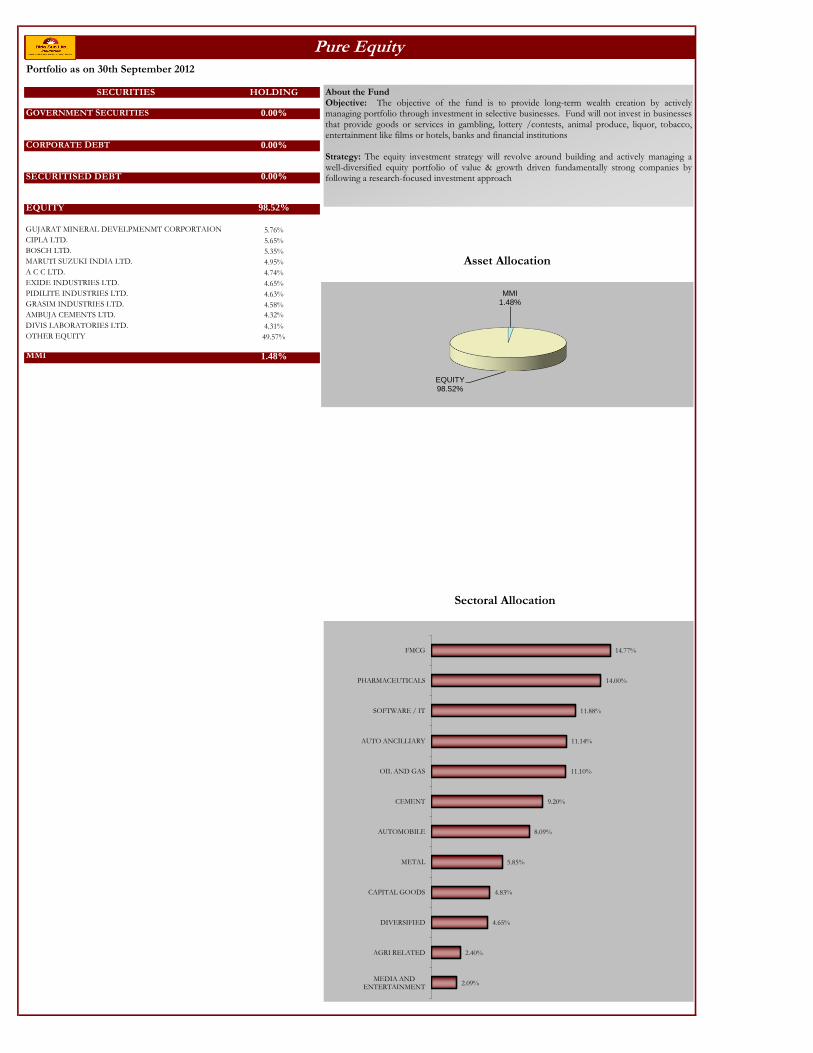
SECURITIES HOLDING
GOVERNMENT SECURITIES 0.00%
CORPORATE DEBT 0.00%
SECURITISED DEBT 0.00%
EQUITY 98.52%
GUJARAT MINERAL DEVELPMENMT CORPORTAION 5.76%
CIPLA LTD. 5.65%
BOSCH LTD. 5.35%
MARUTI SUZUKI INDIA LTD. 4.95%
A C C LTD. 4.74%
EXIDE INDUSTRIES LTD. 4.65%
PIDILITE INDUSTRIES LTD. 4.63%
GRASIM INDUSTRIES LTD. 4.58%
AMBUJA CEMENTS LTD. 4.32%
DIVIS LABORATORIES LTD. 4.31%
OTHER EQUITY 49.57%
MMI 1.48%
Pure EquityPortfolio as on 30th September 2012
About the Fund Objective: The objective of the fund is to provide long-term wealth creation by actively managing portfolio through investment in selective businesses. Fund will not invest in businesses that provide goods or services in gambling, lottery /contests, animal produce, liquor, tobacco, entertainment like films or hotels, banks and financial institutions Strategy: The equity investment strategy will revolve around building and actively managing a well-diversified equity portfolio of value & growth driven fundamentally strong companies by following a research-focused investment approach
2.09%
2.40%
4.65%
4.83%
5.85%
8.09%
9.20%
11.10%
11.14%
11.88%
14.00%
14.77%
MEDIA AND ENTERTAINMENT
AGRI RELATED
DIVERSIFIED
CAPITAL GOODS
METAL
AUTOMOBILE
CEMENT
OIL AND GAS
AUTO ANCILLIARY
SOFTWARE / IT
PHARMACEUTICALS
FMCG
MMI 1.48%
EQUITY 98.52%
Asset Allocation
Sectoral Allocation