Key Fundamental Factors - Pakistan Institute of ... 18AGM/Key Fundamental Factors.pdf · Key...
22
Key Fundamental Factors and Long-run Price Changes in An Emerging Market ---A Case Study of Karachi Stock Exchange Chaudhary Mohammad Irfan M.Phil Research Fellow Applied Economics Research Centre University of Karachi email: [email protected] and Dr. Mohammed Nishat Professor and Chairman Department of Economics and Finance Institute of Business Administration University Road, Karachi email: [email protected] Phone: 111-422-422, Fax: 9243421 Abstract This paper identifies the joint effect multiple factors exert on share prices in Karachi Stock Exchange (KSE) using annual balance sheet data of listed firms during 1981 to 2000. Out of six theory suggested fundamental variables (dividend yield, payout ratio, size, asset growth, leverage and earning volatility) the significant joint factors observed are payout ratio, size, leverage and dividend yield. Together these four factors explain one-fourth variation in share prices at KSE. The explanatory power of fundamental factors is found to be different in pre-reform period (1981-1990) and post-reform period (1991-2000). In pre-reform period three factors i.e. payout ratio, size and dividend yield explain about half of the variation in share prices whereas during post-reform period these factors explained about one-third of the variability in these prices. The correct sign of size effect is only observed in the pre-reform period. Key Words: Fundamental factors; Share price volatility; Valuation theories; Financial reforms. JEL Classification: F14, G10
Transcript of Key Fundamental Factors - Pakistan Institute of ... 18AGM/Key Fundamental Factors.pdf · Key...
Key Fundamental Factors and Long-run Price Changes
in An Emerging Market ---A Case Study of Karachi Stock Exchange
Chaudhary Mohammad Irfan M.Phil Research Fellow
Applied Economics Research Centre University of Karachi
email: [email protected]
and
Dr. Mohammed Nishat Professor and Chairman
Department of Economics and Finance Institute of Business Administration
University Road, Karachi email: [email protected]
Phone: 111-422-422, Fax: 9243421
Abstract
This paper identifies the joint effect multiple factors exert on share prices in Karachi Stock Exchange
(KSE) using annual balance sheet data of listed firms during 1981 to 2000. Out of six theory suggested
fundamental variables (dividend yield, payout ratio, size, asset growth, leverage and earning volatility)
the significant joint factors observed are payout ratio, size, leverage and dividend yield. Together these
four factors explain one-fourth variation in share prices at KSE. The explanatory power of fundamental
factors is found to be different in pre-reform period (1981-1990) and post-reform period (1991-2000).
In pre-reform period three factors i.e. payout ratio, size and dividend yield explain about half of the
variation in share prices whereas during post-reform period these factors explained about one-third of
the variability in these prices. The correct sign of size effect is only observed in the pre-reform period.
Key Words: Fundamental factors; Share price volatility; Valuation theories; Financial reforms. JEL Classification: F14, G10
1
“Key Fundamental Factors and Long-run Price Changes in An Emerging Market” ---A Case Study of Karachi Stock Exchange (KSE)
Chaudhary Mohammad Irfan Mohammed Nishat1
1. Introduction
Share prices are the most important indicator readily available to the investors for their
decision to invest or not in a particular share. Theories suggest that share price changes is
associated with changes in fundamental variables which are relevant for share valuation like
payout ratio, dividend yield, capital structure, earnings size of the firm and its growth,
[Wilcox (1984), Rappoport (1986), Downs (1991)]. Linter (1956) linked dividend changes to
earnings while Shapiro valuation model (1962) showed dividend streams discounted by the
difference in discount rate and growth in dividend should be equal to share price. This
predicts direct relation between pay out ratio and the price-earning multiple. Conversely it
means that there is an inverse relation between pay out ratio and share price changes. Several
event-based studies established direct relation between share price changes and either
earnings or dividend changes (Ball and Brown 1968: Baskin 1989). Sharpe (1964) and
Hamada (1972) suggested direct relation between share price changes and capital structure.
Beaver, Kettler and Sholes (1970) showed that firms appear to pay less of their earnings if
firms have higher earning volatility. This suggests payout ratio as relevant factor for share
price changes. Investigations of share price changes appear to yield evidence that changes in
fundamental variable(s) should jointly bring about changes in share prices both in developed
and emerging markets. However, the actual fundamental factors found to be relevant may
vary from market to market. For example, changes in asset growth of firms are significant in
the case of Japanese shares while earnings appear to be universally a relevant factor (Ariff et
al., 1994). However, it is widely agreed that a set of fundamental variables as suggested by
2
individual theories is no doubt relevant as possible factors affecting share price changes in the
short and the long-run (Ariff and Khan, 2000).
The link between fundamental factors and share price changes has been extensively
investigated over short horizons but only few studies attempted to model it over lengthy
periods of time. Studies over short windows commonly apply cross-sectional tests using
event-based research methodology. The cases of studies examining this relation cross-
sectional or inter-temporally are few, and these have one common feature i.e., the
fundamental factors used in a specific study are either one or two although there is a long list
of fundamental factors. Furthermore, while price revisions at the time of announcements of
price relevant disclosures are valid as announcement effects shown over short horizons, it is
equally important to test the effect over a lengthier period of time using data over several
years as measure of the variables (Ariff and Khan, 2000). Black and Sholes (1973) support
the idea, that the value of security will be higher, the higher is the volatility of security’s
return. The relation between dividend and earning follows that the greater the volatility of
earnings of a firm, the less is the likelihood of dividend yield being changed by the firm’s
management. Hence earnings volatility is directly related to share price volatility.
Another relevant factor in affecting the share prices is the capital structure of the firm. The
level of debt financing by the firm has impact on the value of firm’s assets. Hamada (1972)
and Sharpe (1964) specify their theories regarding the capital structure. A high-risk firm (a
firm with debt) must generate high return consistent with the investor’s expected return. It
follows that with higher debt firm should have greater rate of change in its share price. Hence
capital structure (DA as debt to asset ratio) changes must be directly related to the share price
volatility. Modigliani and Miller (1958) emphasized that in competitive capital markets the
value of a firm is independent of its financial structure. But if markets are imperfect
Authors are MPhil research fellow at Applied Economics Research Centre, University of Karachi and Professor and Chairman, Department of Economics and Finance, Institute of Business Administration,
3
(transaction cost, taxes, informational asymmetry, agency cost etc.) then capital structure
matters and influences the share prices.
Size of a firm does have effect on the valuation of the firm assets. Smaller stocks have higher
average returns. Introduction of size, as a multiplicative term to dividend, provides a
significant improvement in the explanation of share prices (Karathanassis and Philiappas,
1988). The size of the firm if captured through total capital employed, is expected to influence
the share prices positively as large firms are better diversified than small ones and thus are
less risky (Benishy, 1961). Atiase (1985) showed that as the size of the firm increases, their
share price volatility declines.
(Ariff et al, 1994) established the joint linear effect of these six variables for the three markets
using data relating to samples of firms over 16 or more years in Japan, Malaysia and
Singapore. In general, the six variables are significantly related to share price volatility in the
three markets although some were not significant in particular markets. In the case of more
analytically intensive Japanese market, changes in the fundamental factors accounted for two-
fifth of the variation in share price volatility The same was not the case in the less analytically
intensive developing markets of Malaysia and Singapore. Obviously, larger portions of price
variation appear not to be explained by the variation in the six firm-specific fundamental
variables in the less developing markets. Perhaps, prices in the latter two markets, it may be
suggested, are more responsive to macroeconomic factors, which were not included in the
cross-sectional tests. Alternatively, investors in such markets are not pricing the shares on the
basis of fundamental factors, perhaps preferring to price on speculative information. The US
Investors are known to price the securities much more on the basis of analysis made widely
available by the financial analyst community and the mass media. In another study (Ariff,
2000) on a sample of hundred homogenous industrial firms, four out of these six factors were
found significant and explained two-third of share price volatility over a window of twenty
years for US market.
Karachi respectively.
4
Karachi stock exchange is an important emerging capital market of the region among the
developing countries. KSE is termed as high-risk high return market where investors seek
high-risk premium (Nishat, 1999). Few studies have attempted to analyse the long run
behavior of the market (Nishat, 1991) and no work has been done to explore the fundamental
variables affecting the share prices. Factors affecting share prices has been identified for the
short run (Nishat, 1995; Nishat and Saghir, 1991). It is also important to study these factors
in the Pakistani context after the introduction of reforms, which emphasized more towards
openness to foreign investor and competition. Under reforms emphasis has been on
information disclosure by companies, documentation, increasing role of brokerage houses and
investment companies which provide more feedback to investor. The objective of this study
is to investigate the joint effect fundamental factors may have on share prices in the long run.
It also attempts to see the impact of these factors in two sub periods to assess the reform
impact on the share price changes. This paper is a modest first attempt in Pakistan in this
direction using the data of all the firms’ (160) that are continuously listed for last 20years.
The rest of the paper is organized as follows. The second section describes the econometric
model and estimation methods. The data description and variable construction is discussed in
section three followed by results and discussion in section four. Section five provides
summary and conclusion.
2. Econometric Model and Estimation methods
Keeping in view these six factors an approximation of the relation between share price
volatility (PV) and the identified fundamental variables namely dividend yield (DY), payout
ratio (POR), Leverage (DA), asset growth (ASg), Size of the firm (SZ) and earning volatility
(EV). can be given in the following form
5
The directions of the predicted relations between share price changes and the factors are
indicated by the + or – signs placed as superscripts above the symbols used for the factors.
These factors will be identified on an annual basis over a lengthy period of twenty years to
estimate a valid relation using all the continuously twenty year listed companies at KSE. The
analysis utilized cross-sectional weighted least square regression. First test involved
regressing the dependent variable PV against all the independent variables separately. This
provides a crude test of the relationship between common stock volatility and the theory
suggested fundamental variables individually. Thus providing the impact of each variable on
stock price change if no other factor is considered.
In an attempt to find the collective impact of these six factors on price variability all the
factors are regressed against the dependent variable PV. The test model can now be specified
using observations per firm, j, where j = 1, -----160 during t period where t = 1981 to 2000
The expectation was that the DY, POR, ASg and SZ would be negatively related to the PV
whilst EV and DA would be positively related to PV. The sign for the ASg and SZ and EV
found to be contrary to the theory.
The firms selected are heterogeneous in character ranging from big firms like as in energy
sector to smaller ones as in textile sector. Because of the presence of heteroscedasticity in the
data we are using Weighted Least Squares (WLS). The first set of estimation is from running
the regression using all the variables. Adding more variables biases the researcher in favour of
acceptance of the test model. Therefore, it is necessary to carry out a selection procedure to
) ; ; ; ; ;( +−−+−−= EVSZASgDAPORDYfPV
tjtjtjtjjtjtjtttjSZASgEVDAPORDYPV ελλλλλλλ +++++++= )()()()()()( 6543210
6
choose a parsimonious model. We use the Akaike selection statistical procedure to eliminate
errors that could arise from multi collinear independent variables. The results after this
selection, which is a step-wise regression procedure, are presented separately.
3. Data and Variables Construction
Price change (PV) is represented by a price volatility measure, using extreme value method
developed by Parkinson (1980) somewhat similar to the standard deviation, but superior to
the traditional measure of standard deviation. Parkinson (1980) showed that the extreme value
method developed by him is 2.5 to 5 times superior as a measure of variance in a variable.
The year’s high and low share prices of a firm are used to calculate the rate of changes in
prices over the test period. This measure is appropriate to capture the changes in share prices
on an annual basis, and it is expressed as a rate of change measure but it has greater amplitude
than in case with the more common standard deviation. Tests showed that this variable has
produced reliable results reported in other studies.
The six independent variables are measured on an annual basis, each firm providing a total of
twenty annual observations. Dividend yield for the cross sectional regression test using the
sample of firms will be the averages of the dividend yields of individual firms, the average
being taken over the estimation year per firm.
Dividend Yield
This variable was calculated by summing all the annual dividends paid to common
shareholders and then dividing this sum by the market value of the common stock. The
average of all available years was utilized.
7
Earning volatility
First, the average of the total earnings to total asset ratios for all years was obtained. Then,
the average of the squared deviation from the overall average was calcula ted. A square root
transformation was applied to the mean squared deviation to obtain estimates of standard
deviations.
Payout ratio
Total cumulative individual company earnings and dividends were calculated for all years.
Payout is the ratio of total dividends to total earnings of the firm. The use of this procedure
means that the problem of extreme value in individual years due to low or possibly negative
net income is reduced. Furthermore the payout ratio was set to one in cases where total
dividends exceeded total cumulative profits.
Size
The variable size was constructed in a form that reflects the order of magnitude in real terms.
The variable was constructed by taking the average market of common stock for the period
1981 to 2000. The value (in millions) of real size was averaged over the period.
Leverage
The ratio of long term debt to total assets was calculated. The average of all years was used in
the analysis.
Growth in assets
The yearly growth rate was calculated by taking the ratio of the change in total assets. The
average over all years was used in analysis.
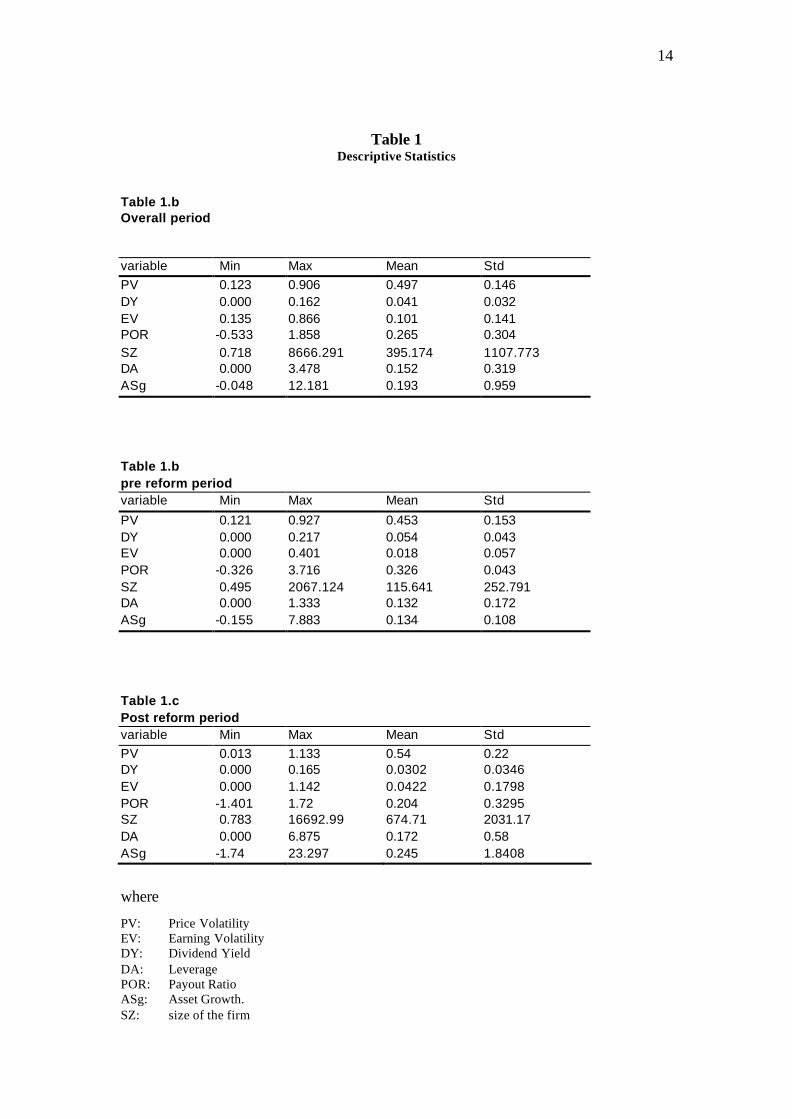
The behaviour of the variables over the long run as defined in an earlier section is presented
in Tables 1.a, 1.b and 1.c the descriptive statistics of the of the data in overall, pre-reform and
8
post-reform periods respectively. All the firms that are continuously listed on the Karachi
Stock Exchange from 1981 to 2000 has been taken for the purpose. The annual data of these
firms is taken from the various issues of “balance sheet analysis” published by State Bank of
Pakistan. Price data has been taken from the annual reports and annual publications of
Karachi Stock Exchange.
4. Results and Discussion
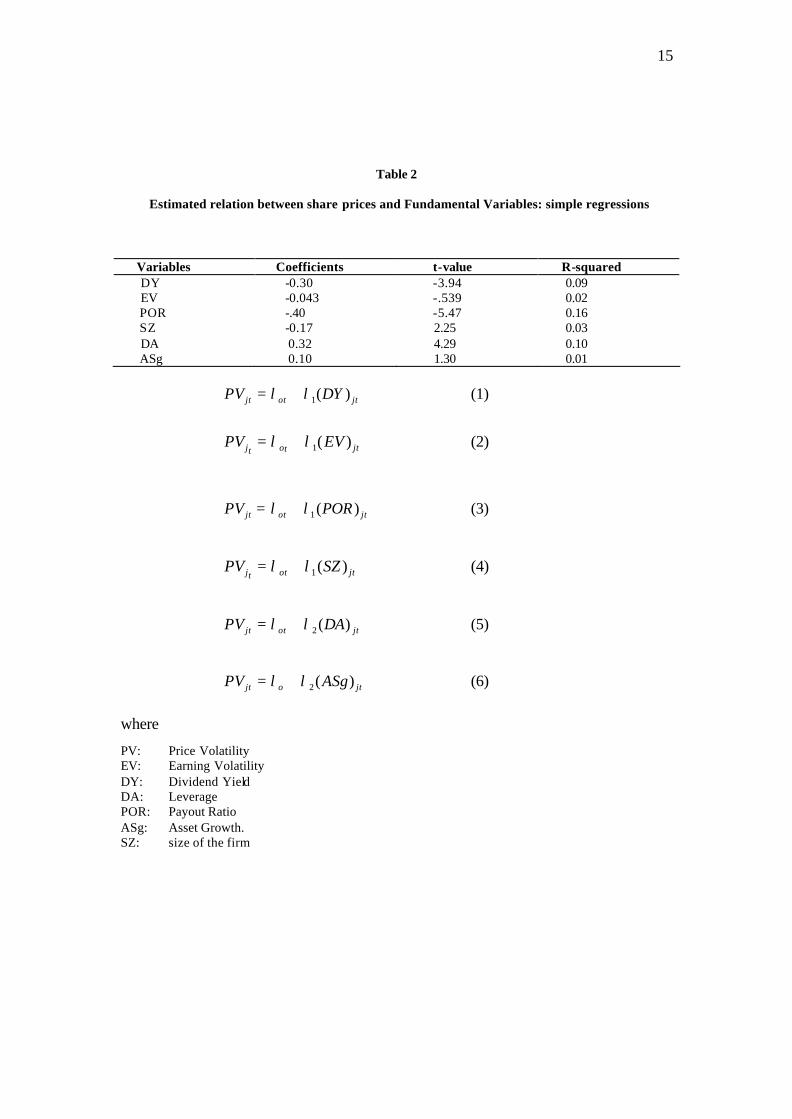
Table 2 reports the test results of regression between price change variable (PV) and each of
the six independent variables. This generates the kind of results most commonly found in
existing literature investigating one fundamental variable at a time. The results of this
regression show that two variables Earning volatility (EV) and Asset growth (ASg) are not
significantly explaining the price volatility. The other four variables are significant but not
substantial enough to explain a large portion of price variation. The explained variation
ranges from as low as 1 per cent in case of asset growth to as high as 16 per cent for payout
ratio. Earning volatility, which is significant factor in most of the markets, is insignificant in
case of KSE. Individually the highest impact is of pay out ratio which is 16 per cent while
lowest is of size if we consider the significant variables only. Highest impact is of POR
followed by leverage, dividend yield and size. Contrary to theory, size has a sign that is
opposite to that predicted by theory in this simple regression test. This is due to market
imperfections (Nishat, 1999). Sign of earning volatility is also wrong theoretically but the
variable is statistically insignificant. Taken together these results are consistent with prior
studies for developing markets.
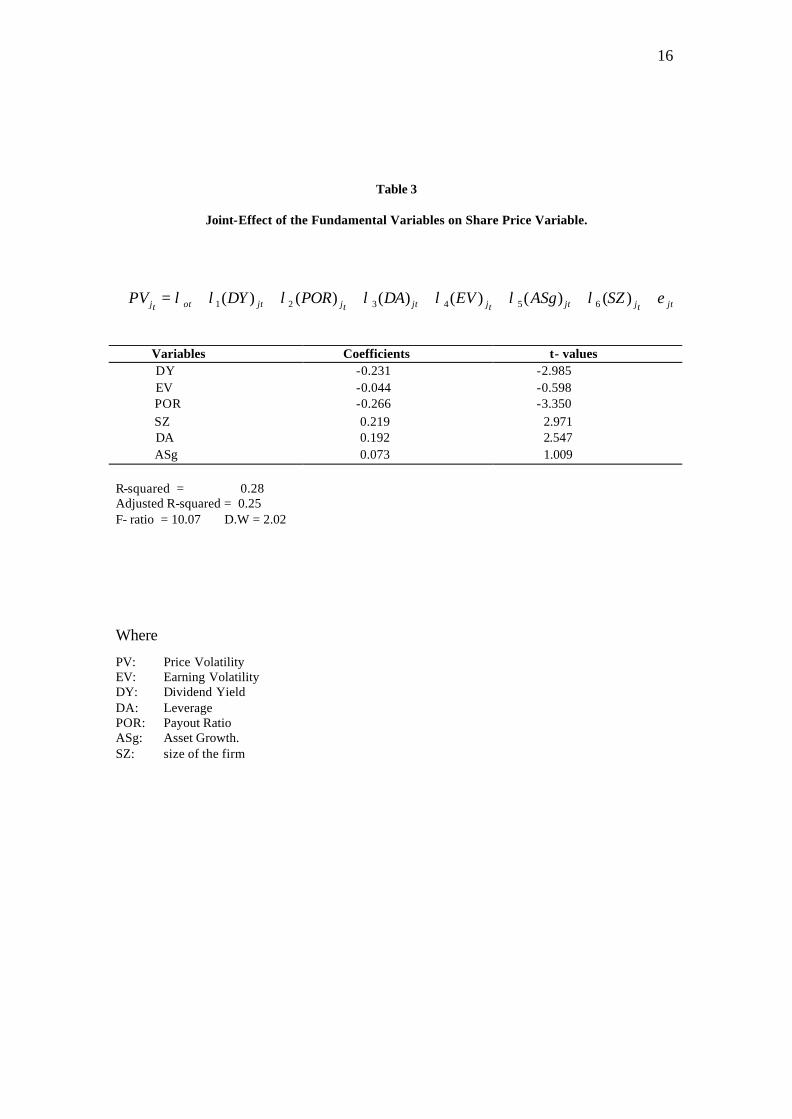
The joint effect on share price variable from the six variables is tested running regression
presented in table 3. The explained variation in the price is not very substantial, about 28 per
cent. However this is consistent with the findings regarding the developing markets where
firm related factors are not priced fully. Rather speculative forces and macro economic
9
environment plays more dominant role (Ariff et al 1994). Noticeably the largest impact
comes from pay out ratio (coefficient of 0.26) followed by dividend yield, size and leverage
closely. Thus four of the six factors are statistically relevant for the pricing of the shares in
the Karachi stock exchange in this join test using a lengthy period data.
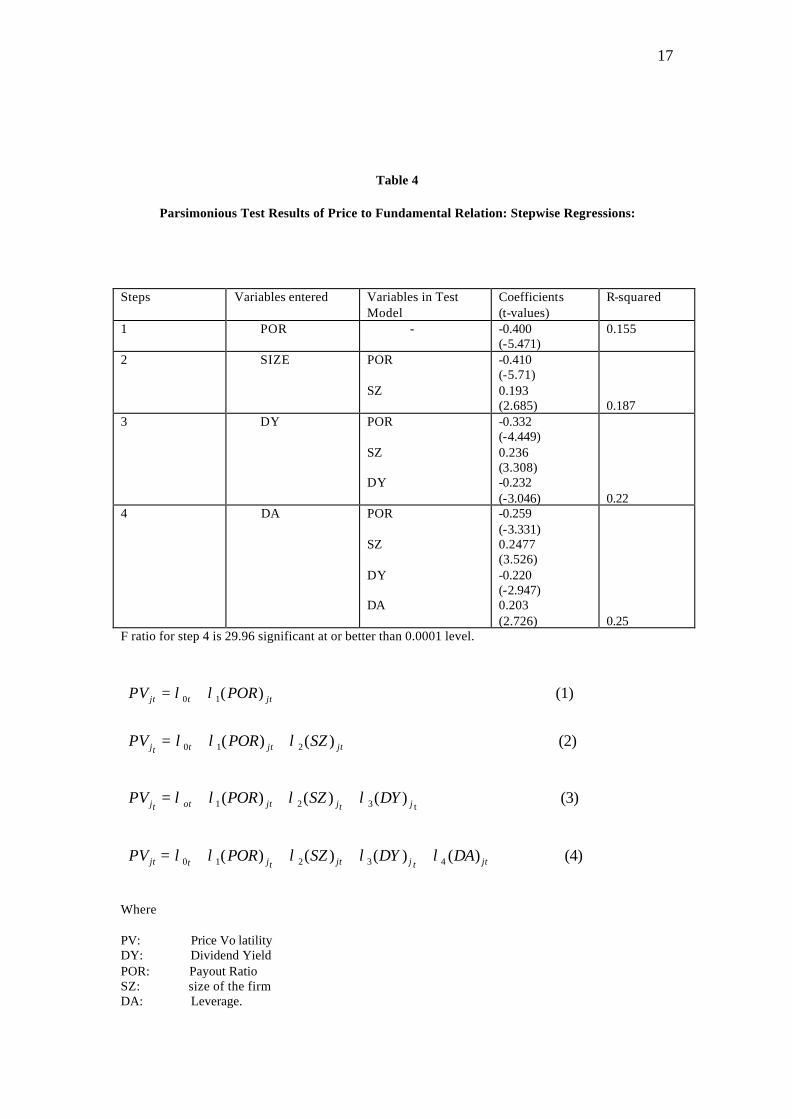
To control the multicollinearity and to select only significant variables, the procedure
suggested by Mendenhall and Sincich (1989) is used. The results shown in table 4 are
obtained by applying the step-wise regression to remove the effect multiple factors have on
the model’s specificity. These results indicate that the joint-effect of only four variables
dominate this relationship. However there are a number of important differences. The
variables selected are more reliable as the variable selection is carried out using step-wise
regression method of entering one variable at a time, then adding variables only if the variable
being added marks a substantial difference to the results. Overall, four variables namely
payout ratio, size of the firm, dividend yield and leverage are statistically significant in that
order of importance as determined by the size of the coefficient. Overall the model fit is
significant with the F-ratio of 29.962. The explained variation by these four variables is 25.9
per cent. Our results are consistent with the results observed in less developed markets of
Singapore and Malaysia where goodness of fit obtained were about 25 per cent (Ariff et al
1994). Individual factors were found to be significant, consistent with theoretical predictions,
even in the institutionally less developed markets. However, compared with the results for
developed markets the goodness of fit of the model is far inferior. It is very likely that the
stable economic environment in developed markets coupled with their more analytically
inclined investing institutions drive prices more than 60 per cent on the basis of key
fundamental variables. Such may not be the case of investors pricing shares in the more
volatile economic environments in the less analytically intensive investment dominated by
individuals trading on uninformed basis in the less developed capital markets like Pakistan.
10
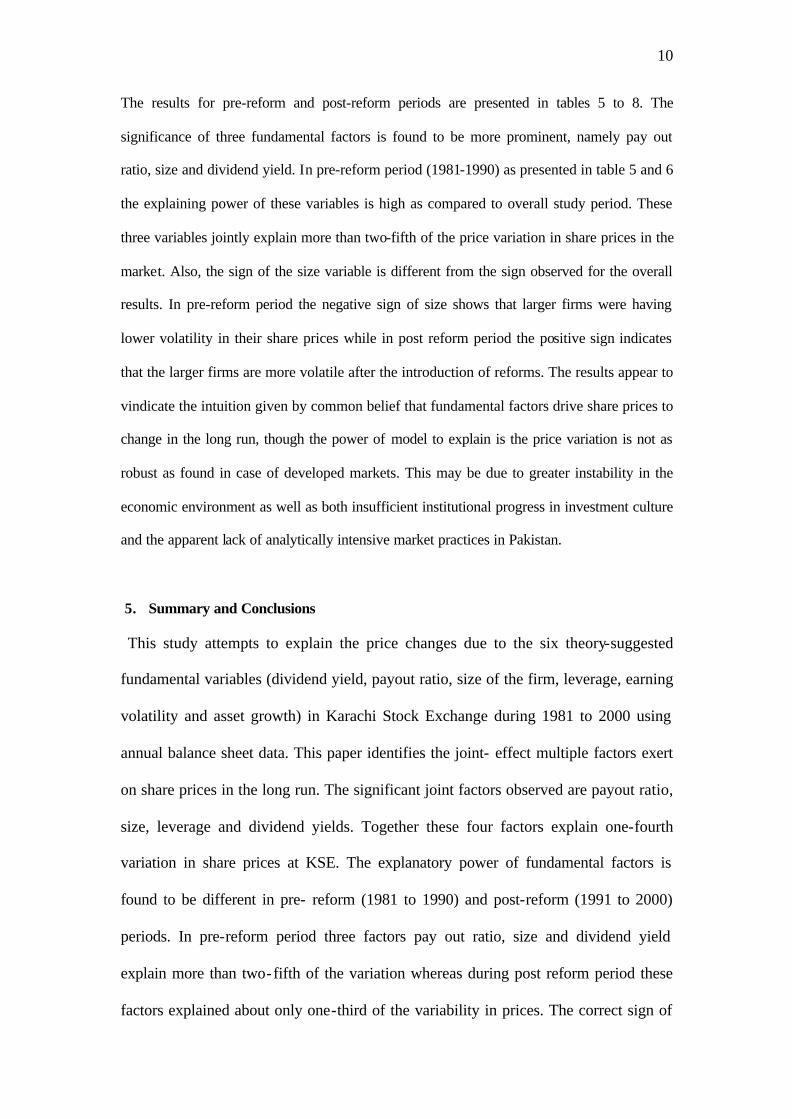
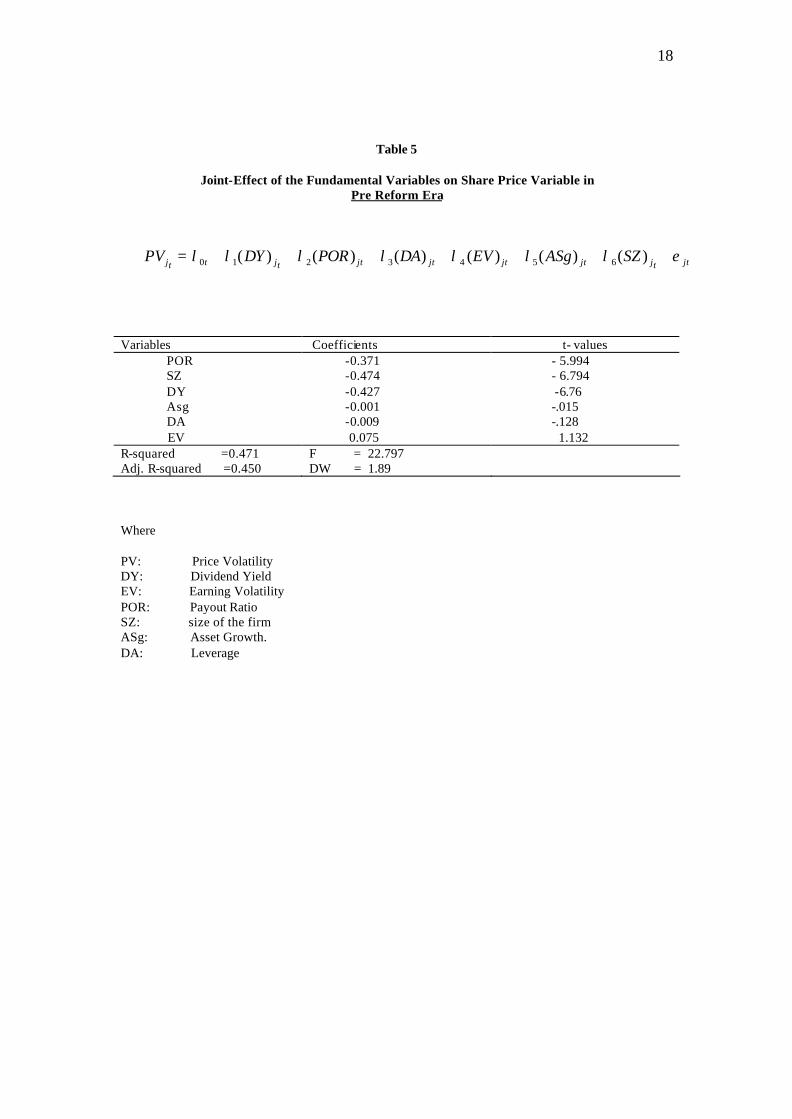
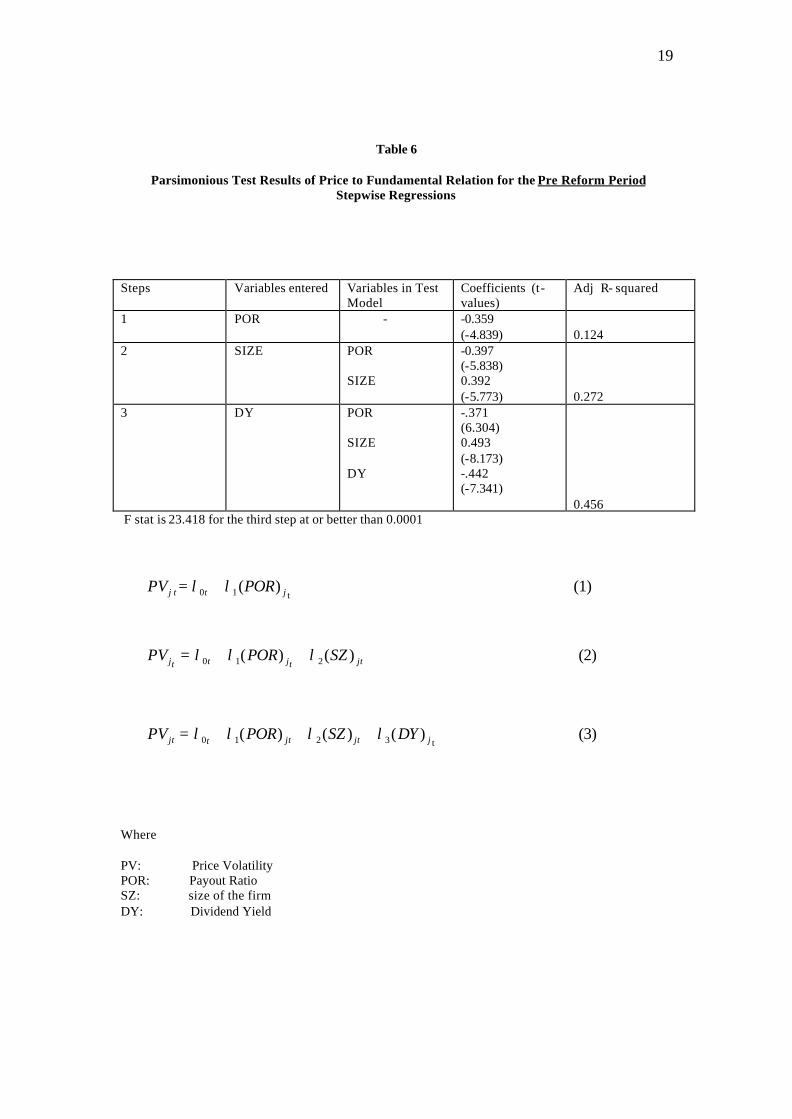
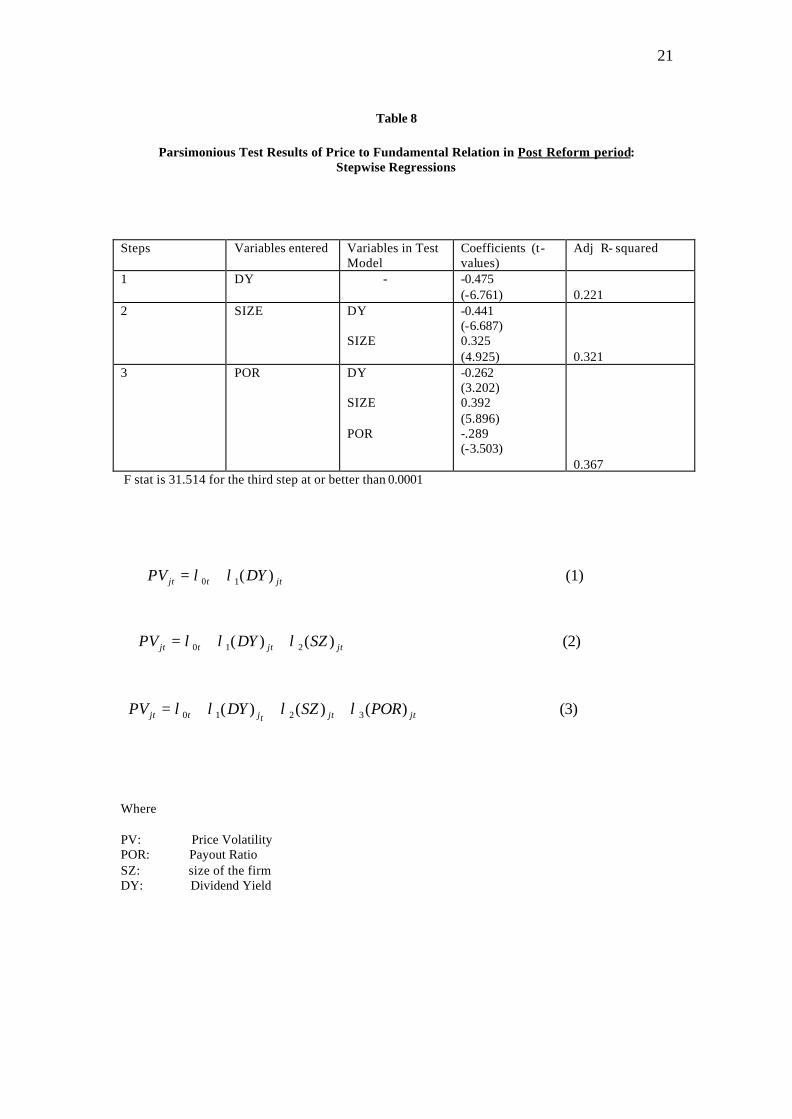
The results for pre-reform and post-reform periods are presented in tables 5 to 8. The
significance of three fundamental factors is found to be more prominent, namely pay out
ratio, size and dividend yield. In pre-reform period (1981-1990) as presented in table 5 and 6
the explaining power of these variables is high as compared to overall study period. These
three variables jointly explain more than two-fifth of the price variation in share prices in the
market. Also, the sign of the size variable is different from the sign observed for the overall
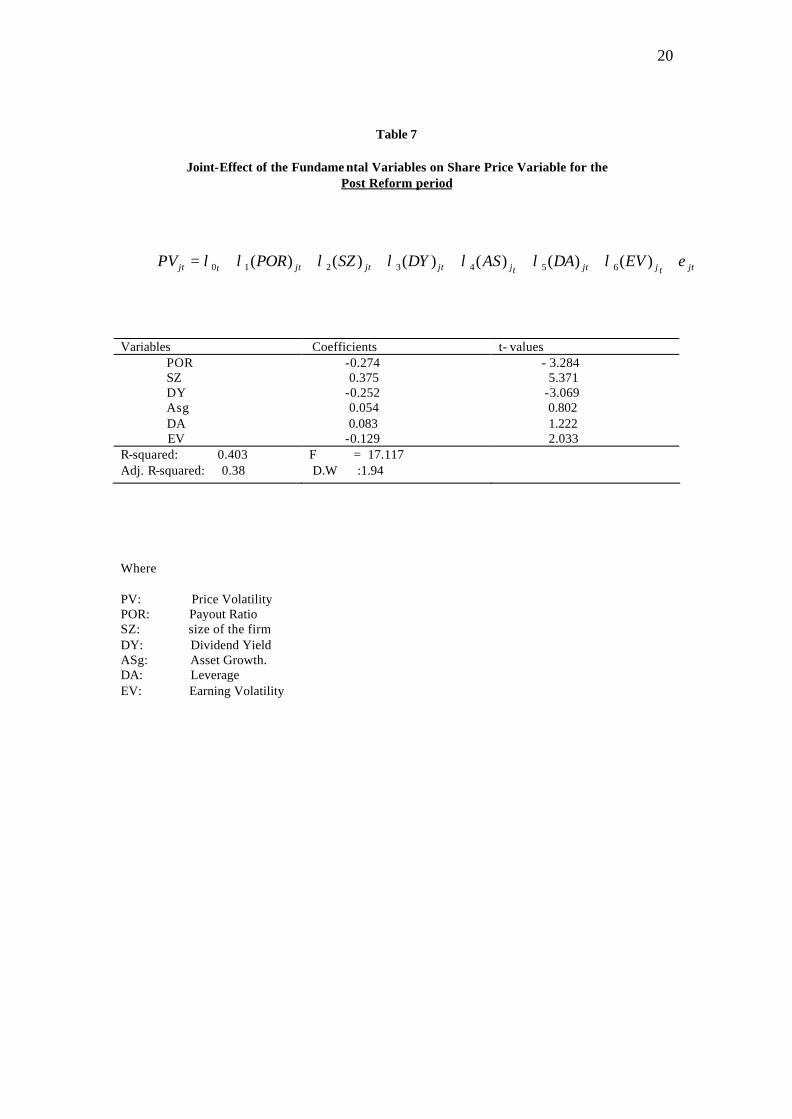
results. In pre-reform period the negative sign of size shows that larger firms were having
lower volatility in their share prices while in post reform period the positive sign indicates
that the larger firms are more volatile after the introduction of reforms. The results appear to
vindicate the intuition given by common belief that fundamental factors drive share prices to
change in the long run, though the power of model to explain is the price variation is not as
robust as found in case of developed markets. This may be due to greater instability in the
economic environment as well as both insufficient institutional progress in investment culture
and the apparent lack of analytically intensive market practices in Pakistan.
5. Summary and Conclusions
This study attempts to explain the price changes due to the six theory-suggested
fundamental variables (dividend yield, payout ratio, size of the firm, leverage, earning
volatility and asset growth) in Karachi Stock Exchange during 1981 to 2000 using
annual balance sheet data. This paper identifies the joint- effect multiple factors exert
on share prices in the long run. The significant joint factors observed are payout ratio,
size, leverage and dividend yields. Together these four factors explain one-fourth
variation in share prices at KSE. The explanatory power of fundamental factors is
found to be different in pre- reform (1981 to 1990) and post-reform (1991 to 2000)
periods. In pre-reform period three factors pay out ratio, size and dividend yield
explain more than two-fifth of the variation whereas during post reform period these
factors explained about only one-third of the variability in prices. The correct sign of

11
size effect is only observed in the pre-reform period, which shows that market has
become more volatile after the reform period, which made prices of larger firms more
volatile. The explanatory power of the variables has reduced in the post reform era.
The analysis indicates that variables other than fundamental variables may be more
important and relevant to explain the share price variation in Pakistan and need
further investigation.
12
References
Ariff, M., Shamsher M., and Annuar M. N. (1994) “Finding the Factors Associated with Stock Price Volatility: A comparative Study of Developed and Developing Share Markets” in D. Ghosh and Khaksari (eds.) Managerial Finance in the Corporate Economy, Routlege, London, UK. Ariff, M., and Khan, W. (2000), “Key Fundamental Factors and Long Run Stock Price Changes”, Working Paper (APFA 2000 meeting), April 2000. Atiase, R. K., (1985), “Pre-disclosure information, Firm Capitalization and Security Price Behaviour around Earnings Announcement.” Journal of Accounting Research, 23(2): 215-235. Annual reports of Karachi Stock Exchange (1984, 1988, 1992) Annual publications of Karachi Stock Exchange. (1993 to 2000) Balance Sheet Analysis, various issues, State Bank of Pakistan. (1984, 1988, 1993, 1998) Baskin, J., (1989), “Dividend Policy and the Volatility of Common Stock”, Journal of Portfolio Management, 15(3): 19-25. Ball, R., and P. Brown, (1968), “An Empirical Evaluation of Accounting Income Numbers”, Journal of Accounting Research, 6(2): 157-178. Beaver, W., P. Kettler and M. Scholes, (1970), “The Association between Market Determined and Accounting Determined Risk Measures”, The Accounting Review, 45(3): 325-349. Black, F., and M.(1973), “The Pricing of Options and Corporate Liabilities, Journal of Political Economy, 81 (4): 637-654. Downs, T. W., (1991). “An Alternate Approach to Fundamental Analysis: The Asset Side of the Equation.” Journal of Portfolio Management, 17 (no. 2): 6-17 Fama, E. F., and K. French, (1992), “ The cross-section of Expected Stock returns”, The Journal of Finance, 47(4): 427-465. Ghosh, D., and S. Khaksari (eds) (1994), Managerial Finance in the Corporate Economy, publisher: Routledge, London, United Kingdom. Hamada, R. S., (1972), “Portfolio Analysis, Market Equilibrium and Corporation Finance”, The Journal of Finance, 24 (1) 13-31 Gordon-Shapiro model is often referred to as Gordon, M. J., 1962, The Investment Financing and Valuation of the Corporation, Homewood, Illinois: Irwin. Linter, J., (1956), “Distributions of Incomes of Corporations among Dividends, Retained Earnings and Taxes”, American economic Review, 46 (1): 97-113. Mendenhall, W., and T. Sincich, (1989), A second Course in Business Statistics: Regression Analysis, Macmillan, London, New York.
13
Molodowsky, N., 1995, “A Theory of Price- Earnings Ratios”, Financial Analysis Journal, Jan. –Feb., 29-43. Nishat, M. (1995), “Determinants of Stock Prices in Pakistan”, International Journal of Development Banking, 13(2): 37-42 Nishat, M. and Saghir A. (1991), “The Stock Market and Pakistan Economy”, Saving and Development, (2) –1991-XV. Nishat, M. (1999), “The Impact of Institutional Development on Stock Prices in Pakistan,” Doctoral Dissertation, Auckland Business School, University of Auckland. Rappoport, (1986) , “The Affordable Dividend Approach to Equity Valuation”, Financial Analysis Journal, 42 (4): 52-58. Reinganum, M., (1982), “A Direct Test of Roll’s Conjecture on Film Size Effect”, The Journal of Finance, 37 (1): 27-36 Sharpe, W., 1964, Capital Asset Prices: A theory of Market Equilibrium”, The Journal of Finance, 19(1): 425-442. Wilcox, J. W., 1984, “The P/B – ROE Valuation Model”, Financial Analysis Journal, January-February, 58-66.
14
Table 1 Descriptive Statistics
Table 1.b Overall period
variable Min Max Mean Std PV 0.123 0.906 0.497 0.146 DY 0.000 0.162 0.041 0.032 EV 0.135 0.866 0.101 0.141 POR -0.533 1.858 0.265 0.304 SZ 0.718 8666.291 395.174 1107.773 DA 0.000 3.478 0.152 0.319 ASg -0.048 12.181 0.193 0.959
Table 1.b pre reform period variable Min Max Mean Std
PV 0.121 0.927 0.453 0.153 DY 0.000 0.217 0.054 0.043 EV 0.000 0.401 0.018 0.057 POR -0.326 3.716 0.326 0.043 SZ 0.495 2067.124 115.641 252.791 DA 0.000 1.333 0.132 0.172 ASg -0.155 7.883 0.134 0.108
Table 1.c Post reform period variable Min Max Mean Std PV 0.013 1.133 0.54 0.22 DY 0.000 0.165 0.0302 0.0346 EV 0.000 1.142 0.0422 0.1798 POR -1.401 1.72 0.204 0.3295 SZ 0.783 16692.99 674.71 2031.17 DA 0.000 6.875 0.172 0.58 ASg -1.74 23.297 0.245 1.8408
where
PV: Price Volatility EV: Earning Volatility DY: Dividend Yield DA: Leverage POR: Payout Ratio ASg: Asset Growth. SZ: size of the firm
15
Table 2
Estimated relation between share prices and Fundamental Variables: simple regressions Variables Coefficients t-value R-squared DY -0.30 -3.94 0.09 EV -0.043 -.539 0.02 POR -.40 -5.47 0.16 SZ -0.17 2.25 0.03 DA 0.32 4.29 0.10 ASg 0.10 1.30 0.01
where
PV: Price Volatility EV: Earning Volatility DY: Dividend Yield DA: Leverage POR: Payout Ratio ASg: Asset Growth. SZ: size of the firm
(1) )(1 jtotjt DYPV λλ +=
(2) )(1 jttotjEVPV λλ +=
(3) )(1 jtotjt PORPV λλ +=
(4) )(1 jtottjSZPV λλ +=
(5) )(2 jtotjt DAPV λλ +=
(6) )(2 jtojt ASgPV λλ +=
16
Table 3
Joint-Effect of the Fundamental Variables on Share Price Variable.
Variables Coefficients t- values DY -0.231 -2.985 EV -0.044 -0.598 POR -0.266 -3.350 SZ 0.219 2.971 DA 0.192 2.547 ASg 0.073 1.009 R-squared = 0.28 Adjusted R-squared = 0.25 F- ratio = 10.07 D.W = 2.02
Where
PV: Price Volatility EV: Earning Volatility DY: Dividend Yield DA: Leverage POR: Payout Ratio ASg: Asset Growth. SZ: size of the firm
jttjjttjjttjjtottjSZASgEVDAPORDYPV ελλλλλλλ +++++++= )()()()()()( 654321
17
Table 4
Parsimonious Test Results of Price to Fundamental Relation: Stepwise Regressions:
Steps Variables entered Variables in Test
Model Coefficients (t-values)
R-squared
1 POR
- -0.400 (-5.471)
0.155
2 SIZE
POR SZ
-0.410 (-5.71) 0.193 (2.685)
0.187
3 DY POR SZ DY
-0.332 (-4.449) 0.236 (3.308) -0.232 (-3.046)
0.22
4 DA POR SZ DY DA
-0.259 (-3.331) 0.2477 (3.526) -0.220 (-2.947) 0.203 (2.726)
0.25
F ratio for step 4 is 29.96 significant at or better than 0.0001 level.
Where PV: Price Vo latility DY: Dividend Yield POR: Payout Ratio SZ: size of the firm DA: Leverage.
(3) )()()(t321 jtjjtottj
DYSZPORPV λλλλ +++=
(1) )(10 jttjt PORPV λλ +=
(2) )()( 210 jtjtttjSZPORPV λλλ ++=
(4) )()()()( 43210 jttjjttjtjt DADYSZPORPV λλλλλ ++++=
18
Table 5
Joint-Effect of the Fundamental Variables on Share Price Variable in Pre Reform Era
Variables Coefficients t- values POR -0.371 - 5.994 SZ -0.474 - 6.794 DY -0.427 -6.76 Asg -0.001 -.015 DA -0.009 -.128 EV 0.075 1.132 R-squared =0.471 Adj. R-squared =0.450
F = 22.797 DW = 1.89
Where PV: Price Volatility DY: Dividend Yield EV: Earning Volatility POR: Payout Ratio SZ: size of the firm ASg: Asset Growth. DA: Leverage
jttjjtjtjtjttjttjSZASgEVDAPORDYPV ελλλλλλλ +++++++= )()()()()()( 6543210
19
Table 6
Parsimonious Test Results of Price to Fundamental Relation for the Pre Reform Period Stepwise Regressions
Steps Variables entered Variables in Test Model
Coefficients (t-values)
Adj R- squared
1 POR - -0.359 (-4.839)
0.124
2 SIZE POR SIZE
-0.397 (-5.838) 0.392 (-5.773)
0.272
3 DY POR SIZE DY
-.371 (6.304) 0.493 (-8.173) -.442 (-7.341)
0.456
F stat is 23.418 for the third step at or better than 0.0001
Where PV: Price Volatility POR: Payout Ratio SZ: size of the firm DY: Dividend Yield
(3) )()()(t3210 jjtjttjt DYSZPORPV λλλλ +++=
(1) )(t10 jttj PORPV λλ +=
(2) )()( 210 jttjttjSZPORPV λλλ ++=
20
Table 7
Joint-Effect of the Fundame ntal Variables on Share Price Variable for the Post Reform period
Variables Coefficients t- values POR -0.274 - 3.284 SZ 0.375 5.371 DY -0.252 -3.069 Asg 0.054 0.802 DA 0.083 1.222 EV -0.129 2.033 R-squared: 0.403 Adj. R-squared: 0.38
F = 17.117 D.W :1.94
Where PV: Price Volatility POR: Payout Ratio SZ: size of the firm DY: Dividend Yield ASg: Asset Growth. DA: Leverage EV: Earning Volatility
jttjjttjjtjtjttjt EVDAASDYSZPORPV ελλλλλλλ +++++++= )()()()()()( 6543210
21
Table 8
Parsimonious Test Results of Price to Fundamental Relation in Post Reform period:
Stepwise Regressions
Steps Variables entered Variables in Test
Model Coefficients (t-values)
Adj R- squared
1 DY - -0.475 (-6.761)
0.221
2 SIZE DY SIZE
-0.441 (-6.687) 0.325 (4.925)
0.321
3 POR DY SIZE POR
-0.262 (3.202) 0.392 (5.896) -.289 (-3.503)
0.367
F stat is 31.514 for the third step at or better than 0.0001
Where PV: Price Volatility POR: Payout Ratio SZ: size of the firm DY: Dividend Yield
(3) )()()( 3210 jtjttjtjt PORSZDYPV λλλλ +++=
(1) )(10 jttjt DYPV λλ +=
(2) )()( 210 jtjttjt SZDYPV λλλ ++=