Risky Business: 12 surprising facts about construction in emerging markets
date post
21-Dec-2015Category
view
237download
0
Key Facts About Minnesota Health Care Markets
For more information:
www.health.state.mn.us/healtheconomics/

Health Care Cost Trends in Minnesota
Minnesota Health Care Spending by Source of Funds, 2005
Medicare14.6%
Medical Assistance
17.8%Other Private
3.0%
Out-of-Pocket14.0%
Private Health Insurance
43.5%
Other Public Spending
7.0%
Source: MDH Health Economics Program
Total Spending $29.4 Billion

Shares of Minnesota Health Spending by Source of Funds, 2001-2005
2001 2002 2003 2004 2005
Public Spending 39.7% 40.4% 39.6% 39.8% 39.4%
Medicare 14.6% 14.3% 13.8% 14.2% 14.6%
Medicaid 18.2% 18.9% 18.7% 18.6% 17.8%
Other Public Spending 7.0% 7.2% 7.1% 7.1% 7.0%
Private Spending 60.3% 59.6% 60.4% 60.2% 60.6%
Private Health Insurance 41.0% 41.2% 42.6% 42.7% 43.5%
Out of Pocket 15.2% 14.7% 14.5% 14.4% 14.0%
Other Private 4.0% 3.7% 3.3% 3.1% 3.0%
Total 100.0% 100.0% 100.0% 100.0% 100.0%
Source: MDH Health Economics Program
Note: Detail may not sum to 100% due to rounding.
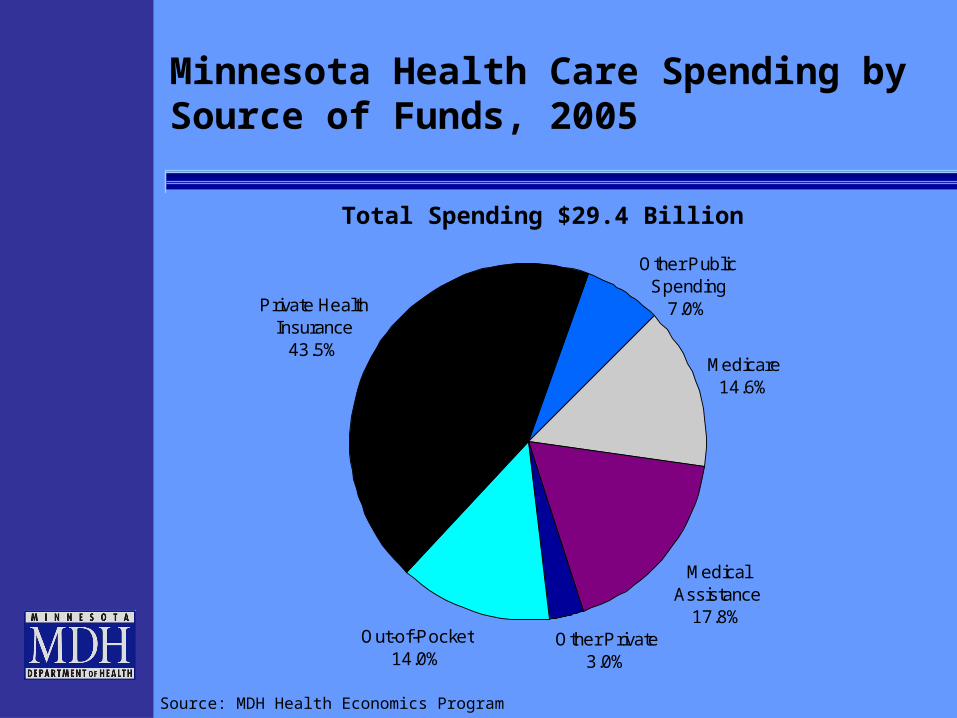
Public Spending for Health Care in Minnesota: Federal, State, and Local Shares, 2005
Federal68.3%
State30.2%
Local1.5%
Source: MDH Health Economics Program
Total Public Spending in 2005: $11.6 Billion
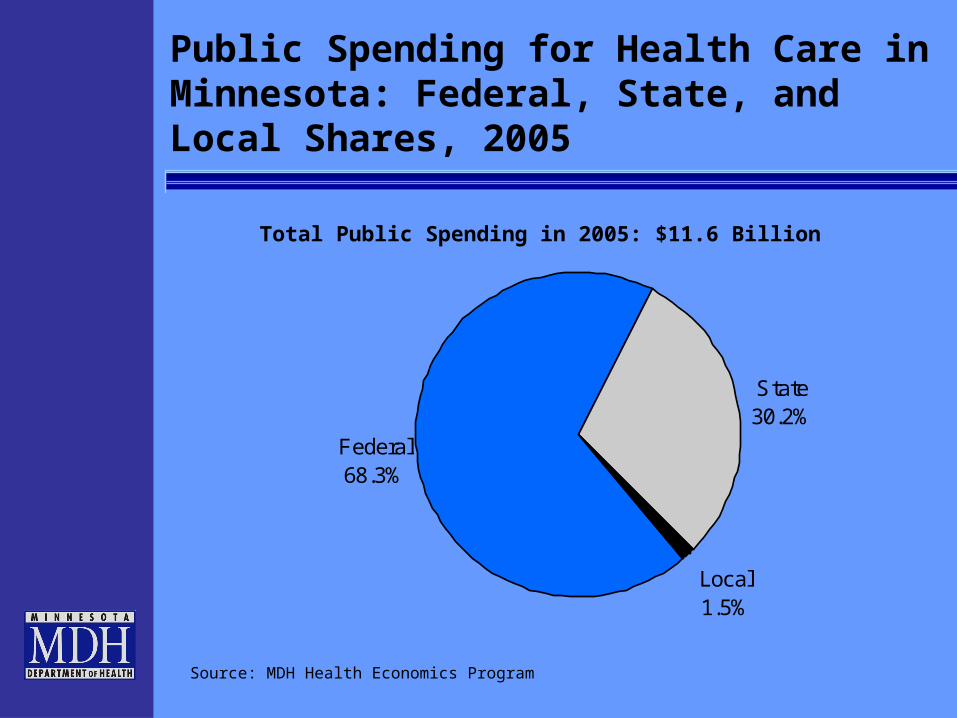
Minnesota Health Care Spending by Type of Service, 2005
Other Spending15.2%
Prescription Drugs11.9%
Physician Services21.7%
Hospital Care29.3%
Long Term Care (including Home
Care)15.4%
Other Professional Services
3.1%
Dental Services3.5%
Source: MDH Health Economics Program
Total Spending $29.4 Billion

Shares of Minnesota Health Care Spending by Type of Service, 2001 to 2005
Type of Service 2001 2002 2003 2004 2005
Inpatient Hospital 20.1% 19.9% 19.8% 19.6% 19.7%
Outpatient Hospital 7.5% 8.0% 8.4% 8.8% 9.6%
Physician Services 22.6% 22.7% 22.5% 21.2% 21.7%
Long Term Care (including Home Care)
16.8% 16.8% 16.0% 15.9% 15.4%
Prescription Drugs 10.7% 11.4% 12.1% 12.5% 11.9%
Dental 3.4% 3.4% 3.6% 3.5% 3.5%
Other Professional Services 2.7% 2.7% 2.8% 3.0% 3.1%
Other Spending 16.2% 15.1% 14.9% 15.4% 15.2%
Total 100.0% 100.0% 100.0% 100.0% 100.0%
Source: MDH Health Economics Program
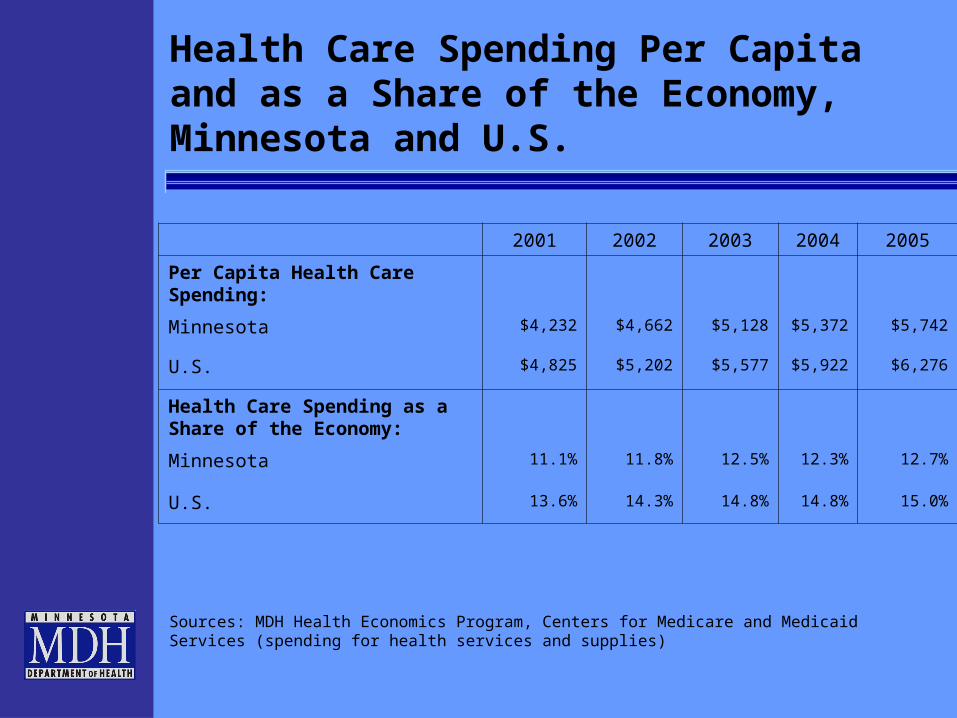
Health Care Spending Per Capita and as a Share of the Economy, Minnesota and U.S.
2001 2002 2003 2004 2005
Per Capita Health Care Spending:
Minnesota $4,232 $4,662 $5,128 $5,372 $5,742
U.S. $4,825 $5,202 $5,577 $5,922 $6,276
Health Care Spending as a Share of the Economy:
Minnesota 11.1% 11.8% 12.5% 12.3% 12.7%
U.S. 13.6% 14.3% 14.8% 14.8% 15.0%
Sources: MDH Health Economics Program, Centers for Medicare and Medicaid Services (spending for health services and supplies)

Private Health Insurance Premium and Spending Trends, 1995 to 2005
Per Minnesota Resident With Private Health Insurance
0.9% 1.0%0.5%
8.8%
12.1%
16.0%
12.2%
9.8%9.0%
11.2%
4.5%
7.3%
4.3%
2.1%
15.5%
10.5%
7.4%6.8%
7.9%8.9%
10.1%
12.9%
0%
4%
8%
12%
16%
1995 1996 1997 1998 1999 2000 2001 2002 2003 2004 2005
% c
ha
ng
e fr
om
pre
vio
us
yea
r
Premiums Expenses
Source: MDH Health Economics Program. Fully-insured market only.
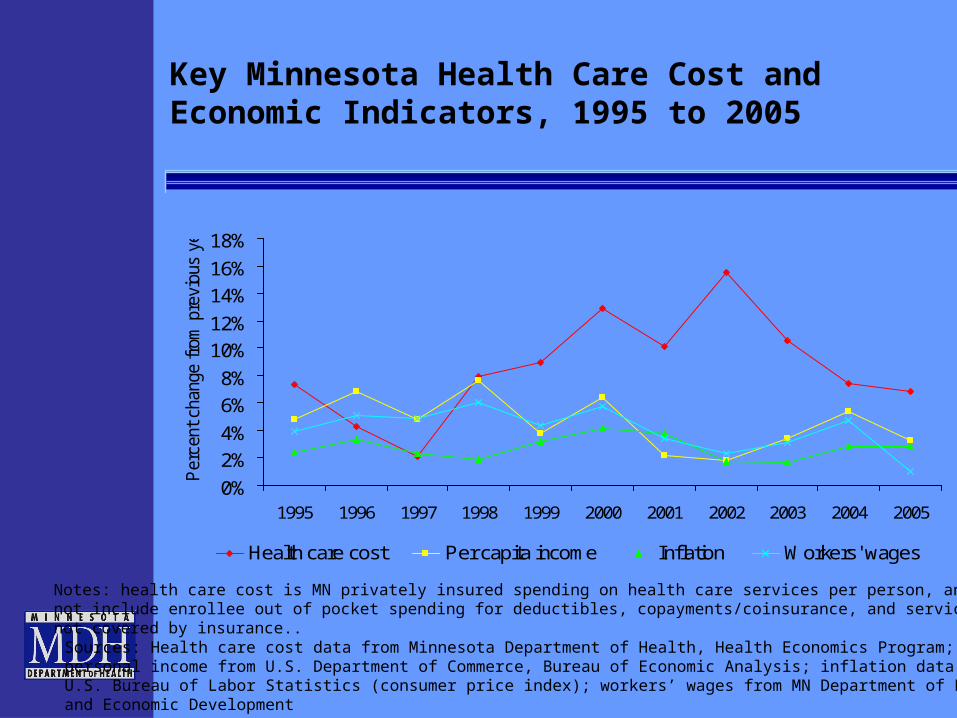
Key Minnesota Health Care Cost and Economic Indicators, 1995 to 2005
0%
2%
4%
6%
8%
10%
12%
14%
16%
18%
1995 1996 1997 1998 1999 2000 2001 2002 2003 2004 2005
Per
cent
cha
nge
from
pre
viou
s ye
ar
Health care cost Per capita income Inflation Workers' wages
Notes: health care cost is MN privately insured spending on health care services per person, and doesnot include enrollee out of pocket spending for deductibles, copayments/coinsurance, and servicesnot covered by insurance..Sources: Health care cost data from Minnesota Department of Health, Health Economics Program; per capitapersonal income from U.S. Department of Commerce, Bureau of Economic Analysis; inflation data fromU.S. Bureau of Labor Statistics (consumer price index); workers’ wages from MN Department of Employment and Economic Development
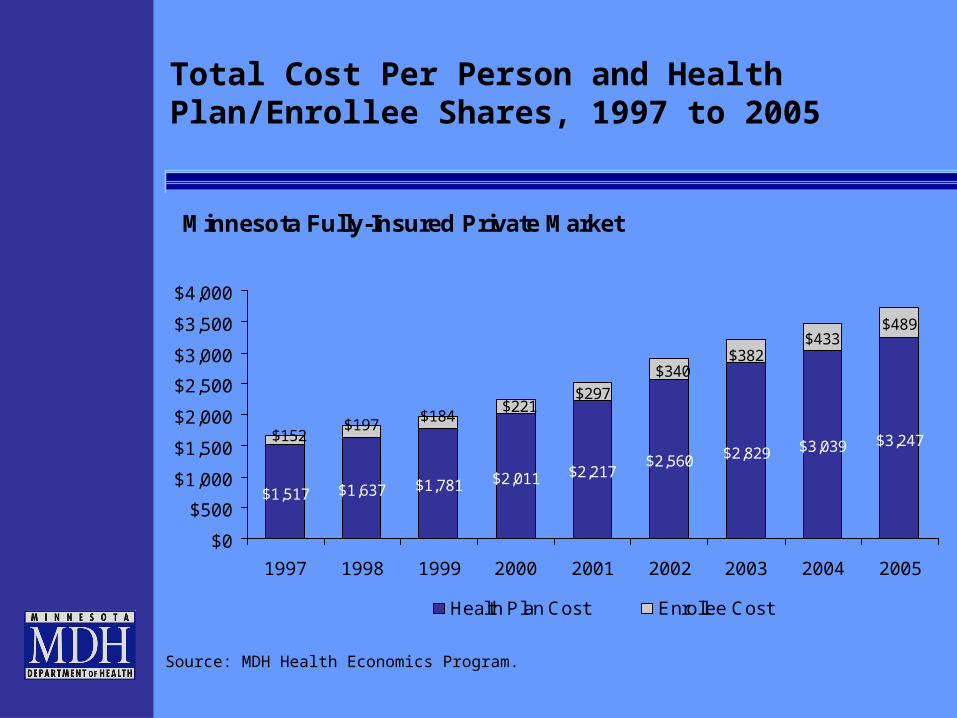
Total Cost Per Person and Health Plan/Enrollee Shares, 1997 to 2005
Minnesota Fully-Insured Private Market
$1,637 $1,781 $2,011 $2,217$2,560 $2,829 $3,039 $3,247
$433$489
$1,517
$340$382
$297$221
$184$197
$152
$0
$500
$1,000
$1,500
$2,000
$2,500
$3,000
$3,500
$4,000
1997 1998 1999 2000 2001 2002 2003 2004 2005
Health Plan Cost Enrollee Cost
Source: MDH Health Economics Program.
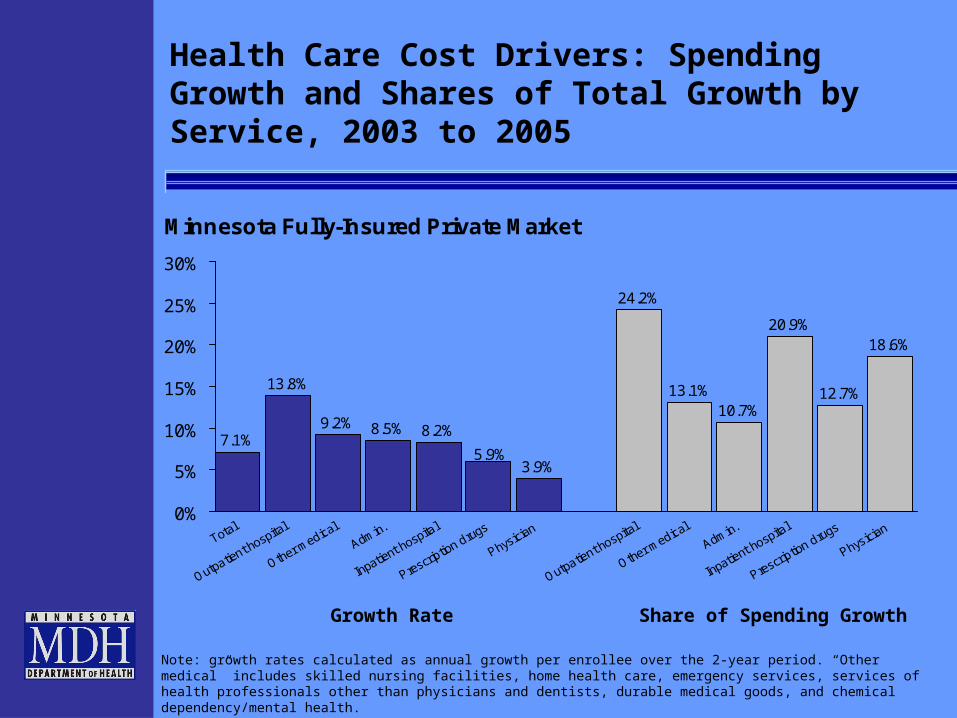
Health Care Cost Drivers: Spending Growth and Shares of Total Growth by Service, 2003 to 2005
Minnesota Fully-Insured Private Market
7.1%
13.8%
9.2% 8.5% 8.2%
3.9%
24.2%
13.1%10.7%
20.9%
12.7%
18.6%
5.9%
0%
5%
10%
15%
20%
25%
30%
Total
Outpatient hospital
Other medical
Admin.
Inpatient hospital
Prescription drugs
Physician
Outpatient hospital
Other medical
Admin.
Inpatient hospital
Prescription drugs
Physician
Note: growth rates calculated as annual growth per enrollee over the 2-year period. “Other medical” includes skilled nursing facilities, home health care, emergency services, services of health professionals other than physicians and dentists, durable medical goods, and chemical dependency/mental health.Source: MDH Health Economics Program.
Growth Rate Share of Spending Growth
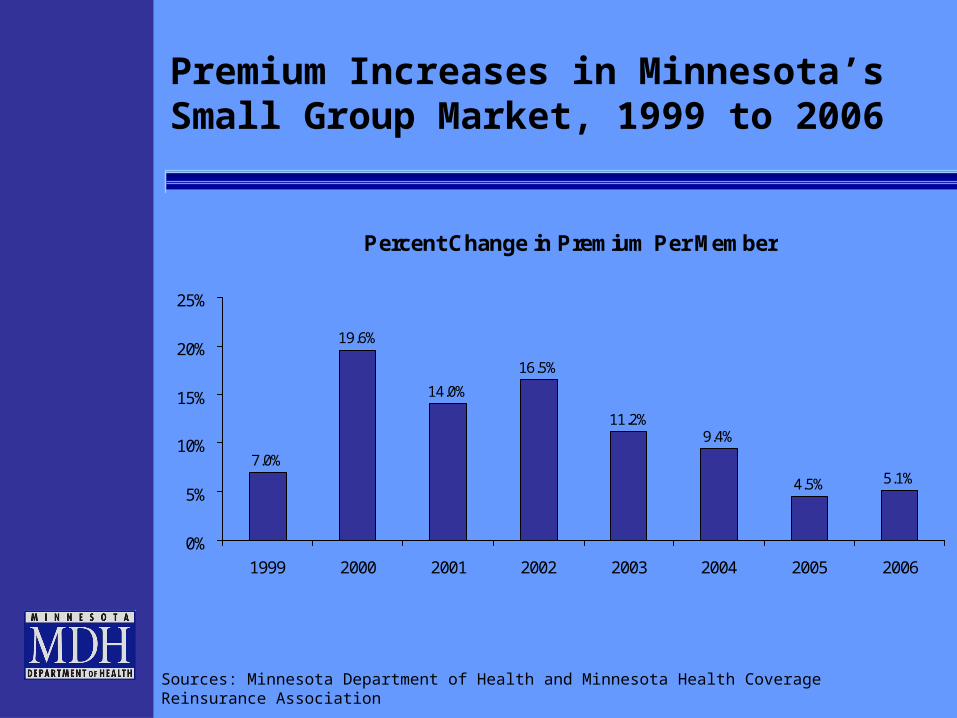
Percent Change in Premium Per Member
7.0%
19.6%
14.0%
16.5%
11.2%9.4%
4.5% 5.1%
0%
5%
10%
15%
20%
25%
1999 2000 2001 2002 2003 2004 2005 2006
Sources: Minnesota Department of Health and Minnesota Health Coverage Reinsurance Association
Premium Increases in Minnesota’s Small Group Market, 1999 to 2006

Premium Increases in Minnesota's Individual Market, 1999 to 2006
Percent Change in Premium Per Member
2.7%
16.4%
9.4%
17.2%
7.9%
5.4%4.6%
6.7%
0%2%4%6%8%
10%12%14%16%18%20%
1999 2000 2001 2002 2003 2004 2005 2006
Source: Minnesota Health Coverage Reinsurance Association and Minnesota Department of Health

Health Insurance Coverage in Minnesota
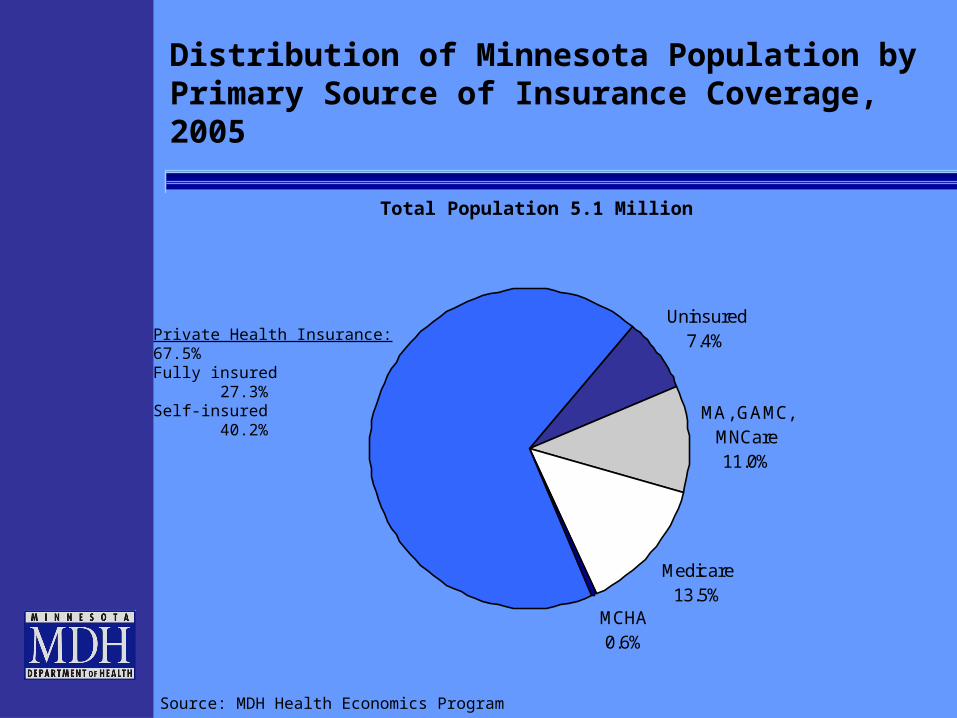
Distribution of Minnesota Population by Primary Source of Insurance Coverage, 2005
Uninsured7.4%
MA, GAMC, MNCare11.0%
Medicare13.5%
MCHA0.6%
Source: MDH Health Economics Program
Total Population 5.1 Million
Private Health Insurance: 67.5%Fully insured 27.3%Self-insured 40.2%
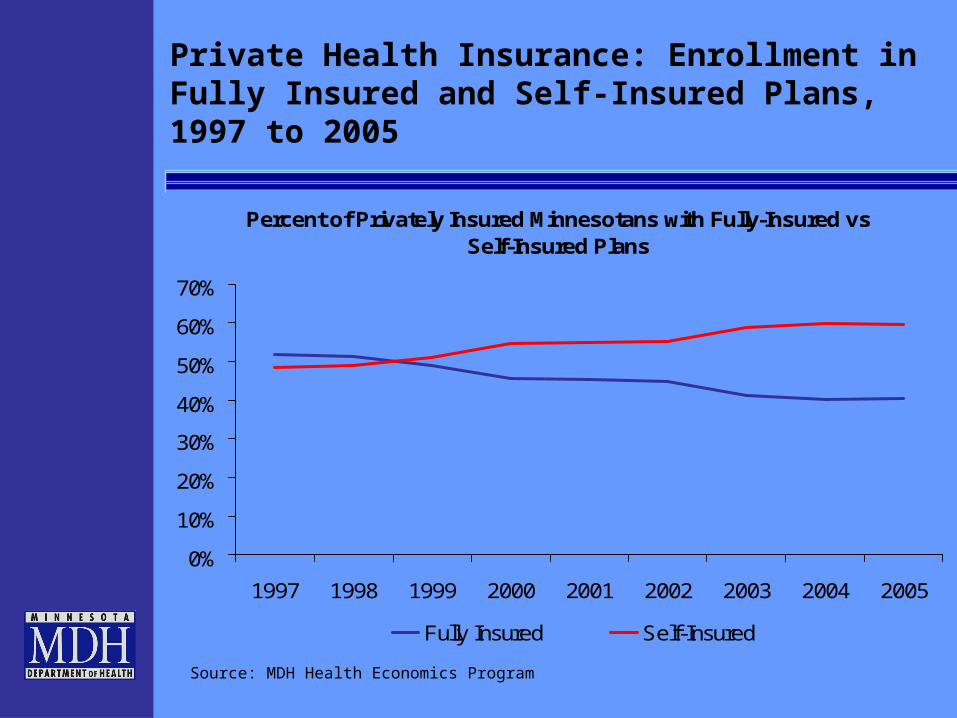
Private Health Insurance: Enrollment in Fully Insured and Self-Insured Plans, 1997 to 2005
Percent of Privately Insured Minnesotans with Fully-Insured vs Self-Insured Plans
0%
10%
20%
30%
40%
50%
60%
70%
1997 1998 1999 2000 2001 2002 2003 2004 2005
Fully Insured Self-Insured
Source: MDH Health Economics Program

Private Health Insurance: Enrollment in Large Group, Small Group, and Individual Coverage, 2004
Individual6.3%
Small Group12.9%
Large Group80.8%
Source: MDH Health Economics Program

Percent of Minnesota Businesses Offering Health Insurance, by Firm Size, 2006
*Indicates a statistically significant difference (95% level) from the rate for all firm sizes Source: preliminary results from 2006 Minnesota Employer Health Insurance Survey
42.3%*
71.2%*
91.9%*97.0%*
58.4%
0%
20%
40%
60%
80%
100%
Fewer than 10 10 to 49 50 to 199 200 or more All firm sizes

Percent of Minnesota Businesses Offering Health Insurance, by Region, 2006
*Indicates a statistically significant difference (95% level) from the statewide rateSource: preliminary results from 2006 Minnesota Employer Health Insurance Survey
48.4%* 49.5%*53.3%
65.2%*58.4%
0%
20%
40%
60%
80%
100%
Northwest Northeast South Twin Cities Statewide

Percent of Employees Working for a Firm That Offers Health Insurance, by Firm Size, 2006
*Indicates a statistically significant difference (95% level) from the rate for all firm sizes Source: preliminary results from 2006 Minnesota Employer Health Insurance Survey
44.5%*
75.6%*
91.9%99.4%*
88.6%
0%
20%
40%
60%
80%
100%
Fewer than 10 10 to 49 50 to 199 200 or more All firm sizes

Percent of Employees Working for a Firm That Offers Health Insurance, by Region, 2006
*Indicates a statistically significant difference (95% level) from the statewide rateSource: preliminary results from 2006 Minnesota Employer Health Insurance Survey
80.8%*88.2% 85.4%
90.4% 88.6%
0%
20%
40%
60%
80%
100%
Northwest Northeast South Twin Cities Statewide
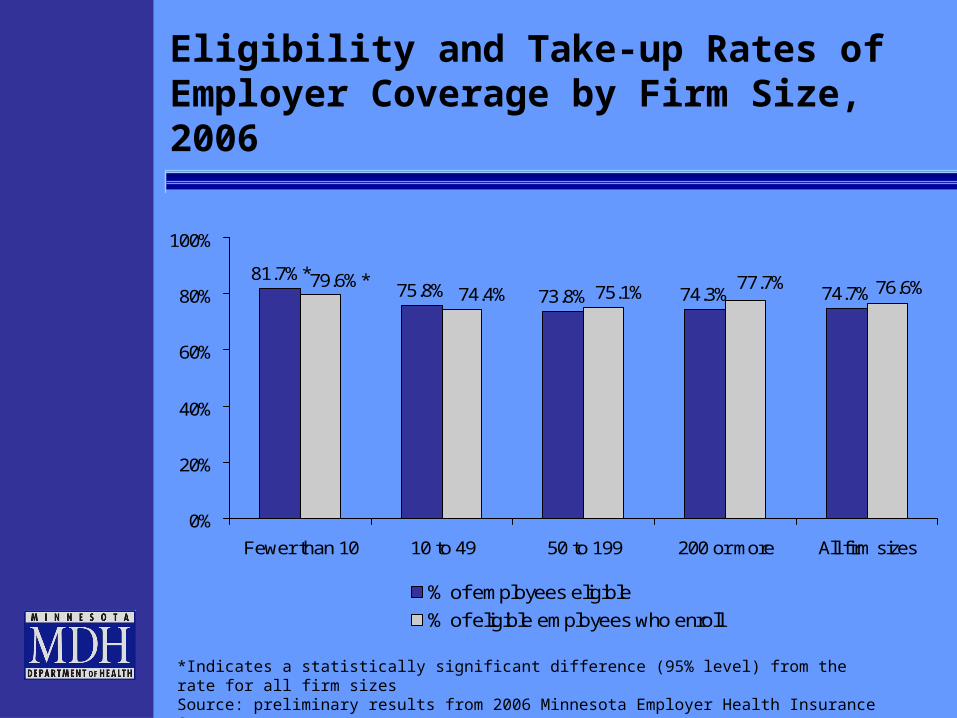
Eligibility and Take-up Rates of Employer Coverage by Firm Size, 2006
*Indicates a statistically significant difference (95% level) from the rate for all firm sizes Source: preliminary results from 2006 Minnesota Employer Health Insurance Survey
81.7%*75.8% 73.8% 74.3% 74.7%76.6%77.7%75.1%74.4%
79.6%*
0%
20%
40%
60%
80%
100%
Fewer than 10 10 to 49 50 to 199 200 or more All firm sizes
% of employees eligible
% of eligible employees who enroll
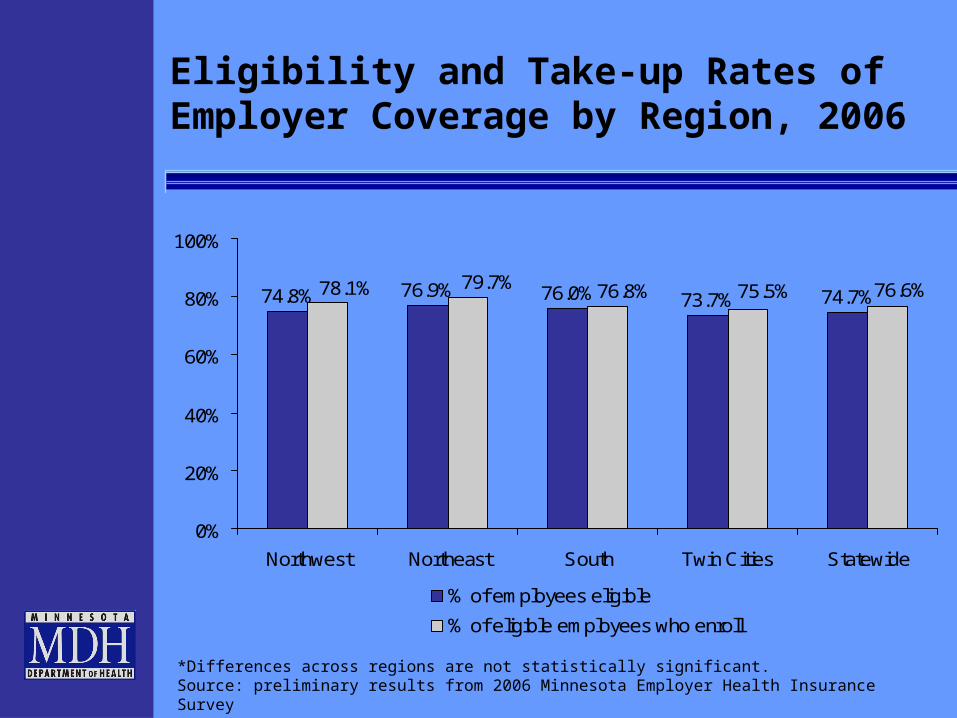
Eligibility and Take-up Rates of Employer Coverage by Region, 2006
*Differences across regions are not statistically significant. Source: preliminary results from 2006 Minnesota Employer Health Insurance Survey
74.8% 76.9% 76.0% 73.7% 74.7%76.6%75.5%76.8%79.7%78.1%
0%
20%
40%
60%
80%
100%
Northwest Northeast South Twin Cities Statewide
% of employees eligible
% of eligible employees who enroll
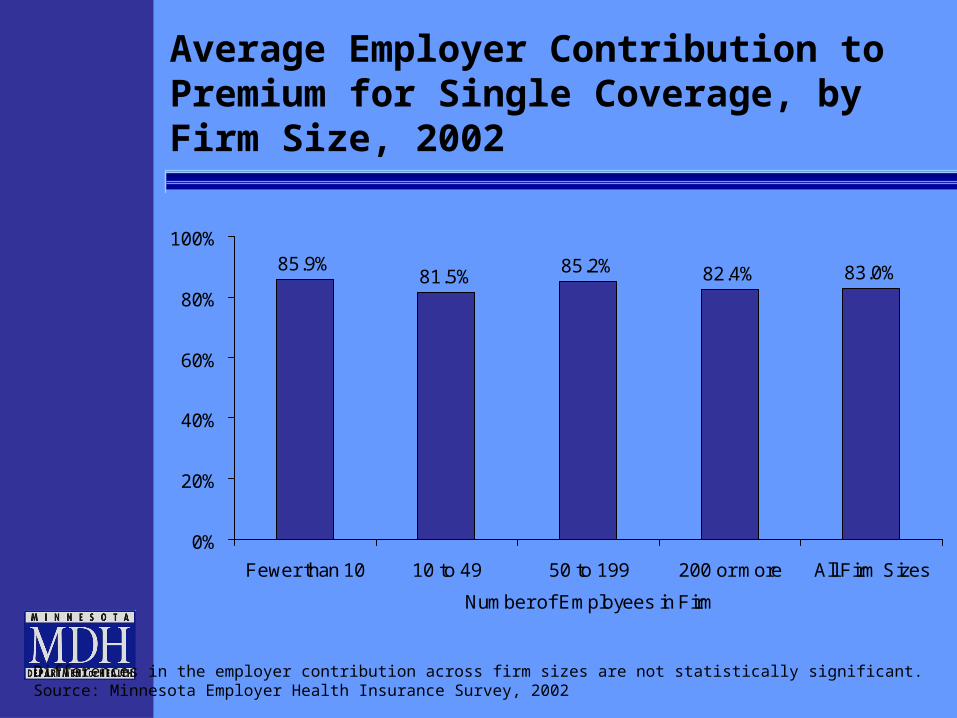
Average Employer Contribution to Premium for Single Coverage, by Firm Size, 2002
85.9%81.5%
85.2% 82.4% 83.0%
0%
20%
40%
60%
80%
100%
Fewer than 10 10 to 49 50 to 199 200 or more All Firm Sizes
Number of Employees in Firm
Differences in the employer contribution across firm sizes are not statistically significant.Source: Minnesota Employer Health Insurance Survey, 2002
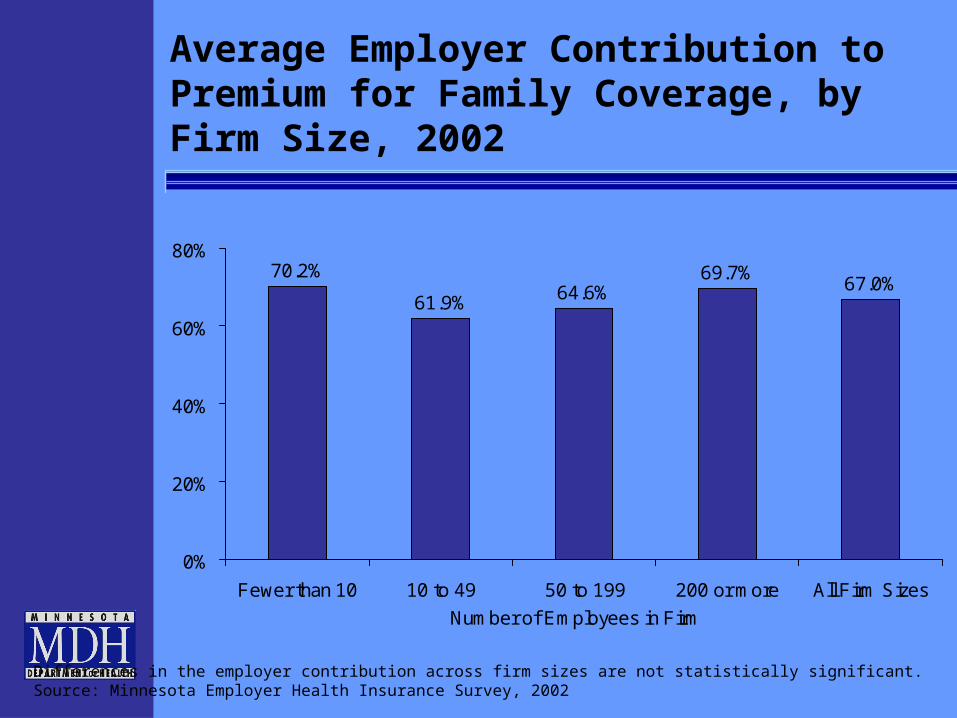
Average Employer Contribution to Premium for Family Coverage, by Firm Size, 2002
70.2%
61.9% 64.6%69.7%
67.0%
0%
20%
40%
60%
80%
Fewer than 10 10 to 49 50 to 199 200 or more All Firm Sizes
Number of Employees in Firm
Differences in the employer contribution across firm sizes are not statistically significant.Source: Minnesota Employer Health Insurance Survey, 2002

0
100,000
200,000
300,000
400,000
500,000
600,000
1994 1995 1996 1997 1998 1999 2000 2001 2002 2003 2004 2005 2006
Note: Fully Insured market only.Source: MDH, Health Economics Program; estimates based on data from various sources.
Trends in Minnesota Small Group Health Insurance Enrollment, 1994 to 2006

Per Person Annual Deductibles in the Small Group Market, 2002 to 2005 (by share of total enrollment)
Source: MDH, Health Economics Program*Median calculation excludes enrollees with no deductible
2002 2005
Range: $100 to $2,500 Range $100 to $5,000
Median: $500 Median: $500
No Deductible 65.6% 52.1%
Less than $500
16.1% 16.5%
$500 to $999 11.9% 16.9%
$1,000 to $1,999 6.2% 10.3%
$2,000 or More 0.2% 4.2%
100.0% 100.0%

Family Level Annual Deductibles in the Small Group Market, 2002 to 2005 (by share of total enrollment)
2002 2005
Range: $200 to $5,000 Range: $200 to $10,000
Median: $1,000 Median: $1,000
No Deductible 65.6% 52.1%
Less than $500
0.9% 2.0%
$500 to $999 14.8% 14.4%
$1,000 to $1,999 12.0% 16.9%
$2,000 or More 6.8% 14.6%
100.0% 100.0%
Source: MDH, Health Economics Program*Median calculation excludes enrollees with no deductible

Trends in Minnesota Individual Market Enrollment, 1994 to 2006
0
50,000
100,000
150,000
200,000
250,000
300,000
1994 1995 1996 1997 1998 1999 2000 2001 2002 2003 2004 2005 2006
Source: MDH, Health Economics Program; estimates based on data from various sources.
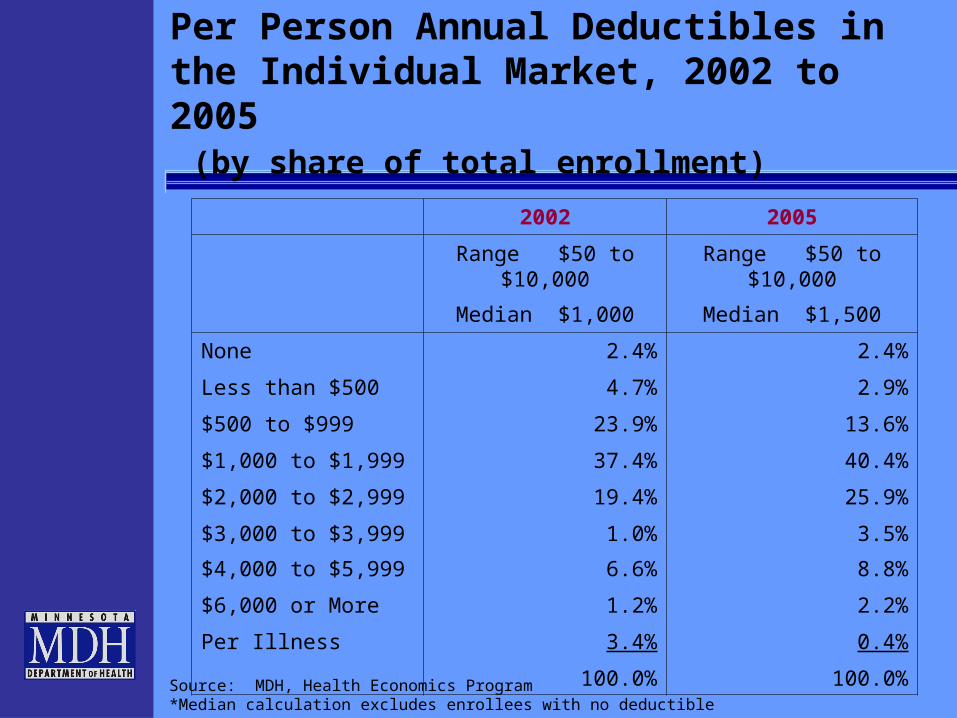
Per Person Annual Deductibles in the Individual Market, 2002 to 2005 (by share of total enrollment)
Source: MDH, Health Economics Program*Median calculation excludes enrollees with no deductible
2002 2005
Range $50 to $10,000 Range $50 to $10,000
Median $1,000 Median $1,500
None 2.4% 2.4%
Less than $500 4.7% 2.9%
$500 to $999 23.9% 13.6%
$1,000 to $1,999 37.4% 40.4%
$2,000 to $2,999 19.4% 25.9%
$3,000 to $3,999 1.0% 3.5%
$4,000 to $5,999 6.6% 8.8%
$6,000 or More 1.2% 2.2%
Per Illness 3.4% 0.4%
100.0% 100.0%

Family Level Annual Deductibles in the Individual Market, 2002 to 2005 (by share of total enrollment)
Source: MDH, Health Economics Program*Median calculation excludes enrollees with no deductible
2002 2005
Range: $100 to $20,000 Range: $100 to $30,000
Median: $2,000 Median: $4,000
None 2.4% 2%
Less than $1,000 1.4% 3%
$1,000 to $2,999 21.9% 20%
$3,000 to $4,999 7.1% 38%
$5,000 to $6,999 2.7% 21%
$7,000 to $10,999 0.7% 4%
$12,000 or more 0.4% 10%
Dependent on Family Size 59.9% 0%
Per Illness 3.4% 0%
100% 100%

Uninsurance in Minnesota

Uninsurance Rate Trends in Minnesota
6.3%
5.4%*5.7%
7.4%*
0%
1%
2%
3%
4%
5%
6%
7%
8%
1995 1999 2001 2004
*Indicates statistically significant difference (95% level) from prior survey year.Source: 1995, 1999, 2001, 2004 Minnesota Health Access Surveys

Sources of Insurance Coverage in Minnesota, 2001 and 2004
* Indicates statistically different at 95% level from 2001.
62.9%*68.4%
4.6%4.7%
25.1%*21.2%
7.4%*5.7%
0%
10%
20%
30%
40%
50%
60%
70%
80%
90%
100%
2001 2004
Group Individual Public Uninsured
Source: Minnesota Health Access Surveys, 2001 and 2004 (preliminary). Estimates that rely solely on household survey data differ slightly from annual estimates that include both survey and administrative data.
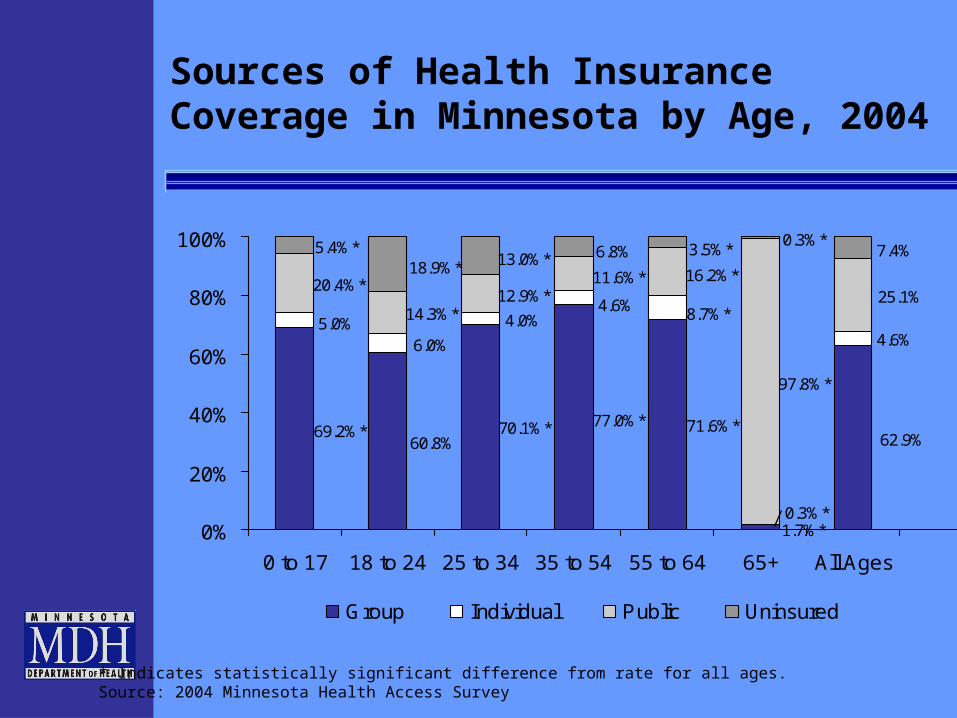
Sources of Health Insurance Coverage in Minnesota by Age, 2004
1.7%*
62.9%71.6%*77.0%*70.1%*
60.8%69.2%*
0.3%*
4.6%
8.7%*4.6%4.0%
6.0%5.0%
97.8%*
25.1%16.2%*11.6%*
12.9%*14.3%*
20.4%*
0.3%*7.4%3.5%*6.8%13.0%*18.9%*
5.4%*
0%
20%
40%
60%
80%
100%
0 to 17 18 to 24 25 to 34 35 to 54 55 to 64 65+ All Ages
Group Individual Public Uninsured
* Indicates statistically significant difference from rate for all ages. Source: 2004 Minnesota Health Access Survey

Sources of Health Insurance Coverage in Minnesota by Income, 2004
62.9%
84.3%*
71.7%*61.8%
33.5%*
15.2%*
4.6%
3.7%*
5.2%
5.7%
5.6%
3.1%*
25.1%
10.1%*18.4%*
23.9%
46.9%*
61.2%*
7.4%1.9%*
4.7%*8.6%14.1%*20.5%*
0%
20%
40%
60%
80%
100%
Up to 100% 101 to 200% 201 to 300% 301 to 400% More than400%
All Incomes
Group Individual Public Uninsured
* Indicates statistically significant difference from rate for all incomes. Source: 2004 Minnesota Health Access Survey
Income as % of Federal Poverty Guidelines

Sources of Health Insurance Coverage in Minnesota by Race/Ethnicity, 2004
62.9%
35.5%*40.5%*
58.7%
41.0%*
65.5%
4.6%
1.5%*0.6%*
6.5%
1.1%*
4.8%
25.1%
28.8%
37.9%*
25.0%
45.2%*
23.8%
7.4%
34.2%*21.0%*
9.8%12.8%*5.9%
0%
20%
40%
60%
80%
100%
White Black Asian American Indian Hispanic AllRace/Ethnicities
Group Individual Public Uninsured
* Indicates statistically significant difference from rate for all race/ethnicities. Source: 2004 Minnesota Health Access Survey

Uninsurance Rates by Economic Development Region, 2001 and 2004
5.7%
5.7%
3.4%^
6.0%
5.1%
4.3%
5.0%
5.5%
7.3%
9.2%^
7.3%
6.5%
10.7%^
6.0%
7.4%*
7.4%*
5.4%^
5.0%
9.1%
5.2%^
9.3%*
9.4%
7.3%
11.2%
10.0%
8.5%
10.9%
8.0%
0% 2% 4% 6% 8% 10% 12%
Statewide
EDR13 Twin CitiesEDR12 Southeast
EDR11 South CentralEDR10 Southwest
EDR9 Central
EDR8 East CentralEDR7 Upper MN Valley
EDR6 Mid-MinnesotaEDR5 North Central
EDR4 West CentralEDR3 Arrowhead
EDR2 Headwaters
EDR1 Northwest
2001 2004
*Indicates statistically significant difference (95% level) from 2001.^Indicates statistically different at 95% level from state rate within year.Source: Minnesota Health Access Surveys, 2001 and 2004
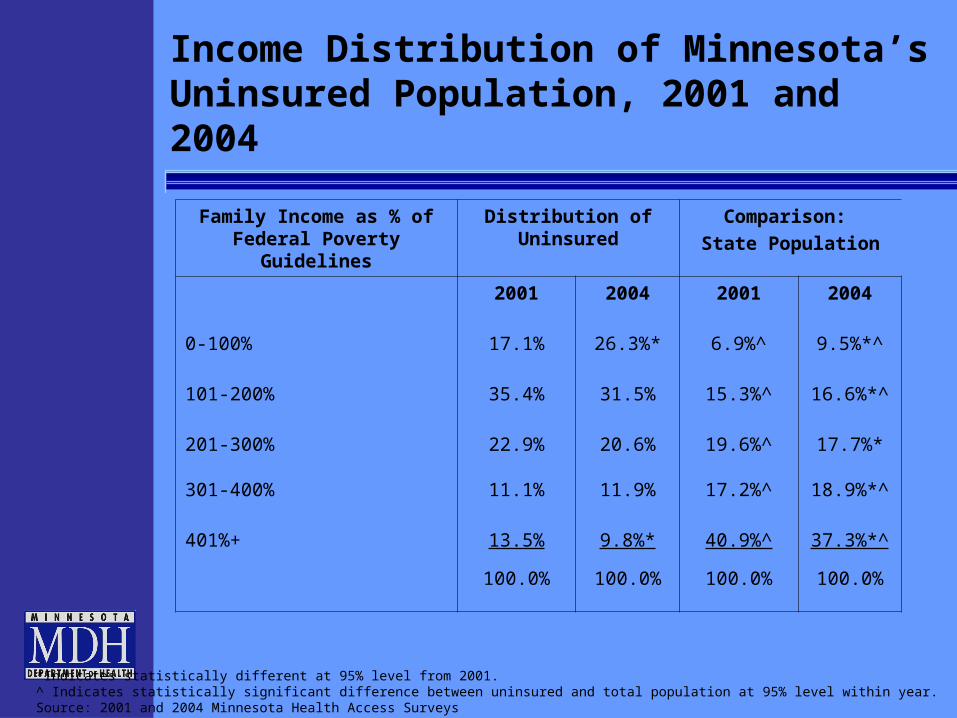
Income Distribution of Minnesota’s Uninsured Population, 2001 and 2004
Family Income as % of Federal Poverty Guidelines
Distribution of Uninsured
Comparison:
State Population
2001 2004 2001 2004
0-100% 17.1% 26.3%* 6.9%^ 9.5%*^
101-200% 35.4% 31.5% 15.3%^ 16.6%*^
201-300% 22.9% 20.6% 19.6%^ 17.7%*
301-400% 11.1% 11.9% 17.2%^ 18.9%*^
401%+ 13.5% 9.8%* 40.9%^ 37.3%*^
100.0% 100.0% 100.0% 100.0%
*Indicates statistically different at 95% level from 2001.^ Indicates statistically significant difference between uninsured and total population at 95% level within year.Source: 2001 and 2004 Minnesota Health Access Surveys
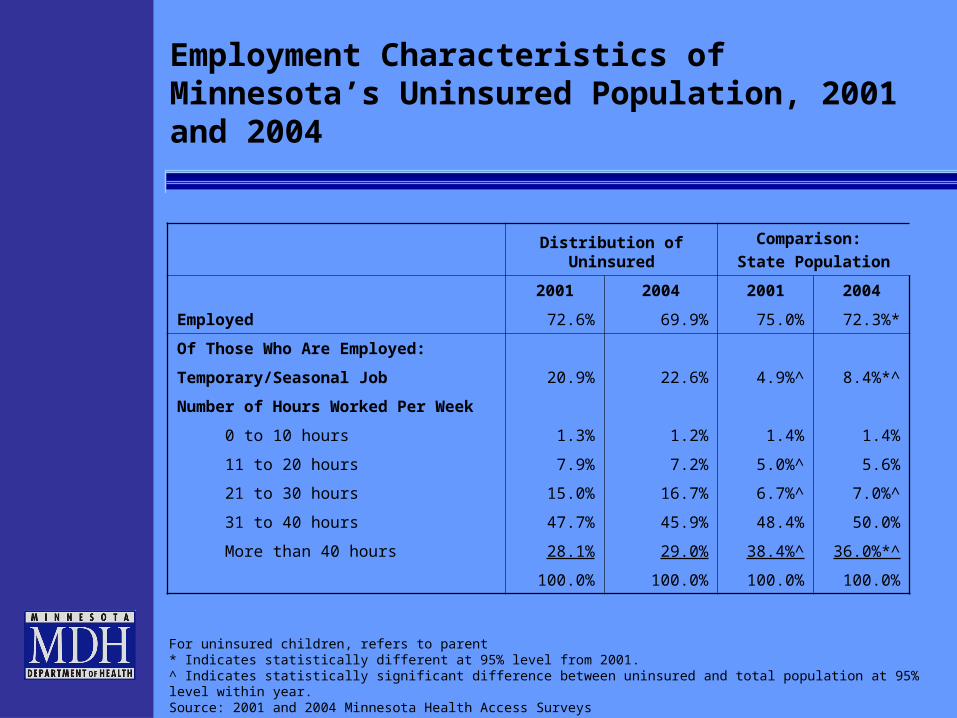
Employment Characteristics of Minnesota’s Uninsured Population, 2001 and 2004
Distribution of Uninsured
Comparison:
State Population
2001 2004 2001 2004
Employed 72.6% 69.9% 75.0% 72.3%*
Of Those Who Are Employed:
Temporary/Seasonal Job 20.9% 22.6% 4.9%^ 8.4%*^
Number of Hours Worked Per Week
0 to 10 hours 1.3% 1.2% 1.4% 1.4%
11 to 20 hours 7.9% 7.2% 5.0%^ 5.6%
21 to 30 hours 15.0% 16.7% 6.7%^ 7.0%^
31 to 40 hours 47.7% 45.9% 48.4% 50.0%
More than 40 hours 28.1% 29.0% 38.4%^ 36.0%*^
100.0% 100.0% 100.0% 100.0%
For uninsured children, refers to parent* Indicates statistically different at 95% level from 2001.^ Indicates statistically significant difference between uninsured and total population at 95% level within year.Source: 2001 and 2004 Minnesota Health Access Surveys
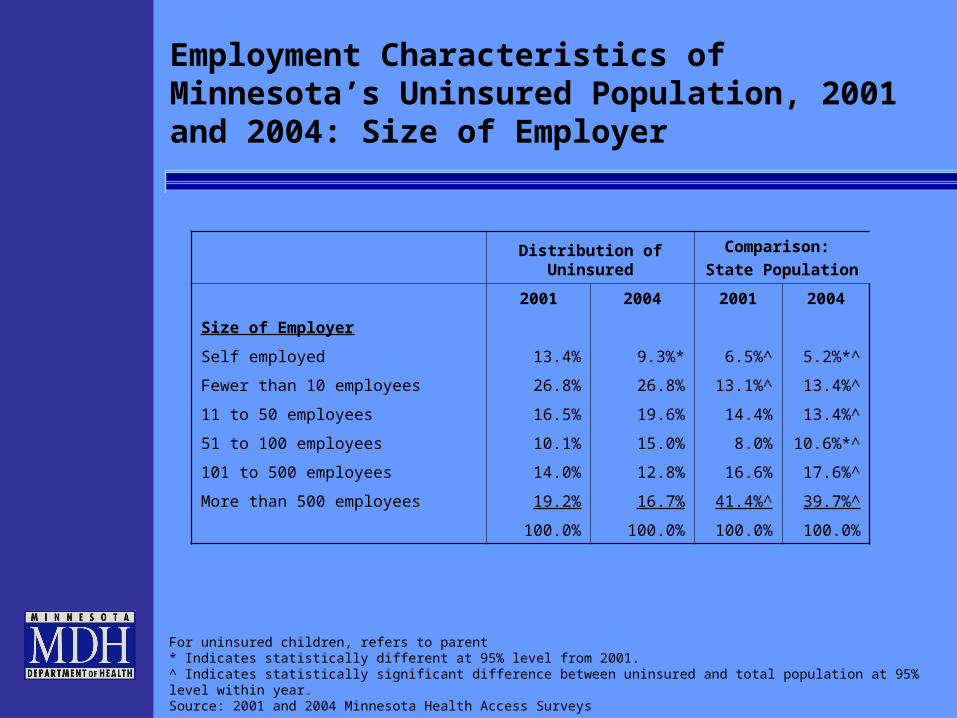
Employment Characteristics of Minnesota’s Uninsured Population, 2001 and 2004: Size of Employer
Distribution of Uninsured
Comparison:
State Population
2001 2004 2001 2004
Size of Employer
Self employed 13.4% 9.3%* 6.5%^ 5.2%*^
Fewer than 10 employees 26.8% 26.8% 13.1%^ 13.4%^
11 to 50 employees 16.5% 19.6% 14.4% 13.4%^
51 to 100 employees 10.1% 15.0% 8.0% 10.6%*^
101 to 500 employees 14.0% 12.8% 16.6% 17.6%^
More than 500 employees 19.2% 16.7% 41.4%^ 39.7%^
100.0% 100.0% 100.0% 100.0%
For uninsured children, refers to parent* Indicates statistically different at 95% level from 2001.^ Indicates statistically significant difference between uninsured and total population at 95% level within year.Source: 2001 and 2004 Minnesota Health Access Surveys

Distribution adds to more than 100% since individuals were allowed to choose more than one race/ethnicity.* Indicates statistically different at 95% level from 2001. ^ Indicates statistically significant difference between uninsured and total population at 95% level within year.Source: 2001 and 2004 Minnesota Health Access Surveys
Racial/Ethnic Distribution of Minnesota’s Uninsured Population, 2001 and 2004
Distribution of Uninsured Comparison: State Population
2001 2004 2001 2004
White 75.7% 70.1%* 90.7%^ 88.7%*^
Black 12.0% 7.6%* 4.2%^ 4.4%^
American Indian 5.1% 5.6% 1.7%^ 2.0%^
Asian 3.9% 4.8% 3.2% 3.6%
Other 1.0% 0.2%* 0.4% 0.1%*
Hispanic 9.0% 15.1%* 2.9%^ 3.3%^
See note See note See note See note

Access to Employer Coverage: Offer, Eligibility, and Take-up Rates, 2001 and 2004
Non-Elderly Minnesotans' Access to Employer-Based Insurance
84.1%
97.7% 95.3%
80.3%*
95.7%* 95.0%
0%
20%
40%
60%
80%
100%
Employer Offer Eligibility Rate Take-up Rate
2001 2004
1: Person works for or has a family member who works for an employer that offers health insurance.2: Percent of those with a connection to an employer that offers coverage who are eligible for health insurance coverage offered by that employer.3: Percent of those eligible for employer coverage who enroll.
*Indicates statistically different at 95% level from 2001.Source: 2001 and 2004 Minnesota Health Access Surveys
1 2 3
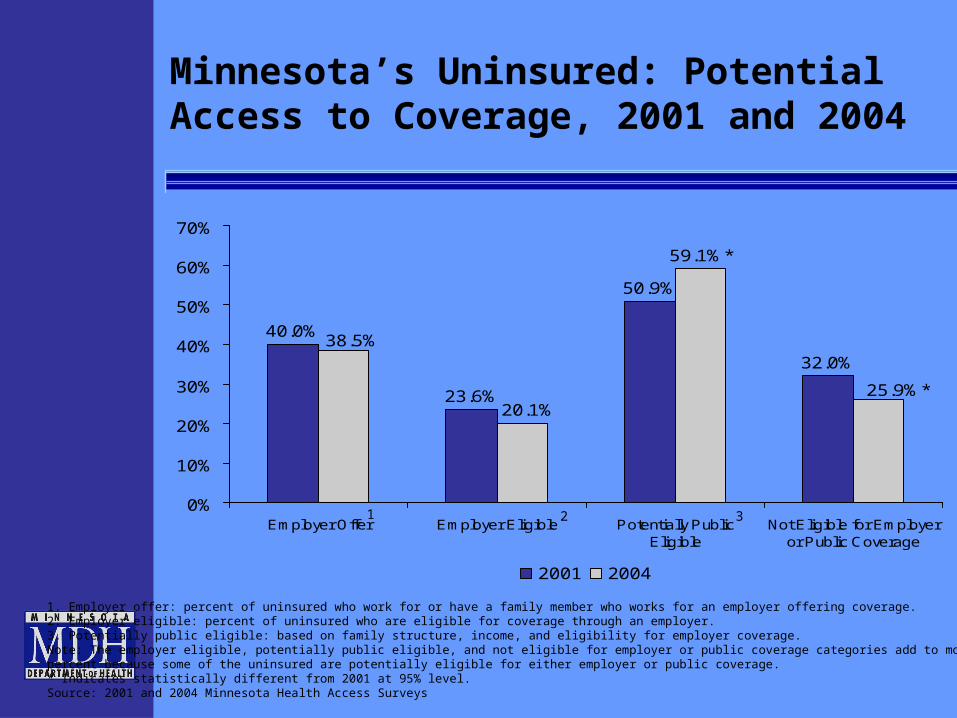
Minnesota’s Uninsured: Potential Access to Coverage, 2001 and 2004
40.0%
23.6%
50.9%
32.0%
59.1%*
20.1%
38.5%
25.9%*
0%
10%
20%
30%
40%
50%
60%
70%
Employer Offer Employer Eligible Potentially PublicEligible
Not Eligible for Employeror Public Coverage
2001 2004
1. Employer offer: percent of uninsured who work for or have a family member who works for an employer offering coverage.2. Employer eligible: percent of uninsured who are eligible for coverage through an employer.3. Potentially public eligible: based on family structure, income, and eligibility for employer coverage.Note: The employer eligible, potentially public eligible, and not eligible for employer or public coverage categories add to more than 100percent because some of the uninsured are potentially eligible for either employer or public coverage.* Indicates statistically different from 2001 at 95% level.Source: 2001 and 2004 Minnesota Health Access Surveys
1 2 3

Public Insurance Programs

Medicare Enrollment and Spending, Minnesota and U.S.
Enrollment
Expenditures
($ millions)
Estimated spending per enrollee
Fiscal yr Minnesota U.S. Minnesota U.S. Minnesota U.S.
1994 623,733 36,935,366 $2,116 $162,481 $3,392 $4,399
1995 630,521 37,535,024 $2,381 $180,088 $3,776 $4,798
1996 635,748 38,064,130 $2,265 $194,393 $3,563 $5,107
1997 639,293 38,444,739 $2,415 $207,156 $3,778 $5,388
1998 643,877 38,824,855 $2,442 $209,509 $3,792 $5,396
1999 648,272 39,140,386 $2,430 $208,648 $3,748 $5,331
2000 654,405 39,619,986 $2,509 $215,689 $3,834 $5,444
2001 660,399 40,025,724 $2,760 $237,269 $4,179 $5,928
2002 667,407 40,488,878 $2,937 $251,117 $4,400 $6,202
2003 676,156 41,086,981 $3,184 $274,054 $4,709 $6,670
2004 686,155 41,728,804 $3,486 $300,089 $5,080 $7,191
Sources: Enrollment data from Centers for Medicare and Medicaid Services as of July 1 each year. Spending estimates by federal fiscal year from the U.S. Census Bureau, Consolidated Federal Funds Report; specific estimates for MN developed by MDH using an adjustment for border crossing.
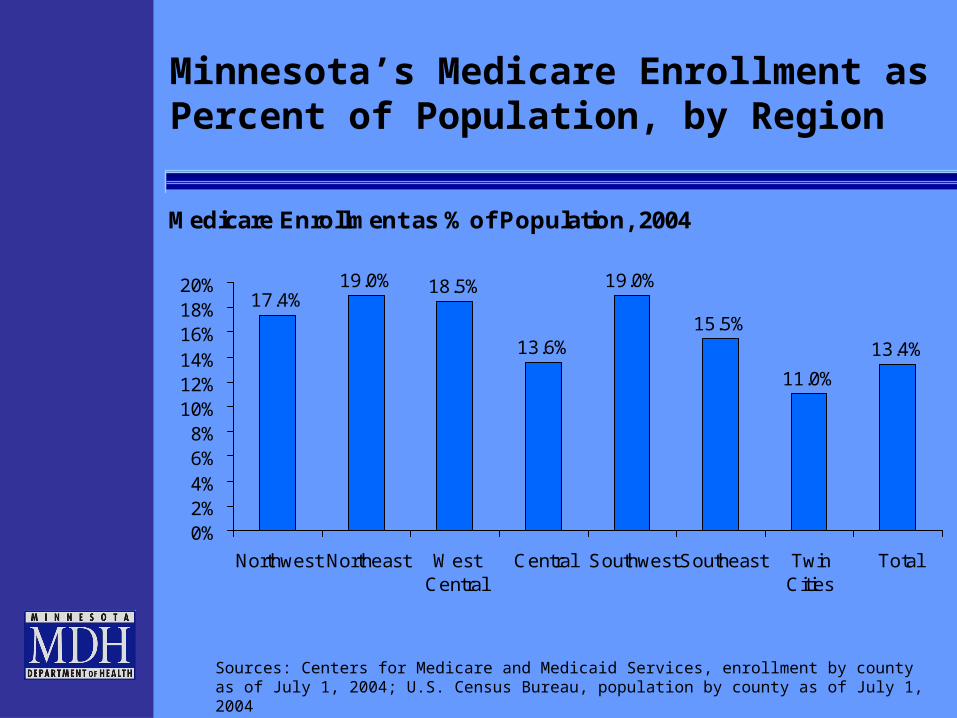
Minnesota’s Medicare Enrollment as Percent of Population, by Region
Medicare Enrollment as % of Population, 2004
17.4%19.0% 18.5%
13.6%
19.0%
15.5%
11.0%
13.4%
0%2%4%6%8%
10%12%14%16%18%20%
Northwest Northeast WestCentral
Central Southwest Southeast TwinCities
Total
Sources: Centers for Medicare and Medicaid Services, enrollment by county as of July 1, 2004; U.S. Census Bureau, population by county as of July 1, 2004
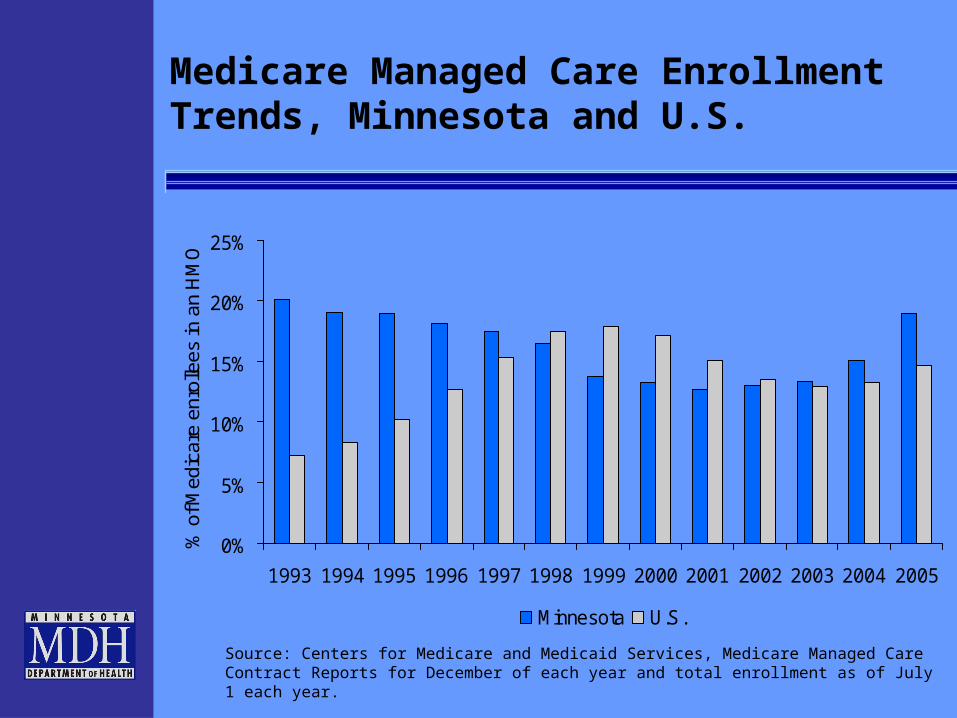
Medicare Managed Care Enrollment Trends, Minnesota and U.S.
0%
5%
10%
15%
20%
25%
1993 1994 1995 1996 1997 1998 1999 2000 2001 2002 2003 2004 2005
% o
f Med
icar
e en
rolle
es in
an
HM
O
Minnesota U.S.
Source: Centers for Medicare and Medicaid Services, Medicare Managed Care Contract Reports for December of each year and total enrollment as of July 1 each year.
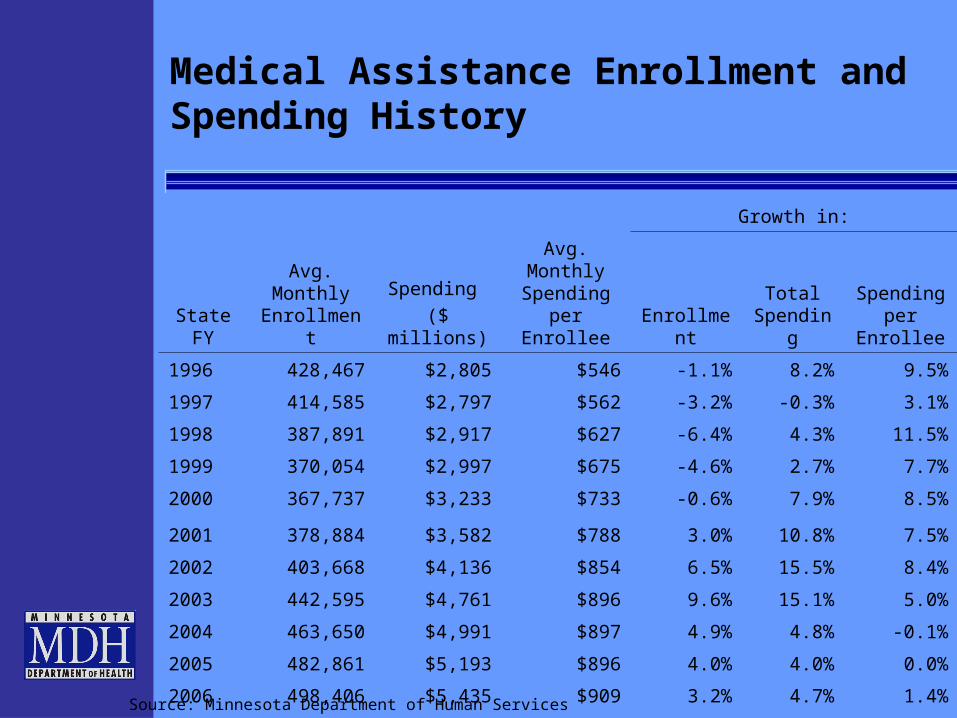
Medical Assistance Enrollment and Spending History
Growth in:
State FY
Avg. Monthly
Enrollment
Spending
($ millions)
Avg. Monthly Spending
per Enrollee EnrollmentTotal
Spending
Spending per
Enrollee
1996 428,467 $2,805 $546 -1.1% 8.2% 9.5%
1997 414,585 $2,797 $562 -3.2% -0.3% 3.1%
1998 387,891 $2,917 $627 -6.4% 4.3% 11.5%
1999 370,054 $2,997 $675 -4.6% 2.7% 7.7%
2000 367,737 $3,233 $733 -0.6% 7.9% 8.5%
2001 378,884 $3,582 $788 3.0% 10.8% 7.5%
2002 403,668 $4,136 $854 6.5% 15.5% 8.4%
2003 442,595 $4,761 $896 9.6% 15.1% 5.0%
2004 463,650 $4,991 $897 4.9% 4.8% -0.1%
2005 482,861 $5,193 $896 4.0% 4.0% 0.0%
2006 498,406 $5,435 $909 3.2% 4.7% 1.4%
Source: Minnesota Department of Human Services
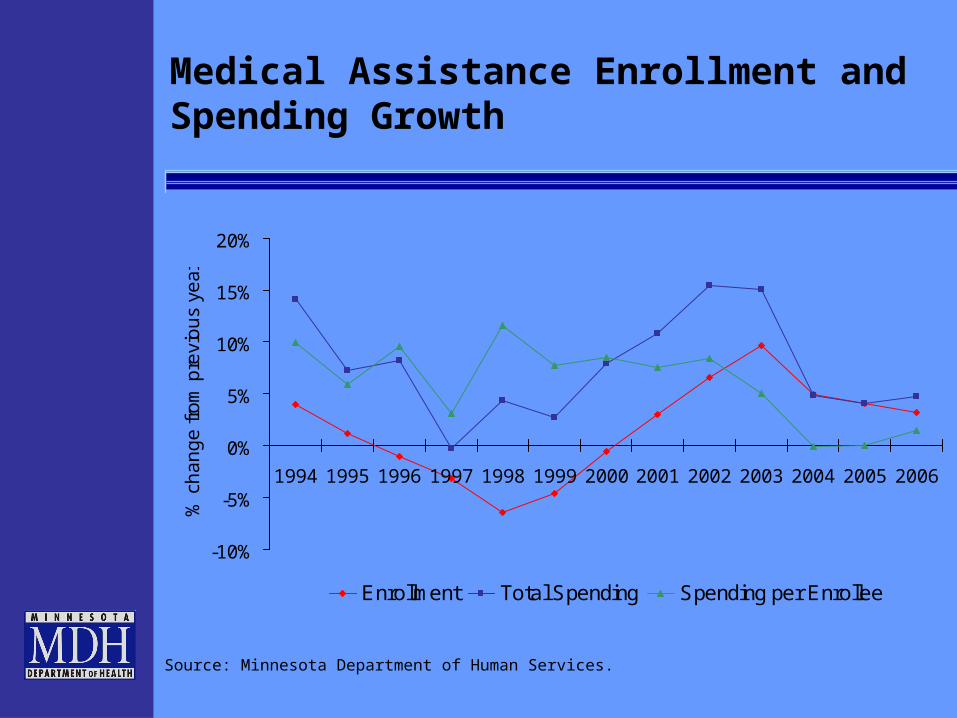
Medical Assistance Enrollment and Spending Growth
-10%
-5%
0%
5%
10%
15%
20%
1994 1995 1996 1997 1998 1999 2000 2001 2002 2003 2004 2005 2006
% c
ha
ng
e fr
om
pre
vio
us
yea
r
Enrollment Total Spending Spending per Enrollee
Source: Minnesota Department of Human Services.

Medical Assistance Enrollment and Spending by Eligibility Category, 2005
69.6%
23.9%
19.5%
49.7%
10.9%26.5%
Enrollment Spending
Families with children Disabled/Blind Elderly
Source: Minnesota Department of Human Services, data for state fiscal year 2005

MinnesotaCare Enrollment and Spending History
Growth in:
State FY
Avg. Monthly Enrollment
Spending
($ millions)
Avg. Monthly Spending
per Enrollee EnrollmentTotal
Spending
Spending per
Enrollee
1996 88,277 $80 $75 14.0% 41.7% 24.3%
1997 93,136 $98 $88 5.5% 23.2% 16.8%
1998 97,854 $108 $92 5.1% 10.5% 5.2%
1999 106,552 $164 $129 8.9% 51.7% 39.3%
2000 108,999 $187 $143 2.3% 13.8% 11.2%
2001 122,247 $240 $164 12.2% 28.3% 14.4%
2002 138,022 $351 $212 12.9% 46.3% 29.6%
2003 151,205 $435 $240 9.6% 23.8% 13.0%
2004 148,505 $487 $273 -1.8% 11.9% 14.0%
2005 141,822 $409 $240 -4.5% -16.1% -12.1%
2006 128,733 $438 $284 -9.2% 7.3% 18.2%
Source: Minnesota Department of Human Services
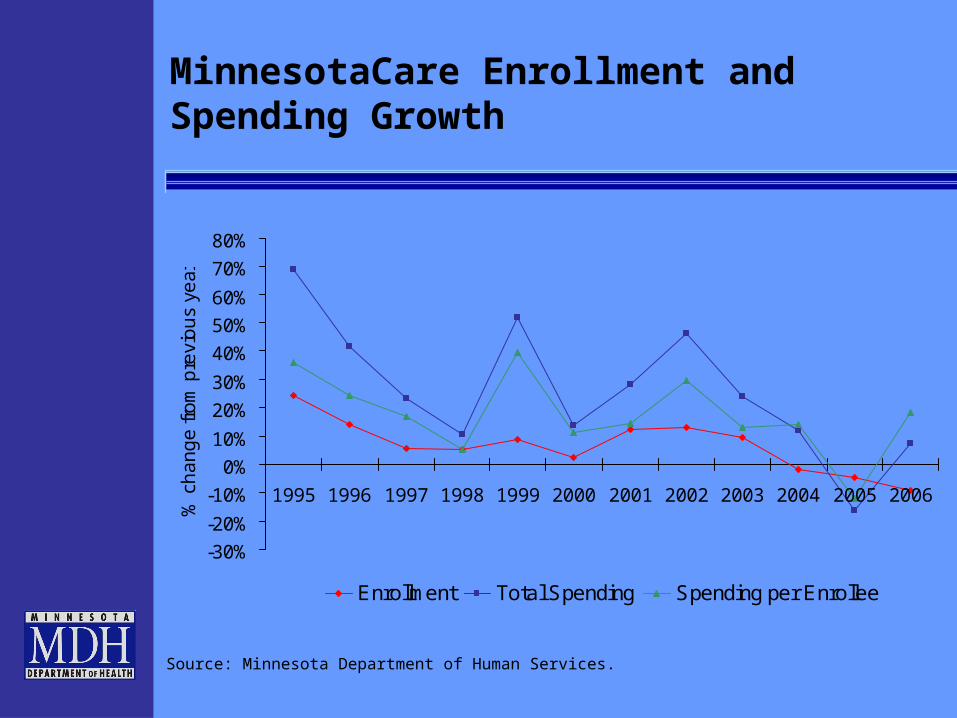
MinnesotaCare Enrollment and Spending Growth
-30%
-20%
-10%
0%
10%
20%
30%
40%
50%
60%
70%
80%
1995 1996 1997 1998 1999 2000 2001 2002 2003 2004 2005 2006
% c
ha
ng
e fr
om
pre
vio
us
yea
r
Enrollment Total Spending Spending per Enrollee
Source: Minnesota Department of Human Services.
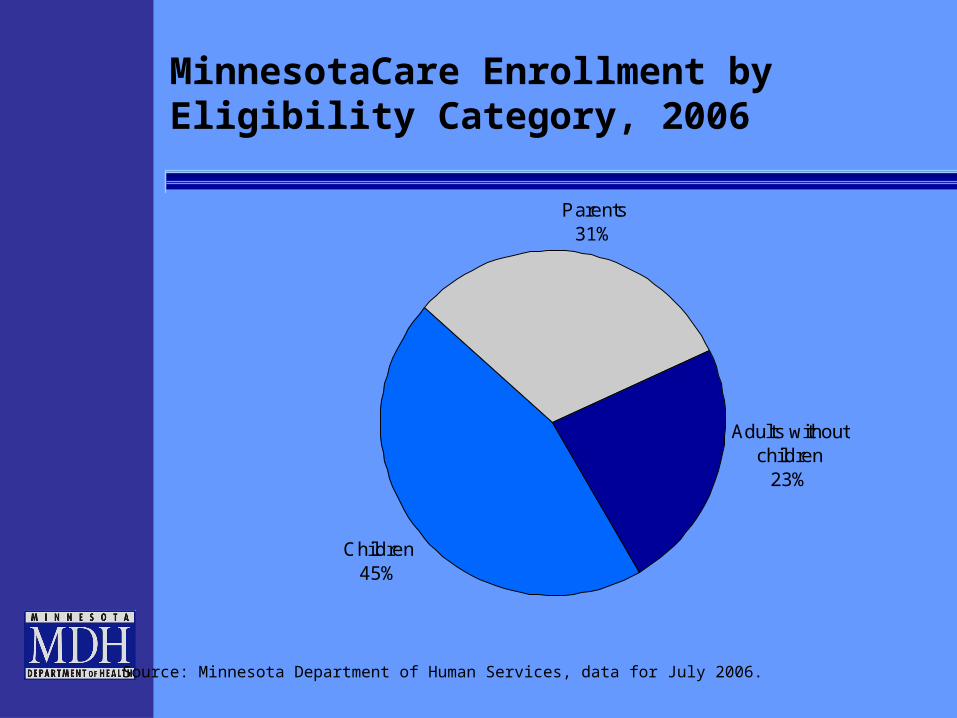
MinnesotaCare Enrollment by Eligibility Category, 2006
Children45%
Parents31%
Adults without children
23%
Source: Minnesota Department of Human Services, data for July 2006.
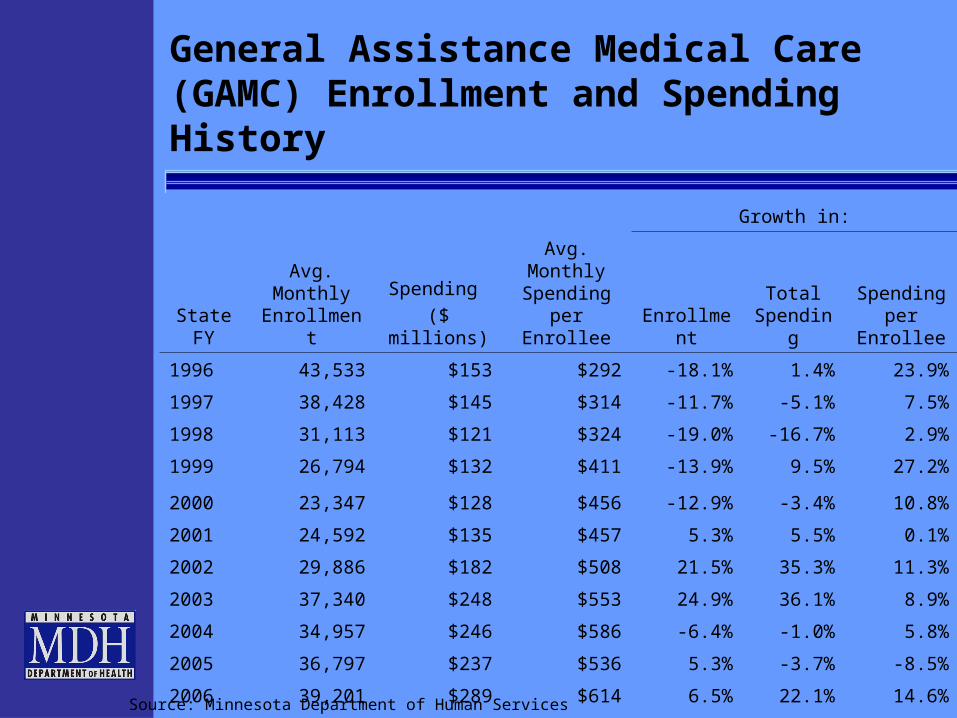
General Assistance Medical Care (GAMC) Enrollment and Spending History
Growth in:
State FY
Avg. Monthly
Enrollment
Spending
($ millions)
Avg. Monthly Spending
per Enrollee EnrollmentTotal
Spending
Spending per
Enrollee
1996 43,533 $153 $292 -18.1% 1.4% 23.9%
1997 38,428 $145 $314 -11.7% -5.1% 7.5%
1998 31,113 $121 $324 -19.0% -16.7% 2.9%
1999 26,794 $132 $411 -13.9% 9.5% 27.2%
2000 23,347 $128 $456 -12.9% -3.4% 10.8%
2001 24,592 $135 $457 5.3% 5.5% 0.1%
2002 29,886 $182 $508 21.5% 35.3% 11.3%
2003 37,340 $248 $553 24.9% 36.1% 8.9%
2004 34,957 $246 $586 -6.4% -1.0% 5.8%
2005 36,797 $237 $536 5.3% -3.7% -8.5%
2006 39,201 $289 $614 6.5% 22.1% 14.6%
Source: Minnesota Department of Human Services

GAMC Enrollment and Spending Growth
-30%
-20%
-10%
0%
10%
20%
30%
40%
1994 1995 1996 1997 1998 1999 2000 2001 2002 2003 2004 2005 2006
% c
ha
ng
e fr
om
pre
vio
us
yea
r
Enrollment Total Spending Spending per Enrollee
Source: Minnesota Department of Human Services.
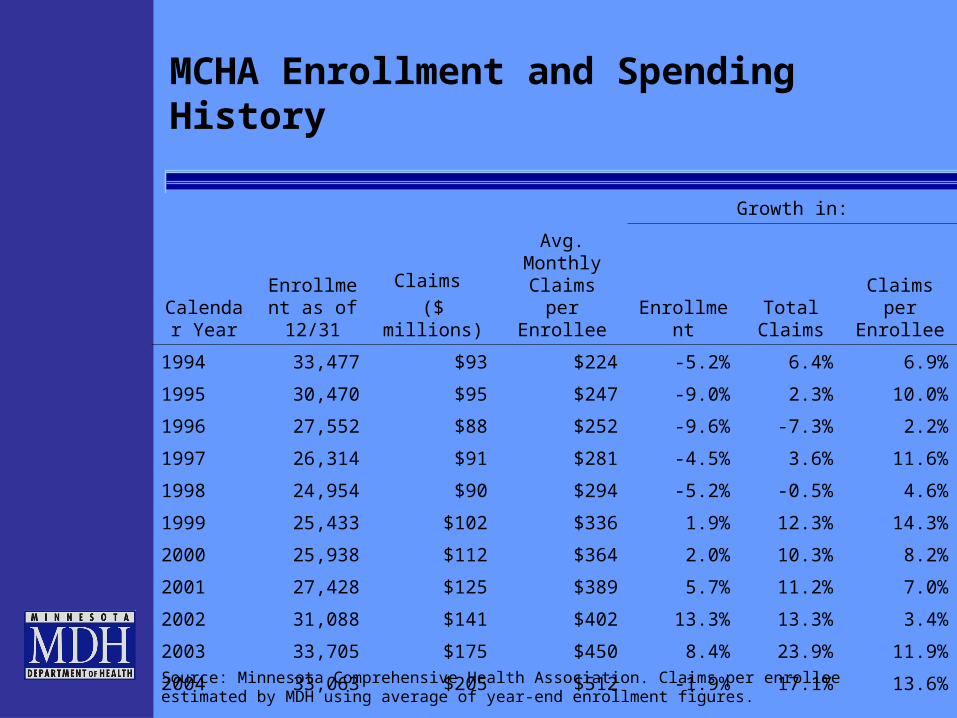
MCHA Enrollment and Spending History
Growth in:
Calendar Year
Enrollment as of 12/31
Claims
($ millions)
Avg. Monthly Claims per
Enrollee EnrollmentTotal
ClaimsClaims per
Enrollee
1994 33,477 $93 $224 -5.2% 6.4% 6.9%
1995 30,470 $95 $247 -9.0% 2.3% 10.0%
1996 27,552 $88 $252 -9.6% -7.3% 2.2%
1997 26,314 $91 $281 -4.5% 3.6% 11.6%
1998 24,954 $90 $294 -5.2% -0.5% 4.6%
1999 25,433 $102 $336 1.9% 12.3% 14.3%
2000 25,938 $112 $364 2.0% 10.3% 8.2%
2001 27,428 $125 $389 5.7% 11.2% 7.0%
2002 31,088 $141 $402 13.3% 13.3% 3.4%
2003 33,705 $175 $450 8.4% 23.9% 11.9%
2004 33,063 $205 $512 -1.9% 17.1% 13.6%
Source: Minnesota Comprehensive Health Association. Claims per enrollee estimated by MDH using average of year-end enrollment figures.
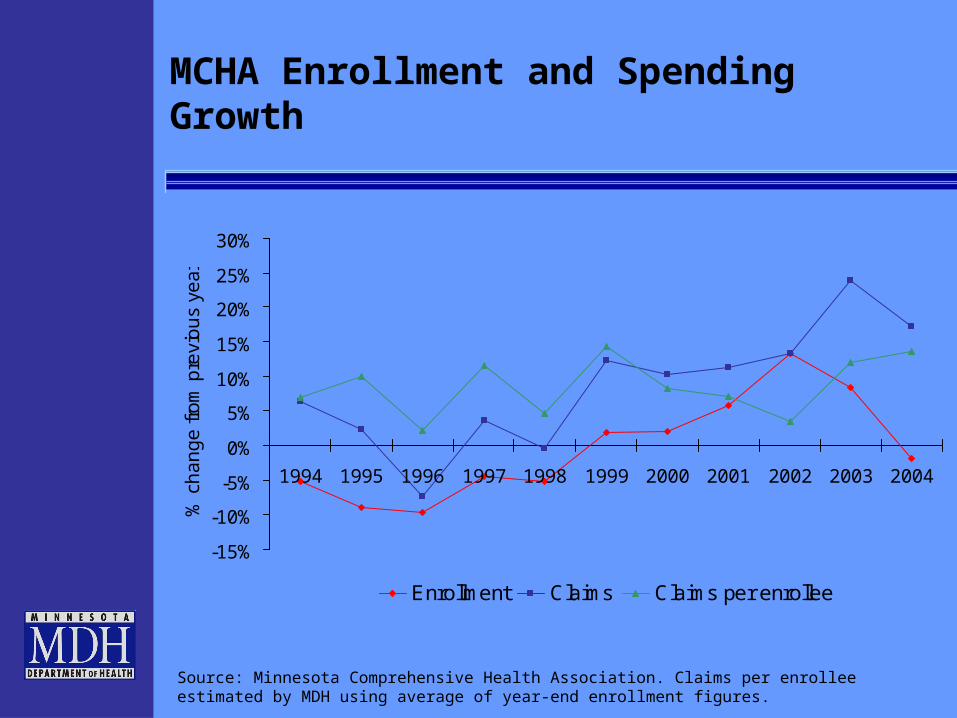
MCHA Enrollment and Spending Growth
-15%
-10%
-5%
0%
5%
10%
15%
20%
25%
30%
1994 1995 1996 1997 1998 1999 2000 2001 2002 2003 2004
% c
ha
ng
e fr
om
pre
vio
us
yea
r
Enrollment Claims Claims per enrollee
Source: Minnesota Comprehensive Health Association. Claims per enrollee estimated by MDH using average of year-end enrollment figures.
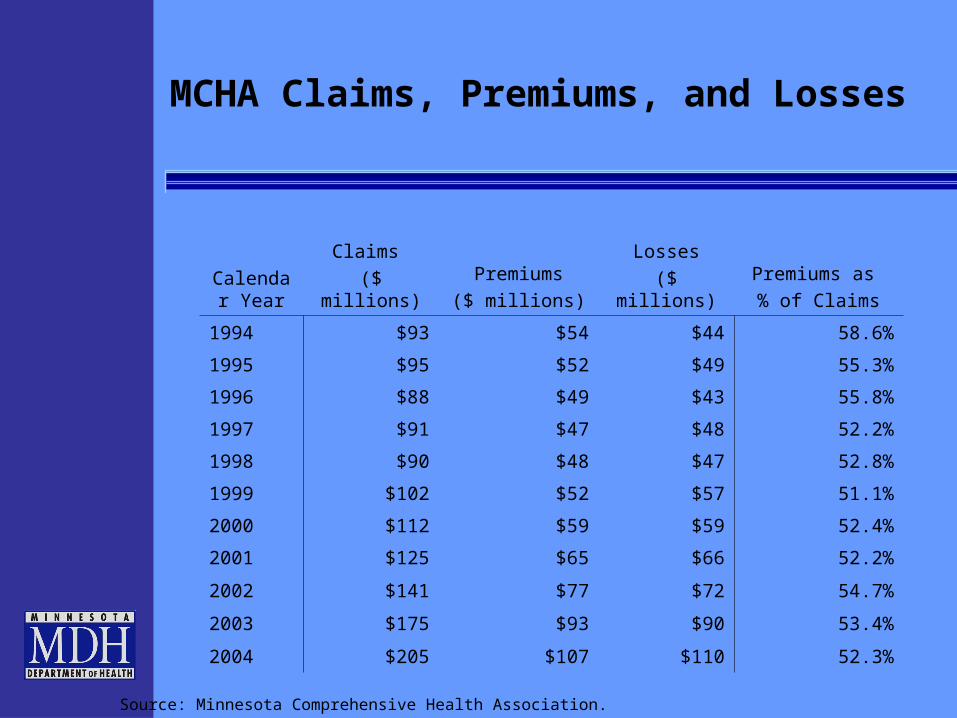
MCHA Claims, Premiums, and Losses
Calendar Year
Claims
($ millions)
Premiums
($ millions)
Losses
($ millions)
Premiums as
% of Claims
1994 $93 $54 $44 58.6%
1995 $95 $52 $49 55.3%
1996 $88 $49 $43 55.8%
1997 $91 $47 $48 52.2%
1998 $90 $48 $47 52.8%
1999 $102 $52 $57 51.1%
2000 $112 $59 $59 52.4%
2001 $125 $65 $66 52.2%
2002 $141 $77 $72 54.7%
2003 $175 $93 $90 53.4%
2004 $205 $107 $110 52.3%
Source: Minnesota Comprehensive Health Association.

Key Statistics on Minnesota Health Plans
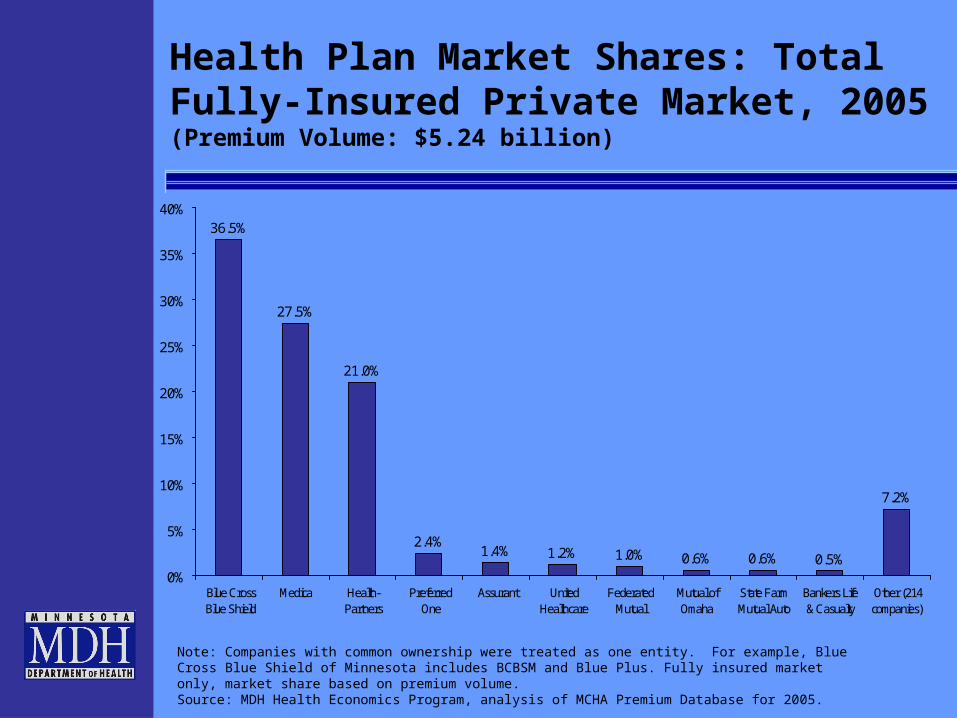
Health Plan Market Shares: Total Fully-Insured Private Market, 2005(Premium Volume: $5.24 billion)
36.5%
27.5%
21.0%
2.4%1.4% 1.2% 1.0% 0.6% 0.6% 0.5%
7.2%
0%
5%
10%
15%
20%
25%
30%
35%
40%
Blue CrossBlue Shield
Medica Health-Partners
PreferredOne
Assurant UnitedHealthcare
FederatedMutual
Mutual ofOmaha
State FarmMutual Auto
Bankers Life& Casualty
Other (214companies)
Note: Companies with common ownership were treated as one entity. For example, Blue Cross Blue Shield of Minnesota includes BCBSM and Blue Plus. Fully insured market only, market share based on premium volume.Source: MDH Health Economics Program, analysis of MCHA Premium Database for 2005.

Health Plan Market Shares: Small Group Market, 2006
44.3%
30.7%
17.5%
3.3% 3.1%0.5% 0.4% 0.3%
0%
5%
10%
15%
20%
25%
30%
35%
40%
45%
50%
Blue CrossBlue Shield of
MN
Medica HealthPartners PreferredOne FederatedMutual Ins. Co.
Time Ins. Co.(formerlyFortis)
Principal LifeIns. Co.
Other (3companies)
Note: Companies with common ownership were treated as one entity. For example, Blue Cross Blue Shield of Minnesota includes BCBSM and Blue Plus. Market shares based on premium volume; fully insured market only. Source: Minnesota Department of Commerce, "Report of 2006 Loss Ratio Experience in the Individual and Small Employer Health Plan Markets for: Insurance Companies Nonprofit Health Service Plan Corporations and Health Maintenance Organizations," June 2007.
Total Premium Volume in 2006: $1.5 Billion
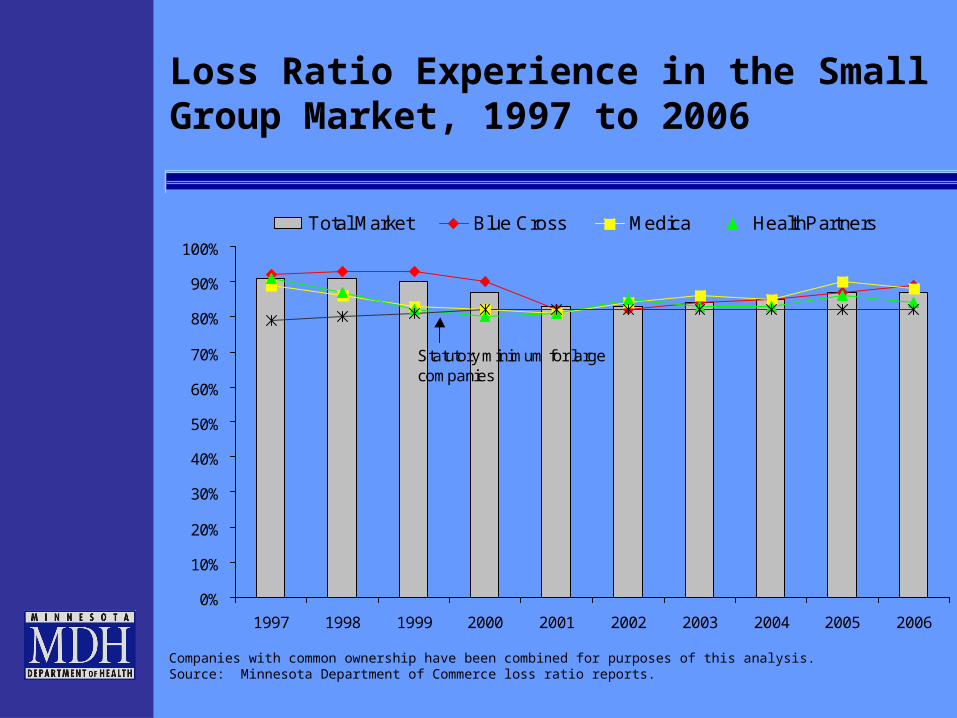
Loss Ratio Experience in the Small Group Market, 1997 to 2006
0%
10%
20%
30%
40%
50%
60%
70%
80%
90%
100%
1997 1998 1999 2000 2001 2002 2003 2004 2005 2006
Total Market Blue Cross Medica HealthPartners
Statutory minimum for large companies
Companies with common ownership have been combined for purposes of this analysis. Source: Minnesota Department of Commerce loss ratio reports.

Health Plan Market Shares: Individual Market, 2006
64.4%
12.6% 11.6%
5.9%1.6% 1.5% 1.4% 0.9%
0%
10%
20%
30%
40%
50%
60%
70%
Blue CrossBlue Shield of
MN
Time Ins. Co.(formerlyFortis)
HealthPartners Medica AmericanFamily Mutual
Ins. Co.
World Ins. Co. State FarmMutual
Automobile Ins.Co.
Other (5companies)
Note: Companies with common ownership were treated as one entity. For example, Time Ins. Co. includes Time Ins. Co. and John Alden Life Ins. Co.. Market shares based on premium volume; fully insured market only. Source: Minnesota Department of Commerce, "Report of 2006 Loss Ratio Experience in the Individual and Small Employer Health Plan Markets for: Insurance Companies Nonprofit Health Service Plan Corporations and Health Maintenance Organizations ," June 2007.
Total Premium Volume in 2006: $520 Million
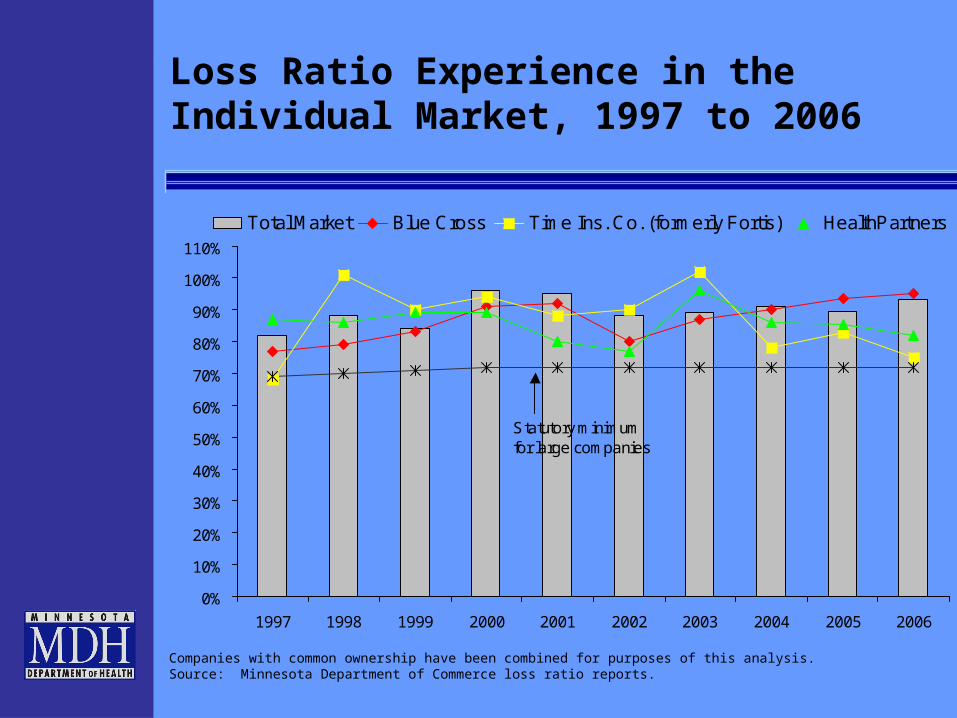
Loss Ratio Experience in the Individual Market, 1997 to 2006
0%
10%
20%
30%
40%
50%
60%
70%
80%
90%
100%
110%
1997 1998 1999 2000 2001 2002 2003 2004 2005 2006
Total Market Blue Cross Time Ins. Co. (formerly Fortis) HealthPartners
Statutory minimumfor large companies
Companies with common ownership have been combined for purposes of this analysis. Source: Minnesota Department of Commerce loss ratio reports.
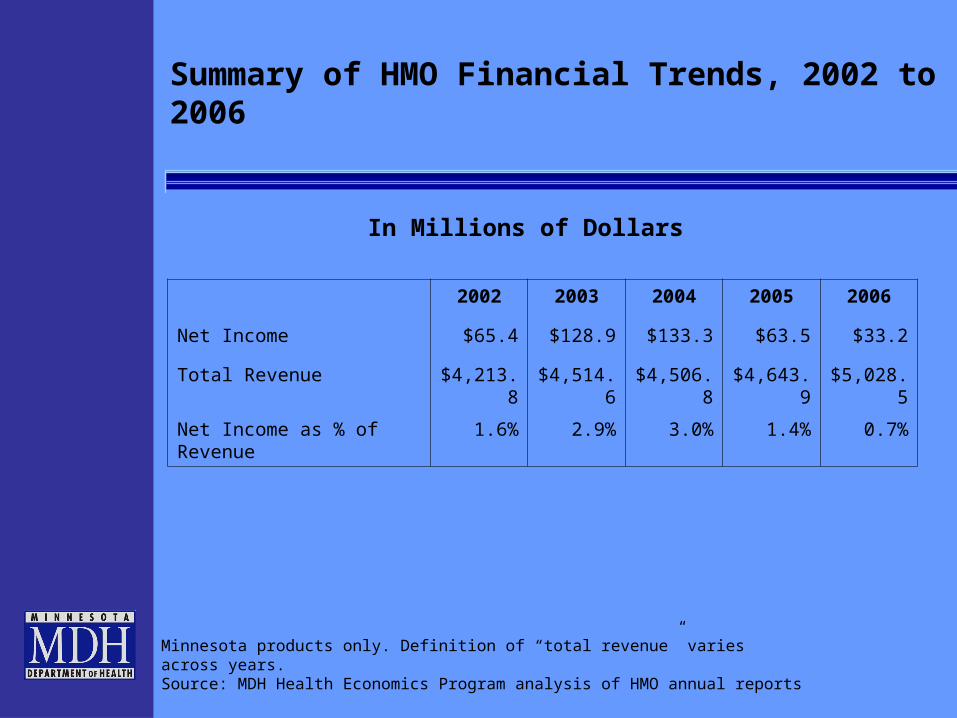
Summary of HMO Financial Trends, 2002 to 2006
2002 2003 2004 2005 2006
Net Income $65.4 $128.9 $133.3 $63.5 $33.2
Total Revenue $4,213.8 $4,514.6 $4,506.8 $4,643.9 $5,028.5
Net Income as % of Revenue 1.6% 2.9% 3.0% 1.4% 0.7%
Minnesota products only. Definition of “total revenue” varies across years.Source: MDH Health Economics Program analysis of HMO annual reports
In Millions of Dollars
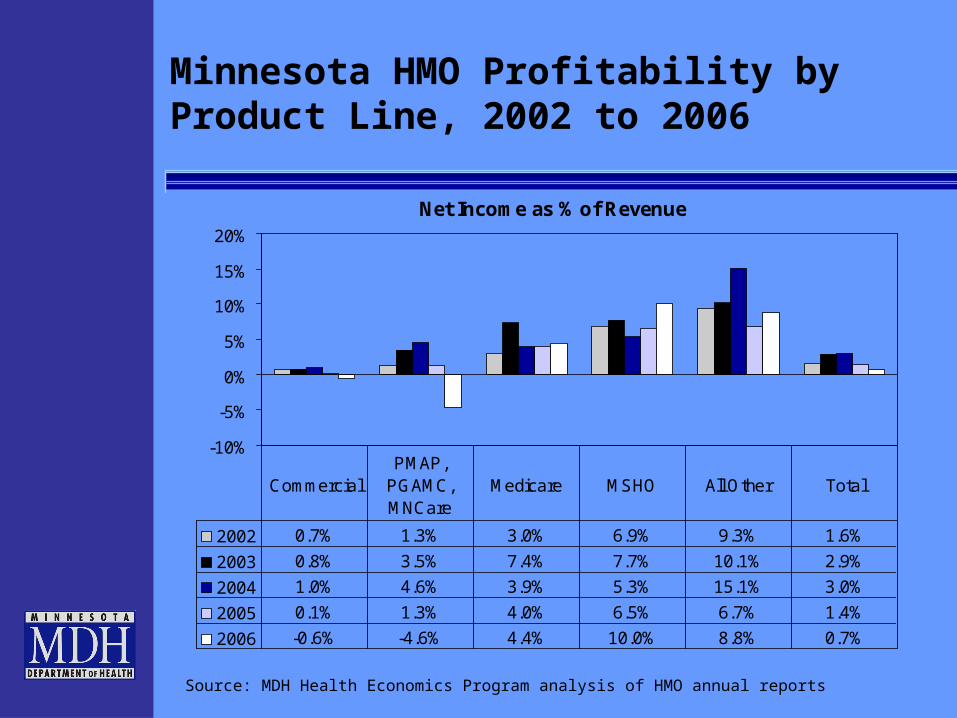
Minnesota HMO Profitability by Product Line, 2002 to 2006
Net Income as % of Revenue
-10%
-5%
0%
5%
10%
15%
20%
2002 0.7% 1.3% 3.0% 6.9% 9.3% 1.6%
2003 0.8% 3.5% 7.4% 7.7% 10.1% 2.9%
2004 1.0% 4.6% 3.9% 5.3% 15.1% 3.0%
2005 0.1% 1.3% 4.0% 6.5% 6.7% 1.4%
2006 -0.6% -4.6% 4.4% 10.0% 8.8% 0.7%
CommercialPMAP,
PGAMC, MNCare
Medicare MSHO All Other Total
Source: MDH Health Economics Program analysis of HMO annual reports

Minnesota Hospitals
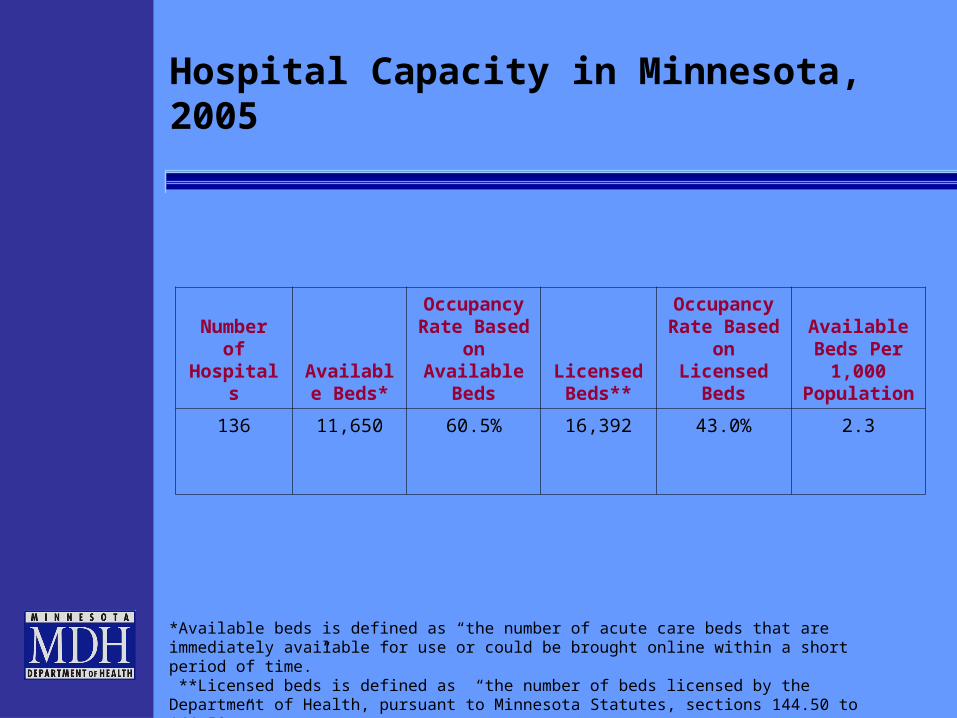
*Available beds is defined as “the number of acute care beds that are immediately available for use or could be brought online within a short period of time.” **Licensed beds is defined as “the number of beds licensed by the Department of Health, pursuant to Minnesota Statutes, sections 144.50 to 144.58.” Source: MDH, Health Care Cost Information System
Number of Hospitals
Available Beds*
Occupancy Rate Based on Available
BedsLicensed Beds**
Occupancy Rate Based on Licensed
Beds
Available Beds Per
1,000 Population
136 11,650 60.5% 16,392 43.0% 2.3
Hospital Capacity in Minnesota, 2005

Region
Number of
HospitalsAvailable
Beds*
Occupancy Rate Based
on Available
BedsLicensed
Beds**
Occupancy Rate Based
on Licensed
Beds
Available Beds Per
1,000 Population
Central 20 1,119 52.2% 1,390 42.0% 1.6
Metropolitan 26 5,700 72.4% 8,328 49.6% 2.1
Northeast 17 1,188 51.8% 1,465 42.0% 3.7
Northwest 13 447 38.7% 576 30.0% 2.3
South Central 15 553 42.8% 784 30.2% 1.9
Southeast 12 1,658 60.4% 2,613 38.3% 3.5
Southwest 24 627 26.8% 773 21.7% 2.8
West Central 9 358 40.5% 463 31.3% 1.9
Total 136 11,650 60.5% 16,392 43.0% 2.3
*Available beds is defined as “the number of acute care beds that are immediately available for use or could be brought online within a short period of time.” **Licensed beds is defined as “the number of beds licensed by the Department of Health, pursuant to Minnesota Statutes, sections 144.50 to 144.58.”Source: MDH, Health Care Cost Information System
Regional Hospital Capacity in Minnesota, 2005

Source: MDH, Health Care Cost Information System
0
100,000
200,000
300,000
400,000
500,000
600,000
700,000
1995 1996 1997 1998 1999 2000 2001 2002 2003 2004 20050
1,000,000
2,000,000
3,000,000
4,000,000
5,000,000
6,000,000
7,000,000
8,000,000
9,000,000
Inpatient Admissions Outpatient Visits
Minnesota Hospital Visits and Admissions, 1995 - 2005
Ad
mis
sio
ns
Ou
tpa
tien
t visits

4.8 4.7 4.6 4.5 4.5 4.5 4.4 4.3 4.3 4.2 4.2
0
1
2
3
4
5
6
1995 1996 1997 1998 1999 2000 2001 2002 2003 2004 2005
Source: MDH, Health Care Cost Information System
Average Length of Stay (ALOS) in Minnesota Hospitals, 1995 – 2005
Ave
rag
e le
ng
th o
f st
ay
(da
ys)
0
50,000
100,000
150,000
200,000
250,000
300,000
350,000
1995 1996 1997 1998 1999 2000 2001 2002 2003 2004 2005
Source: MDH, Health Care Cost Information System
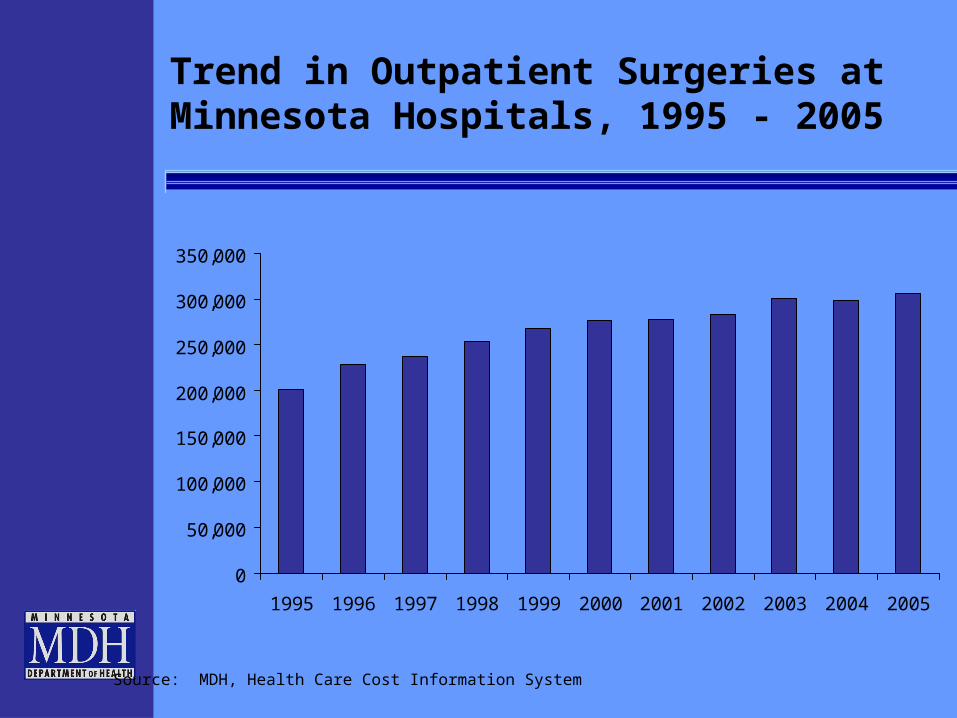
Trend in Outpatient Surgeries at Minnesota Hospitals, 1995 - 2005

0
200,000
400,000
600,000
800,000
1,000,000
1,200,000
1,400,000
1,600,000
1,800,000
1995 1996 1997 1998 1999 2000 2001 2002 2003 2004 2005
Source: MDH, Health Care Cost Information System
Trend in Emergency Room Visits at Minnesota Hospitals, 1995 - 2005

$351
$268
$351 $347
$403
$309
$400
$454
$616
$706
$370
$0
$100
$200
$300
$400
$500
$600
$700
$800
1995 1996 1997 1998 1999 2000 2001 2002 2003 2004 2005
Source: MDH, Health Care Cost Information System
Net Income of Minnesota Hospitals, 1995 to 2005
Mill
ion
s o
f d
olla
rs
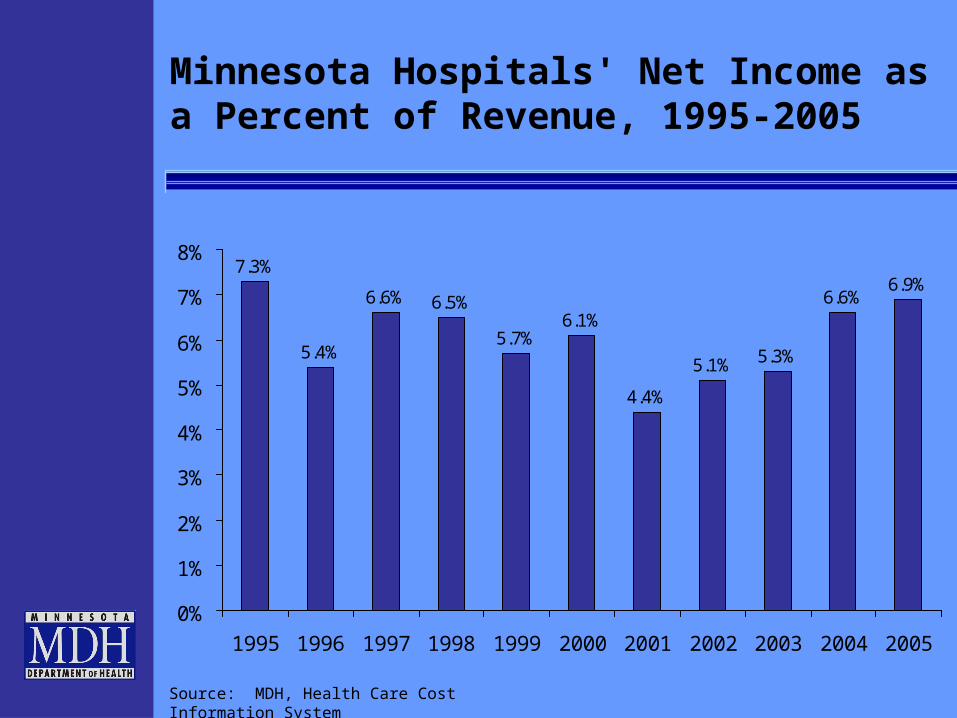
Minnesota Hospitals' Net Income as a Percent of Revenue, 1995-2005
7.3%
5.4%
6.6% 6.5%
5.7%6.1%
4.4%
5.1% 5.3%
6.6%6.9%
0%
1%
2%
3%
4%
5%
6%
7%
8%
1995 1996 1997 1998 1999 2000 2001 2002 2003 2004 2005
Source: MDH, Health Care Cost Information System
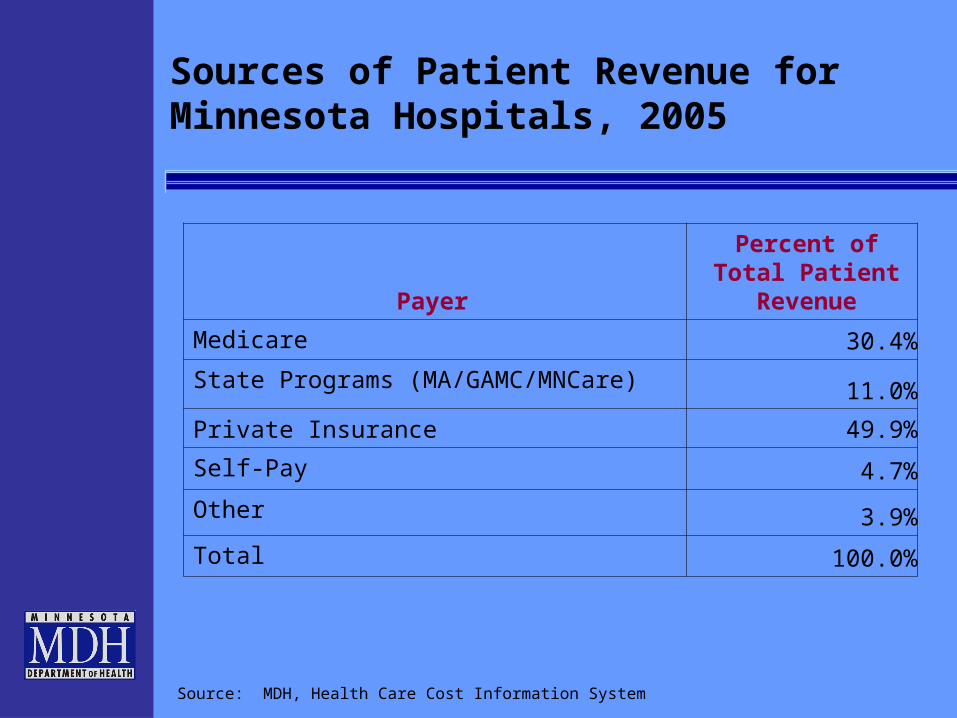
Source: MDH, Health Care Cost Information System
Payer Percent of Total Patient Revenue
Medicare 30.4%
State Programs (MA/GAMC/MNCare) 11.0%
Private Insurance 49.9%
Self-Pay 4.7%
Other 3.9%
Total 100.0%
Sources of Patient Revenue for Minnesota Hospitals, 2005

Uncompensated Care Costs in Minnesota Hospitals, 1996 to 2005
$81 $82$98 $106
$123 $124 $125 $129
$151
$191
$0
$50
$100
$150
$200
$250
1996 1997 1998 1999 2000 2001 2002 2003 2004 2005
$ M
illio
ns
*Uncompensated care figures are adjusted by a cost to charge ratio.Source: MDH, Health Care Cost Information System.
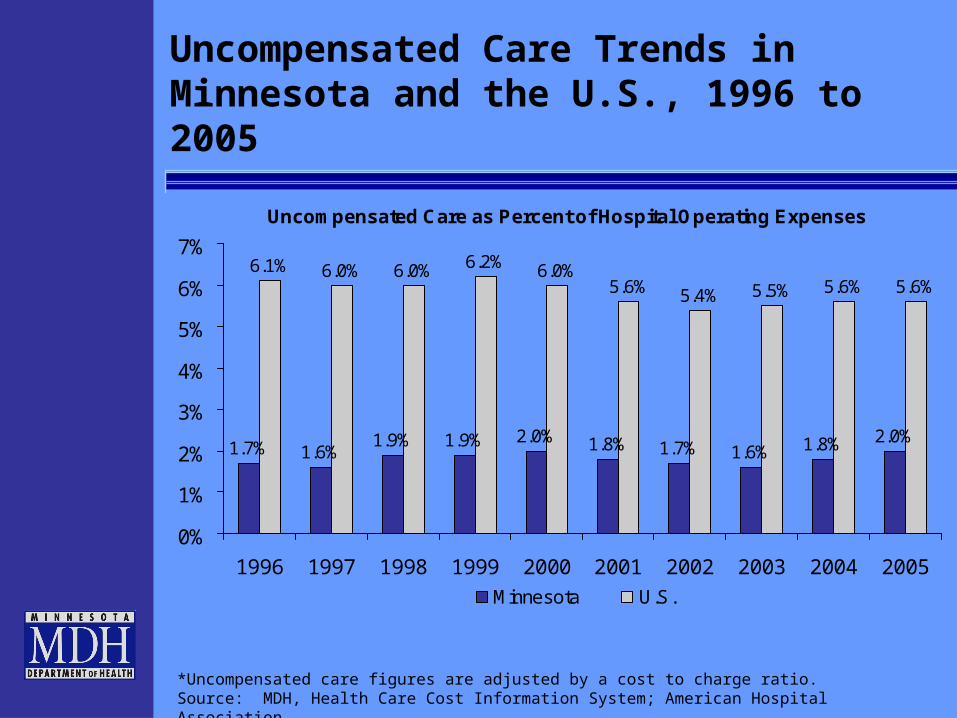
Uncompensated Care Trends in Minnesota and the U.S., 1996 to 2005
Uncompensated Care as Percent of Hospital Operating Expenses
1.7% 1.6%1.9% 1.9% 2.0% 1.8% 1.7% 1.6% 1.8% 2.0%
6.1% 6.0% 6.0% 6.2% 6.0%5.6% 5.4% 5.5% 5.6% 5.6%
0%
1%
2%
3%
4%
5%
6%
7%
1996 1997 1998 1999 2000 2001 2002 2003 2004 2005
Minnesota U.S.
*Uncompensated care figures are adjusted by a cost to charge ratio.Source: MDH, Health Care Cost Information System; American Hospital Association

Uncompensated Care Trends for Rural and Urban Minnesota Hospitals, 1996 to 2005
Uncompensated Care as Percent of Hospital Operating Expenses
1.3% 1.3%
1.5% 1.5%
1.8% 1.8%
1.6% 1.6%1.7%
1.9%1.8%
1.7%
1.9% 1.9%2.0%
1.8%1.7%
1.6%
1.8%
2.0%
0.0%
0.5%
1.0%
1.5%
2.0%
2.5%
1996 1997 1998 1999 2000 2001 2002 2003 2004 2005
Rural Urban
*Uncompensated care figures are adjusted by a cost to charge ratio.Source: MDH, Health Care Cost Information System.

Minnesota’s Largest Providers of Hospital Uncompensated Care, 2005
Uncompensated Care as Percent of Hospital Operating Expenses
7.5%
3.4%
1.3% 1.5%1.8%
1.0%
2.6%
1.7% 1.6%1.3%
1.7%
0%
1%
2%
3%
4%
5%
6%
7%
8%
HennepinCountyMedicalCenter
RegionsHospital
Fairview-UniversityMedicalCenter
Saint MarysHospital
NorthMemorialMedicalCenter
AbbottNorthwestern
Hospital
Saint MarysMedicalCenter
UnitedHospital
St. CloudHospital
MethodistHospital Park
NicolletHealth
Services
OtherHospitals
(126Hospitals)
*Uncompensated care figures are adjusted by a cost to charge ratio.
Source: MDH, Health Care Cost Information System.
2.0%, statewide average

Source: MDH, Health Care Cost Information System
Services Available Services Not available
Surgery
Inpatient Surgery 128 8
Outpatient Surgery 134 2
Open-Heart Surgery Services 18 118
Organ Transplant Services 6 130
Mental Health/Chemical Dependency Services
Outpatient Psychiatric Services 56 80
Detoxification Services 25 111
Diagnostic Radiology
Computer Tomography (CT) Scanning Services 131 5
Magnetic Resonance Imaging (MRI) Services 128 8
Positron Emission Tomography (PET) Services 13 123
Single Photon Emission Computerized Tomography
(SPECT) Services
29 107
Other Services
Renal Dialysis Services 41 95
Cardiac Catheterization Services 23 113
Number of Hospitals
Services Available in Minnesota Hospitals, 2005

Physician Services

Source: MDH, Office of Rural Health & Primary Care
Number of Physicians: 12,799
Primary Care Physicians 6,125
Specialty Physicians 6,674
Physicians per 100,000 Population: 249
Primary Care Physicians 119
Specialty Physicians 130
Estimated Number of Physicians Practicing in Minnesota, 2005
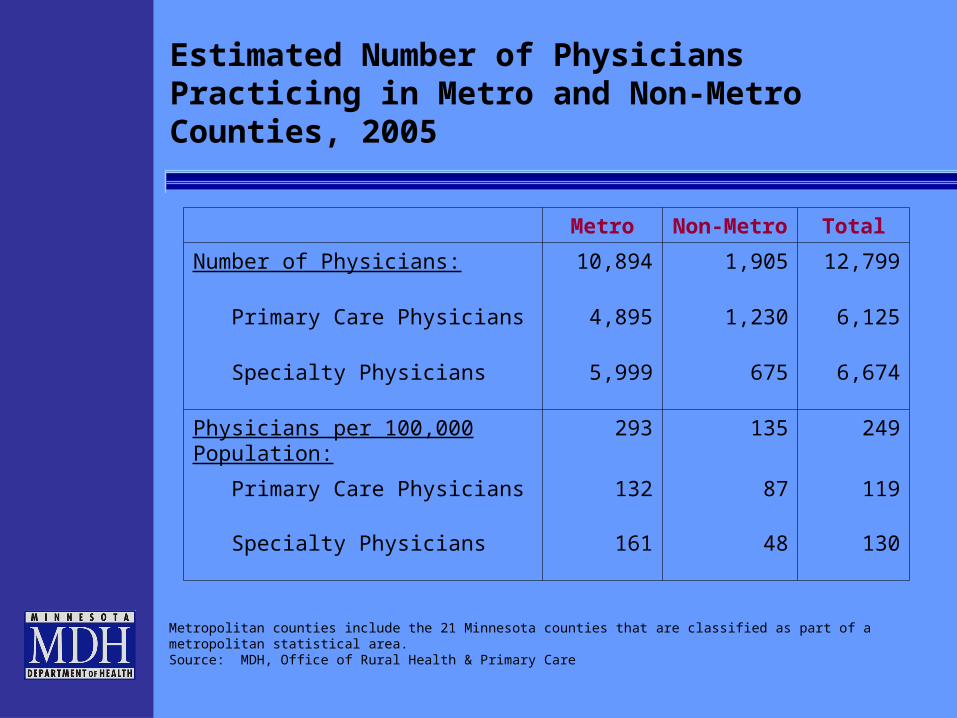
Metropolitan counties include the 21 Minnesota counties that are classified as part of a metropolitan statistical area. Source: MDH, Office of Rural Health & Primary Care
Metro Non-Metro Total
Number of Physicians: 10,894 1,905 12,799
Primary Care Physicians 4,895 1,230 6,125
Specialty Physicians 5,999 675 6,674
Physicians per 100,000 Population: 293 135 249
Primary Care Physicians 132 87 119
Specialty Physicians 161 48 130
Estimated Number of Physicians Practicing in Metro and Non-Metro Counties, 2005