KEY DATA FOR ONLINE SCANDINAVIAN MARKETS e-Business Issue … · · 2014-04-07KEY DATA FOR ONLINE...
14
eMarket Services makes it easier to use eMarkets for international business KEY DATA FOR ONLINE SCANDINAVIAN MARKETS e-Business Issue By Noelia Martínez Head of WEB Internationalisation at BITMarketing (www.bitmarketing.es) www.emarketservices.es April 2014
Transcript of KEY DATA FOR ONLINE SCANDINAVIAN MARKETS e-Business Issue … · · 2014-04-07KEY DATA FOR ONLINE...

eMarket Services makes it easier to use eMarkets
for international business
KEY DATA FOR ONLINE SCANDINAVIAN
MARKETS
e-Business
Issue
By Noelia Martínez
Head of WEB Internationalisation at
BITMarketing (www.bitmarketing.es)
www.emarketservices.es
April 2014

April 2014
Page 2 of 1 4 www.emarketservices.es
Summary
Scandinavian countries lead the world in the area of social rights, employment levels and economic and structural advances. They have demanding consumers, experienced buyers in search of exclusiveness, making this a promising terrain for export both in physical terms and via e-commerce.
In this article Noelia Martínez, head of Internationalisation and Sales at BITmarketing looks at the breakdown of the figures for Sweden, Norway, Denmark and Finland and identifies the sectors with the highest number of imports, as well as offering data on online purchases, number of consumers and the most commonly demanded products in e-commerce in these four countries.
Denmark, Finland, Norway and Sweden have a combined population of over 23 million people; their languages stem from the same origins and to a certain degree they have a shared history and culture. They are great consumers, accustomed to a comfortable standard of living and with a high rate of consumption, who demand products with top quality production and finishing.
They are at the top of list of countries whose population shows widespread acceptance of online shopping, and in the average cost of their shopping basket.
But let's take a closer look at each of these four countries to identify their strong points and analyse their physical and online markets, regarded as being such fertile ground for exports.
Denmark Norway Finland Sweden
Online shoppers 3.86 mill. 3.3 mill. 3.18 mill. 6.68 mill.
Internet penetration1 92% 93 % 87 % 92%
Average expenditure 2013 1.914 € 2.100 € 1.930 € 1. 084 €
Total online sales 7.4 bill. 6.2 bill. 6.1 bill. 7.2 bill.
% online purchases 36% 34% 25% 34%
% offline purchases 64% 66% 75% 66%
Compiled by the author with data from Europe B2C Ecommerce Report 2013 – Ecommerce-Europe.eu
Denmark, a major importer
An analysis of the latest statistics shows that Denmark, with a population of 5 million, is fifth in the world in per capita GDP (nominal) according to data from Eurostat 2012. It imports
1 Eurostat.eu
April 2014
Page 3 of 1 4 www.emarketservices.es
particularly machinery and equipment, raw material and semi-manufactures for industry, chemical products, grains and food products, consumer goods, cereals, alcoholic beverages, cattle feed, dairy products, organic chemicals, furniture and furs. These are precisely some of the sectors in which Spain exports most worldwide.
There is one point worth noting with regard to the Danish market, namely that it has the competences for foreign affairs, security and financial policy for Greenland, an importer of agri-food products from the French market particularly. Greenland's foreign trade is notable for its large volume of imports and for the low diversity of its exports, as it imports practically all the goods required for subsistence and to sustain its production.
Although Denmark has a positive balance of payments, imports of goods and services rose by 2.5% in 2012, accounting for 50.1% of GDP.
Denmark is a member of the European Union Customs Union. It is also a member of the Asia-Europe Meeting (ASEM) and -as an EU member state- it has multilateral and bilateral agreements with many countries. It has preferential trade agreements with several developing countries, and with countries in eastern Europe and the Mediterranean basin.
Although in practice most countries have some kind of agreement in place, it is nonetheless true that imports of textiles, agricultural products and steel carry certain restrictions in Denmark. Other goods such as metals (gold and silver), ethanol, certain agricultural and textile products, when they come from third countries outside the scope of the EU, require an import licence and/or are subject to quotas.
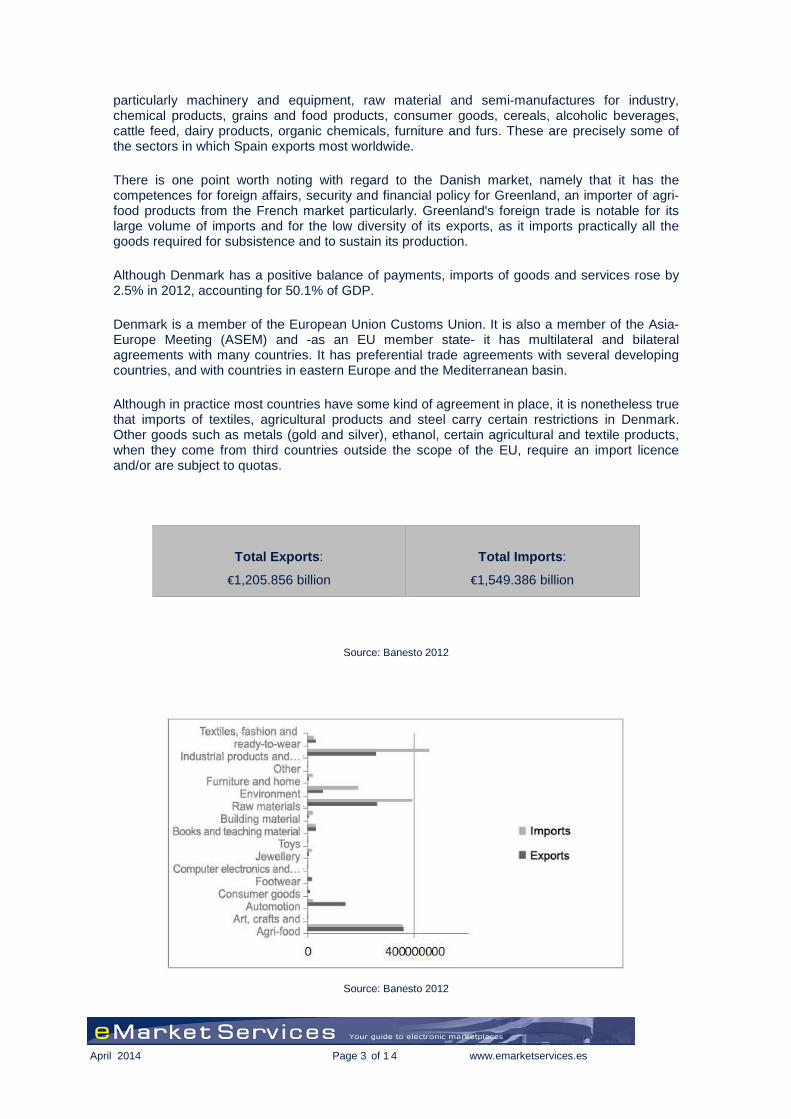
Total Exports:
€1,205.856 billion
Total Imports:
€1,549.386 billion
Source: Banesto 2012
Source: Banesto 2012

April 2014
Page 4 of 1 4 www.emarketservices.es
In the case of online consumer behaviour, the Eurostat report indicates that Denmark now has one the highest percentages –79%– of online shoppers of all EU member states, only surpassed by the United Kingdom (82%).
The figures show that of the 5.6 million people living in Denmark, 5.15 million use Internet and 3.86 million are e-shoppers.
According to the Europe B2C Ecommerce Report 20132 on B2C e-commerce, total sales of goods and services in 2012 was €7.4 billion, representing 3.01% of the country's GDP.
The annual report by Dansk E-Handel Analyse 2013 (Analysis of Danish e-commerce3) reveals that the most frequently purchased items in Danish e-commerce by gender are the following:
Source: Dansk E-Handel Analyse 2013
This reveals that categories of goods with the highest purchases are clothing, particularly in the case of women, multimedia material (films, music etc) with a greater predominance among men, and travel, which is equal for both sexes.
In fact Denmark ranks second among countries making holiday and accommodation reservations over the Internet (56%), far exceeding the European Union average (32%) according to estimates from Foreningen for Dansk Internet Handel (FDIH)4.
2 https://www.ecommerce-europe.eu/website/facts-figures/light-version/download 3 http://www.fdih.dk/analyser/dansk-e-handelsanalyse-forbruger/2013/ 4 http://www.fdih.dk/analyser/dansk-e-handelsanalyse-forbruger/2013/

April 2014
Page 5 of 1 4 www.emarketservices.es
Also according to the report by Dansk E-Handel Analyse 2013, retail sales accounted for 62% of all online sales made in Denmark in 2012. The beneficiaries of this trend are brands such as the Danish group Bestseller which has gained in popularity in recent years, in addition to discount shops which capture a large clientele and offer a wide range of products.
Manufacturers offer more user-friendly sites with reliable payment systems and more flexible deliveries; as an example we could cite the fact that 36% of Danes buy their Christmas presents online, with toys, shoes and fashion, jewellery and cosmetics, and digital entertainment coming top of the list.
Norway, the little big market
Norway continues to have the typical structure of a highly developed country in which 60% of the workforce is employed in the tertiary sector. Its imports rose by 2.4% in 2012, representing 27.5% of GDP, according to data from Banesto for 2012. Heading the list of products are industrial machinery, vehicles, electrical material, metals and food products, and their main suppliers are Sweden, Germany and China.
The highest volumes of imports of Spanish products are specifically maritime navigation products, electrical material, food and beverages.
Exports of agricultural and transformed products could potentially pose greater difficulties in Norway due to tariffs, schedules and other barriers. Another point is that wine is a highly regulated product, controlled by the state monopoly Vonmonopolet.
Norwegian tax legislation is harmonised with the EU in order to guarantee health safeguards and information for consumers. But the export of certain textile articles, alcoholic beverages, pharmaceutical products, fishing nets, raw materials for manufacturing nets, tobacco, weapons, ammunition, live animals, animal products, fruit, vegetables and other plants requires additional documentation apart from the commercial invoice. Customs tariffs are shown at this link: http://madb.europa.eu/madb/indexPubli.htm" http://madb.europa.eu/madb/indexPubli.htm
Total Exports:
€950.399 billion
Total Imports:
€1,796.093 billion
Source: Banesto 2012

April 2014
Page 6 of 1 4 www.emarketservices.es
Thousands of euros. Source: Banesto 2012
Norway can be considered as a small country that offers major opportunities for e-commerce: with 4.7 million Internet users, it ranked tenth in the world in e-commerce sales by country in 2012 according to eCommerce Europe, and spends more time per capita connected to Internet than any other country.
Of the 5.05 million people living in Norway, 4.7 million use Internet and 3.3 million are e-shoppers. E-commerce sales amounted to €6.9 billion in 2012.
The average expenditure on online purchases in 2012 was €2,100, divided equally between products –50%– and services –50%. Top products were electronics, footwear and fashion.
The Norwegians have no hesitation in making purchases on foreign websites. One out of two Norwegians shops on foreign websites at least once a year and 13% even do so at least once a month.
Sector Export Import
Agri-food 183.893 97895
Art, crafts and antiques 56 8
Automotion 62803 8506
Consumer goods 2898 1272
Footwear 8425 53
Electronics, computers and telecommunications 716 576
Jewelery 2133 14
Toys 3253 94
Books and teaching material 2133 14
Building material 3253 94
Raw materials - semi-manufactures 117579 342776
Environment 101092 1242833
Other 17187 3608

April 2014
Page 7 of 1 4 www.emarketservices.es
In fact in 2002 online sales on foreign websites accounted for €2.07 billion (30%). 50% of these purchases are B2C and the preferred countries are the United States, followed by the United Kingdom and Switzerland.
Source: “Nordic e-commerce 2013” TNS Gallup
Finland, the importer of raw materials
Finland, with most of its population clustered in the southern section of the country and enjoying one of the European Union's most prosperous economies –based on the service and manufacturing sectors–, has historically been an importer of capital to finance its industrial growth.
It depends for its supplies on imports of energy, raw materials, spare parts for manufactured products, pigments, machinery, dairy products and plastic manufactured goods.
The current legal framework is the same as for its EU partners. However it applies additional technical and health standards on top of the European minimum, with greater control in the Adhesion Treaty and an aggressive promotion of products manufactured at home through sector associations and supported by symbols on the packaging for easy identification.
As in the other countries, its customs procedures comply with the EU's Common External Tariff.
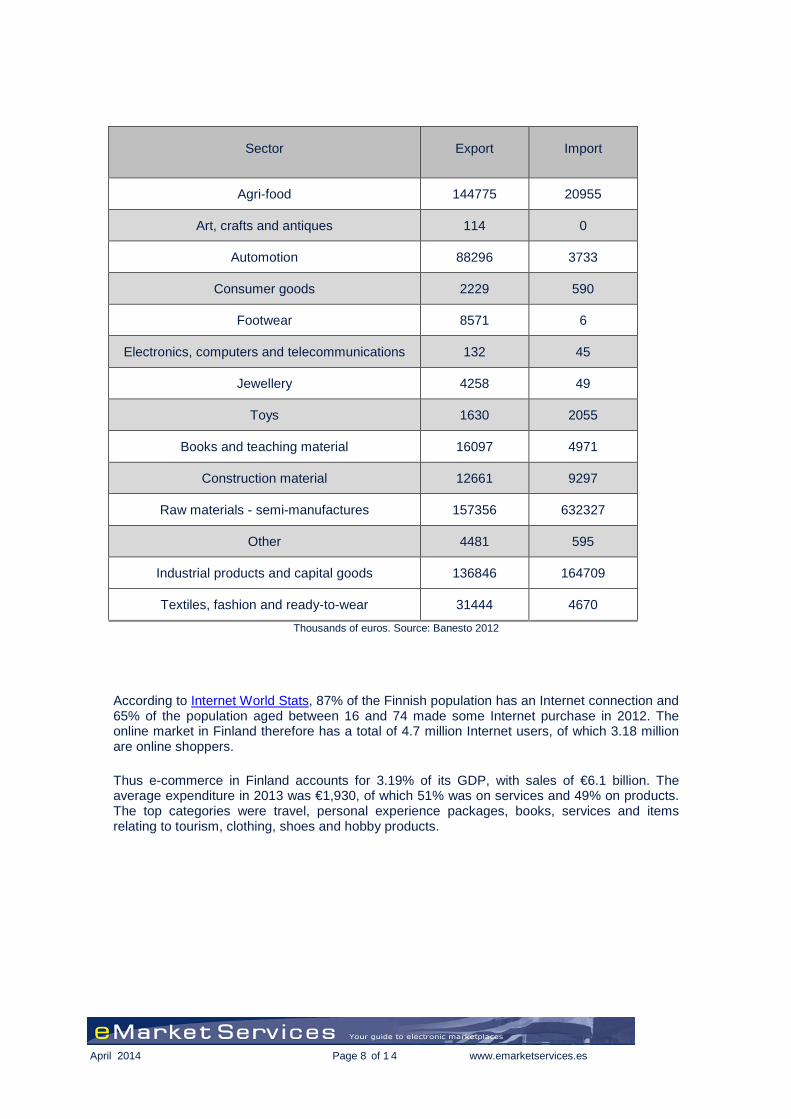
Total Exports:
€611.825 billion
Total Imports:
€845.266 billion
Source: Banesto 2012
April 2014
Page 8 of 1 4 www.emarketservices.es
Thousands of euros. Source: Banesto 2012
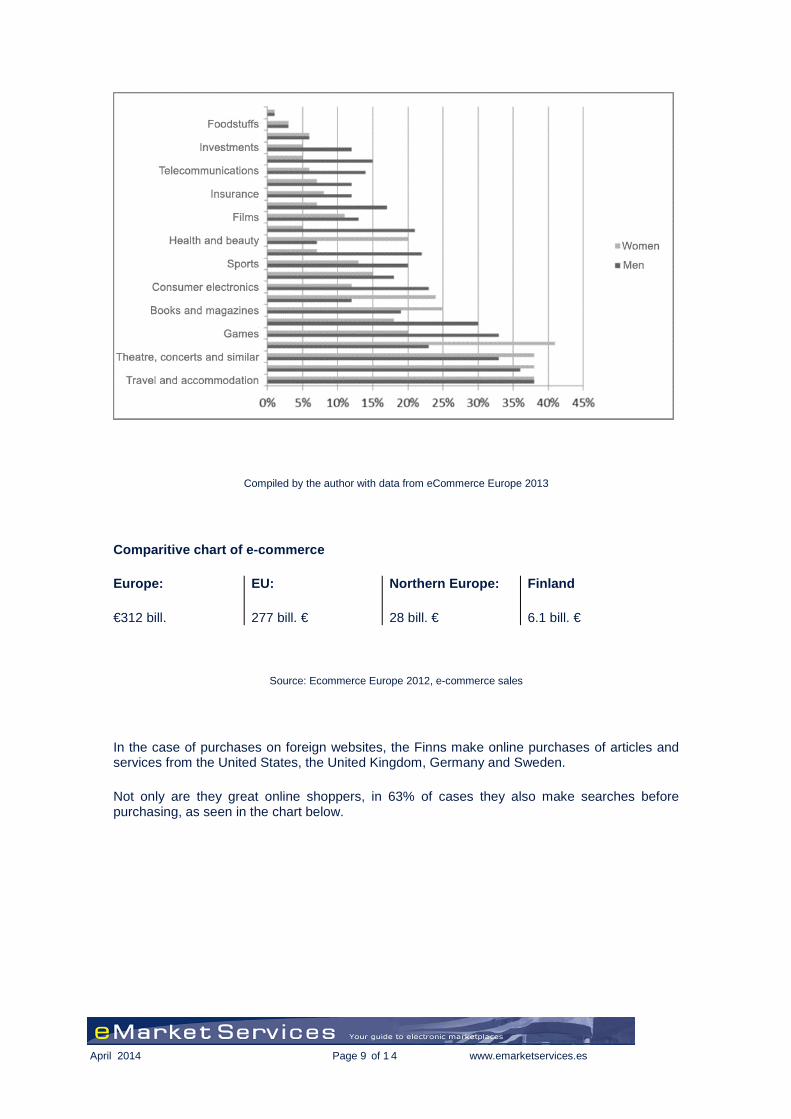
According to Internet World Stats, 87% of the Finnish population has an Internet connection and 65% of the population aged between 16 and 74 made some Internet purchase in 2012. The online market in Finland therefore has a total of 4.7 million Internet users, of which 3.18 million are online shoppers.
Thus e-commerce in Finland accounts for 3.19% of its GDP, with sales of €6.1 billion. The average expenditure in 2013 was €1,930, of which 51% was on services and 49% on products. The top categories were travel, personal experience packages, books, services and items relating to tourism, clothing, shoes and hobby products.
Sector Export Import
Agri-food 144775 20955
Art, crafts and antiques 114 0
Automotion 88296 3733
Consumer goods 2229 590
Footwear 8571 6
Electronics, computers and telecommunications 132 45
Jewellery 4258 49
Toys 1630 2055
Books and teaching material 16097 4971
Construction material 12661 9297
Raw materials - semi-manufactures 157356 632327
Other 4481 595
Industrial products and capital goods 136846 164709
Textiles, fashion and ready-to-wear 31444 4670
April 2014
Page 9 of 1 4 www.emarketservices.es
Compiled by the author with data from eCommerce Europe 2013
Comparitive chart of e-commerce
Europe:
€312 bill.
EU:
277 bill. €
Northern Europe:
28 bill. €
Finland
6.1 bill. €
Source: Ecommerce Europe 2012, e-commerce sales
In the case of purchases on foreign websites, the Finns make online purchases of articles and services from the United States, the United Kingdom, Germany and Sweden.
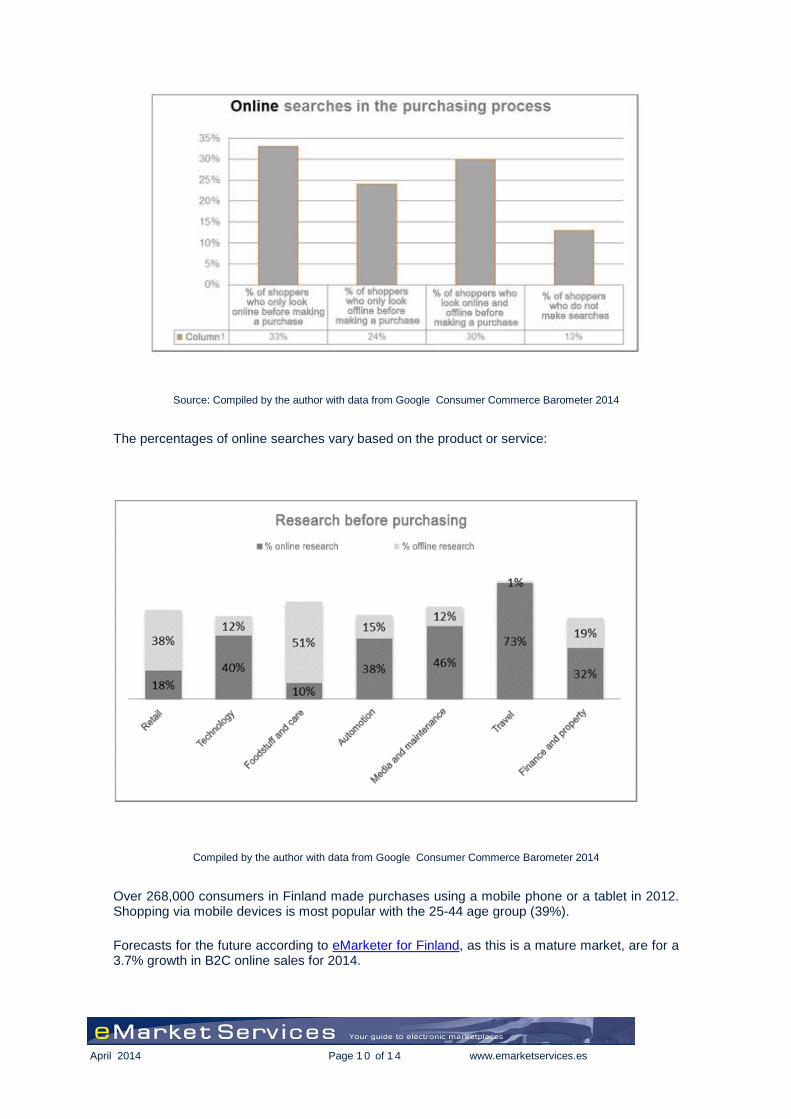
Not only are they great online shoppers, in 63% of cases they also make searches before purchasing, as seen in the chart below.
April 2014
Page 1 0 of 1 4 www.emarketservices.es
Source: Compiled by the author with data from Google Consumer Commerce Barometer 2014
The percentages of online searches vary based on the product or service:
Compiled by the author with data from Google Consumer Commerce Barometer 2014
Over 268,000 consumers in Finland made purchases using a mobile phone or a tablet in 2012. Shopping via mobile devices is most popular with the 25-44 age group (39%).
Forecasts for the future according to eMarketer for Finland, as this is a mature market, are for a 3.7% growth in B2C online sales for 2014.

April 2014
Page 1 1 of 1 4 www.emarketservices.es
Sweden, the highest Internet penetration in homes
This is the eighth largest country in Europe and has almost 10 million inhabitants, of which 93% have Internet access. It is one of the top ten countries in per capita income in the world. Sweden is seen as a liberal, modern and egalitarian country with a well-educated workforce, high purchasing power and loyal to its own brands. Since joining the European Union it has played a more active role in Europe.
The country's most importnat sectors are technology, telecommunications, electronics and robotics. It is an excellent market for manufactured leather, wood and wool products, in addition to organic foods, regional fruits and industrialised vegetables.
Total Exports: €1,873.866 billion
Total Imports: €2,186.804 billion
Source: Banesto 2012
Thousands of euros. Source: Banesto 2012
Sector Export Import
Agri-food 396662 159650
Art, crafts and antiques 293 266
Automotion 203967 208603
Consumer goods 20166 6481
Footwear 19704 6481
Electronics, computers and
telecommunications 6449 361
Jewellery 1969 369
Toys 2459 1637
Books and teaching material 22154 37817
Construction material 26267 2623
Raw materials - semi-manufactures 438173 898492
Industrial products and capital goods 634178 652670
Textiles, fashion and ready-to-wear 69759 14513

April 2014
Page 1 2 of 1 4 www.emarketservices.es
According to the OECD, Sweden is notable for its level of Internet penetration in homes, and is among the countries with most broadband accounts per inhabitant, followed by Australia, Finland and Denmark.
It is tied in second place with Denmark in percentage of online shoppers (79%). This is a market with 8.5 million Internet users, of whom 6.68 million are online shoppers. Online sales amount to €7.2 billion, 1.77% of Swedish GDP.
According to the latest information from the Swedish Association for e-commerce, the first quarter of 2013 saw the greatest leap in percentage since 2007 with a growth of 18%. However it is worth noting that while the Swedes are shopping more online, they are also demanding faster delivery and greater choice.
The average expenditure in 2013 was €1,084, of which 50% was on services and 50% on products. The most popular category in Sweden is consumer electronics, which accounts for 20% of the total online sales, followed by fashion, footwear, shoes and media.
Clothing and footwear was up 12% in the first quarter of 2013 compared to 2012, sports and leisure rose by 32% in the same period, and other sectors such as decoration and furniture saw a jump in sales, up 26% by the end of the first quarter of 2013.
In spite of its maturity, consumer electronics was also up 20% by the end of the same period.
On the point of searches prior to purchasing, 62% used Internet to carry out their research, as seen in the following chart.
Source: Compiled by the author with data from Google Consumer Commerce Barometer 2014
The statistics indicate that Sweden is a progressive online market with a particularly young public. Its persistent online growth and higher rate of mobile penetration makes this country an extremely favourable target for e-commerce. The following chart shows the sectors with the greatest percentage of online purchasing.

April 2014
Page 1 3 of 1 4 www.emarketservices.es
Source: Compiled by the author with data from Google Consumer Commerce Barometer 2014
Scandinavian e-markets
As these are mature online markets, companies also have a substantial internet presence, and are accustomed to operating via e-marketplaces. In addition to the global or European e-marketplaces that operate in their countries, they also have their own online platforms -often exclusively in the local language- in order to deal both with the end consumer and other companies.
According to the eMarket Services directory, there are 23 platforms in Denmark that have a headquarters or branch office in this country, many of them with a global focus. The most numerous are multisector, with 9 platforms, followed by government procurement platforms (5), maritime products and services (4) industrial machinery, second-hand goods and construction, with 3 e-Marketplaces geared to these sectors.
Some local marketplaces are Progrator Gatetrade -now called Evenex-, a procurement platform for the Danish government; or Retrade Surplus Management, for secondhand vehicles and machinery in Nordic countries in general.
Norway has 19 e-marketplaces with a global scope or predominantly for the Scandinavian market, and once again the multisector (8) and public sector (3) marketplaces have the greatest number of platforms. Some of the local e-marketplaces are ehandel.no, a multi-industry in the Norwegian market; Frilansbassen, for contracting professional services, and Nortrade, for import and export services of goods and services in Norway.
April 2014
Page 1 4 of 1 4 www.emarketservices.es
Finland has 12 e-Marketplaces, 5 of them multisector, followed by second-hand goods, industrial machinery and construction tied in second place with two markets each. One local e-marketplace is Crossroad Kvarken, for purchase-sales and procurement between companies and government organisations in Nordic countries.
Sweden is the country with the highest number of platforms, with 33 listed in the eMarket Services directory. In Finland, Norway and Denmark, by category, at the top of the list are multisector (12), followed by second-hand goods, industrial machinery and construction with 6 e-marketplaces each, and then public procurement platforms (4).
Some of the local all e-marketplaces are HästNet, for equestrian products in all the Scandinavian countries; industritorget.se for industrial machinery and tools; Kundkraft from the Swedish electrical sector; and LantBrusk.net and MaskinNet for industrial, forestry and farm vehicles and machinery.
About the author
This article was written by the Head of Internationalisation and Sales at BITmarketing, Noelia Martínez, expert in online marketing. The company BITmarketing is dedicated to helping increase the visibility of websites at the international level by designing positioning strategies focusing both on the country and on the users with whom the interaction will take place.