Key CRO Metrics to Analyze for Successful Landing Pages
29
Key CRO Metrics to Analyze for Successful Landing Pages SAMANTHA KERR
-
Upload
kissmetrics-on-slideshare -
Category
Marketing
-
view
1.089 -
download
0
Transcript of Key CRO Metrics to Analyze for Successful Landing Pages

Key CRO Metrics to Analyze for Successful
Landing Pages SAMANTHA KERR

@Kissmetrics
#KissWebinar
@thuelmadsen

Samantha is a Sr. CRO Manager at Hanapin Marketing, the agency behind PPC Hero. With 2.5 years at Hanapin
Marketing under her belt, Samantha has developed a passion for landing page testing and everything CRO.
SAMANTHA KERR Sr. CRO Manager, Hanapin Marketing
@Samantha__Kerr
Thue is the Kissmetrics Webinar Wizard and Marketing Ops Manager. Before joining forces with Kissmetrics, he was a Lyft driver in SF, which is also how he ended up as a KISSmetrics marketer. Whenever Thue is not trying to automate everything around him, you can find him hiking
in the Sierras.
THUE MADSEN Marketing Operations Manager, Kissmetrics
@ThueLMadsen

@HanapinMarketing
#KissWebinar
@Samantha__Kerr
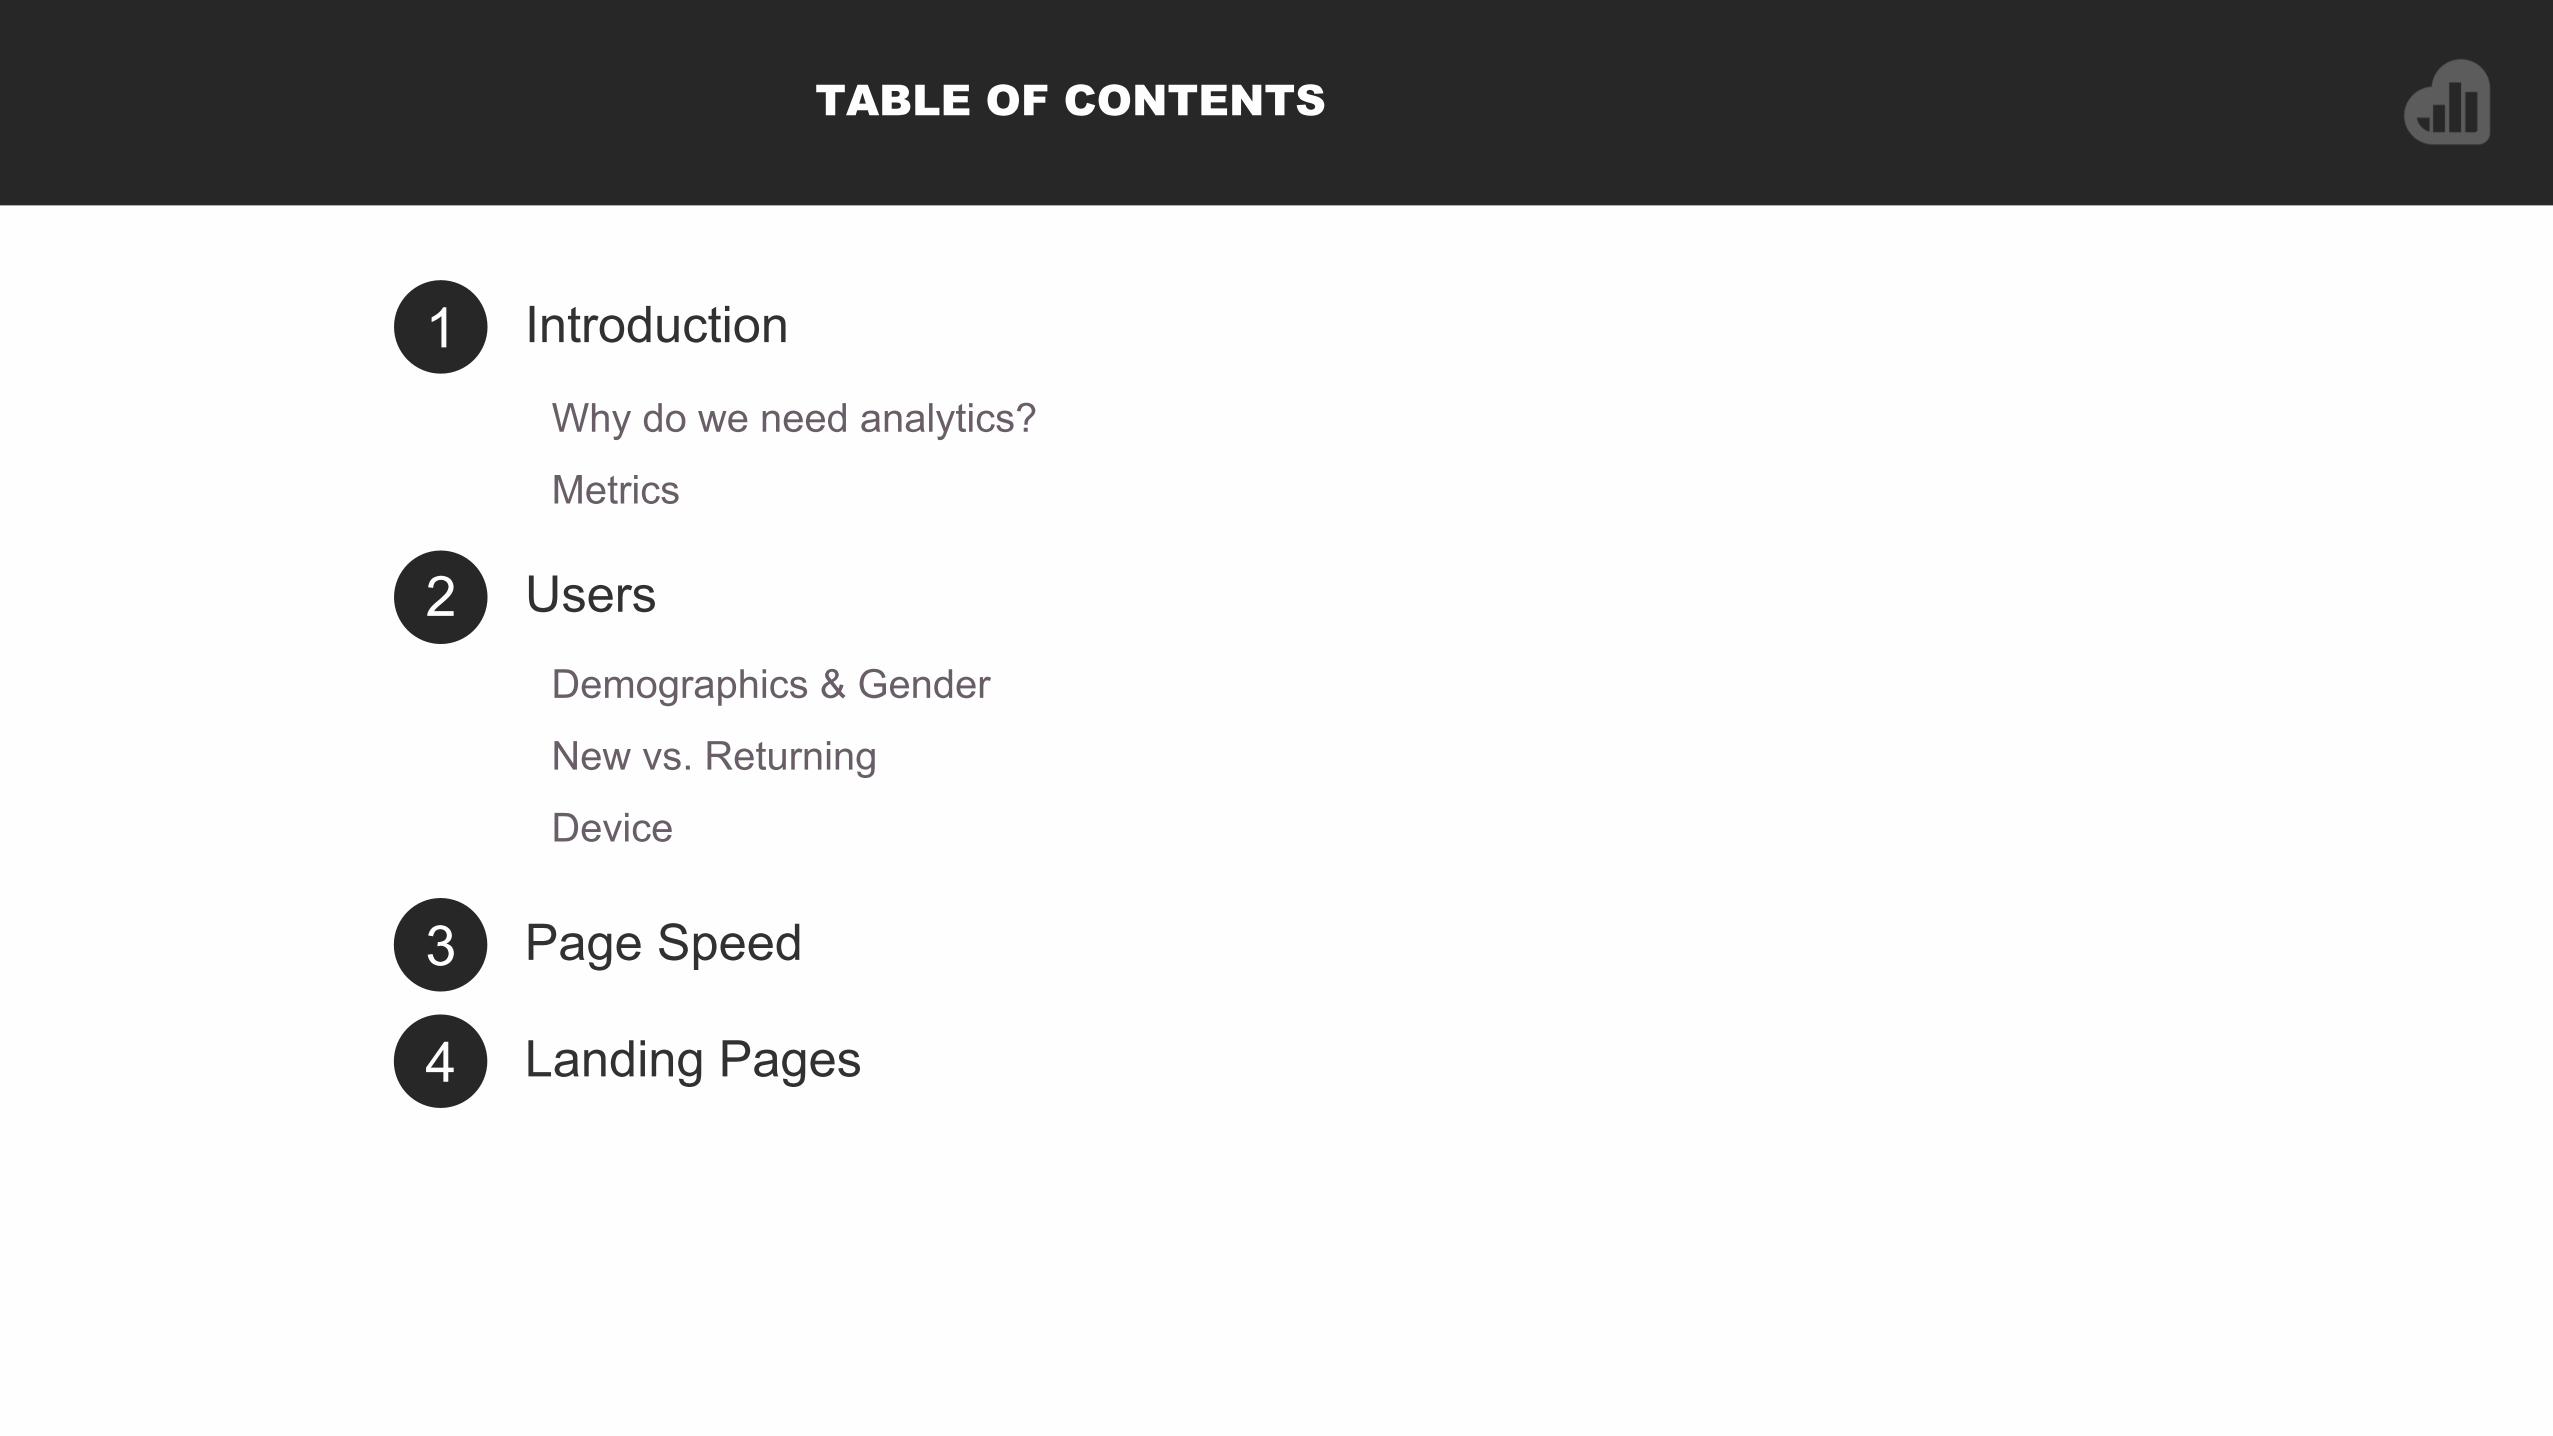
1 Introduction
TABLE OF CONTENTS
Demographics & Gender
New vs. Returning
Device
2 Users
3 Page Speed
4 Landing Pages
Why do we need analytics?
Metrics

WATCH WEBINAR RECORDING NOW

Introduction
WHY SHOULD YOU USE ANALYTICS?
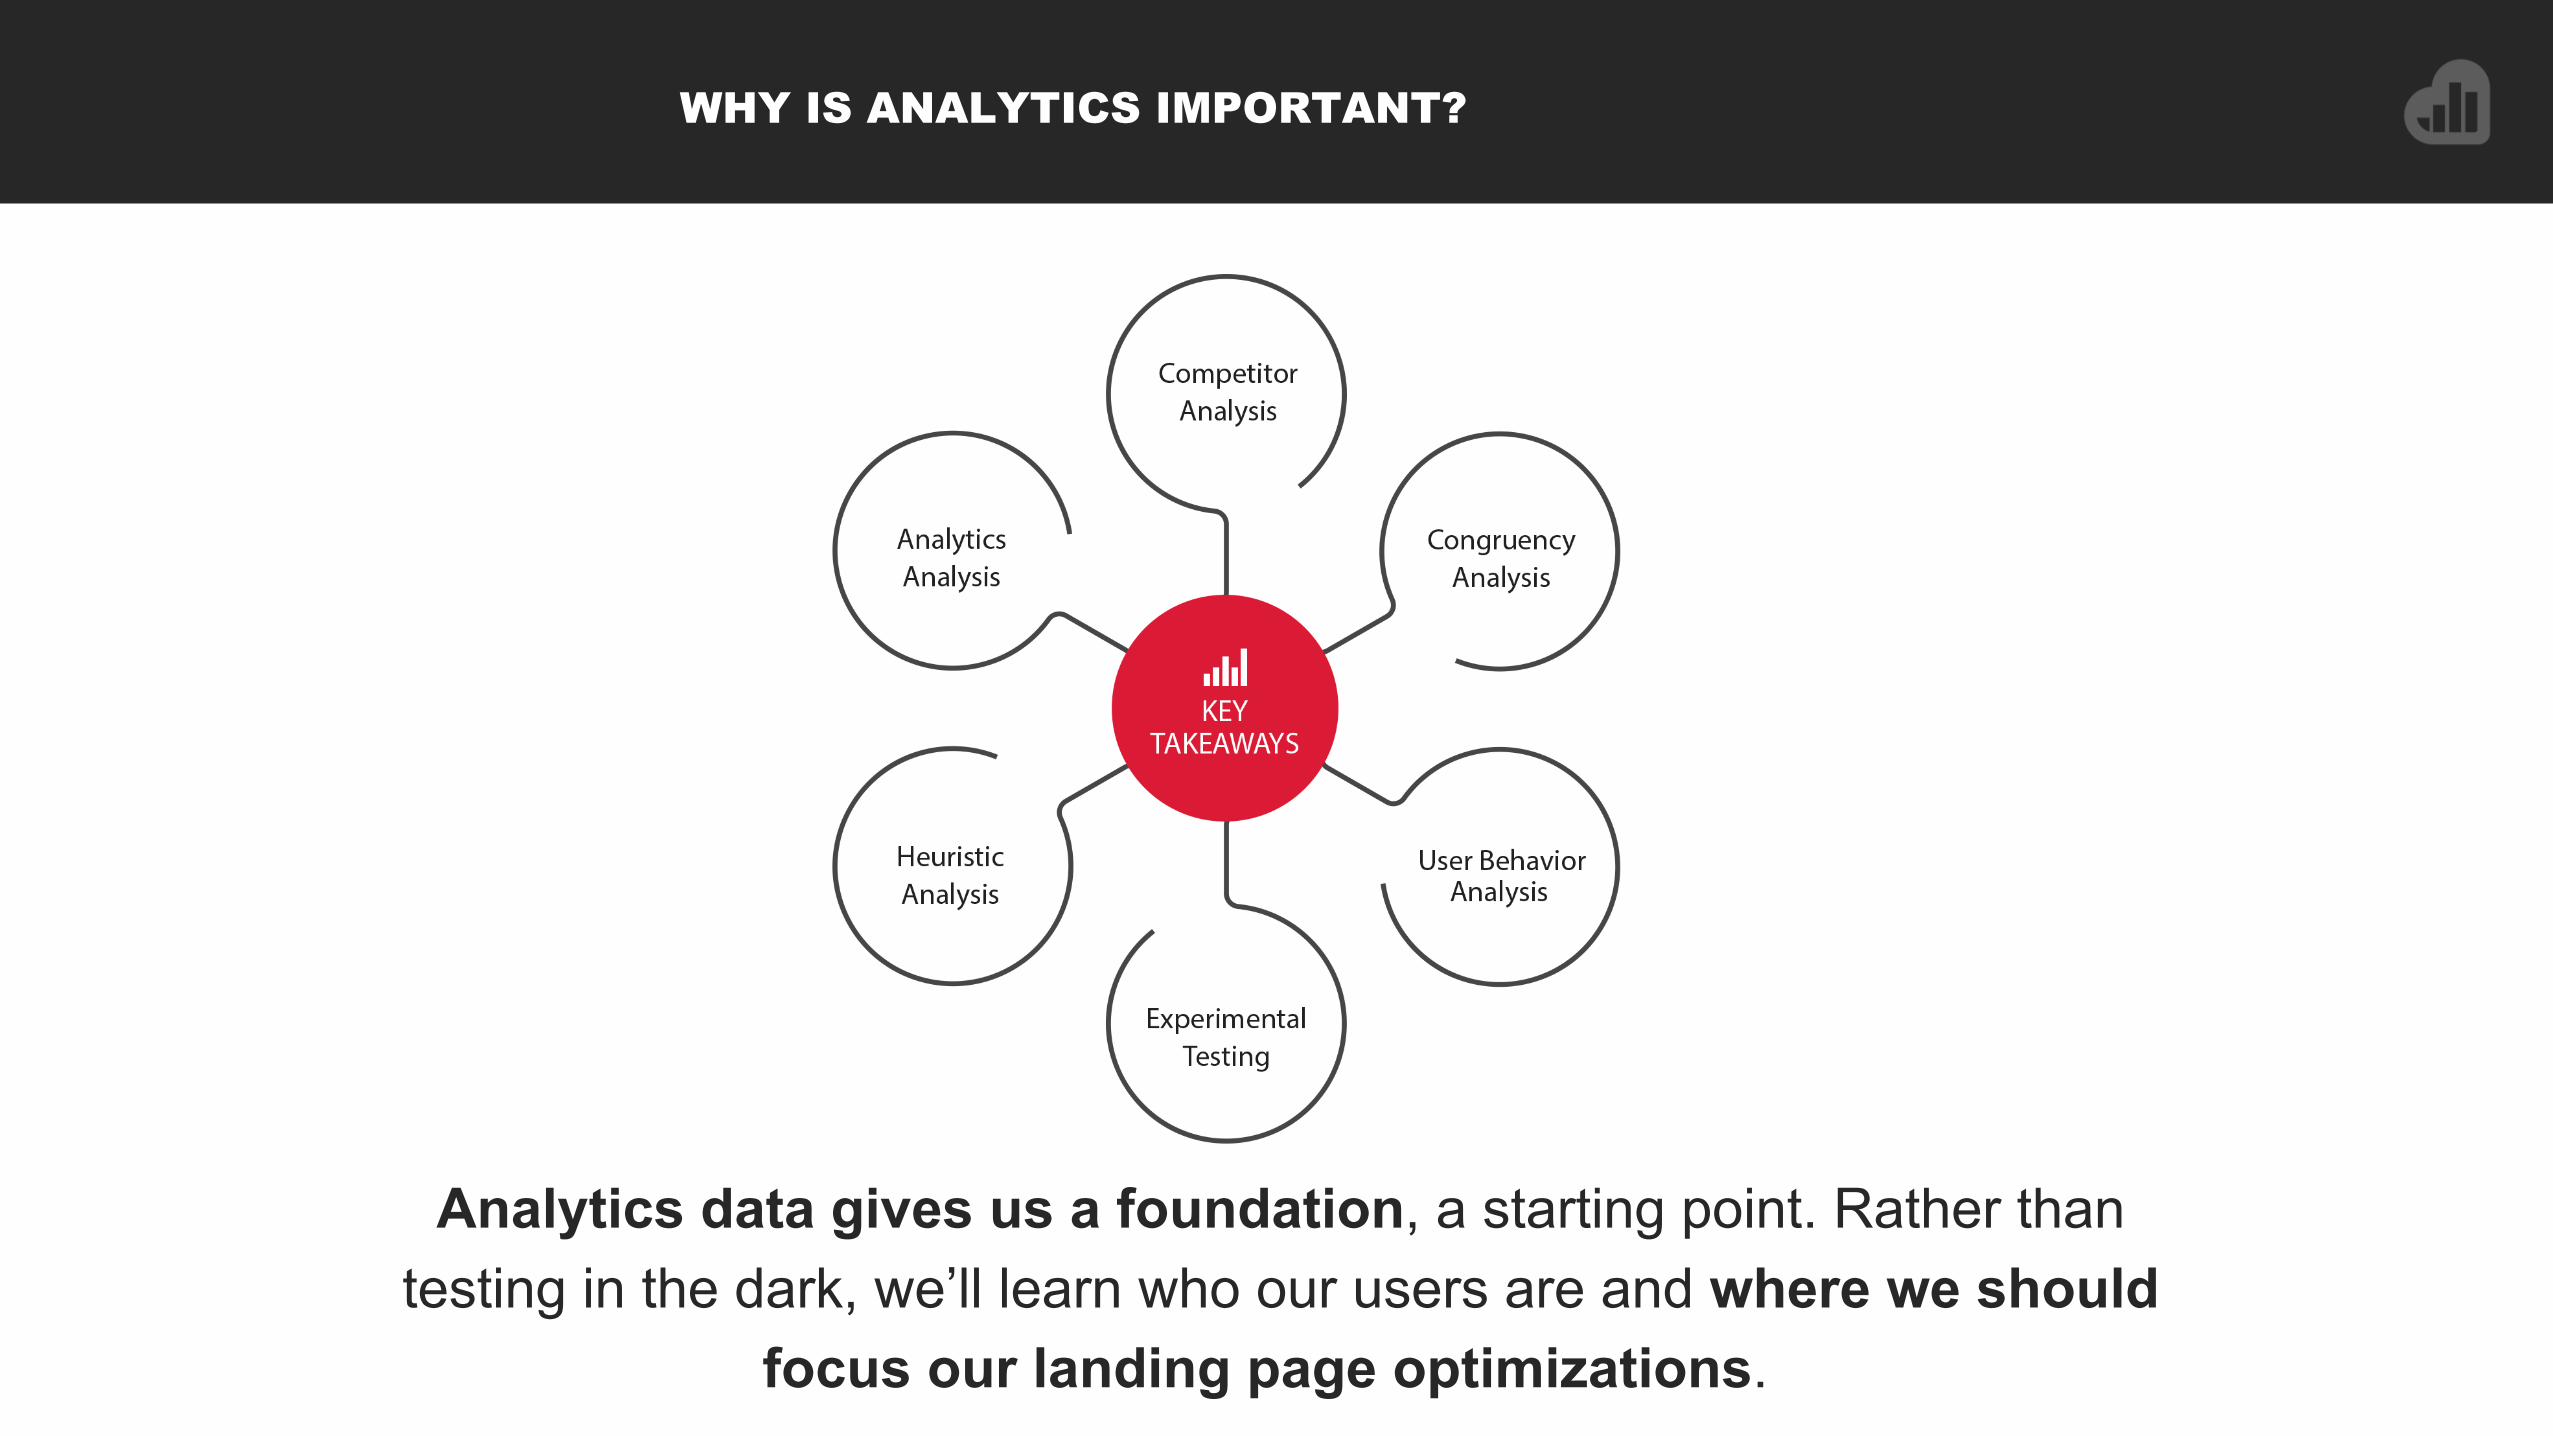
WHY IS ANALYTICS IMPORTANT?
Analytics data gives us a foundation, a starting point. Rather than testing in the dark, we’ll learn who our users are and where we should
focus our landing page optimizations.

METRICS
What metrics do we look at? • Bounce Rate • Exit Rate • Avg. Time on Page • Pages/Session • Session Duration • Conv. Rate
Bounce rate is the percentage of single-page sessions while exit rate is the percentage of all pageviews to the page that were last in the session.
These metrics provide insight into the overall engagement with the site.

Users
WHO SHOULD YOU BE TARGETING WITH YOUR OPTIMIZATIONS?

FIND OUT WHO YOUR AUDIENCE IS
Ensure you’re targeting the appropriate users when creating optimizations. • Do your age and gender demographics align with
what the client sees? • Do your new and returning users have appropriate
levels of engagement with the site? • Is your site mobile friendly and should you create
mobile specific optimizations?
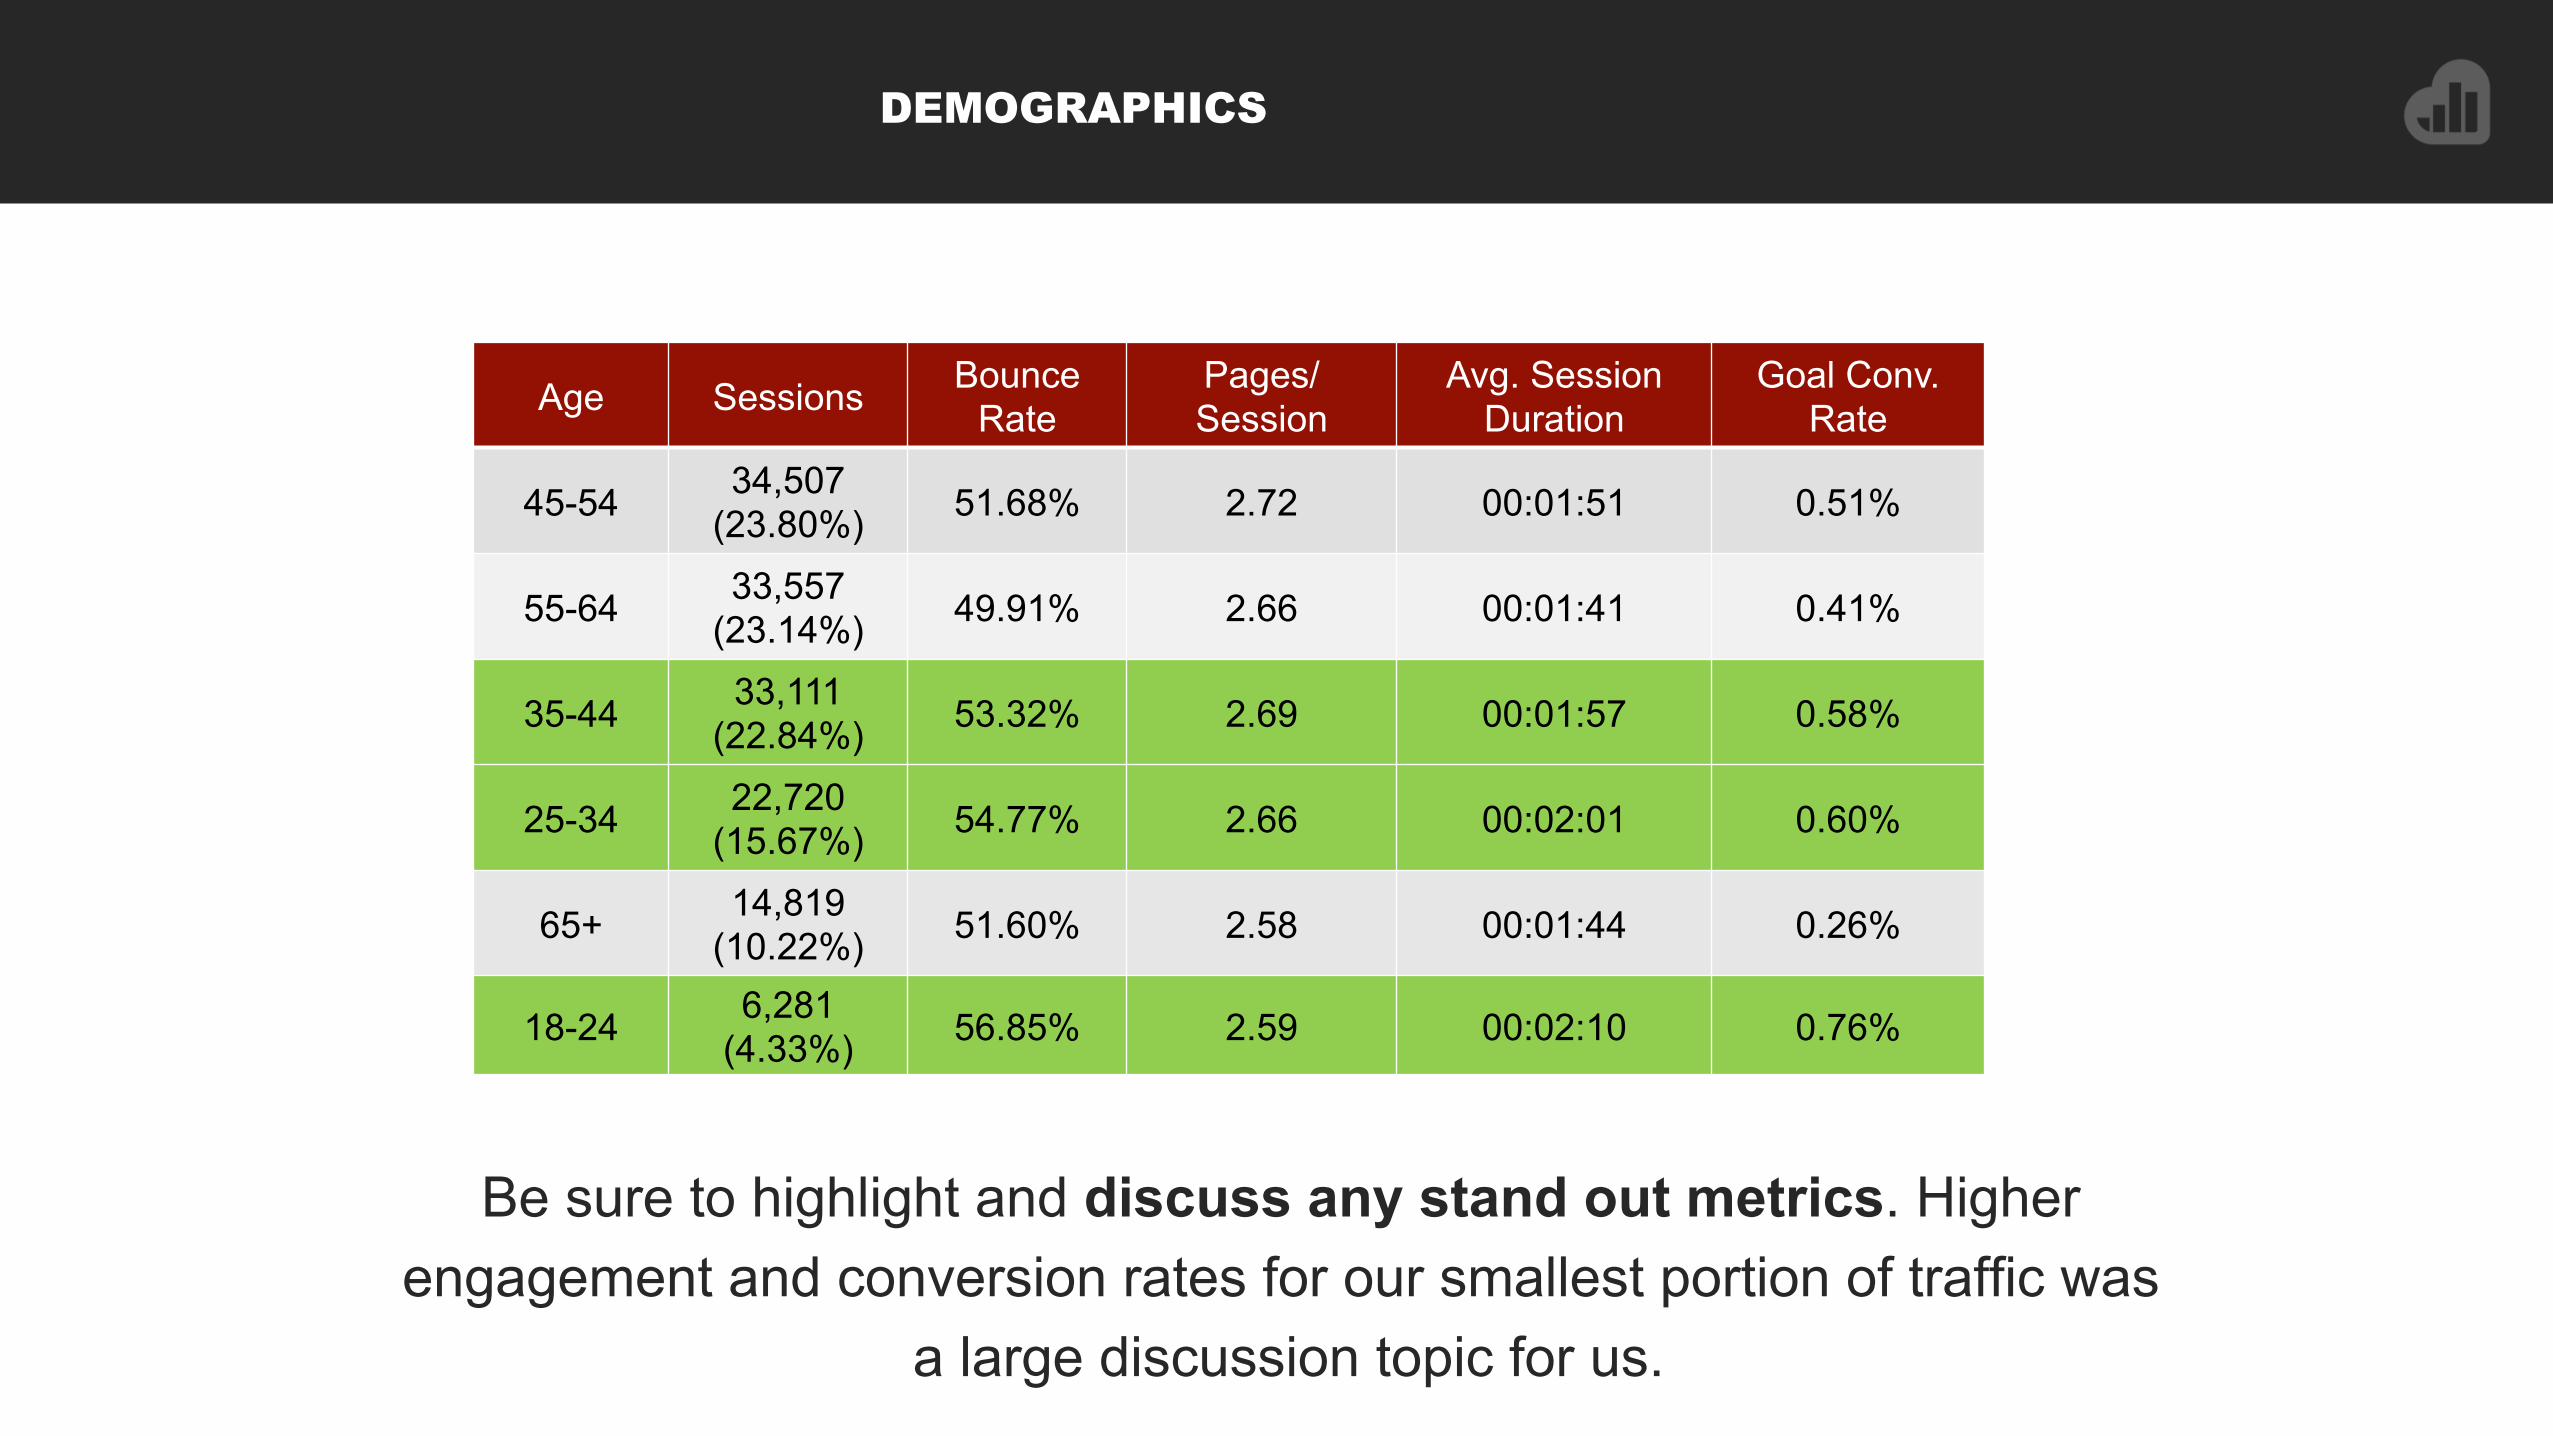
DEMOGRAPHICS
Be sure to highlight and discuss any stand out metrics. Higher engagement and conversion rates for our smallest portion of traffic was
a large discussion topic for us.
Age Sessions Bounce Rate
Pages/ Session
Avg. Session Duration
Goal Conv. Rate
45-54 34,507 (23.80%) 51.68% 2.72 00:01:51 0.51%
55-64 33,557 (23.14%) 49.91% 2.66 00:01:41 0.41%
35-44 33,111 (22.84%) 53.32% 2.69 00:01:57 0.58%
25-34 22,720 (15.67%) 54.77% 2.66 00:02:01 0.60%
65+ 14,819 (10.22%) 51.60% 2.58 00:01:44 0.26%
18-24 6,281 (4.33%) 56.85% 2.59 00:02:10 0.76%
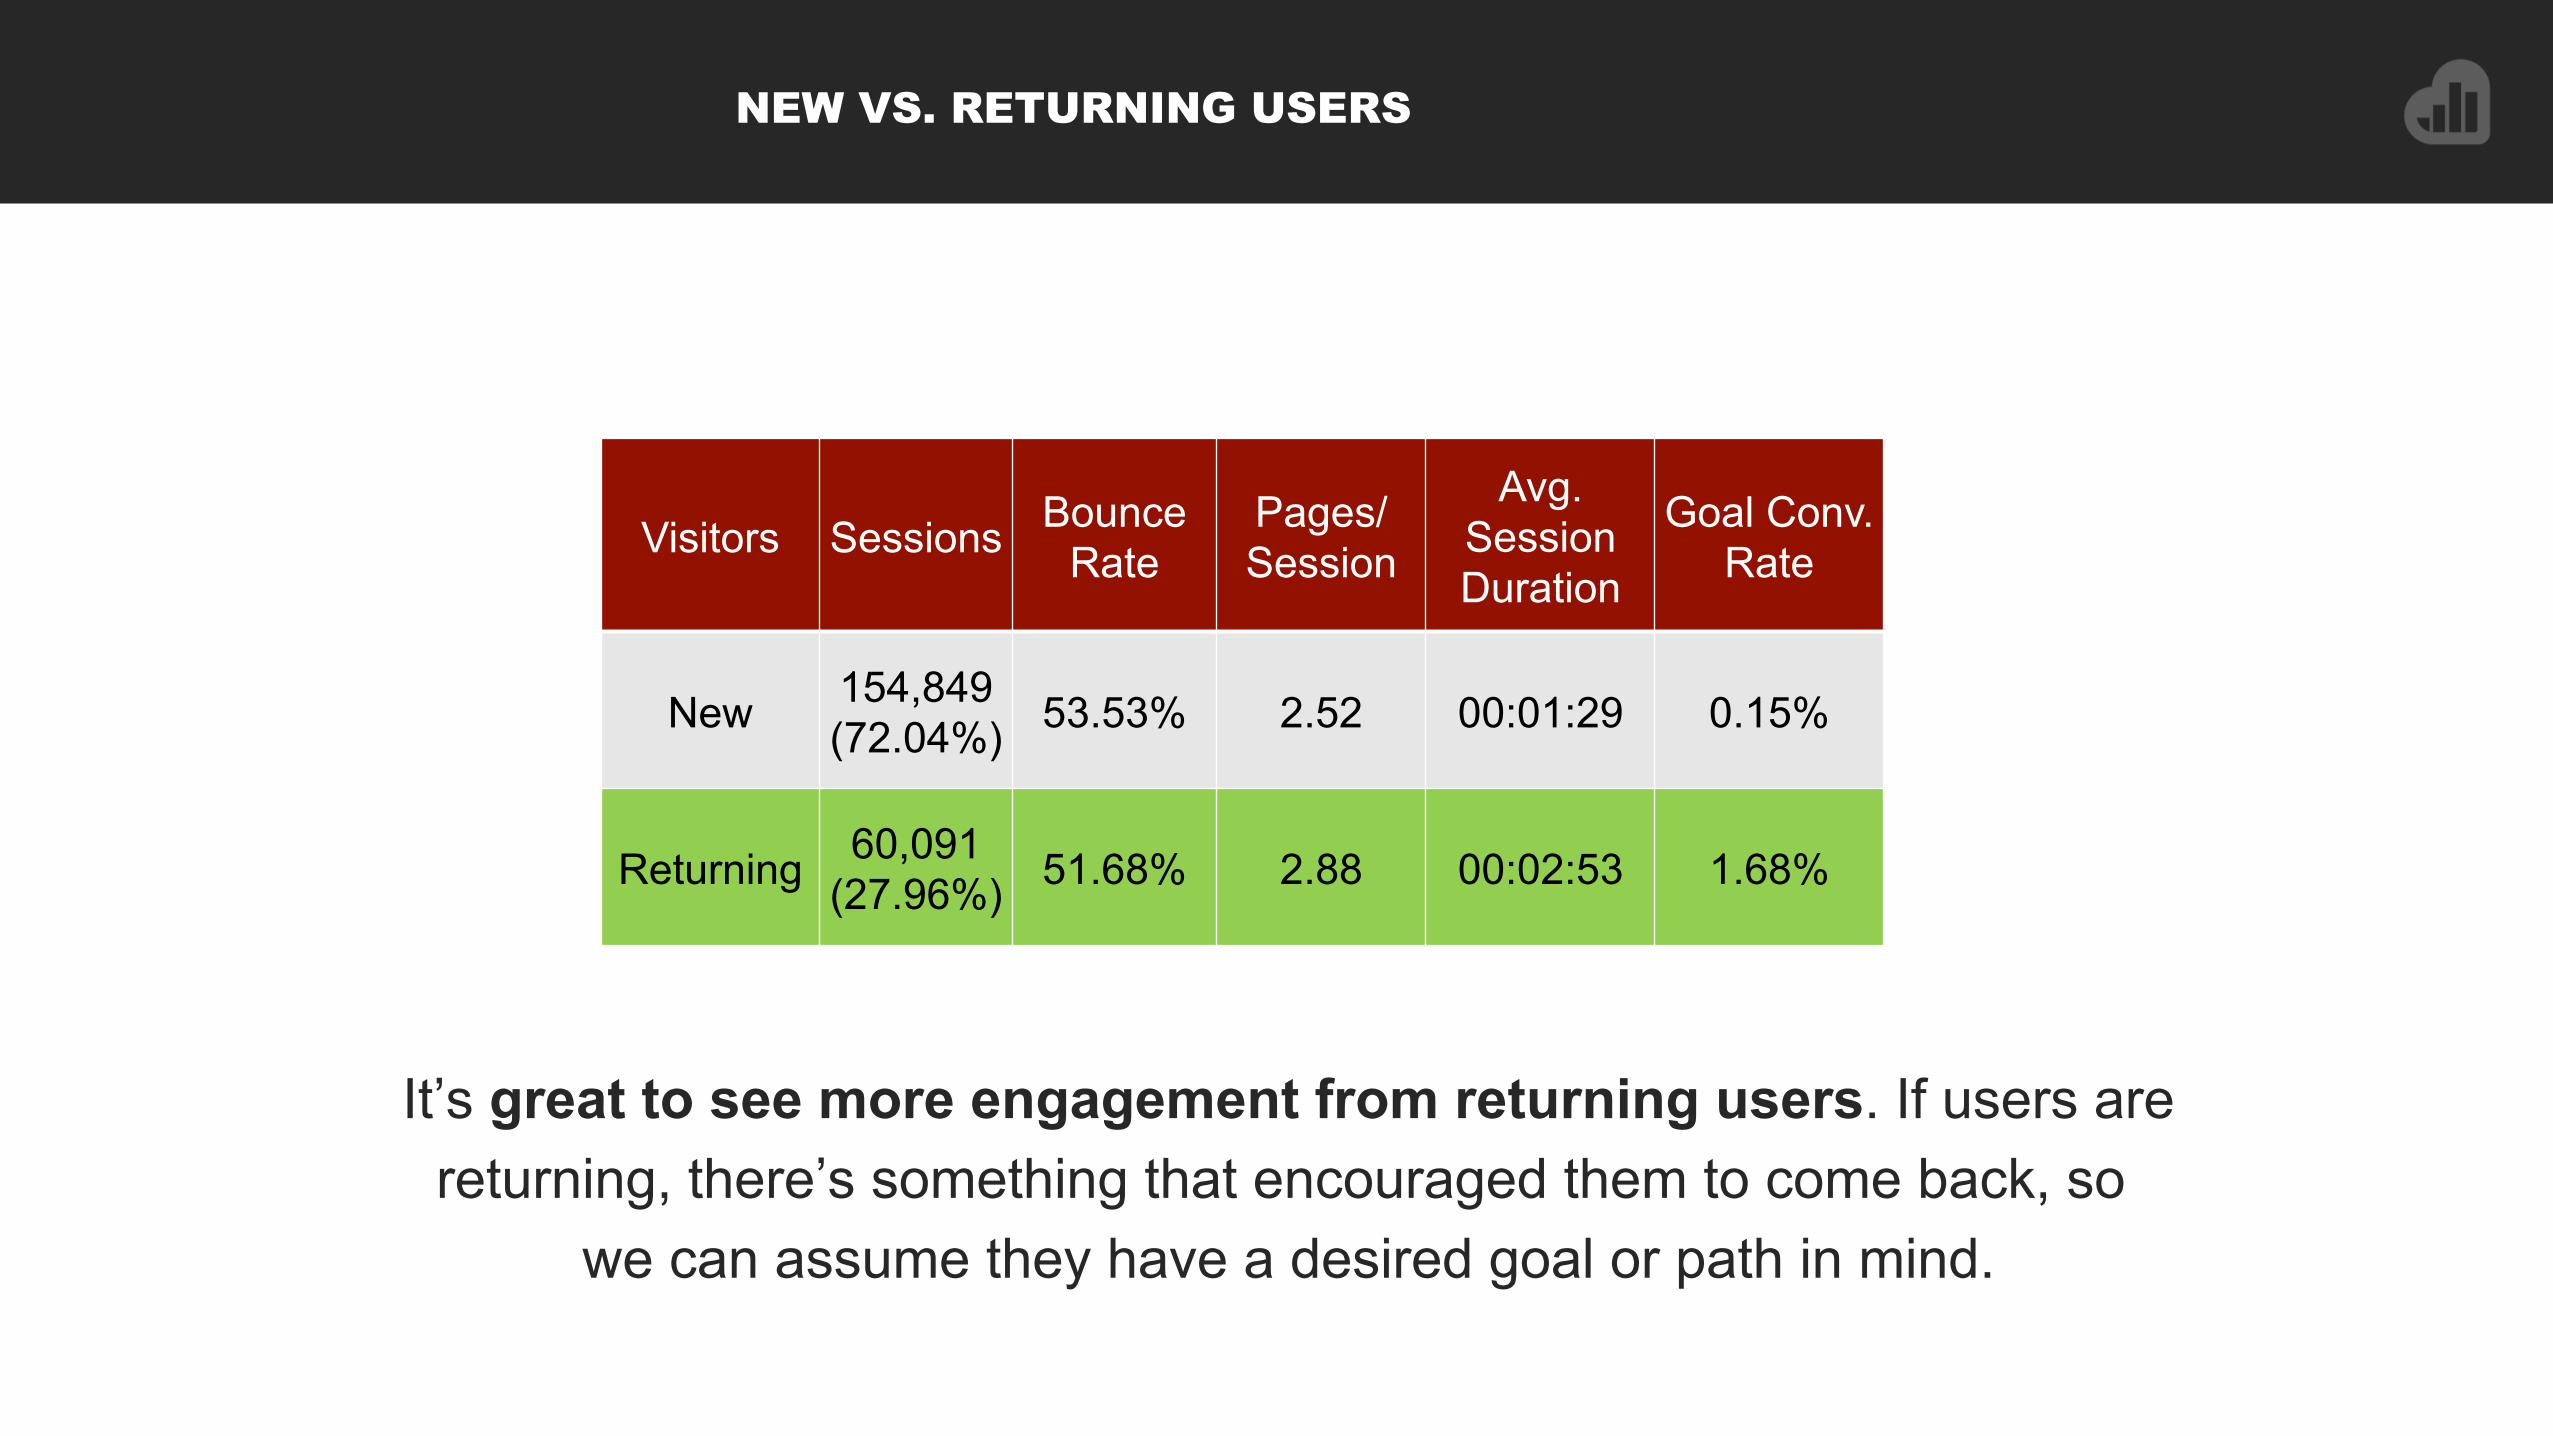
NEW VS. RETURNING USERS
It’s great to see more engagement from returning users. If users are returning, there’s something that encouraged them to come back, so
we can assume they have a desired goal or path in mind.
Visitors Sessions Bounce Rate
Pages/ Session
Avg. Session Duration
Goal Conv. Rate
New 154,849 (72.04%) 53.53% 2.52 00:01:29 0.15%
Returning 60,091 (27.96%) 51.68% 2.88 00:02:53 1.68%
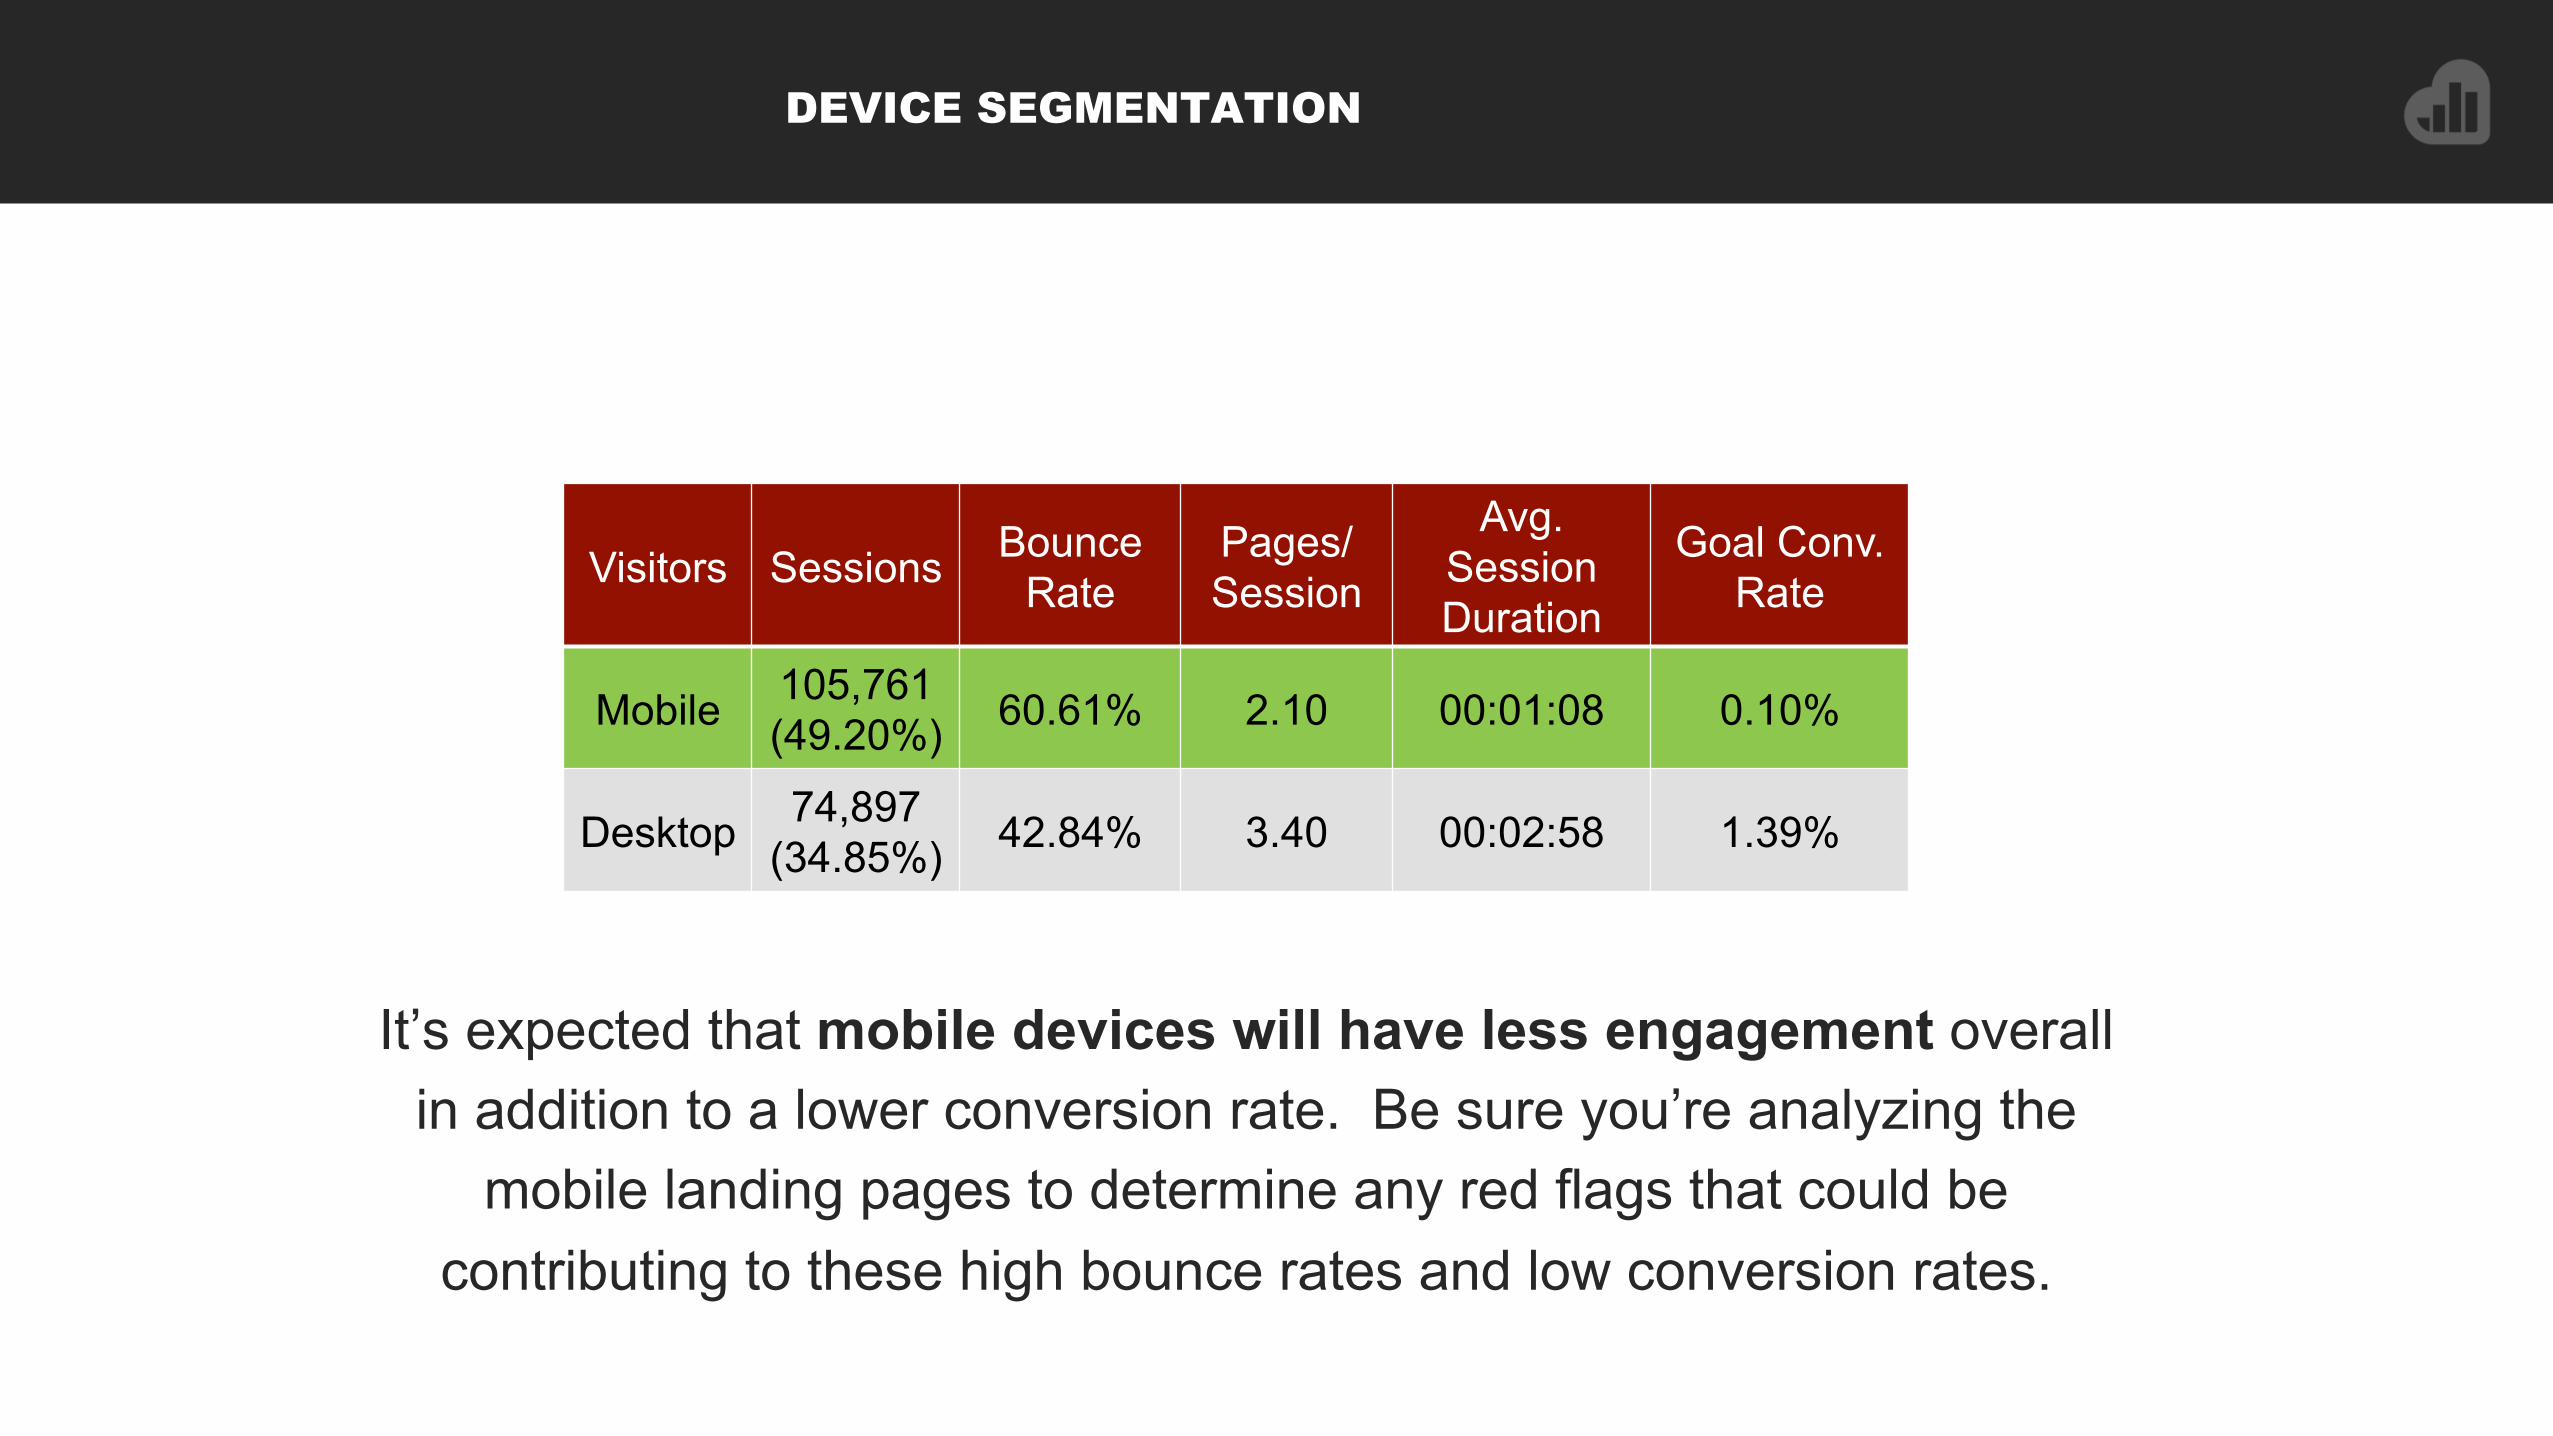
DEVICE SEGMENTATION
It’s expected that mobile devices will have less engagement overall in addition to a lower conversion rate. Be sure you’re analyzing the
mobile landing pages to determine any red flags that could be contributing to these high bounce rates and low conversion rates.
Visitors Sessions Bounce Rate
Pages/ Session
Avg. Session Duration
Goal Conv. Rate
Mobile 105,761 (49.20%) 60.61% 2.10 00:01:08 0.10%
Desktop 74,897 (34.85%) 42.84% 3.40 00:02:58 1.39%

OPERATING SYSTEM
In certain cases where we see high traffic from mobile devices, it may be important to determine what operating systems your customers are using. This information will help you learn even more about your
users and be able to target them appropriately.
Device Sessions Bounce Rate
Exit Rate
Avg. Time on Page
Avg. Session Duration
Pages/ Session
Mobile 7,011 (73.00%) 51.16% 66.87
% 00:02:43 00:01:29 1.54
Desktop 1,766 (18.39%) 65.57% 72.26
% 00:03:53 00:01:20 1.38
Tablet 827 (8.61%) 46.55% 66.57
% 00:02:52 00:01:21 1.54
OS Sessions Bounce Rate
Exit Rate
Avg. Time on Page
Avg. Session Duration
Pages/ Session
Android 5,630 (60.37%) 47.05% 68.00% 00:02:43 00:01:26 1.52
iOS 2,041 (21.89%) 64.77% 67.37% 00:02:44 00:01:20 1.41
Windows 1,655 (17.75%) 56.68% 62.87% 00:01:41 00:00:58 1.70

Page Speed
WHY IS PAGE SPEED IMPORTANT AND WHAT SHOULD YOU LOOK FOR?
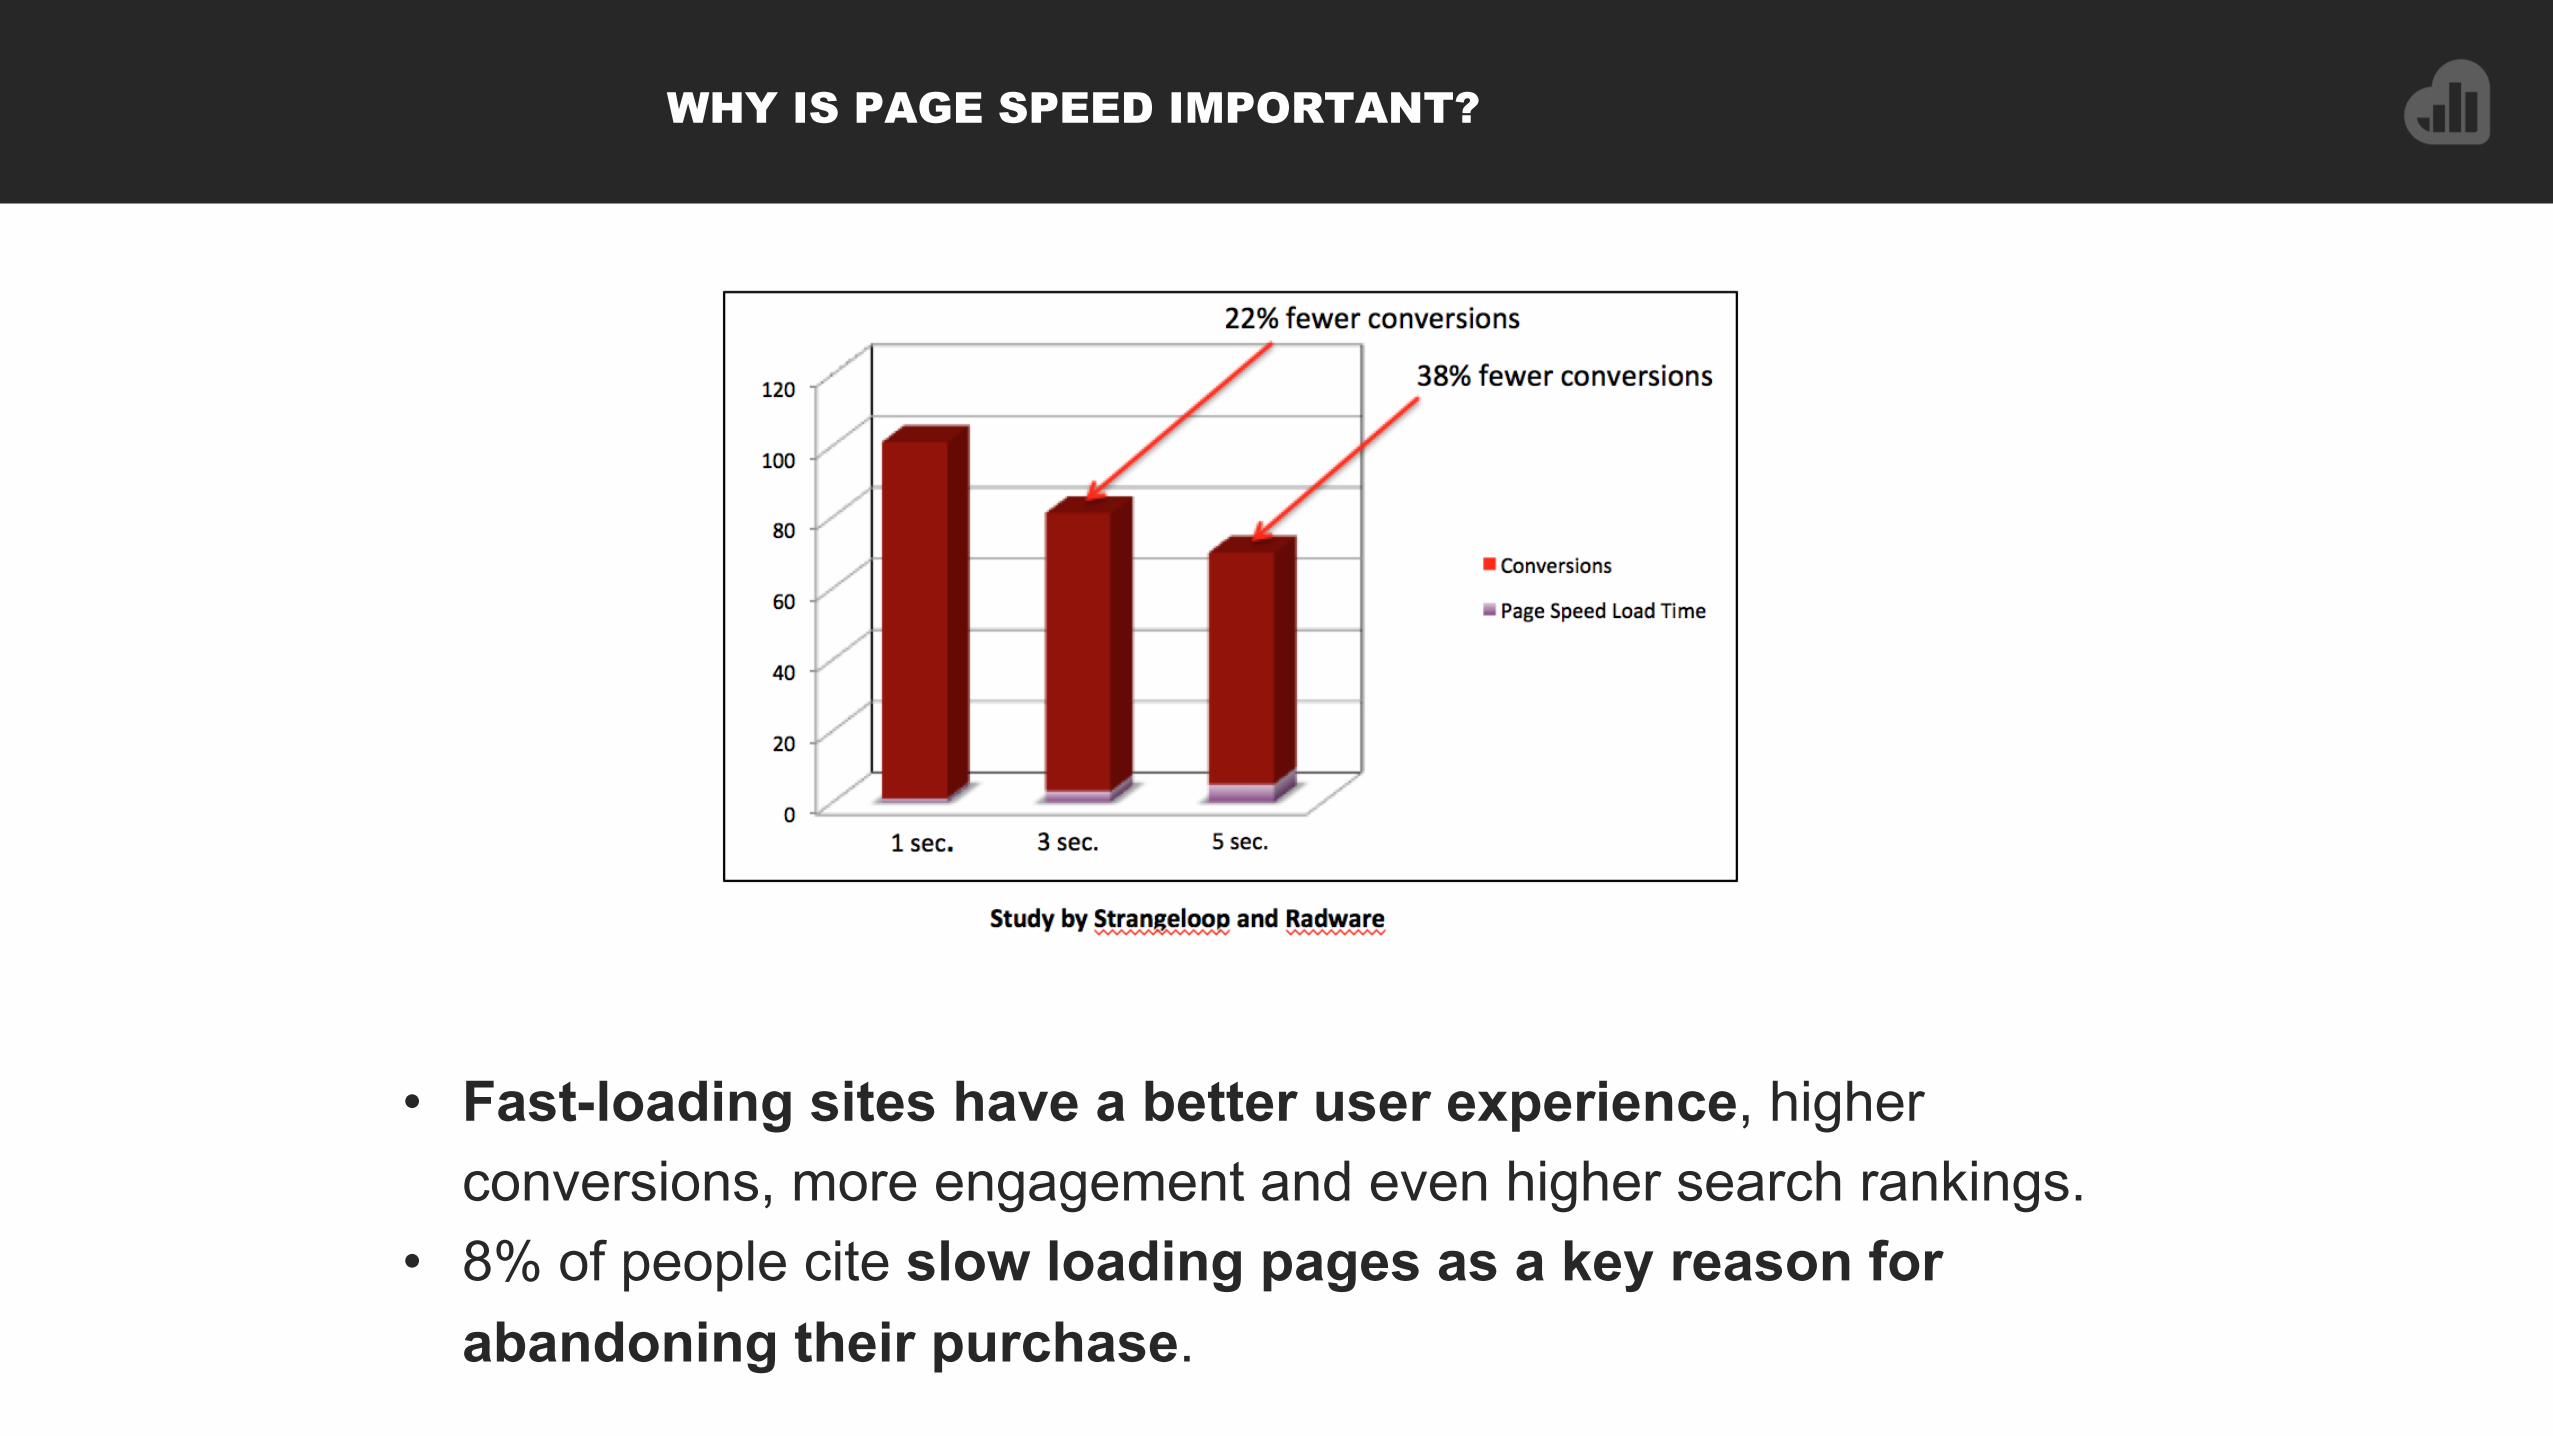
WHY IS PAGE SPEED IMPORTANT?
• Fast-loading sites have a better user experience, higher conversions, more engagement and even higher search rankings.
• 8% of people cite slow loading pages as a key reason for abandoning their purchase.

WHAT TO LOOK FOR IN GA
• Avg. Page Load Time: How many seconds it takes that page to load including network and server time and browser time
• Avg. Document Interactive Time: How many seconds until the page is usable • Look for individual red flags, high traffic pages and pages that are part of
your sales funnel
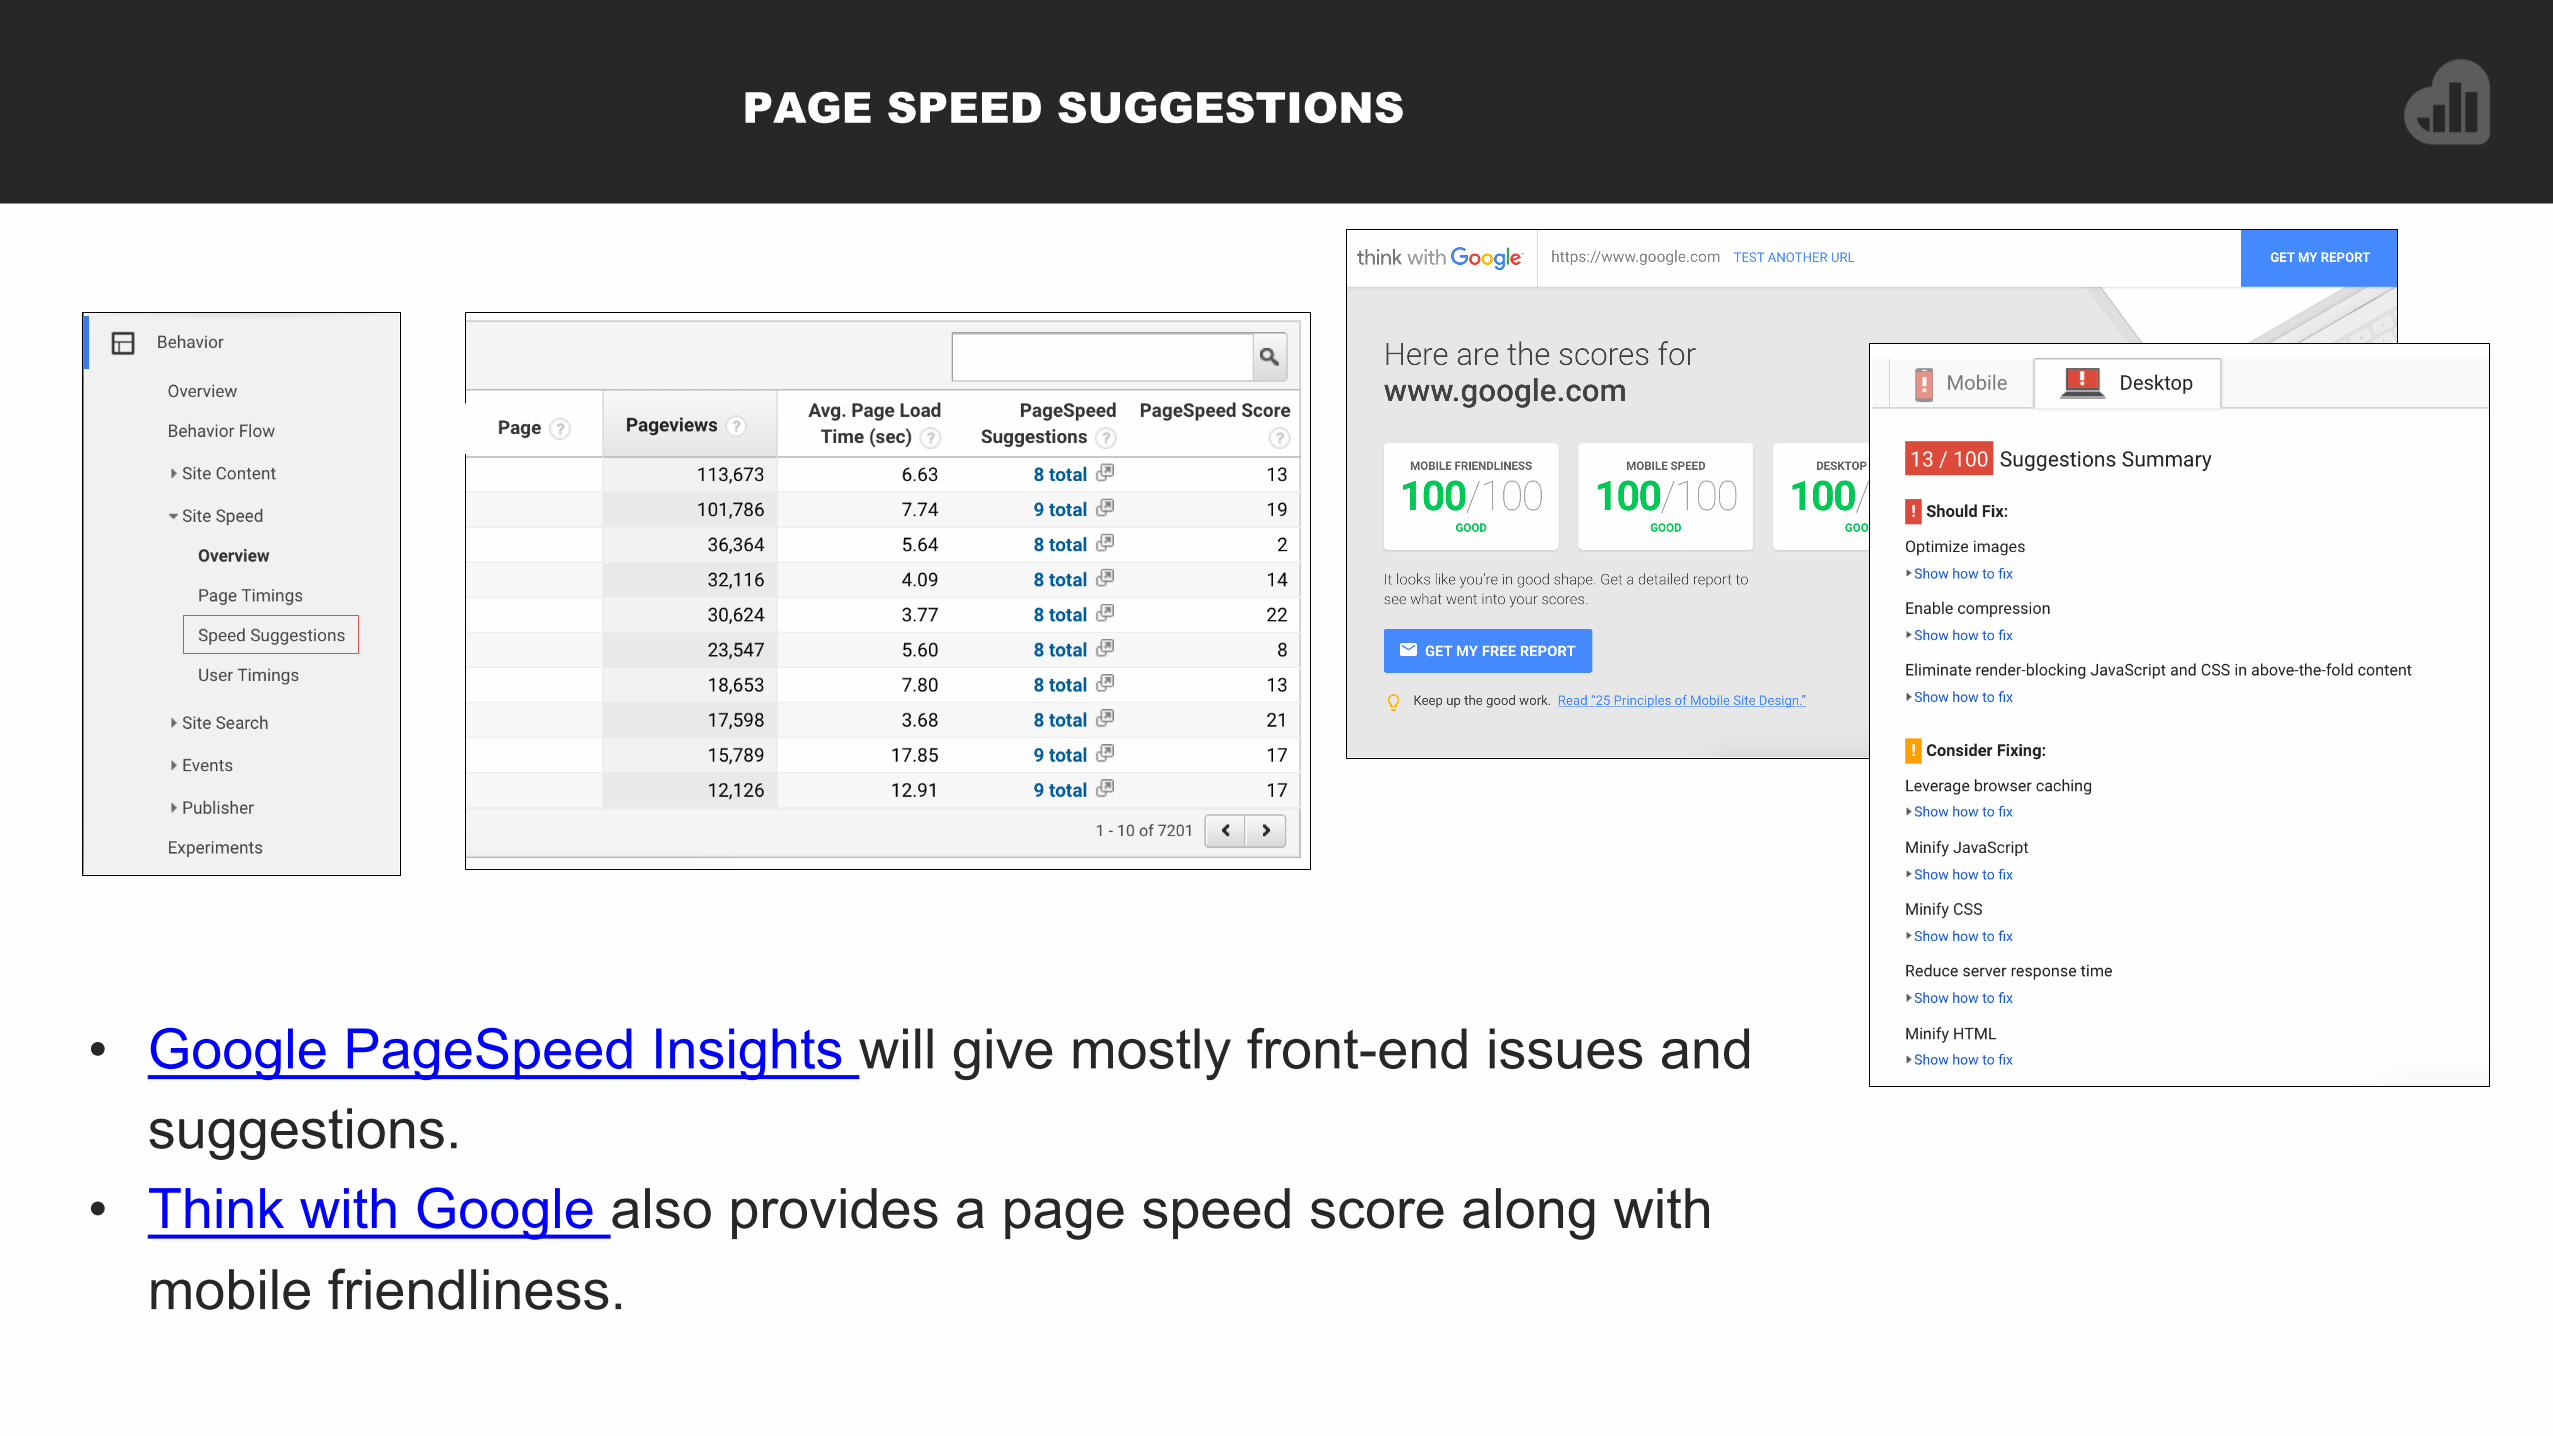
PAGE SPEED SUGGESTIONS
• Google PageSpeed Insights will give mostly front-end issues and suggestions.
• Think with Google also provides a page speed score along with mobile friendliness.

Landing Pages
WHERE SHOULD YOU FOCUS YOUR OPTIMIZATIONS?

LANDING PAGES BY CHANNEL
The channels report will allow you to drill down to specific pages. Here you can find some of your desired metrics: bounce rate, pages/
session, avg. session duration and conv. rate.
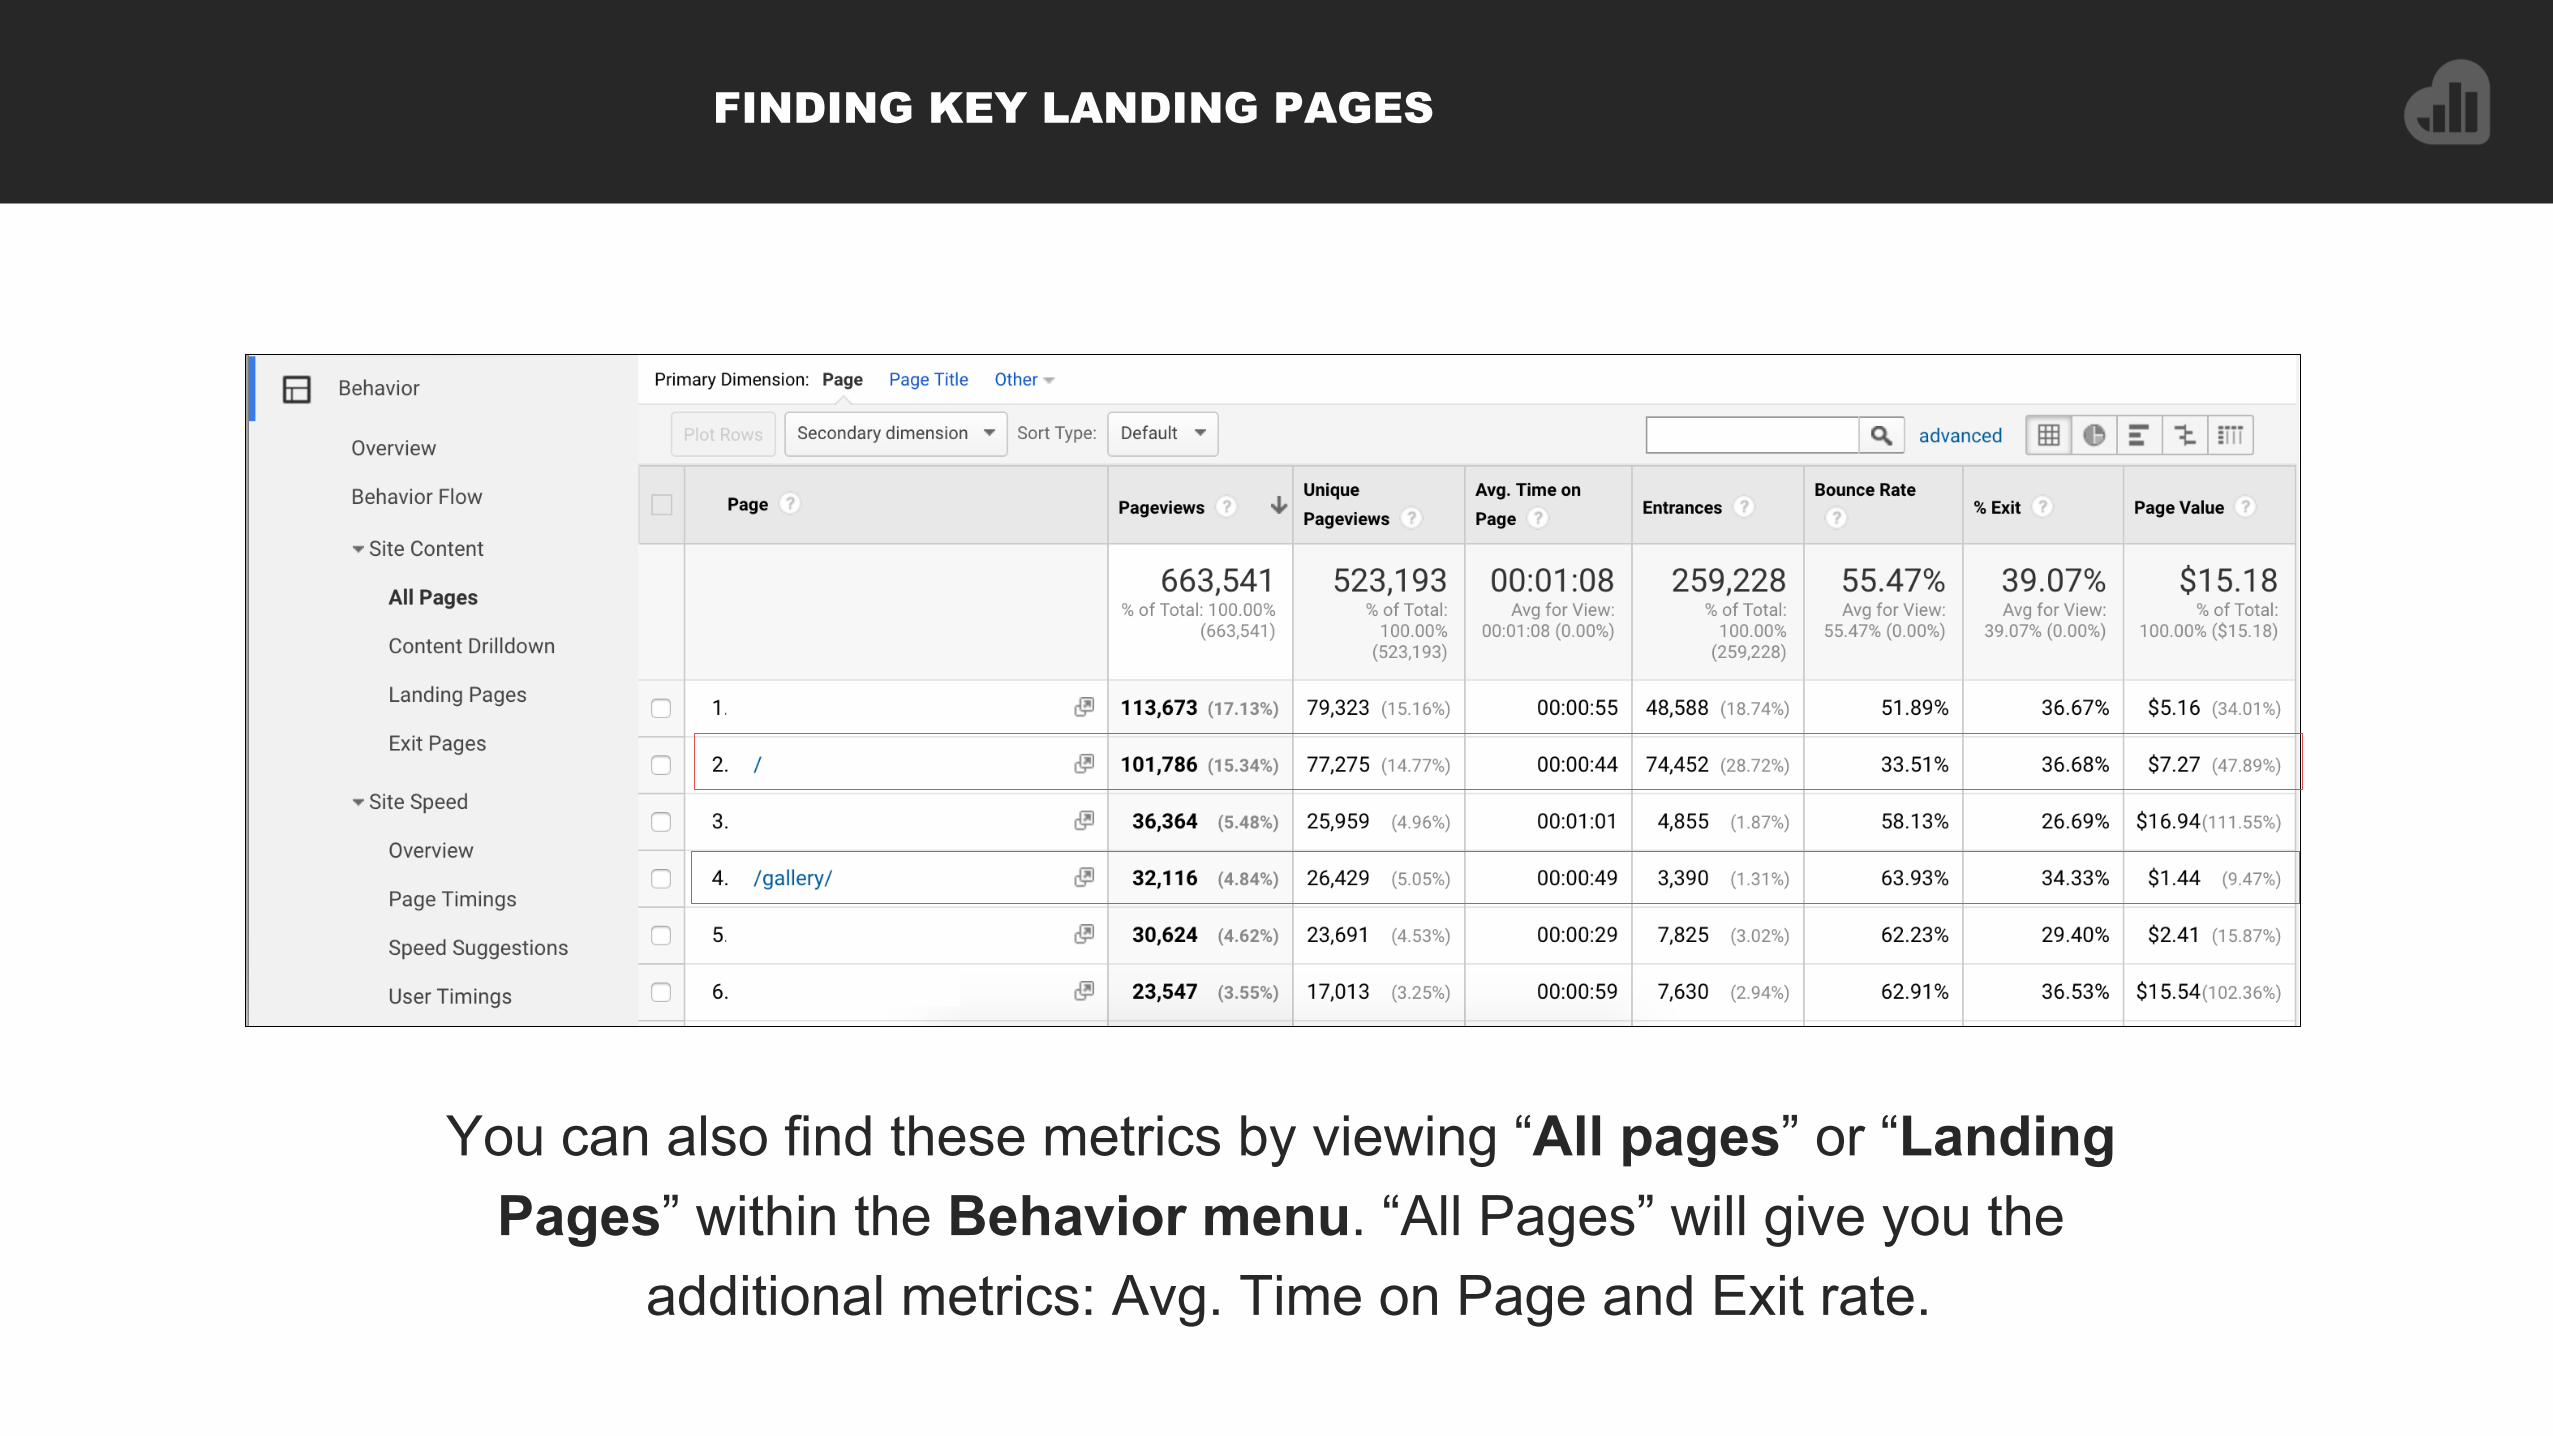
FINDING KEY LANDING PAGES
You can also find these metrics by viewing “All pages” or “Landing Pages” within the Behavior menu. “All Pages” will give you the
additional metrics: Avg. Time on Page and Exit rate.

What comes next?
WHERE DO WE GO FROM HERE?

ANALYZING THE DATA
To know what optimizations you need to make, you need to determine the problem. For example, we see that the mobile conversion rate, as well as overall engagement is significantly lower for mobile devices. How do we determine why this is a problem?
Device Bounce Rate
Exit Rate
Avg. Time on Page
Avg. Session Duration
Pages/ Session
Conv. Rate
Desktop 23.35% 30.40% 00:00:54 00:04:17 4.71 2.21%
Mobile 38.75% 40.31% 00:00:36 00:01:29 2.89 .16%
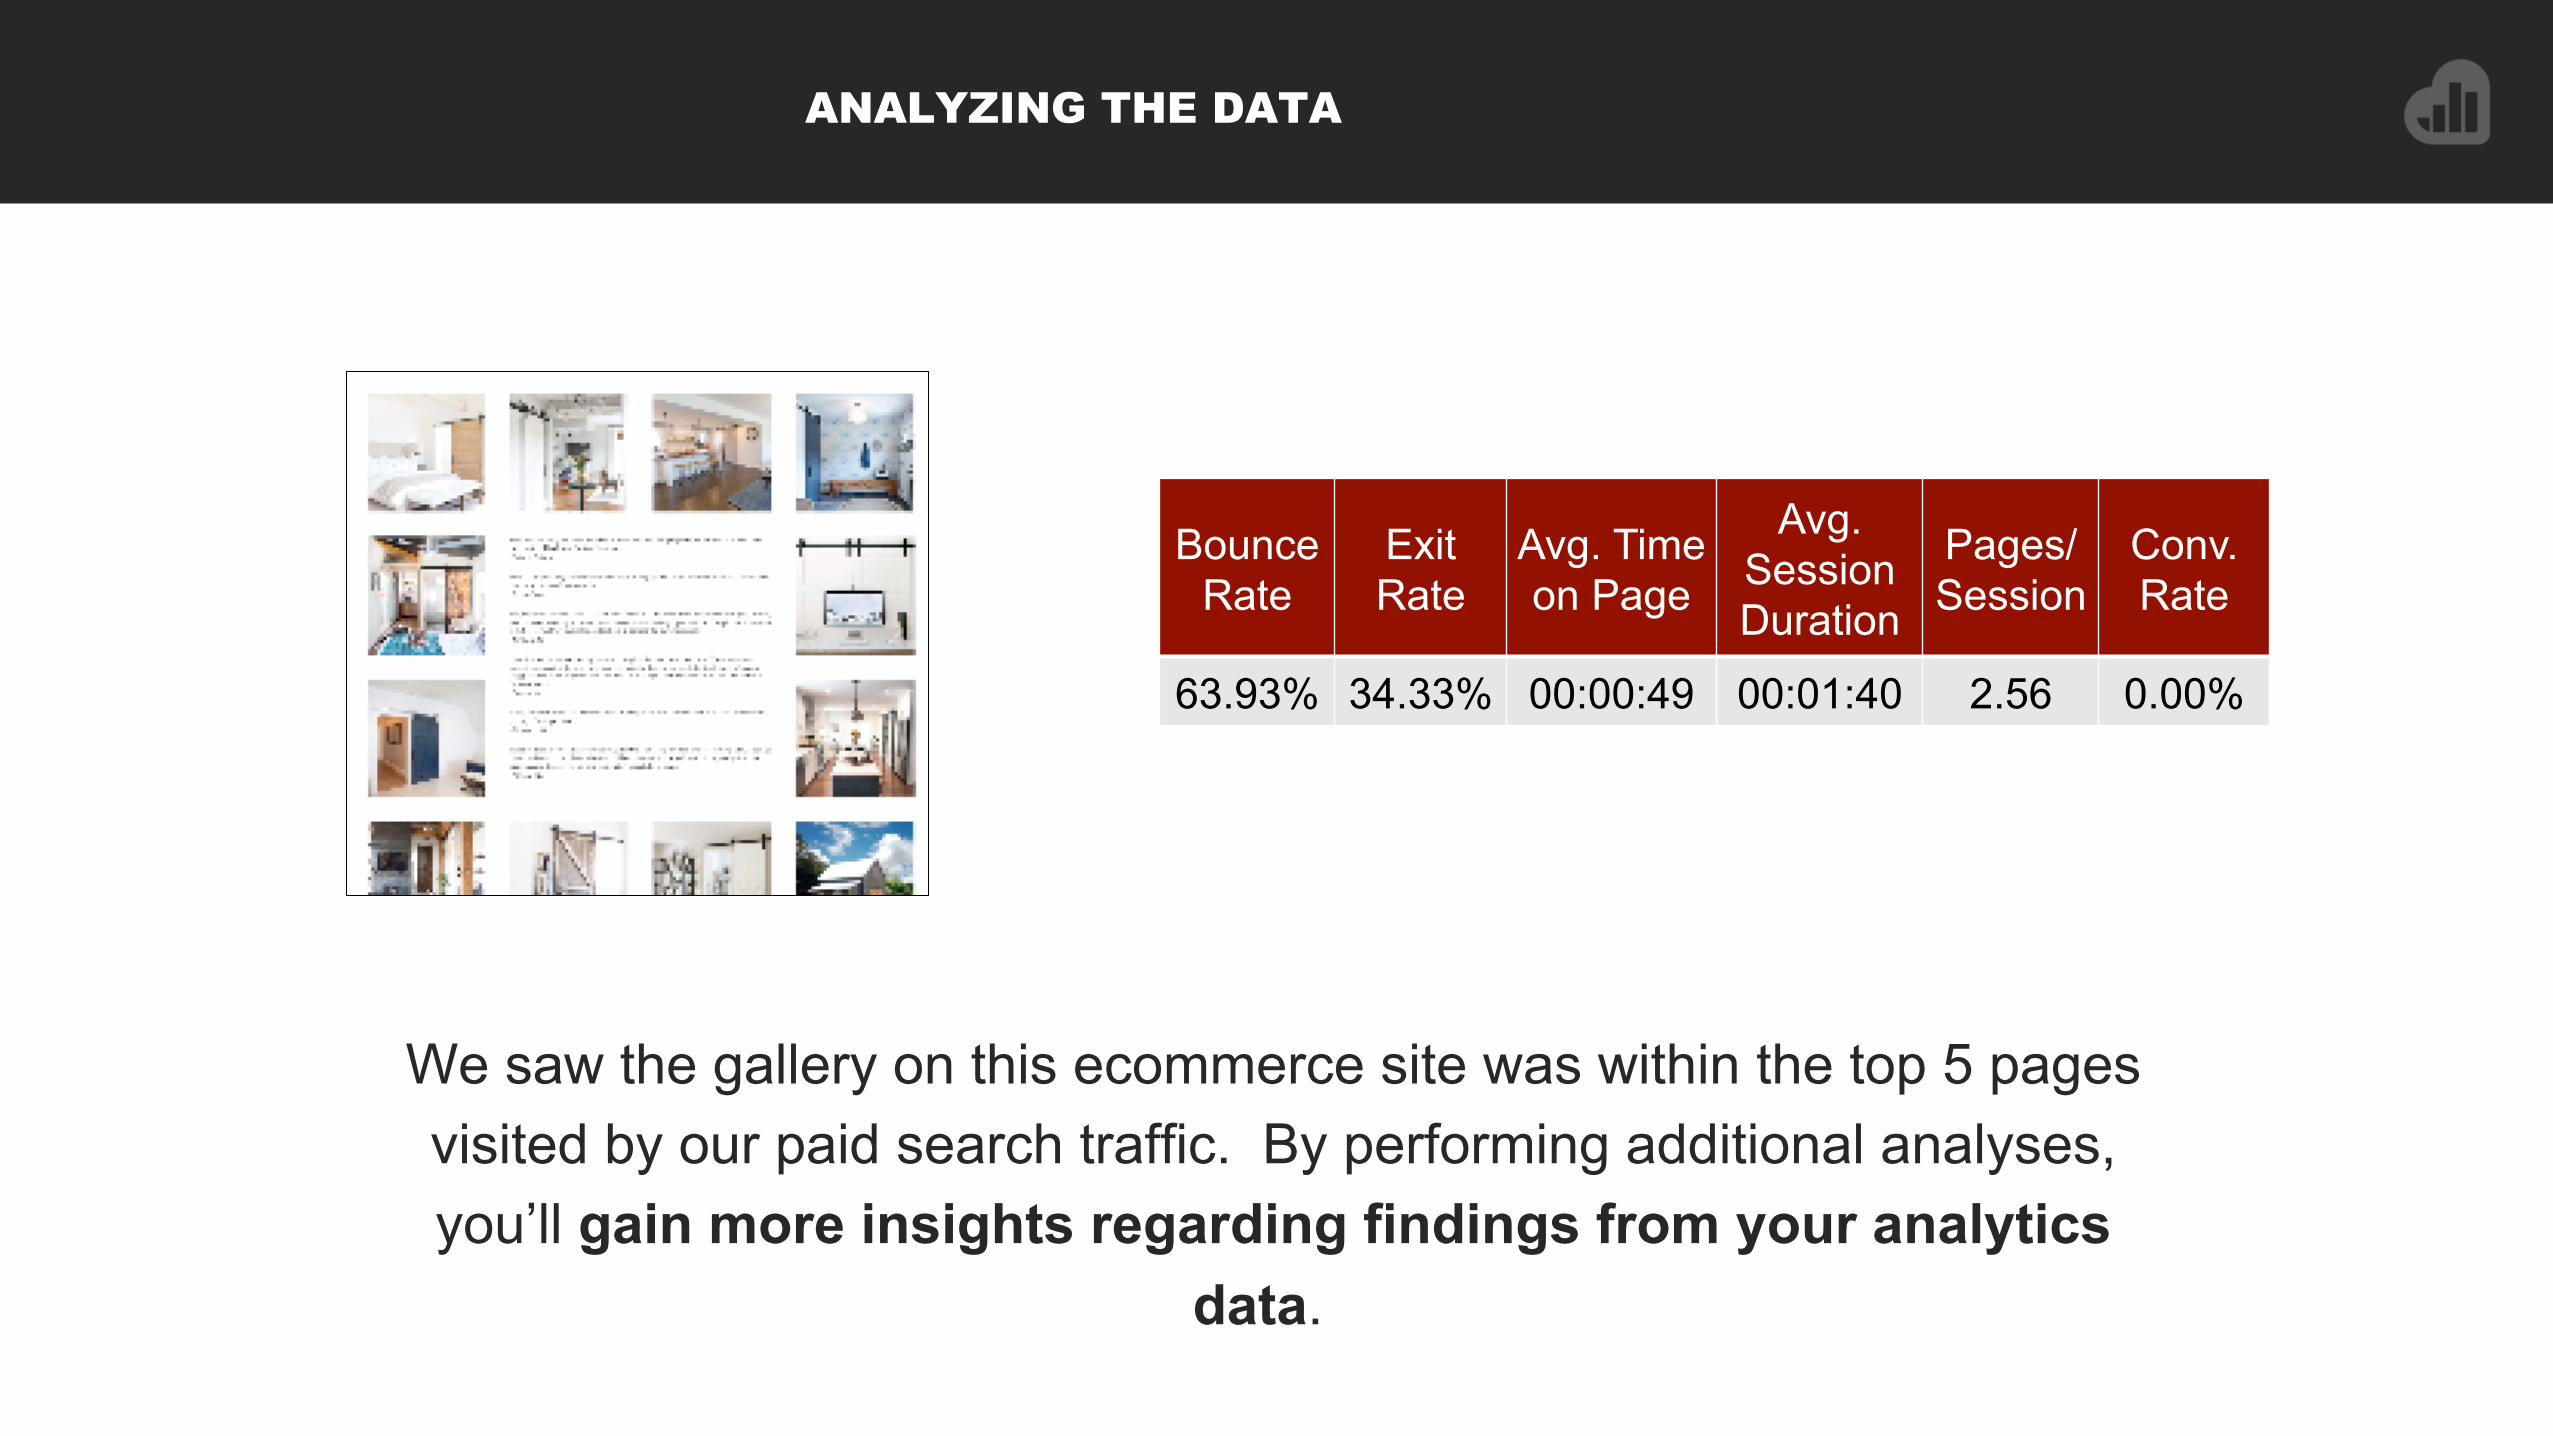
ANALYZING THE DATA
We saw the gallery on this ecommerce site was within the top 5 pages visited by our paid search traffic. By performing additional analyses, you’ll gain more insights regarding findings from your analytics
data.
Bounce Rate
Exit Rate
Avg. Time on Page
Avg. Session Duration
Pages/ Session
Conv. Rate
63.93% 34.33% 00:00:49 00:01:40 2.56 0.00%

ANALYZING THE DATA
Analytics lays the groundwork for landing page testing. Additional analyses acts as building blocks to determine your overall
takeaways and optimizations.
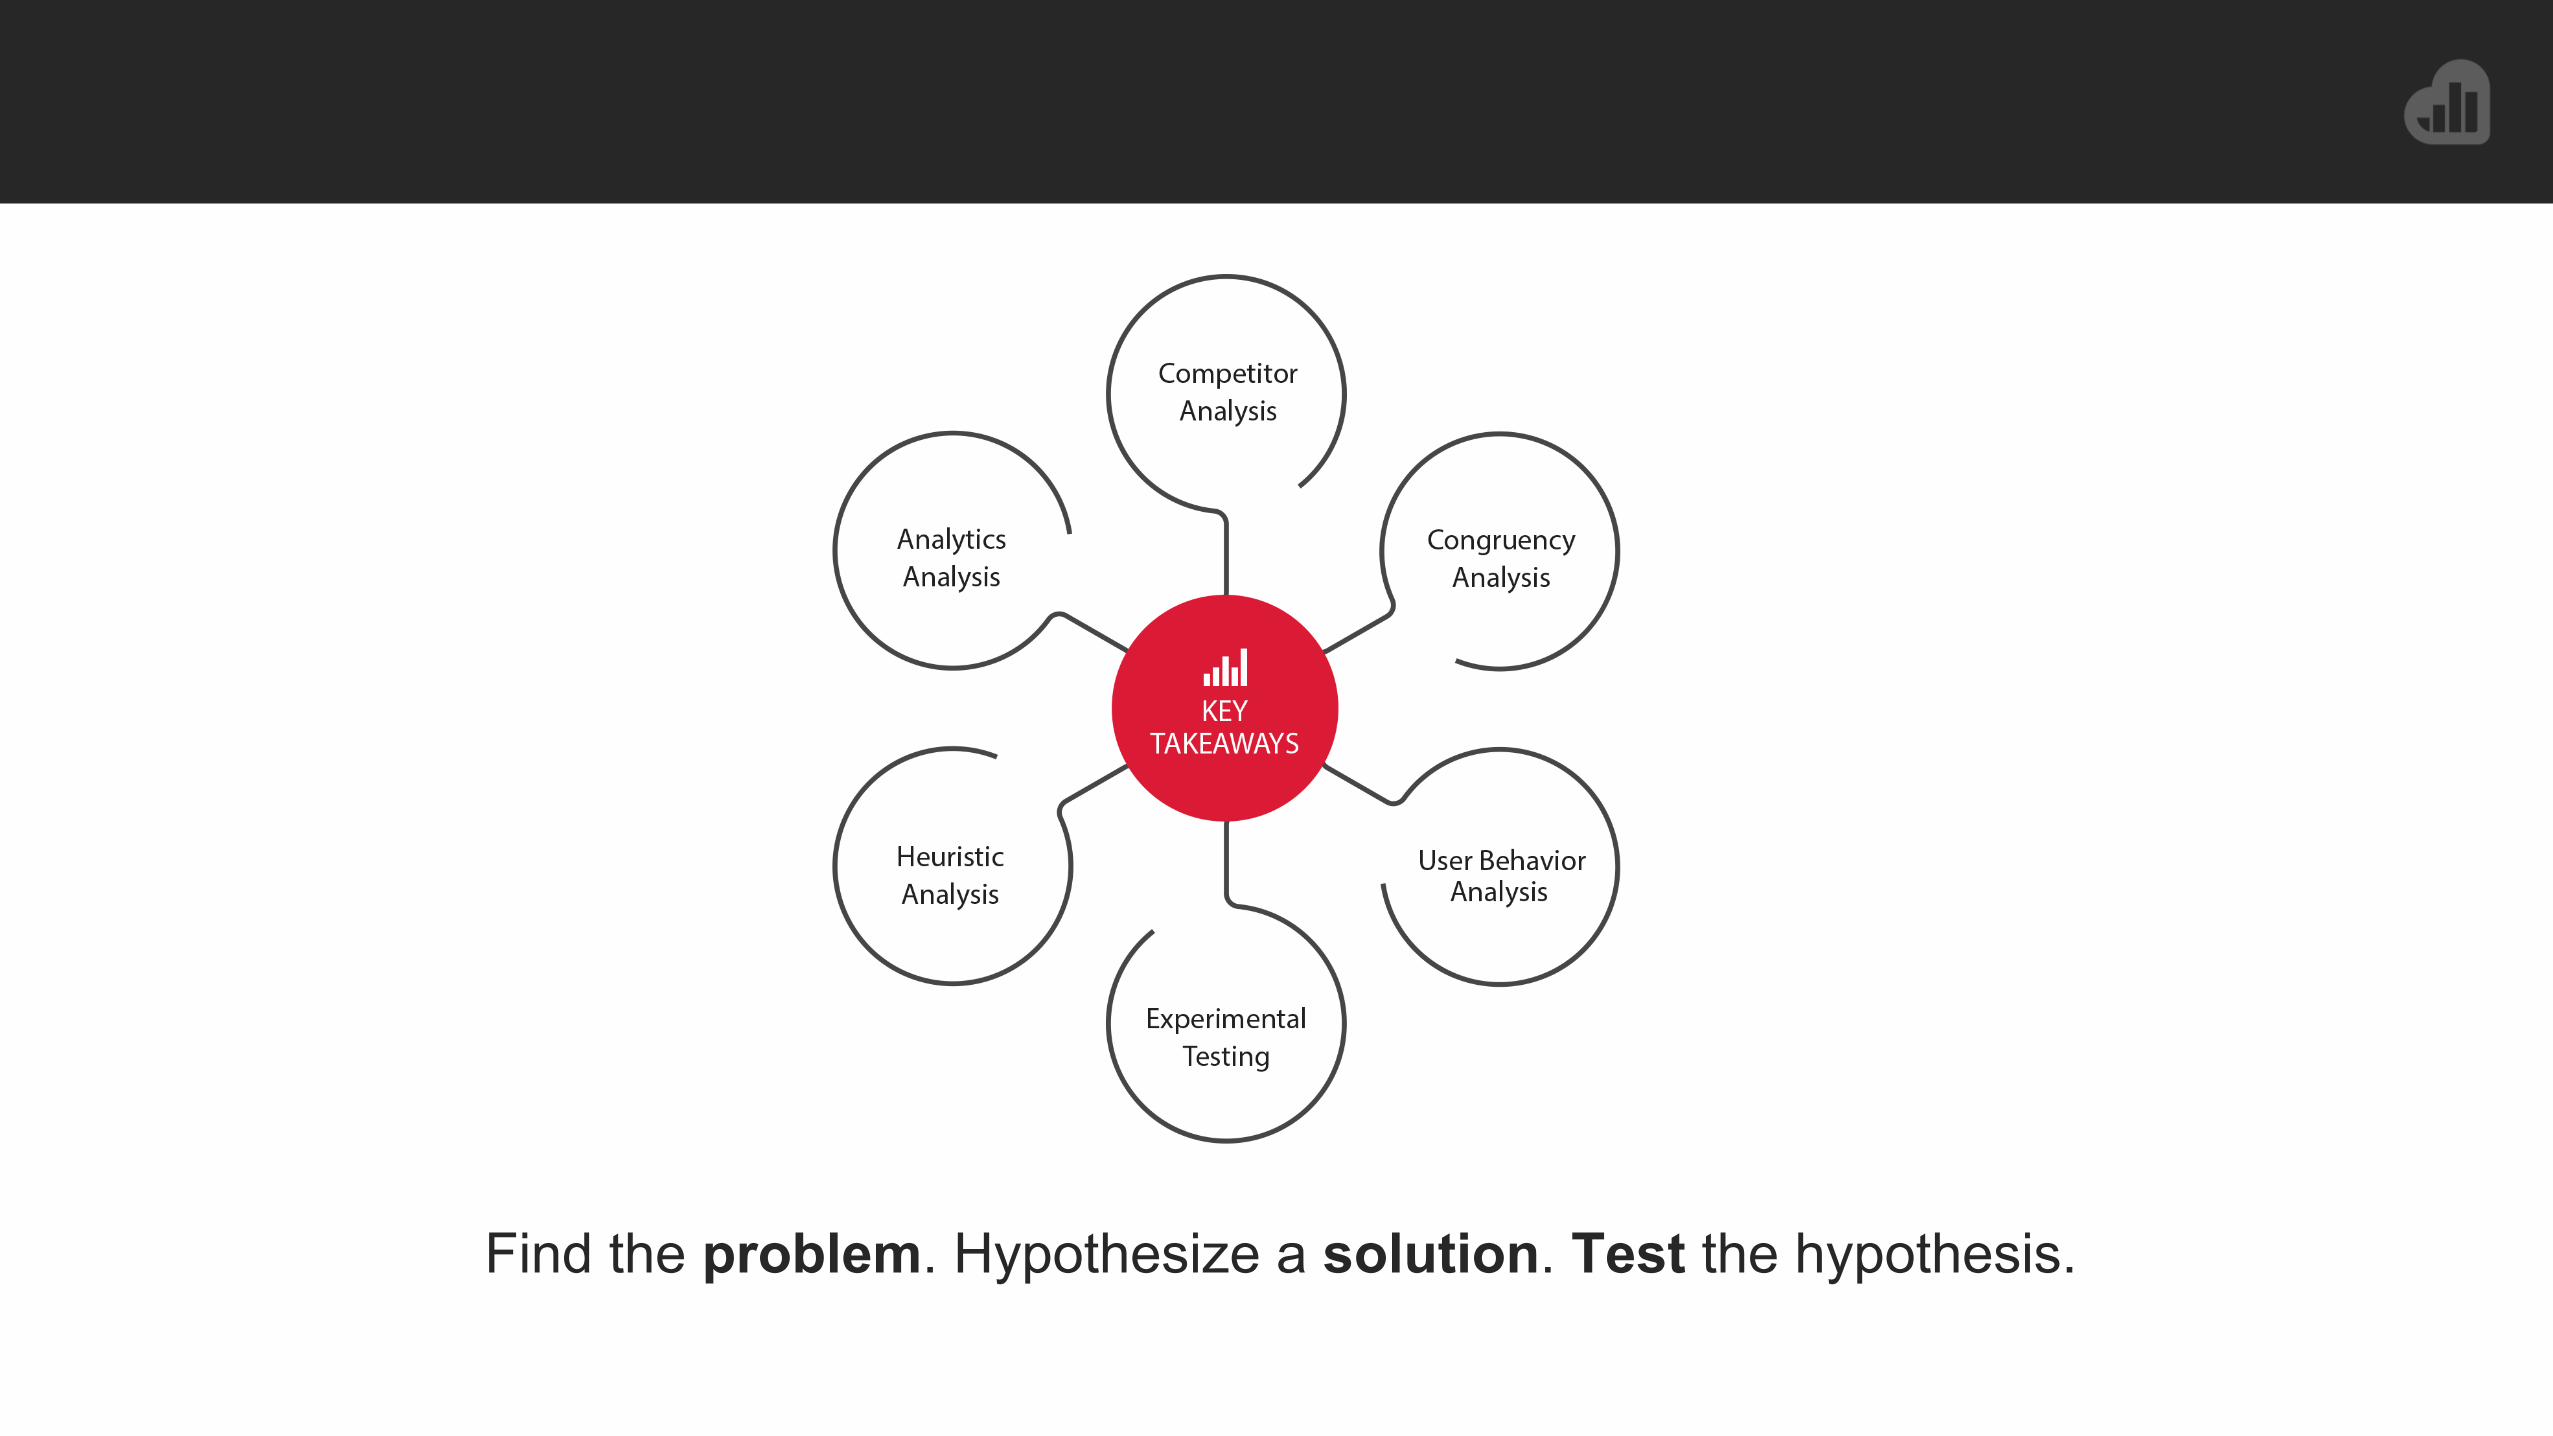
Find the problem. Hypothesize a solution. Test the hypothesis.

LEARN MORE NOW
Discover how Kissmetrics can help you optimize your marketing

Questions?
THUE MADSEN Marketing Operations Manager, Kissmetrics
@ThueLMadsen
SAMANTHA KERR Sr. CRO Manager, Hanapin Marketing
@Samantha__Kerr


![[CXL Live 16] Beyond Test-by-Test Results: CRO Metrics for Performance & Insight by Claire Vo](https://static.fdocuments.in/doc/165x107/587017221a28ab7f428b5b95/cxl-live-16-beyond-test-by-test-results-cro-metrics-for-performance-insight.jpg)
![CRO PROS Leveraging call analytics for conversion rate optimisation [CRO]](https://static.fdocuments.in/doc/165x107/587213291a28ab3f188b59ad/cro-pros-leveraging-call-analytics-for-conversion-rate-optimisation-cro.jpg)