Key Comparison - BIPM€¦ · Key Comparison CCQM-K36.2016 was a follow-up comparison for K36 and...
24
21.09.2017 Key Comparison CCQM – K36.2016 Electrolytic Conductivity at 0.5 S m -1 and 5 mS m -1 Final Report Steffen Seitz, Beatrice Sander Alan Snedden, Lisa DeLeeBeeck, Galia Ticona Canaza, Toshiaki Asakai, Igor Maksimov, Xiaoping Song, Hai WANG, Wladyslaw Kozlowski, Joanna Dumanska, Beáta Jakusovszky, Zsófia Nagyné Szilágyi, Vladimir Gavrilkin, Olexiy Stennik, Yuri Ovchinnikov, Simone Fajardo Ferraz, Fabiano Barbieri Gonzaga, Kleiton da Cruz Cunha,Zuzana Hanková, Michal Máriássy, Martina Vicarova, Alena Vospelova, Jose Luis Ortiz-Aparicio, Judith Velina Lara-Manzano, Jorge Uribe-Godínez, Daniela Stoica, Paola Fisicaro, V.I.Suvorov, Leonid A Konopelko, Aleksey M.Smirnov, Ronald Cristancho Amaya, Henry Torres Quezada Summary Key Comparison CCQM-K36.2016 was a follow-up comparison for K36 and provided updated support for the corresponding calibration and measurement capability (CMC) entries in the BIPM CMC database. It aimed to demonstrate the capabilities of the participating NMIs to measure electrolytic conductivity of aqueous electrolyte solutions in the conductivity range 0.15 S m -1 to 1.5 S m -1 and in the conductivity range 1.5 mS m -1 to 15 mS m -1 . To this end electrolytic conductivity of a potassium chloride solution (nominal conductivity 0.5 S m -1 ) and of a HCl solution (nominal conductivity 5 mS m -1 ) had to be measured. 17 NMIs participated in the comparison. The key comparison reference value (KCRV) of the KCl solution was (0.50999 +/-0.00032) S m -1 and the KCRV of the HCl solution was (4.9877 +/-0.012) mS m -1 . Both values were estimated from the medians of the results considered eligible for KCRV calculation. They were given with their expanded uncertainties (95% coverage). The majority of the 0.5 S m -1 results were consistent with the KCRV. Two institutes showed a small inconsistency, one outlier was observed. The conductivity of the HCl solution showed a small, but steady linear drift of 0.00006843 mS m -1 per day during the measurement period that was corrected for KCRV calculation. Some institutes reported unstable measurement conditions for this solution. The results of seven participants have been inconsistent with the KCRV.
Transcript of Key Comparison - BIPM€¦ · Key Comparison CCQM-K36.2016 was a follow-up comparison for K36 and...

21.09.2017
Key Comparison
CCQM – K36.2016 Electrolytic Conductivity at 0.5 S m-1 and 5 mS m-1
Final Report
Steffen Seitz, Beatrice Sander
Alan Snedden, Lisa DeLeeBeeck, Galia Ticona Canaza, Toshiaki Asakai, Igor Maksimov, Xiaoping Song, Hai WANG, Wladyslaw Kozlowski, Joanna Dumanska, Beáta Jakusovszky,
Zsófia Nagyné Szilágyi, Vladimir Gavrilkin, Olexiy Stennik, Yuri Ovchinnikov, Simone Fajardo Ferraz, Fabiano Barbieri Gonzaga, Kleiton da Cruz Cunha,Zuzana Hanková, Michal Máriássy,
Martina Vicarova, Alena Vospelova, Jose Luis Ortiz-Aparicio, Judith Velina Lara-Manzano, Jorge Uribe-Godínez, Daniela Stoica, Paola Fisicaro, V.I.Suvorov, Leonid A Konopelko, Aleksey
M.Smirnov, Ronald Cristancho Amaya, Henry Torres Quezada
Summary
Key Comparison CCQM-K36.2016 was a follow-up comparison for K36 and provided updated support for the corresponding calibration and measurement capability (CMC) entries in the BIPM CMC database. It aimed to demonstrate the capabilities of the participating NMIs to measure electrolytic conductivity of aqueous electrolyte solutions in the conductivity range 0.15 S m-1 to 1.5 S m-1 and in the conductivity range 1.5 mS m-1 to 15 mS m-1. To this end electrolytic conductivity of a potassium chloride solution (nominal conductivity 0.5 S m-1) and of a HCl solution (nominal conductivity 5 mS m-1) had to be measured. 17 NMIs participated in the comparison. The key comparison reference value (KCRV) of the KCl solution was (0.50999 +/-0.00032) S m-1 and the KCRV of the HCl solution was (4.9877 +/-0.012) mS m-1. Both values were estimated from the medians of the results considered eligible for KCRV calculation. They were given with their expanded uncertainties (95% coverage). The majority of the 0.5 S m-1 results were consistent with the KCRV. Two institutes showed a small inconsistency, one outlier was observed. The conductivity of the HCl solution showed a small, but steady linear drift of 0.00006843 mS m-1 per day during the measurement period that was corrected for KCRV calculation. Some institutes reported unstable measurement conditions for this solution. The results of seven participants have been inconsistent with the KCRV.

CCQM-K36.2016
2 / 24
Content
Coordinating laboratory and contact persons ........................................................................ 3
Metrology Area ........................................................................................................................ 4
Branch ...................................................................................................................................... 4
Subject ..................................................................................................................................... 4
Time schedule .......................................................................................................................... 4
Description of samples ............................................................................................................ 5
Preparation, shipment, handling ......................................................................................... 5
Homogeneity ....................................................................................................................... 7
Stability ................................................................................................................................ 8
Correspondence with institutes ............................................................................................ 11
Results of 0.5 S m-1 KCl solution ............................................................................................ 12
Reported results ................................................................................................................ 12
KCRV calculation ................................................................................................................ 13
Degrees of Equivalence ..................................................................................................... 14
Results of 5 mS m-1 HCl solution............................................................................................ 16
Reported results ................................................................................................................ 16
KCRV calculation ................................................................................................................ 18
Degrees of Equivalence ..................................................................................................... 19
Effect of Carbon Dioxide .................................................................................................... 21
“How Far Does The Light Shine” statement .......................................................................... 22
Traceability statement........................................................................................................... 22
References ............................................................................................................................. 23
Appendix A: Equations used to calculate KCRV estimates .................................................... 24

CCQM-K36.2016
3 / 24
Coordinating laboratory and contact persons
Physikalisch-Technische Bundesanstalt WG 3.41 - Fundamentals in Electrochemistry and electrochemical Energy Storage Bundesallee 100 GERMANY 38116 Braunschweig Steffen Seitz Email [email protected] Phone +49 (0)531 592 3019 Fax +49 (0)531 592 3015 Beatrice Sander Email [email protected] phone +49 (0)531 592 3132 fax +49 (0)531 592 3015

CCQM-K36.2016
4 / 24
Metrology Area
Amount of Substance
Branch
Electrochemistry
Subject
Measurement of the electrolytic conductivity of two unknown samples with nominal values 0.5 S m-1 (aqueous KCl solution) and 5 mS m-1 (aqueous HCl solution.
Time schedule
Invitation June 2016
Registration Deadline 31 July 2016
Sample preparation August/September 2016
Sample shipment Beginning of November 2016
Reporting Deadline 27 January 2017, extended 17.02.2017
Draft A April 2017
Draft B report April 2018
List of participants and contact persons
No Akkr Institute Country contact person email
1 DFM Dansk Fundamental Metrologi
DEN Alan Snedden [email protected]
2
INACL Instituto Nacional de Calidad PER Galia Ticona Canaza [email protected]
3 NMIJ National Metrology Institute of Japan
JPN Toshiaki Asakai [email protected]
4 NIM National Institute of Metrology (NIM)
CHN Xiaoping Song [email protected]
5 GUM Central Office of Measures (GUM)
POL Wladyslaw Kozlowski [email protected]
6
BFKH Government Office of the Capital City Budapest
HUN Beáta Jakusovszky [email protected]
7 UkrCSM
State Enterprise All-Ukrainian State Research and production Center of Standardization Metrology
UKR Vladimir Gavrilkin [email protected]
8 VNIIFTRI Federal Agency on technical regulation and metrology of Russia
RUS Yuri Ovchinnikov [email protected]
9 LATU Laboratorio Tecnológico del Uruguay
URY Simone Fajardo Ferraz [email protected]
CCQM-K36.2016
5 / 24
No Akkr Institute Country contact person email
10 INMETRO Instituto Nacional de Metrologia Qualidade e Tecnologia
BRA Fabiano Barbieri Gonzaga [email protected]
11 SMU Slovak Institute of Metrology
SVK Zuzana Hanková [email protected]
12 CMI Czech Metrology Institute CZE Martina Vicarova [email protected]
13 CENAM Centro Nacional de Metrología
MEX Jose Luis Ortiz-Aparicio [email protected]
14 PTB Physikalisch-Technische Bundesanstalt
GER Beatrice Sander [email protected]
15 LNE Laboratoire National de Métrologie et d’Essais
FRA Daniela Stoica [email protected]
16 VNIIM D.I.Mendeleyev Institute for Metrology
RUS V.I.Suvorov [email protected]
17 INM National Metrology Institute of Colombia
COL Ronald Cristancho Amaya [email protected]
Description of samples
Preparation, shipment, handling
The solutions used for the comparison have been produced by the coordinating laboratory.
20 L KCl solution with a nominal conductivity value of 0.5 S m-1 have been prepared in a 25 L PE vessel using potassium chloride (Suprapur from Merck Millipore) and pure water. The water has been taken from a Millipore Elix purification system. The solution has been aerated for several hours after preparation to achieve equilibrium condition with ambient air. Afterwards the KCl solution has been homogenized, filled in 200 mL bore silicate glass bottles and closed with rubber stoppers. The stoppers have been fixed with aluminium crimps. Afterwards they have been weighed.
20 L HCl solution with a nominal conductivity of 5 mS m-1 has been prepared by dilution of hydrochloric acid (Titrisol 0.01 M from Merck Millipore) with pure water in a 25 L PE vessel. The solution has been aerated after preparation for a few days to achieve equilibrium condition with ambient air. In the meanwhile 500 mL HDPE bottles have been filled and stored with a similar HCl solution for a few days. Afterwards they have been spilled once with pure water and dried in an oven at 60°C. Then the HCl solution for the comparison has been homogenized and filled into the bottles. The bottles have been closed with lids immediately after filling. The lids have been sealed with tape and then the bottles have been weighed. Afterwards they have been sealed in aluminium laminated bags to prevent water evaporation.
The samples have been dispatched to all participants at the same time. They were shipped in a cardboard box by courier. After receipt the bottles have been visually inspected for damages. Bottle masses have been measured and corrected for air buoyancy. The results have been reported to the coordinating institute, where they have been compared with the initially weighed masses in order to verify bottle integrity. DFM and VNIIFTRI bottles have shown significantly deviating masses for the HCl solutions (also see section communication with institutes). One bottle of KCl solution sent to VNIIFTRI showed a deviation of about 0.1 g. Mass

CCQM-K36.2016
6 / 24
differences of all other bottles were smaller than 0.05 g (see figures 1 and 2). Apart from the conspicuous VNIIFTRI values all other masses of the HCl solution bottles have decreased. A plot of the deviation against the date of weighing (not shown) shows a tendency to decreasing masses and to increasing spread. Apparently, there has been a small residual loss of water. However, since the drop was 0.003 % on average its effect on conductivity could be neglected. After weighing the bottles had to be stored below 25 °C until the measurements started. The bottles containing HCl solution had to be put back into the aluminium bags for storage until the measurement, whereas the bags had to be closed with tape, but not to be re-sealed.
Figure 1 Measured mass differences of 0.5 S/m KCl solution with respect to the initial weighing at the coordinating institute. One value from VNIIFTRI has been cut off.
-0.030
-0.025
-0.020
-0.015
-0.010
-0.005
0.000
0.005
0.010
0.015
CEN
AM
CM
I
CM
I
DFM
DFM
GU
M
GU
M
INA
CA
L
INM
Inm
etro
LATU
LATU LN
E
LNE
BFK
H
BFK
H
BFK
H
NIM
NM
IJ
NM
IJ
SMU
Ukr
CSM
VN
IIFT
RI
VN
IIM
VN
IIM
mas
s d
iffe
ren
ce
/g

CCQM-K36.2016
7 / 24
Figure 2 Measured mass differences of 5 mS/m HCl solution with respect to the initial weighing at the coordinating institute. The values from VNIIFTRI have been cut off.
Homogeneity
0.5 S m-1 KCl solution
5 bottles have been chosen for homogeneity testing with bottle numbers distributed over the whole batch. A Guildline Autosal B salinometer has been used to measure conductances of the samples. The relative standard deviation of the conductances was 0.0024 %. This is significantly smaller than the measurement uncertainties of conductivity measurements, so that the samples can be assumed sufficiently homogeneous for the comparison. The results of the individual measurements are shown in table 1.
Table 1 Results of homogeneity test of the KCl solution samples
bottle # bath
temperature conductance
°C arbit. units
3 23.993 0.19244 20 23.993 0.19244 56 23.993 0.19243 77 23.993 0.19244 93 23.993 0.19244
Mean conductance (arbit. units): 0.19244 Standard deviation < 0.00001 Relative standard deviation 0.0024 %
-0.0500
-0.0400
-0.0300
-0.0200
-0.0100
0.0000
0.0100
CE
NA
M
CM
I
DF
M
DF
M
GU
M
GU
M
INA
CA
L
INM
Inm
etr
o
LA
TU
LA
TU
LN
E
LN
E
LN
E
BF
KH
BF
KH
NIM
NM
IJ
NM
IJ
SM
U
UkrC
SM
UksC
SM
VN
IIF
TR
I
VN
IIF
TR
I
VN
IIM
mass d
iffe
ren
ces
/
g

CCQM-K36.2016
8 / 24
5 mS m-1 HCl solution
5 bottles have been chosen for homogeneity testing with bottle numbers distributed over the whole batch. A two electrode Jones-type cell has been used to measure conductivity of the samples. The relative standard deviation was 0.003 %. This is significantly smaller than the expected measurement uncertainties of the comparison conductivity measurements, so that the samples can be assumed sufficiently homogeneous for the comparison measurement. The results of the individual measurements are shown in table 2. Note that conductivities have been linearly corrected to 24.980 °C.
Table 2 Results of the homogeneity test of the HCl solution samples
bottle # bath
temperature conductivity @ 24.980°C
°C mS/m
10 24.981 4.98954
14 24.978 4.98986
26 24.984 4.98954
35 24.993 4.98966
47 24.982 4.98990
Mean conductivity: 4.9897 mS/m Standard deviation: 0.0017 mS/m Relative standard deviation 0.0034 %
Stability
0.5 S m-1 KCl solution
5 bottles have been arbitrarily chosen for stability testing. A Guildline Autosal B salinometer has been used to measure conductances of the samples. Measurements have been conducted in approximately 4 week intervals over the whole measurement period. No significant drift has been observed. The relative standard deviation is 0.0076%, which is small enough for the requirements of this comparison, albeit a factor 3 larger than the measured homogeneity. Therefore another homogeneity test has been performed at the end of the measurement period. The relative standard deviation of that measurement was 0.00024%, which was even an order of magnitude smaller than the first homogeneity test. The relative deviation of the means of both homogeneity tests is 0.0016%. Thus the spread of the stability results is more likely due to (small) instabilities of the measurement device during the measurement period than due to sample instabilities. Consequently the KCl solution samples can be assumed sufficiently stable for the comparison measurement. The results of the individual measurements are shown in table 3 and figure 3.

CCQM-K36.2016
9 / 24
Table 3 Results of the stability test of the KCl solution samples
bottle # date
measured bath
temperature conductance @ 24.000 °C
°C arbit. units from
homgeinty tests
09.09.2016 23.993 0.19244
50 04.11.16 24.001 0.19245
96 13.12.16 24.001 0.19243
41, 59 06.01.2017 24.000 0.19241
68 02.02.2017 24.001 0.19243 13, 35, 57,
78, 101 17.02.2017 24.000 0.19244
Mean conductance (arbit. units): 0.19243 Standard deviation: 0.000015 Relative standard deviation 0.0079 %
Figure 3 Stability tests of KCl solution samples. The error bars indicate the double standard deviation of the (first) homogeneity test. Note that the smallest, expanded standard uncertainties of the comparison are about a factor 10 larger.
0.19239
0.19240
0.19241
0.19242
0.19243
0.19244
0.19245
0.19246
0.19247
0 50 100 150 200
days
cond
ucta
nce
/
arbi
t. u
nits

CCQM-K36.2016
10 / 24
5 mS m-1HCl solution
4 bottles have been arbitrarily chosen for stability testing. The samples have been stored in the laboratory at room temperature and kept in the aluminium bags until the measurement. A two electrode Jones-type cell has been used to measure conductivity of the samples. Measurements have been conducted in approximately 4 week intervals over the whole measurement period. A linear increase of the measured conductivity values of 0.00006843 mS m-1 per day has been observed. The results of the individual measurements are shown in table 4 and figure 4. Note that conductivities have been linearly corrected to 24.980 °C.
After drift had been realised stability of the Jones-type cell has been verified with a stable 100 mS m-1 KCl solution to check if the measured drift results from a change of solution conductivity, but not from a change of cell properties. The samples have been prepared and characterised for homogeneity in the same way as the 0.5 S m-1 KCl solution of this comparison. Starting 22.12.2016, KCl solution samples have been measured once a month during the remaining measurement period. Since the spread of the resistance values over time (<0.004%) was compatible with the results of the homogeneity measurement, it is concluded that the cell and the 100 mS m-1 KCl test solution were stable during the measurement period.
At the end of the measurement period the homogeneity test has been repeated with another 4 bottles of HCl solution. The relative standard deviation of those measurements has been 0.01 %, which is somewhat larger than the spread of the first homogeneity test, however, it is still acceptable. Thus it can be reasonably assumed that all HCl solution samples underwent a similar drift within acceptable limits. All reported measurement results have been corrected for the observed drift to a date in the middle of the measurement period (18.12.2016) in order to calculate the KCRV and the DoEs. It must be noted that the drift correction had only a small effect on the results.
Table 4 Results of the stability test of the HCl solution samples
bottle # date
measured bath
temperature conductivity @ 24.980°C
°C arbit. units from
homogeneity tests
31.10.16 24.980 (mean)
4.9897
17,38 05.12.16 24.971 (mean)
4.9919
12 23.12.16 24.971 4.9935
7 02.02.2017 24.995 4.9960
4,8,31,36,43 09.03.2017 24.997 (mean)
4.9985

CCQM-K36.2016
11 / 24
Figure 4 Stability tests of the HCl solution samples. The error bars indicate the double standard deviation of the (first) homogeneity test. Note that measurement uncertainties of most institutes are significantly larger.
Correspondence with institutes
DFM has been informed that the reported bottle masses of the HCl solution deviated significantly from the masses measured at the coordinating laboratory. It turned out that DFM had reported masses including the aluminium bag and has sent results without the bags later on, which then showed a deviation within the accepted limits.
VNIIFTRI has reported a significantly delayed delivery of the samples (24.01.2017) due to problems with customs clearance. As a consequence, VNIIFTRI could not meet the reporting deadline. When the report finally arrived end of February a few days after the extended deadline, there was no time for further actions. However, the deviation regarding the HCl solution bottle masses matched the mass of the aluminium bag, so VNIIFTRI most probably didn’t remove the bag either. Moreover, the reported conductivity results of the two KCl solution samples measured by VNIIFTRI didn’t correspond to the observed mass differences. In contrast, the conductivities of both samples were equivalent within measurement uncertainty. Consequently, integrity of all samples sent to VNIIFTRI can be assumed.
BFKH and CMI have reported problems to meet the deadline due to illness of staff. INMETRO has reported technical problems. The coordinating institute has agreed to postpone the deadline until 17.02.2017. Eventually all reports have arrived, even though with an acceptably small delay.
y = 6.84333E-05x + 4.98968E+00
4.99
4.99
4.99
4.99
5.00
5.00
5.00
0
20
40
60
80
10
0
12
0
14
0
days
con
du
ctiv
ity
/(m
S/m
)

CCQM-K36.2016
12 / 24
Conducting a preliminarily evaluation the coordinating laboratory identified results showing unusual deviation of some measurement results from the median or unusual measurement uncertainties. Moreover, some of the reports did not contain requested information. The institutes concerned were asked to provide the lacking information and to check their results for calculation or typing errors respectively. No information was given about the magnitude or the sign of the deviation. Subsequently the following institutes have sent revised values: CENAM, GUM, INM, INMETRO, VNIIFTRI, UkrCSM, LATU and CMI. LNE and NMIJ have confirmed the original results. UkrCSM, VNIIFTRI, VNIIM and CMI have sent additional information.
Results of 0.5 S m-1 KCl solution
Reported results
Table 5 lists the reported results. The last column lists the stated source of traceability. Figure 5 shows the results graphically.
Table 5 Reported conductivity results of the 0.5 S m-1 KCl solution
Laboratory i quantity
value i
standard uncertainty
u(i)
coverage factor ki
expanded (95%)
uncertainty
U(i)
cell type source of
traceability
akkr. S/m S/m S/m
VNIIM 0.4970 0.0005 2 0.001 secondary VNIIM RM /
recipe OIML
NMIJ 0.50898 0.00065 2 0.00129 primary/ Jones
SI
GUM 0.50939 0.00014 2 0.00027 primary/ Piston
SI
INMETRO 0.50955 0.00035 2 0.0007 primary/ Piston
SI
INACAL 0.50963 0.00044 2 0.00089 secondary SMU CRM
LATU 0.50966 0.00042 2 0.00084 secondary DFM CRM
VNIIFTRI 0.50995 0.00013 2 0.00026 secondary VNIIFTRI RM/SI
BFKH 0.50996 0.00017 2 0.00034 secondary BFKM RM /
recipe/ OIML
PTB 0.50999 0.00010 2 0.00020 primary/ Piston
SI
SMU 0.51008 0.00012 2 0.00024 secondary SMU RM/recipe
Bradshaw values
DFM 0.51017 0.00022 2 0.00044 secondary DFM CRM / SI
NIM 0.51026 0.00015 2 0.0003 secondary NIM RM / recipe
IUPAC
CMI 0.51029 0.00025 2 0.00050 secondary CMI CRM / SI
LNE 0.510291 0.001026 2 0.002052 primary/ Jones
SI
UkrCSM 0.510459 0.00009 2 0.00018 secondary Ukraine RM / SI
CENAM 0.5105 0.0021 2 0.0041 secondary SMU CRM
INM 0.510569 0.000395 2 0.00079 secondary SMU CRM

CCQM-K36.2016
13 / 24
Figure 5 Reported results of the 0.5 S/m KCl solution. The error bars indicate standard uncertainties.
KCRV calculation
Only independent results have been used for calculation of the key comparison reference value (KCRV) [1]. Hence, values of institutes that have used standards from other participating institutes for cell calibration have been excluded from KCRV calculation. Three candidate KCRV estimates and the corresponding standard uncertainties have been calculated (see appendix A for the formula used): the arithmetic mean, the (external) weighted mean and the median. The candidate KCRVs and their standard uncertainties are shown in table 6. A Chi-square consistency check of the input data for the weighted mean calculation has been performed according to [2]. Since the F13 value is larger than the X12,0.95 value the results must be considered inconsistent with the weighted mean. Because of the deviating VNIIM value, the arithmetic mean does not reflect the bulk of the results and it has an unacceptably large uncertainty. EAWG has decided in the CCQM spring meeting 17. April 2017 in Paris to use the median as KCRV. Even though the result of VNIIM is probably an outlier (for unknown reasons) it has not been excluded, since its effect on the median is negligible.
Hence, the value of the chosen KCRV and its standard uncertainty is
KCRV(0.5 S m-1 KCl) = (0.50999 ± 0.00016) S m-1
0.507
0.508
0.509
0.510
0.511
0.512
0.513
VN
IIM
NM
IJ
GU
M
INM
ET
RO
INA
CA
L
LA
TU
VN
IIF
TR
I
BF
KH
PT
B
SM
U
DF
M
NIM
CM
I
LN
E
UkrC
SM
CE
NA
M
INM
co
nd
uctivity o
f K
Cl so
lution
/
(S/m
)
0.497
CCQM-K36.2016
14 / 24
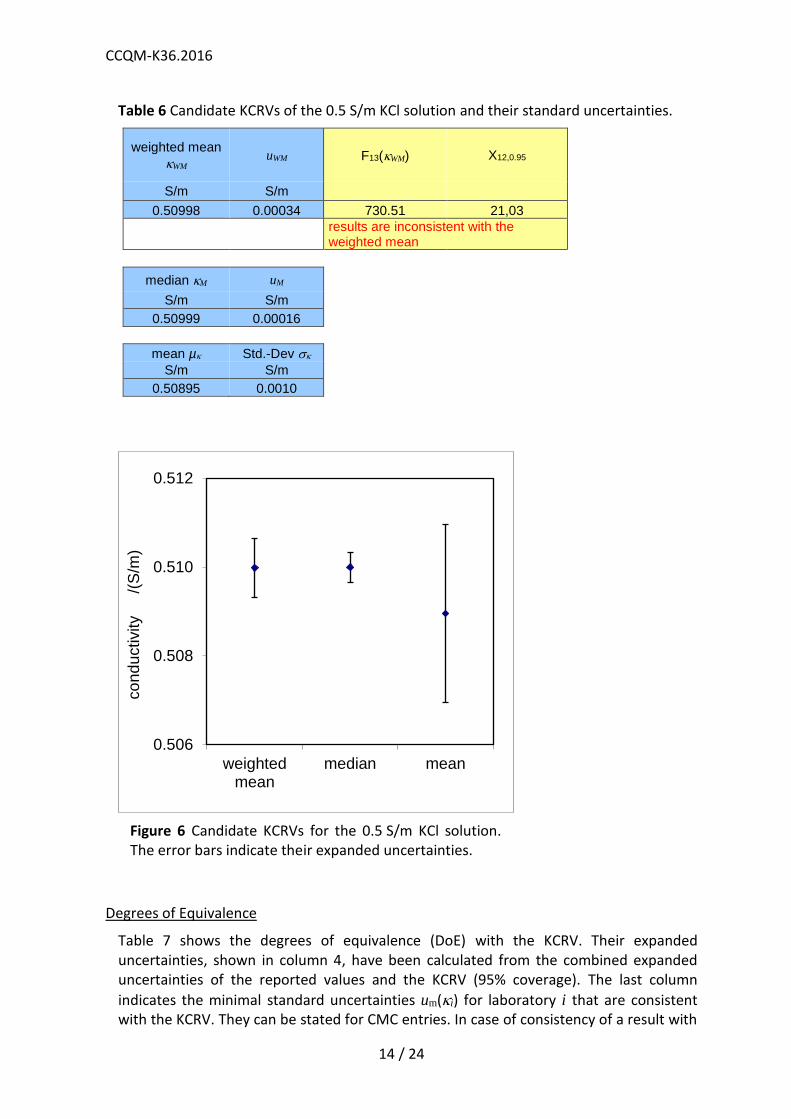
Table 6 Candidate KCRVs of the 0.5 S/m KCl solution and their standard uncertainties.
weighted mean
WM uWM F13(WM) X12,0.95
S/m S/m
0.50998 0.00034 730.51 21,03
results are inconsistent with the weighted mean
median M uM
S/m S/m
0.50999 0.00016
mean µ Std.-Dev
S/m S/m
0.50895 0.0010
Figure 6 Candidate KCRVs for the 0.5 S/m KCl solution. The error bars indicate their expanded uncertainties.
Degrees of Equivalence
Table 7 shows the degrees of equivalence (DoE) with the KCRV. Their expanded uncertainties, shown in column 4, have been calculated from the combined expanded uncertainties of the reported values and the KCRV (95% coverage). The last column
indicates the minimal standard uncertainties um(i) for laboratory i that are consistent with the KCRV. They can be stated for CMC entries. In case of consistency of a result with
0.506
0.508
0.510
0.512
weightedmean
median mean
co
nd
uctivity
/(S
/m)
CCQM-K36.2016
15 / 24
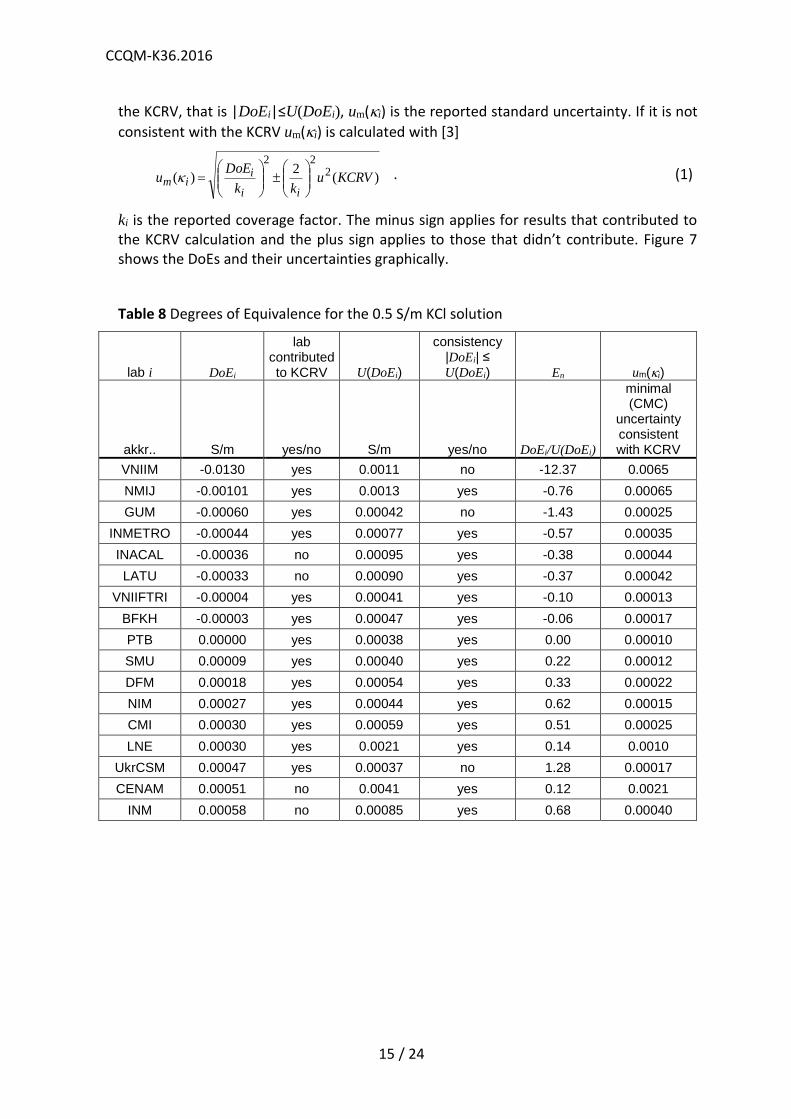
the KCRV, that is |DoEi|≤U(DoEi), um(i) is the reported standard uncertainty. If it is not
consistent with the KCRV um(i) is calculated with [3]
)(2
)( 222
KCRVukk
DoEu
ii
iim
. (1)
ki is the reported coverage factor. The minus sign applies for results that contributed to the KCRV calculation and the plus sign applies to those that didn’t contribute. Figure 7 shows the DoEs and their uncertainties graphically.
Table 8 Degrees of Equivalence for the 0.5 S/m KCl solution
lab i DoEi
lab contributed to KCRV U(DoEi)
consistency |DoEi| ≤ U(DoEi) En um(i)
akkr.. S/m yes/no S/m yes/no DoEi/U(DoEi)
minimal (CMC)
uncertainty consistent with KCRV
VNIIM -0.0130 yes 0.0011 no -12.37 0.0065
NMIJ -0.00101 yes 0.0013 yes -0.76 0.00065
GUM -0.00060 yes 0.00042 no -1.43 0.00025
INMETRO -0.00044 yes 0.00077 yes -0.57 0.00035
INACAL -0.00036 no 0.00095 yes -0.38 0.00044
LATU -0.00033 no 0.00090 yes -0.37 0.00042
VNIIFTRI -0.00004 yes 0.00041 yes -0.10 0.00013
BFKH -0.00003 yes 0.00047 yes -0.06 0.00017
PTB 0.00000 yes 0.00038 yes 0.00 0.00010
SMU 0.00009 yes 0.00040 yes 0.22 0.00012
DFM 0.00018 yes 0.00054 yes 0.33 0.00022
NIM 0.00027 yes 0.00044 yes 0.62 0.00015
CMI 0.00030 yes 0.00059 yes 0.51 0.00025
LNE 0.00030 yes 0.0021 yes 0.14 0.0010
UkrCSM 0.00047 yes 0.00037 no 1.28 0.00017
CENAM 0.00051 no 0.0041 yes 0.12 0.0021
INM 0.00058 no 0.00085 yes 0.68 0.00040

CCQM-K36.2016
16 / 24
Figure 7 Degrees of equivalence and the corresponding expanded uncertainties.
Results of 5 mS m-1 HCl solution
Reported results
Table 9 lists the reported results for the 5 mS m-1 HCl solution. The third column shows the results corrected for drift as described above. Figure 8 shows the reported results and the drift corrected results graphically. Obviously, the conductivity drift during storage was small and the effect on the KCRV and the DoEs is insignificant compared to the uncertainty of the KCRV
(0.03% vs 0.12%). Some institutes have measured more than one bottle at different dates. In this case a mean date has been used for drift correction (7th column). The 8th column lists times that have passed between filling of the cells and the actual measurements. The 9th column lists if the corresponding institute has corrected for a short-term drift during the measurement.
-0.005
-0.004
-0.003
-0.002
-0.001
0.000
0.001
0.002
0.003
0.004
0.005
VN
IIM
NM
IJ
GU
M
INM
ET
RO
INA
CA
L
LA
TU
VN
IIF
TR
I
BF
KH
PT
B
SM
U
DF
M
NIM
CM
I
LN
E
UkrC
SM
CE
NA
M
INM
Deg
ree o
f E
qu
ivale
nce
/
(S/m
)

CCQM-K36.2016
17 / 24
Table 9 Reported conductivity results of the 5 mS m-1 HCl solution
lab i quantity
value i
quantity
value i
(drift
corrected)
standard uncertainty
u(i)
coverage factor ki
expanded (95%)
uncertainty
U(i)
date measured
(mean)
time between filling and
measurement
drift during measure-
ment corrected
cell (*) source of traceability
abbr. mS/m mS/m mS/m mS/m min
NMIJ 4.8437 4.8444 0.0126 2 0.0253 9.12.16 720 n/m primary SI
INM 4.948 4.9484 0.006 2 0.012 13.12.16 20 no secondary SMU CRM
GUM 4.9723 4.9723 0.0037 2 0.0074 18.12.16 50 yes primary SI
CMI 4.9792 4.9766 0.0042 2 0.0084 25.1.17 120 n/m secondary CMI RM/SI
SMU 4.9778 4.9796 0.0015 2 0.003 22.11.16 30 no secondary SMU CRM / recipe Bradshaw values
INACAL 4.9808 4.9819 0.0205 2 0.041 2.12.16 n/m n/m secondary SMU CRM
BFKH 4.9843 4.9835 0.00191 2.52 0.00483 30.12.16 30 n/m secondary BKEH RM/recipe OIML
NIM 4.9895 4.9875 0.0020 2 0.0040 17.1.17 120 no secondary NIM RM/recipe IUPAC
LNE 4.9868 4.9877 0.00632 2 0.01264 6.12.16 130 n/m primary SI
DFM 4.9957 4.9936 0.0027 2 0.0055 18.1.17 15 yes secondary DFM RM/SI
PTB 4.9926 4.9959 0.0015 2 0.003 31.10.16 130 yes secondary PTB RM / SI
UkrCSM 5.007 5.0046 0.0015 2 0.003 23.1.17 40 yes secondary UkrCSM RM/SI
LATU 5.011 5.0084 0.013 2 0.026 26.1.17 40 n/m secondary DFM CRM
INMETRO 5.0245 5.0219 0.0054 2 0.0108 26.1.17 432 yes primary SI
VNIIM 5.035 5.0330 0.010 2 0.020 16.1.217 200 n/m secondary VNIIM RM/recipe OIML
CENAM 5.039 5.0375 0.043 2 0.086 10.1.17 120 n/m secondary SMU CRM
VNIIFTRI 5.099 5.0957 0.005 2 0.010 5.2.17 4 n/m secondary VNIIFTRI RM/SI
n/m = “not mentioned”
(*) for the kind of primary cell type see table 5

CCQM-K36.2016
18 / 24
Figure 8 Results of the 5 mS/m HCl solution. The solid diamonds indicate the results corrected for (storage) drift, while the void squares show the originally reported values. The error bars indicate standard uncertainties.
KCRV calculation
Three candidate KCRV estimates and the corresponding standard uncertainties have been calculated (see appendix A for the formula used): the arithmetic mean, the (external) weighted mean and the median. The results are shown in table 6. A Chi-square consistency check of the input data for the weighted mean calculation has been performed [2]. Since the F13 value is larger than the X12,0.95 value the results must be considered inconsistent with the weighted mean. Basically, all candidates provide compatible KCRV estimates, whereas the median is more robust with respect to outliers. Therefore, CCQM-EAWG has decided in the meeting held 17. April 2017 in Paris to use the median as KCRV.
Hence, the value of the chosen KCRV and its standard uncertainty is
KCRV(5 mS m-1 HCl) = (4.9877 ± 0.0060) mS m-1
4.92
4.94
4.96
4.98
5.00
5.02
5.04
5.06
5.08
5.10
NM
IJ
INM
GU
M
CM
I
SM
U
INA
CA
L
BF
KH
NIM
LN
E
DF
M
PT
B
UkrC
SM
LA
TU
INM
ET
RO
VN
IIM
CE
NA
M
VN
IIF
TR
I
co
nd
uctivity o
f H
Cl so
lution
(m
S/m
)
reported
drift corrected
4.844

CCQM-K36.2016
19 / 24
Table 10 Estimates for the KCRV of the 5 mS/m HCl solution
weighted mean
WM uWM F13(WM) X12,0.95
mS/m mS/m
4.9924 0.0055 827.00 21.03
results are inconsistent with the weighted mean
median M uM
mS/m mS/m
4.9877 0.0060
mean µ Std.-Dev
mS/m mS/m
4.990 0.015
Figure 9 Various candidate KCRV estimates for the 5 mS/m HCl solution. The error bars indicate their expanded uncertainties (k=2).
Degrees of Equivalence
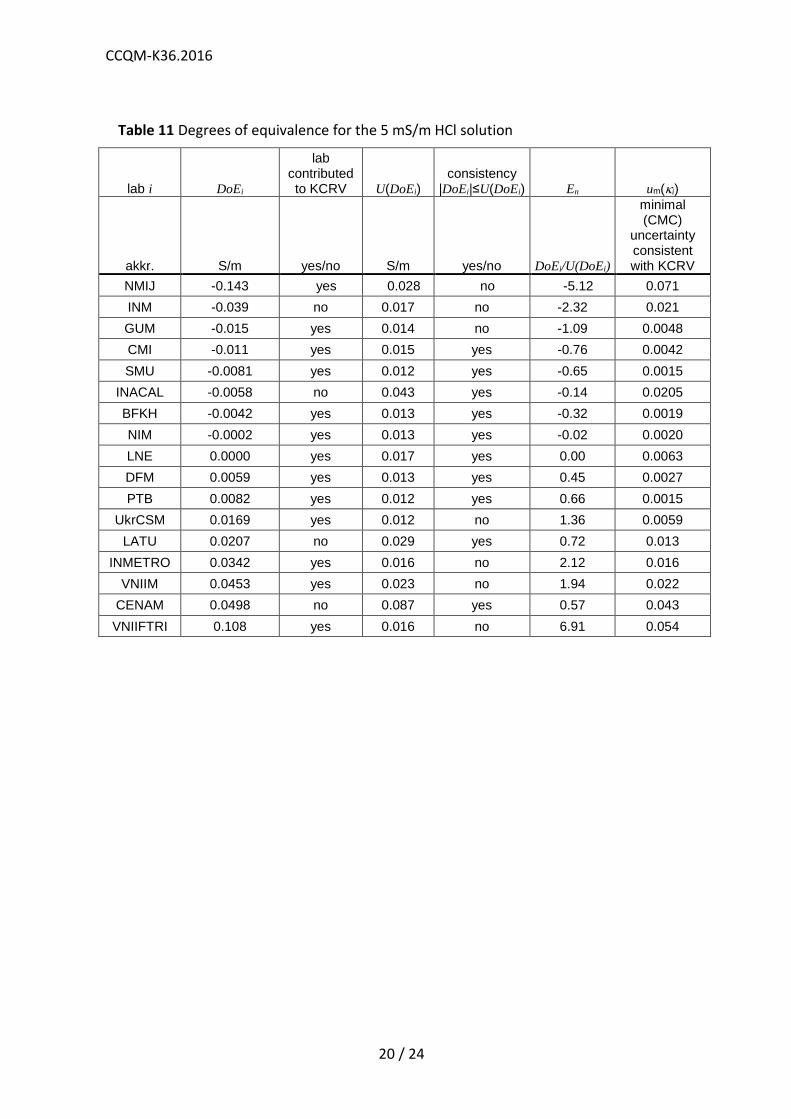
Table 11 shows the degrees of equivalence based on the median. Their expanded uncertainties, shown in column 4, have been calculated from the combined expanded uncertainties of the reported values and the KCRV (95% coverage). The last column
indicates the minimal uncertainties um(i) that are consistent with the KCRV. They can be
stated for CMC entries. In case of consistency with the KCRV um(i) is the reported standard uncertainty. In case it is not consistent with the KCRV it is calculated with eq (1). Figure 10 shows the DoEs and their uncertainties graphically.
4.95
4.96
4.97
4.98
4.99
5.00
5.01
5.02
5.03
weightedmean
median mean
co
nd
uctivity
/(m
S/m
)
CCQM-K36.2016
20 / 24
Table 11 Degrees of equivalence for the 5 mS/m HCl solution
lab i DoEi
lab contributed to KCRV U(DoEi)
consistency |DoEi|≤U(DoEi) En um(i)
akkr. S/m yes/no S/m yes/no DoEi/U(DoEi)
minimal (CMC)
uncertainty consistent with KCRV
NMIJ -0.143 yes 0.028 no -5.12 0.071
INM -0.039 no 0.017 no -2.32 0.021
GUM -0.015 yes 0.014 no -1.09 0.0048
CMI -0.011 yes 0.015 yes -0.76 0.0042
SMU -0.0081 yes 0.012 yes -0.65 0.0015
INACAL -0.0058 no 0.043 yes -0.14 0.0205
BFKH -0.0042 yes 0.013 yes -0.32 0.0019
NIM -0.0002 yes 0.013 yes -0.02 0.0020
LNE 0.0000 yes 0.017 yes 0.00 0.0063
DFM 0.0059 yes 0.013 yes 0.45 0.0027
PTB 0.0082 yes 0.012 yes 0.66 0.0015
UkrCSM 0.0169 yes 0.012 no 1.36 0.0059
LATU 0.0207 no 0.029 yes 0.72 0.013
INMETRO 0.0342 yes 0.016 no 2.12 0.016
VNIIM 0.0453 yes 0.023 no 1.94 0.022
CENAM 0.0498 no 0.087 yes 0.57 0.043
VNIIFTRI 0.108 yes 0.016 no 6.91 0.054

CCQM-K36.2016
21 / 24
Figure 10 Degrees of equivalence and the corresponding expanded uncertainties of the 5 mS/m HCl solution.
Effect of Carbon Dioxide
HCl has been chosen for this comparison to supress the effect of CO2 on the conductivity measurement result. Aqueous solutions not preventing the dissociation of dissolved CO2, such as commonly used aqueous KCl and NaCl conductivity standards, can be subject to significant conductivity variation in the conductivity range below 15 mS m-1 if exposed to ambient air. Common measurement practice does not avoid such air contact, since this would require immense efforts. The contribution of dissolved and subsequently dissociated CO2 to the conductivity of such solutions is around 0.1 mS m-1 under equilibrium conditions [4]. Hence, the uncertainty budget must account for this kind of solution instability. In fact, it is only the change of the amount of hydrogen carbonate and carbonate ions during the measurement process that contributes to the uncertainty. This uncertainty contribution is difficult to be estimated in general since the change depends on the partial CO2 pressure present at the site of measurement, the usually unknown carbonate ion concentrations in the solution and the time the solution is exposed to air during filling and measurement. Consequently, it might be negligible in one measurement and substantial in another. However, under typical operation procedures it is reasonable to assume that the conductivity change due to CO2 is not larger than ±0.02 mS m-1 with respect to the initial value before opening the bottle. Thus, a standard uncertainty contribution of 0.012 mS m-1 should be generally considered in the combined standard uncertainty of conductivity measurements of pure aqueous electrolyte solutions.
-0.200
-0.100
0.000
0.100
0.200
NM
IJ
INM
GU
M
CM
I
SM
U
INA
CA
L
BF
KH
NIM
LN
E
DF
M
PT
B
UkrC
SM
LA
TU
INM
ET
RO
VN
IIM
CE
NA
M
VN
IIF
TR
I
Deg
rees o
f E
qu
ivale
nce
/(
mS
/m)

CCQM-K36.2016
22 / 24
“How Far Does The Light Shine” statement
The results of this KC are considered representative for conductivity measurement capabilities of stable aqueous electrolyte solutions in the conductivity range 0.15 S m-1 to 1.5 S m-1 and 1.5 mS m-1 to 15 mS m-1, respectively. For the reasons described in the previous section an uncertainty contribution of 0.012 mS m-1 must be considered in the minimal
uncertainty umCO2(i) permissible for CMCs of aqueous solutions, having conductivities
15 mS m-1, in order to account for the effect of CO2 on conductivity:
𝑢𝑚𝐶𝑂2(𝜅𝑖) = √𝑢𝑚2 (𝜅𝑖) + (0.012
𝑚𝑆
𝑚)
2
(2)
um(i) corresponds to the value of laboratory i given in table 11.
This statement particularly holds for aqueous, low conductivity KCl and NaCl conductivity standard solutions.
Traceability statement
During the spring meeting in 2016 EAWG has decided to accept IUPAC Technical Report 2001 [4] as metrological reference for the traceability of conductivity measurement results for practical reasons. Therein conductivity values and their uncertainties are assigned to KCl solutions, prepared according to a defined recipe. An evaluation of previous key comparisons and pilot studies has shown no evidence for a significant deviation in the DoEs of such results compared to those traceable to the SI. It was also decided that this statement has to be verified based on the results of every future conductivity key comparison in order to retain the link of such measurements to the SI. Figure 9 shows the normalised DoEs of all results contributing to the KCRV. No significant deviations of recipe based values are observed. Hence, the statement is still considered valid.
Figure 11 En values (DoEs normalized with the corresponding U(DoE)). Solid diamonds indicate results traceable to the SI, void diamonds those traceable to [4]. |En| ≤ 1 indicates consistency with the KCRV.
-2
-1
0
1
2
3
0 2 4 6 8 10 12 14
En
v
alu
es o
f H
Cl re
sults
arbitrary number
-2
-1
0
1
2
0 2 4 6 8 10 12 14
En
va
lue
s o
f K
Cl re
su
lts
arbitrary number

CCQM-K36.2016
23 / 24
References
[1] M. G. Cox, "The evaluation of key comparison data," Metrologia, vol. 39, pp. 589-595 (2002).
[2] M. G. Cox, "The evaluation of key comparison data: determining the largest consistent subset," Metrologia, vol. 44, pp. 187-200 (2007).
[3] M.G. Cox, P. Harris, M. Milton, “Method for determining acceptable CMCs to ensure consistency with KC results, 2009, unpublished
[4] K. W. Pratt, W. F. Koch, Y. C. Wu, and P. A. Berezansky, "Molality-based primary standards of electrolytic conductivity," Pure Appl. Chem., vol. 73, pp. 1783-1793 (2001).
CCQM-K36.2016
24 / 24
2
2
1
1
i
i
i
u
uw
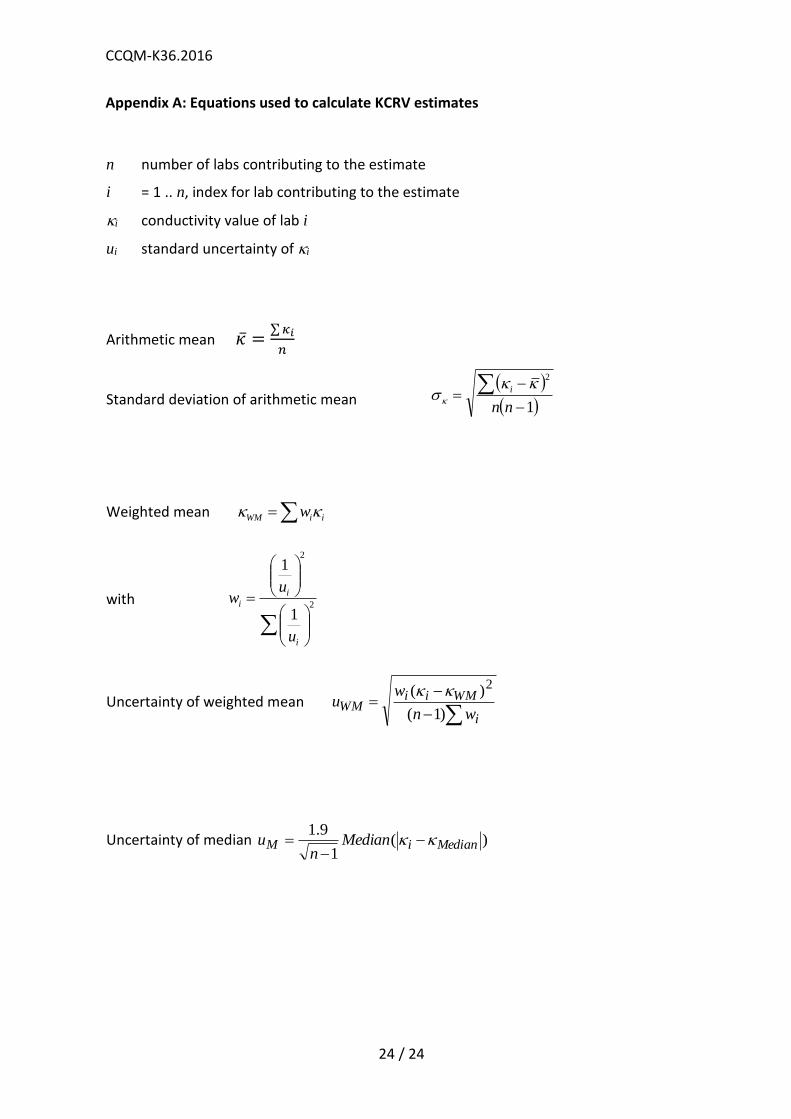
Appendix A: Equations used to calculate KCRV estimates
n number of labs contributing to the estimate
i = 1 .. n, index for lab contributing to the estimate
i conductivity value of lab i
ui standard uncertainty of i
Arithmetic mean �̅� =∑ 𝜅𝑖
𝑛
Standard deviation of arithmetic mean
Weighted mean iiWM w
with
Uncertainty of weighted mean
i
WMiiWM
wn
wu
)1(
)( 2
Uncertainty of median )(1
9.1MedianiM Median
nu
1
2
nn
i