Key Challenges, Opportunities and Strategies for Carbon ...
56
Key Challenges, Opportunities and Strategies for Carbon Capture and Storage Deployment Presentation to MIT Club of Washington DC March 22, 2016 Victor Der, Executive Advisor - Americas Global CCS Institute
Transcript of Key Challenges, Opportunities and Strategies for Carbon ...

Key Challenges, Opportunities andStrategies for Carbon Capture and
Storage Deployment
Presentation to MIT Club of Washington DCMarch 22, 2016Victor Der, Executive Advisor - AmericasGlobal CCS Institute

What is Carbon Capture and Sequestration?
Ocean
Capture and storage of CO2 and other greenhouse gases thatwould otherwise be emitted to the atmosphere
Terrestrial CaptureCO2 absorbed from air
Point Source Capture
• Power Plants
• Ethanol Plants
• Cement
• Steel
• Refineries
• Natural GasProcessing
Terrestrial StorageTrees, grasses, soils
Geologic Storage
• Saline formations
• Depleted oil/gas
• Unmineable coal
•Other: basalts,shalesSandstone

CCS is a vital element of a low-carbon energy future
Source: IEA Energy TechnologyPerspectives (2015)
A transformation in how we generate and use energy is needed
GtC
O2
emis
sion
s
6DS
2DS

Mitigation costs more than double in scenarios with limitedavailability of CCS
*Percentage increase in total discounted mitigation costs (2015-2100) relative to default technology assumptions – median estimate
+ 7% + 6%
+ 64%
+ 138%
Baseline costwith all mitigationoptions utilized
Source: IPCC Fifth Assessment Synthesis Report, Summary for Policymakers, November 2014.
Cost increase underlimited technologyavailability scenarios
50
100
150
Perc
enta
ge*
Nuclear phase out Limited solar/wind
Limited bioenergy
No CCS

Technology – Market – Policy DynamicsMARKET
Pull and SkewedBy Policy
TECHNOLOGY
Pushes Marketsand GuidesPolicy
POLICY/REGS
“Pubic Good” byShaping Market &Enabled by availableTechnology
• Federal Government– Support R&D
New TechnologyOptions
– Remove barriers& Lower hurdlesfor the publicgood.
– ProvideIncentives &Framework
BUSINESS CASEFOR CCS
FINANCEABILITYACCEPTANCE

Challenges to CCS Deployment

7
Key Challenges to Carbon Capture and Storage
• Capture Technology– Existing Plants– New Plants (PC)– IGCC
• Cost of CCS
• Sufficient Storage Capacity
• Permanence
• Best Practices– Storage Site
Characterization– Monitoring/Verification– Site Closure
• Regulatory Framework– Permitting– Treatment of CO2
• Policy incentives
• Infrastructure
• Human Capital
• Legal Framework– Liability– Ownership
• pore space• CO2
• Public Acceptance(NIMBYà NUMBY)
Technical Issues Legal/Social Issues
DOE projects helping to address bothcategories of issuesSource: US DOE

8
COMMERCIAL GAPS HAVE TO BE ADDRESSED
Illustrative Coal Fired Power Plant + CCS
NPV
inU
S$Bi
llion
s
4
2
0
-2ForecastedElectricityRevenues
OPEXBasePlant
CAPEXBasePlant
CommercialGap
CAPEXCCS
OPEXCCS
Bridge?

9
CCS competitiveness against other low carbonalternatives in Europe in 2012-17
CoE Low Carbon technologies – New PP over next 5 years
7986
0
50
100
150
200
250
300
Hardcoal wCCS Post
2017
Gas CCPPw CCS2017
Nuclear Hydro Geo-thermal
WindOnshore
WindOffshore
SolarThermal
Solar PV0
50
100
150
200
250
300
€ / MWh Reference case
Up to 45€cents/kWh
Low caseCSP Tower with
storage(82 for Ref CCS Oxy)
Source : Alstom analysis 2012. CCS w Post amine 2017 costs, including on shore T&S & CO2 price (Flue GasRecirculation for CCS Gas CC) CoE do not include “externalities” of Intermittent power (Back-up cost, balancingcost, grid enhancement if required)
Under realistic assumptions and with a conservative variation range, CCS is already inthe “mix” of low carbon alternatives
EUROPE

Investments in Clean EnergyDriven by Policy Incentives
Clean energy investment* between 2004-2013 ($USD):
CCS Investment: $20 B
All Clean EnergyInvestment:$ 1929 B
0
100
200
300
400
500
600
700
800
900
1000
1100
1200
1300
1400
1500
1600
1700
1800
1900
2000
CCS All clean energy
USDbillion
20
1929
* Includes technology development, projects, M&A. Source: BNEF.
Data source: Bloomberg New Energy Finance as shown in IEA presentation “Carbon Captureand Storage: Perspectives from the International Energy Agency”, presented at National CCSweek in Australia, September 2014.

A significant task within one generation
44 large-scale CCS projects -combined capture capacity of80 Mtpa*:
• 22 projects in operation orconstruction (40 Mtpa)
• 10 projects in advancedplanning, five nearing FID(15 Mtpa)
• 12 projects in earlier stagesof planning (25 Mtpa)
OECDNon-OECD
4,000 Mtpa of CO2captured by CCS by 2040
(IEA 450 Scenario)**
40 Mtpa
Global Statusof CCS: 2015
*Mtpa = million tonnes per annum **Source: IEA, Energy Technology Perspectives (2015).

Pathway for Technology CommercializationTRL 2 Successes
from FWP,SBIR/STTR, ARPA-E
Transfer to Office ofMajor Demonstrations
Scope ofCapture Program
“Valley of Death” for Technologies
Source: US DOE

Carbon Capture

CO2 Capture Optionsfor Fossil Energy Generators
Source: Cost and Performance Baseline for Fossil Energy Power Plants study,Volume 1: Bituminous Coal and Natural Gas to Electricity; NETL, May 2007.
Pulverized Coal (PC)Post-combustion
PC Oxy-combustion
Gasification (IGCC)Pre-combustion
Technologies alsoapplicable to:
• Industrial sources(cement, refinery,chemical…)
• NGCC power plants

1st Generation CO2 Capture –Impact on Plant Cost
Source:Cost and Performance Baseline for Fossil Energy Power Plants study, Volume 1: BituminousCoal and Natural Gas to Electricity; NETL, Nov. 2010 revision.Unpublished 2011 update to Pulverized Coal Oxycombustion Power Plants, Volume 1:Bituminous Coal to Electricity; NETL, Aug. 2008 revision.
No
Cap
ture
With
Cap
ture
0
20
40
60
80
100
120
140
IGCC Post-Combustion Oxy-combustion NGCC
77
59 59 59
112107
9686
Cost
ofEl
ectr
icity
,$/
MW
h
Base Plant
With CO2 Capture
IGCC Post-Combustion
Oxy-Combustion
NGCC

1st Generation CO2 Capture –Impact on Plant Efficiency
0
10
20
30
40
50
60
Avg IGCC Avg IGCCw/CO2Capture
PC-Sub PC-Subw/CO2Capture
PC-Super PC-Superw/CO2Capture
PC-Super PC-Superw/ Oxy-Comb.
NGCC NGCCw/CO2Capture
40
3237
26
39
28
39
29
50
43
Net
Effic
ienc
y(H
HV)
Gasification Pulverized Coal Combustion Natural GasCombined Cycle
Source:Cost and Performance Baseline for Fossil Energy Power Plants study, Volume 1: BituminousCoal and Natural Gas to Electricity; NETL, Nov. 2010 revision.Unpublished 2011 update to Pulverized Coal Oxycombustion Power Plants, Volume 1:Bituminous Coal to Electricity; NETL, Aug. 2008 revision.
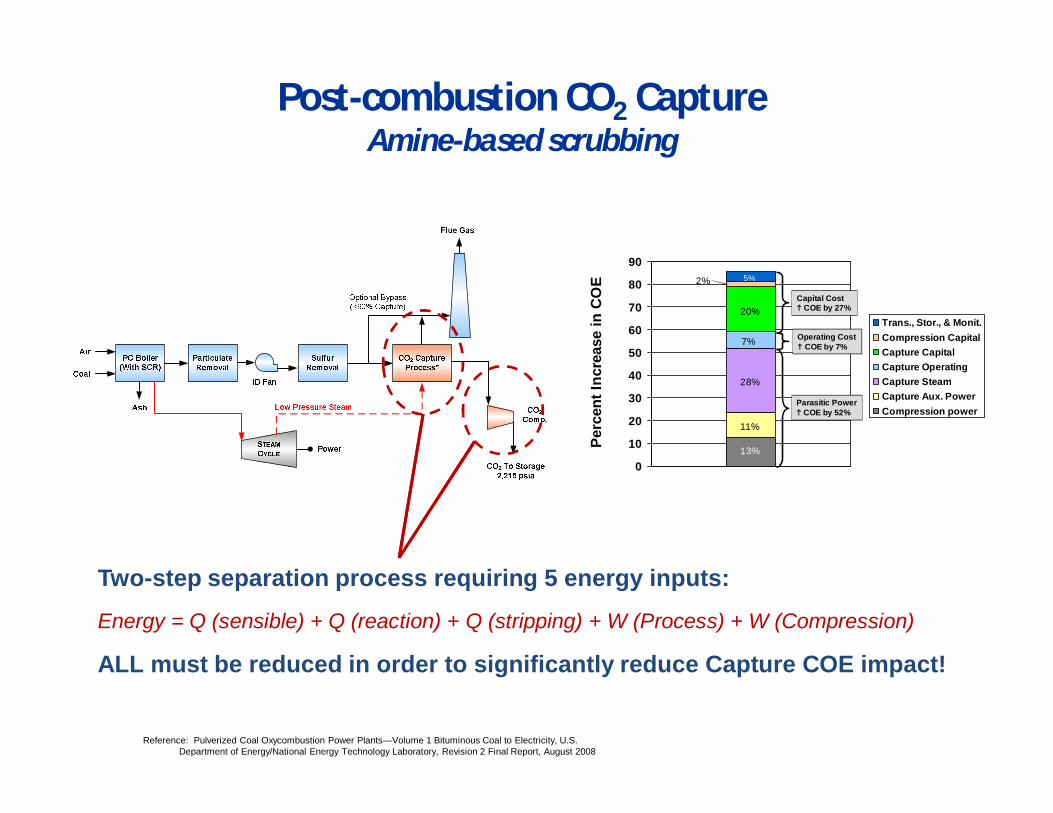
Post-combustion CO2 CaptureAmine-based scrubbing
Reference: Pulverized Coal Oxycombustion Power Plants—Volume 1 Bituminous Coal to Electricity, U.S.Department of Energy/National Energy Technology Laboratory, Revision 2 Final Report, August 2008
Two-step separation process requiring 5 energy inputs:
Energy = Q (sensible) + Q (reaction) + Q (stripping) + W (Process) + W (Compression)
ALL must be reduced in order to significantly reduce Capture COE impact!
0
10
20
30
40
50
60
70
80
90
Perc
entI
ncre
ase
inC
OE
Trans., Stor., & Monit.Compression CapitalCapture CapitalCapture OperatingCapture SteamCapture Aux. PowerCompression power
13%
11%
28%
7%
20%
5%2%
Parasitic Powerh COE by 52%
Operating Costh COE by 7%
Capital Costh COE by 27%

Pressurized Oxy-CombustionAllam Cycle – sCO2 Working Fluid

Carbon StorageAnswering Key Questions:
Safe & Stable and SufficientStorage Capacity

Lines of Evidence Suggesting GeologicalStorage Will Be Secure
• Natural CO2 reservoirs• Oil and gas reservoirs• 70 CO2 EOR projects in U.S.• 50 acid gas injection sites in North America• Numerical simulation of geological systems• Current Large-Scale CO2 storage projects
“At least 99%+ retention is likely for wellselected and managed storage sites”
Bullets Based on Rubin, CMU; Quote from IPCC Special Report on Carbon Capture & Storage

DRAFT DELIBERATIVE – DO NOT CITE, QUOTE OR DISTRIBUTE
CO2 Geologic Storage – Risk Profile• CO2 may be permanently trapped in subsurface over time
– Trapping mechanisms reduce CO2 mobility
– Reduces potential to impact USDWs or to return to atmosphere
• Relative project risks at zero before injection
• Increasing during injection and subsiding over time followingcessation of injection
From Benson (2007)
21

CO2 as a supercritical fluid• CO2 increases in density with depth, becomes a supercritical fluid
and takes up much less space in the tiny pore spaces in storagerocks. The blue numbers show the volume of CO2 at each depthcompared to a volume of 100 units at the surface.(Image source CO2CRC (http://www.co2crc.com.au/imagelibrary/); CO2 phase diagram (Bielinski2006)

Carbon Storage – How does it work?Storage mechanisms vary by target class; generally multiple
processes which improve over time•Physical trapping
•Residual phase trapping
•Solution/MineralTrapping
•Gas adsorption•For organic minerals only (coals,oil shales)
1.0MgCO30.2NaAlCO3(OH)2
Source: S Benson, LBNL

1. Solubility TrappingCO2(g) CO2(aq)
CO2(aq) + H2O H2CO3(aq)
2. Ionic TrappingH2CO3(aq) HCO3
-(aq) + H+
HCO3-(aq) CO3
2-(aq) + H+
3. Mineral TrappingCO3
2-(aq) + Ca2+ CaCO3(s)
HCO3-(aq) + Ca2+ CaCO3(s) + H+
Sequence of Geochemical Reactions betweenCO2 and Formation Water and Rocks
Sequence of Geochemical Reactions betweenCO2 and Formation Water and Rocks

Height of Willis Tower(Sears Tower)
Roof is 1,451 feet
Antenna is 1,730 feet
Porous injection Zone is400 feet thick)
Geologic Storage – How Deep?Example Formation: Mount Simon – Thickness 1,506 feet
WashingtonMonument is 555
feet tall
Depth of Mt. Simon
This example startsat 5,550 feet
(over a mile deep)
Slide adapted from slide courtesy of: William R. RoyUniversity of Illinois

26
North American CO2 Storage Potential(Billion Metric Tons)
Sink Type Low High
Saline Formations 1,653 20,213
Unmineable Coal Seams 60 117Oil and Gas Fields 143 143
U.S. Emissions ~ 6 Billion Tons CO2/yr (all sources)
Hundreds toThousands ofYears Storage
Potential
Sufficient Capacity for Secure Storage Emerging
Saline Formations
Oil and Gas Fields Unmineable Coal Seams
ConservativeResource
Assessment

OpportunitiesCarbon Utilization andStorage/Sequestration

Longer than expected:EOR volumes estimates have grown
• Many 10’s of billions producible (justUS)
• 100’s of billions worldwide• Provide revenues: break even for
capital retrofit costs in 7-8 years!• Conventional EOR uses 2-3 tons CO2
/bbl
Billio
nBa
rrels
88.1
47.4
2.30
20
40
60
80
100
TechnicallyRecoverable
EconomicallyRecoverable*
AlreadyProduced/
Proven
Domestic Oil Resources
ARI, 2008
Millio
nMe
tricT
ons
Total U.S.CO2 Demand
NewLower-48
CO2 Demand
Net Lower-48From CapturedCO2 Emissions
02,0004,0006,0008,000
10,00012,00014,000 12,500
9,700
7,500
2,800* 2,200**
Market CO2 demand
>25B tons storage potential from conventional EORThat’s ½ the US coal fleet for ~20 yearsSource: US DOE

Non-EOR CCUS (Utilization)CO2 Conversion to Products
CO2 as Feedstock – depends on market size,competing feedstock costs, and process cost
Plastics, Chemicals, and other products
Mineralization Processes with slate of chemicals
Bio-based Fuels and Additives: ethanol, butanols,bio-diesel
Bio-Energy with CCS
Co-production of desalinated water extraction

Skyonic “Skymine” Project, San Antonio, TXOperational !!
75,000 tons/y CO2 captured - >200,000 tons avoidedSource: US DOE

Co-produced freshwater as utilization
31
Bourcier et al., 2011
While Reducing Risks of CO2 Geologic Injection andStorage via Pressure Reduction in saline formations

CCS Statusand RDD&D Strategy

Large Geological Storage Projects UnderwayEach Stores > 1 Million Tonnes CO2/yr
Photos from Staoil Website
Sleipner Project- Norway• CO2 removed from natural gas produced
on production platform in North Sea• Injection into saline reservoir under sea• Started 1996
In Salah Gas Plant - Algeria• Injection into saline formation
downdip of gas reservoir• 3 wells• Started 2004
Weyburn – Saskatchewan• EOR project with 50 wells• Uses CO2 from coal gasification plant• Started 2000

DOE R&D Goals
0% Reduction
20%Reduction
30%Reduction
40
50
60
70
80
90
100
110
IGCC orSupercritical PC
2nd-Generation Technology TransformationalTechnology
COE
Relat
iveto
Toda
y'sCo
alwi
thCa
ptur
e,%
SOTA FY20-25 Demo FY25-30 Demo
Cost of Electricity Reduction TargetsCost of Electricity Reduction Targets Carbon Capture ProgramObjectives:
• Large-scale pilot validation• 2nd generation by 2020• Transformational by 2025
• Demonstration 5 years after eachlarge pilot phase
• Meet 20% reduction by advancedsolvents and systems; membranes,and sorbents
• Meet 30% goal through disruptiveresearch in novel materials,advanced manufacturing, processintensification, electro chemical,and other advanced processes
Source: US DOE

Coal R&D: Integrated Solutions are Essential to meetObjectives
Source: US DOE
Advanced Combustion
CO2 StorageAdvanced CO 2 Captureand Compression
q Solventsq Sorbentsq Membranesq Hybridq ProcessIntensificationq CryogenicCapture
q Pressurizedq O2 membraneq Chemical
loopingq USC Materials
q Carbon Utilization(EOR)
q Infrastructure(RCSPs)
q Geological Storageq Monitoring,
Verification andAccounting
q Gasificationq Turbinesq Supercritical CO2q Direct Power Extraction
Efficiencies > 45%i Capital Cost by 50%<< $40/tonne CO2 Captured
Near-zero GHGsNear-zero criteria pollutantsNear-zero water usage
Advanced EnergySystems
5 MWE Oxycombustion Pilot Advanced Turbines

Advanced CO2 Solvents
R&D approaches• Ionic liquids• Amino Acids• Potassium carbonate/enzymes• Phase change solvents• Novel high capacity oligomers• Carbonates (AC/ABC, potassium)
R&D Focus• High CO2 working capacity, optimalDHrxn, low heat capacity, non-volatile
• Fast kinetics (enzymes)• Thermally and chemically stable• Non-corrosive, environmentally safe• Low cost solvent and process MOC*• Improved mass transfer systems• Match process to solvent
Advantages• 70+ years acid gas scrubbing experience• Allows good heat integration and
management (useful for exothermic rxns)• Selective capture from low partial
pressure CO2 streams
Challenges• Dilute chemical solutions due to
viscosity and corrosion• High regeneration energy (aqueous
phase sensible heating, stripping)• DHrxn and kinetics tradeoff
*Materials of construction

Solid CO2 Sorbents
R&D Approaches• Supported amines (silica, clay)• Metal zeolites, alumina• Carbon-based• Carbonates• Sorbent systems (CCSI4)
Advantages• Some experience with solid systems
(TSA1-dehumidification, PSA2-H2 sep.,VSA3 for oxygen separation)
• Low regeneration energy (no strippingsteam, low heat capacity substrates)
• High equilibrium capacity—high surfacearea
• Hybrid sorbents (Shift + Capture)
Challenges• Heat management• Durability (attrition, chemical stability)• Maintaining high mass transfer• System design (pressure drop & solids
transport)• Scale-up
R&D Focus• High CO2 working capacity, low heat
capacity, fast kinetics (enzymes)• Durability: thermally, chemically and
physically• Non-corrosive, environmentally safe• Low cost sorbent and process MOC1
• Match process to sorbent (system)• Hybrid (Shift + Capture) for IGCC
1Materials of Construction, 2Transport Integrated Gasification, 3Fluid Bed Catalytic Cracker, 4Carbon Capture Simulation Initiative

Gas Separation Membranes
R&D Approaches• Spiral wound• Hollow fiber• Cryogenic membrane separation• Membrane/solvent hybrid• Polymer based• Metal based
Advantages• Simple operation; no chemical reactions,
no moving parts• Tolerance to acid gases & O2
• Compact, modularà small footprint• NG purification membrane technologies
have reached similar scale to powerplant gas separation needs
• High pressure driving force in IGCC
R&D Focus• High selectivity (H2 or CO2)• High flux (permeability)• Tolerant to contaminants• Thermally stable (IGCC WGCU*)• Mechanically stable (high P ratio)• Design for high packing density• Low cost materials & manufacturing
Challenges• PC: Require feed compression or
permeate vacuum pressures• IGCC: Satisfy ‘topping’ and ‘bottoming’
cycle system requirements• PC & IGCC: Balancing flux and
selectivity
*Warm gas clean-up

Pulverized Coal Oxy-CombustionChallenges
• Cryogenic ASUs are capital andenergy intensive
• Existing boiler air infiltration• Corrosion and process control• Excess O2 and inerts (N2, Ar) h CO2
purification cost
R&D Focus• Oxygen membranes (OTM & ITM)*• Oxyfuel boilers (USC materials)• Retrofitting existing boilers (air leakage,
process control, corrosion)• CO2 Purification• System integration
*Oxygen Transport Membrane (Praxair), Ion Transport Membrane (ITM)
Advantages• Plant vs. unit operation — multiple
integration & cost reduction opportunities• 1st Generation plants with cryogenic ASU
is cost competitive with amine scrubbing• Co-sequestration options• Applicable to new and existing plants
R&D Approaches• Oxygen membranes• Oxyboiler modeling/design• Oxyburner modeling & design• Pilot-scale testing (process
control, heat transfer, …)• Corrosion testing• CO2 purification

Chemical Looping
Challenges• Solids transport
• Heat integration
• Solids attrition
• Process control
Red1700F
Ox2000F
CaS
Air
Fuel CO2 + H2O
CaSO4
MBHX N2 + O2
Steam
Advantages• Oxy-combustion and gasification without
an O2 plant• Potential lowest cost option for near-zero
emission coal power plant• Applicable to new and existing plants
R&D Approaches• Calcium and Iron-based systems• Improve oxygen carrier properties,
e.g. capacity, reactivity, and attritionresistance
• Solids handling and process design• Process heat integration• Lower capital and operating cost
Chemical looping combustion

CCSI: Accelerating Technology Development
National Labs Academia Industry
Identifypromisingconcepts
Reduce the timefor design &
troubleshooting
Quantify the technical risk,to enable reaching larger
scales, earlier
Stabilize the cost duringcommercial deployment
Source: US DOE

2nd Generation Capture Technologies
• IGCC (pre-combustion capture)– 90% capture with potential for no increase in COE– 4 to 5 percentage points higher in efficiency
than today’s plants with capture– Feedstock/product flexibility (coal, biomass, or
opportunity fuels to produce power, liquid fuels, chemicals)
• Post-Combustion Capture– COE penalty for CCS reduced from +80% (1st Generation) to +30%– 90% capture efficiency– Parasitic energy reduced (from 30% to ~15%)– Applicable to new plants, retrofits, natural gas,
& industrial power
• Oxy-Combustion– Increase in COE for CCS cut from +80% (1st Generation) to +30%– +99% capture potential– Parasitic energy reduced (from 30% to ~15%)– Applicable to new and existing power plants– Co-sequestration opportunities
ITM OxygenWarm gas cleanupHydrogen turbineSolid coal feed pumpRamgen CO2 compressor
Advanced Solvents(Ionic liquids, phase changesolvents, etc.)
CO2 membranesSolid sorbentsUSC boiler materialsRamgen CO2 compressor
Advanced Oxyfuel BoilersITM oxygenCO2 purificationUSC boiler materialsRamgen CO2 compressorChemical looping
Example Technologies
Source: US DOE

FY2015 Funding Opportunity Announcements14 Transformational Capture Technologies
Post- and Pre-Combustion Projects PerformerDevelopment of a Novel Biphasic CO2 Absorption Process with Multiple Stages of Liquid–LiquidPhase Separation for Post-Combustion Carbon Capture University of Illinois
Evaluation of Amine–Incorporated Porous Polymer Networks as Sorbents for Post-combustionCO2 Capture Texas A&M University
Hybrid Encapsulated Ionic Liquids for Post-combustion CO2 Capture University of Notre Dame
Development of a Non-aqueous Solvent CO2 Capture Process for Coal-Fired Power Plants Research Triangle Institute
Enabling 10 mol/kg Swing Capacity via Heat Integrated Sub-ambient Pressure Swing Adsorption Georgia Tech ResearchCorporation
Development of a Solid Sorbent for CO2 Capture Process for Coal-Fired Power Plants Research Triangle Institute
Electrochemically Mediated Sorbent Regeneration in CO2 Scrubbing Processes Massachusetts Institute ofTechnology
Testing of Next-Generation Hollow Fiber Membrane Modules American Air Liquide, Inc.
Energy Efficient Membrane–Based “Hybrid” Hybrid Process for Post-combustion CO2 Capture Gas Technology Institute
Development of a Hybrid Capture System with Advanced Membrane, Solvent System, andProcess Integration Liquid Ion Solutions LLC
A High-Efficiency, Ultra-compact Process for Pre-combustion CO2 Capture University of SouthernCalifornia
Sorption Enhanced Mixed Matrix Membranes for H2 Purification and CO2 Capture University of Buffalo
Combined Sorbent/Water-Gas Shift–Based CO2 Capture Process with Integrated HeatManagement Southern Research
Zeolite Membrane Reactor for Pre-combustion Carbon Dioxide Capture Arizona State University
Source: US DOE

National Carbon Capture Center
Pilot Solvent Test Unit
Post Combustion
q PC4 Facility – 4.3MWeq Real PC flue gasq Bench through pilot scaleq ~25,000 hours of testingq 15 Technologies testedq “Tech-Flexible”
Pre Combustion
q 6.3MWe Trig gasifierq Air- or O2 fired syngasq Bench through pilot scaleq ~20,000 hours of testingq 13 gasifier runsq “Tech-Flexible”
– World Class Carbon Capture Technology Test Facility –
TRIG Gasifier
§5 year $150MM§$100MM Capture Funding§Independent Test Facility§Supports Capture &
Gasification
Source: US DOE

Current DOE’s Carbon Capture Small Pilot Projects
Performer Scale Planned Construction CompletePost-combustion Solvents
Linde, LLC 1 MWe Complete
Neumann Systems Group, Inc 0.5 MWe Complete
Southern Company Services 25 MWe Complete
University of Kentucky 0.7 MWe Complete
General Electric 0.5 MWe Late 2015
ION Engineering 0.7 MWe CompletePost-combustion Sorbents
ADA-Environmental Solutions 1 MWe Complete
TDA Research, Inc. 0.5 MWe Late 2016
SRI International 1 MWe Late 2015Post-combustion Membranes
Fuel Cell Energy 1MWe 2018
Membrane Technology & Research 1 MWe Complete
Gas Technology Institute 1 MWe Early 2016Pre-combustion
SRI International 0.1 MWe Complete
TDA, Inc. 0.1 MWe Late 2015
Source : US DOE

BIG SKYBIG SKY
WESTCARBWESTCARB
SWPSWP
PCORPCOR
MGSCMGSC
SECARBSECARB
MRCSPMRCSP
Regional Carbon Sequestration PartnershipsDeveloping the Infrastructure for Wide Scale Deployment
Seven Regional Partnerships400+ distinct organizations, 43 states, 4 Canadian Provinces
• Engage regional, state, and local governments• Determine regional sequestration benefits• Baseline region for sources and sinks• Establish monitoring and verification protocols• Validate sequestration technology andinfrastructure
Development Phase (2008-2018+)
8 large scale injections (over 1million tons each)
Commercial scaleunderstanding and validation
Validation Phase (2005-2011)
20 injection tests in saline formations, depleted oil, unmineablecoal seams, and basalt
Characterization Phase (2003-2005)
Search of potential storagelocations and CO2 sources
Found potential for 100s ofyears of storage

Major CCS 1st Gen Demonstration ProjectsProject Locations & Cost Share
Clean Coal Power InitiativeICCS Area 1
Southern CompanyKemper County IGCC Project
Transport Gasifier w/ Carbon Capture~$4.12B – Total, $270M – -DOEEOR – ~3.0M MTPY 2016 start
Petra Nova (formerly NRG)W.A. Parish Generating StationPost Combustion CO2 Capture
$775 M – Total$167M – DOE
EOR – ~1.4M MTPY 2017 start
Summit TX Clean EnergyCommercial Demo of Advanced
IGCC w/ Full Carbon Capture~$1.7B – Total, $450M – DOEEOR – ~2.2M MTPY 2018 start
Air Products and Chemicals, Inc.CO2 Capture from Steam Methane Reformers
EOR in Eastern TX Oilfields$431M – Total, $284M – DOE
EOR – ~0.93M MTPY 2012 start
Archer Daniels MidlandCO2 Capture from Ethanol PlantCO2 Stored in Saline Reservoir
$208M – Total, $141M – DOESALINE – ~0.9M MTPY 2016 start
Source: US DOE

Port Arthur, TX: 1.1 M tons/y CO2 Air Products, 2013Port Arthur, TX: 1.1 M tons/y CO2 Air Products, 2013
VSA Vessels
Co-Gen Unit
Blowers
CO2Compressor &
TEG UnitCO2 Surge
Tanks
Existing SMR
Operational! 1.7M tons stored so far

Kemper County, MS: 2.7M tons/y CO2Southern Co., 2013 (Anticipated start mid-2016)

Decatur, ILADM 2013
300,000 tons/y today;Over 900,000 tons to date
1 M tons/y shortly
CO2 Pipe to Injection Well
Final class VI permit

W.A. Parrish, TX: 1.4M tons/y CO2NRG/PetraNova project
Broke Ground Sept. 5th! Operational in2016

Policy Incentives and Regulatoryframeworks for CCS/CCUS in US

Technology – Market – Policy Dynamics
MARKET
Pull and SkewedBy Policy
TECHNOLOGY
Pushes Marketsand GuidesPolicy
POLICY/REGS
“Pubic Good” byShaping Market &Enabled by availableTechnology
• Federal Government– Support R&D
New TechnologyOptions
– Remove barriers& Lower hurdlesfor the publicgood.
– ProvideIncentives &Framework
BUSINESS CASEFOR CCS
FINANCEABILITYACCEPTANCE

US EPA REGULATIONS - CO2 EMISSIONS
54
EPA CLEAN POWER PLAN – ?? Supreme Court Stay• EMISSIONS REDUCTIONS ON STATE-BY STATE BASIS• CCS IS NOT DESIGNATED AS A REQUIRED
TECHNOLOGY, BUT MAY BE PART OF EMISSIONSCOMPLIANCE PLAN FOR STATES
NEW SOURCE PEFORMANCE STANDARDS• NEW COAL PLANTS MUST MEET 1400 LBS/MWHR;• CAN BE MET BY EITHER CARBON CAPTURE (~ 20%
CAPTURE) OR CO-FIRING WITH NATURAL GAS (40%GAS )

Funding CCS Projects in the United States
Federal Funding and Incentives for CCS• American Reinvestment and Recovery Act (ARRA)• U.S. DOE Office of Fossil Energy RD&D Program• Loan Guarantees• Tax Credits:
$20 per ton for Saline Storage$10 per ton for EOR
State Incentives for CCS• Financial Support – Loans and Grants• Tax Incentives• Off-take Agreements• Utility Cost Recovery Mechanisms• CCS Eligibility in Portfolio Standards• Assumption of Liability for Stored Carbon

Closing RemarksPolicy Incentives and Parity essential to CCS deployment aspart of a low-carbon technology portfolio for climate mitigation
Cost of capture and lack of carbon valuation are challenges forfinanceable CCS
CCUS: A catalyst for CCS – builds key infrastructures for CCS• CO2- EOR – Largest near-term potential for CCUS• Non-EOR - CO2 for Bio-based energy and “green” products• Mineralization Processes – to produce chemicals
CCS:• Dedicated storage needed for CO2; desalination potential• Fossil-CCS can backup intermittent renewables (PV, wind)• A key to negative carbon- BioEnergy-CCS and air capture• Only technology for reducing CO2 from industrial facilities
Modularity – as added deployment path to large-scale demos
International collaboration needed for broad CCS deployment