Key Aspects of the Australian Pharmaceutical …vuir.vu.edu.au/15944/1/15944.pdfKey Aspects of the...
54
Key Aspects of the Australian Pharmaceutical Benefits Scheme Working Paper No. 35 Kim Sweeny Pharmaceutical Industry Project Working Paper Series November 2007 Centre for Strategic Economic Studies Victoria University of Technology PO Box 14428 Melbourne VIC 8001 AUSTRALIA Telephone +613 9919 1340 Fax +613 9919 1350 Contact email: [email protected]
Transcript of Key Aspects of the Australian Pharmaceutical …vuir.vu.edu.au/15944/1/15944.pdfKey Aspects of the...
Key Aspects of the Australian Pharmaceutical Benefits Scheme
Working Paper No. 35
Kim Sweeny
Pharmaceutical Industry Project Working Paper Series
November 2007
Centre for Strategic Economic Studies Victoria University of Technology
PO Box 14428 Melbourne VIC 8001 AUSTRALIA Telephone +613 9919 1340
Fax +613 9919 1350
Contact email: [email protected]
Key Aspects of the Australian PBS
PIP Working Paper No. 35 1
Key Aspects of the Australian Pharmaceutical Benefits Scheme
Kim Sweeny
1. Government programs providing pharmaceutical benefits The Australian Commonwealth Government’s aim in its National Medicines Policy is to ensure
• “timely access to the medicines that Australians need, at a cost individuals and the community can afford;
• medicines meeting appropriate standards of quality, safety and efficacy; • quality use of medicines; and • maintaining a responsible and viable medicines industry” DoHAC (2000).
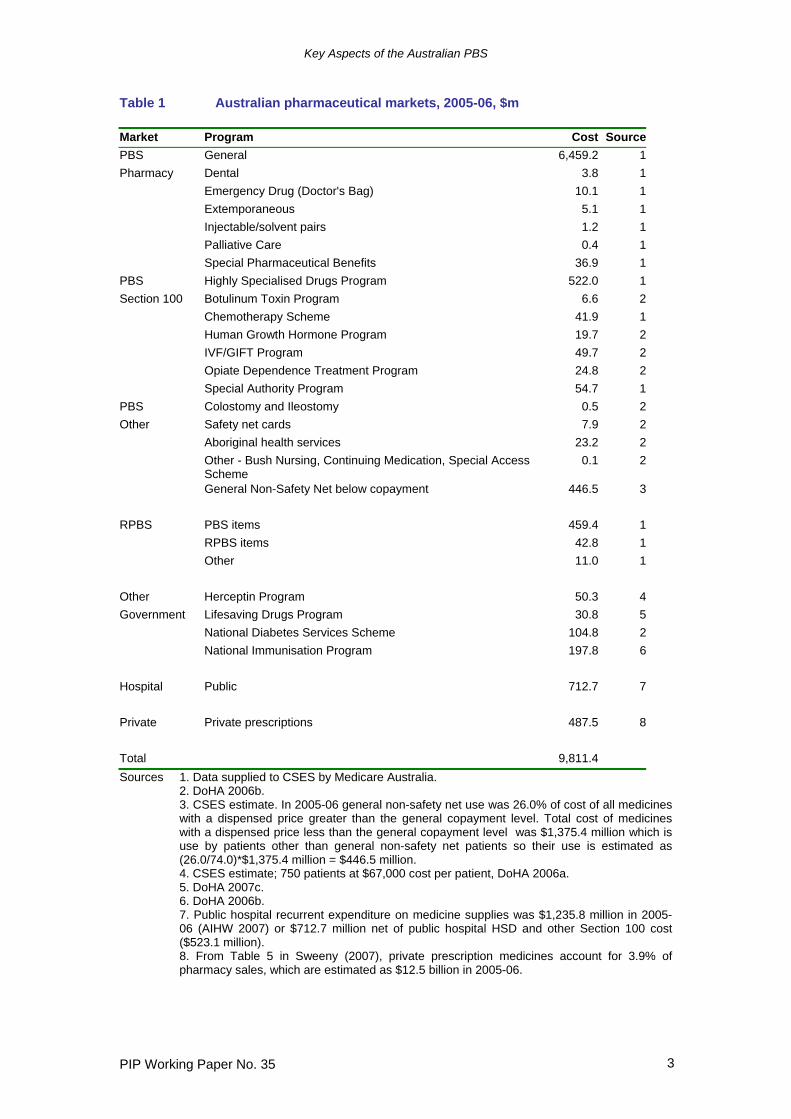
The second of these objectives is mainly met through the activities of the Therapeutic Goods Administration (described in Sweeny (2007)), while the third is articulated in the National Strategy for Quality Use of Medicines (Commonwealth of Australia 2002) and programs such as the National Prescribing Service. The fourth objective has been addressed through a number of industry support programs, most recently the Pharmaceuticals Partnership Program. The first objective is met by a range of programs administered by the Commonwealth Government that deliver pharmaceutical benefits to the Australian people. The programs which account for most of the cost are those gathered under the umbrella of the Pharmaceutical Benefits Scheme (PBS), although expenditure is also significant under some of the other programs, most notably the Repatriation Pharmaceutical Benefits Scheme (RPBS). The State governments are responsible for public hospitals and for the costs of pharmaceutical benefits delivered in them, where these are not covered by the Commonwealth programs. In addition, there is a private market for those prescription medicines that are either not listed under the PBS or prescribed for indications outside those permitted by the PBS. Table 1 provides estimates of the value of pharmaceutical markets in Australia for 2005-06 and for the various government programs. Clearly medicines provided under the PBS predominate as they make up $7,714.3 million of the total prescription medicine market of $9,811.4 million or 78.6%. To this can be added $513.2 million (5.2%) from medicines under the RPBS and a further $383.7 million (3.9%) in other Commonwealth Government programs. State Governments through public hospitals spend a further $712.7 million (7.3%) and the private prescription market is quite small at $ 487.5 million (5.0%). This latter figure is similar to the amount spent by general non-safety net patients on medicines that cost less than the general copayment level and are not therefore picked up in official PBS data. It is interesting to note also that the bulk of cost under the RPBS is the use by RPBS cardholders of PBS items rather than use of those items that are only available on the RPBS itself. Aside from the PBS and RPBS which are described further below, the other main Commonwealth pharmaceutical programs are the Herceptin Program, the Lifesaving Drugs Program, the National Diabetes Services Scheme and the National Immunisation Program. The Herceptin Program makes available the medicine Herceptin (trastuzumab) to women with HER2 positive late stage breast cancer.
Key Aspects of the Australian PBS
PIP Working Paper No. 35 2
Since October 2006 Herceptin has also been listed on the PBS for women with HER2 positive early stage breast cancer. The Lifesaving Drugs Program provides 4 very expensive medicines to treat 3 rare life threatening diseases. One of these diseases is mucopolysaccharidosis type 1 and the medicine laronidase-rch will be provided to treat 8-12 patients a year at a cost of $16.4 million over 4 years (DoHA 2007f). The National Diabetes Services Scheme provides access to products and services needed for the self-management of diabetes at subsidised prices and includes syringes, insulin infusion pump consumables and glucose testing reagents. The National Immunisation Program provides funds to the States and Territories for mass immunisation against a range of communicable diseases. The Pharmaceutical Benefits Scheme1 is administered by the Commonwealth Department of Health and Ageing with transaction processing carried out by Medicare Australia on behalf of the Department. The operations of the PBS are governed by Part VII of the National Health Act 1953 together with the National Health (Pharmaceutical Benefits) Regulations 1960 made under the Act. The aim of the PBS is to provide “reliable, timely and affordable access to a wide range of medicines for all Australians” (DoHA 2007a). The Act specifies that, in general, pharmaceutical benefits can only be paid on medicines dispensed by registered pharmacists on prescriptions written by qualified medical practitioners (in practice doctors and dentists). The bulk of medicines consumed under the PBS are made available in this way as shown by the first section of Table 1. Aside from the “General” category which covers the vast bulk of PBS medicines, there is specific provision for a group of medicines (mainly anti-infectives and painkillers) which are prescribed by dentists (“Dental”), an allowance for emergency supplies of a range of medicines for doctors (“Doctor’s Bag”), a group of medicines that are made up by pharmacists from basic materials (“Extemporaneous”), and a group mainly of painkillers, laxatives and other medicines to provide palliative care to dying people (“Palliative Care”). The Special Pharmaceutical Benefits section consists of those few medicines (9 at August 2007) on which the Government and supplier cannot agree on the price and a Special Patient Contribution is paid by the consumer. Section 100 of the Act makes allowance for other conditions under which PBS medicines can be delivered. Based on this section, certain medicines are listed that can only be administered to patients in a hospital by specialist practitioners. These medicines include those listed under the Highly Specialised Drugs (HSD) program, which is by far the largest component at $522.0 million, as well as the following (at August 2007)
• Botulinum Toxin Program • Chemotherapy Scheme • Human Growth Hormone Program • IVF/GIFT Program • Opiate Addiction Treatment Program • Special Authority Program • Special Access Scheme
1 Duckett (2004) provides a useful recent summary of various aspects of the Pharmaceutical Benefits Scheme.
Key Aspects of the Australian PBS
PIP Working Paper No. 35 3
Table 1 Australian pharmaceutical markets, 2005-06, $m Market Program Cost SourcePBS General 6,459.2 1Pharmacy Dental 3.8 1 Emergency Drug (Doctor's Bag) 10.1 1 Extemporaneous 5.1 1 Injectable/solvent pairs 1.2 1 Palliative Care 0.4 1 Special Pharmaceutical Benefits 36.9 1PBS Highly Specialised Drugs Program 522.0 1Section 100 Botulinum Toxin Program 6.6 2 Chemotherapy Scheme 41.9 1 Human Growth Hormone Program 19.7 2 IVF/GIFT Program 49.7 2 Opiate Dependence Treatment Program 24.8 2 Special Authority Program 54.7 1PBS Colostomy and Ileostomy 0.5 2Other Safety net cards 7.9 2 Aboriginal health services 23.2 2 Other - Bush Nursing, Continuing Medication, Special Access
Scheme 0.1 2
General Non-Safety Net below copayment 446.5 3 RPBS PBS items 459.4 1 RPBS items 42.8 1 Other 11.0 1 Other Herceptin Program 50.3 4Government Lifesaving Drugs Program 30.8 5 National Diabetes Services Scheme 104.8 2 National Immunisation Program 197.8 6 Hospital Public 712.7 7 Private Private prescriptions 487.5 8 Total 9,811.4Sources 1. Data supplied to CSES by Medicare Australia.
2. DoHA 2006b. 3. CSES estimate. In 2005-06 general non-safety net use was 26.0% of cost of all medicines with a dispensed price greater than the general copayment level. Total cost of medicines with a dispensed price less than the general copayment level was $1,375.4 million which is use by patients other than general non-safety net patients so their use is estimated as (26.0/74.0)*$1,375.4 million = $446.5 million. 4. CSES estimate; 750 patients at $67,000 cost per patient, DoHA 2006a. 5. DoHA 2007c. 6. DoHA 2006b. 7. Public hospital recurrent expenditure on medicine supplies was $1,235.8 million in 2005-06 (AIHW 2007) or $712.7 million net of public hospital HSD and other Section 100 cost ($523.1 million). 8. From Table 5 in Sweeny (2007), private prescription medicines account for 3.9% of pharmacy sales, which are estimated as $12.5 billion in 2005-06.
Key Aspects of the Australian PBS
PIP Working Paper No. 35 4
The HSD Program consists of about 72 medicines used to treat a range of conditions such as arthritis, HIV/AIDS and hepatitis while the Chemotherapy Scheme has 44 medicines used to treat cancer. The Botulinum Toxin Program and the Human Growth Hormone Program consist of one medicine each – botulinum toxin and somatropin respectively, while the IVF/GIFT Program covers 5 medicines used in in-vitro fertilisation and the Opiate Addiction Program comprises two medicines – methadone and buprenorphine. The Special Authority Program consists of two medicines – Glivec (imatinib mesylate) and Herceptin (trastuzumab) which are both used to treat cancer. 2. PBS beneficiaries, copayments and safety nets PBS benefits are available to all Australian residents and eligible foreign visitors, i.e., people from countries which have Reciprocal Health Care Agreements with Australia, namely Finland, Ireland, Italy, Malta, the Netherlands, New Zealand, Norway, Sweden, and the United Kingdom. Since 1 July 2001, all Australian citizens must produce a Medicare card when benefits are dispensed, as proof of eligibility. The PBS distinguishes between general patients who contribute a higher copayment when purchasing PBS medicines and concessional patients who contribute a lesser copayment. From 1 January 2007, the general and concessional copayments have been $30.70 and $4.90 respectively. Concessional patients must have one of the following cards from Centrelink or the Department of Veterans Affairs (DVA):
• Pensioner Concession Card; • Commonwealth Seniors Health Card; • Health Care Card; or • Repatriation Health Card or Repatriation Pharmaceutical Benefits Card
Pensioner Concession Cards are available to a range of social security beneficiaries, including aged pensioners, unemployment beneficiaries, and single parents. To qualify for the Seniors Health Card, a person must:
• be an Australian resident, living in Australia, and • have reached age pension age but not qualify for the Age Pension, and • have an annual income of less than:
• $50,000 (singles) • $80,000 (couples combined), or • $100,000 (couples combined who are separated due to ill health)
These latter limits are increased by $639.60 for each dependent child cared for (Centrelink 2007). In addition to subsidising the cost of medicines for both general and concessional patients, the PBS also provides for Safety Nets which allow for a lesser copayment once the annual cost of medicines incurred by a patient exceeds the amount specified as the Safety Net level. For general patients once the safety net limit is reached the copayment is the same as the concessional copayment (ie $4.90), while for concessional patients, there is no copayment once the safety net limit has been reached. At the beginning of a new year, safety net patients revert to their previous patient category until the safety net limit is reached again. For 2007, the safety net values are $1,059.00 and $274.40 for general and concessional patients respectively.
Key Aspects of the Australian PBS
PIP Working Paper No. 35 5
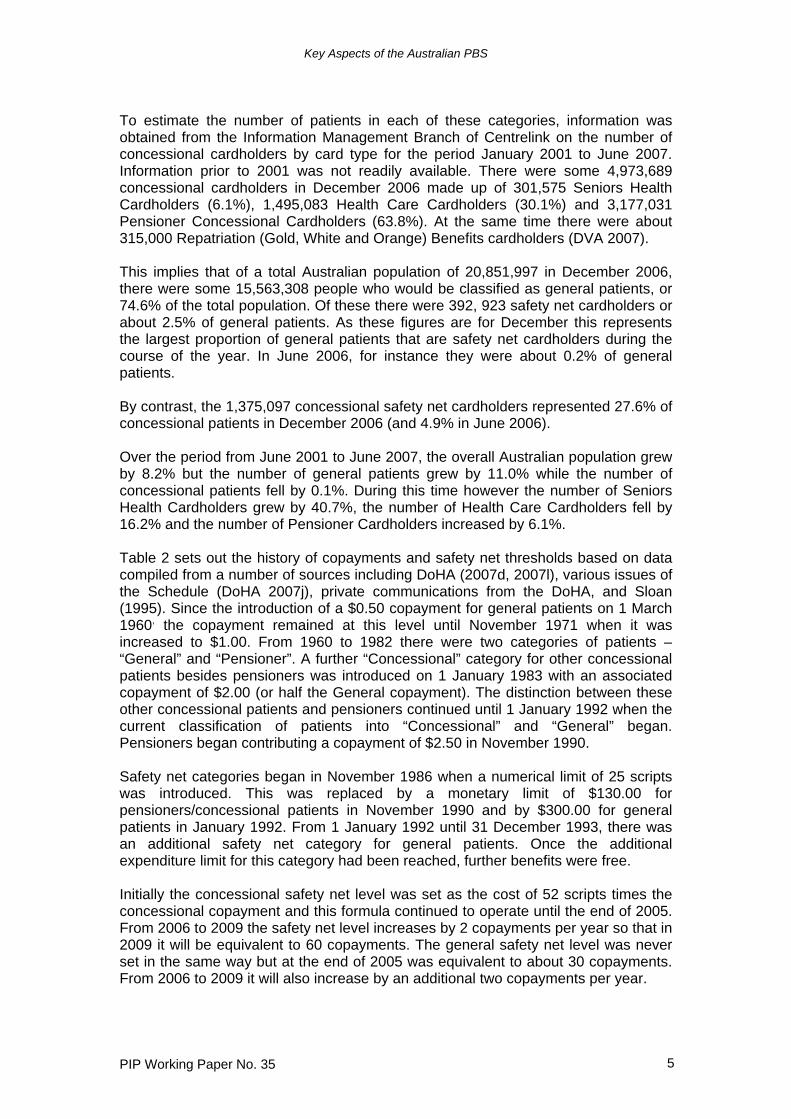
To estimate the number of patients in each of these categories, information was obtained from the Information Management Branch of Centrelink on the number of concessional cardholders by card type for the period January 2001 to June 2007. Information prior to 2001 was not readily available. There were some 4,973,689 concessional cardholders in December 2006 made up of 301,575 Seniors Health Cardholders (6.1%), 1,495,083 Health Care Cardholders (30.1%) and 3,177,031 Pensioner Concessional Cardholders (63.8%). At the same time there were about 315,000 Repatriation (Gold, White and Orange) Benefits cardholders (DVA 2007). This implies that of a total Australian population of 20,851,997 in December 2006, there were some 15,563,308 people who would be classified as general patients, or 74.6% of the total population. Of these there were 392, 923 safety net cardholders or about 2.5% of general patients. As these figures are for December this represents the largest proportion of general patients that are safety net cardholders during the course of the year. In June 2006, for instance they were about 0.2% of general patients. By contrast, the 1,375,097 concessional safety net cardholders represented 27.6% of concessional patients in December 2006 (and 4.9% in June 2006). Over the period from June 2001 to June 2007, the overall Australian population grew by 8.2% but the number of general patients grew by 11.0% while the number of concessional patients fell by 0.1%. During this time however the number of Seniors Health Cardholders grew by 40.7%, the number of Health Care Cardholders fell by 16.2% and the number of Pensioner Cardholders increased by 6.1%. Table 2 sets out the history of copayments and safety net thresholds based on data compiled from a number of sources including DoHA (2007d, 2007l), various issues of the Schedule (DoHA 2007j), private communications from the DoHA, and Sloan (1995). Since the introduction of a $0.50 copayment for general patients on 1 March 1960, the copayment remained at this level until November 1971 when it was increased to $1.00. From 1960 to 1982 there were two categories of patients – “General” and “Pensioner”. A further “Concessional” category for other concessional patients besides pensioners was introduced on 1 January 1983 with an associated copayment of $2.00 (or half the General copayment). The distinction between these other concessional patients and pensioners continued until 1 January 1992 when the current classification of patients into “Concessional” and “General” began. Pensioners began contributing a copayment of $2.50 in November 1990. Safety net categories began in November 1986 when a numerical limit of 25 scripts was introduced. This was replaced by a monetary limit of $130.00 for pensioners/concessional patients in November 1990 and by $300.00 for general patients in January 1992. From 1 January 1992 until 31 December 1993, there was an additional safety net category for general patients. Once the additional expenditure limit for this category had been reached, further benefits were free. Initially the concessional safety net level was set as the cost of 52 scripts times the concessional copayment and this formula continued to operate until the end of 2005. From 2006 to 2009 the safety net level increases by 2 copayments per year so that in 2009 it will be equivalent to 60 copayments. The general safety net level was never set in the same way but at the end of 2005 was equivalent to about 30 copayments. From 2006 to 2009 it will also increase by an additional two copayments per year.
Key Aspects of the Australian PBS
PIP Working Paper No. 35 6
Since their introduction, the nominal and real values of both copayments and safety net limits have increased, and while these increases have generally been modest, large rises have occurred from time to time as the Government has sought to limit its exposure to the growth in the cost of the PBS by shifting more of the cost to patients. Usually changes in copayments and safety net limits have taken effect from 1 January by an amount in line with inflation. However, as Table 2 shows, much larger increases occurred in November 1986, November 1990, January 1997, and January 2005. Table 2 History of PBS copayments and safety net thresholds, $ Change Date
Copay Pensioners
Copay Concessional
Safety netConcessional
Copay General
Safety net General
Safety net General 2
01.03.1960 0.50 01.11.1971 1.00 01.09.1975 1.50 01.03.1976 2.00 01.07.1978 2.50 01.09.1979 2.75 01.12.1981 3.20 01.01.1983 2.00 4.00 01.07.1985 2.00 5.00 01.11.1986 2.50 25 scripts 10.00 25 scripts 01.07.1988 2.50 25 scripts 11.00 25 scripts 01.11.1990 2.50 2.50 130.00 15.00 25 scripts 01.01.1991 2.50 2.50 130.00 15.00 300.00 50.00 01.08.1991 2.50 2.50 130.00 15.70 300.00 50.00 01.10.1991 2.60 2.60 130.00 15.70 300.00 50.00 01.01.1992 2.60 135.20 15.70 309.90 51.60 01.01.1993 2.60 135.20 15.70 312.30 52.00 01.08.1993 2.60 135.20 16.00 312.30 52.00 01.01.1994 2.60 135.20 16.00 400.00 01.08.1994 2.60 135.20 16.20 400.00 01.01.1995 2.60 135.20 16.20 407.60 01.08.1995 2.60 135.20 16.80 407.60 01.01.1996 2.70 140.40 16.80 600.00 01.08.1996 2.70 140.40 17.40 600.00 01.01.1997 3.20 166.40 20.00 612.60 01.01.1999 3.20 166.40 20.30 620.30 01.01.2000 3.30 171.60 20.60 631.20 01.01.2001 3.50 182.00 21.90 669.70 01.01.2002 3.60 187.20 22.40 686.40 01.01.2003 3.70 192.40 23.10 708.40 01.01.2004 3.80 197.60 23.70 726.80 01.01.2005 4.60 239.20 28.60 874.90 01.01.2006 4.70 253.80 29.50 960.10 01.01.2007 4.90 274.40 30.70 1059.00 Sources: DoHA (2007i various issues); DoHA (2007d); Sloan (1995).
Key Aspects of the Australian PBS
PIP Working Paper No. 35 7
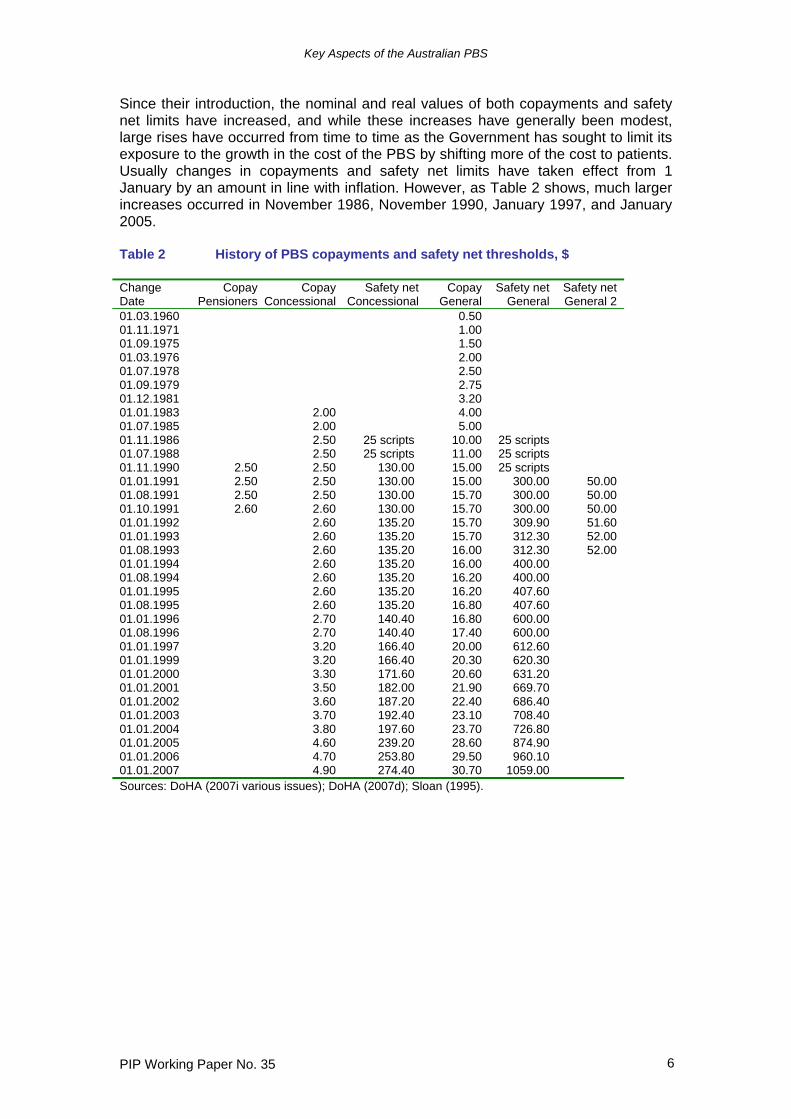
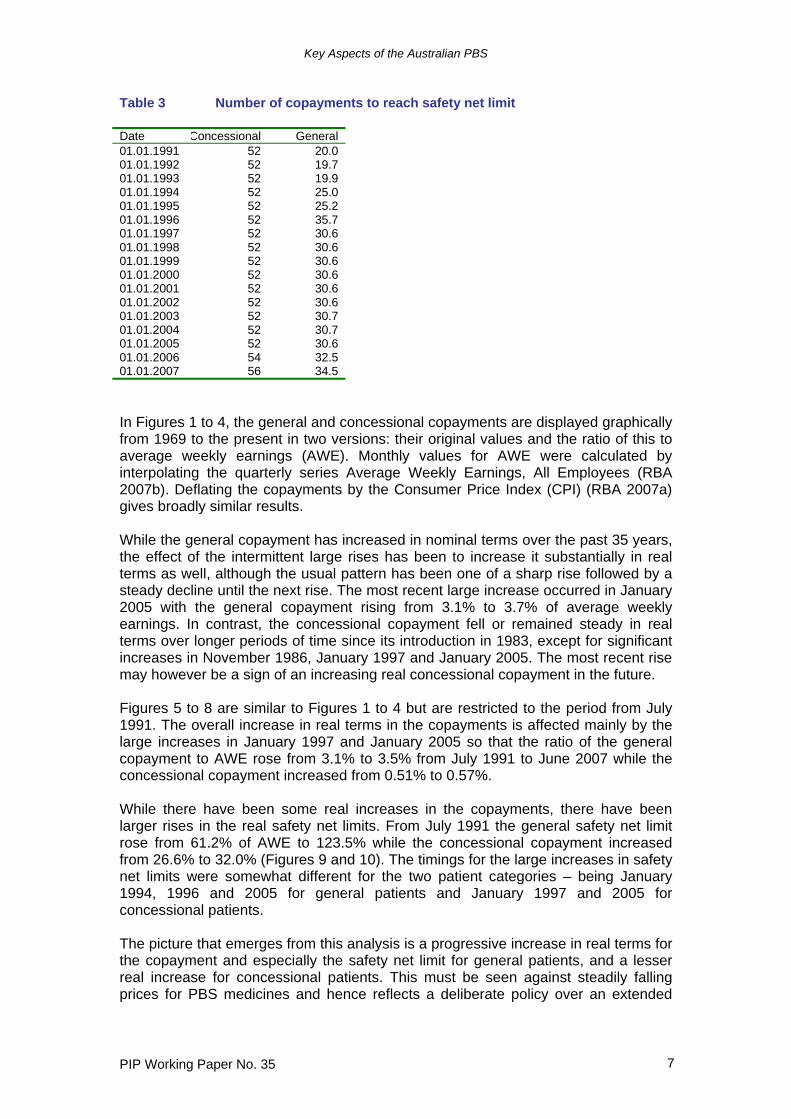
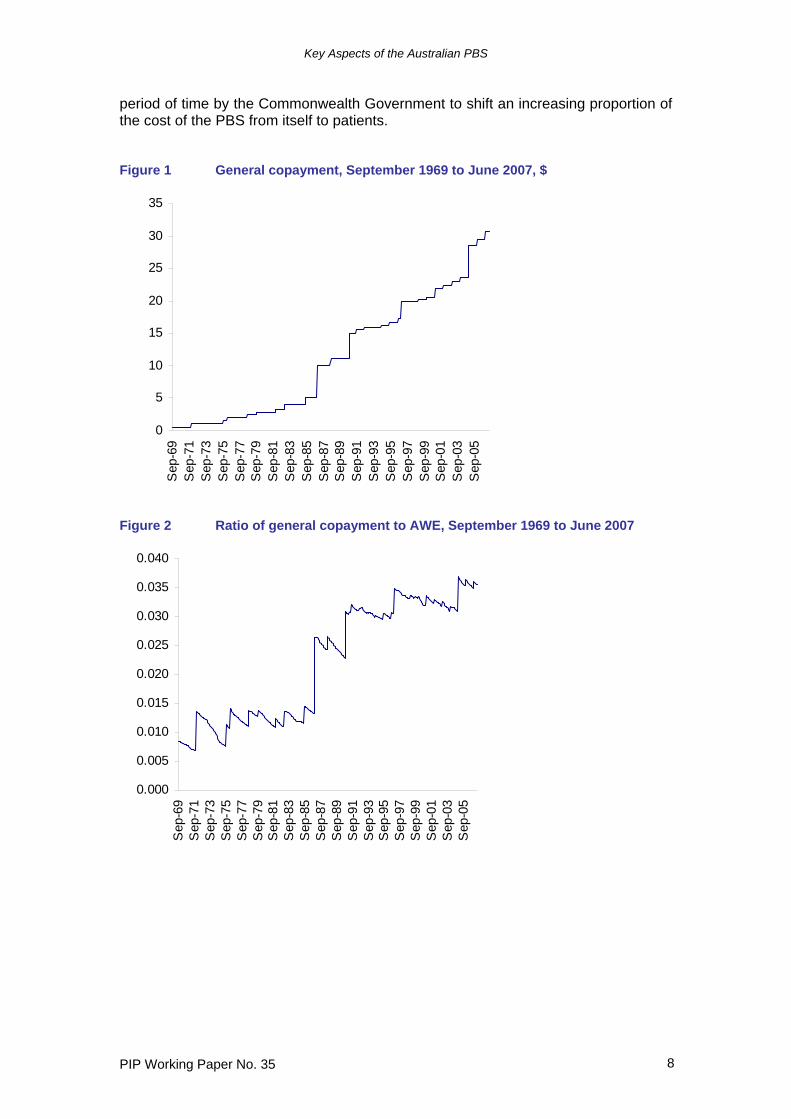
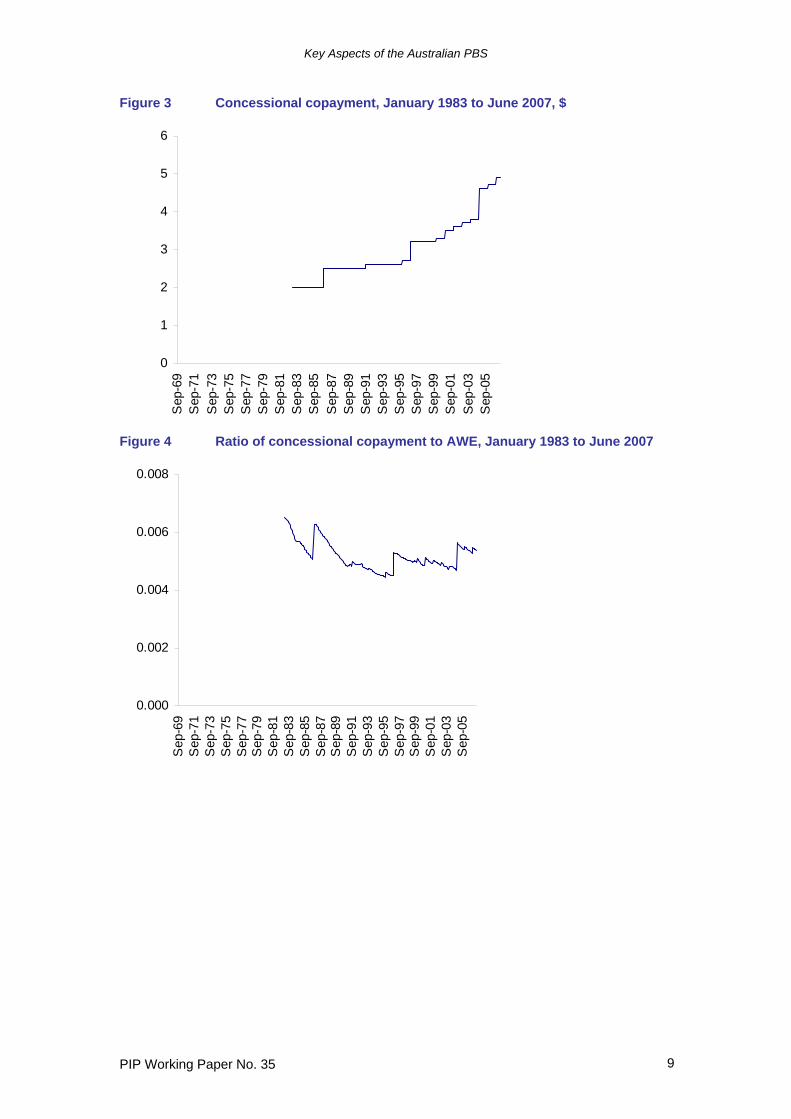
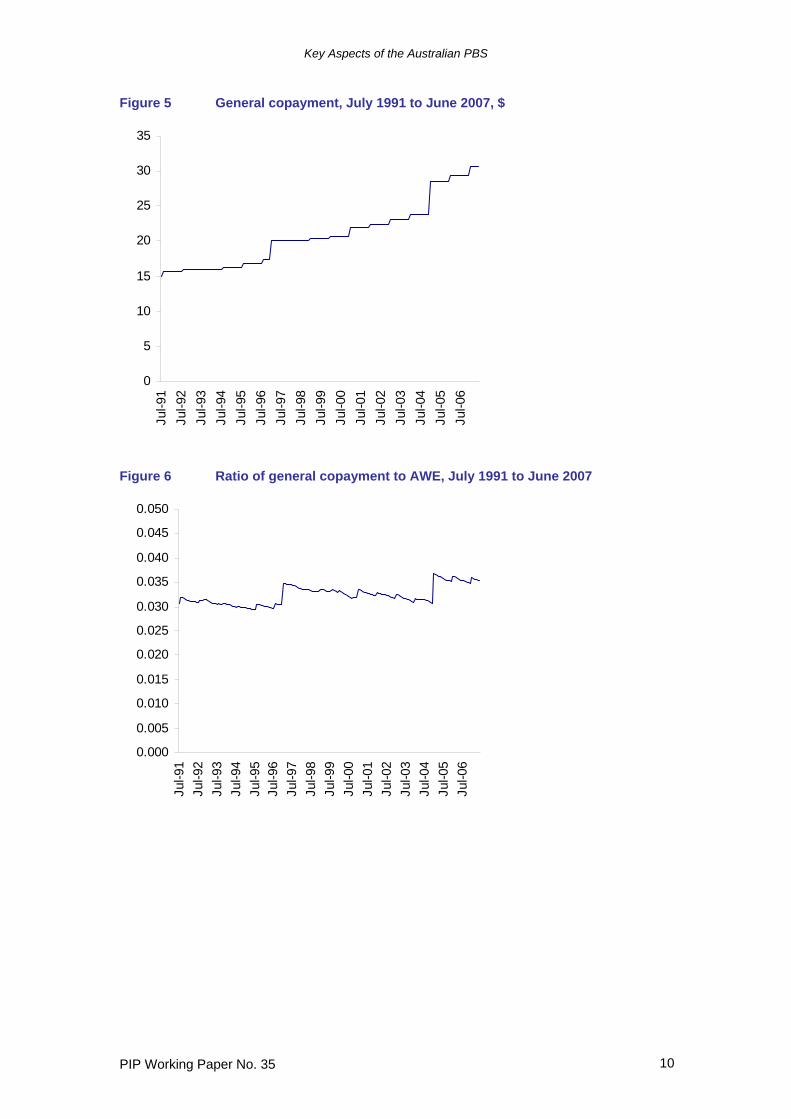
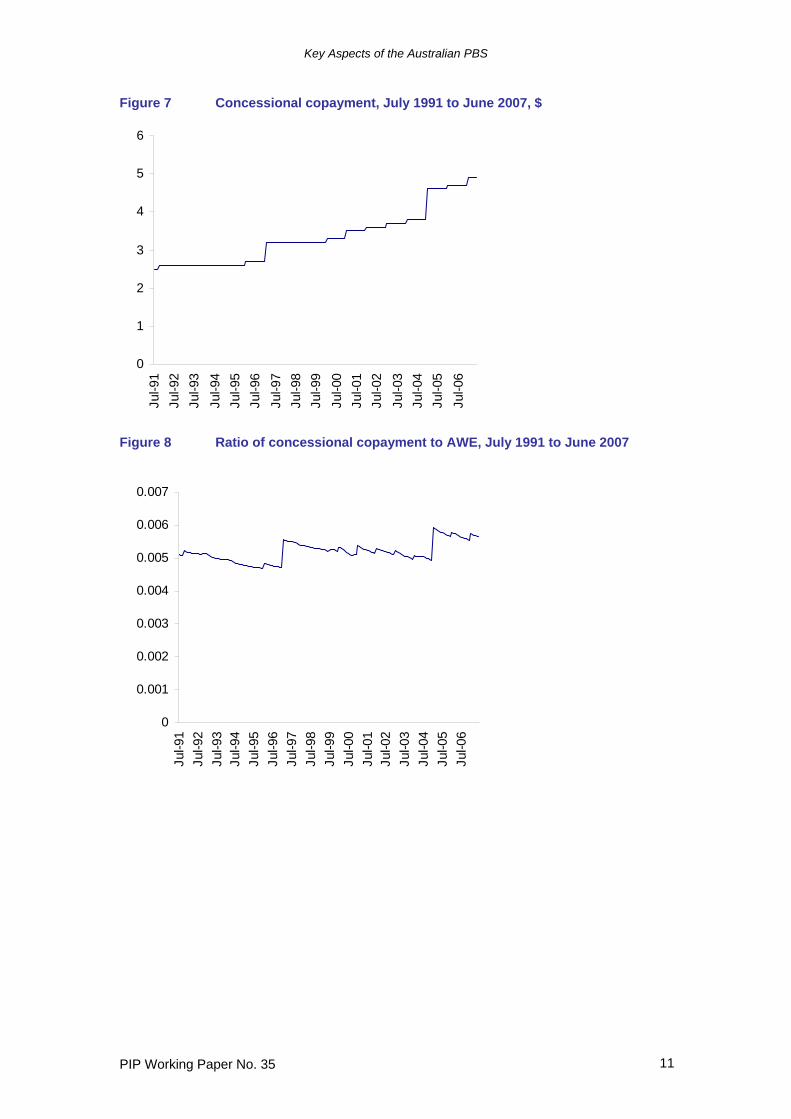
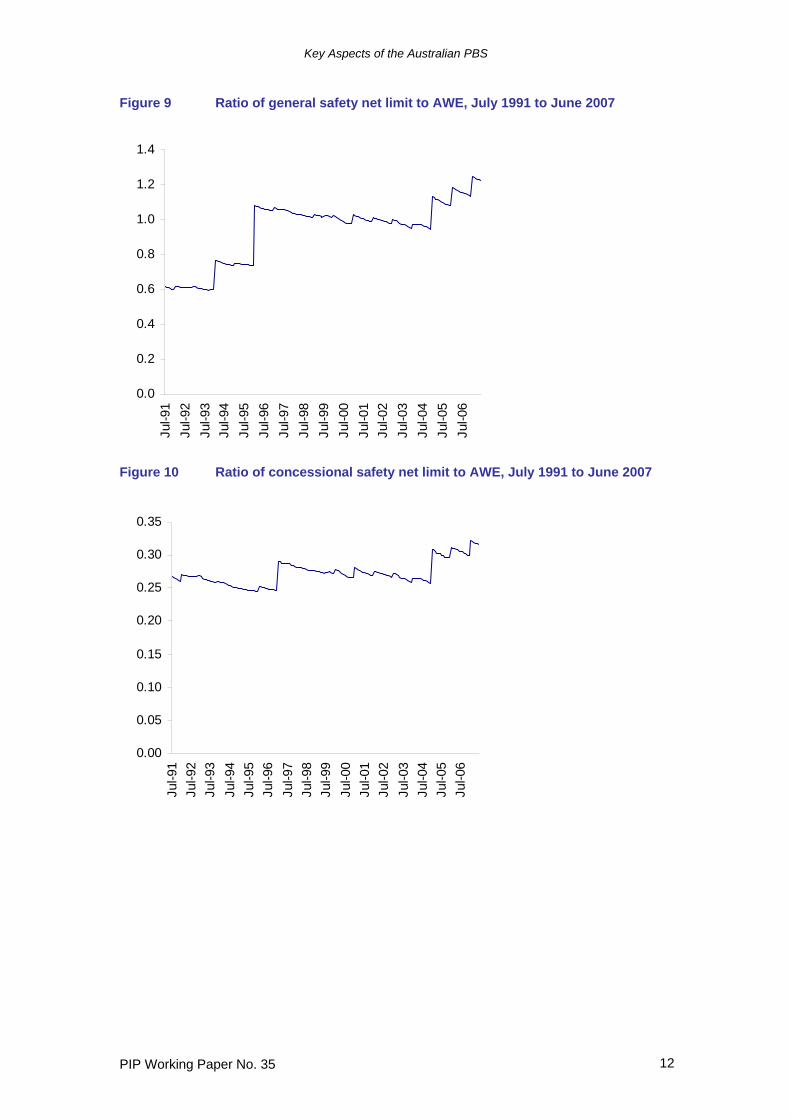
Table 3 Number of copayments to reach safety net limit Date Concessional General 01.01.1991 52 20.0 01.01.1992 52 19.7 01.01.1993 52 19.9 01.01.1994 52 25.0 01.01.1995 52 25.2 01.01.1996 52 35.7 01.01.1997 52 30.6 01.01.1998 52 30.6 01.01.1999 52 30.6 01.01.2000 52 30.6 01.01.2001 52 30.6 01.01.2002 52 30.6 01.01.2003 52 30.7 01.01.2004 52 30.7 01.01.2005 52 30.6 01.01.2006 54 32.5 01.01.2007 56 34.5 In Figures 1 to 4, the general and concessional copayments are displayed graphically from 1969 to the present in two versions: their original values and the ratio of this to average weekly earnings (AWE). Monthly values for AWE were calculated by interpolating the quarterly series Average Weekly Earnings, All Employees (RBA 2007b). Deflating the copayments by the Consumer Price Index (CPI) (RBA 2007a) gives broadly similar results. While the general copayment has increased in nominal terms over the past 35 years, the effect of the intermittent large rises has been to increase it substantially in real terms as well, although the usual pattern has been one of a sharp rise followed by a steady decline until the next rise. The most recent large increase occurred in January 2005 with the general copayment rising from 3.1% to 3.7% of average weekly earnings. In contrast, the concessional copayment fell or remained steady in real terms over longer periods of time since its introduction in 1983, except for significant increases in November 1986, January 1997 and January 2005. The most recent rise may however be a sign of an increasing real concessional copayment in the future. Figures 5 to 8 are similar to Figures 1 to 4 but are restricted to the period from July 1991. The overall increase in real terms in the copayments is affected mainly by the large increases in January 1997 and January 2005 so that the ratio of the general copayment to AWE rose from 3.1% to 3.5% from July 1991 to June 2007 while the concessional copayment increased from 0.51% to 0.57%. While there have been some real increases in the copayments, there have been larger rises in the real safety net limits. From July 1991 the general safety net limit rose from 61.2% of AWE to 123.5% while the concessional copayment increased from 26.6% to 32.0% (Figures 9 and 10). The timings for the large increases in safety net limits were somewhat different for the two patient categories – being January 1994, 1996 and 2005 for general patients and January 1997 and 2005 for concessional patients. The picture that emerges from this analysis is a progressive increase in real terms for the copayment and especially the safety net limit for general patients, and a lesser real increase for concessional patients. This must be seen against steadily falling prices for PBS medicines and hence reflects a deliberate policy over an extended
Key Aspects of the Australian PBS
PIP Working Paper No. 35 8
period of time by the Commonwealth Government to shift an increasing proportion of the cost of the PBS from itself to patients. Figure 1 General copayment, September 1969 to June 2007, $
0
5
10
15
20
25
30
35
Sep
-69
Sep
-71
Sep
-73
Sep
-75
Sep
-77
Sep
-79
Sep
-81
Sep
-83
Sep
-85
Sep
-87
Sep
-89
Sep
-91
Sep
-93
Sep
-95
Sep
-97
Sep
-99
Sep
-01
Sep
-03
Sep
-05
Figure 2 Ratio of general copayment to AWE, September 1969 to June 2007
0.000
0.005
0.010
0.015
0.020
0.025
0.030
0.035
0.040
Sep
-69
Sep
-71
Sep
-73
Sep
-75
Sep
-77
Sep
-79
Sep
-81
Sep
-83
Sep
-85
Sep
-87
Sep
-89
Sep
-91
Sep
-93
Sep
-95
Sep
-97
Sep
-99
Sep
-01
Sep
-03
Sep
-05
Key Aspects of the Australian PBS
PIP Working Paper No. 35 9
Figure 3 Concessional copayment, January 1983 to June 2007, $
0
1
2
3
4
5
6
Sep
-69
Sep
-71
Sep
-73
Sep
-75
Sep
-77
Sep
-79
Sep
-81
Sep
-83
Sep
-85
Sep
-87
Sep
-89
Sep
-91
Sep
-93
Sep
-95
Sep
-97
Sep
-99
Sep
-01
Sep
-03
Sep
-05
Figure 4 Ratio of concessional copayment to AWE, January 1983 to June 2007
0.000
0.002
0.004
0.006
0.008
Sep
-69
Sep
-71
Sep
-73
Sep
-75
Sep
-77
Sep
-79
Sep
-81
Sep
-83
Sep
-85
Sep
-87
Sep
-89
Sep
-91
Sep
-93
Sep
-95
Sep
-97
Sep
-99
Sep
-01
Sep
-03
Sep
-05
Key Aspects of the Australian PBS
PIP Working Paper No. 35 10
Figure 5 General copayment, July 1991 to June 2007, $
0
5
10
15
20
25
30
35
Jul-9
1Ju
l-92
Jul-9
3Ju
l-94
Jul-9
5Ju
l-96
Jul-9
7Ju
l-98
Jul-9
9Ju
l-00
Jul-0
1Ju
l-02
Jul-0
3Ju
l-04
Jul-0
5Ju
l-06
Figure 6 Ratio of general copayment to AWE, July 1991 to June 2007
0.000
0.005
0.010
0.015
0.020
0.025
0.030
0.035
0.040
0.045
0.050
Jul-9
1Ju
l-92
Jul-9
3Ju
l-94
Jul-9
5Ju
l-96
Jul-9
7Ju
l-98
Jul-9
9Ju
l-00
Jul-0
1Ju
l-02
Jul-0
3Ju
l-04
Jul-0
5Ju
l-06
Key Aspects of the Australian PBS
PIP Working Paper No. 35 11
Figure 7 Concessional copayment, July 1991 to June 2007, $
0
1
2
3
4
5
6Ju
l-91
Jul-9
2Ju
l-93
Jul-9
4Ju
l-95
Jul-9
6Ju
l-97
Jul-9
8Ju
l-99
Jul-0
0Ju
l-01
Jul-0
2Ju
l-03
Jul-0
4Ju
l-05
Jul-0
6
Figure 8 Ratio of concessional copayment to AWE, July 1991 to June 2007
0
0.001
0.002
0.003
0.004
0.005
0.006
0.007
Jul-9
1Ju
l-92
Jul-9
3Ju
l-94
Jul-9
5Ju
l-96
Jul-9
7Ju
l-98
Jul-9
9Ju
l-00
Jul-0
1Ju
l-02
Jul-0
3Ju
l-04
Jul-0
5Ju
l-06
Key Aspects of the Australian PBS
PIP Working Paper No. 35 12
Figure 9 Ratio of general safety net limit to AWE, July 1991 to June 2007
0.0
0.2
0.4
0.6
0.8
1.0
1.2
1.4Ju
l-91
Jul-9
2Ju
l-93
Jul-9
4Ju
l-95
Jul-9
6Ju
l-97
Jul-9
8Ju
l-99
Jul-0
0Ju
l-01
Jul-0
2Ju
l-03
Jul-0
4Ju
l-05
Jul-0
6
Figure 10 Ratio of concessional safety net limit to AWE, July 1991 to June 2007
0.00
0.05
0.10
0.15
0.20
0.25
0.30
0.35
Jul-9
1Ju
l-92
Jul-9
3Ju
l-94
Jul-9
5Ju
l-96
Jul-9
7Ju
l-98
Jul-9
9Ju
l-00
Jul-0
1Ju
l-02
Jul-0
3Ju
l-04
Jul-0
5Ju
l-06
Key Aspects of the Australian PBS
PIP Working Paper No. 35 13
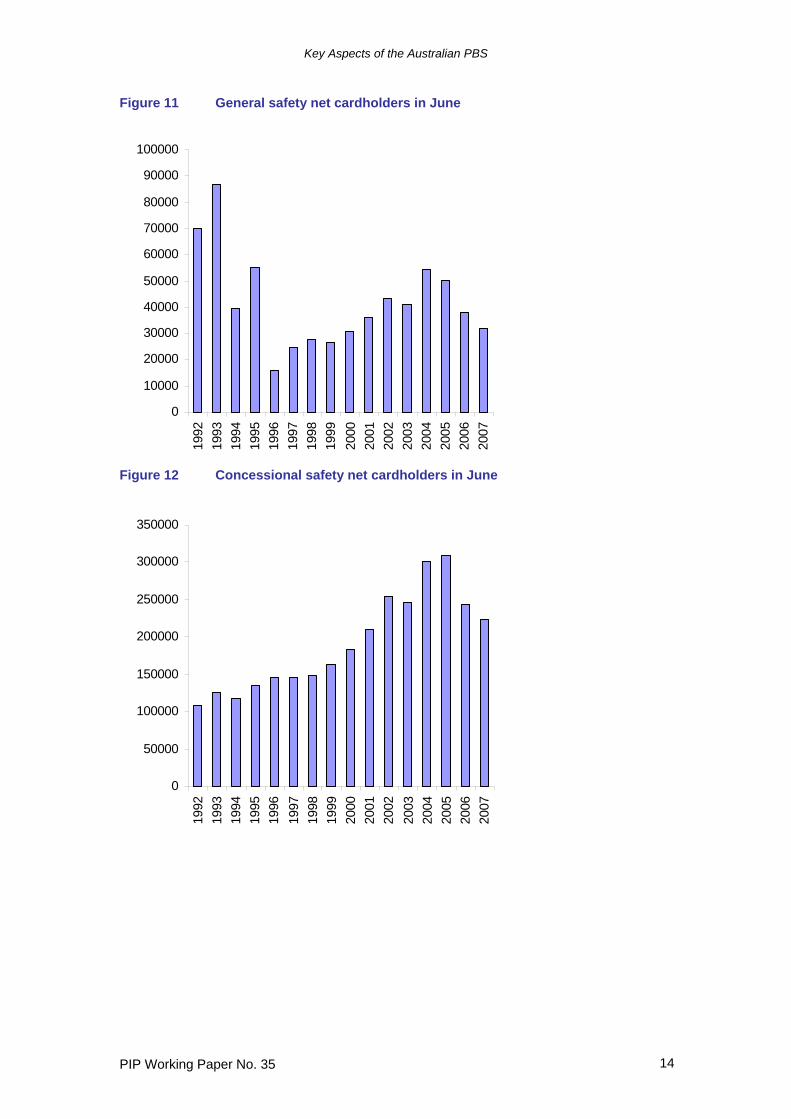
A different way of seeing this is to look at the number of people holding safety net cards over this period (DoHA 2006c, various issues). As noted earlier the number of cardholders increases rapidly throughout the year as more people reach the expenditure limit. In 2005 for instance there were 46 cardholders in January, 375,020 in June and 1,969,200 in December. To see the trend in cardholders therefore the number at June each year is shown in Figures 11 and 12 for general and concessional patients. This shows clearly the impact of the increased limits for general patients as the number of cardholders fell substantially in 1994 and 1996 and again in 2006 and 2007. The number of concessional cardholders rose strongly through the period and especially in 2004 but fell significantly in both 2006 and 2007. A comparison with Table 3 indicates that these falls coincided with an increase in the number of copayments necessary to make the safety net limit. The flagged increases in the number of copayments to the year 2009 will further reduce the number of safety net cardholders. To influence the number of safety net cardholders, the Government has two instruments – the level of the safety net limit and the level of the copayment. As described above and shown in Table 3, until recently the Government’s policy for concessional cardholders has been to set these together to ensure that the number of copayments to reach the safety net limit has been constant. From 1997 to 2004 this was also the case for general patients, but at other times the safety net limit and the copayment have been set somewhat independently of each other. The relative impact of the two policy instruments can be determined econometrically by regressing the number of safety net cardholders on the safety net limit and the copayment. In the regression results reported in Tables 4 and 5 below the variables are defined as follows
constant time =i for year i di Dummy variable for month i gcard Number of general safety net cardholders ccard Number of concessional safety net cardholders gcp The level of the general copayment, $ ccp The level of the concessional copayment, $ glevel The general safety net limit, $ clevel The concessional safety net limit, $ gncp The number of general copayments to reach the safety net limit = glevel/gcp cncp The number of concessional copayments to reach the safety net limit = clevel/ccp lgcard Natural logarithm of gcard lccard Natural logarithm of ccard lgcp Natural logarithm of gcp lccp Natural logarithm of ccp lglevel Natural logarithm of glevel lclevel Natural logarithm of clevel lgncp Natural logarithm of gncp lcncp Natural logarithm of cncp
Key Aspects of the Australian PBS
PIP Working Paper No. 35 14
Figure 11 General safety net cardholders in June
0
10000
20000
30000
40000
50000
60000
70000
80000
90000
100000
1992
1993
1994
1995
1996
1997
1998
1999
2000
2001
2002
2003
2004
2005
2006
2007
Figure 12 Concessional safety net cardholders in June
0
50000
100000
150000
200000
250000
300000
350000
1992
1993
1994
1995
1996
1997
1998
1999
2000
2001
2002
2003
2004
2005
2006
2007
Key Aspects of the Australian PBS
PIP Working Paper No. 35 15
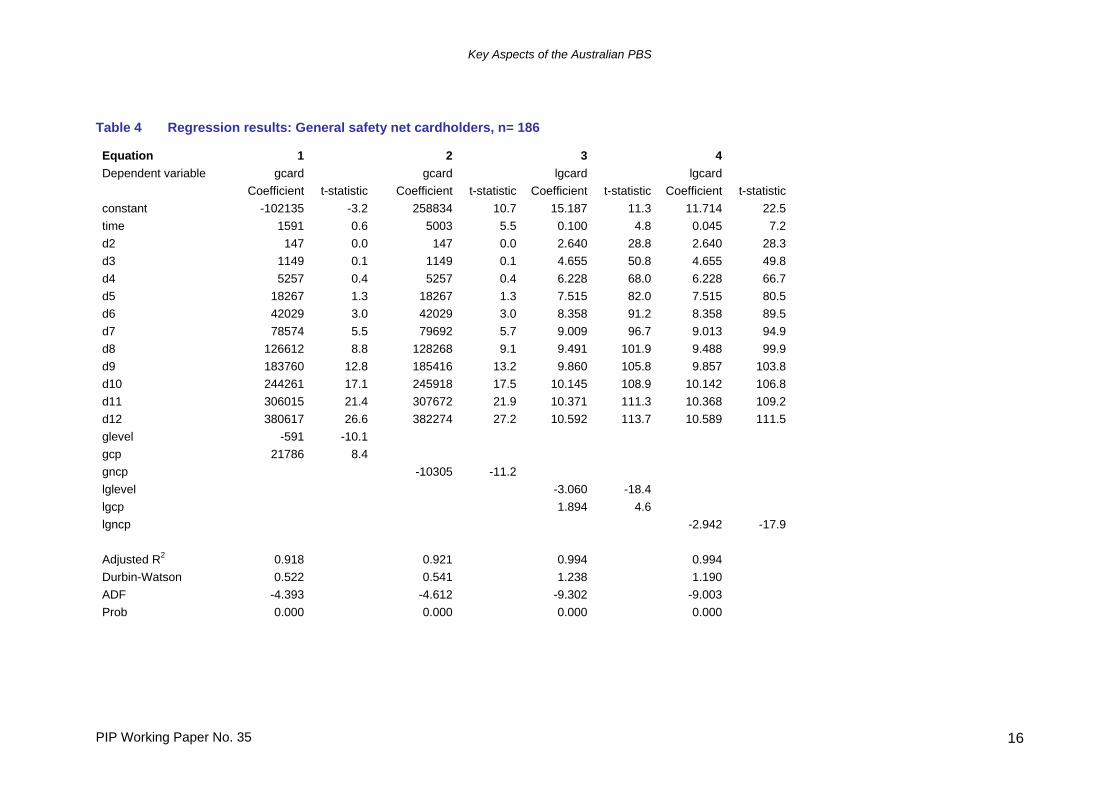
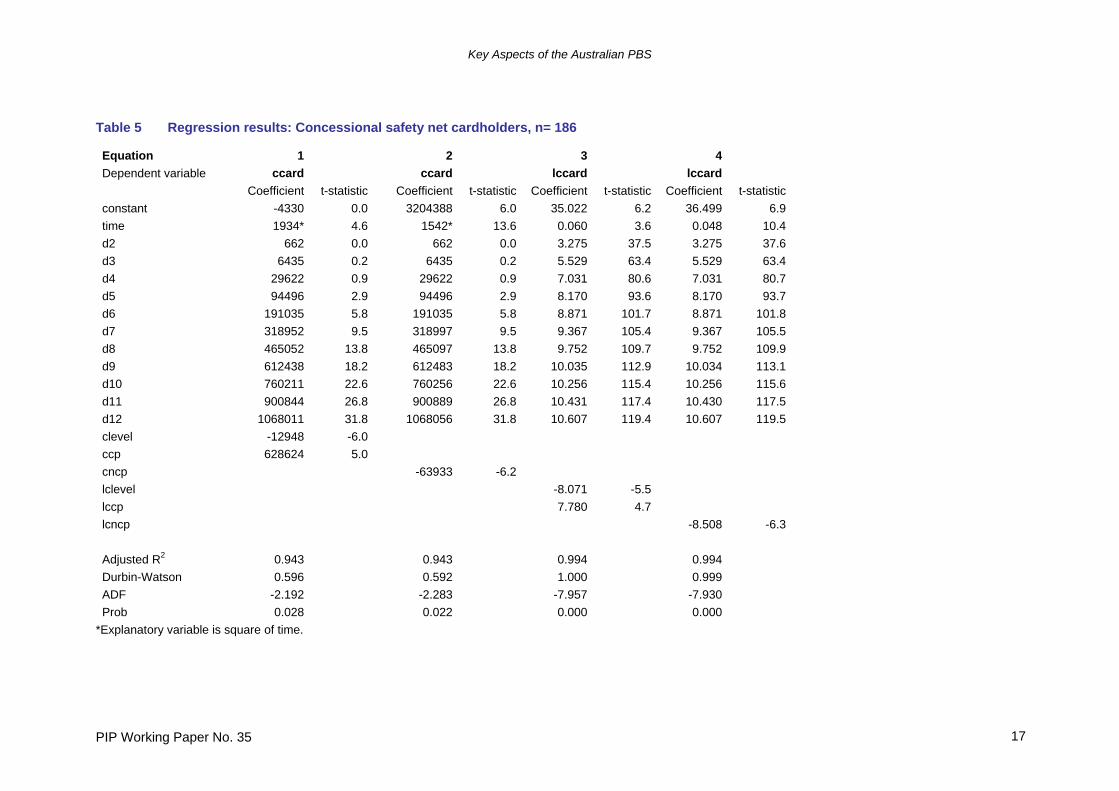
The tables show results for alternative specifications of the equation for the number of safety net level cardholders using monthly data from January 1992 to June 2007. The first two results are for equations using untransformed variables while the second two results have variables expressed as natural logarithms except for the time trend and monthly seasonal dummy variables which are untransformed. The time trend is used to account for any general increase in the number of general or concessional patients over time while the monthly dummy variables are used to control for the large differentials in monthly values across the year2. To ensure that regression results were not spurious, they were tested for cointegration among the variables by calculating the Augmented Dickey-Fuller statistics on the residuals from the equation. The values of these statistics all indicate acceptance of the null hypothesis of cointegration at the 5% probability level. The ADF statistic and probability level are reported for all regression results. In Table 4 for the number of general safety net cardholders, all equations have coefficients for explanatory variables that have the expected sign and are generally significant at the 5% level. The logarithmic specification performs better than the one using variables that are untransformed, with all variables having very significant coefficients, and the fit statistics being better. In general there is no difference in fit between the equation that contains both the safety net limit and the copayment level as explanatory variables (glevel and gcp) and the equation which only has the number of copayments to reach the safety net limit (gncp = glevel/gcp). The logarithmic specification equation 3 in Table 4 evaluated using values for 2007 suggests that a 10% increase in the general safety net limit will reduce the number of general safety net cardholders by around 25.3% all other things being equal, while a 10% increase in the general copayment will increase the number of cardholders by 19.8%. If equation 4 is evaluated using values for 2007, an increase of 10% in the number of copayments necessary to reach the safety net limit will reduce the number of cardholders by 24.4%. The equations for concessional safety net cardholders in Table 5 produce similar results. Again the logarithmic specification is superior in terms of overall fit and significance of the coefficients, and there is little to choose between the version that contains both the safety net limit and the copayment level as explanatory variables (clevel and ccp) and the equation which only has the number of copayments to reach the safety net limit (cncp). Evaluating equation 3 using values for 2007 suggests that a 10% increase in the concessional safety net limit will reduce the number of concessional safety net cardholders by around 53.7% all other things being equal, while a 10% increase in the concessional copayment will increase the number of cardholders by 109%. From equation 4, an increase of 10% in the number of copayments necessary to reach the safety net limit will reduce the number of cardholders by 55.6%. In interpreting these results however it should be remembered that there were only two increases in the number of copayments necessary to reach the safety net limit (in January 2006 and January 2007) so the effect of this change may not be fully reflected in the regression results.
2 Replacing the time trend with either the number of concessional cardholders or the number of general patients as relevant and re-estimating over the shorter time period from January 2001 to June 2007 for which the concessional cardholder data is available gives somewhat poorer results with the coefficients on these variables generally insignificant.
Key Aspects of the Australian PBS
PIP Working Paper No. 35 16
Table 4 Regression results: General safety net cardholders, n= 186 Equation 1 2 3 4 Dependent variable gcard gcard lgcard lgcard Coefficient t-statistic Coefficient t-statistic Coefficient t-statistic Coefficient t-statistic constant -102135 -3.2 258834 10.7 15.187 11.3 11.714 22.5 time 1591 0.6 5003 5.5 0.100 4.8 0.045 7.2 d2 147 0.0 147 0.0 2.640 28.8 2.640 28.3 d3 1149 0.1 1149 0.1 4.655 50.8 4.655 49.8 d4 5257 0.4 5257 0.4 6.228 68.0 6.228 66.7 d5 18267 1.3 18267 1.3 7.515 82.0 7.515 80.5 d6 42029 3.0 42029 3.0 8.358 91.2 8.358 89.5 d7 78574 5.5 79692 5.7 9.009 96.7 9.013 94.9 d8 126612 8.8 128268 9.1 9.491 101.9 9.488 99.9 d9 183760 12.8 185416 13.2 9.860 105.8 9.857 103.8 d10 244261 17.1 245918 17.5 10.145 108.9 10.142 106.8 d11 306015 21.4 307672 21.9 10.371 111.3 10.368 109.2 d12 380617 26.6 382274 27.2 10.592 113.7 10.589 111.5 glevel -591 -10.1 gcp 21786 8.4 gncp -10305 -11.2 lglevel -3.060 -18.4 lgcp 1.894 4.6 lgncp -2.942 -17.9 Adjusted R2 0.918 0.921 0.994 0.994 Durbin-Watson 0.522 0.541 1.238 1.190 ADF -4.393 -4.612 -9.302 -9.003 Prob 0.000 0.000 0.000 0.000
Key Aspects of the Australian PBS
PIP Working Paper No. 35 17
Table 5 Regression results: Concessional safety net cardholders, n= 186 Equation 1 2 3 4 Dependent variable ccard ccard lccard lccard Coefficient t-statistic Coefficient t-statistic Coefficient t-statistic Coefficient t-statistic constant -4330 0.0 3204388 6.0 35.022 6.2 36.499 6.9 time 1934* 4.6 1542* 13.6 0.060 3.6 0.048 10.4 d2 662 0.0 662 0.0 3.275 37.5 3.275 37.6 d3 6435 0.2 6435 0.2 5.529 63.4 5.529 63.4 d4 29622 0.9 29622 0.9 7.031 80.6 7.031 80.7 d5 94496 2.9 94496 2.9 8.170 93.6 8.170 93.7 d6 191035 5.8 191035 5.8 8.871 101.7 8.871 101.8 d7 318952 9.5 318997 9.5 9.367 105.4 9.367 105.5 d8 465052 13.8 465097 13.8 9.752 109.7 9.752 109.9 d9 612438 18.2 612483 18.2 10.035 112.9 10.034 113.1 d10 760211 22.6 760256 22.6 10.256 115.4 10.256 115.6 d11 900844 26.8 900889 26.8 10.431 117.4 10.430 117.5 d12 1068011 31.8 1068056 31.8 10.607 119.4 10.607 119.5 clevel -12948 -6.0 ccp 628624 5.0 cncp -63933 -6.2 lclevel -8.071 -5.5 lccp 7.780 4.7 lcncp -8.508 -6.3 Adjusted R2 0.943 0.943 0.994 0.994 Durbin-Watson 0.596 0.592 1.000 0.999 ADF -2.192 -2.283 -7.957 -7.930 Prob 0.028 0.022 0.000 0.000
*Explanatory variable is square of time.
Key Aspects of the Australian PBS
PIP Working Paper No. 35 18
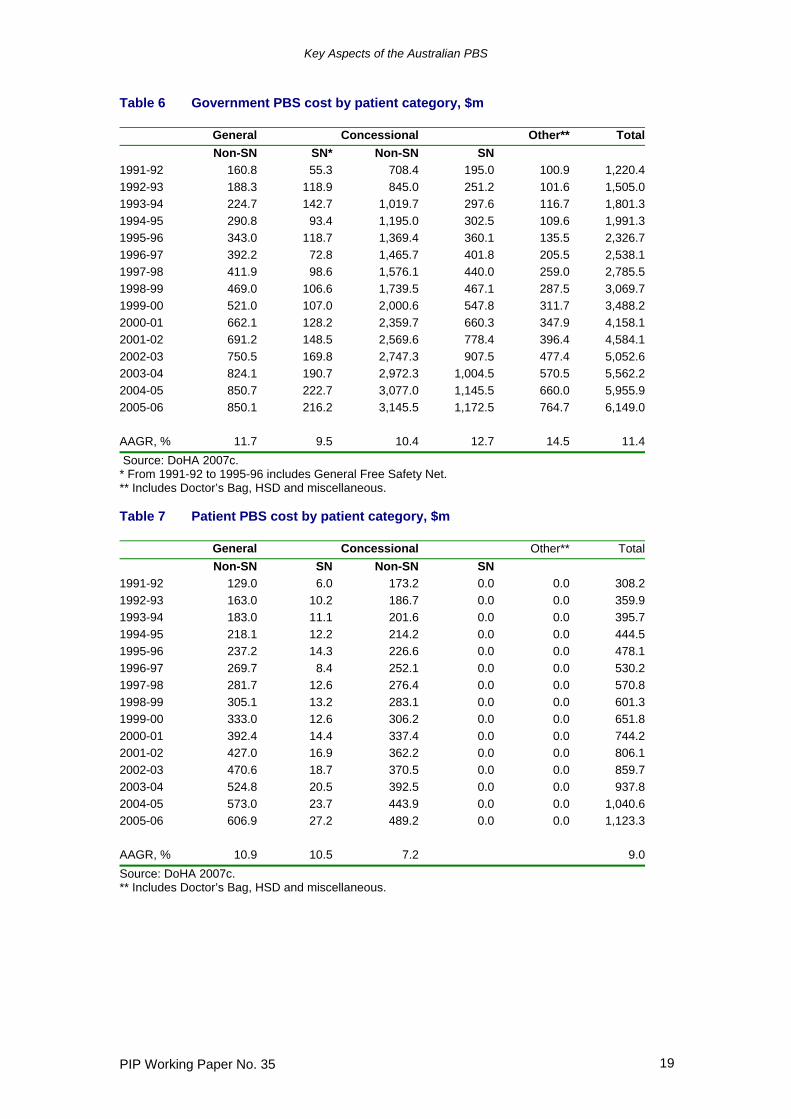
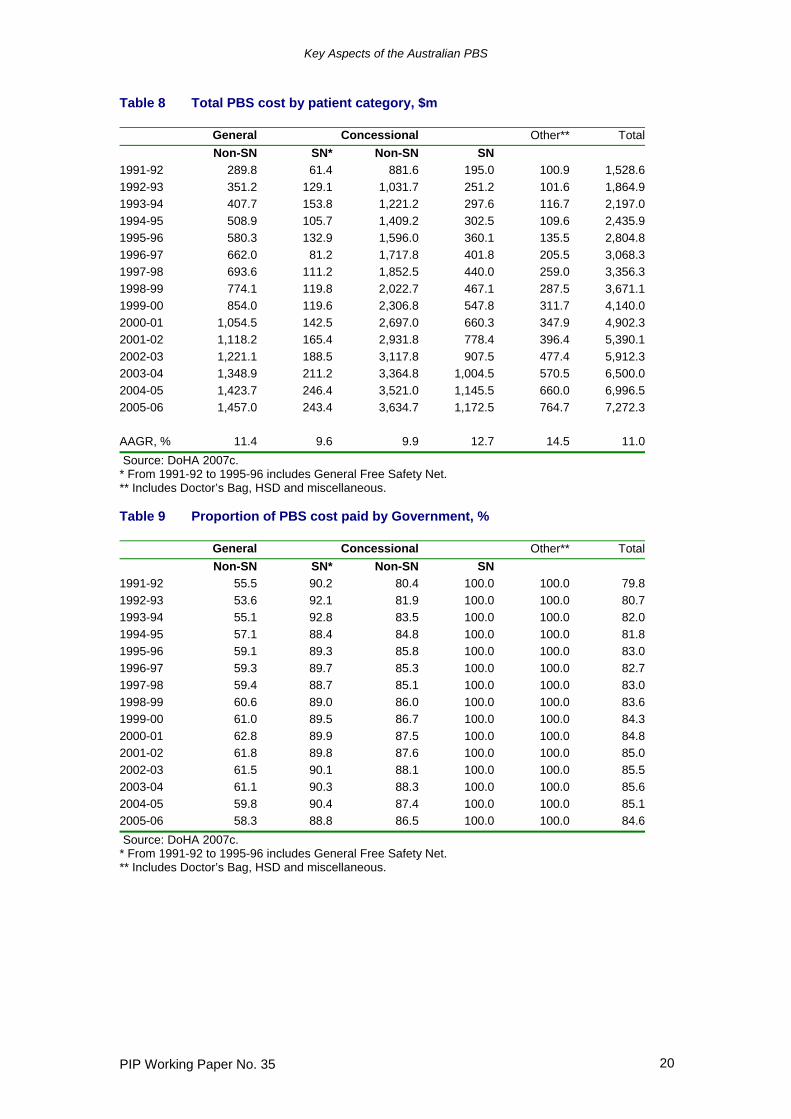
To see the effect of the new policy from 2006 to 2009 equations 3 and 4 for both types of cardholders were evaluated using known values for June 2006 and 2007 and assuming the copayments increase by 2% per annum in the next two years. Given the announced policy of increasing the number of copayments necessary to reach the safety net limit by 2 per annum to 2009, the value of the safety net limit can also be estimated. Substituting these values in equation 3 gives a decrease of 26.4% and 58.3% in the number of general and concessional safety net cardholders between 2006 and 2009 due to the impact of the new policy. Using equation 4 gives reductions of 30.2% and 52.8% respectively. The policy of increasing the safety net limit by the value of two copayments per year will therefore have a very significant impact on the numbers of patients eligible to obtain PBS medicines at reduced cost and represents a major shift in the proportion of PBS cost borne by patients rather than the Government. Tables 6 to 8 show how much of the cost of PBS medicines incurred by each patient category is paid for by the Government and the patient. Compound average annual growth rates from 1991-92 to 2005-06 are given in the last row of each table. It should be remembered when considering these tables that the values reported for General Non-safety Net patients are just for medicines with a dispensed price higher than the general copayment level. This means that the values in this category understate the true amount paid by these patients for the medicines they consume (the Patient Cost) and the overall cost of these medicines (the Total Cost), but not the amount paid by the Government (the Government Cost). The “Other” category in these tables includes medicines consumed in hospitals under the Section 100 provisions and other PBS programs as listed earlier. The expenditure in this category is for medicines that involve no charge to the patient. General patients accounted for 23.4% of total cost in 2005-06, with concessional patients at 66.1% and “Other” at 10.5%. Concessional and general safety net patients represented 16.1% and 3.3% respectively. As the tables show, the growth rate for general safety net patients has been more varied and lower overall than other categories because of the impact of the safety net limits. By contrast, the growth of concessional safety net patients has been the largest of all categories, except for the “other” category. General patients meet well over half of the costs of the PBS medicines they consume because of the higher copayments, meaning that concessional patients figure more prominently in the costs paid by the Government, being 70.2% of the total. The Government paid for 58.3%, 88.8%, and 86.5% of the costs of medicines for general non-safety net patients, general safety net patients and concessional non-safety net patients in 2005-06. As Table 9 demonstrates these percentages have been falling in recent years especially for general patients.
Key Aspects of the Australian PBS
PIP Working Paper No. 35 19
Table 6 Government PBS cost by patient category, $m
General Concessional Other** TotalNon-SN SN* Non-SN SN
1991-92 160.8 55.3 708.4 195.0 100.9 1,220.41992-93 188.3 118.9 845.0 251.2 101.6 1,505.01993-94 224.7 142.7 1,019.7 297.6 116.7 1,801.31994-95 290.8 93.4 1,195.0 302.5 109.6 1,991.31995-96 343.0 118.7 1,369.4 360.1 135.5 2,326.71996-97 392.2 72.8 1,465.7 401.8 205.5 2,538.11997-98 411.9 98.6 1,576.1 440.0 259.0 2,785.51998-99 469.0 106.6 1,739.5 467.1 287.5 3,069.71999-00 521.0 107.0 2,000.6 547.8 311.7 3,488.22000-01 662.1 128.2 2,359.7 660.3 347.9 4,158.12001-02 691.2 148.5 2,569.6 778.4 396.4 4,584.12002-03 750.5 169.8 2,747.3 907.5 477.4 5,052.62003-04 824.1 190.7 2,972.3 1,004.5 570.5 5,562.22004-05 850.7 222.7 3,077.0 1,145.5 660.0 5,955.92005-06 850.1 216.2 3,145.5 1,172.5 764.7 6,149.0 AAGR, % 11.7 9.5 10.4 12.7 14.5 11.4 Source: DoHA 2007c. * From 1991-92 to 1995-96 includes General Free Safety Net. ** Includes Doctor’s Bag, HSD and miscellaneous. Table 7 Patient PBS cost by patient category, $m
General Concessional Other** TotalNon-SN SN Non-SN SN
1991-92 129.0 6.0 173.2 0.0 0.0 308.21992-93 163.0 10.2 186.7 0.0 0.0 359.91993-94 183.0 11.1 201.6 0.0 0.0 395.71994-95 218.1 12.2 214.2 0.0 0.0 444.51995-96 237.2 14.3 226.6 0.0 0.0 478.11996-97 269.7 8.4 252.1 0.0 0.0 530.21997-98 281.7 12.6 276.4 0.0 0.0 570.81998-99 305.1 13.2 283.1 0.0 0.0 601.31999-00 333.0 12.6 306.2 0.0 0.0 651.82000-01 392.4 14.4 337.4 0.0 0.0 744.22001-02 427.0 16.9 362.2 0.0 0.0 806.12002-03 470.6 18.7 370.5 0.0 0.0 859.72003-04 524.8 20.5 392.5 0.0 0.0 937.82004-05 573.0 23.7 443.9 0.0 0.0 1,040.62005-06 606.9 27.2 489.2 0.0 0.0 1,123.3 AAGR, % 10.9 10.5 7.2 9.0Source: DoHA 2007c. ** Includes Doctor’s Bag, HSD and miscellaneous.
Key Aspects of the Australian PBS
PIP Working Paper No. 35 20
Table 8 Total PBS cost by patient category, $m
General Concessional Other** TotalNon-SN SN* Non-SN SN
1991-92 289.8 61.4 881.6 195.0 100.9 1,528.61992-93 351.2 129.1 1,031.7 251.2 101.6 1,864.91993-94 407.7 153.8 1,221.2 297.6 116.7 2,197.01994-95 508.9 105.7 1,409.2 302.5 109.6 2,435.91995-96 580.3 132.9 1,596.0 360.1 135.5 2,804.81996-97 662.0 81.2 1,717.8 401.8 205.5 3,068.31997-98 693.6 111.2 1,852.5 440.0 259.0 3,356.31998-99 774.1 119.8 2,022.7 467.1 287.5 3,671.11999-00 854.0 119.6 2,306.8 547.8 311.7 4,140.02000-01 1,054.5 142.5 2,697.0 660.3 347.9 4,902.32001-02 1,118.2 165.4 2,931.8 778.4 396.4 5,390.12002-03 1,221.1 188.5 3,117.8 907.5 477.4 5,912.32003-04 1,348.9 211.2 3,364.8 1,004.5 570.5 6,500.02004-05 1,423.7 246.4 3,521.0 1,145.5 660.0 6,996.52005-06 1,457.0 243.4 3,634.7 1,172.5 764.7 7,272.3 AAGR, % 11.4 9.6 9.9 12.7 14.5 11.0 Source: DoHA 2007c. * From 1991-92 to 1995-96 includes General Free Safety Net. ** Includes Doctor’s Bag, HSD and miscellaneous. Table 9 Proportion of PBS cost paid by Government, %
General Concessional Other** TotalNon-SN SN* Non-SN SN
1991-92 55.5 90.2 80.4 100.0 100.0 79.81992-93 53.6 92.1 81.9 100.0 100.0 80.71993-94 55.1 92.8 83.5 100.0 100.0 82.01994-95 57.1 88.4 84.8 100.0 100.0 81.81995-96 59.1 89.3 85.8 100.0 100.0 83.01996-97 59.3 89.7 85.3 100.0 100.0 82.71997-98 59.4 88.7 85.1 100.0 100.0 83.01998-99 60.6 89.0 86.0 100.0 100.0 83.61999-00 61.0 89.5 86.7 100.0 100.0 84.32000-01 62.8 89.9 87.5 100.0 100.0 84.82001-02 61.8 89.8 87.6 100.0 100.0 85.02002-03 61.5 90.1 88.1 100.0 100.0 85.52003-04 61.1 90.3 88.3 100.0 100.0 85.62004-05 59.8 90.4 87.4 100.0 100.0 85.12005-06 58.3 88.8 86.5 100.0 100.0 84.6 Source: DoHA 2007c. * From 1991-92 to 1995-96 includes General Free Safety Net. ** Includes Doctor’s Bag, HSD and miscellaneous.
Key Aspects of the Australian PBS
PIP Working Paper No. 35 21
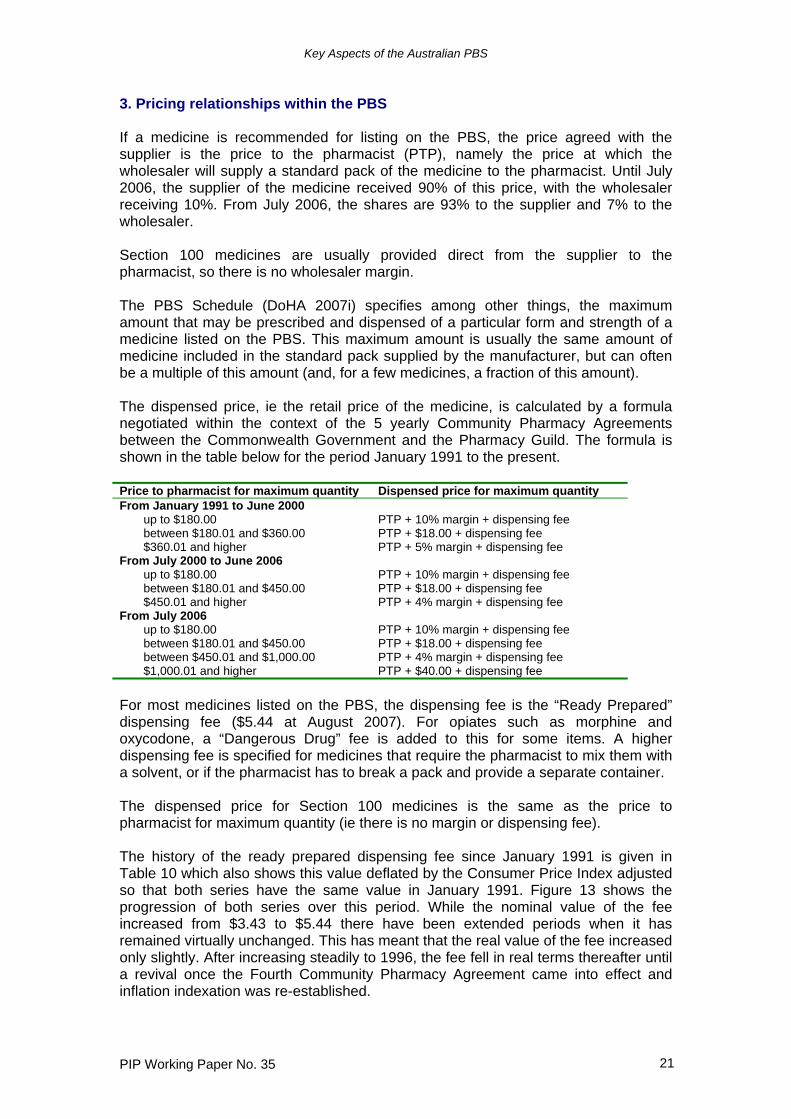
3. Pricing relationships within the PBS If a medicine is recommended for listing on the PBS, the price agreed with the supplier is the price to the pharmacist (PTP), namely the price at which the wholesaler will supply a standard pack of the medicine to the pharmacist. Until July 2006, the supplier of the medicine received 90% of this price, with the wholesaler receiving 10%. From July 2006, the shares are 93% to the supplier and 7% to the wholesaler. Section 100 medicines are usually provided direct from the supplier to the pharmacist, so there is no wholesaler margin. The PBS Schedule (DoHA 2007i) specifies among other things, the maximum amount that may be prescribed and dispensed of a particular form and strength of a medicine listed on the PBS. This maximum amount is usually the same amount of medicine included in the standard pack supplied by the manufacturer, but can often be a multiple of this amount (and, for a few medicines, a fraction of this amount). The dispensed price, ie the retail price of the medicine, is calculated by a formula negotiated within the context of the 5 yearly Community Pharmacy Agreements between the Commonwealth Government and the Pharmacy Guild. The formula is shown in the table below for the period January 1991 to the present. Price to pharmacist for maximum quantity Dispensed price for maximum quantity From January 1991 to June 2000
up to $180.00 PTP + 10% margin + dispensing fee between $180.01 and $360.00 PTP + $18.00 + dispensing fee $360.01 and higher PTP + 5% margin + dispensing fee
From July 2000 to June 2006 up to $180.00 PTP + 10% margin + dispensing fee between $180.01 and $450.00 PTP + $18.00 + dispensing fee $450.01 and higher PTP + 4% margin + dispensing fee
From July 2006 up to $180.00 PTP + 10% margin + dispensing fee between $180.01 and $450.00 PTP + $18.00 + dispensing fee between $450.01 and $1,000.00 PTP + 4% margin + dispensing fee $1,000.01 and higher PTP + $40.00 + dispensing fee
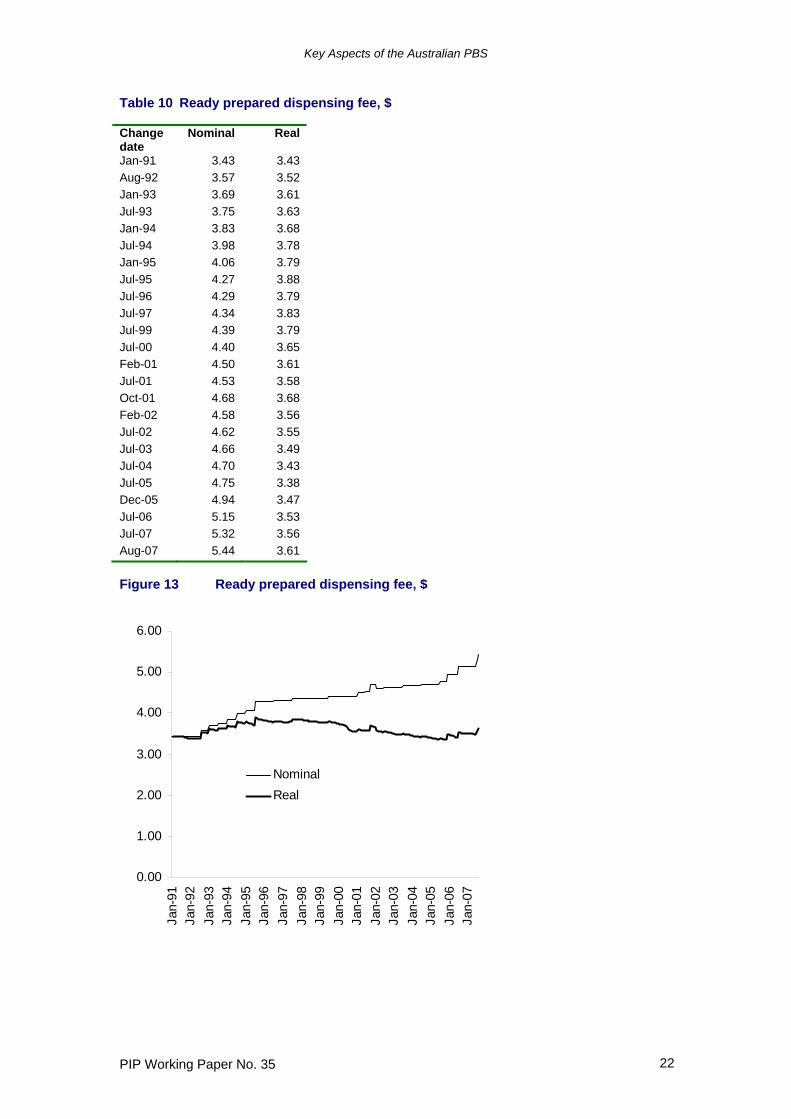
For most medicines listed on the PBS, the dispensing fee is the “Ready Prepared” dispensing fee ($5.44 at August 2007). For opiates such as morphine and oxycodone, a “Dangerous Drug” fee is added to this for some items. A higher dispensing fee is specified for medicines that require the pharmacist to mix them with a solvent, or if the pharmacist has to break a pack and provide a separate container. The dispensed price for Section 100 medicines is the same as the price to pharmacist for maximum quantity (ie there is no margin or dispensing fee). The history of the ready prepared dispensing fee since January 1991 is given in Table 10 which also shows this value deflated by the Consumer Price Index adjusted so that both series have the same value in January 1991. Figure 13 shows the progression of both series over this period. While the nominal value of the fee increased from $3.43 to $5.44 there have been extended periods when it has remained virtually unchanged. This has meant that the real value of the fee increased only slightly. After increasing steadily to 1996, the fee fell in real terms thereafter until a revival once the Fourth Community Pharmacy Agreement came into effect and inflation indexation was re-established.
Key Aspects of the Australian PBS
PIP Working Paper No. 35 22
Table 10 Ready prepared dispensing fee, $ Change date
Nominal Real
Jan-91 3.43 3.43 Aug-92 3.57 3.52 Jan-93 3.69 3.61 Jul-93 3.75 3.63 Jan-94 3.83 3.68 Jul-94 3.98 3.78 Jan-95 4.06 3.79 Jul-95 4.27 3.88 Jul-96 4.29 3.79 Jul-97 4.34 3.83 Jul-99 4.39 3.79 Jul-00 4.40 3.65 Feb-01 4.50 3.61 Jul-01 4.53 3.58 Oct-01 4.68 3.68 Feb-02 4.58 3.56 Jul-02 4.62 3.55 Jul-03 4.66 3.49 Jul-04 4.70 3.43 Jul-05 4.75 3.38 Dec-05 4.94 3.47 Jul-06 5.15 3.53 Jul-07 5.32 3.56 Aug-07 5.44 3.61 Figure 13 Ready prepared dispensing fee, $
0.00
1.00
2.00
3.00
4.00
5.00
6.00
Jan-
91Ja
n-92
Jan-
93Ja
n-94
Jan-
95Ja
n-96
Jan-
97Ja
n-98
Jan-
99Ja
n-00
Jan-
01Ja
n-02
Jan-
03Ja
n-04
Jan-
05Ja
n-06
Jan-
07
NominalReal
Key Aspects of the Australian PBS
PIP Working Paper No. 35 23
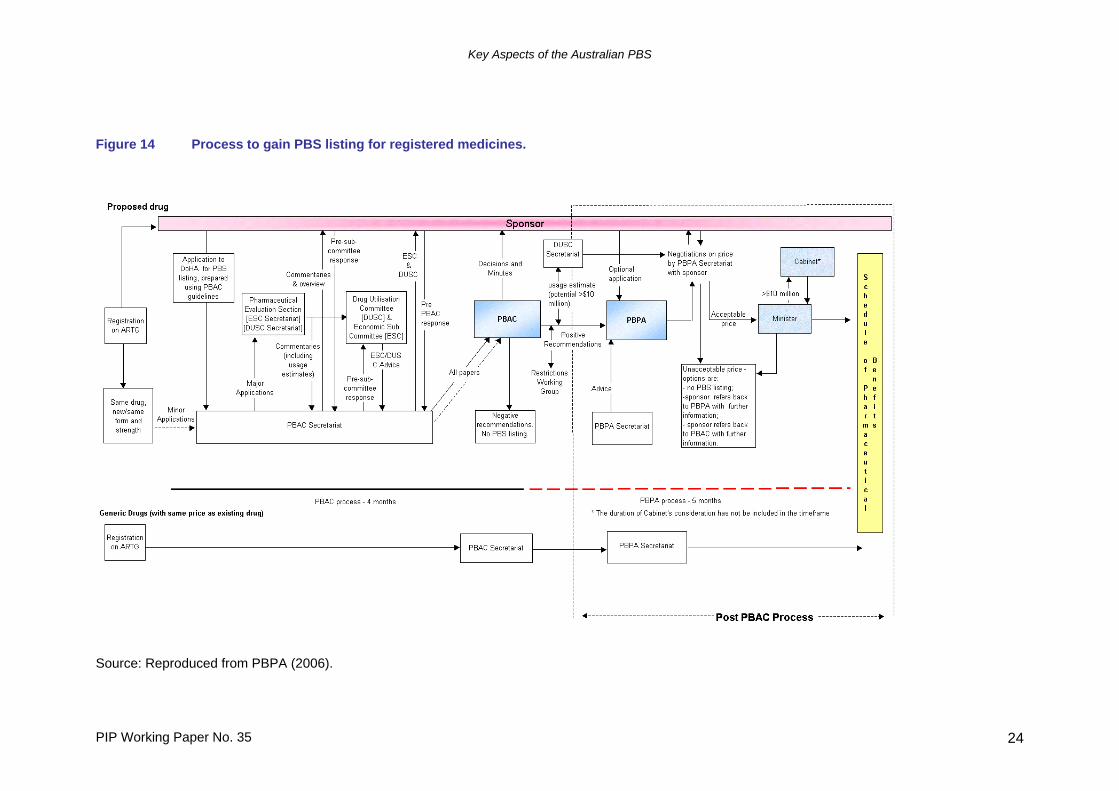
4. PBS listing and pricing procedures As is the case in most comparable countries, the PBS operates a positive list (Jacobzone 2000), requiring suppliers (“sponsors”) to apply to have their medicine made available for subsidy. Negative lists, on the other hand, allow all medicines to be subsidised unless specifically excluded by the listing authority. The United Kingdom is an example of a country operating a scheme with a negative list. The process to gain PBS listing is shown in Figure A.2. The two main organisations involved are the Pharmaceutical Benefits Advisory Committee (PBAC) which recommends to the Minister for Health and Ageing which medicines and medicinal preparations should be listed on the PBS and under what conditions, and the Pharmaceutical Benefits Pricing Authority (PBPA) which recommends to the Minister the price at which they should be listed. The PBAC was established as an independent statutory body in 1953 and the PBPA was formed in January 1988. Medicines with an estimated cost to the PBS of over $5 million per year must be approved by the Department of Finance and Administration, while those expected to cost over $10 million per year must be approved by the Cabinet of the Commonwealth Government. For medicines expected to cost less than $5 million, the decision on listing is made by the Minister for Health and Ageing. In response to a range of queries and complaints about the nature and transparency of the procedures for listing and pricing medicines, the PBPA has provided a regularly revised outline of these processes in its Policies, Procedures and Methods Used in the Pricing of Pharmaceutical Products, the most recent edition of which is for May 2006 (PBPA 2006). In addition, the DoHA has prepared Guidelines for preparing submissions to the Pharmaceutical Benefits Advisory Committee (Guidelines) (DoHA 2006d) to assist sponsors. The latest and most comprehensively revised edition of this latter document is for December 2006. These two documents are the source for much of the description of the processes of the PBS in this section. The PBS Guidelines were developed based on a body of economic theory and analysis, known as pharmacoeconomics, that was developed to provide a rationale for decisions about the price to be paid for medical treatments and the conditions of their availability. The application of this literature to procedures for pricing and listing PBS medicines was summarised in an influential report to the then Department of Health, Housing, Local Government and Community Services in December 1989 (Evans et al 1993), which sets out in some detail the arguments in favour of the use of cost-minimisation, cost-effectiveness, and cost-utility analysis and against the use of cost-benefit analysis. The report draws on several sources, principally, Drummond (1987), Torrance (1987) and Torrance and Feeny (1989). A partial list of the subsequent literature on aspects of the application of economic analysis to PBAC decision making is available at DoHA (2005d). 4.1 PBAC evaluation of medicines Prior to a decision by the PBAC, a medicine seeking a PBS listing must be approved by the Therapeutic Goods Administration (TGA), the body responsible in Australia for approving all medicines, and be registered on the Australian Register of Therapeutic Goods (ARTG) for specific therapeutic indications. Submissions to the PBAC however, can be made once a positive recommendation by officers of the TGA has been made to its Australian Drug Evaluation Committee (ADEC) and prior to final marketing approval.
Key Aspects of the Australian PBS
PIP Working Paper No. 35 24
Figure 14 Process to gain PBS listing for registered medicines.
Source: Reproduced from PBPA (2006).
Key Aspects of the Australian PBS
PIP Working Paper No. 35 25
An amendment to the National Health Act in 1987 required the PBAC to consider comparative effectiveness and cost in making its recommendations. From 1991, submissions by sponsors began to include an economic analysis and from January 1993 this was made mandatory (Birkett et al 2001). The PBAC describes the guidelines governing its activities as follows:
“To assess value for money, PBAC considers the clinical place, overall effectiveness, cost and cost-effectiveness of a proposed drug compared with other drugs already listed in the PBS for the same, or similar, indications. Where there is no listed alternative, PBAC considers the clinical place, overall effectiveness, cost and cost-effectiveness of the proposed drug compared with standard medical care. On the basis of its community usage, PBAC recommends maximum quantities and repeats and may also recommend restrictions as to the indications where PBS subsidy is available… For acute medical conditions, the maximum quantity is usually sufficient for a normal single course of treatment (bearing in mind the size of the manufacturer’s pack). For chronic medical conditions, the maximum quantity and repeats usually provide up to six months’ therapy, depending on the need for clinical review of the condition to be treated.” (DoHA 2006d Guidelines p 5)
Further,
“A new drug may be recommended for listing if: • it is needed for the prevention or treatment of significant medical
conditions not already covered, or inadequately covered, by drugs in the existing list and is of acceptable cost-effectiveness
• it is more effective or less toxic (or both) than a drug already listed for the same indications and is of acceptable cost-effectiveness
• it is at least as effective and safe as a drug already listed for the same indications and is of similar or better cost-effectiveness.” (DoHA 2006d Guidelines p 6)
4.2 Submissions to the PBAC Suppliers proposing to have a new product listed on the PBS are required to follow a specified application procedure (as described in the Guidelines) and to provide a range of information including the cost of the new medicine and its proposed price, as well as an economic evaluation in order for the PBAC to ‘evaluate the costs associated with the new drug, or indication, against the benefits gained from its use, and compare that cost-outcome ratio to existing therapy. New drugs are most commonly recommended by the PBAC on the basis of either cost minimisation or an acceptable incremental cost effectiveness ratio (ICER)’ (PBPA 2006, p 12). Minor submissions to the PBAC do not require an economic evaluation and these cover
• listing a new form (or strength) of a currently listed drug for which a price advantage is not requested, or for which the likely volume and proportion of use is expected to be small
• changing the maximum quantity per prescription of a currently listed drug • changing the number of repeats per prescription of a currently listed drug • clarifying the wording of a restriction (while not altering the intended use).
Key Aspects of the Australian PBS
PIP Working Paper No. 35 26
New brands of listed medicines, ie generic equivalents, are dealt with by the DoHA rather than the PBAC. On the other hand, major submissions are required when applying to
• list a new drug (including a new fixed combination product, a new nutritional product, a new vaccine or a new orphan drug)
• substantially change the listing of a currently restricted drug (including a new indication or a derestriction)
• enable a review of the comparative cost-effectiveness of a currently listed drug in order to change a PBAC recommendation to the PBPA on its therapeutic relativity or price advantage
• list a new form (or strength) of a currently listed drug for which a price advantage is requested.
4.3 Types of economic analysis The guidelines for a major submission to the PBAC specify that the submission have 6 sections (A to F) of which the most important are those that compare the outcomes from clinical trials of the proposed medicine and its comparator (Section B), the translation of this evidence into the Australian PBS context (Section C) and the presentation of the economic analysis based on the evidence in these two sections (Section D). The evidence presented from clinical trials is used to guide the choice of which type of economic analysis is recommended to the sponsor - in particular the choice between a “cost-minimisation” analysis and a “cost-effectiveness” analysis. After a discussion of what the clinical trial data should encompass, the guidelines present a table in Section B (p 88) which categorises the comparison of clinical trial data for the proposed medicine and its comparator in two dimensions – comparative effectiveness in treating the condition for the medicine seeking listing and the comparative safety in terms of side effects and adverse events associated with use of the medicine. For both dimensions there are four states – “Inferior”, “Uncertain”, “Noninferior”, and “Superior”. While the first and last of these categories are relatively straightforward, “Uncertain and “Noninferior” require further elaboration.
“‘Uncertainty’ covers concepts such as inadequate minimisation of important sources of bias, lack of statistical significance in an underpowered trial, detecting clinically unimportant therapeutic differences, inconsistent results across trials, and trade-offs within the comparative effectiveness and/or the comparative safety considerations (eg where the toxicity profiles of the compared drugs differ, with some aspects worse for the proposed drug and some aspects better for the proposed drug).” (DoHA 2006d Guidelines p88)
“Noninferiority means that, in terms of effectiveness, the proposed drug is no worse than its main comparator. It is used to support a claim of equivalence because it is not adequate to demonstrate the absence of a statistically significant difference between the treatments to claim equivalence; such a lack of a significant difference might occur when the trials are too small to demonstrate a real difference in the effects of the interventions. The appropriate comparison to present is the point estimate of the difference with its 95% confidence interval. This allows PBAC to assess whether the confidence
Key Aspects of the Australian PBS
PIP Working Paper No. 35 27
interval contains the minimal clinically important difference.” (DoHA 2006d Guidelines p69) “The essential difference between assessing whether the proposed drug is superior or noninferior to the main comparator is that the 95% confidence interval for superiority excludes the possibility that there is no difference between the therapies, whereas the 95% confidence interval for noninferiority excludes the possibility that the proposed drug is inferior to a clinically important extent.” (DoHA 2006d Guidelines p88)
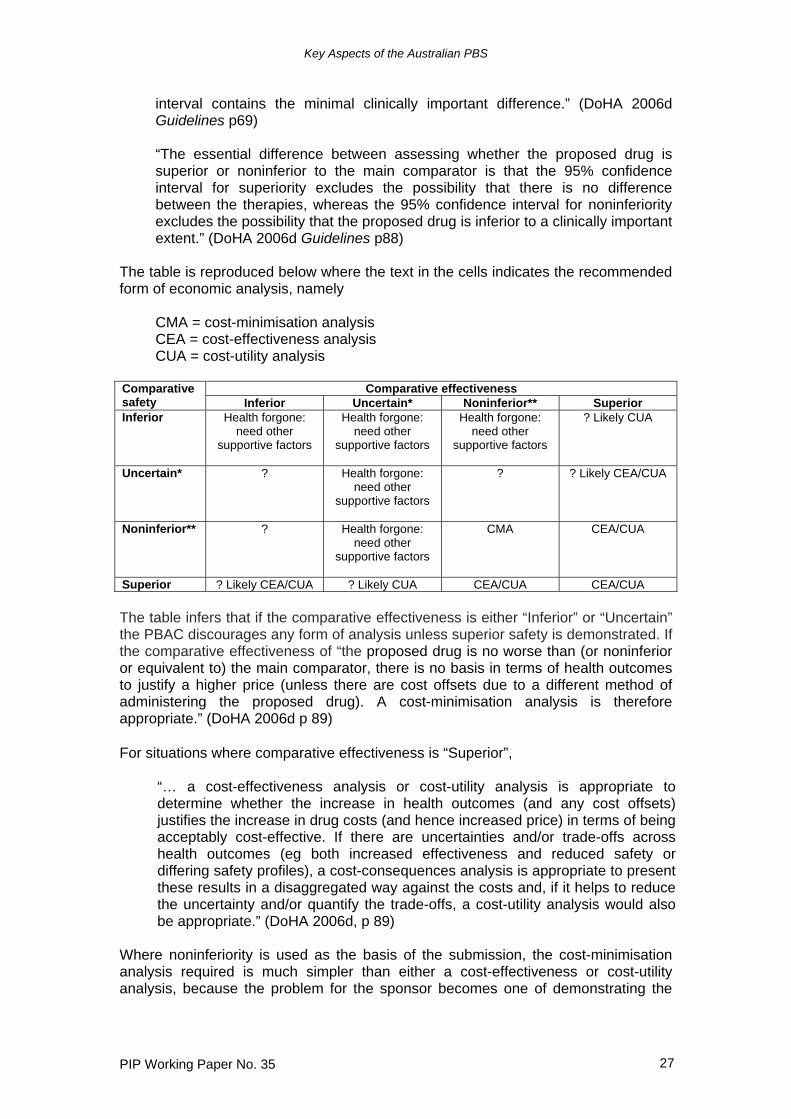
The table is reproduced below where the text in the cells indicates the recommended form of economic analysis, namely
CMA = cost-minimisation analysis CEA = cost-effectiveness analysis CUA = cost-utility analysis
Comparative effectiveness Comparative
safety Inferior Uncertain* Noninferior** Superior Inferior Health forgone:
need other supportive factors
Health forgone: need other
supportive factors
Health forgone: need other
supportive factors
? Likely CUA
Uncertain* ? Health forgone: need other
supportive factors
? ? Likely CEA/CUA
Noninferior** ? Health forgone: need other
supportive factors
CMA CEA/CUA
Superior ? Likely CEA/CUA ? Likely CUA CEA/CUA CEA/CUA The table infers that if the comparative effectiveness is either “Inferior” or “Uncertain” the PBAC discourages any form of analysis unless superior safety is demonstrated. If the comparative effectiveness of “the proposed drug is no worse than (or noninferior or equivalent to) the main comparator, there is no basis in terms of health outcomes to justify a higher price (unless there are cost offsets due to a different method of administering the proposed drug). A cost-minimisation analysis is therefore appropriate.” (DoHA 2006d p 89) For situations where comparative effectiveness is “Superior”,
“… a cost-effectiveness analysis or cost-utility analysis is appropriate to determine whether the increase in health outcomes (and any cost offsets) justifies the increase in drug costs (and hence increased price) in terms of being acceptably cost-effective. If there are uncertainties and/or trade-offs across health outcomes (eg both increased effectiveness and reduced safety or differing safety profiles), a cost-consequences analysis is appropriate to present these results in a disaggregated way against the costs and, if it helps to reduce the uncertainty and/or quantify the trade-offs, a cost-utility analysis would also be appropriate.” (DoHA 2006d, p 89)
Where noninferiority is used as the basis of the submission, the cost-minimisation analysis required is much simpler than either a cost-effectiveness or cost-utility analysis, because the problem for the sponsor becomes one of demonstrating the
Key Aspects of the Australian PBS
PIP Working Paper No. 35 28
costs of the proposed medicine and its comparator in achieving the same level of effectiveness. If the sponsor is claiming the proposed medicine is therapeutically superior to the main comparator, the Guidelines set out four types of economic evaluation that could be used (DoHA 2006d p 116-117), namely
“Cost-utility analysis (generally preferred) A cost-utility analysis presents the health outcome in terms of the life-years gained from the start of the analysis, with each life-year adjusted by a utility weight that is society’s preferences for the health outcome experiences in that life-year relative to full health. The ultimate benefit of restored health is the restoration of health-related quality of life, for example restoration of opportunities to undertake activities of daily living. Economists have attempted to identify the value placed by individuals on different health states. The basis for this valuation is that each increment in health related quality of life gives satisfaction (measured as the strength of preference for the restored health over the pre treatment state of health and termed ‘utility’ by economists), which is the ultimate outcome of life. The denominator in a cost-utility analysis is most commonly the incremental QALY [quality-adjusted life year] gained, which is the difference between the two profiles following the use of the proposed drug or its main comparator, each calculated as the times spent in successive varying health states, with each period of time weighted by the strength of preference for, or the utility weight of, its respective health state… Cost-effectiveness analysis A cost-effectiveness analysis measures the incremental cost per extra unit of health outcome achieved. That is, it differs from a cost-utility analysis in that the health outcome is reported in its natural units. If the proposed drug is demonstrated to offer more of a given health outcome than its main comparator (eg it achieves the desired health outcome in a higher proportion of patients), this goes beyond cost minimisation... Cost-benefit analysis (supplementary option) A cost-benefit analysis expresses all outcomes (health and non health) valued in monetary rather than natural or utility units. This is in contrast to other forms of economic evaluation and requires a monetary valuation of these outcomes… Cost-benefit analysis can also include both health and non health outcomes. Cost-consequences analysis (if disaggregation of outcomes would be helpful) A cost-consequences analysis compares the incremental costs of the proposed drug over its main comparator with an array of outcomes measured in their natural units rather than a single representative outcome as presented in a cost-effectiveness analysis. It can be presented if the proposed drug is demonstrated to have a different profile of effects that are not adequately captured by a single outcome measure; there might be trade-offs between the two drugs in terms of the directions of the changes in effectiveness and safety (and within effectiveness and safety). As such, it is a form of disaggregated analysis of changes in patterns of health care resource provision and changes in health outcomes and can be presented before presenting other types of aggregated economic evaluation, such as a cost-utility analysis.”
Key Aspects of the Australian PBS
PIP Working Paper No. 35 29
From these descriptions it can be seen that CUA is the preferred form of economic analysis, a view reinforced by Evans et al (1993). In practice however, if the health outcomes being compared between the proposed medicine and its comparator are straightforward, there seems to be little difference between CEA and CUA other than that a value in utility units is given to the health outcomes in CUA. Because of this most classifications of PBS medicines, for instance in therapeutic reference groups, just distinguish between “cost-effectiveness” and “cost-minimisation”. It is also clear from a reading of the Guidelines that while cost-benefit analysis is listed as a possible form of economic analysis, in practice sponsors are strongly discouraged from presenting submissions based on this type of analysis. Appendix 7 of the Guidelines presents a list of reasons for avoiding cost-benefits analysis, including the difficulties of valuing health states and the inclusion of non-health outcome benefits. However some of the objections in terms of the subjectivity of valuation could also be made against the utility weights used in CUA to weigh health states in calculating QALYs. In providing a rationale for the need for an economic analysis, Evans et al (1993) note that “Efficiency analysis has been applied to new medical technologies, including pharmacological agents, in an attempt to ensure that the resources allocated to them would not have produced greater benefits if used elsewhere. This involves comparing the benefits which would have been produced by the new technology with the benefits which would have been produced by the same resources in alternative uses.” (p 10). Again this seems to be an argument for cost-benefit analysis which is then refuted in the rest of the report. While the PBAC argues strongly that its terms of reference restrict it to a narrow comparative assessment of the health-related outcomes and costs associated with a proposed medicine and its comparator, Islam and Mak (2002) have made a case for an approach based on cost-benefit analysis which encompasses a broader range of outcomes (including social outcomes) and costs. This type of analysis however is best used when making decisions from a whole-of-government perspective. All three approaches to economic analysis – CMA, CEA and CUA – are aimed at producing a metric, in the form of health outcome per dollar of cost, for both the new medicine and the comparator, to enable comparison between the two. If, for instance, a new medicine is proposed that treats hypertension (ie high blood pressure), the health outcome might be units of blood pressure reduced per dollar. The Guidelines draws a distinction in measurement of health outcomes between surrogate (or intermediate) outcome indicators, which measure the change in physical outcome which is believed to be associated with an improvement in health status, and final outcome indicators which measure the change in health status. For example, in the treatment of hypertension, an intermediate outcome might be the change in blood pressure, while the final outcome might be the number of years of life saved by avoiding deaths from heart attack or stroke. Clinical trials can provide evidence on intermediate outcomes but it is usually harder to measure final outcomes because it may require many years and/or very large samples before the differences in outcomes become apparent. The difference between intermediate and final outcomes becomes important when there are multiple outcomes associated with a medicine and the profile for the new medicine is different from that of the comparator. As an example, an antidepressant medicine may reduce the number of deaths from suicide and also improve the quality
Key Aspects of the Australian PBS
PIP Working Paper No. 35 30
of life for sufferers by alleviating their depressive feelings. In this case it is necessary to combine these outcomes into a single measure, which means that the individual measures all be expressed in the same units. Typical final outcome units are deaths prevented, life-years gained or quality-adjusted life-years gained. In cost-utility analysis, utilities are measured by QALYs and there is a substantial literature on how these should be quantified. A considerable amount of effort has gone into expressing disease states within a society in terms of their effects from years of life lost due to premature mortality (YLL) and/or from years of life lost due to disability (YLD). These can be combined to form disability-adjusted life-years which are now more commonly described as quality-adjusted life-years (QALYs). These QALYs have been used to estimate the overall burden of disease within societies (eg Mathers et al 1999) and as a method of determining priorities within health programs, such as the PBS. In calculating the health outcome ratio, the costs measured are the same for all three methods. The Guidelines specify that only direct costs for both the new medicine and the comparator be included. These consist of
• the cost of the medicine • the cost of all other medical resources which need to be used in conjunction
with the medicine • the cost of medical resources used in treating side effects associated with the
medicine An analysis which includes all direct costs for both the new medicine and comparator will pick up any savings in medical costs arising from using the medicine (for instance, savings in the cost of hospitalisations avoided through using the medicine). The Guidelines discourage the inclusion of any indirect benefits, such as those accruing to an individual patient. It argues that benefits to patients from returning to work earlier through use of the new medicine can contribute to the patient’s well-being but do not provide a net benefit to society as a whole, because among other things, an unemployed worker will replace a worker absent through illness. When it assesses submissions by sponsors to list medicines on the PBS, the PBAC makes one of four decisions
• Positive recommendations; or • 1st time decisions not to recommend; or • “Subsequent decisions” not to recommend; or • Deferrals
A sponsor has the option of resubmitting an application a number of times if it does not receive a positive recommendation, and for a few medicines this means that it can be a substantial period of time before a final outcome is known. Publicly available information on the decisions of the PBAC on sponsors’ submissions has only been available for about seven years. Since its December 1999 meeting, the PBAC has posted its positive recommendations on the DoHA web site, and since June 2003 it has included the other decisions (DOHA 2007e). In addition, since July 2005, it has also published Public Summary Documents (DoHA 2007g, 2007h) which summarise the information contained in company submissions to the PBAC and the PBAC’s comments on the submissions. Importantly these documents include information on the medicine and its comparator, and estimates of the impact on PBS cost.
Key Aspects of the Australian PBS
PIP Working Paper No. 35 31
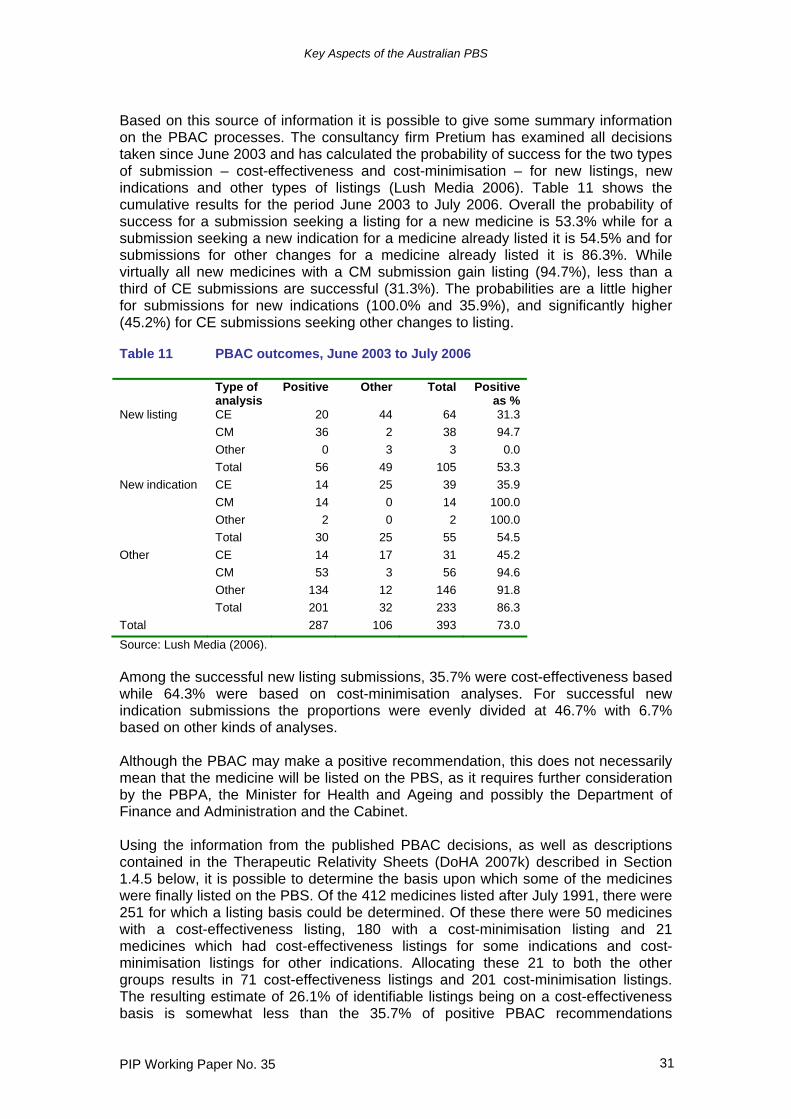
Based on this source of information it is possible to give some summary information on the PBAC processes. The consultancy firm Pretium has examined all decisions taken since June 2003 and has calculated the probability of success for the two types of submission – cost-effectiveness and cost-minimisation – for new listings, new indications and other types of listings (Lush Media 2006). Table 11 shows the cumulative results for the period June 2003 to July 2006. Overall the probability of success for a submission seeking a listing for a new medicine is 53.3% while for a submission seeking a new indication for a medicine already listed it is 54.5% and for submissions for other changes for a medicine already listed it is 86.3%. While virtually all new medicines with a CM submission gain listing (94.7%), less than a third of CE submissions are successful (31.3%). The probabilities are a little higher for submissions for new indications (100.0% and 35.9%), and significantly higher (45.2%) for CE submissions seeking other changes to listing. Table 11 PBAC outcomes, June 2003 to July 2006
Type of analysis
Positive Other Total Positive as %
New listing CE 20 44 64 31.3 CM 36 2 38 94.7 Other 0 3 3 0.0 Total 56 49 105 53.3 New indication CE 14 25 39 35.9 CM 14 0 14 100.0 Other 2 0 2 100.0 Total 30 25 55 54.5 Other CE 14 17 31 45.2 CM 53 3 56 94.6 Other 134 12 146 91.8 Total 201 32 233 86.3 Total 287 106 393 73.0 Source: Lush Media (2006). Among the successful new listing submissions, 35.7% were cost-effectiveness based while 64.3% were based on cost-minimisation analyses. For successful new indication submissions the proportions were evenly divided at 46.7% with 6.7% based on other kinds of analyses. Although the PBAC may make a positive recommendation, this does not necessarily mean that the medicine will be listed on the PBS, as it requires further consideration by the PBPA, the Minister for Health and Ageing and possibly the Department of Finance and Administration and the Cabinet. Using the information from the published PBAC decisions, as well as descriptions contained in the Therapeutic Relativity Sheets (DoHA 2007k) described in Section 1.4.5 below, it is possible to determine the basis upon which some of the medicines were finally listed on the PBS. Of the 412 medicines listed after July 1991, there were 251 for which a listing basis could be determined. Of these there were 50 medicines with a cost-effectiveness listing, 180 with a cost-minimisation listing and 21 medicines which had cost-effectiveness listings for some indications and cost-minimisation listings for other indications. Allocating these 21 to both the other groups results in 71 cost-effectiveness listings and 201 cost-minimisation listings. The resulting estimate of 26.1% of identifiable listings being on a cost-effectiveness basis is somewhat less than the 35.7% of positive PBAC recommendations
Key Aspects of the Australian PBS
PIP Working Paper No. 35 32
accounted for by CE submissions, although the two numbers are based on analyses over different periods of time. George et al (2001) reviewed all 355 submissions to the PBAC between 1991 and 1996 and found that there 125 cost-effectiveness analyses (35%), 98 cost-minimisation analyses (28%), 3 cost-utility studies (3%), and 129 pseudo cost-effectiveness, other, or no analyses (24%). Of these only 33 (or 26% of the cost-effectiveness and cost-utility analyses) provided an analysis with final outcomes either in the form of life-years gained (26) or in QALYs (9). For those submissions with final outcomes measured in life-years gained, the PBAC did not reject any new medicine with an incremental cost per additional life-year gained of less than $42,697 (at 1998-99 prices). On the other hand it did not unequivocally recommend any new medicine with a value above $75,286. Within this range 4 medicines were recommended and 5 rejected or deferred. Based on these findings, George et al assert that the PBAC appears to have a threshold value of between $42,000 and $65,000 for a life-year. They recognise that these estimates may include life-years of less than perfect health which may have been implicitly recognised by the PBAC in its decisions. The width of the threshold range may also indicate that the PBAC is guided by factors other than strict economic efficiency in its recommendations. The number of analyses using QALYS as final outcomes was too small to make any meaningful estimate of an implicit threshold for an incremental cost per QALY. Abelson (2003) has estimated the value of a life-year in Australia at $108,000. Sweeny (2003) has indirectly estimated the value of a life-year at between $100,000 and $200,000 based on a range of US and Australian studies (Viscusi 1993, Murphy and Topel 1999, Cutler et al 2000, Nordhaus 2002, Viscusi and Aldy 2003, Kniesner and Leeth 1991, Miller et al 1997). These values for a life-year suggest that the PBAC may be setting too low an implicit value and therefore rejecting medicines that might otherwise be accepted. Birkett et al (2001) examined all submissions between 1993 and 1999 and of these 39% were cost-minimisation analyses, 36% cost-effectiveness analyses, 5% cost-utility analyses and 20% partial analyses. Over the period the proportion of cost-minimisation (50%) and cost-utility (16%) analyses increased while that of cost-effectiveness (24%) and partial (10%) analyses decreased (the numbers in brackets being for 1999). 4.4 PBPA pricing processes The Pharmaceutical Benefits Pricing Authority (PBPA) within the Department of Health and Ageing has responsibility for determining the price of both new medicines entering the PBS and of medicines already on the PBS. In doing so it acts on the advice of the PBAC as to clinical and cost effectiveness and in making decisions considers a range of factors, the most important of which are
• The proposed price for the medicine • The prices of other medicines in the same therapeutic group • Cost data obtained from sponsors, and • Overseas prices (UK and New Zealand).
Key Aspects of the Australian PBS
PIP Working Paper No. 35 33
While the level of activity of the company in Australia in new investment, production and research and development is still formally a factor (Factor (f)), in practice this is no longer taken into account. 4.5 Price of new medicines or new indications For new medicines, or when new indications are requested for existing PBS medicines, the PBPA pricing procedure depends on whether the PBAC recommended the medicine on the basis of cost-effectiveness or cost-minimisation. In the case of cost minimisation, the medicine is priced at the level of the lowest price comparative medicine. Sometimes the price is adjusted if the costs of administration vary between say an orally administered tablet and an intravenous infusion. However this adjustment is not made in all cases. For medicines recommended on the basis of cost-effectiveness, the process seems to be less straightforward. If the PBAC suggests that incremental cost effectiveness ratios are ‘high’ but ‘acceptable’, the PBPA will probably not accept the price requested by the sponsor but seek a lower price. For medicines recommended without this qualification the PBPA is not explicit about the extent to which it accepts the price nominated by the sponsor in the cost-effectiveness analysis. However it does say that if
“…a sponsor demonstrates to the PBAC a clinical advantage for a particular drug over alternative products (recommended on the basis of acceptable cost effectiveness) then that drug may be granted a higher subsidised price over the alternative.” (PBPA 2006 p 9)
The PBPA describes three methods of determining prices, namely
• Cost Plus Method, • Reference Pricing, and • Weighted Average Monthly Treatment Cost (WAMTC)
but it is clear from the descriptions of each that the last two are only applied for medicines recommended on a cost-minimisation basis. The prices for cost-effectiveness medicines must therefore be determined using the Cost Plus Method, which aims to set the price based on a gross margin of around 30% on the cost of manufacture. Higher margins are accepted for medicines with a low volume while lower margins may be sought for high volume products. Here the cost of manufacture includes a variety of costs, such as landed costs, packaging, quality assurance, plant and equipment, manufacturing overheads and TGA fees. There is no readily available information on how much the final price for cost-effectiveness medicines determined in this way departs from that used in the sponsor’s economic analysis for calculating the incremental cost effectiveness ratio. Reference Pricing occurs when medicines are recommended on the basis of cost-minimisation, and with this approach ‘the lowest priced brand or drug sets the benchmark price for either the other brands of that drug or the other drugs within the same therapeutic group. Pricing within these therapeutic groups is based on therapeutic relativities between drugs as noted on the therapeutic relativity sheets…Therapeutic relativity sheets show specific relativities and pricing comparisons between drugs with a therapeutic group and form the basis of pricing
Key Aspects of the Australian PBS
PIP Working Paper No. 35 34
decisions made by the PBPA. The relativities are usually based on PBAC advice but may also be historically based’ (DoHA 2006d p 9, 16). The relativity sheets are regularly updated and published (DoHA 2007k), but it is somewhat difficult to use their descriptions to identify completely the cost-minimisation therapeutic groups and their constituent medicines, because some descriptions are ambiguous. Following the publication of the August 2005 edition of the PBS Schedule, the DoHA posted on its web site a revised version of a previously unpublished list of cost-minimisation groups and their constituent medicines. Since that time the list of what are now called Reference Pricing Groups (RPG) and their constituent medicines has been revised to coincide with major editions of the PBS Schedule and to incorporate new medicines and changes in views on how RPGs should be defined (DoHA 2007i). RPGs are typically formed when a medicine listed on a cost-effectiveness basis becomes the comparator for medicines listed on a cost-minimisation basis against it. RPGs therefore consist of medicines listed on both CE and CM bases. At April 2007 there were 111 RPGs encompassing 328 medicines. There were a further 353 medicines which are not part of a group, either because they were listed on a cost-effectiveness basis and as yet have not been the seed for a RPG, or because they are not mentioned in the Therapeutic Relativity Sheets, usually because they are old medicines. The form of reference pricing in which the prices of different brands of the same medicine, including the originator brand are set together and usually at the same level, is found in many different countries (Boston Consulting Group 2004, Davey et al 2005). The extension of reference pricing to include other medicines within the same therapeutic class was developed in Australia, and has only been adopted more broadly in other countries in recent years. Because the comparator medicine can belong to a different ATC category and may have been on the market for a considerable time, the price of the new medicine may be linked through this form of reference pricing to the price of a medicine that has already experienced patent expiry and the entry of generic competitors offering lower prices. Even if this is not the case, the comparator itself may have been listed based on an economic evaluation which had linked its price to that of another comparator which had experienced patent expiry. Over time, it might be expected that there will be a growing proportion of medicines listed on the PBS that are both linked to a comparator and, through a chain of comparators, to medicines that are quite old. These are likely to be out of patent with generic competitors and possibly prices that are approaching the marginal cost of supply. In some cases, the prices negotiated by the PBPA with the sponsor depart from those suggested by the value of incremental improvements in health outcomes. Despite statements that the PBS does not operate to achieve explicit or implicit budget targets (for instance, DoHA 2006d, p 23), sponsors are required to estimate the overall cost of the new medicine to the PBS and this is taken into consideration in the decision to list or not and at what level in Government this decision is taken. In addition, the PBPA can negotiate ‘risk-sharing agreements’ with sponsors to limit the cost of the medicine to the PBS. “The two most common types of arrangements are price-volume agreements, where the sponsor of a particular drug agrees to a price reduction for any sales that exceed a pre-agreed sales volume and rebate agreements where the sponsor offers a rebate (of varying size) for the cost of increased expenditure over a set annual subsidisation cap / threshold” (DoHA 2006d
Key Aspects of the Australian PBS
PIP Working Paper No. 35 35
p 13). Risk-sharing agreements are imposed when there is potential for significant use outside the PBS indications for the medicine and the cost could be high. This form of agreement is the only mechanism within the PBS where demand by patients has an influence on the price received by suppliers. In all other circumstances suppliers agree to supply whatever amount of medicine is demanded at the price set by the PBS. The Australian National Audit Office (2006) recently reviewed the operation of cost-containment measures within the PBS (principally restrictions and risk-sharing agreements) and found that “…[the DoHA] is increasingly using restrictions, authority required restrictions and risk sharing agreements to control expenditure and decrease the risk of PBS drugs being used outside subsidy conditions…” (p 13). With respect to restrictions, they concluded that
“… the complexity of restrictions, including the number of words required to define conditions, is increasing, as is the proportion of restricted and authority required items on the PBS… Generally, over time, restrictions are relaxed or conditions are added. Often when a restriction is relaxed or discontinued, [the DoHA] negotiates a price reduction with the drug’s sponsor.” (p 15)
For risk-sharing agreements, they found that since the first formal agreement was signed in October 2003, 14 had been entered into and at November 2005, a further nine were being negotiated. However of these agreements only 2 had been activated by November 2005, although a further 3 would be activated in 2006 (pp 47-48). This suggests that the effect of risk-sharing agreements on prices has been very limited, although they could become more important over time. Currently 3 Section 100 medicines – abacavir, bosentan and efavirenz are listed at the sponsor’s desired price on the understanding that free goods will be provided to hospitals to make up the difference between this price and the cost effectiveness price. 4.6 Pricing of PBS medicines already listed All medicines listed on the PBS are reviewed annually, with all medicines in a broadly defined therapeutic class being reviewed together. Sponsors can seek variations in prices or these can be initiated by the PBPA. Changes may occur if
• the price of the benchmark brand or product within a therapeutic group changes
• the cost of supplying the medicine has changed • a price increase results in a gross margin that is still acceptable • the PBAC’s views on relativities changes • there are changes in listing restrictions • additional indications are approved • pricing agreements trigger a change • suppliers wish to add or change a price premium
In December 1990, the Minimum Pricing Policy was introduced which set the price to be reimbursed by the PBS for a medicine as the lowest priced brand of the medicine listed on the PBS at the time. Where there are two or more brands of the same medicine, suppliers can add a brand premium to the benchmark price, as long as their brand is bio-equivalent or interchangeable with the benchmark brand. In this
Key Aspects of the Australian PBS
PIP Working Paper No. 35 36
case, the patient wishing to purchase this particular brand pays both the copayment and the premium. In December 1994, brand substitution was introduced. This enabled pharmacists to offer patients cheaper brands of a particular medicine if not specifically prohibited by the prescribing doctor. In general, if a particular medicine has brands with a premium, this does not mean that the other medicines that are members of the same therapeutic group can also have premiums. For certain groups however the other medicines in the group can add a therapeutic premium even though there is only one brand of that particular medicine. These types of premium were introduced in February 1998, are determined by the Minister for Health and Ageing and currently apply to four Therapeutic Premium Groups (TPG):
• H2-receptor antagonists for treating peptic ulcers • Calcium channel blockers for treating high blood pressure • Angiotensin converting enzyme (ACE) inhibitors for treating high blood
pressure • Certain HMG CoA reductase inhibitors (statins) for lowering cholesterol
In certain circumstances the PBS will pay the premium as well as the base price, especially if the patient has adverse effects from using the other medicines in the group, or changing medicines causes patient confusion. Pharmacists are not allowed to substitute for different medicines within these groups. Aside from these arrangements, there are a few medicines where the Government and supplier have not been able to agree on a price but the Government allows the supplier to add a Special Patient Contribution (SPC) to the Government’s base price. The patient pays the SPC and any copayment applicable. Until recently only two medicines had ever added an SPC – bleomycin and polygeline – but a further 8 have been agreed since the introduction of the recent mandatory 12.5% price reduction discussed in Section 4.5 below. For most of these medicines, there are provisions (in the form of separate PBS item codes) for the Government to pay the SPC on behalf of the patient, usually if other alternative treatments are not suitable. For certain groups of medicines, once they are listed on the PBS, their prices are determined by the Weighted Average Monthly Treatment Cost (WAMTC) methodology which was introduced in 1988. This is a further refinement of reference pricing where the aim is to equalise the cost of a month’s treatment among the medicines in the group. The methodology is described in DoHA (2004) as follows
“Reference pricing is usually based on the therapeutic relativities of drugs, from clinical trials, as presented to the Pharmaceutical Benefits Advisory Committee (PBAC) at the time of submission ie 20 mg of drug X was deemed equivalent to 30 mg of drug Y. Price is then generally determined on this basis. The WAMTC methodology is intended to account for different usage practices in the market place compared to the formal clinical trial situation. Using sample data on prescribing behaviours and data on script volumes, a weighted average daily (and thus monthly) cost of treatment can be obtained.
Key Aspects of the Australian PBS
PIP Working Paper No. 35 37
…The WAMTC methodology is intended to account for different usage practices in the market place compared to the formal clinical trial situation. As an example, if drug A is listed on a cost minimisation basis versus drug B with 45 mg = 60 mg, but as used in clinical practice the average daily doses are 47 mg and 59 mg then the price for drug A should be lower and for drug B higher than based on the 45 mg = 60 mg comparison.”
Current WAMTC groups are
• Angiotensin converting enzyme (ACE) inhibitors*. • Angiotensin II receptor antagonists (ATRAs). • Calcium channel blockers (CCBs)*. • H2-receptor antagonists (H2RAs)*. • HMG Coenzyme A reductase inhibitors (statins)*. • Proton pump inhibitors (PPIs). • SSRIs plus. A subgroup of antidepressants, including selective serotonin
reuptake inhibitors (SSRIs) and other antidepressants that have been listed on a cost minimisation basis with the SSRIs.
The four Therapeutic Premium Groups indicated by the asterisk are necessarily WAMTC groups. Since its introduction there have been significant revisions to the WAMTC methodology in 1992 and in 2003 following a review by Ernst & Young (2001). 4.7 Restrictions, Cautions and Notes As noted above, when the PBAC makes a recommendation about a submission for a new medicine to be listed on the PBS, it can specify the level and nature of any restrictions that may be applied to the indications for which it is listed and the conditions under which it can be prescribed. There are three levels of restriction
“Authority required”, “Restricted”, and “Unrestricted”.
Before “Authority required” items can be prescribed, the doctor must obtain permission by contacting Medicare Australia by mail or phone prior to prescribing the medicine according to the wording within the PBS Schedule. For “Restricted” items, the doctor must only prescribe the medicine for the indications given in the Schedule, while for “Unrestricted” items there is no restriction on how the medicine can be prescribed. The report by the Audit National Audit Office (2006) mentioned earlier provides examples of medicines where the length and complexity of restrictions has increased over time and the PBPA acknowledges that the level of restriction is set high on initial listing of the medicine in order to judge the extent of usage before being relaxed after some time has passed. When restriction levels change, the PBPA also often seeks a price cut to compensate in part for any increased usage that may occur, in a manner similar to the risk-sharing agreements discussed earlier.
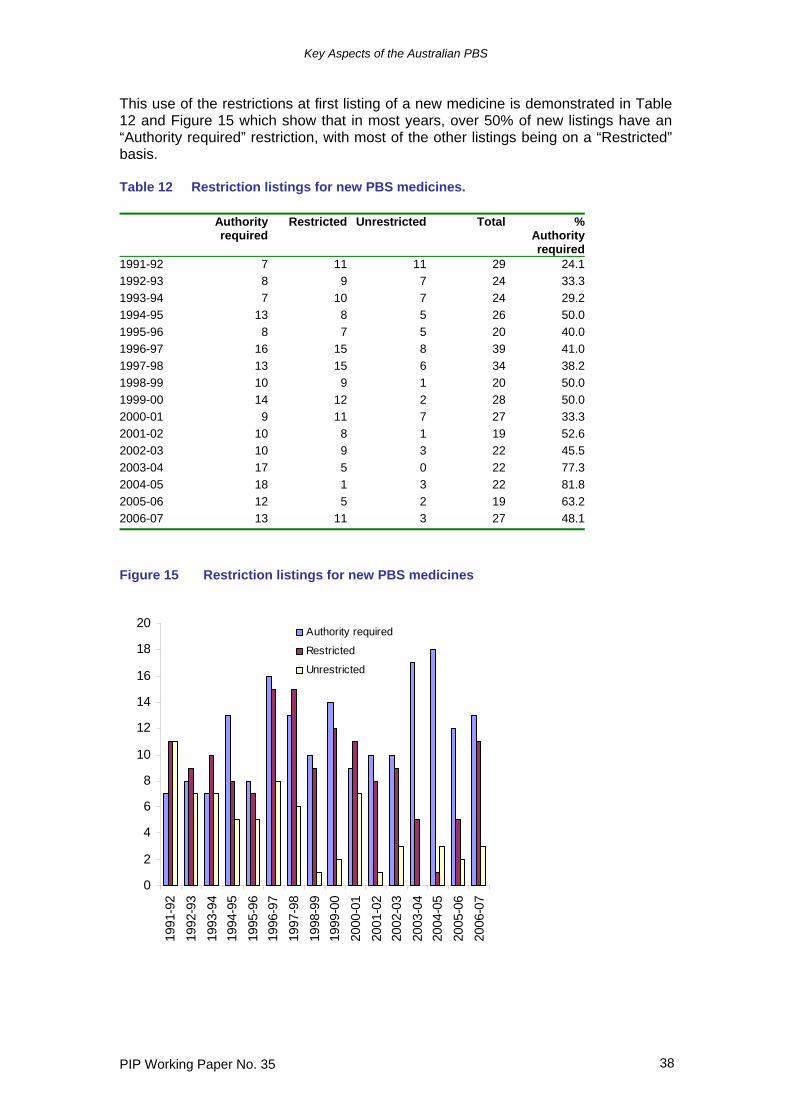
Key Aspects of the Australian PBS
PIP Working Paper No. 35 38
This use of the restrictions at first listing of a new medicine is demonstrated in Table 12 and Figure 15 which show that in most years, over 50% of new listings have an “Authority required” restriction, with most of the other listings being on a “Restricted” basis. Table 12 Restriction listings for new PBS medicines. Authority
requiredRestricted Unrestricted Total %
Authorityrequired
1991-92 7 11 11 29 24.11992-93 8 9 7 24 33.31993-94 7 10 7 24 29.21994-95 13 8 5 26 50.01995-96 8 7 5 20 40.01996-97 16 15 8 39 41.01997-98 13 15 6 34 38.21998-99 10 9 1 20 50.01999-00 14 12 2 28 50.02000-01 9 11 7 27 33.32001-02 10 8 1 19 52.62002-03 10 9 3 22 45.52003-04 17 5 0 22 77.32004-05 18 1 3 22 81.82005-06 12 5 2 19 63.22006-07 13 11 3 27 48.1
Figure 15 Restriction listings for new PBS medicines
0
2
4
6
8
10
12
14
16
18
20
1991
-92
1992
-93
1993
-94
1994
-95
1995
-96
1996
-97
1997
-98
1998
-99
1999
-00
2000
-01
2001
-02
2002
-03
2003
-04
2004
-05
2005
-06
2006
-07
Authority required
Restricted
Unrestricted
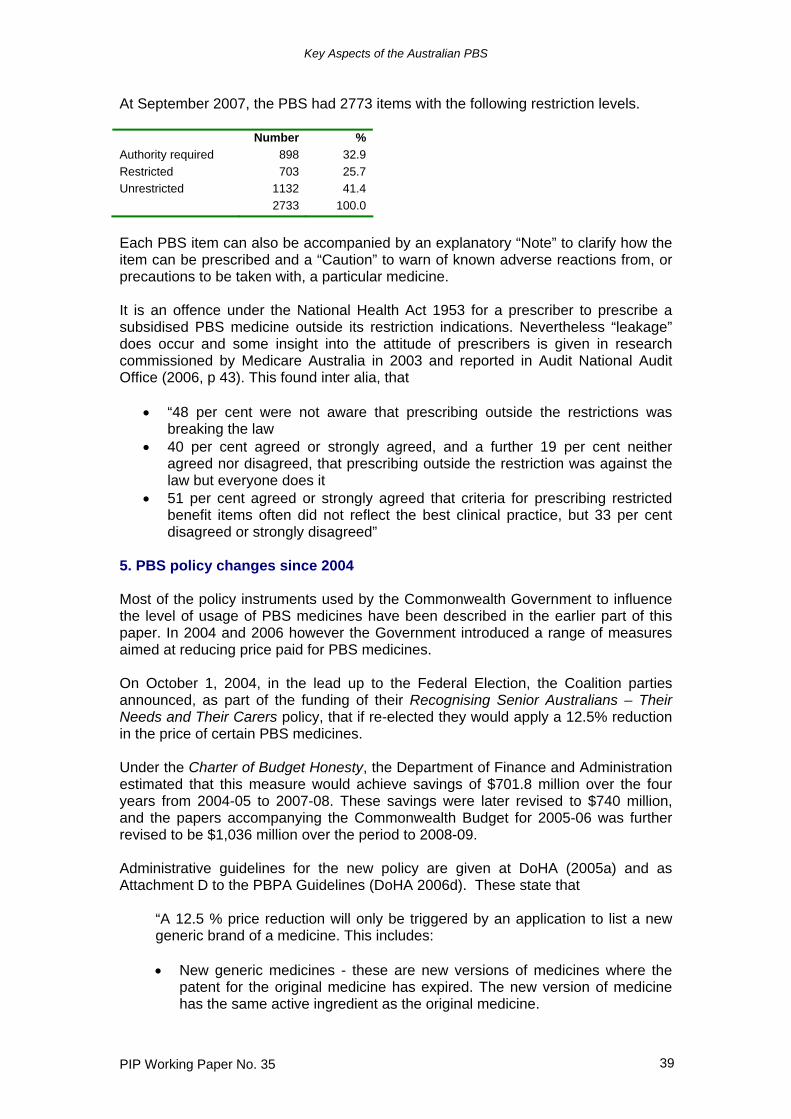
Key Aspects of the Australian PBS
PIP Working Paper No. 35 39
At September 2007, the PBS had 2773 items with the following restriction levels. Number % Authority required 898 32.9 Restricted 703 25.7 Unrestricted 1132 41.4 2733 100.0
Each PBS item can also be accompanied by an explanatory “Note” to clarify how the item can be prescribed and a “Caution” to warn of known adverse reactions from, or precautions to be taken with, a particular medicine. It is an offence under the National Health Act 1953 for a prescriber to prescribe a subsidised PBS medicine outside its restriction indications. Nevertheless “leakage” does occur and some insight into the attitude of prescribers is given in research commissioned by Medicare Australia in 2003 and reported in Audit National Audit Office (2006, p 43). This found inter alia, that
• “48 per cent were not aware that prescribing outside the restrictions was breaking the law
• 40 per cent agreed or strongly agreed, and a further 19 per cent neither agreed nor disagreed, that prescribing outside the restriction was against the law but everyone does it
• 51 per cent agreed or strongly agreed that criteria for prescribing restricted benefit items often did not reflect the best clinical practice, but 33 per cent disagreed or strongly disagreed”
5. PBS policy changes since 2004 Most of the policy instruments used by the Commonwealth Government to influence the level of usage of PBS medicines have been described in the earlier part of this paper. In 2004 and 2006 however the Government introduced a range of measures aimed at reducing price paid for PBS medicines. On October 1, 2004, in the lead up to the Federal Election, the Coalition parties announced, as part of the funding of their Recognising Senior Australians – Their Needs and Their Carers policy, that if re-elected they would apply a 12.5% reduction in the price of certain PBS medicines. Under the Charter of Budget Honesty, the Department of Finance and Administration estimated that this measure would achieve savings of $701.8 million over the four years from 2004-05 to 2007-08. These savings were later revised to $740 million, and the papers accompanying the Commonwealth Budget for 2005-06 was further revised to be $1,036 million over the period to 2008-09. Administrative guidelines for the new policy are given at DoHA (2005a) and as Attachment D to the PBPA Guidelines (DoHA 2006d). These state that
“A 12.5 % price reduction will only be triggered by an application to list a new generic brand of a medicine. This includes: • New generic medicines - these are new versions of medicines where the
patent for the original medicine has expired. The new version of medicine has the same active ingredient as the original medicine.
Key Aspects of the Australian PBS
PIP Working Paper No. 35 40
• New pseudo generic medicines - these are new versions of medicines which are still on-patent. These may be marketed by the patent holder, or by another sponsor under an arrangement with the patent holder. The new version of medicine has the same active ingredient as the original medicine.
As the PBS is based on a reference pricing system (the prices of medicines are linked if they work in the same way or have the same health outcome), the reduction will: • Flow on to all brands of that medicine. • Flow on to all forms and strengths of that medicine which are administered
in the same way. • Flow on to all other medicines in the same reference pricing group, which
are administered in the same way. • Be applied to combination medicines (when one medicine is combined with
another medicine in the one formulation) on a pro-rata basis. • Be applied on a pro-rata basis, based upon the PBS listed indication(s) in
common between the new generic brand and the other medicines in the same reference pricing group. The pro-rata reduction will be determined by the listing recommendations of the Pharmaceutical Benefits Advisory Committee and the utilisation of the medicine in the relevant indication(s). Where there is disagreement about the pro rata reductions to apply, an assessment will be made by the Pharmaceutical Benefits Pricing Authority.”
The new policy commenced on 1 August 2005 and applied only once for each medicine, including for medicines in a reference pricing group where the reduction occurred as a flow-on from another medicine. Estimates by the author in CSES (2005) prior to the introduction of the policy indicated that savings to the Government would be substantially larger than estimated by the Government. This was confirmed by outcomes for the first four rounds of price cuts between August 2005 and August 2006 which will save the Government an estimated $842 million on conservative assumptions over the four years from 2005-06 to 2008-09 (CSES 2006a). The mandatory 12.5% price reduction policy was introduced because it was known that several popular medicines would be subject to patent expiry over the following five to ten years and suppliers would therefore seek to list new brands of these medicines. In addition there would be further new brands being offered for medicines already off-patent. However experience with reference pricing and the Minimum Pricing Policy had shown that there was little if any incentive for suppliers introducing a new brand to offer a price significantly lower than the base price for that medicine. Such a supplier would gain no real competitive price advantage firstly because the base price of all other brands of the medicine would be set to the price being offered, and secondly any brand premium added by another supplier in part compensation for this would only be a small addition to the base price. In these circumstances the only way to achieve price cuts was to make them mandatory. A more complex package of changes focussing on further price cuts was discussed with the industry in May 2006 and finalised as policy in early 2007 (DoHA 2006e, DoHA 2007b). Some of these changes required amendments to the National Health Act 1953 so the policy was designed to be implemented from 1 August 2007. The initiatives within this latest package concentrate on new mechanisms for reducing prices but also include measures to compensate wholesalers and
Key Aspects of the Australian PBS
PIP Working Paper No. 35 41
pharmacists, to streamline the “Authority required” procedure and to consult with industry. The key to the new pricing arrangements is the establishment of two formularies within the PBS from 1 August 2007. Formulary 1 (F1) will consist of a number of single brand medicines, but will not include single brand medicines which are interchangeable at the patient level with multiple brand medicines. These medicines are those within the current WAMTC groups except for the SSRIs and only simvastatin and pravastatin within the statin group. Formulary 2 (F2) will consist of multiple brand medicines and those single brand medicines not included in F1. If there are multiple brands for some forms and strengths of a particular medicine but only a single brand for other forms and strengths all forms and strengths will belong to F2. Although reference pricing will be retained for the determination of prices of new medicines on the PBS, this policy seriously compromises reference pricing as a means of determining prices for medicines already listed, as acknowledged by some of the architects of reference pricing (Searles et al 2007). Thus some Reference Pricing Groups will be split into those medicines on F1 and those on F2, and there will be no link between price changes for those on F2 and those on F1. While DoHA (2007) asserts that reference pricing will continue among medicines within RPGs on F1, in practice the only way for medicines on F1 to experience a price change (other than outside the reference pricing mechanism) is if a new brand of the medicine is listed on the PBS (possibly following patent expiry) at which time the medicine will shift to F2 and also be subject to the mandatory 12.5% pricing policy. Reference pricing among medicines on F2 will only apply to those within TGP groups and across different brands of the same medicine. Thus a change in the price of a medicine on F2 will not flow through to other members of the RPG on F2, other than for the 4 TGPs. For a transition period of three years from 1 August 2007, F2 will be split into two sub-formularies. Formulary F2T will comprise medicines attracting significant treading terms to pharmacy at 1 October 2006. This means those medicines for which some suppliers will offer 25% or more in the way of discounts from the official PBS price to pharmacist (or equivalent inducements). Medicines offering discounts were identified as such by the Pharmacy Guild. Formulary F2A will comprise medicines not attracting significant trading terms to pharmacy discounts. All medicines on F2A will be subject to a mandatory price cut of 2% per year for three years beginning on 1 August 2008. In addition suppliers of a new brand of a F2A medicine will be required to disclose the actual price to pharmacist. Staged price reductions in the base price will then occur for all brands of that medicine until the weighted average disclosed price is reached. Price reductions from disclosure will commence on 1 August 2009. In general medicines leaving F1 for F2 will be subject to the same conditions as F2A medicines. Medicines on F2T will be subject to a mandatory 25% price cut on 1 August 2008, except for a defined list of patent protected medicines within the TGPs, for which the price cut will be phased in over the remaining patent life. Suppliers offering a new brand of an F2T medicine from 1 January 2001 will be required to disclose the actual
Key Aspects of the Australian PBS
PIP Working Paper No. 35 42
price to pharmacist and price cuts based on these disclosed prices will commence from 1 August 2012. In addition to these changes to pricing policy, an incentive of $1.50 will be paid to pharmacists each time they dispense a substitutable premium-free brand to encourage greater dispensing of generic brands rather than originator brands. The Government claimed that the package of initiatives would lead to savings of $3 billion over 10 years and savings of $580 million in the four years from 2007-08 to 2010-11 (DoHA 2006e). Estimates by the author in CSES (2006b) indicated that savings to the Government would around $480 million over four years although the modelling did not include savings due to the incentive for pharmacists and other changes in pharmacy and wholesaling arrangements, or before some changes to and elaborations of the new policy were made as reflected in DoHA (2007b) and the composition of the formularies was finalised. The other major initiative by the Government in recent years which could influence the PBS was the conclusion of a Free Trade Agreement (FTA) between Australia and the United States in May 2004. This agreement contained a number of commitments relating to the PBS which were clarified by an exchange of letters in November 2004. The PBS had been placed on the agenda for the FTA negotiations by the US government at the prompting of US research-based pharmaceutical companies, but despite this pressure the commitments made by the Australian Government in the final agreement are likely to have little if any impact on the operations of the PBS. The main outcome from the FTA is the establishment of an independent review mechanism which “shall provide an opportunity for independent review of PBAC determinations, where an application has not resulted in a PBAC recommendation to list” (Independent Review (PBS) 2005). The Convenor of the Independent Review (PBS) was appointed in May 2006 and her task is to manage the independent review by a qualified expert. This is equivalent to obtaining a second opinion because new evidence cannot be presented to this reviewer. The recommendations of the review are made public and considered by both the PBAC and the Minister but neither are obliged to accept any recommendations contrary to the original PBAC decision. Sponsors also have the opportunity for a hearing before the PBAC while its application is being processed by the PBAC. The FTA also requires that details of PBAC recommendations be made publicly available and this has been implemented. 6. The Repatriation Pharmaceutical Benefits Scheme The Repatriation Commission established the Repatriation Pharmaceutical Benefits Scheme (RPBS) in 1919 to provide free medication to veterans of the First World War and the Boer War. Although benefits under the PBS began in 1948, the RPBS was the more important scheme until the expansion of the PBS in the 1960s. Changes have been made to the RPBS over time, perhaps the most significant of which was in March 1983 when prescribing was restricted to medicines listed on the PBS and a supplementary schedule of items tailored to the particular needs of veterans. The history of the RPBS is set on in Sloan (1995, Chapter 5) from which the account in this paragraph is drawn. The rules governing access to non-PBS items have been tightened progressively. On 1 January 1992 a patient copayment equivalent to the PBS concessional copayment was introduced and repatriation beneficiaries were included within the Safety Net provisions.
Key Aspects of the Australian PBS
PIP Working Paper No. 35 43
The RPBS is managed by the Repatriation Commission, a body set up under the Veterans’ Entitlement Act 1986. This act provides for a “whole of life” health services for entitled veterans and war widow(er)s (DVA 2004a). Based on this veterans are entitled to
• Those items provided under the PBS • Additional pharmaceuticals listed on the RPBS, including wound dressings • Other drug items not listed on either the PBS or RPBS for which a clinical
justification is given by the prescriber and RPBS prior approval has been given by DVA (2004a).
There are different classes of veteran beneficiaries.
• Holders of a Repatriation Health Card – For All Conditions (Gold) can obtain pharmaceuticals under the RPBS for all medical conditions. Conditions of entitlement are complex but cardholders include veterans of World War II, ex-prisoners of war, and age and disability pensioners.
• Holders of a Repatriation Health Card – For Specific Conditions (White)
can obtain appropriate pharmaceuticals for war or service related disabilities and for malignant cancer, pulmonary tuberculosis and post traumatic stress disorder however caused. All veterans are entitled to this card.
• Holders of a Repatriation Pharmaceutical Benefits Card (Orange) can
obtain pharmaceuticals for all conditions. Veterans from other countries that participated in operations with the Australian Defence Force or were allies in World War 1 or II are entitled to this card.
In June 2007 there were 240,642 Gold Cardholders, 52,979 White Cardholders and 14,963 Orange Cardholders. In 2005-06 the total cost of the RPBS was $513.2 million of which $459.4 million was from RPBS cardholder use of PBS items, $42.8 million was for RPBS items and a further $11.2 million was for other medicines not listed on the PBS or RPBS. The cost to the Government of the RPBS was $455.1 million, a fall of 2.3% from 2004-05. The rate of growth of the RPBS has been slowing as the average age of veterans increases and the number of eligible beneficiaries decreases. The number of Gold, White and Orange Cardholders fell from 347,745 in June 1991 to 308,584 in June 2007 and will fall further to 267,000 in June 2010 (DVA 2007). About 55% of Gold and White Card holders are aged 80 or more. At December 2005, the RPBS consisted of some 169 products listed as 373 items. Of these products, 135 were unique to the RPBS while 34 were products listed on the PBS but with different strengths, indications etc. Of the 135 unique products, 86 were medicines while the remainder were bandages, dressings, tapes, and other non-medicine products. The Repatriation Pharmaceutical Reference Committee (RPRC) which was established in 1982 advises the Commission and the Minister concerning pharmaceutical items which should be made concessionally available to eligible recipients under RPBS arrangements. This committee makes recommendations on medicines to be listed on the RPBS but not on the PBS. The RPRC follows a process similar to that of the PBAC when considering which medicines to list on the RPBS. A major submission is needed in order to
Key Aspects of the Australian PBS
PIP Working Paper No. 35 44
(i) list a new item on the Repatriation Pharmaceutical Benefits Schedule, or (ii) list a new presentation of a currently listed item, or (iii) request a significant change to the listing of a currently restricted item (including a new indication or a change to a restriction), or (iv) enable a review of the comparative cost-effectiveness of a currently listed item; or (v) list a new formulation (or strength) of a currently listed item for which a price premium is requested. (DVA 2004b).
A minor submission is required for
(i) listing a new formulation, strength, brand or generic equivalent of a currently listed item for which a price premium is not requested, or (ii) a request to change the maximum quantity per prescription of a currently listed item, or (iii) a request to change the number of repeats per prescription of a currently listed item; or (iv) a request to change the agreed price of a currently listed item if the requested percentage increase since the most recent price change is greater than the Health Group CPI Index Number percentage change for the same period; or (v) clarification of the wording of a restriction (while not altering the intended use), or (vi) any change to the reasons or conditions of listing.
Condition (iv) above provides an opportunity for the sponsor of a medicine listed on the RPBS to change its price in line with inflation. This provision is not available under the PBS. Where the requested price increase is less than the increase in the CPI, a simple application can be made to the RPRC. Because the RPBS is aimed at the medical needs of the veteran and war widow(er) populations, the economic analysis needs to consider the epidemiology and risk factors as well as current treatments for medical conditions of this population. Decisions on listing and pricing may therefore differ from those that might be made with respect to a specific medicine if listing was sought on the PBS. Appendix 4 sets out the recommended guidelines for a submission to the RPRC. References Abelson, Peter 2003, ‘The Value of Life and Health for Public Policy’, Economic
Record, Volume 79, Special Issue, June 2003, S2-S13
AIHW 2007, Australian hospital statistics 2005–06, Health services series no. 30. Cat. no. HSE 50.Canberra: AIHW
Australian National Audit Office 2006, Selected Measures for Managing Subsidised Drug Use in the Pharmaceutical Benefits Scheme, Audit Report No 44, 2005-06, ANAO, Canberra, June 2006
Birkett, Donald J, Mitchell, Andrew S, and McManus, Peter 2001, ‘A Cost-Effectiveness Approach to Drug Subsidy and Pricing in Australia’, Health Affairs, Volume 20, Number 3, 104-114
Key Aspects of the Australian PBS
PIP Working Paper No. 35 45
Boston Consulting Group 2004, Overview of Government Interventions in OECD Countries, PhRMA Project on Government Interventions in Pharmaceutical Markets in OECD Countries, PhRMA, July 1 2004
Centrelink 2007, Information you need to know about your claim for Commonwealth Seniors Health Card, Australian Government, March 2007
Commonwealth of Australia 2002, National Strategy for Quality Use of Medicines Plain English Edition, Commonwealth of Australia 2002
CSES 2005, Proposed New Listing and Pricing Arrangements for Generic Medicines: An Assessment, Report to Medicines Australia, CSES, Victoria University, March 2005
CSES 2006a, Monitoring the Effects of Recent Changes to PBS Medicine Pricing Policies, Report to Medicines Australia, CSES, September 2006
CSES 2006b, Proposed Changes to PBS Pricing Policies, Report to Medicines Australia, CSES, Victoria University, November 2006
Cutler David M, Gruber Jonathan, Hartman Raymond S, Landrum Mary Beth, Newhouse Joseph P, and Rosenthal Meredith B 2000, ‘The Economic Impact of the Tobacco Settlement’, NBER Working Paper 7760, NBER, May 2000
Davey Peter, Price Natalia, Lees Michael, Makino Koji, Birinyi-Strachan Liesl and Forst Michelle 2005, ‘Comparison of Reimbursement Systems of Various Countries in Central and Eastern Europe, Africa, Middle East and Asia’, ISPOR Connections, February 15 2005, 4-6
Department of Health and Aged Care 2000, National Medicines Policy 2000, Department of Health and Aged Care, Canberra, 1999 at http://www.health.gov.au/internet/wcms/publishing.nsf/Content/nmp-objectives-policy.htm
Department of Health and Ageing 2004, Weighted Average Monthly Treatment Cost (WMATC) Users’ Manual, Department of Health and Ageing, Canberra, December 2004 at http://www.health.gov.au/internet/wcms/publishing.nsf/Content/health-pbs-general-pricing-wamtc
Department of Health and Ageing 2005a, Administrative guideline on the scope of the 12.5% price reduction policy (Updated July 2005), Department of Health and Ageing, Canberra, July 2005 at http://www.health.gov.au/internet/wcms/publishing.nsf/Content/health-pbs-pricing-adminguide
Department of Health and Ageing 2005b, Key Papers Published on the Australian Approach, Department of Health and Ageing, Canberra, at http://www.health.gov.au/internet/wcms/publishing.nsf/Content/health-pbs-general-listing-keypaper.htm
Department of Health and Ageing 2006a, Annual Report 2005-06, Commonwealth of Australia, Canberra at http://www.health.gov.au/internet/wcms/publishing.nsf/Content/2005-2006-2
Department of Health and Ageing 2006b, Australian Government 2006-07 Portfolio Budget Statements, DoHA at http://www.health.gov.au/internet/budget/publishing.nsf/Content/budget2006-portfoliobudgetstatements.htm
Department of Health and Ageing 2006c, Expenditure and prescriptions twelve months to 30 June 2006, Department of Health and Ageing, Canberra,
Key Aspects of the Australian PBS
PIP Working Paper No. 35 46
December 2006 at http://www.health.gov.au/internet/wcms/publishing.nsf/Content/pbs-stats-pbexp-jun06
Department of Health and Ageing 2006d, Guidelines for preparing submissions to the Pharmaceutical Benefits Advisory Committee (Version 4.1), Commonwealth of Australia, Canberra, December 2006
Department of Health and Ageing 2006e, Strengthening Your PBS – Preparing for the Future, Commonwealth of Australia, Canberra, November 2006 at http://www.health.gov.au/internet/wcms/publishing.nsf/Content/Strengthening-your-PBS.htm
Department of Health and Ageing 2007a, Pharmaceutical Benefits Scheme, Department of Health and Ageing, Canberra, 2007, at http://www.health.gov.au/internet/wcms/publishing.nsf/Content/Pharmaceutical+Benefits+Scheme+%28PBS%29-2
Department of Health and Ageing 2007b, Fact Sheet Pharmaceutical Benefits Scheme (PBS) Reform, Department of Health and Ageing, Canberra, 2 February 2007 at http://www.health.gov.au/internet/wcms/publishing.nsf/Content/pbs_reform_02feb07.htm
Department of Health and Ageing 2007c, Life Saving Drugs Program – funding for Aldurazyme® (laronidase-rch), Department of Health and Ageing, Canberra, May 2007, at http://www.health.gov.au/internet/budget/publishing.nsf/Content/budget2007-hfact14.htm
Department of Health and Ageing 2007d, Past Copayments and Safety Net Thresholds, Department of Health and Ageing, Canberra, February 2007, available at http://www.health.gov.au/internet/wcms/publishing.nsf/Content/health-pbs-general-pbs-copayment.htm
Department of Health and Ageing 2007e, PBAC Outcomes by Meeting, Department of Health and Ageing, Canberra, December 1999 to July 2007, at http://www.health.gov.au/internet/wcms/publishing.nsf/Content/pbac-outcomes-by-meeting
Department of Health and Ageing 2007f, Life Saving Drugs Program – funding for Aldurazyme® (laronidase-rch), Department of Health and Ageing, Canberra, May 2007, at http://www.health.gov.au/internet/budget/publishing.nsf/Content/budget2007-hfact14.htm
Department of Health and Ageing 2007g Public Summary Documents by Meeting, Department of Health and Ageing, Canberra, July 2005 to March 2007 at http://www.health.gov.au/internet/wcms/publishing.nsf/Content/public-summary-documents-by-meeting
Department of Health and Ageing 2007h, Public Summary Documents by Product, Department of Health and Ageing, Canberra, July 2005 to March 2007 at http://www.health.gov.au/internet/wcms/publishing.nsf/Content/public-summary-documents-by-product
Department of Health and Ageing 2007i, Reference Pricing Groups, Department of Health and Ageing, Canberra, April 2007 at http://www.health.gov.au/internet/wcms/publishing.nsf/Content/health-pbs-refpri
Key Aspects of the Australian PBS
PIP Working Paper No. 35 47
Department of Health and Ageing 2007j Schedule of Pharmaceutical Benefits for Approved Pharmacists and Medical Practitioners, Commonwealth of Australia, Canberra, various issues, available at http://www.pbs.gov.au/html/healthpro/publication/list
Department of Health and Ageing 2007k, Therapeutic Relativity Sheets, Department of Health and Ageing, Canberra, August 2007, at http://www.health.gov.au/internet/wcms/publishing.nsf/Content/health-pbs-general-pricing-therelativity.htm
Department of Health and Ageing 2007l, Who Pays? Where does the money go?, Department of Health and Ageing, Canberra, at http://www.health.gov.au/internet/wcms/publishing.nsf/Content/health-pbs-general-pbs-whopays.htm
Department of Veterans’ Affairs 2004a, Information for Prescribers of Medication under the Repatriation Pharmaceutical Benefits Scheme, DVA Facts HIP60, Department of Veterans’ Affairs, Woden, 2 March 2004 at http://www.dva.gov.au/factsheets/default.htm
Department of Veterans’ Affairs 2004b, Reference Manual for Submissions to the Repatriation Pharmaceutical Reference Committee, Edition 1, Department of Veterans’ Affairs, Woden, June 2004
Department of Veterans’ Affairs 2005, Annual Report 2004-2005, Commonwealth of Australia, Canberra
Department of Veterans’ Affairs 2007, DVA Treatment Population Statistics, June 2007, Department of Veterans’ Affairs, Woden, at http://www.dva.gov.au/media/publicat/Statistics/index.htm#pensioner_summary
Drummond MF 1987, Economic evaluation of health care programmes, Oxford, UK:Oxford Press, 1987
Duckett, Stephen J 2004, ‘Drug Policy Down Under: Australia’s Pharmaceutical Benefits Scheme’, Health Care Financing Review, Spring 2004, Volume 25, Number 3, 55-67
Ernst & Young ABC 2001, Commonwealth Government Department of Health & Aged Care Review of WAMTC Method Volume 1 and 2, Ernst & Young ABC, 26 March 2001
Evans David, Deborah Freund, Robert Dittus, Jane Robertson and David Henry 1993, Background document on the use of economic analysis as a basis for inclusion of pharmaceutical products on the Pharmaceutical Benefits Scheme, Commonwealth of Australia, Canberra, 1993
George, Bethan, Harris, Anthony and Mitchell, Andrew 2001, ‘Cost-Effectiveness Analysis and the Consistency of Decision Making Evidence from Pharmaceutical Reimbursement in Australia (1991 to 1996)’, Pharmacoeconomics 2001; 19 (11): 1103-1109
Independent Review (PBS) 2005, Australia-United States Free Trade Agreement and the Pharmaceutical Benefits Scheme, Media Release by Minister for Health and Ageing, Canberra, 4 February 2005 at http://www.independentreviewpbs.gov.au/internet/independentreviewpbs/publishing.nsf/Content/home-1
Islam, S.M.N. and Mak, C. 2002, Social Cost-Benefit Analysis of the Pharmaceutical Benefit Schemes, in The Otemon Journal of Australian Studies, vol. 28, pp. 1 –33.
Key Aspects of the Australian PBS
PIP Working Paper No. 35 48
Jacobzone, S 2000, ‘Pharmaceutical Policies in OECD Countries: Reconciling Social and Industrial Goals’, Labour Market and Social Policy Occasional Papers No 40, OECD, Paris
Kniesner T J and Leeth J D1991, ‘Compensating Wage Differentials for Fatal Injury Risk in Australia, Japan, and the United States’, Journal of Risk and Uncertainty, 4(1), 75-90
Lush Media 2006, ‘Drug Tracker: latest analysis of PBAC activity’ Pharma in Focus, 28 Aug 3 Sep 2006, email newsletter
Mathers C, Vos T, and Stevenson C 1999, The burden of disease and injury in Australia, Australian Institute of Health and Welfare, cat. no. PHE 17, Canberra, November 1999
Miller Paul, Mulvey Charles, and Norris Keith 1997, ‘Compensating Differentials for Risk of Death in Australia’, Economic Record, December 1997, 73 (223), 363-372
Murphy Kevin M and Topel Robert 1999, The Economic Value of Medical Research, Department of Economics, University of Chicago, September 1999
Nordhaus William D 2002, ‘The Health of Nations: The Contribution of Improved Health to Living Standards’, NBER Working Paper 8818, NBER, March 2002
Pharmaceutical Benefits Pricing Authority 2006, Policies, Procedures and Methods Used in the Pricing of Pharmaceutical Products, Pharmaceutical Benefits Pricing Authority, Canberra, May 2006
Reserve Bank of Australia 2007a, Consumer Price Index, Bulletin Statistical Table G02, RBA, at http://www.rba.gov.au/Statistics/Bulletin/index.html
Reserve Bank of Australia 2007b, Labour Costs, Bulletin Statistical Table G06, RBA, at http://www.rba.gov.au/Statistics/Bulletin/index.html#table_g
Searles Andrew, Susannah Jefferys, Evan Doran and David A Henry 2007, ‘Reference pricing, generic drugs and proposed changes to the Pharmaceutical Benefits Scheme’, Medical Journal of Australia, Volume 187 Number 4 20 August 2007, 236-239
Sloan, Clyde 1995, A History of the Pharmaceutical Benefits Scheme 1947-1992, Commonwealth Department of Human Services and Health, Canberra, 1995
Sweeny Kim 2003, The Value of Medicines and Australian Pharmaceutical Pricing Policy A Case Study of AIIRAs, Consultancy report, CSES, May 2003
Sweeny Kim 2007, ‘Trends and Outcomes in the Australian Pharmaceutical Benefits Scheme’, Pharmaceutical Industry Project Working Paper No. 36, December, Centre for Strategic Economic Studies, Victoria University, Melbourne
Torrance G W 1987, ‘Utility approach to measuring health-related quality of life’, Journal of Chronic Diseases 1987; 40:593-600
Torrance G W and Feeney D H 1989, ‘Utilities and quality-adjusted life-years’, International Journal of Technology Assessment in Health Care, 1989; 5(4): 559-575
Viscusi W Kip 1993, “The Value of Risks to Health and Life”, Journal of Economic Literature, Vol 31, December 1993, 1912-46
Viscusi W Kip and Aldy Joseph E 2003, “The Value of a Statistical Life: A Critical Review of Market Estimates Throughout the World”, NBER Working Paper 9487, NBER, February 2003
Key Aspects of the Australian PBS
PIP Working Paper No. 35 49
Appendix 4 Contents for Major Submissions to the PBAC and RPRC
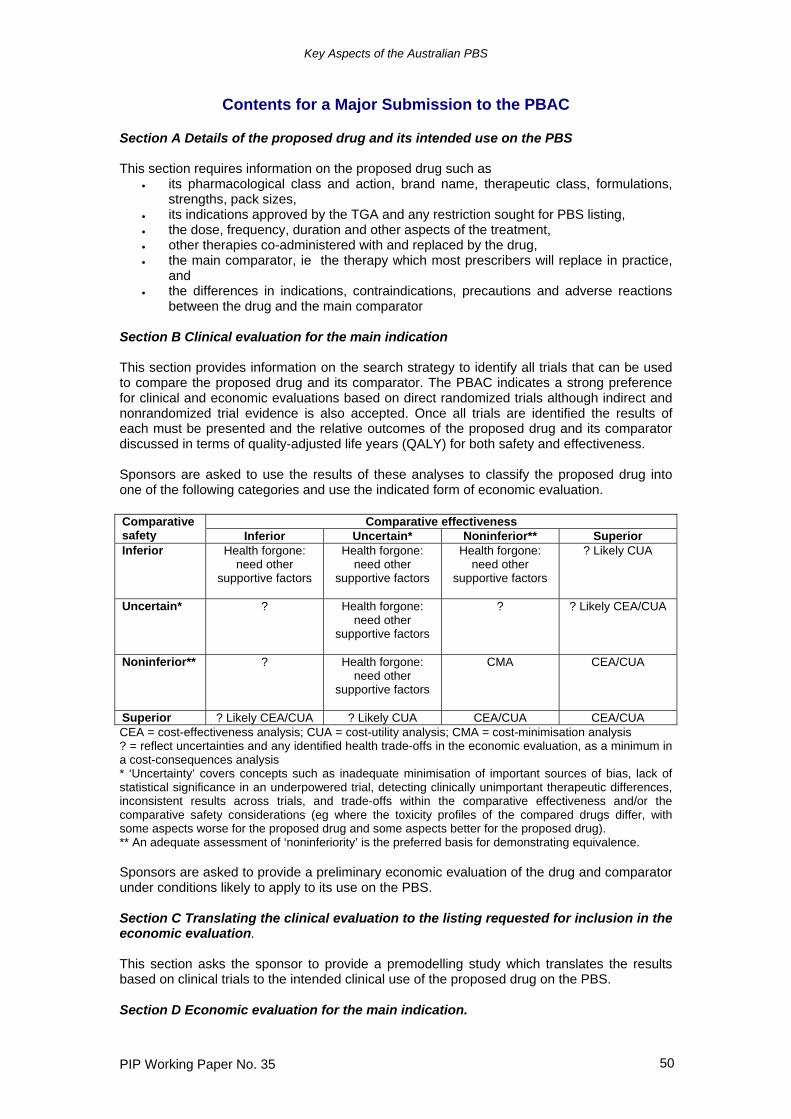
Key Aspects of the Australian PBS
PIP Working Paper No. 35 50
Contents for a Major Submission to the PBAC Section A Details of the proposed drug and its intended use on the PBS This section requires information on the proposed drug such as
• its pharmacological class and action, brand name, therapeutic class, formulations, strengths, pack sizes,
• its indications approved by the TGA and any restriction sought for PBS listing, • the dose, frequency, duration and other aspects of the treatment, • other therapies co-administered with and replaced by the drug, • the main comparator, ie the therapy which most prescribers will replace in practice,
and • the differences in indications, contraindications, precautions and adverse reactions
between the drug and the main comparator Section B Clinical evaluation for the main indication This section provides information on the search strategy to identify all trials that can be used to compare the proposed drug and its comparator. The PBAC indicates a strong preference for clinical and economic evaluations based on direct randomized trials although indirect and nonrandomized trial evidence is also accepted. Once all trials are identified the results of each must be presented and the relative outcomes of the proposed drug and its comparator discussed in terms of quality-adjusted life years (QALY) for both safety and effectiveness. Sponsors are asked to use the results of these analyses to classify the proposed drug into one of the following categories and use the indicated form of economic evaluation.
Comparative effectiveness Comparative safety Inferior Uncertain* Noninferior** Superior Inferior Health forgone:
need other supportive factors
Health forgone: need other
supportive factors
Health forgone: need other
supportive factors
? Likely CUA
Uncertain* ? Health forgone: need other
supportive factors
? ? Likely CEA/CUA
Noninferior** ? Health forgone: need other
supportive factors
CMA CEA/CUA
Superior ? Likely CEA/CUA ? Likely CUA CEA/CUA CEA/CUA CEA = cost-effectiveness analysis; CUA = cost-utility analysis; CMA = cost-minimisation analysis ? = reflect uncertainties and any identified health trade-offs in the economic evaluation, as a minimum in a cost-consequences analysis * ‘Uncertainty’ covers concepts such as inadequate minimisation of important sources of bias, lack of statistical significance in an underpowered trial, detecting clinically unimportant therapeutic differences, inconsistent results across trials, and trade-offs within the comparative effectiveness and/or the comparative safety considerations (eg where the toxicity profiles of the compared drugs differ, with some aspects worse for the proposed drug and some aspects better for the proposed drug). ** An adequate assessment of ‘noninferiority’ is the preferred basis for demonstrating equivalence. Sponsors are asked to provide a preliminary economic evaluation of the drug and comparator under conditions likely to apply to its use on the PBS. Section C Translating the clinical evaluation to the listing requested for inclusion in the economic evaluation. This section asks the sponsor to provide a premodelling study which translates the results based on clinical trials to the intended clinical use of the proposed drug on the PBS. Section D Economic evaluation for the main indication.
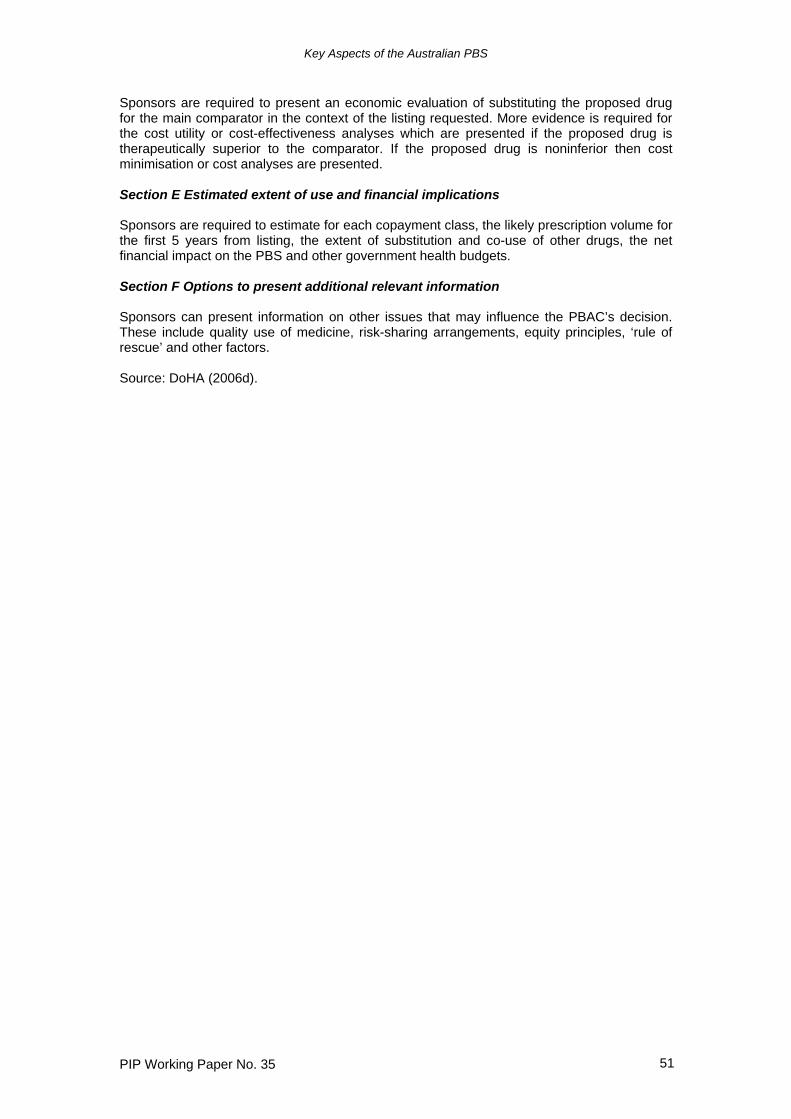
Key Aspects of the Australian PBS
PIP Working Paper No. 35 51
Sponsors are required to present an economic evaluation of substituting the proposed drug for the main comparator in the context of the listing requested. More evidence is required for the cost utility or cost-effectiveness analyses which are presented if the proposed drug is therapeutically superior to the comparator. If the proposed drug is noninferior then cost minimisation or cost analyses are presented. Section E Estimated extent of use and financial implications Sponsors are required to estimate for each copayment class, the likely prescription volume for the first 5 years from listing, the extent of substitution and co-use of other drugs, the net financial impact on the PBS and other government health budgets. Section F Options to present additional relevant information Sponsors can present information on other issues that may influence the PBAC’s decision. These include quality use of medicine, risk-sharing arrangements, equity principles, ‘rule of rescue’ and other factors. Source: DoHA (2006d).
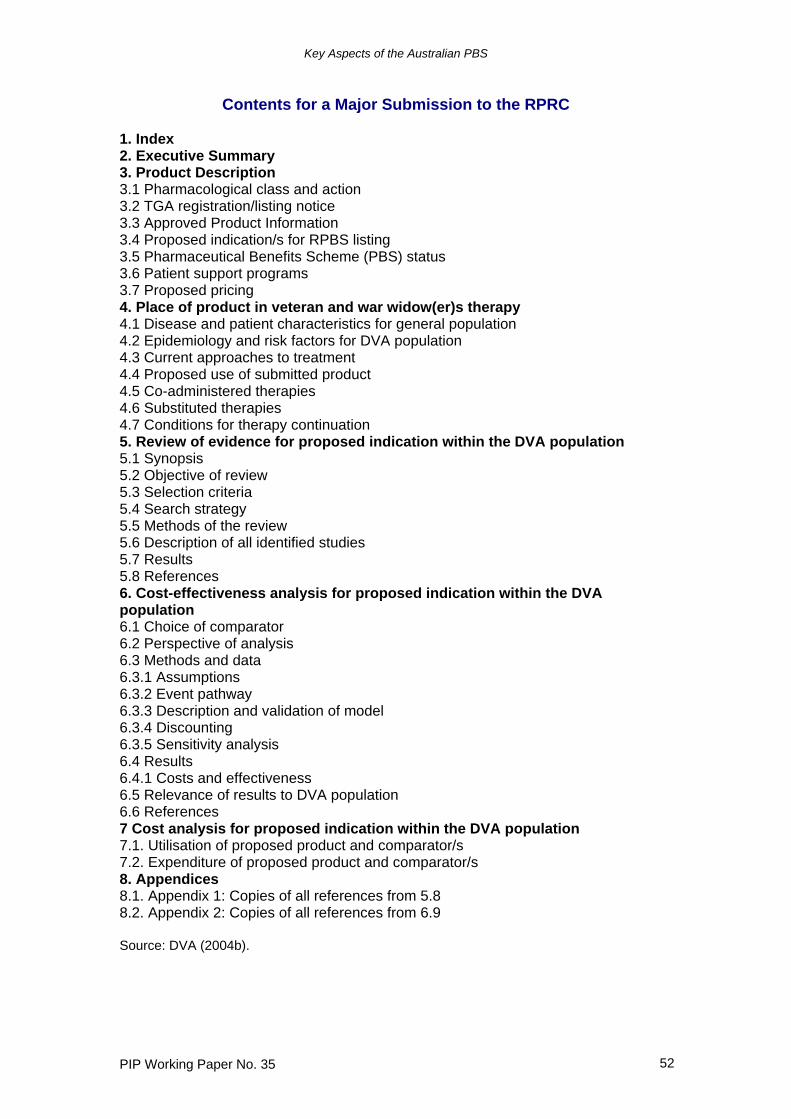
Key Aspects of the Australian PBS
PIP Working Paper No. 35 52
Contents for a Major Submission to the RPRC 1. Index 2. Executive Summary 3. Product Description 3.1 Pharmacological class and action 3.2 TGA registration/listing notice 3.3 Approved Product Information 3.4 Proposed indication/s for RPBS listing 3.5 Pharmaceutical Benefits Scheme (PBS) status 3.6 Patient support programs 3.7 Proposed pricing 4. Place of product in veteran and war widow(er)s therapy 4.1 Disease and patient characteristics for general population 4.2 Epidemiology and risk factors for DVA population 4.3 Current approaches to treatment 4.4 Proposed use of submitted product 4.5 Co-administered therapies 4.6 Substituted therapies 4.7 Conditions for therapy continuation 5. Review of evidence for proposed indication within the DVA population 5.1 Synopsis 5.2 Objective of review 5.3 Selection criteria 5.4 Search strategy 5.5 Methods of the review 5.6 Description of all identified studies 5.7 Results 5.8 References 6. Cost-effectiveness analysis for proposed indication within the DVA population 6.1 Choice of comparator 6.2 Perspective of analysis 6.3 Methods and data 6.3.1 Assumptions 6.3.2 Event pathway 6.3.3 Description and validation of model 6.3.4 Discounting 6.3.5 Sensitivity analysis 6.4 Results 6.4.1 Costs and effectiveness 6.5 Relevance of results to DVA population 6.6 References 7 Cost analysis for proposed indication within the DVA population 7.1. Utilisation of proposed product and comparator/s 7.2. Expenditure of proposed product and comparator/s 8. Appendices 8.1. Appendix 1: Copies of all references from 5.8 8.2. Appendix 2: Copies of all references from 6.9 Source: DVA (2004b).
Key Aspects of the Australian PBS
PIP Working Paper No. 35 53
Acronyms ACE Angiotensin converting enzyme ADEC Australian Drug Evaluation Committee AIHW Australian Institute of Health and Welfare ARTG Australian Register of Therapeutic Goods AWE Average Weekly Earnings CPI Consumer Price Index DoHA Department of Health and Ageing DoHAC Department of Health and Aged Care DVA Department of Veterans’ Affairs FTA Free Trade Agreement HSD Highly Specialised Drugs PBAC Pharmaceutical Benefits Advisory Committee PBPA Pharmaceutical Benefits Pricing Authority PBS Pharmaceutical Benefits Scheme PTP Price to pharmacist QALY Quality-Adjusted Life Years RBA Reserve Bank of Australia RPBS Repatriation Pharmaceutical Benefits Scheme SPC Special Patient Contribution TGA Therapeutic Goods Administration TPG Therapeutic Premium Group WAMTC Weighted average monthly treatment cost