
KEWAL KIRAN CLOTHING LTD Q2 FY14 Detail Reportbreport.myiris.com/firstcall/KEWKIRCL_20131227.pdf ·...
14
CMP 1140.00 Target Price 1283.00 ISIN: INE401H01017 DECEMBER 27 th 2013 KEWAL KIRAN CLOTHING LTD. Result Update: Q2 FY14 BUY BUY BUY BUY Index Details Stock Data Sector Textiles BSE Code 532732 Face Value 10.00 52wk. High / Low (Rs.) 1165.00/660.00 Volume (2wk. Avg. Q.) 7258 Market Cap (Rs. in mn.) 14056.20 Annual Estimated Results (A*: Actual / E*: Estimated) YEARS FY13A FY14E FY15E Net Sales 3029.90 3847.97 4463.65 EBITDA 858.30 1042.94 1202.41 Net Profit 534.20 651.48 756.26 EPS 43.33 52.84 61.34 P/E 26.31 21.58 18.59 Shareholding Pattern (%) 1 Year Comparative Graph KEWAL KIRAN CLOTHING LTD. BSE SENSEX SYNOPSIS Kewal Kiran Clothing Limited has Incorporated in 1981, and headquarter is at Mumbai, it is one of India’s largest branded apparel manufacturers dealing in apparel for both men and women. The company’s net sales registered 27.11% increase and stood at a record Rs. 1165.50 million from Rs. 916.90 million over the corresponding quarter last year. During the quarter, Net profit of Rs. 235.30 million showed an increase of 33.31% against Rs. 176.50 million in Q2 FY 13. Kewal Kiran Clothing Ltd has declared an interim dividend of Rs. 7.50/- per share on face value of Rs. 10/- each for the half year ended Sept 30, 2013. The company has opened 35 retail stores during the quarter, i.e. 15 K-Lounges, 12 Killer EBOs, 5 Integriti EBOs and 3 Lawman Pg3 EBOs. Increase in apparel sale volume by 16.37% and realisation per garment by 10.44% resulting in growth in apparel sales value by 28.52% as compared to corresponding quarter last year. The brand ‘Killer’ sales grew by 25% in Q2 FY14 to Rs. 589.00 mn from 472.90 mn in Q2 FY13 and continue to be the flagship brand with share of 51%. Net Sales and PAT of the company are expected to grow at a CAGR of 14% and 13% over 2012 to 2015E respectively. PEER GROUPS CMP MARKET CAP EPS P/E (X) P/BV(X) DIVIDEND Company Name (Rs.) Rs. in mn. (Rs.) Ratio Ratio (%) Kewal Kiran Clothing Ltd. 1140.00 14056.20 43.33 26.31 5.54 175.00 Lovable Lingerie Ltd 292.65 4916.50 14.58 20.07 2.83 20.00 Kitex Garments Ltd. 76.00 3610.00 9.07 8.38 2.95 80.00 Pearl Global Industries Ltd. 162.20 3513.90 3.85 42.13 0.96 10.00
Transcript of KEWAL KIRAN CLOTHING LTD Q2 FY14 Detail Reportbreport.myiris.com/firstcall/KEWKIRCL_20131227.pdf ·...

CMP 1140.00
Target Price 1283.00
ISIN: INE401H01017
DECEMBER 27th
2013
KEWAL KIRAN CLOTHING LTD.
Result Update: Q2 FY14
BUYBUYBUYBUY
Index Details
Stock Data
Sector Textiles
BSE Code 532732
Face Value 10.00
52wk. High / Low (Rs.) 1165.00/660.00
Volume (2wk. Avg. Q.) 7258
Market Cap (Rs. in mn.) 14056.20
Annual Estimated Results (A*: Actual / E*: Estimated)
YEARS FY13A FY14E FY15E
Net Sales 3029.90 3847.97 4463.65
EBITDA 858.30 1042.94 1202.41
Net Profit 534.20 651.48 756.26
EPS 43.33 52.84 61.34
P/E 26.31 21.58 18.59
Shareholding Pattern (%)
1 Year Comparative Graph
KEWAL KIRAN CLOTHING LTD. BSE SENSEX
SYNOPSIS
Kewal Kiran Clothing Limited has Incorporated in
1981, and headquarter is at Mumbai, it is one of
India’s largest branded apparel manufacturers
dealing in apparel for both men and women.
The company’s net sales registered 27.11% increase
and stood at a record Rs. 1165.50 million from Rs.
916.90 million over the corresponding quarter last
year.
During the quarter, Net profit of Rs. 235.30 million
showed an increase of 33.31% against Rs. 176.50
million in Q2 FY 13.
Kewal Kiran Clothing Ltd has declared an interim
dividend of Rs. 7.50/- per share on face value of Rs.
10/- each for the half year ended Sept 30, 2013.
The company has opened 35 retail stores during the
quarter, i.e. 15 K-Lounges, 12 Killer EBOs, 5 Integriti
EBOs and 3 Lawman Pg3 EBOs.
Increase in apparel sale volume by 16.37% and
realisation per garment by 10.44% resulting in
growth in apparel sales value by 28.52% as
compared to corresponding quarter last year.
The brand ‘Killer’ sales grew by 25% in Q2 FY14 to
Rs. 589.00 mn from 472.90 mn in Q2 FY13 and
continue to be the flagship brand with share of 51%.
Net Sales and PAT of the company are expected to
grow at a CAGR of 14% and 13% over 2012 to
2015E respectively.
PEER GROUPS CMP MARKET CAP EPS P/E (X) P/BV(X) DIVIDEND
Company Name (Rs.) Rs. in mn. (Rs.) Ratio Ratio (%)
Kewal Kiran Clothing Ltd. 1140.00 14056.20 43.33 26.31 5.54 175.00
Lovable Lingerie Ltd 292.65 4916.50 14.58 20.07 2.83 20.00
Kitex Garments Ltd. 76.00 3610.00 9.07 8.38 2.95 80.00
Pearl Global Industries Ltd. 162.20 3513.90 3.85 42.13 0.96 10.00

Recommendation & Analysis - ‘BUY’
Kewal Kiran Clothing Limited (KKCL) has Incorporated in 1981, and headquarter is at Mumbai, the company is
one of India’s largest branded apparel manufacturers dealing in apparel for both men and women. The company
has Nationwide presence with a well entrenched distribution network that reaches out to customers through
various formats and also has an international footprint and exports its products to selected countries. Killer,
Easies, LawmanPg3, Integriti are iconic apparel brands in India of the company.
The Company achieved historically highest turnover, volumes and profitability during the quarter. Net Sales of
Rs. 1165.50 million for the 2nd quarter of the current year 2013-14 as against Rs. 916.90 millions in the
corresponding quarter of the previous year. The company has reported an EBITDA of Rs. 374.50 millions an
increased by 32.52% in Q2 FY14 from Rs. 282.60 million in Q2 FY13 and a net profit of Rs. 235.30 million showed
an increase of 33.31% against Rs. 176.50 million reported respectively in the corresponding quarter of the
previous year. Increase in apparel sale volume by 16.37% and realisation per garment by 10.44% resulting
ingrowth in apparel sales value by 28.52% as compared to corresponding quarter last year. The company has
opened 35 retail stores(Including 3 relocated) i.e. 15 K-Lounges , 12 Killer EBOs, 5 Integriti EBOs and 3 Lawman
Pg3 EBOs during Q2 FY14 and Navratri festival season.
During the first half of the current financial year, the company achieved sales of Rs. 1910.00 millions
representing growth of Rs 28.64% over the same period last year while the net profit grew faster pace of 43.24%
and was Rs. 357.10 millions. Apparel sales value increased by 30.52% to Rs 1840.20 mn. Apparel sales quantity
increased by 17.31% and Apparel sales realization per unit increased by 11.26%.
Despite the dampened growth environment across the economy, KKCL has been able to achieve this performance
due to its continued focus on building a robust business driven by its core values. The company has successfully
established strong brands and well positioned to pursue its growth aspiration along with its export business, the
retail business has emerged as a key driver of profitability in the company. We expect the company to post a
CAGR of 14% and 13% in its top-line and bottom-line respectively. Hence, we recommend ‘BUY’ for ‘KEWAL
KIRAN CLOTHING LIMITED’ with a target price of Rs. 1283.00 on the stock.
QUARTERLY HIGHLIGHTS (STANDALONE)
Results updates- Q2 FY14,
KKCL has nationwide presence with a well
entrenched distribution network that reaches out to
customers through various formats and also has an
international footprint and exports its products to
selected countries. The Company achieved
historically highest turnover, volumes and
profitability during the quarter and has reported its
financial results for the quarter ended 30th
SEPTEMBER, 2013.
The company has achieved a Net Sales of Rs. 1165.50 million for the 2nd quarter of the current year 2013-14 as
against Rs. 916.90 millions in the corresponding quarter of the previous year. The company has reported an
EBITDA of Rs. 374.50 millions an increased by 32.52% in Q2 FY14 and a net profit of Rs. 235.30 million against
Rs. 176.50 million reported respectively in the corresponding quarter of the previous year. The company has
reported an EPS of Rs. 19.08 for the 2nd quarter as against an EPS of Rs. 14.31 in the corresponding quarter of the
previous year.
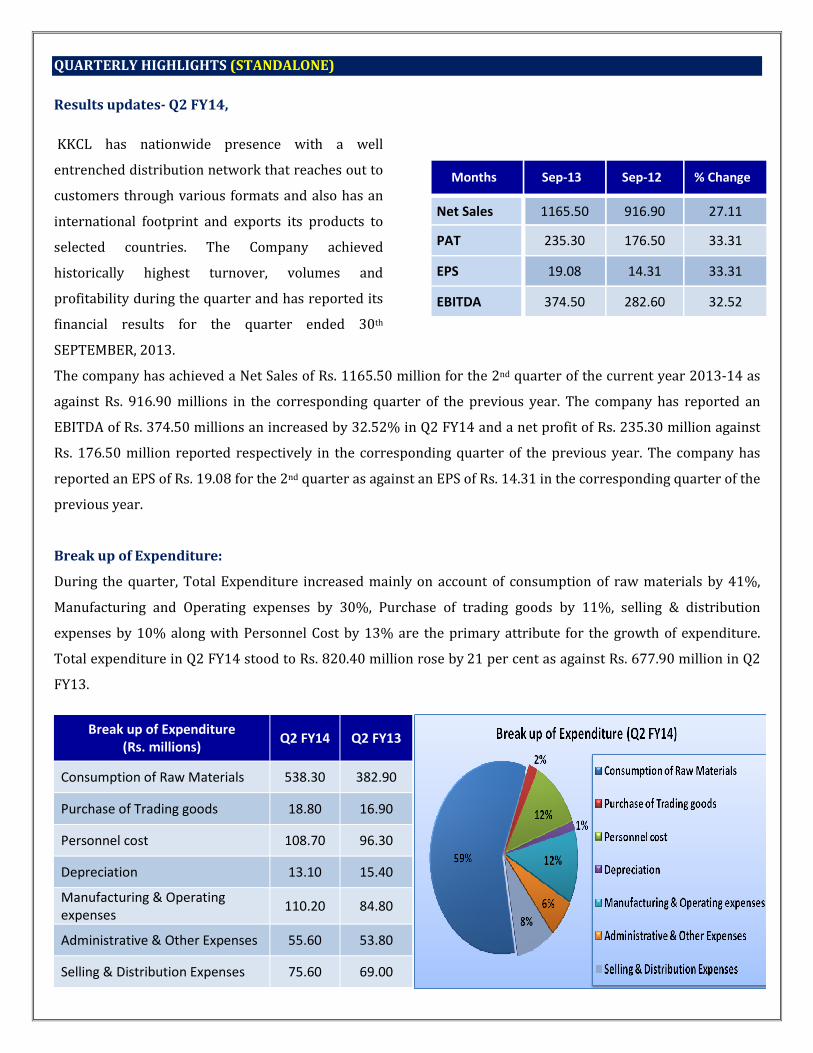
Break up of Expenditure:
During the quarter, Total Expenditure increased mainly on account of consumption of raw materials by 41%,
Manufacturing and Operating expenses by 30%, Purchase of trading goods by 11%, selling & distribution
expenses by 10% along with Personnel Cost by 13% are the primary attribute for the growth of expenditure.
Total expenditure in Q2 FY14 stood to Rs. 820.40 million rose by 21 per cent as against Rs. 677.90 million in Q2
FY13.
Break up of Expenditure
(Rs. millions) Q2 FY14 Q2 FY13
Consumption of Raw Materials 538.30 382.90
Purchase of Trading goods 18.80 16.90
Personnel cost 108.70 96.30
Depreciation 13.10 15.40
Manufacturing & Operating
expenses 110.20 84.80
Administrative & Other Expenses 55.60 53.80
Selling & Distribution Expenses 75.60 69.00
Months Sep-13 Sep-12 % Change
Net Sales 1165.50 916.90 27.11
PAT 235.30 176.50 33.31
EPS 19.08 14.31 33.31
EBITDA 374.50 282.60 32.52

Segment Revenue:
Revenue Wise Segment (Rs. mn) Q2 FY14 Q2 FY13
Apparel & Lifestyle Accessories 1165.60 915.80
Other/Reconciling Item 1.90 2.20
Latest Updates
• Kewal Kiran Clothing Ltd has declared an interim dividend @ 75% (Rs. 7.50/- per share) on equity share of
Rs. 10/- each for the half year ended September 30, 2013.
• The New Campaign of Integriti brand named as “The Spirit called Youth” has started which will be used for
promotion of Integriti brand during the next quarter.
• The company has opened 35 retail stores(Including 3 relocated) i.e. 15 K-Lounges , 12 Killer EBOs, 5 Integriti
EBOs and 3 Lawman Pg3 EBOs during Q2 and Navratri festival season. Closed 3 K-Lounge, 1 KLounge for Her,
2 Integriti EBOs and 1Killer EBOs. Relocated 3 retail stores.
• The Company enhanced “Business Progressive Fund” to Rs. 125.00 million by additionally creating Rs 15.00
million during current quarter out of its profits.
• Sales – Q2 FY2013-14:
o Apparel sales value increased by 28.52% to Rs 1129.90 mn as compared to corresponding quarter last
year.
o Apparel sales quantity increased by 16.37% and Apparel sales realization per unit increased by 10.44%
to Rs. 873.
• Sales – H1 FY2013-14
o Apparel sales value increased by 30.52% to Rs 1840.20 mn
o Apparel sales quantity increased by 17.31% Apparel sales realization per unit increased by 11.26% to Rs.
874
Brands
• Brand ‘Killer’ sales grew by 25% in Q2 FY14 to Rs. 589.00 mn from 472.90 mn in the corresponding quarter
of previous year and continue to be the flagship brand with share of 51%.
• Lawman Pg3 share has increased to 20% and sales grew by 53% in Q2 FY14 to Rs. 235.00 mn from 153.30
mn in the corresponding quarter of previous year.

Products
• During the quarter, Jeans is the largest selling product with a share of 61% of sales among their brands.
• Jeans sales increased by 17% from Rs. 601.50 mn in Q2 FY13 to Rs. 705.30 mn in Q2 FY14 and Sale of T-
Shirts increased by 25%to Rs. 50.20 mn against Rs. 40.10 mn in Q1 FY13.
Channels
• The channel mix has been stable with strong growth across all channels
• Sales through Retail and National Chain Stores showed strong growth of 29% and 77% respectively.
COMPANY PROFILE
Kewal Kiran Clothing Limited (KKCL) has Incorporated in 1981, and headquarter is at Mumbai, the company is
one of India’s largest branded apparel manufacturers dealing in apparel for both men and women. Killer, Easies,
LawmanPg3, Integriti are iconic apparel brands in India of the company. The company has consumers in Asia,
Middle East and CIS. The brand ‘Killer’ sales grew by 25% in Q2 FY14 to Rs. 589.00 mn from 472.90 mn in Q2
FY13 and continue to be the flagship brand with share of 51%. The company designs, manufactures and markets
branded jeans and a wide range of apparel products for men and women. The manufacturing units are
undoubtedly the real growth enablers for the company. The production facilities are ISO 9000 certified.
The proud owner of these brands is Kewal Kiran Clothing Limited (KKCL). Currently, the brands produce an
exciting range of western wear for men and women largely Design, manufactures and market jeans, formals, semi
formals, casual wears and lifestyle accessories under the brands Killer, Easies, Lawman Pg3 and Integriti. These
products are distributed through retail formats such as Addictions and K-Lounge, apart from other selling and
distribution formats.
Awards
The Company’s Annual Report for the FY 2012 won silver award from ‘The League of American Communications
Professionals’ (LACP) in the world’s largest annual report competition, featuring more than 6,000 entries from
over two-dozen countries
The Killer Jeans’ green advertisement made a sweep at the Olive Crown Awards held in April, 2013. The awards
were organised by the International Advertising Association, which recognises brands and companies that
encourage green based advertising. The Company won awards in the following categories:
� Gold Crown in Film Category
� Gold Crown in Out Of Home

� Gold Crown for the Green Brand of the Year
Advertiser of the Year
In recognition of KKCL’s 30-second commercial on ‘Water-Saver Jeans’, KKCL was awarded the coveted Grand
Prix award at the Abby’s held at Goafest 2013.
MANUFACTURING LOCATION
Kewal Kiran Clothing Limited designs and manufacturing facilities located in Dadar (Mumbai), Goregaon
(Mumbai), Daman and Vapi. Jeans manufacturing processes are supported by international technocrats.
DISTRIBUTION CHANNELS
KKCL has wide network of distribution channels helps to remain in touch with its diverse and expanding
customer base. This network also keeps abreast about their changing requirements. The company reaches out to
discerning customers through 141 K-Lounge showrooms, 3 K-Lounge for her showrooms, 129 Exclusive Brand
Outlets (EBOs), various Lifestyle accessories stores, National Chain Stores (NCSs), Multi-Brand Outlets (MBOs)
and many more. The company also use other modes, including distributors, master stockists, brand licensees and
online.

FINANCIAL HIGHLIGHT (STANDALONE) (A*- Actual, E* -Estimations & Rs. In Millions)
Balance Sheet as at March31, 2012 -2015E FY12A FY13A FY14E FY15E
I. EQUITY AND LIABILITIES:
A) Shareholders’ Funds:
a) Share Capital 123.30 123.30 123.30 123.30
b) Reserves and Surplus 2132.21 2415.32 3066.78 3823.05
Sub-Total Net worth 2255.51 2538.62 3190.08 3946.35
B) Non-Current Liabilities:
a) Other Long Term Liabilities 38.66 54.34 76.08 102.70
b) Long Term Provisions 6.95 5.54 6.04 6.51
Sub-Total Long term liabilities 45.61 59.88 82.11 109.21
C) Current Liabilities:
a) Short-term borrowings 148.90 140.91 231.09 305.04
b) Trade Payables 157.82 227.41 341.12 426.39
c) Other Current Liabilities 77.96 111.61 133.93 147.33
d) Short Term Provisions 144.21 165.91 303.62 379.52
Sub-Total Current Liabilities 528.89 645.84 1009.75 1258.28
TOTAL EQUITY AND LIABILITIES (A + B + C) 2830.01 3244.34 4281.95 5313.84
II. ASSETS:
D) Non-Current Assets:
Fixed Assets
i. Tangible Assets 432.51 431.72 448.99 462.46
ii. Intangible Assets 1.83 3.71 5.64 7.89
iii. Tangible Capital work-in-progress 8.86 7.03 7.87 8.66
a) Total Fixed Assets 443.20 442.46 462.50 479.01
b) Deferred tax assets 17.28 20.30 23.35 26.61
c) Other non-current assets 10.95 9.64 11.09 12.64
d) Non Current Investments 35.09 34.83 37.62 39.87
e) Long Term Loans and Advances 106.53 96.82 101.66 105.73
Sub-Total Non-Current Assets 613.05 604.05 636.22 663.86
E) Current Assets:
a) Current Investments 280.70 1181.35 1712.96 2141.20
b) Inventories 320.93 336.70 606.06 969.70
c) Trade Receivables 482.17 478.71 798.20 1074.50
d) Cash and Bank Balances 1013.22 607.65 486.12 413.20
e) Short Term Loans and Advances 45.57 18.15 31.76 44.47
f) Other Current Assets 74.37 17.73 10.64 6.91
Sub-Total Current Assets 2216.96 2640.29 3645.74 4649.98
TOTAL ASSETS ( D + E ) 2830.01 3244.34 4281.95 5313.84

Annual Profit & Loss Statement for the period of 2012 to 2015E
Value(Rs.in.mn) FY12 FY13 FY14E FY15E
Description 12m 12m 12m 12m
Net Sales 3019.00 3029.90 3847.97 4463.65
Other Income 117.80 121.70 92.49 99.89
Total Income 3136.80 3151.60 3940.47 4563.54
Expenditure -2285.40 -2293.30 -2897.52 -3361.13
Operating Profit 851.40 858.30 1042.94 1202.41
Interest -25.90 -26.20 -28.82 -31.24
Gross profit 825.50 832.10 1014.12 1171.17
Depreciation -62.30 -59.40 -54.65 -59.02
Profit Before Tax 763.20 772.70 959.47 1112.15
Tax -241.80 -238.50 -307.99 -355.89
Net Profit 521.40 534.20 651.48 756.26
Equity capital 123.30 123.30 123.30 123.30
Reserves 2132.20 2415.30 3066.78 3823.05
Face value 10.00 10.00 10.00 10.00
EPS 42.29 43.33 52.84 61.34
Quarterly Profit & Loss Statement for the period of 31 MARCH, 2013 to 31Dec, 2013E
Value(Rs.in.mn) 31-Mar-13 30-June-13 30-Sep-13 31-Dec-13E
Description 3m 3m 3m 3m
Net sales 771.20 744.90 1165.50 1025.64
Other income 33.80 23.90 16.30 16.79
Total Income 805.00 768.80 1181.80 1042.43
Expenditure -553.60 -570.50 -807.30 -761.02
Operating profit 251.40 198.30 374.50 281.40
Interest -5.70 -6.80 -8.20 -7.54
Gross profit 245.70 191.50 366.30 273.86
Depreciation -14.70 -12.20 -13.10 -13.36
Profit Before Tax 231.00 179.30 353.20 260.50
Tax -66.10 -57.50 -117.90 -82.84
Net Profit 164.90 121.80 235.30 177.66
Equity capital 123.30 123.30 123.30 123.30
Face value 10.00 10.00 10.00 10.00
EPS 13.37 9.88 19.08 14.41

Ratio Analysis
Particulars FY12 FY13 FY14E FY15E
EPS (Rs.) 42.29 43.33 52.84 61.34
EBITDA Margin (%) 28.20 28.33 27.10 26.94
PBT Margin (%) 25.28 25.50 24.93 24.92
PAT Margin (%) 17.27 17.63 16.93 16.94
P/E Ratio (x) 26.96 26.31 21.58 18.59
ROE (%) 23.12 21.04 20.42 19.16
ROCE (%) 38.00 34.25 32.08 29.67
Debt Equity Ratio 0.07 0.06 0.07 0.08
EV/EBITDA (x) 16.51 16.38 13.48 11.69
Book Value (Rs.) 182.93 205.89 258.73 320.06
P/BV 6.23 5.54 4.41 3.56
Charts

OUTLOOK AND CONCLUSION
� At the current market price of Rs. 1140.00, the stock P/E ratio is at 21.58 x FY14E and 18.59 x FY15E
respectively.
� Earning per share (EPS) of the company for the earnings for FY14E and FY15E is seen at Rs.52.84 and
Rs.61.34 respectively.
� Net Sales and PAT of the company are expected to grow at a CAGR of 14% and 13% over 2012 to 2015E
respectively.
� On the basis of EV/EBITDA, the stock trades at 13.48 x for FY14E and 11.69 x for FY15E.
� Price to Book Value of the stock is expected to be at 4.41 x and 3.56 x respectively for FY14E and FY15E.
� We expect that the company surplus scenario is likely to continue for the next three years, will keep its
growth story in the coming quarters also. We recommend ‘BUY’ in this particular scrip with a target price of
Rs.1283.00 for Medium to Long term investment.
INDUSTRY OVERVIEW
The Indian Textile Industry counts among the leading textile industries in the world. Apart from providing the
basic necessities of life, its role in the country’s economic growth is significant. India’s textile industry
contributes about 14 per cent to industrial production; 4 per cent to the country’s gross domestic product (GDP);
17 per cent to its export earnings; and is a source of direct employment for over 35 million people, which makes
it the second largest provider of employment after agriculture. Abundant raw materials, healthy foreign direct
investments (FDI) and a government willing to invest ensures a bright future for India’s textile sector.
Market Size
• The industry is expected to touch US$ 220 billion by 2020, according to estimates by Alok Industries Ltd.
Also, India has the capacity to improve its textile and apparel share in the world trade from the current 4.5
per cent to 8 per cent and reach US$ 80 billion by 2020.
• Garment exports from India grew by 19 per in the period July 2012–July 2013 to touch US$ 1.27 billion, on
the back of increasing demand in developed economies such as the US, according to data released by the
Apparel Export Promotion Council (AEPC).
• India has the advantage of abundant resources of raw materials. It is one of the largest producers of cotton
yarn in the world and there are good resources of fibres such as polyester, silk, viscose, etc. The country is
also home to a wide range of cotton fibre and has a rapidly developing synthetic fibre industry.
• The most significant change in the Indian textile industry has been the advent of man-made fibres (MMF).
India’s innovative range of MMF textiles finds presence in almost all the countries across the globe. MMF
production recorded an increase of 7 per cent in the month of August 2013 and grew by 4 per cent during
April–August 2013.
• Cotton yarn production increased by about 10 per cent during August 2013 and by about 11 per cent during
April–August 2013. Blended and 100 per cent non-cotton yarn production increased by 5 per cent during
August 2013 and by 8 per cent during April–August 2013.
• Cloth production by mill sector registered a growth of 4 per cent during August 2013 and 10 per cent during
April–August 2013. Cloth production by handloom and hosiery increased by 3 per cent and 12 per cent
during April–August 2013. The total cloth production grew by 6 per cent during August 2013 and by 3 per
cent during April–August 2013.
Investments
Investment is the key for Indian textiles to make rapid strides. The industry (including dyed and printed)
attracted FDI worth Rs 5883710.00 million (US$ 928.63 million) in the period April 2000–August 2013.

Some of the major investments in the Indian Textile Industry are as follows:
� Trident Ltd plans to invest Rs 16670.00 million (US$ 263.24 million) to install 176,000 spindles and 500
looms to manufacture around 40,000 TPA of additional cotton yarn of higher count
� Exhilway, a US-based private equity firm, will fund a Kolkata-headquartered garments retail start-up firm
Sconto Retail Pvt Ltd. The initial investment will only be in equity of around Rs 60.00 million (US$
947,490.36), with the graded funding, both in equity and debt, likely to go up to Rs 240.00 million (US$ 3.79
million) by the first 18 months
� The DyStar Group and Arvind Ltd have signed an agreement for joint development in the field of denim.
Dedicated teams from DyStar and Arvind's Denim Division will work closely to implement new technologies
in indigo dyeing and finishing as well as develop new products, processes and effects for denim fabrics and
garments
� Gitanjali Group has entered into the apparels segment as part of its brand extension of its popular brands and
plans to set up 300 selling points across the country in 2013.
� Swedish retailer Rusta plans to import Indian textiles and handicraft worth Rs 2000.00 million (US$ 31.58
million) annually over the next 3-4 years.
Government Initiatives
India is expected to become a significant player in the global textile economy, both as a consumer and as a
producer of textiles. The efforts of the government have resulted in the industry growth rate of 8–9 per cent
during the past 2–3 years.
The Ministry of Textiles is responsible for policy formulation, planning, development, export promotion and
trade regulation in respect of the textile sector. This includes all natural and man-made cellulosic fibres that go
into the making of textiles, clothing and handicrafts.
Some of initiatives taken by the government to further promote the industry are as under:
� The Government of India plans to set up a Rs 1000.00 million (US$ 15.79 million) venture capital fund to
provide equity support to start-ups in the textile sector, in order to encourage innovative ideas.
� The Government has allowed 100 per cent FDI in the sector through the automatic route. In the 12thFive
Year Plan (2012–17), the government plans to spend US$ 9.1 billion on textiles as against US$ 4 billion in the
11th Plan.

� In order to make textile processing units more environment-friendly and globally competitive, the Cabinet
Committee on Economic Affairs (CCEA) has approved an Integrated Processing Development Scheme (IPDS)
with an investment of Rs 5000.00 million (US$ 78.94 million).
� Under the Technology Upgradation Fund Scheme (TUFS), the cotton textile industry of India will receive
margin money from the Ministry of Finance. The industry is also expected to attract Rs 40000.00 millions
(US$ 631.65 million) in the form of investments over the next six months.
� The Government of India has allotted Rs 7000.00 millions (US$ 110.53 million) in the next Five Year Plan for
the development of technical textiles. In 2012–13, the technical textiles industry reached Rs 7.48 trillion (US$
118.19 billion) at an annual growth rate of 3.5 per cent.
� In the new textile policy, the Government of Gujarat has announced 5 per cent interest subsidy on bank loans
for five years, for those who establish new plants for value addition chain like ginning, processing, weaving,
knitting, and machine carpeting.
Road Ahead
The future for the Indian textile industry looks promising, buoyed by both strong domestic consumption as well
as export demand. With consumerism and disposable income on the rise, the retail sector has experienced a
rapid growth in the past decade with the entry of several international players like Marks & Spencer, Guess and
Next into the Indian market. The organised apparel segment is expected to grow at a compound annual growth
rate (CAGR) of more than 13 per cent over a 10-year period.
Disclaimer:
This document prepared by our research analysts does not constitute an offer or solicitation for the purchase or sale
of any financial instrument or as an official confirmation of any transaction. The information contained herein is
from publicly available data or other sources believed to be reliable but do not represent that it is accurate or
complete and it should not be relied on as such. Firstcall India Equity Advisors Pvt. Ltd. or any of it’s affiliates shall
not be in any way responsible for any loss or damage that may arise to any person from any inadvertent error in the
information contained in this report. This document is provide for assistance only and is not intended to be and must
not alone be taken as the basis for an investment decision.

Firstcall India Equity Research: Email – [email protected]
C.V.S.L.Kameswari Pharma
U. Janaki Rao Capital Goods
Ashish.Kushwaha IT, Consumer Durable & Banking
Anil Kumar Diversified
Suhani Adilabadkar Diversified
M. Vinayak Rao Diversified
Firstcall India also provides
Firstcall India Equity Advisors Pvt.Ltd focuses on, IPO’s, QIP’s, F.P.O’s,Takeover
Offers, Offer for Sale and Buy Back Offerings.
Corporate Finance Offerings include Foreign Currency Loan Syndications,
Placement of Equity / Debt with multilateral organizations, Short Term Funds
Management Debt & Equity, Working Capital Limits, Equity & Debt
Syndications and Structured Deals.
Corporate Advisory Offerings include Mergers & Acquisitions(domestic and
cross-border), divestitures, spin-offs, valuation of business, corporate
restructuring-Capital and Debt, Turnkey Corporate Revival – Planning &
Execution, Project Financing, Venture capital, Private Equity and Financial
Joint Ventures
Firstcall India also provides Financial Advisory services with respect to raising
of capital through FCCBs, GDRs, ADRs and listing of the same on International
Stock Exchanges namely AIMs, Luxembourg, Singapore Stock Exchanges and
other international stock exchanges.
For Further Details Contact:
3rd Floor,Sankalp,The Bureau,Dr.R.C.Marg,Chembur,Mumbai 400 071
Tel. : 022-2527 2510/2527 6077/25276089 Telefax : 022-25276089
E-mail: [email protected]
www.firstcallindiaequity.com