
Kevin H. O’Rourke Department of Economics and IIIS Trinity ... · Kevin H. O’Rourke Department...
35
Europe and the causes of globalization, 1790 to 2000 Kevin H. O’Rourke Department of Economics and IIIS Trinity College, Dublin Forthcoming in H. Kierzkowski (ed.), From Europeanization of the Globe to the Globalization of Europe (Palgrave, 2002).
Transcript of Kevin H. O’Rourke Department of Economics and IIIS Trinity ... · Kevin H. O’Rourke Department...

Europe and the causes of globalization, 1790 to 2000
Kevin H. O’Rourke
Department of Economics and IIISTrinity College, Dublin
Forthcoming in H. Kierzkowski (ed.), From Europeanization of the Globe to theGlobalization of Europe (Palgrave, 2002).

1
Europe and the Causes of Globalization, 1790 to 2000
Kevin H. O�Rourke*
Trinity College, Dublin and CEPR and NBER
1. Introduction
According to the recent declaration agreed by EU leaders at Laeken, the EU seeks to become
�a power wanting to change the course of world affairs in such a way as to benefit not just the
rich countries but also the poorest. A power seeking to set globalisation within a moral
framework, to anchor it in solidarity and sustainable development� (Irish Times, December
17, 2001). Indeed, globalization is identified by the declaration as one of the two key
challenges facing the Union. The prominence given to this issue reflects in part the belief,
shared by politicians and �anti-globalization� protestors alike, that globalization is a new and
unprecedented phenomenon. But is this in fact the case? And does Europe actually have
anything to contribute to this process at the start of the 21st century? In this chapter, I trace the
evolution of international economic integration over the past two centuries, and seek to
explain that evolution, highlighting Europe�s role. I conclude by speculating about ways in
which the EU may be able to inform the globalization debate over the coming decades.
There will be at least two main themes in what follows. The first is that the move
towards greater economic integration has not been unidirectional, but that the globalization
process has suffered periodic reversals. Moreover, it is the 19th century rather than the 20th
which saw the most impressive integration gains. The second is that the major threats to the
smooth functioning of the world economy have changed over time, from war, to tariffs and
quotas, to spillovers from domestic regulation. This change in part reflects the changing
nature of international trade. The way in which the international community has responded to
these evolving threats by developing appropriate institutions has been the major determinant,
along with technology, of globalization trends since 1790.

2
2. Globalization through history: the 19th century was different
Contrary to popular belief, the most impressive episode of international economic integration
which the world has seen to date was not the second half of the 20th century, but the years
between 1870 and the Great War. The 19th century, and in particular the late 19th century, was
the period that saw the largest decline ever in inter-continental barriers to trade and factor
mobility. I start by surveying trends in commodity market integration (CMI), and then turn to
factor mobility and foreign direct investment (FDI).
2.1. Commodity market integration
The costs of trading across frontiers will be reflected in price differentials for homogenous
goods in different markets, and a decline in these price differentials provides the clearest
indication of international CMI. Findlay (ch. 2 in this volume) shows that economic links
between continents extend far back in time, and that these links had important effects on the
transfer of technology and germs, the determination of aggregate price levels, the
development of key industries, and other important economic variables. However, prior to the
19th century there is no systematic evidence of inter-continental price convergence: for
example, Figure 1 gives data on price gaps between Amsterdam and Southeast Asia for three
commodities, cloves, coffee and black pepper (here measured as the ratio of the Amsterdam
to the Asian price). In all three cases, the story is the same: little or no price convergence prior
to 1800, but substantial price convergence thereafter. Nor is there any evidence of Anglo-
Indian price convergence from the mid-17th to the mid-18th century: the trade expansion
between 1500 and 1800 was due to demand and supply shifts, rather than to CMI (O�Rourke
and Williamson 2002a).
The 19th century could not have been more different. Figure 1 shows rapid Dutch-
Asian price convergence for the 19th century: for example, by the 1820s the clove price spread
was one-fourteenth of the 1730s level. Figure 2 provides similar evidence for another
commodity, wheat, and a different pair of countries, Britain and the US.1 The price gap

3
fluctuated widely around an average level of maybe 100% between 1800 and 1840, before
falling sharply, and reaching negligible levels by the eve of World War I. (Strikingly, there
has been no further price convergence for this commodity and this pair of markets during the
20th century.) The evidence of Figure 2 could be replicated many times over: by the late 19th
century it is difficult to find commodities and pairs of markets for which there is no evidence
of powerful CMI.2 To take just three examples, London-Cincinnati price differentials for
bacon fell from 92.5% in 1870 to 17.9% in 1913 ; the Liverpool-Bombay cotton price spread
fell from 57% in 1873 to 20% in 1913; and the London-Rangoon rice price spread fell from
93 to 26% over the same period (O�Rourke and Williamson 1999, pp. 43-53). CMI during this
period was a genuinely worldwide phenomenon.
Surprisingly, there has been almost no work done documenting long run trends in CMI
over the 20th century. Figure 2 suggests that for one commodity, wheat, and one pair of
countries, Britain and the US, integration is no better today than it was before 1914. Clearly
much work needs to be done on this important issue; in what follows I offer a survey of some
of the more readily accessible data. Crucially, the evidence that follows is for the late 20th
century only; research spanning the entire 20th century is to my knowledge non-existent.
The World Bank Development Indicators 1999 gives agricultural producer prices (in
dollars per metric ton) for wheat and maize. Figure 3 gives the coefficient of variation for
wheat and maize prices from 1966 to 1995. For wheat, data are available for 10 countries over
the full period; data for a further nine countries are available through 1994; and data for a
further seven countries are available through 1992.3 For maize, data are available for 13
countries over the full period; for an additional 12 through 1994; and for an additional nine
through 1990.4 For both foodstuffs the data show a clear increase in the coefficient of
variation between 1966 and 1995, rather than a decline: no sign of market integration here
(the figure uses the 10 and 13-country samples for which data are available over the entire
period; using the larger samples available over shorter periods yields identical results).

4
The other data source I use is the IMF�s International Financial Statistics, which gives
prices for a number of commodities; in some cases, prices are given for the same commodity
in more than one market. Table 1 gives percentage price gaps for 16 commodities (based on
regressions of the price gaps on time and time squared). There are as many price gaps
increasing as decreasing during the 1950s, 1980s and 1990s, as well as overall; more price
gaps increased than declined during the 1960s and 1970s.
Of course, one would not want to infer too much from these late 20th century price
data. First, since I have taken them from official sources, rather than directly from primary
sources such as newspapers, I cannot be sure of how comparable the goods are in each
market; price trends may thus reflect changing quality differentials as well as trading costs.
Second, the official sources used give a biassed sample of goods (i.e., commodities); if these
markets are more prone to government intervention than, say, industrial markets, the figures
would give a misleading overall impression. Nonetheless, there is a sharp contrast between
this ambiguous late 20th century evidence, and the pervasive late 19th century evidence of
commodity price convergence. The message is not that commodity markets have in fact
disintegrated over the past few decades, but that we urgently need serious research on CMI
during the 20th century.
The lack of such research has led most scholars to rely on quantity data when
assessing overall trends in CMI over the period, despite the obvious defects of such measures.
Once again, the 19th century emerges as the canonical period of increasing world trade. World
trade grew at a little over 1% per annum between 1500 and 1800 (O�Rourke and Williamson
2002a), but it has grown at around 3.5% per annum since 1820, with the 19th and 20th century
growth rates being roughly equal (Maddison 1995). However, the 19th century growth rate
was more impressive than the 20th, in the sense that world GDP growth was twice as high
since 1913 as it was between 1820 and 1913: the implication is that trade ratios (e.g. the ratio
of merchandise exports to GDP) grew more rapidly during the 19th century than they did

5
during the 20th. Table 2 documents the eight-fold increase in this ratio worldwide between
1820, when trade was negligible as a share of GDP, and 1913, when merchandise exports
accounted for almost 8% of world GDP, and more than 16% of western European GDP.
Progress in the 20th century was much less impressive. Table 2 shows that merchandise
exports accounted for a smaller share of world GDP in 1950 than they had done in 1913,
suggesting interwar disintegration; and that the 1913 levels of openness (on this measure) had
not been recouped as late as 1973 in the UK, Spain, Australia, Latin America, China, India
and Thailand. Indeed, they had not been recouped as late as 1992 in much of the developing
world, and in particular in Latin America and India (where they had not even been recouped
by 1998).
However, the merchandise share of GDP has been shrinking since 1913, which would
tend to pull down the share of merchandise exports in GDP, irrespective of globalization
trends. As Robert Feenstra (1998), among others, has pointed out, the growth in merchandise
trade has been far more impressive relative to merchandise value added than relative to GDP
(although even his Table 2, which gives data for advanced countries only, shows Japanese and
UK ratios lower in 1990 than in 1913). And other more qualitative criteria also clearly
demarcate the present era from the period before World War I (CEPR 2002): higher levels of
intra-industry trade relative to inter-industry trade; a rapid growth of trade in components,
reflecting the increased fragmentation of firms� production processes;5 and the emergence of
new, �weightless� commodities thanks to new information technology.
Overall, several conclusions regarding CMI over the past two centuries seem
reasonable. First, ongoing CMI started in the 19th century, which saw far more dramatic
progress towards integration than did the 20th century.6 Second, international commodity
markets are probably better integrated today than they were in 1913, although we do not have
hard quantitative evidence to back up this assertion. Third, there are significant qualitative
differences between trade today and trade in the past. Even so, it is important not to

6
exaggerate the significance of the past decade�s changes (CEPR 2002). �Weightless� activities
only account for a tiny share of GDP; and gravity equations explaining the volume of trade
find that distance continues to influence trade greatly. Thus, a typical elasticity of trade with
respect to distance emerging from these regressions (say -1.25) implies that trade volumes at
distances of 4000 km are down by 82% relative to their values at 1000 km. The death of
distance has, it turns out, been greatly exaggerated.
2.2. Capital market integration and foreign direct investment
Standard measures tell a consistent story: capital markets became much more integrated in the
late 19th century, reaching extremely high levels of integration in 1913; they disintegrated
during the interwar period, and are only now recovering the levels of integration experienced
in 1913. Once again, the 19th century stands out as the century which saw the greatest increase
in integration: for example, Lothian (2000) documents a big 19th century decline in the
international dispersion of real interest rates. By contrast, the 20th century saw disintegration
followed by recovery. This U-shaped pattern is apparent in data on current account to GDP
ratios; on real and nominal interest-rate differentials; and in applications of the Feldstein-
Horioka test to long-run data (Obstfeld and Taylor 1998, 2001).
As is the case with international commodity markets, however, such quantitative
evidence ignores several important qualitative changes which have occurred over time. Net,
long run capital flows may be no more impressive now than in 1913, but international capital
markets today differ in several respects from those of one hundred years ago. Most notably, a
far broader range of financial assets are traded today, while the ratio of gross to net capital
flows is much greater now than then, reflecting greater volumes of short run capital flows
(Bordo, Eichengreen and Kim 1998). On the other hand, international capital markets today
do a far less impressive job of channeling savings towards developing countries than did their
counterparts of a hundred years ago (Obstfeld and Taylor 2001).

7
FDI is a dimension of capital flows that deserves separate mention, since it can play a
particularly powerful role promoting technological transfer (Cantwell and Piscitello, ch. 8 in
this volume), and in helping peripheral countries converge on the core (Barry, ch. 9 in this
volume). Table 3, taken from Michael Twomey�s (2000) recent book on the subject, shows
that a 20th century U-shaped pattern also applies to FDI: FDI relative to GDP collapsed
between 1913 and 1950, before subsequently recovering. Outward FDI remains much less
important today than it was in 1913 for two former colonial powers, the UK and the
Netherlands. In terms of world averages, the stock of FDI reached over 9% of world GDP in
1913, a figure only exceeded in the early 1990s (the figure stood at 16% in 1999).7 FDI is
more important now to the world as a whole, but we are talking about a quantitative, not a
qualitative shift. Furthermore, as Table 3 shows, FDI plays a significantly less important role
today in developing countries than it did on the eve of World War I: it accounts for 18% of
GDP in developing countries today, as opposed to 40% in 1913. This reflects the fact that
LDCs are host to less than a third of world FDI today, as opposed to almost two thirds in 1914
(O�Rourke 2002). As in the case of capital flows more generally, however, the composition of
FDI flows has shifted markedly over time (Baldwin and Martin 1999). In 1914, 70% of US
FDI in the Third World was in agriculture, mining or petroleum; 26% was in services; and
just 1% in manufacturing. In 1998 these figures were 14%, 59% and 27% respectively
(Twomey 2000, Table 3.14, p. 55).
As in the case of commodity trade, it appears that the 19th century was the canonical
globalization epoch, in that by the end of the period capital markets and FDI had become very
extensive; by contrast, quantitative measures show only minor gains over the 1913-2000
period as a whole, with a late 20th century recovery following an early 20th century slump.
2.3. Migration
It is in the area of migration that the late 19th century seems most clearly to have been more
globalized than today. Although barriers to immigration were being erected by the end of the

8
period, by and large the late 19th century stands out as a relatively liberal interlude in terms of
migration policy, and falling transport costs eventually led to huge migration flows (roughly
60 million Europeans emigrated to the New World between 1820 and 1914).
At the beginning of the century, transport costs remained high, free labour flows were
still small, and intercontinental migration was dominated by slavery. During the 1820s, free
immigration into the Americas averaged a mere 15,380 per annum, compared with a slave
inflow of 60,250 per annum. By the 1840s, the free inflow had increased to 178,530 per
annum (and the slave inflow had declined to 44,510 per annum: Chiswick and Hatton 2001,
Table 1), although it was not until the 1880s that the cumulative European migration exceeded
that of the African (Eltis 1983, p. 255). In the first three decades after 1846, total European
intercontinental emigration averaged around 300,000 per annum; the numbers more than
doubled in the next two decades, and rose to more than a million per annum after 1900
(Chiswick and Hatton 2001, Figure 1). There were also significant migrations within Europe
and the New World, as well as substantial intercontinental emigration from Asia.
As with trade and capital flows, this dimension of globalization went into reverse after
1914. European emigration had averaged over 1.2 million per annum in the decade before the
war; it was less than half that between 1916 and 1930; and during the 1930s it was lower than
it had been in the late 1840s (Chiswick and Hatton 2001, Figure 1). Again, decline was
followed by recovery; gross immigration into the US was 4.1 million during the 1920s, 0.5
million in the 1930s, 1 million in the 1940s, 2.5 million in the 1950s, 3.3 million in the 1960s,
4.5 million in the 1970s, and 7.3 million in the 1980s (Chiswick and Hatton 2001, Table 2).
However, in the case of migration this U-shaped recovery is not yet complete. The world
stock of migrants was 2.3% of the total world population in both 1965 and 1990. Within
Western Europe, the share of migrants in the total population increased from 3.6% to 6.1%
over the same period, while within North America, the migrant share increased from 6% to
8.6% (Zlotnik 1999). By contrast, the foreign born accounted for 14.7% of the population of
9
the United States, and 22% of the Canadian population in 1911. Similarly, 1990s immigration
rates into countries like the US (roughly 30 per thousand), Canada (70 to 80 per thousand in
the early 1990s) and Germany (roughly 80 per thousand in the first half of the decade, and 50
per thousand thereafter), while clearly substantial, were dwarfed by those of the late 19th and
early 20th centuries: in the first decade of the 20th century these were 167.6 in Canada, 118.4
in Cuba, 102 in the United States, and 291.8 in Argentina (O�Rourke 2002).
2.4. Summary: the 19th and 20th centuries compared
It would appear that the 19th century saw greater globalization gains than any period before or
since. There is however an important distinction to be made between levels and trends. There
was greater progress towards integration in the 19th century along every dimension of
globalization, but in terms of the absolute level of integration, matters are more obscure.
Commodity markets are probably somewhat better integrated today, although we lack
convincing evidence to this effect; capital markets are on balance about as well integrated
today; and labour markets are less well integrated today.
3. Explaining international economic integration
Why did the 19th century see more impressive gains in international economic integration than
did the 20th? The answers must lie in the technological and political histories of the two
periods, and I consider each in turn.
3.1. Technological change
Findlay (ch. 2 in this volume) has discussed the impact of globalization on the European
industrial revolution of the late 18th century, but causation was by no means one way: some of
the most dramatic effects of that revolution, with its breakthroughs in steam technology and
metallurgy, would occur in the following century in the transportation sphere. O�Rourke and
Williamson (1999) document the impact of railroads in cutting transport costs on land; by sea,
the development of the steamship played a crucial role in making intercontinental trade

10
cheaper. Knick Harley�s (1988) index of British ocean freight rates remains relatively
constant between 1740 and 1840, before dropping by about 70% between 1840 and 1910: a
dramatic decline indeed, and one which was mirrored on sea routes worldwide (Findlay and
O�Rourke 2001). Strikingly, Figure 2 shows that it was precisely around 1840 that sustained
CMI involving the British and American wheat markets began. Transport cost declines were
the big cause of late 19th century commodity market integration. They were also necessary for
the surge in migration during that period: while wage gaps between Europe and the New
World had always been high, prior to the advent of cheap ocean transport emigration was
simply not an option for those poor Europeans who stood to benefit from it most (Hatton and
Williamson 1998).
Figure 4 extends the British freight rate evidence into the 20th century: it plots freight
rates deflated by the Statist wholesale price index between 1869 and 1966.8 Between 1869
and 1914 these freight rates fell by 34 percentage points (based on a regression of the deflated
rates on time and time-squared). Freight rates increased sharply during the war, remaining
abnormally high until 1920. While they fell until 1925, they never attained their prewar levels,
and rose thereafter, with the overall trend between 1921 and the late 1950s being broadly flat
(at a level roughly equal to the 1869 level). However, in the late 1950s real freight rates fell
sharply, almost to the lows attained in the late 1900s.
In the most careful study of post-1945 trends to date, David Hummels (1999)
concludes that ocean freight rates have actually increased over much of the period. An index
of liner shipping prices, calculated by the German Ministry of Transport, rises from 1954 to
1958, is fairly flat until 1970 (despite the introduction of containers in the 1960s), rises
through the 1970s, peaks in 1985, and falls sharply thereafter. Deflated by the German GDP
deflator it never attains its 1960s levels, even as late as 1997; deflated by the US GDP deflator
it only recovers to its 1954 position by 1993.

11
The fact that ocean freight rates have failed to register significant declines in real
terms since 1910 or so seems to offer one obvious explanation for the apparent failure of the
20th century economy to register as much CMI as did the preceding century. Three important
caveats are in order, however. First, we need better freight rate data spanning the entire
period. Second, air travel is obviously a key 20th century invention which marks a qualitative
break with the past, and which has revolutionized certain sectors of the economy, such as
tourism. Net labour flows between continents may be less important now than in 1913, but
presumably gross passenger numbers have increased relative to population (a similar
distinction to the one made earlier between gross and net flows for capital markets). Air
freight rates declined dramatically in the 1950s, 1960s and 1980s, while declining more
slowly in the 1990s, and rising in the 1970s. These declines were greatest on North American
routes. The result, predictably enough, has been a more than ten-fold increase in the ratio of
air to ocean shipments in the years since 1962 (Hummels 1999). Third, the increasing speed
of ocean transport has implied cost savings not accounted for by the freight rate data. More
rapid transport between 1950 and 1998 was, according to Hummels (2001), equivalent to
reducing US tariffs on manufacturing goods from 32% to 9%, a significant decline. A similar
calculation has not yet been done for the 19th century, however, another period of very
significant reductions in transport times.
As far as international capital markets are concerned, the most important breakthrough
of the last two hundred years was the introduction of the telegraph. To take just one example,
before the introduction of the trans-Atlantic cable in 1866 it took 10 days for information to
travel between London and New York: thus, would-be arbitrageurs between those two
markets had to place orders, based on information already 10 days old, which would only be
executed in a further 10 days. With the cable, investors could learn of international price
differentials, and respond to these, within a day: the result was an immediate 69% decline in
mean absolute price differentials for identical assets between the two cities (Garbade and

12
Silber 1978, p. 825). No other innovation, including that other late 19th century invention, the
telephone, or its late 20th century equivalent, the internet, has had a comparable impact on the
speed of information flows and capital market integration.
3.2. Politics
It seems as though technology might indeed help to explain the slower pace of integration
experienced in the 20th century; but it cannot explain the U-shaped pattern of disintegration
followed by recovery that seems to have characterised the period since 1913. After all, new
technologies are not typically forgotten, and were not in this instance. To explain
disintegration, politics has to be taken into account: the historical record indicates that politics
can quite easily reverse the impact of technology, at least in the short to medium run.
3.2.1. War
Prior to the 18th century, intercontinental trade largely involved �non-competing� goods with
no obvious substitutes in destination markets, Asian spices being an obvious example. In such
an environment, intercontinental trade would not be expected to have the economy-wide
income distribution effects which were identified by Heckscher and Ohlin, and the evidence
suggests that indeed it did not have such effects (O�Rourke and Williamson 2002b). Political
trade disputes were thus not so much intra-national as inter-national, and involved mercantilist
states competing for the rents associated with monopolising trade routes or foreign colonies.
Wars were frequent, and disrupted the international economy: Figure 1 shows disintegration
occurring during the 1650s and 1660s, coinciding with the first and second Anglo-Dutch
Wars; during the 1750s, coinciding with the Seven Years War (1756-63); and during the
1790s, coinciding with the outbreak of the French and Napoleonic Wars (1791-1815).
Findlay and O�Rourke (2001) show that the disruption associated with the last of these
wars was both extensive and long-lived. Blockades and embargoes had a large relative price
impact, the volume of trade declined sharply, and import-substitution was everywhere
encouraged. This last effect is the primary reason why wars (or Great Depressions) have such

13
long-lasting consequences: industries which have grown up under such hothouse conditions
tend to require protection to survive, and whenever wars end they leave powerful protectionist
coalitions in their wake. Thus, according to Crouzet (1964) the trade embargoes and
blockades associated with the wars of 1791-1815 replaced French industry�s traditional
Atlantic orientation with an inward-looking and defensive one, and help explain France�s
abiding suspicion of the international market-place; while Jefferson�s Embargo Act (1807-9)
arguably had similar effects in the Northern U.S. In exactly the same manner, the First World
War led to peacetime demands for industrial protection in countries such as India, Australia
and Argentina; more seriously, it led to a wartime expansion of grain production in regions
such as North America, to cope with Allied demand, which in turn provoked a postwar crisis
of agricultural over-supply which was a key source of interwar trade tensions, and helped
provoke the American Smoot-Hawley tariff (Aggarwal and Dupont, ch. 6 in this volume). Nor
do wars only disrupt international commodity markets: Lothian (2001) shows that wars have
been associated with capital market disintegration since the 17th century, while the negative
effects of wars on labour mobility, at least in the context of modern warfare, seem even more
obvious.
Viewed in this context, a key institutional innovation which ushered in the long 19th
century, and helped make it the canonical period of globalization, was the international
system instituted by the Congress of Vienna, which marked the end of an unusually bloody,
lengthy, and worldwide conflict. In Paul Schroeder�s view, the political equilibrium which
ensued arose from �a mutual consensus on norms and rules, respect for law, and an overall
balance among the various actors in terms of rights, security, status, claims, duties and
satisfactions rather than power� (Schroeder 1992, p. 694). Rather than relying on an
unattainable balance of power, the Congress implicitly recognized British and Russian
hegemony in their respective spheres of influence (the wider globe, and Eastern Europe and
much of Asia respectively); but the hegemony was relatively benign, and the entire system
14
relied on �the restoration of the rule of law, beginning with its foundation, the security and
legitimacy of all thrones� (Schroeder 1992, p. 696).
Ultimately, of course, the Vienna system was unable to withstand the rise of Germany,
which simultaneously challenged British dominance overseas, Russian dominance in Eastern
Europe, and British economic dominance in Western Europe. Nonetheless, the fact remains
that battlefield deaths as a proportion of Europe�s population were seven times higher in the
18th century than they were in the 19th (Schroeder 1994, p. vii), and the 19th century stands out
as an unusually peaceful one in the context of Europe�s bloody history. Thus European wars,
which have historically been such a major cause of international economic disruption, were
less important during this canonical globalization period than they have been before or since;
and this is surely no coincidence.
3.2.2. Traditional protectionism: tariffs and quotas
The French and Napoleonic wars thus gave rise to a settlement which led to �a dramatic
decline in the incidence, scope, length and violence of wars� (Schroeder 1994, p. vii). But
there are of course more prosaic reasons why the international economy can be disrupted.
Tariffs, quotas and other instruments can be used in an effort to stimulate infant industries; or
to influence the distribution of income; or to cope with the impact of recession. The 19th and
early 20th centuries saw protectionism being implemented for all these reasons, and more.
It was not just wars which gave rise to infant industry protection; such protection was
adopted in many New World economies in the late 19th century. The great transport cost
declines surveyed earlier made intercontinental bulk trade in basic commodities possible, and
led to a new worldwide division of labour, in which the resource-rich New World exported
food and raw materials in return for European manufactured goods. Not only the New World
found itself playing this role: India, a traditional exporter of textiles, found itself specialising
more and more in primary products. Thus, textiles accounted for more than half of the English
East India Company�s exports to Europe in the late 1750s; the figure had dwindled to a mere

15
3.7% in 1850-1 (Findlay and O�Rourke 2001). India was not legislatively independent, but the
New World was, and high tariffs on industrial products were adopted in Latin America, the
United States, Canada, and Australia. The collapse in primary product prices in the 1920s and
1930s, and the Depression-induced protection in core markets, would persuade many
developing countries to follow suit in the 20th century, with ultimately disastrous
consequences.
Another motivation for protection, particularly in the late 19th century, was the desire
to avoid the distributional effects associated with globalization (O�Rourke and Williamson
1999). As the land-abundant New World exported competing land-intensive products such as
wheat to Europe, European landowners found their incomes declining, and in many cases
their governments provided them with agricultural protection: thus tariffs represented
compensation for declining transport costs (Bairoch 1989, pp. 55-58). As labour-abundant
Europe exported unskilled workers to the New World, unskilled wages there fell in relative
terms and New World inequality rose. Again, governments responded by tightening
immigration restrictions. Thus, globalization largely undermined itself during this period: it
did not simply come to an abrupt end in 1914.
This is not to deny the importance of the First World War in destroying the liberal
economy of the pre-1914 era: it was an enormous shock which had long run as well as short
run consequences for international economic integration. Indeed, the imbalances to which it
gave rise were, as already stated, one of the key causes of the interwar descent into autarky.
However, the late 19th century record does clearly show that left to its own devices,
globalization can undermine itself politically, and that distribution matters, not just for its own
sake, but on account of the political responses which it provokes. (Further evidence of this
tendency for markets to undermine themselves can be found in the pre-1914 period�s
development of a variety of welfare institutions: see Atkinson (ch. 12 in this volume), and
Polanyi (1944).)

16
An account of the rise and decline of globalization from 1815 to 1945 would therefore
go something like this: In the aftermath of a catastrophic world war, the great powers agreed
on a system of interstate politics that largely kept the peace for a hundred years. This interlude
coincided with a transport revolution that, together with the telegraph, led to the greatest
increase in the integration of the international economy which the world has ever seen. The
globalization of the late 19th century was due to technology rather than economic policies,
since tariffs and migration quotas worked hard to mute its impact, at least from the 1870s; and
the First World War ultimately undid much of what had been achieved.
The economic imbalances caused by the Great War exacerbated protectionist
pressures, while the failure of the League of Nations to recreate the stability of the Congress
era made it more difficult for Governments to head those pressures off (Aggarwal and
Dupont, ch. 6 in this volume). Two further factors also help explain interwar deglobalization:
the Great Depression and democracy. The Depression obviously helped persuade
governments to adopt tariffs and migration restrictions; it also led to the widespread adoption
of Keynesian macroeconomic policies, which had far-reaching implications for capital
mobility. Obstfeld and Taylor (2001) have located the causes of the 20th-century U-shaped
pattern of capital mobility in governments� attempts to wrestle with the famous
macroeconomic policy trilemma: you cannot have fixed exchange rates, capital mobility and
an independent monetary policy simultaneously. This trilemma was resolved in the late 19th
century by abandoning interventionist monetary policy: the gold standard promoted capital
flows and fixed exchange rates, but tied the monetary authorities� hands. Democracy was
always going to make it more difficult for governments to adopt such a stance; faced with the
Great Depression, interwar governments abandoned fixed exchange rates and/or capital
mobility in order to concentrate on internal macroeconomic management. The postwar
Bretton Woods settlement opted for fixed exchange rates and Keynesianism, at the expense of
abandoning capital mobility. It was only with the abandonment of fixed exchange rates in the

17
early 1970s that international capital markets began to recover, to the point where they have
now become as integrated as they had been in 1913.
Distributional concerns, the macroeconomic environment, and World War I thus
explain the interwar period�s descent into autarky. However, just as the wars of 1791-1815
ushered in the Congress of Vienna, so the wars of 1914-45 led to another ambitious postwar
settlement which, crucially, involved the setting up of explicitly economic institutions such as
the GATT. These were designed to help governments face down the traditional �economic�
(Listian, Heckscher-Ohlin and Keynesian) demands for protection outlined above. Thus, the
settlement promoted the gradual liberalization of commodity markets: trade was liberalised
within the OECD, and CMI gradually resumed. Indeed, the CMI which has occurred since
1945 differs from that of the 1870-1914 period in that it was largely due to trade
liberalization, rather than technological change.
It is important to recognise, however, that focussing on postwar liberalization in the
OECD leads to an unbalanced view of late 20th century trade policies. Table 4 gives data on
manufacturing tariffs for a number of countries back to 1913. It shows the familiar OECD
story of rising interwar tariffs and falling postwar tariffs, and also shows that for most of these
countries tariffs are lower today than they were in 1913 (the UK being an exception).
However, this OECD story is not a universal one (and even in the context of the OECD it
ignores the more restrictive agricultural protection of today, as well as the greater use of non-
tariff barriers). In much of the developing world manufacturing tariffs today are higher than
they were in 1913, as a result of import substitution policies, socialism, or the intellectual
legacy of decolonisation. Just as important, for much of the late 20th century the Soviet Block
remained largely closed to international markets: the post-1945 economic settlement only
applied to the West, while the post-1945 political settlement led to a Cold War, rather than a
post-1815 style peace. It is for this reason above all that the 1990s stands out as a key

18
globalization decade, with an entire region of the world opening itself to international markets
for the first time in a generation (Kierzkowski, ch. 11 in this volume).
4. The future: coping with regulatory spillovers
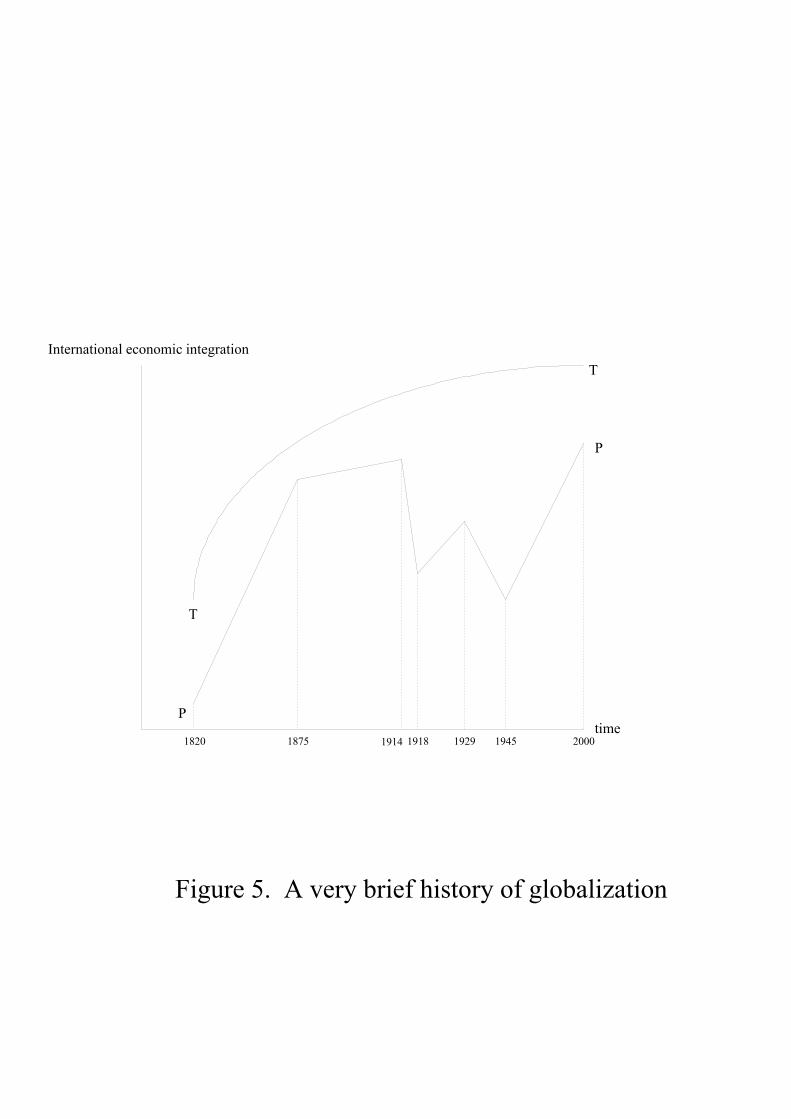
Figure 5 illustrates the argument thus far: it shows how the level of international economic
integration has changed between 1820 and 2000. TT represents the maximum level of
integration achievable, given the state of technology: it rises continuously throughout this
period, but at a slower rate during the 20th century than during the 19th. How close to this
technological frontier the world progresses is however a matter of politics: PP represents the
actual level of integration achieved over the period. Integration thus depends on technology
(TT), and on politics (the gap between TT and PP). This gap was much smaller in 1875 than
in 1820, indicating that in the absence of war, and with the gradual liberalization of trade
associated above all with Britain (Aggarwal and Dupont, ch. 6 in this volume), politics was
working in the same integrationist direction as technology. The post-1875 backlash is
indicated by the growing TP gap between 1875 and 1914; but this backlash was not sufficient
to overturn the impact of continuing technological progress. Where technology dominates 19th
century trends, politics explains the 20th-century U-shape. The disintegration of Word War I is
followed by a partial recovery through the 1920s, disintegration through 1945, and the rapid
integration of the post-war era, driven by GATT and other political institutions.
Just as the Congress of Vienna succeeded in reducing the incidence of warfare, so the
GATT and WTO have succeeded in reducing the incidence of tariffs, and to a lesser extent
quotas. These international settlements, following in the wake of two 30-year world wars,
together with the massive transport cost declines of the 19th century, and the more modest
declines of the 20th, are the key to understanding the large globalization upswing of 1815-
1914, and the smaller upswing (which largely represented a recovery of prior losses) of 1945-
2000.9 While wars and tariffs have not gone away, another challenge to CMI has recently

19
gained prominence: the difficulty of reconciling different countries� health, safety, antitrust or
environmental standards with the free international movement of goods and services. Disputes
regarding hormone-fed beef, or genetically modified crops, or dolphin-friendly tuna, are
likely to become more common in the future, if for no other reason than that health, safety,
antitrust and environmental legislation can be expected to accumulate in all countries over
time, in large part reflecting public opinion.
Over the past two centuries Europe has had a profound impact on globalization trends,
both positive and negative. The technological breakthroughs of the late 18th and early 19th
centuries mentioned above were largely (if not entirely) hers; and the world wars which have
periodically had such an impact on the international economy have also originated in Europe.
Indeed, one of the key determinants of globalization, at least until the Second World War, has
been the evolving relationship between Europe�s nation states. European political and
economic thought, and European colonialism, are two further factors with which any
complete account of the history of international economic integration would have to deal: for
example, not only has Europe produced the classical theories of free trade (and its antithesis,
Marxism), but European overseas expansion and European nationalism combined to produce
post-colonial �nation-states,� which pursued autarkic policies as enthusiastically as had the
new European nation states of the 1920s (Liebich, ch. 5 in this volume). Today Europe no
longer enjoys the international prominence which it once did (but see Steinherr, ch. 7 in this
volume): but does Europe have anything to contribute to international economic integration in
the years ahead?
To the extent that spillovers from domestic regulatory regimes into the international
trade sphere pose a major challenge for future CMI, the answer is probably �yes�. EU member
states have considerable experience in negotiating complex economic agreements in which
domestic regulations and trade concerns are intertwined, the most obvious example of this
being the negotiation of the �Single Market� or �1992� programme. European integration has

20
involved reconciling the �globalization� of internal EU markets (which is why the EU will
never make a particularly convincing opponent of globalization per se) with the continuing
heavy regulation of European economies (for good or ill). Europe, it could be said, has a
comparative advantage in producing trade agreements between independent nation states
which allow those states to preserve a large amount of domestic regulatory autonomy, while
at the same time facilitating the free international flow of commodities and factors of
production. As such, it seems that now would be an appropriate time for the EU to become
much more centrally involved in debates concerning the �international economic architecture�
(CEPR 2002), and in particular the future of the WTO.

21
Table 1. Percentage price gaps, selected commodities and markets
(based on regressions on time and time-squared) Commodity Markets 1948 1951 1957 1960 1970 1980 1990 1999 Butter UK-NZ -0.3 27.8 50.6 68.1 79.4 Cocoa beans UK/NYC-Brazil -4.3 -1.7 2.7 4.5 8.4 9.3 7.0 2.4 Coconut oil NYC-Phillippines 18.5 20.0 21.9 19.1 11.8 1.3 Coffee NYC-Brazil 10.4 14.6 21.6 24.5 31.0 32.5 29.2 22.1 Fishmeal Hamburg-Iceland 20.2 11.9 8.9 10.3 Lamb UK-NZ 22.0 33.9 59.1 62.4 43.7 8.1 Lead NYC-UK 51.4 39.0 14.4 15.8 43.2 90.1 Newsprint Finland-NYC 5.7 12.4 15.3 22.7 26.7 27.1 25.0 Palm Oil Europe-Malaysia 5.2 10.3 12.1 15.1 13.1 6.0 -2.0 Rice New Orleans-
Bangkok 48.9 32.2 25.8 14.3 17.5 35.5 64.3
Rubber NYC-Thailand 45.6 37.6 24.1 18.6 6.9 5.0 12.8 28.2 Sugar US-Brazil 46.0 46.7 55.1 73.1 100.8 134.0 Sugar Phillippines-Brazil 74.1 61.7 42.6 35.8 26.6 38.1 70.2 116.8 Tea London-Sri Lanka 18.1 17.0 13.9 11.8 10.6 10.3 Tin London-Malaysia 2.8 2.9 2.9 2.3 1.0 -0.2 Tin Bolivia-Malaysia 4.1 2.9 2.4 1.9 2.6 4.7 6.9 Zink NYC-Bolivia 5.3 15.8 21.1 38.8 56.5 74.1 90.1 Zink NYC-London 26.1 34.5 54.4 61.8 56.6 41.2
Source: IMF International Financial Statistics June 2000.

22
Table 2. Merchandise exports as a share of GDP (percent) Country 1820 1870 1913 1929 1950 1973 1992 1998 France 1.3 4.9 7.8 8.6 7.6 15.2 22.9 28.7 Germany na 9.5 16.1 12.8 6.2 23.8 32.6 38.9 Netherlands na 17.4 17.3 17.2 12.2 40.7 55.3 61.2 UK 3.1 12.2 17.5 13.3 11.3 14.0 21.4 25.0 Total Western Europe na 10.0 16.3 13.3 9.4 20.9 29.7 na Spain 1.1 3.8 8.1 5.0 3.0 5.0 13.4 23.5 USSR/Russia na na 2.9 1.6 1.3 3.8 5.1 10.6 Australia na 7.1 12.3 11.2 8.8 11.0 16.9 18.1 Canada na 12.0 12.2 15.8 13.0 19.9 27.2 na USA 2.0 2.5 3.7 3.6 3.0 4.9 8.2 10.1 Argentina na 9.4 6.8 6.1 2.4 2.1 4.3 7.0 Brazil na 12.2 9.8 6.9 3.9 2.5 4.7 5.4 Mexico na 3.9 9.1 12.5 3.0 1.9 6.4 10.7 Total Latin America na 9.0 9.5 9.7 6.2 4.6 6.2 na China na 0.7 1.7 1.8 2.6 1.5 2.3 4.9 India na 2.6 4.6 3.7 2.9 2.0 1.7 2.4 Indonesia na 0.9 2.2 3.6 3.4 5.1 7.4 9.0 Japan na 0.2 2.4 3.5 2.2 7.7 12.4 13.4 Korea 0.0 0.0 1.2 4.5 0.7 8.2 17.8 36.3 Taiwan -- -- 2.5 5.2 2.5 10.2 34.4 na Thailand na 2.2 6.8 6.6 7.0 4.1 11.4 13.1 Total Asia na 1.3 2.6 2.8 2.3 4.4 7.2 na World 1.0 4.6 7.9 9.0 5.5 10.5 13.5 17.2
Source: Findlay and O�Rourke (2001). na = not available.

23
Table 3. Trends in Foreign Direct Investment, 1913-1995
1913 1938 1950 1971 1980 1995 Developed Country Outward stock of FDI/GDP (percent) Canada 6 14 6 7 9 20 France 23 21 5 25 Germany 11 1 3 4 10 Japan 11 21 2 2 5 Netherlands 82 91 35 25 47 UK 49 38 9 17 15 28 US 7 8 4 8 8 18 1914 1930s 1950s 1970 1995 Developing Countries Inward stock of FDI/GDP (percent) Average colonies 42 61 35 14 19 Average independent 36 37 17 9 14 Average 40 51 30 13 18
Source: Twomey (2000), Table 3.4, p. 35; Table 7.2, p. 195.

24
Table 4. Average tariffs on manufactured goods, selected countries, 1913-1998 1913 1931 1950 1980 1998/99
Austria 18 24 18 14.6 NA Belgium 9 14 11 NA NA Denmark 14 � 3 NA NA France 20 30 18 NA NA Germany 13 21 26 NA NA Italy 18 46 25 NA NA Netherlands 4 -- 11 NA NA Spain 41 63 -- 8.3 NA Sweden 20 21 9 6.2 NA UK 0 -- 23 NA NA EU NA NA NA 8.3 4.1 Russia 84 ** ** ** 13.4a Switzerland 9 19 -- 3.3 3.2b Australia 16 -- -- -- 6 Canada 26 -- -- -- 4.9 Japan 25-30 -- -- 9.9 5.5 New Zealand 15-20 -- -- -- 4.4 USA 44 48 14 7 4.5 Argentina 28 -- -- -- 14 Brazil 50-70 -- -- -- 15.2 Colombia 40-60 -- -- -- 11.4 Mexico 40-50 -- -- -- 12.6 China 4-5 -- -- -- 17.4 India approx. 5 -- -- -- 34.2 Iran 3-4 -- -- -- -- Thailand 2-3 -- -- -- 47.2c Turkey 5-10 -- -- -- 0.25
Source: Findlay and O�Rourke (2001). Notes: NA = not applicable; � = not available; ** refers to the fact that the USSR ran such a restrictive trade policy that average tariffs were irrelevant; a = 1997; b = 1996; c = 1993.

25
Endnotes
* Several good friends have helped me with this paper. Parts of it draw on joint work with
Ronald Findlay (Findlay and O�Rourke 2001) and Jeffrey G. Williamson (O�Rourke and
Williamson 1999). I am grateful to both for allowing me to do this, and for many helpful
conversations on these and related issues. Tim Hatton, Alan Taylor, and Jeff Williamson
provided detailed scientific advice on Figure 5. I am particularly grateful to Jim Livesey for
important historical insights, and for reading an earlier draft. The usual disclaimer applies.
1 The British data are Gazette averages through 1980, and are taken from Mitchell (1988).
After 1980, they are taken from the Commodity Price Trends tables in the UK Annual
Abstract of Statistics. The US data for 1870-1913 are taken from O�Rourke (1997), where
they are expressed in shillings per cwt; onto these data are spliced the series in U.S.
Department of Commerce (1975) for 1800-1870; and from the US Department of Agriculture
website (http://usda.mannlib.cornell.edu/usda/usda.html) for 1914-1999.
2 Continental European grain markets protected by defensive tariffs provide one exception:
see O�Rourke (1997).
3 Data are available over the full period for: Algeria, Australia, Belgium, Greece, Malawi,
Pakistan, South Africa, Spain, Tunisia, Turkey. Through 1994, data are available for: Austria,
Egypt, France, Ireland, Italy, Paraguay, Portugal, Sweden, United States. Through 1992, data
are available for: Denmark, Guatemala, Jordan, Kenya, Norway, Rwanda, United Kingdom.
4 Data are available over the full period for: Algeria, Australia, Congo, Greece, South Korea,
Malawi, South Africa, Spain, Sri Lanka, Switzerland, Thailand, Turkey, Venezuela. Through
1994, data are available for: Austria, Dominican Republic, Egypt, France, Honduras, Italy,
Lesotho, Panama, Paraguay, Philippines, Portugal, United States. Through 1990, data are
available for: Belgium, Burkina Faso, Costa Rica, Cote d'Ivoire, Guatemala, Kenya, Rwanda,
Zambia, Zimbabwe.

26
5 According to Yeats (1998) 30% of world manufactures trade is trade in components rather
than final products.
6 It would be nice to have intercontinental price evidence for the period 1450-1550, which
would shed light on whether the European Voyages of Discovery led to a significant once-off
decline in intercontinental price differentials. Alas, such evidence has not yet been produced.
7 For the source of these statistics, see O�Rourke (2002).
8 Freight rates from 1869 to 1936 are from Isserlis (1938); from 1948 to 1966 the official
freight rates given in Mitchell (1988) are used. The two indices are spliced using the
calculation, cited in Mitchell (1988, p. 531), that nominal freight rates in 1948 were 3.3 times
higher than those in 1938; and the assumption that nominal freight rates rose slightly between
1936 and 1938, in the same proportion as did wholesale prices generally.
9 The fact that the Peace of Westphalia, associated with the ending of yet another 30-year war,
was also associated with institutional innovation (the development of the modern European
state system: see Kohen, ch. 4 in this volume), and with an improvement in outcomes (a
decline in religious warfare, and a certain growth of religious tolerance), might lead one to
speculate about a 150-year European cycle of systemic crisis, followed by systemic reform.
But one should probably not exaggerate.

27
References
Bairoch, P. (1989). �European Trade Policy, 1815-1914�, in P. Mathias and S. Pollard (eds.),
The Cambridge Economic History of Europe Volume VIII. Cambridge: Cambridge
University Press.
Baldwin, R. E. and Martin, P. (1999). �Two Waves of Globalization: Superficial Similarities,
Fundamental Differences�, in H. Siebert (ed.), Globalisation and Labour. Tübingen:
J.C.B. Mohr for Kiel Institute of World Economics.
Bordo, M. D., Eichengreen, B. and Kim, J. (1998). �Was There Really an Earlier Period of
International Financial Integration Comparable to Today?�, in The Implications of
Globalization of Financial Markets. Seoul: Bank of Korea.
CEPR. (2002). International Economic Integration, Sustainable Development and Inequality.
A study commissioned from the Centre for Economic Policy Research by the Group
of Policy Advisors to the President of the European Commission, December 2001.
London: CEPR, forthcoming 2002.
Chiswick, B. and Hatton, T. J. (2001). �International Migration and the Integration of Labor
Markets�. Paper presented at the NBER Globalization in Historical Perspective
conference, Santa Barbara, CA, May 3-6, 2001.
Crouzet, F. (1964). �Wars, Blockade, and Economic Change in Europe, 1792-1815�. Journal
of Economic History 24: 567-588.
Eltis, D. (1983). �Free and Coerced Transatlantic Migrations: Some Comparisons�. American
Historical Review 88: 251-80.
Feenstra, R. (1998). �Integration of Trade and Disintegration of Production in the Global
Economy�. Journal of Economic Perspectives 12: 31-50.
Findlay, R. and O�Rourke, K. H. (2001). �Commodity Market Integration 1500-2000�. NBER
Working Paper 8579. Cambridge, MA: NBER.
Garbade, K. D. and Silber W. L. (1978). �Technology, Communication and the Performance
of Financial Markets: 1840-1975�. Journal of Finance 33: 819-32.
Harley, C. K. (1988). �Ocean Freight Rates and Productivity, 1740-1913: The Primacy of
Mechanical Invention Reaffirmed�. Journal of Economic History 48: 851-76.

28
Hatton, T.J. and J.G. Williamson. (1998). The Age of Mass Migration: An Economic Analysis.
New York: Oxford University Press.
Hummels, D. (1999). �Have International Transportation Costs Declined?� Mimeo, Purdue
University.
Hummels, D. (2001). �Time as a Trade Barrier�. Mimeo, Purdue University.
Isserlis, L. (1938). �Tramp Shipping Cargoes and Freights�. Journal of the Royal Statistical
Society 101: 304-417.
Lothian, J.R. (2000). �Capital Market Integration and Exchange Rate Regimes in Historical
Perspective�, in I. Hasan and W.C. Hunter (eds.), Research in Banking and Finance 1.
New York: Elsevier.
------ (2001). �Financial Integration Over the Past Three Centuries�. Independent Institute
Working Paper 26. Oakland, CA: Independent Institute.
Maddison, A. (1995). Monitoring the World Economy 1820-1992. Paris: OECD.
Mitchell, B. R. (1988). British Historical Statistics. Cambridge: Cambridge University Press.
Obstfeld, M. and Taylor, A. M. (1998). �The Great Depression as a Watershed: International
Capital Mobility in the Long Run�, in M. D. Bordo, C. D. Goldin and E. N. White
(eds.), The Defining Moment: The Great Depression and the American Economy in
the Twentieth Century. Chicago: University of Chicago Press.
------ (2001). �Globalization and Capital Markets�. Paper presented at the NBER Globalization
in Historical Perspective conference, Santa Barbara, CA, May 3-6, 2001.
O'Rourke, K. H. (1997). �The European Grain Invasion, 1870-1913�. Journal of Economic
History 57: 775-801.
------ (2002). �Globalization and Inequality: Historical Trends�. Annual World Bank
Conference on Development Economics 2001, forthcoming.
O'Rourke, K. H. and Williamson. J. G. (1999). Globalization and History: The Evolution of a
Nineteenth-Century Atlantic Economy. Cambridge, MA: MIT Press.
------ (2002a). �After Columbus: Explaining the Global Trade Boom 1500-1800�. Journal of
Economic History, forthcoming.
------ (2002b). �The Heckscher-Ohlin Model Between 1400 and 2000: When It Explained
Factor Price Convergence, When It Did Not, and Why�, in R. Findlay, L. Jonung and

29
M. Lundahl (eds.), Bertil Ohlin: A Centennial Celebration 1899-1999. Cambridge,
MA: MIT Press, forthcoming.
Polanyi, K. (1944). The Great Transformation. New York: Rinehart.
Schroeder, P. W. (1992). �Did the Vienna Settlement Rest on a Balance of Power?� American
Historical Review 97: 683-706.
------ (1994). The Transformation of European Politics 1763-1848. Oxford: Clarendon Press.
Timmer, A. and Williamson, J. G. (1998). �Immigration Policy Prior to the Thirties: Labor
Markets, Policy Interactions and Globalization Backlash�. Population and
Development Review 24: 739-71.
Twomey, M. (2000). A Century of Foreign Investment in the Third World. London:
Routledge.
U. S. Department of Commerce. (1975). Historical Statistics of the United States: Colonial
Times to 1970, Part 2. Washington, D.C.: USGPO.
Yeats, A. (1998). �Just How Big is Global Production Sharing?� World Bank Policy Research
Paper 1871. Washington, D.C.: World Bank.
Zlotnik, H. (1999). �Trends of International Migration Since 1965: What Existing Data
Reveal�. International Migration 37: 21-61.

0
5
10
15
20
25
Sale
s pr
ice/
purc
hase
pri
ce
1580s 1620s 1660s 1700s 1740s 1780s 1820s 1860s 1900sYear
Cloves Black pepper Coffee
Figure 1. Spice and coffee markups:Amsterdam vs. Southeast Asia 1580-1939
Source: O'Rourke and Williamson (2002a).

0
50
100
150
200
perc
ent
1800 1820 1840 1860 1880 1900 1920 1940 1960 1980 2000 Year
Fig. 2.GB-US wheat price gaps%,absolute value, 3-yr. moving average
Source: see endnote 1.

0.1
0.2
0.3
0.4
0.5
0.6
0.7
Coe
ffic
ient
of
vari
atio
n
1966 1968 1970 1972 1974 1976 1978 1980 1982 1984 1986 1988 1990 1992 1994Year
Wheat Maize
Figure 3. International grain pricesCoefficient of variation
Source: see text.

50
100
150
200
250
300
350
400
1869
=100
1860 1880 1900 1920 1940 1960 1980 Year
Figure 4. Deflated UK freight rates1869-1966 (1869=100)
Source: see endnote 8.
time
International economic integration
T
T
1820 1875 1914 1929 1945 2000
P
P
1918
Figure 5. A very brief history of globalization