Kevan Polkinghorne Stephen McDonald Leonie Excell Brian ... · Kevan Polkinghorne Stephen McDonald...
32
CHAPTER 5 HAEMODIALYSIS Kevan Polkinghorne Stephen McDonald Leonie Excell Brian Livingston Hannah Dent Definitions CARI guidelines Caring for Australasians with Renal Impairment guidelines Quotidian HD ≥ 5 HD treatments per week Long Hour HD ≥ 6.5 hours per HD session High Flux Dialyser Ultrafiltration coefficient (kuf) >20 ml/hr/mmHg (as specified by the manufacturer) AVF Native vein arteriovenous fistula AVG Synthetic arteriovenous bridge graft CVC Central venous HD catheter (Includes both tunnelled and non-tunnelled unless otherwise stated)
Transcript of Kevan Polkinghorne Stephen McDonald Leonie Excell Brian ... · Kevan Polkinghorne Stephen McDonald...
CHAPTER 5
HAEMODIALYSIS
Kevan Polkinghorne
Stephen McDonald Leonie Excell
Brian Livingston
Hannah Dent
Definitions CARI guidelines Caring for Australasians with Renal Impairment guidelines
Quotidian HD ≥ 5 HD treatments per week Long Hour HD ≥ 6.5 hours per HD session
High Flux Dialyser Ultrafiltration coefficient (kuf) >20 ml/hr/mmHg (as specified by the manufacturer)
AVF Native vein arteriovenous fistula AVG Synthetic arteriovenous bridge graft CVC Central venous HD catheter (Includes both tunnelled and non-tunnelled unless otherwise stated)
HAEMODIALYSIS ANZDATA Registry 2009 Report _____________________________________________________________________________________
5-2
AUSTRALIA
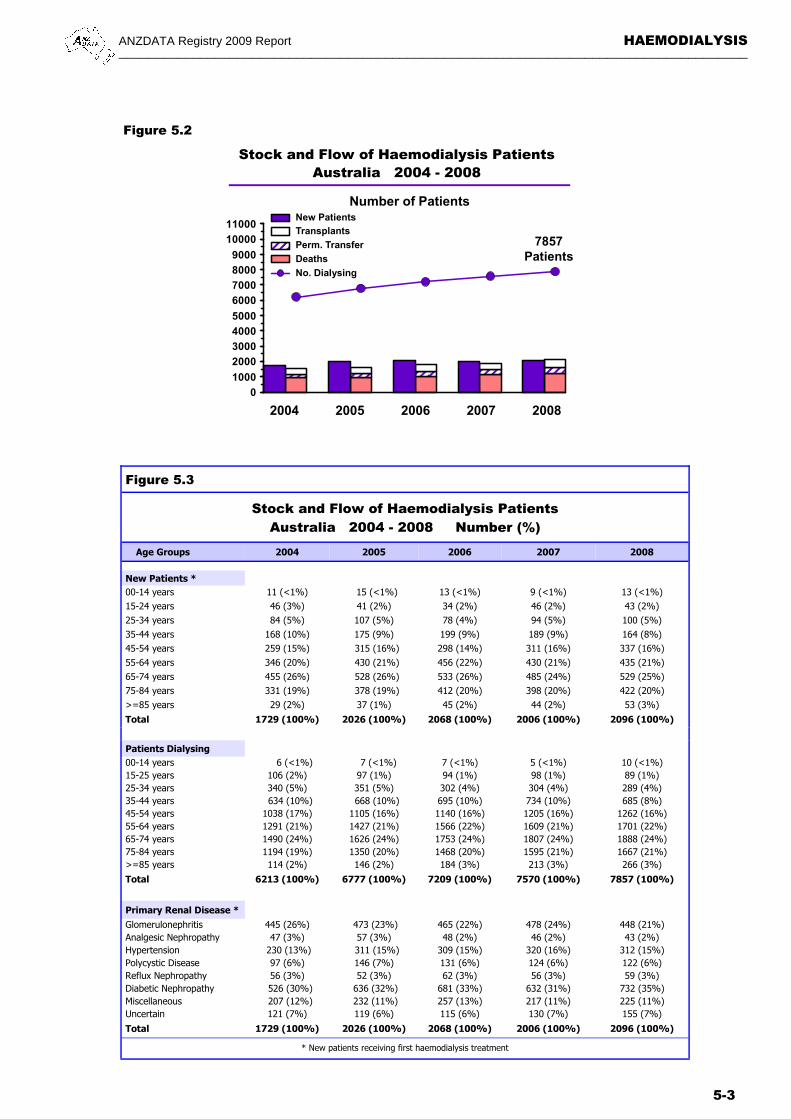
The annual stock and flow of HD patients during the period 2004-2008 is shown in Figures 5.1, 5.2 and 5.3.
There were 7,857 patients (368 per million) receiving HD treatment at 31st December 2008, an increase of 4%; of these 30% were hospital based, the same as in 2007, 58% were in satellite centres (57% in 2007) and 12% at home (13% in 2007).
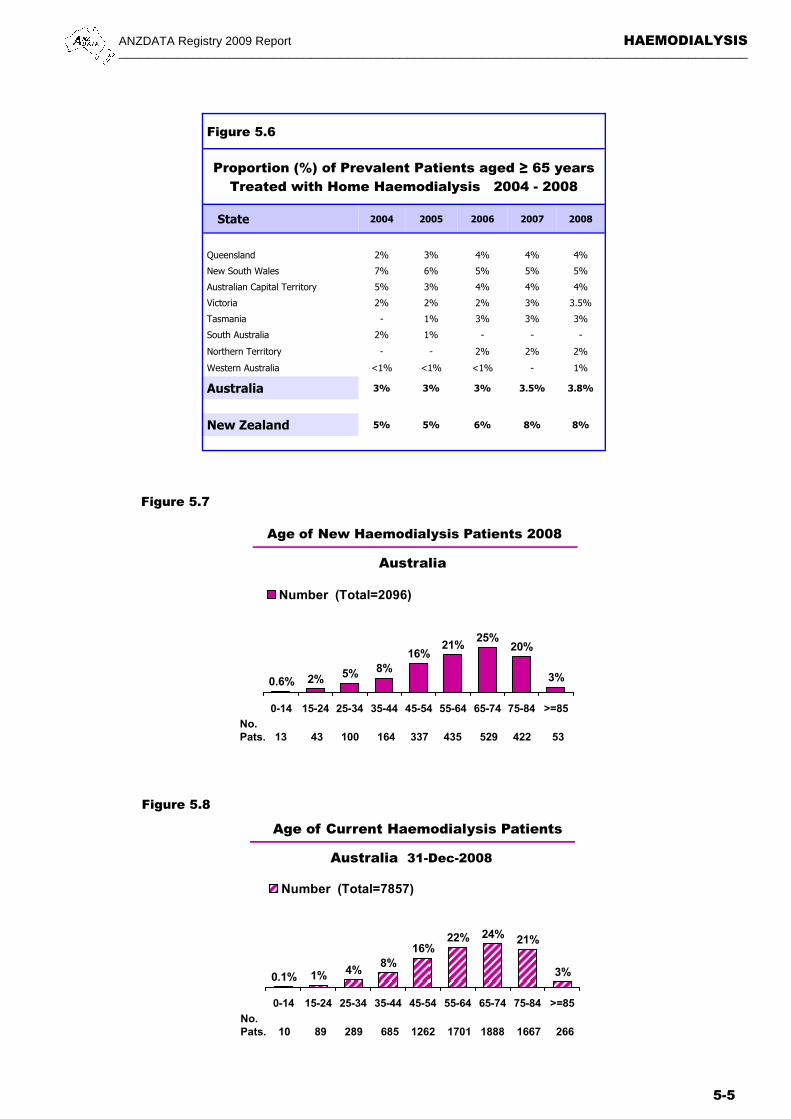
The proportion of all HD patients who were using home HD in each State was 14% for New South Wales, 10% Queensland and the ACT, 8% Victoria, 5% Tasmania and the Northern Territory, 3% Western Australia and 1% for South Australia. These proportions were lower among older people (Figure 5.6).
Figure 5.1
Stock and Flow of Haemodialysis Patients 2004 - 2008
2004 2005 2006 2008
Australia
Patients new to HD 1729 2026 2068 2096
First Dialysis Treatment 1454 1731 1781 1744
Previous Dialysis (PD) 238 258 255 313
Failed Transplant 37 37 32 39
Transplanted 437 415 427 535
Deaths 920 927 1036 1189
Never Transplanted 853 859 962 1126
Previous Transplant 67 68 74 63
Permanent Transfers out (>12 months) 207 256 312 398
Temporary Transfers (12 months) 130 135 152 93
Patients Dialysing (HD) at 31 December 6213 6777 7209 7857
Patients Dialysing (HD) at Home 31 December 801 822 896 948
% of all Home Dialysis (HD and PD) Patients 31% 31% 31% 30%
New Zealand
Patients new to HD 355 387 406 389
First Dialysis Treatment 275 299 326 316
Previous Dialysis (PD) 78 73 70 65
Failed Transplant 2 15 10 8
Transplanted 54 44 51 69
Deaths 153 150 181 233
Never Transplanted 142 136 166 216
Previous Transplant 11 14 15 17
Permanent Transfers out (>12 months) 87 87 114 138
Temporary Transfers (<12 months) 26 17 43 24
Patients Dialysing (HD) at 31 December 1034 1159 1229 1337
Patients Dialysing (HD) at Home 31 December 264 297 320 328
% of all Home Dialysis (HD and PD) Patients 26% 29% 30% 30%
2007
2006
1716
267
23
405
1163
1084
79
309
116
7570
950
31%
378
309
57
12
60
176
166
10
118
27
1323
328
31%
A total of 2,096 patients received HD for the first time during the year, an increase of 4% from 2007. There was a 4% increase from 2007 to 2008 (2,006 to 2,096 patients) following a 3% decrease from 2006 to 2007.
The proportion of all HD patients in each age group is shown in Figure 5.8. There were 1,933 people ≥ 75 years receiving haemodialysis, including 266 people ≥ 85 years, a rise of 25% from 2007.
There were 535 transplant operations, a 32% increase from 2007 (405 operations), representing 7% of all HD patients dialysing and 12% of those patients < 65 years. There were 41 patients aged ≥ 65 years transplanted.
There were 1,189 deaths, at a rate of 16.6 deaths per 100 person-years (Figure 3.9).
NEW ZEALAND
The annual stock and flow of HD patients during the period 2004-2008 is shown in Figures 5.1, 5.4 and 5.5.
There were 1,337 patients (313 per million) receiving treatment at 31st
December 2008, a 1% increase from 2007, after an 8% increase in 2006.
Hospital based HD remained similar to last year 47%, while satellite HD and home HD remained the same, 29% and 25% respectively.
New Zealand is continued on page 5-6.
STOCK AND FLOW
For more detail regarding age and mode of HD in each State see Appendix II at the Website (www.anzdata.org.au/ANZDATA/AnzdataReport/download.htm).
ANZDATA Registry 2009 Report HAEMODIALYSIS _____________________________________________________________________________________
5-3
Figure 5.2
Figure 5.3
Stock and Flow of Haemodialysis Patients Australia 2004 - 2008 Number (%)
Age Groups 2004 2005 2006 2008
New Patients *
00-14 years 11 (<1%) 15 (<1%) 13 (<1%) 13 (<1%) 15-24 years 46 (3%) 41 (2%) 34 (2%) 43 (2%) 25-34 years 84 (5%) 107 (5%) 78 (4%) 100 (5%) 35-44 years 168 (10%) 175 (9%) 199 (9%) 164 (8%) 45-54 years 259 (15%) 315 (16%) 298 (14%) 337 (16%) 55-64 years 346 (20%) 430 (21%) 456 (22%) 435 (21%) 65-74 years 455 (26%) 528 (26%) 533 (26%) 529 (25%) 75-84 years 331 (19%) 378 (19%) 412 (20%) 422 (20%) >=85 years 29 (2%) 37 (1%) 45 (2%) 53 (3%)
Total 1729 (100%) 2026 (100%) 2068 (100%) 2096 (100%)
Patients Dialysing
00-14 years 6 (<1%) 7 (<1%) 7 (<1%) 10 (<1%) 15-25 years 106 (2%) 97 (1%) 94 (1%) 89 (1%) 25-34 years 340 (5%) 351 (5%) 302 (4%) 289 (4%) 35-44 years 634 (10%) 668 (10%) 695 (10%) 685 (8%) 45-54 years 1038 (17%) 1105 (16%) 1140 (16%) 1262 (16%) 55-64 years 1291 (21%) 1427 (21%) 1566 (22%) 1701 (22%) 65-74 years 1490 (24%) 1626 (24%) 1753 (24%) 1888 (24%) 75-84 years 1194 (19%) 1350 (20%) 1468 (20%) 1667 (21%) >=85 years 114 (2%) 146 (2%) 184 (3%) 266 (3%)
Total 6213 (100%) 6777 (100%) 7209 (100%) 7857 (100%)
Primary Renal Disease *
Glomerulonephritis 445 (26%) 473 (23%) 465 (22%) 448 (21%) Analgesic Nephropathy 47 (3%) 57 (3%) 48 (2%) 43 (2%) Hypertension 230 (13%) 311 (15%) 309 (15%) 312 (15%) Polycystic Disease 97 (6%) 146 (7%) 131 (6%) 122 (6%) Reflux Nephropathy 56 (3%) 52 (3%) 62 (3%) 59 (3%) Diabetic Nephropathy 526 (30%) 636 (32%) 681 (33%) 732 (35%) Miscellaneous 207 (12%) 232 (11%) 257 (13%) 225 (11%) Uncertain 121 (7%) 119 (6%) 115 (6%) 155 (7%)
Total 1729 (100%) 2026 (100%) 2068 (100%) 2096 (100%)
* New patients receiving first haemodialysis treatment
2007
9 (<1%) 46 (2%) 94 (5%) 189 (9%) 311 (16%) 430 (21%) 485 (24%) 398 (20%) 44 (2%)
2006 (100%)
5 (<1%) 98 (1%) 304 (4%) 734 (10%) 1205 (16%) 1609 (21%) 1807 (24%) 1595 (21%) 213 (3%)
7570 (100%)
478 (24%) 46 (2%)
320 (16%) 124 (6%) 56 (3%)
632 (31%) 217 (11%) 130 (7%)
2006 (100%)
Stock and Flow of Haemodialysis PatientsAustralia 2004 - 2008
0
1000
2000
3000
4000
5000
6000
7000
8000
9000
10000
11000
Number of Patients
7857 Patients
2004 2005 2006 2007 2008
New Patients
Transplants
Perm. Transfer
Deaths
No. Dialysing

HAEMODIALYSIS ANZDATA Registry 2009 Report _____________________________________________________________________________________
5-4
Figure 5.5
Stock and Flow of Haemodialysis Patients New Zealand 2004 - 2008 Number (%)
Age Groups 2004 2005 2006 2008
New Patients *
00-14 years 1 (<1%) 2 (<1%) 3 (1%) 5 (1%)
15-24 years 10 (3%) 12 (3%) 15 (4%) 18 (5%)
25-34 years 23 (7%) 14 (4%) 30 (7%) 15 (4%)
35-44 years 45 (12%) 44 (11%) 33 (8%) 31 (8%)
45-54 years 78 (22%) 79 (21%) 91 (22%) 83 (21%)
55-64 years 97 (27%) 119 (31%) 95 (23%) 116 (30%)
65-74 years 70 (20%) 90 (23%) 95 (23%) 88 (23%)
75-84 years 26 (7%) 23 (6%) 40 (11%) 32 (8%)
>=85 years 5 (1%) 4 (1%) 4 (1%) 1 (<1%)
Total 355 (100%) 387 (100%) 406 (100%) 389 (100%)
Patients Dialysing
00-14 years 1 (<1%) 2 (<1%) 2 (<1%) 4 (<1%)
15-25 years 33 (3%) 32 (3%) 32 (3%) 36 (3%)
25-34 years 74 (7%) 82 (7%) 88 (7%) 76 (6%)
35-44 years 139 (13%) 152 (13%) 150 (12%) 148 (11%)
45-54 years 221 (21%) 244 (21%) 246 (20%) 274 (20%)
55-64 years 287 (28%) 324 (28%) 345 (28%) 373 (28%)
65-74 years 208 (20%) 242 (21%) 270 (22%) 290 (22%)
75-84 years 68 (7%) 76 (7%) 87 (7%) 126 (9%)
>=85 years 3 (<1%) 5 (<1%) 9 (<1%) 10 (1%)
Total 1034 (100%) 1159 (100%) 1229 (100%) 1337 (100%)
Primary Renal Disease *
Glomerulonephritis 90 (26%) 96 (26%) 91 (22%) 68 (17%)
Analgesic Nephropathy 1 (<1%) - (-) 1 (<1%) 1 (<1%)
Hypertension 43 (12%) 39 (10%) 40 (10%) 34 (8%)
Polycystic Disease 20 (5%) 29 (7%) 21 (5%) 13 (3%)
Reflux Nephropathy 12 (3%) 9 (2%) 7 (2%) 9 (2%)
Diabetic Nephropathy 155 (43%) 160 (41%) 184 (45%) 201 (52%)
Miscellaneous 18 (5%) 36 (9%) 33 (8%) 46 (13%)
Uncertain 16 (5%) 18 (5%) 29 (7%) 17 (4%)
Total 355 (100%) 387 (100%) 406 (100%) 389 (100%)
* New patients receiving first haemodialysis treatment
2007
3 (<1%)
21 (6%)
17 (4%)
45 (12%)
63 (17%)
98 (26%)
89 (24%)
38 (10%)
4 (1%)
378 (100%)
3 (<1%)
39 (3%)
80 (6%)
161 (12%)
261 (20%)
360 (27%)
299 (23%)
107 (8%)
13 (1%)
1323 (100%)
87 (23%)
3 (<1%)
44 (12%)
15 (4%)
8 (2%)
161 (43%)
48 (13%)
12 (3%)
378 (100%)
Stock and Flow of Haemodialysis PatientsNew Zealand 2004 - 2008
0
200
400
600
800
1000
1200
1400
1600
1800
2000
Number of Patients
1337 Patients
2004 2005 2006 2007 2008
New PatientsTransplants
Perm. Transfer
DeathsNo. Dialysing
Figure 5.4
ANZDATA Registry 2009 Report HAEMODIALYSIS _____________________________________________________________________________________
5-5
Figure 5.6
Proportion (%) of Prevalent Patients aged ≥ 65 years Treated with Home Haemodialysis 2004 - 2008
State 2004 2005 2006 2008
Queensland 2% 3% 4% 4%
New South Wales 7% 6% 5% 5%
Australian Capital Territory 5% 3% 4% 4%
Victoria 2% 2% 2% 3.5%
Tasmania - 1% 3% 3%
South Australia 2% 1% - -
Northern Territory - - 2% 2%
Western Australia <1% <1% <1% 1%
Australia 3% 3% 3% 3.8%
New Zealand 5% 5% 6% 8%
2007
4%
5%
4%
3%
3%
-
2%
-
3.5%
8%
Figure 5.7
Figure 5.8
2% 5% 8%16%
21%25%
20%
3%0.6%
0-14 15-24 25-34 35-44 45-54 55-64 65-74 75-84 >=85
Number (Total=2096)
Age of New Haemodialysis Patients 2008
No. Pats. 13 43 100 164 337 435 529 422 53
Australia
1% 4%8%
16%22% 24% 21%
3%0.1%
0-14 15-24 25-34 35-44 45-54 55-64 65-74 75-84 >=85
Number (Total=7857)
Age of Current Haemodialysis Patients
No. Pats. 10 89 289 685 1262 1701 1888 1667 266
Australia 31-Dec-2008
HAEMODIALYSIS ANZDATA Registry 2009 Report _____________________________________________________________________________________
5-6
NEW ZEALAND (continued from page 5-2)
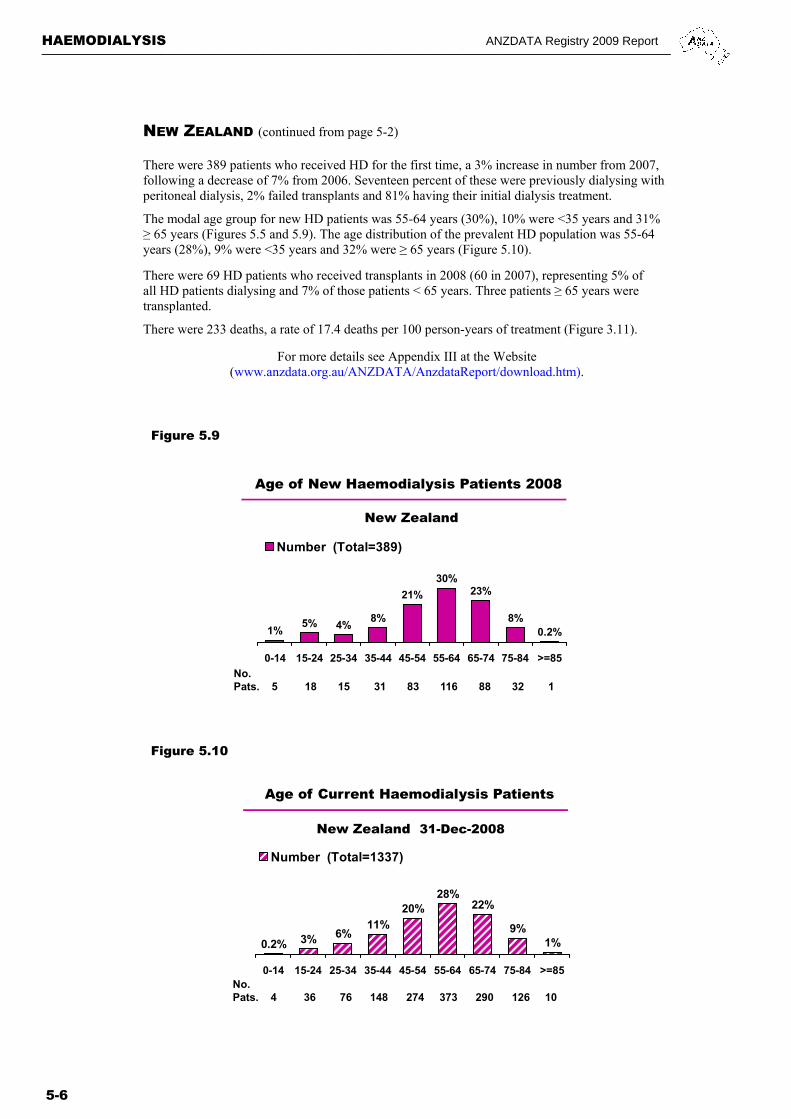
There were 389 patients who received HD for the first time, a 3% increase in number from 2007, following a decrease of 7% from 2006. Seventeen percent of these were previously dialysing with peritoneal dialysis, 2% failed transplants and 81% having their initial dialysis treatment.
The modal age group for new HD patients was 55-64 years (30%), 10% were <35 years and 31% ≥ 65 years (Figures 5.5 and 5.9). The age distribution of the prevalent HD population was 55-64 years (28%), 9% were <35 years and 32% were ≥ 65 years (Figure 5.10).
There were 69 HD patients who received transplants in 2008 (60 in 2007), representing 5% of all HD patients dialysing and 7% of those patients < 65 years. Three patients ≥ 65 years were transplanted.
There were 233 deaths, a rate of 17.4 deaths per 100 person-years of treatment (Figure 3.11).
For more details see Appendix III at the Website (www.anzdata.org.au/ANZDATA/AnzdataReport/download.htm).
Figure 5.9
Figure 5.10
5% 4%8%
21%
30%23%
8%0.2%1%
0-14 15-24 25-34 35-44 45-54 55-64 65-74 75-84 >=85
Number (Total=389)
Age of New Haemodialysis Patients 2008
No. Pats. 5 18 15 31 83 116 88 32 1
New Zealand
3% 6%11%
20%28%
22%
9%1%0.2%
0-14 15-24 25-34 35-44 45-54 55-64 65-74 75-84 >=85
Number (Total=1337)
Age of Current Haemodialysis Patients
No. Pats. 4 36 76 148 274 373 290 126 10
New Zealand 31-Dec-2008
ANZDATA Registry 2009 Report HAEMODIALYSIS _____________________________________________________________________________________
5-7
* One patient having C.V.V. HD as at 31-Dec-2006 not included * Two patients having C.V.V. HD as at 31-Dec-2007 not included
AUSTRALIA
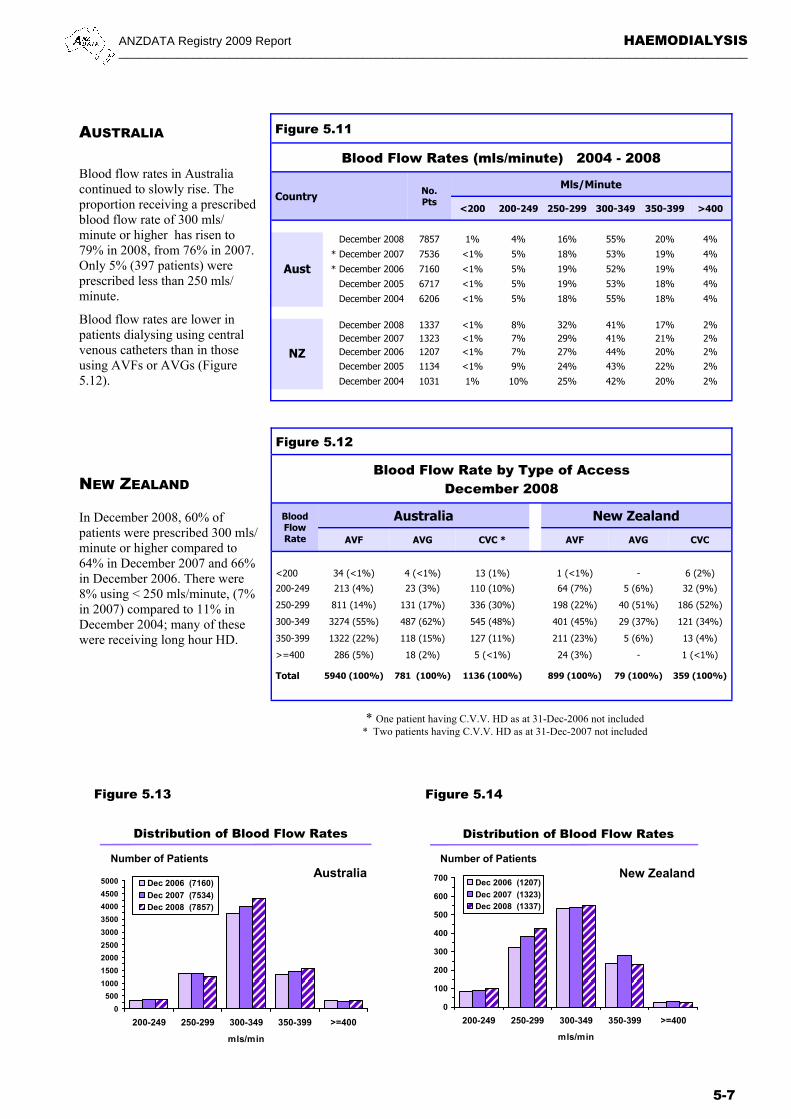
Blood flow rates in Australia continued to slowly rise. The proportion receiving a prescribed blood flow rate of 300 mls/minute or higher has risen to 79% in 2008, from 76% in 2007. Only 5% (397 patients) were prescribed less than 250 mls/minute.
Blood flow rates are lower in patients dialysing using central venous catheters than in those using AVFs or AVGs (Figure 5.12).
NEW ZEALAND In December 2008, 60% of patients were prescribed 300 mls/minute or higher compared to 64% in December 2007 and 66% in December 2006. There were 8% using < 250 mls/minute, (7% in 2007) compared to 11% in December 2004; many of these were receiving long hour HD.
Figure 5.13 Figure 5.14
Figure 5.11
Blood Flow Rates (mls/minute) 2004 - 2008
Country No. Pts
Mls/Minute
<200 200-249 250-299 300-349 350-399 >400
Aust
December 2008 7857 1% 4% 16% 55% 20% 4%
* December 2007 7536 <1% 5% 18% 53% 19% 4%
* December 2006 7160 <1% 5% 19% 52% 19% 4%
December 2005 6717 <1% 5% 19% 53% 18% 4%
December 2004 6206 <1% 5% 18% 55% 18% 4%
NZ
December 2008 1337 <1% 8% 32% 41% 17% 2% December 2007 1323 <1% 7% 29% 41% 21% 2% December 2006 1207 <1% 7% 27% 44% 20% 2% December 2005 1134 <1% 9% 24% 43% 22% 2%
December 2004 1031 1% 10% 25% 42% 20% 2%
Figure 5.12
Blood Flow Rate by Type of Access December 2008
Australia New Zealand
AVF AVG CVC * AVF AVG CVC
<200 34 (<1%) 4 (<1%) 13 (1%) 1 (<1%) - 6 (2%)
200-249 213 (4%) 23 (3%) 110 (10%) 64 (7%) 5 (6%) 32 (9%)
250-299 811 (14%) 131 (17%) 336 (30%) 198 (22%) 40 (51%) 186 (52%)
300-349 3274 (55%) 487 (62%) 545 (48%) 401 (45%) 29 (37%) 121 (34%)
350-399 1322 (22%) 118 (15%) 127 (11%) 211 (23%) 5 (6%) 13 (4%)
>=400 286 (5%) 18 (2%) 5 (<1%) 24 (3%) - 1 (<1%)
Total 5940 (100%) 781 (100%) 1136 (100%) 899 (100%) 79 (100%) 359 (100%)
Blood Flow Rate
Distribution of Blood Flow Rates
0
500
1000
1500
2000
2500
3000
3500
4000
4500
5000
200-249 250-299 300-349 350-399 >=400
mls/min
Dec 2006 (7160)
Dec 2007 (7534)
Dec 2008 (7857)
Number of PatientsAustralia
Distribution of Blood Flow Rates
0
100
200
300
400
500
600
700
200-249 250-299 300-349 350-399 >=400
mls/min
Dec 2006 (1207)
Dec 2007 (1323)
Dec 2008 (1337)
Number of Patients
New Zealand

HAEMODIALYSIS ANZDATA Registry 2009 Report _____________________________________________________________________________________
5-8
FREQUENT AND LONG HAEMODIALYSIS
The recent trend of the increasing proportions of those dialysing >3 times per week in Australia may have reached a plateau in terms of numbers. In percentage terms, the proportion with very frequent treatment (five or more per week) has dropped in Australia (but increased in New Zealand, Figure 5.19).
In New Zealand the proportion dialysing more than three times per week continues to increase (Figures 5.15 - 5.23).
The proportions dialysing ≥ 4.5 hours per session is steady. As a result, the proportions dialysing more than the “standard” 12 hours per week have stabilised, particularly in Australia.
In 2008, 55% and 58% of HD patients were dialysing ≥ 13.5 hours per week in Australia and New Zealand respectively.
Figure 5.15
Duration and Number of Sessions Per Week December 2008
Sessions Per
week
Hours of Each Treatment Total
<4 4-4.4 4.5-4.9 5-5.4 ≥ 5.5
Australia
≤ 3 359 (5%) 3101 (43%) 1390 (19%) 2079 (29%) 274 (4%) 7203
3.5-4.5 28 (6%) 70 (14%) 42 (8%) 100 (20%) 265 (52%) 505
≥ 5 82 (55%) 24 (16%) 5 (3%) - 38 (26%) 149
Total 469 (6%) 3195 (41%) 1437 (18%) 2179 (28%) 577 (7%) 7857
New Zealand
≤ 3 33 (3%) 519 (43%) 243 (20%) 337 (28%) 74 (6%) 1206
3.5-4.5 6 (6%) 18 (19%) 7 (7%) 34 (35%) 32 (33%) 97 ≥ 5 16 (47%) 14 (41%) - 2 (6%) 2 (6%) 34
Total 55 (4%) 551 (41%) 250 (19%) 373 (28%) 108 (8%) 1337
Figure 5.16
Figure 5.17 Figure 5.18
92 91 92 93 92 90
6 7 6 5 6 7
Dec-06 Dec-07 Dec-08 Dec-06 Dec-07 Dec-08
Per
cen
t
<=3 3.5 - 4.5 >=5
Haemodialysis Frequency (Per Week)December 2006 - 2008
Australia New Zealand
7 6 4 5 4
40 40 41 37 34 41
18 18 1819 22
19
27 27 28 31 30 28
7 7 9 9 8
7
7
Dec-06 Dec-07 Dec-08 Dec-06 Dec-07 Dec-08
Per
cen
t
<4 4 - 4.4 4.5 - 4.9 5 - 5.4 5 - >=5
Haemodialysis Session Length (Hours)December 2006 - 2008
Australia New Zealand
7 6 6 3 4 4
38 38 39 36 33 39
18 18 1819 22 19
32 32 31 35 35 33
5 6 6 6 5 6
Dec-06 Dec-07 Dec-08 Dec-06 Dec-07 Dec-08
Per
cen
t
<12 12 - 13.4 13.5 - 14.9 15 - 19.9 >=20
Haemodialysis Duration (Hours per Week)December 2006 - 2008
Australia New Zealand

ANZDATA Registry 2009 Report HAEMODIALYSIS _____________________________________________________________________________________
5-9
0
.5
1
1.5
2
2.5
3
3.5
Mar 03Sep 03
Mar 04Dec 04
Dec 05Dec 06
Dec 07Dec 08
Mar 03Sep 03
Mar 04Dec 04
Dec 05Dec 06
Dec 07Dec 08
Australia New Zealand
Per
cent
Survey Period
Percentage of PatientsDialysing Five or More Days per Week
45
50
55
60
65
Mar 03Sep 03
Mar 04Dec 04
Dec 05Dec 06
Dec 07Dec 08
Mar 03Sep 03
Mar 04Dec 04
Dec 05Dec 06
Dec 07Dec 08
Australia New Zealand
Per
cent
Survey Period
Percentage of Patients - Dialysing 3 Days per WeekDialysing 4.5 Hours per Session or Longer
45
50
55
60
65
Mar 03Sep 03
Mar 04Dec 04
Dec 05Dec 06
Dec 07Dec 08
Mar 03Sep 03
Mar 04Dec 04
Dec 05Dec 06
Dec 07Dec 08
Australia New Zealand
Per
cent
Survey Period
Percentage of PatientsDialysing >12 Hours per Week
Figure 5.19
Figure 5.20
Figure 5.21

HAEMODIALYSIS ANZDATA Registry 2009 Report _____________________________________________________________________________________
5-10
Figure 5.22
Haemodialysis Percentage ≥ 5 Sessions per Week By Australian State and Country
Australia New
Zealand Qld NSW/ACT Vic Tas SA NT WA
Dec 05 54 (4%) 23 (2%) 48 (3%) 3 (2%) 10 (2%) 1 (<1%) 14 (2%) 14 (1%)
Dec 06 51 (4%) 33 (1%) 56 (3%) 3 (2%) 14 (3%) 3 (1%) 12 (2%) 20 (2%)
Dec 08 52 (4%) 25 (1%) 46 (2%) 2 (2%) 11 (2%) 1 (<1%) 12 (2%) 34 (3%)
Dec 07 58 (4%) 25 (1%) 52 (3%) 1 (<1%) 9 (2%) - 14 (2%) 27 (2%)
Figure 5.23
Haemodialysis Percentage ≥ 4.5 Hours Per Session Three Session per Week
By Australian State and Country
Australia New
Zealand Qld NSW/ACT Vic Tas SA NT WA
Dec 05 477 (46%) 1536 (75%) 565 (35%) 34 (29%) 111 (25%) 236 (85%) 133 (21%) 632 (60%)
Dec 06 620 (57%) 1653 (76%) 575 (33%) 43 (39%) 116 (27%) 243 (84%) 150 (24%) 648 (59%)
Dec 08 715 (58%) 1722 (74%) 641 (35%) 54 (45%) 105 (23%) 279 (79%) 177 (25%) 645 (55%)
Dec 07 677 (59%) 1665 (74%) 606 (34%) 46 (41%) 118 (27%) 276 (86%) 184 (27%) 729 (61%)
Figure 5.24
Haemodialysis Percentage >12 Hours per Week By Australian State and Country
Australia New
Zealand Qld NSW/ACT Vic Tas SA NT WA
Dec 05 600 (49%) 1657 (75%) 719 (40%) 46 (35%) 138 (29%) 237 (84%) 164 (25%) 696 (60%)
Dec 06 769 (60%) 1827 (76%) 753 (39%) 54 (44%) 143 (30%) 250 (83%) 186 (28%) 733 (61%)
Dec 08 882 (60%) 1938 (74%) 839 (41%) 63 (48%) 132 (27%) 286 (79%) 216 (29%) 775 (58%)
Dec 07 845 (62%) 1880 (75%) 802 (40%) 55 (43%) 152 (32%) 272 (86%) 223 (31%) 825 (62%)
Dialysis frequency and session length vary among the Australian States. Patients in Queensland, Victoria and South Australia are more likely to dialyse more frequently, while patients in New South Wales/ACT and the Northern Territory tend to dialyse longer per session on average (Figures 5.22 - 5.25).
ANZDATA Registry 2009 Report HAEMODIALYSIS _____________________________________________________________________________________
5-11
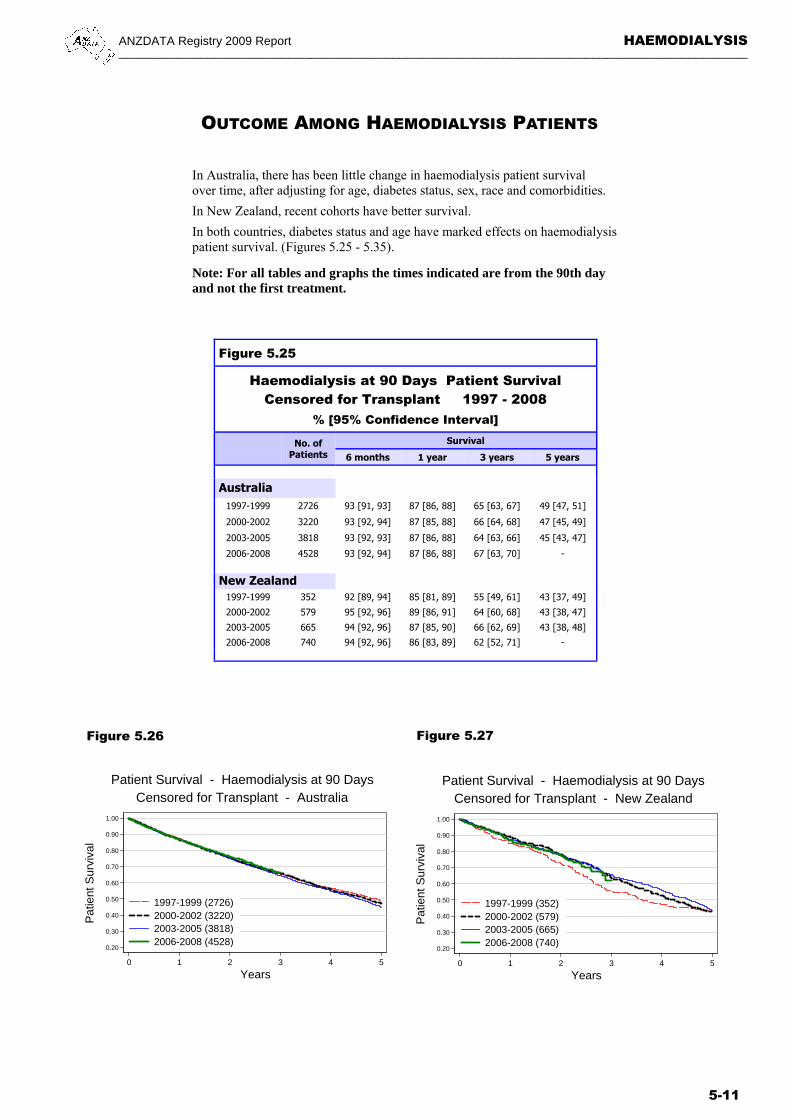
Figure 5.25
Haemodialysis at 90 Days Patient Survival Censored for Transplant 1997 - 2008
% [95% Confidence Interval]
No. of Patients
Survival 6 months 1 year 3 years 5 years
Australia
1997-1999 2726 93 [91, 93] 87 [86, 88] 65 [63, 67] 49 [47, 51]
2000-2002 3220 93 [92, 94] 87 [85, 88] 66 [64, 68] 47 [45, 49]
2003-2005 3818 93 [92, 93] 87 [86, 88] 64 [63, 66] 45 [43, 47]
2006-2008 4528 93 [92, 94] 87 [86, 88] 67 [63, 70] -
New Zealand
1997-1999 352 92 [89, 94] 85 [81, 89] 55 [49, 61] 43 [37, 49]
2000-2002 579 95 [92, 96] 89 [86, 91] 64 [60, 68] 43 [38, 47]
2003-2005 665 94 [92, 96] 87 [85, 90] 66 [62, 69] 43 [38, 48]
2006-2008 740 94 [92, 96] 86 [83, 89] 62 [52, 71] -
Figure 5.27 Figure 5.26
0.20
0.30
0.40
0.50
0.60
0.70
0.80
0.90
1.00
Pat
ient
Sur
viva
l
0 1 2 3 4 5
Years
1997-1999 (2726)2000-2002 (3220)2003-2005 (3818)2006-2008 (4528)
Patient Survival - Haemodialysis at 90 DaysCensored for Transplant - Australia
0.20
0.30
0.40
0.50
0.60
0.70
0.80
0.90
1.00
Pat
ient
Sur
viva
l
0 1 2 3 4 5
Years
1997-1999 (352)2000-2002 (579)2003-2005 (665)2006-2008 (740)
Patient Survival - Haemodialysis at 90 DaysCensored for Transplant - New Zealand
OUTCOME AMONG HAEMODIALYSIS PATIENTS
In Australia, there has been little change in haemodialysis patient survival over time, after adjusting for age, diabetes status, sex, race and comorbidities.
In New Zealand, recent cohorts have better survival.
In both countries, diabetes status and age have marked effects on haemodialysis patient survival. (Figures 5.25 - 5.35).
Note: For all tables and graphs the times indicated are from the 90th day and not the first treatment.

HAEMODIALYSIS ANZDATA Registry 2009 Report _____________________________________________________________________________________
5-12
Figure 5.29
Figures 5.28- 5.29
These figures show survival curves for patients treated with haemodialysis at day 90, adjusted to a median age of 62.6 years for Australia and 56.6 years for New Zealand; non-diabetic primary renal disease; caucasoid race; female gender and no comorbid conditions (lung disease, coronary artery disease, peripheral vascular disease or cerebrovascular disease).
Note x axis scale refers to time after day 90. PRD = Primary renal disease.
Figure 5.28
0.20
0.30
0.40
0.50
0.60
0.70
0.80
0.90
1.00
Pat
ient
Sur
viva
l
0 1 2 3 4 5
Years
1997-1999 (2726)2000-2002 (3220)2003-2005 (3818)2006-2008 (4528)
Patient Survival – Haemodialysis at 90 DaysCensored for Transplant – Australia
Adjusted for Age, Non Diabetic PRD and Gender
0.20
0.30
0.40
0.50
0.60
0.70
0.80
0.90
1.00
Pat
ient
Sur
viva
l
0 1 2 3 4 5
Years
1997-1999 (352)2000-2002 (579)2003-2005 (665)2006-2008 (740)
Patient Survival – Haemodialysis at 90 DaysCensored for Transplant – New Zealand
Adjusted for Age, Non Diabetic PRD and Gender
ANZDATA Registry 2009 Report HAEMODIALYSIS _____________________________________________________________________________________
5-13
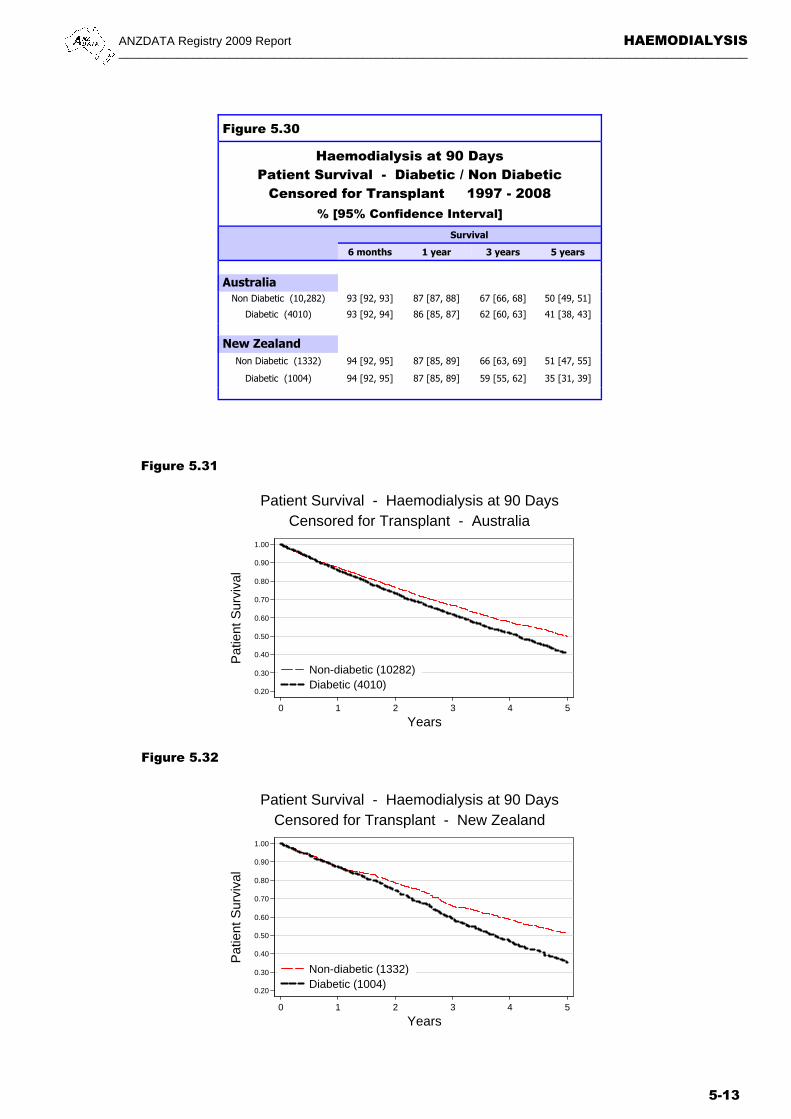
Figure 5.30
Haemodialysis at 90 Days Patient Survival - Diabetic / Non Diabetic
Censored for Transplant 1997 - 2008 % [95% Confidence Interval]
Survival
6 months 1 year 3 years 5 years
Australia
Non Diabetic (10,282) 93 [92, 93] 87 [87, 88] 67 [66, 68] 50 [49, 51]
Diabetic (4010) 93 [92, 94] 86 [85, 87] 62 [60, 63] 41 [38, 43]
New Zealand
Non Diabetic (1332) 94 [92, 95] 87 [85, 89] 66 [63, 69] 51 [47, 55]
Diabetic (1004) 94 [92, 95] 87 [85, 89] 59 [55, 62] 35 [31, 39]
Figure 5.32
Figure 5.31
0.20
0.30
0.40
0.50
0.60
0.70
0.80
0.90
1.00
Pat
ient
Sur
viva
l
0 1 2 3 4 5
Years
Non-diabetic (10282)Diabetic (4010)
Patient Survival - Haemodialysis at 90 DaysCensored for Transplant - Australia
0.20
0.30
0.40
0.50
0.60
0.70
0.80
0.90
1.00
Pat
ient
Sur
viva
l
0 1 2 3 4 5
Years
Non-diabetic (1332)Diabetic (1004)
Patient Survival - Haemodialysis at 90 DaysCensored for Transplant - New Zealand

HAEMODIALYSIS ANZDATA Registry 2009 Report _____________________________________________________________________________________
5-14
Figure 5.33
Haemodialysis at 90 Days Patient Survival - By Age Group
Censored for Transplant 1997 - 2008 % [95% Confidence Interval]
Age Groups Survival
6 months 1 year 3 years 5 years
Australia
0-39 years 1732 98 [97, 98] 95 [93, 96] 86 [84, 88] 79 [76, 82]
40-59 years 4652 96 [95, 96] 92 [91, 93] 77 [75, 78] 62 [60, 64]
60-74 years 5128 91 [90, 92] 84 [83, 85] 61 [60, 63] 42 [40, 43]
75 and over 2780 88 [86, 89] 79 [77, 80] 45 [43, 48] 24 [22, 26]
New Zealand
0-39 years 378 98 [96, 99] 94 [91, 96] 79 [73, 84] 68 [60, 74]
40-59 years 1008 95 [94, 96] 90 [88, 92] 70 [66, 73] 49 [45, 53]
60-74 years 779 92 [90, 94] 85 [83, 88] 55 [51, 59] 35 [30, 39]
75 and over 171 85 [79, 90] 65 [58, 72] 33 [25, 41] 16 [10, 25]
No. of Patients
0.20
0.30
0.40
0.50
0.60
0.70
0.80
0.90
1.00
Pat
ient
Sur
viva
l
0 1 2 3 4 5
Years
<40 (378)40-59 (1008)60-74 (779)>=75 (171)
Patient Survival - Haemodialysis at 90 DaysCensored for Transplant - New Zealand
0.20
0.30
0.40
0.50
0.60
0.70
0.80
0.90
1.00
Pat
ient
Sur
viva
l
0 1 2 3 4 5
Years
<40 (1732)40-59 (4652)60-74 (5128)>=75 (2780)
Patient Survival - Haemodialysis at 90 DaysCensored for Transplant - Australia
Figure 5.34
Figure 5.35

ANZDATA Registry 2009 Report HAEMODIALYSIS _____________________________________________________________________________________
5-15
MEMBRANE TYPE AND SURFACE AREAS
AUSTRALIA Figures 5.36 - 5.38.
Usage of low flux polysulfone dialysers continued to decrease (5% in December 2008 from 7% in 2007 and 16% in 2006), while use of high flux polysulphone also decreased to1.5% in 2008 from 7% in both 2007 and 2006, 9% in 2005 and 39% in 2004. High flux Polysulphone-Helixone increased to 49% in December 2008 from 39% in 2007, 34% in 2006 and 27% in 2005. High flux Polyamix increased to 26% this year from 20% last year and 16% in 2006.
Eighty one percent of patients received dialysis with high flux dialysers (72% in 2007, 64% in 2006 and 57% in 2005). Haemophan was used for only two patients at December 2008.
Ten patients were receiving haemofiltration and 284 haemodiafiltration across all States and the ACT.
NEW ZEALAND Figures 5.36 and 5.38.
Low flux polysulphone decreased to 24% in December 2008, from 38% and 48% in December 2007 and 2006 respectively. No patients were using haemophan.
There were 52% (701 patients) reported as receiving dialysis with high flux dialysers in December 2008, an increase from 29% (382 patients) in 2007 and 22% (260 patients) in 2006.
One hundred and sixty one patients were receiving haemodiafiltration at December 2008. There were no patients receiving these treatments at December 2007.
Figure 5.37 Figure 5.38
Figure 5.36
Haemodialyser Membrane Types by Surface Area 31-Dec-2008
Dialyser Membrane Type Flux
Square Metres Total
<1.0 1.0-1.4 1.5-1.7 1.8-1.9 >1.9
Australia Acrylonitrile SMSC High - - - - 1 1
Cellulose Acetate Low - - 1 - - 1
Cellulose Triacetate High - - 5 13 61 79
Diacetate Low - - 2 - 4 6
Haemophan Low - - - - 2 2
Polyamix High - 44 747 - 1222 2013
Polyamix Low - 114 598 - 350 1062
Polyethersulfone High - - 5 116 183 304
Polysulphone High 1 22 - 44 52 119
Polysulphone Low 5 27 2 177 206 417
Polysulphone-Helixone High - 1000 - 2456 395 3851
Polysynthane Low - - 1 - 1 2
Total 6 1207 1361 2806 2477 7857
New Zealand Polyamix High - - 53 - 204 257
Polyamix Low - 13 102 - 200 315
Polysulphone High - 2 - 82 - 84
Polysulphone Low 2 11 - 189 119 321
Polysulphone-Helixone High - 331 - 27 2 360
Total 2 357 155 298 525 1337
Haemodialysis Surface Area
1.2 1.25 1.3 1.4 1.6 1.7 1.8 1.9 2.0 2.1 2.15 2.2 2.4
Surface Area (sqm)
Dec 2007 (7534)
Dec 2008 (7857)
Number of Patients Australia
8 100 130 1222 0 1348 2324 135 4 1494 0 117 652
12 27 136 1038 2 1359 2677 129 2 1817 1 399 258
Haemodialysis Surface Area
1.2 1.25 1.3 1.4 1.7 1.8 2.0 2.1 2.2 2.4
Surface Area (sqm)
Dec 2007 (1323)
Dec 2008 (1337)
Number of Patients New Zealand
4 14 22 3 173 454 1 425 0 2272 11 15 331 155 298 0 403 2 120
HAEMODIALYSIS ANZDATA Registry 2009 Report _____________________________________________________________________________________
5-16
30
40
50
60
70
80
90
100
Mar 03Sep 03
Mar 04Dec 04
Dec 05Dec 06
Dec 07Dec 08
Mar 03Sep 03
Mar 04Dec 04
Dec 05Dec 06
Dec 07Dec 08
Australia New Zealand
PD HD
Per
cent
Survey Period
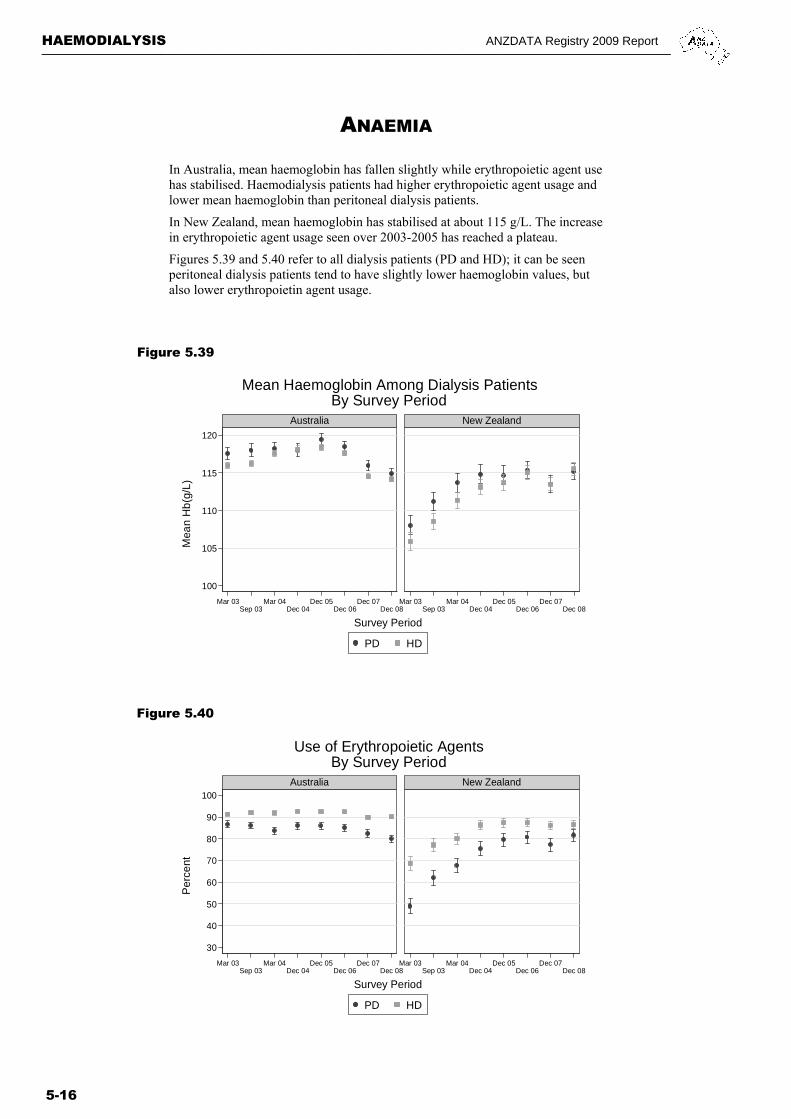
Use of Erythropoietic AgentsBy Survey Period
100
105
110
115
120
Mar 03Sep 03
Mar 04Dec 04
Dec 05Dec 06
Dec 07Dec 08
Mar 03Sep 03
Mar 04Dec 04
Dec 05Dec 06
Dec 07Dec 08
Australia New Zealand
PD HD
Mea
n H
b(g
/L)
Survey Period
Mean Haemoglobin Among Dialysis PatientsBy Survey Period
Figure 5.39
Figure 5.40
ANAEMIA
In Australia, mean haemoglobin has fallen slightly while erythropoietic agent use has stabilised. Haemodialysis patients had higher erythropoietic agent usage and lower mean haemoglobin than peritoneal dialysis patients.
In New Zealand, mean haemoglobin has stabilised at about 115 g/L. The increase in erythropoietic agent usage seen over 2003-2005 has reached a plateau.
Figures 5.39 and 5.40 refer to all dialysis patients (PD and HD); it can be seen peritoneal dialysis patients tend to have slightly lower haemoglobin values, but also lower erythropoietin agent usage.
ANZDATA Registry 2009 Report HAEMODIALYSIS _____________________________________________________________________________________
5-17
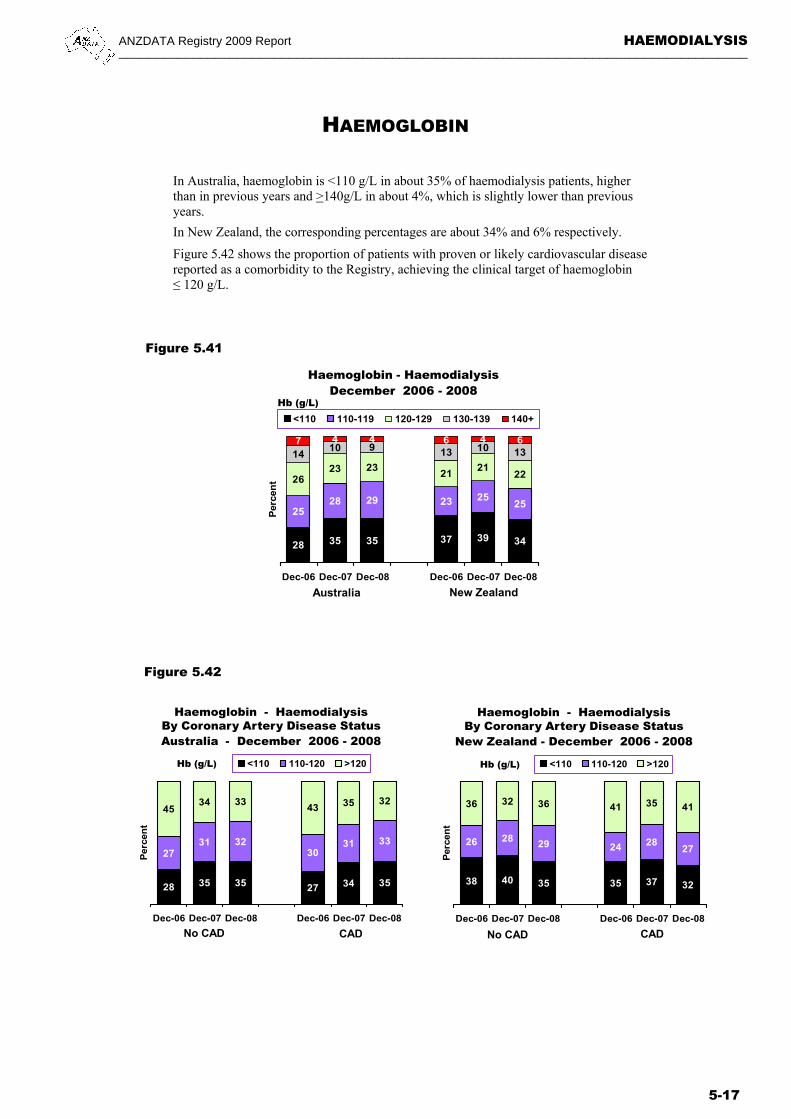
In Australia, haemoglobin is <110 g/L in about 35% of haemodialysis patients, higher than in previous years and >140g/L in about 4%, which is slightly lower than previous years.
In New Zealand, the corresponding percentages are about 34% and 6% respectively.
Figure 5.42 shows the proportion of patients with proven or likely cardiovascular disease reported as a comorbidity to the Registry, achieving the clinical target of haemoglobin ≤ 120 g/L.
Figure 5.41
Figure 5.42
HAEMOGLOBIN
28 35 35 27 34 35
2731 32
3031 33
4534 33
43 35 32
Dec-06 Dec-07 Dec-08 Dec-06 Dec-07 Dec-08
Per
cen
t
<110 110-120 >120
Haemoglobin - HaemodialysisBy Coronary Artery Disease StatusAustralia - December 2006 - 2008
No CAD CAD
Hb (g/L)
Haemoglobin - HaemodialysisBy Coronary Artery Disease Status
New Zealand - December 2006 - 2008
No CAD CAD
Hb (g/L)
38 40 35 35 37 32
26 2829 24 28
27
36 32 36 41 35 41
Dec-06 Dec-07 Dec-08 Dec-06 Dec-07 Dec-08
Per
cen
t
<110 110-120 >120
28 35 35 37 39 34
2528 29 23 25
25
2623 23
2121
22
1410 9 13 10 13
7 4 4 6 4 6
Dec-06 Dec-07 Dec-08 Dec-06 Dec-07 Dec-08
Per
cen
t
<110 110-119 120-129 130-139 140+
Haemoglobin - HaemodialysisDecember 2006 - 2008
Australia New Zealand
Hb (g/L)
HAEMODIALYSIS ANZDATA Registry 2009 Report _____________________________________________________________________________________
5-18
Figure 5.43
Excludes hospitals with <10 patients90
100
110
120
130
140
Med
ian
Hb
(g
/L)
0 5 10 15 20 25 30 35 40 45 50 55 60Caring Hospital
Haemoglobin in Haemodialysis PatientsAustralia 31 December 2008
Excludes hospitals with <10 patients90
100
110
120
130
140
Med
ian
Hb
(g
/L)
0 1 2 3 4 5 6 7 8 9Caring Hospital
Haemoglobin in Haemodialysis PatientsNew Zealand 31 December 2008
Excludes hospitals with <10 patients0
10
20
30
40
50
60
70
80
90
100
Per
cent
0 5 10 15 20 25 30 35 40 45 50 55 60Caring Hospital
% Haemodialysis Patients with Hb 110-129 g/LAustralia 31 December 2008
Excludes hospitals with <10 patients0
10
20
30
40
50
60
70
80
90
100
Per
cent
0 1 2 3 4 5 6 7 8 9Caring Hospital
% Haemodialysis Patients with Hb 110-129 g/LNew Zealand 31 December 2008
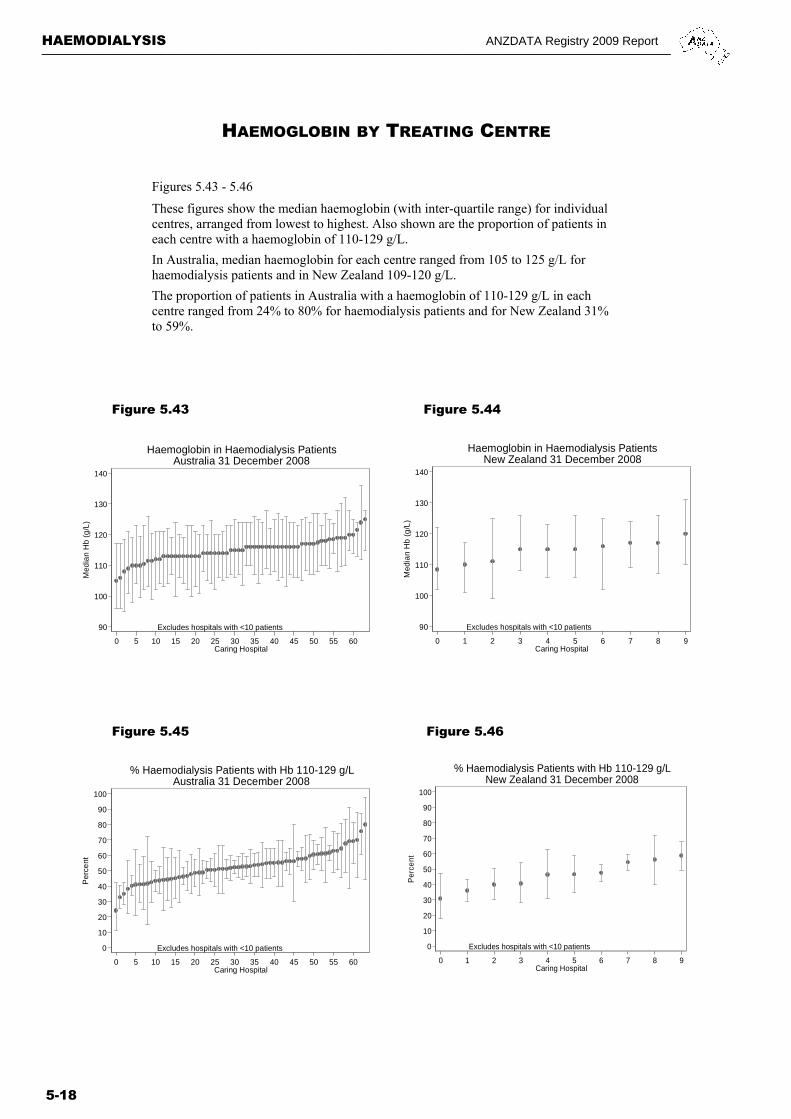
Figures 5.43 - 5.46
These figures show the median haemoglobin (with inter-quartile range) for individual centres, arranged from lowest to highest. Also shown are the proportion of patients in each centre with a haemoglobin of 110-129 g/L.
In Australia, median haemoglobin for each centre ranged from 105 to 125 g/L for haemodialysis patients and in New Zealand 109-120 g/L.
The proportion of patients in Australia with a haemoglobin of 110-129 g/L in each centre ranged from 24% to 80% for haemodialysis patients and for New Zealand 31% to 59%.
Figure 5.44
Figure 5.45 Figure 5.46
HAEMOGLOBIN BY TREATING CENTRE

ANZDATA Registry 2009 Report HAEMODIALYSIS _____________________________________________________________________________________
5-19
FERRITIN AND TRANSFERRIN SATURATION
Figure 5.47
Figure 5.48
11 11 11 13 15 1511 12 12 15 12 13
38 38 38 36 31 34
23 21 21 2222 22
17 18 17 15 19 17
Dec-06 Dec-07 Dec-08 Dec-06 Dec-07 Dec-08
Per
cen
t
<100 100-199 200-499 500-799 800+
Ferritin - HaemodialysisDecember 2006 - 2008
Australia New Zealand
mcg/L
29 30 29 30 33 34
38 37 38 36 34 37
19 19 19 21 1919
14 15 14 13 15 10
Dec-06 Dec-07 Dec-08 Dec-06 Dec-07 Dec-08
Per
cen
t
<20 20-29 30-39 40+
Transferrin Saturation – HaemodialysisDecember 2006 - 2008
Australia New Zealand
T/Sat (%)
Figures 5.47 - 5.48
In Australia and New Zealand the proportions of haemodialysis patients with ferritin <200 mcg/L and those with ferritin ≥ 500 mcg/L have been stable.
In both Australia and New Zealand, distributions of transferrin saturation have been unchanged for the past three years.
HAEMODIALYSIS ANZDATA Registry 2009 Report _____________________________________________________________________________________
5-20
FERRITIN BY TREATING CENTRE
Figures 5.49 - 5.52
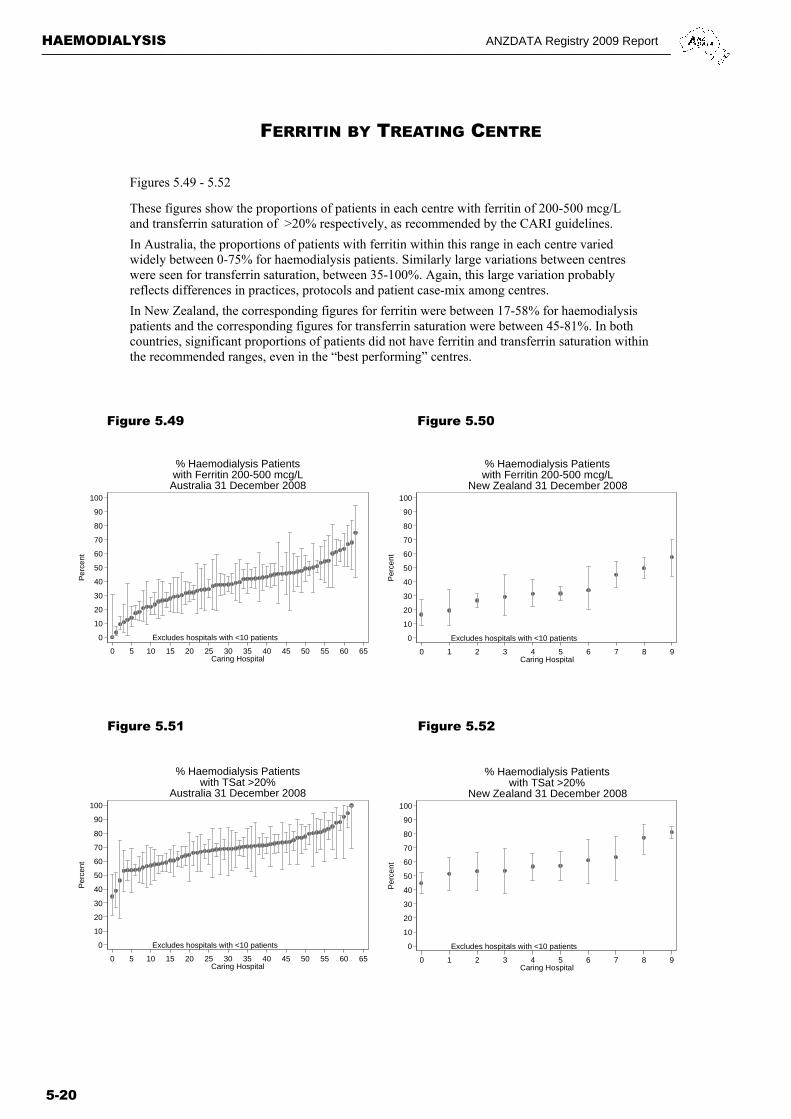
These figures show the proportions of patients in each centre with ferritin of 200-500 mcg/L and transferrin saturation of >20% respectively, as recommended by the CARI guidelines.
In Australia, the proportions of patients with ferritin within this range in each centre varied widely between 0-75% for haemodialysis patients. Similarly large variations between centres were seen for transferrin saturation, between 35-100%. Again, this large variation probably reflects differences in practices, protocols and patient case-mix among centres.
In New Zealand, the corresponding figures for ferritin were between 17-58% for haemodialysis patients and the corresponding figures for transferrin saturation were between 45-81%. In both countries, significant proportions of patients did not have ferritin and transferrin saturation within the recommended ranges, even in the “best performing” centres.
Figure 5.49 Figure 5.50
Figure 5.51 Figure 5.52
Excludes hospitals with <10 patients0
10
20
30
40
50
60
70
80
90
100
Per
cent
0 5 10 15 20 25 30 35 40 45 50 55 60 65Caring Hospital
% Haemodialysis Patientswith Ferritin 200-500 mcg/L
Australia 31 December 2008
Excludes hospitals with <10 patients0
10
20
30
40
50
60
70
80
90
100
Per
cent
0 1 2 3 4 5 6 7 8 9Caring Hospital
% Haemodialysis Patientswith Ferritin 200-500 mcg/L
New Zealand 31 December 2008
Excludes hospitals with <10 patients0
10
20
30
40
50
60
70
80
90
100
Per
cent
0 5 10 15 20 25 30 35 40 45 50 55 60 65Caring Hospital
% Haemodialysis Patientswith TSat >20%
Australia 31 December 2008
Excludes hospitals with <10 patients0
10
20
30
40
50
60
70
80
90
100
Per
cent
0 1 2 3 4 5 6 7 8 9Caring Hospital
% Haemodialysis Patientswith TSat >20%
New Zealand 31 December 2008

ANZDATA Registry 2009 Report HAEMODIALYSIS _____________________________________________________________________________________
5-21
SERUM CALCIUM
Figure 5.53
In both Australia and New Zealand the proportions of patients with proportions with serum calcium ≥ 2.4 mmol/L have decreased over the past three years, while those with < 2.2 mmol/L have increased in Australia, but remained fairly stable in New Zealand.
Figure 5.53
5 6 7 6 4 5
19 20 2414 16 16
40 4142
31 33 33
27 25 22
35 33 32
9 8 614 14 14
Dec-06 Dec-07 Dec-08 Dec-06 Dec-07 Dec-08
Per
cen
t
<2.0 2.0-2.1 2.2-2.3 2.4-2.5 >=2.6
Serum Calcium – HaemodialysisDecember 2006 - 2008
Australia New Zealand
Calcium(mmol/L)
Figures 5.54 and 5.55 show the proportions of patients at each centre with serum calcium 2.1-2.4 mmol/L, as recommended by the CARI guidelines. Note however that the values in the guidelines were for corrected total calcium, while those in this report are for uncorrected total calcium.
In Australia, the proportions ranged widely between 37-85% for haemodialysis patients, while in New Zealand the corresponding proportions were 39-73%.
SERUM CALCIUM BY TREATING CENTRE
Figure 5.54 Figure 5.55
Excludes hospitals with <10 patients0
10
20
30
40
50
60
70
80
90
100
Per
cent
0 5 10 15 20 25 30 35 40 45 50 55 60Caring Hospital
% Haemodialysis Patientswith Calcium 2.1-2.4 mmol/LAustralia 31 December 2008
Excludes hospitals with <10 patients0
10
20
30
40
50
60
70
80
90
100
Per
cent
0 1 2 3 4 5 6 7 8 9Caring Hospital
% Haemodialysis Patientswith Calcium 2.1-2.4 mmol/L
New Zealand 31 December 2008

HAEMODIALYSIS ANZDATA Registry 2009 Report _____________________________________________________________________________________
5-22
SERUM PHOSPHATE
Figure 5.56
In Australia, control of serum phosphate improved consistently over the last three years.
In New Zealand, the proportions with serum phosphate ≥ 1.8 mmol/L have remained stable.
Figure 5.56
Figure 5.57
SERUM PHOSPHATE BY TREATING CENTRE
Figure 5.58
Figures 5.57 - 5.58 show the proportions of patients at each centre with serum phosphate 0.8-1.6 mmol/L, as recommended by the CARI guidelines.
In Australia, the proportions ranged widely between 32-81% for haemodialysis patients and in New Zealand, the corresponding proportions were 21-67%.
Excludes hospitals with <10 patients0
10
20
30
40
50
60
70
80
90
100
Per
cent
0 5 10 15 20 25 30 35 40 45 50 55 60Caring Hospital
% Haemodialysis Patientswith Phosphate 0.8-1.6 mmol/LAustralia 31 December 2008
32 35 3620 24 23
15 16 16
13 12 13
14 14 15
1316 14
38 36 3354 48 50
Dec-06 Dec-07 Dec-08 Dec-06 Dec-07 Dec-08
Per
cen
t
<1.4 1.4-1.5 1.6-1.7 >=1.8
Serum Phosphate – HaemodialysisDecember 2006 - 2008
Australia New Zealand
Phosphate(mmol/L)
Excludes hospitals with <10 patients0
10
20
30
40
50
60
70
80
90
100
Per
cent
0 1 2 3 4 5 6 7 8 9Caring Hospital
% Haemodialysis Patientswith Phosphate 0.8-1.6 mmol/L
New Zealand 31 December 2008

ANZDATA Registry 2009 Report HAEMODIALYSIS _____________________________________________________________________________________
5-23
CALCIUM-PHOSPHATE PRODUCT Figure 5.59
In both Australia and New Zealand, calcium-phosphate product has continued to improve, among haemodialysis patients, with smaller proportions of patients with a product ≥ 5.0 mmol2/l2.
Overall, the proportion of people with high calcium-phosphate product was substantially higher in New Zealand than Australia.
Figure 5.59
42 45 4928 31 30
14 15 16
13 14 15
13 12 12
1314 14
10 9 8
13 11 13
20 17 1533 30 27
Dec-06 Dec-07 Dec-08 Dec-06 Dec-07 Dec-08
Perc
ent
<3.5 3.5-3.9 4.0-4.4 4.5-4.9 >=5.0
Calcium Phosphate Product – HaemodialysisDecember 2006 - 2008
Australia New Zealand
Ca X P(mmol2/L2)
CALCIUM-PHOSPHATE PRODUCT BY TREATING CENTRE
Figures 5.60 - 5.61 show the proportions of patients at each centre with calcium-phosphate product <4.0 mmol2/L2, as recommended by the CARI guidelines.
In Australia, the proportions ranged widely between 41-86% for haemodialysis patients while in New Zealand, the corresponding proportions were 29-79%.
Figure 5.60 Figure 5.61
Excludes hospitals with <10 patients0
10
20
30
40
50
60
70
80
90
100
Per
cent
0 5 10 15 20 25 30 35 40 45 50 55 60Caring Hospital
% Haemodialysis Patientswith Ca-P Product <4.0 mmol2/L2
Australia 31 December 2008
Excludes hospitals with <10 patients0
10
20
30
40
50
60
70
80
90
100
Per
cent
0 1 2 3 4 5 6 7 8 9Caring Hospital
% Haemodialysis Patientswith Ca-P Product <4.0 mmol2/L2New Zealand 31 December 2008
HAEMODIALYSIS ANZDATA Registry 2009 Report _____________________________________________________________________________________
5-24
UREA REDUCTION RATIO
Figures 5.62 and 5.64
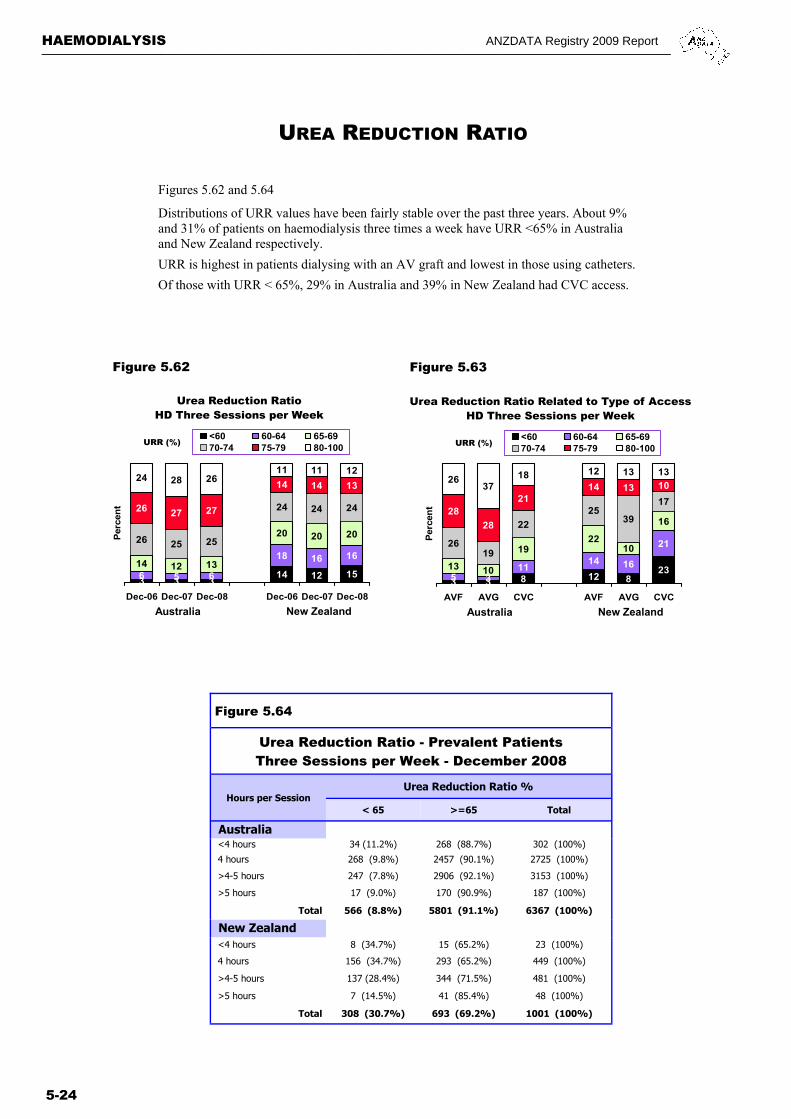
Distributions of URR values have been fairly stable over the past three years. About 9% and 31% of patients on haemodialysis three times a week have URR <65% in Australia and New Zealand respectively.
URR is highest in patients dialysing with an AV graft and lowest in those using catheters.
Of those with URR < 65%, 29% in Australia and 39% in New Zealand had CVC access.
3 3 8 12 823
5 311
14 16
21
13 10
1922
10
16
2619
22
2539
1728
28
2114 13 10
2637
18 12 13 13
AVF AVG CVC AVF AVG CVC
Perc
ent
<60 60-64 65-6970-74 75-79 80-100
Urea Reduction Ratio Related to Type of AccessHD Three Sessions per Week
Australia New Zealand
URR (%)
Figure 5.62 Figure 5.63
3 3 314 12 156 5 6
18 16 1614 12 13
20 20 2026 25 25
24 24 2426 27 27
14 14 1324 28 26
11 11 12
Dec-06 Dec-07 Dec-08 Dec-06 Dec-07 Dec-08
Per
cen
t
<60 60-64 65-6970-74 75-79 80-100
Urea Reduction RatioHD Three Sessions per Week
Australia New Zealand
URR (%)
Figure 5.64
Urea Reduction Ratio - Prevalent Patients Three Sessions per Week - December 2008
Hours per Session Urea Reduction Ratio %
< 65 >=65 Total
Australia
<4 hours 34 (11.2%) 268 (88.7%) 302 (100%)
4 hours 268 (9.8%) 2457 (90.1%) 2725 (100%)
>4-5 hours 247 (7.8%) 2906 (92.1%) 3153 (100%)
>5 hours 17 (9.0%) 170 (90.9%) 187 (100%)
New Zealand
<4 hours 8 (34.7%) 15 (65.2%) 23 (100%)
>5 hours 7 (14.5%) 41 (85.4%) 48 (100%)
Total 308 (30.7%) 693 (69.2%) 1001 (100%)
Total 566 (8.8%) 5801 (91.1%) 6367 (100%)
4 hours 156 (34.7%) 293 (65.2%) 449 (100%)
>4-5 hours 137 (28.4%) 344 (71.5%) 481 (100%)
ANZDATA Registry 2009 Report HAEMODIALYSIS _____________________________________________________________________________________
5-25
UREA REDUCTION RATIO BY TREATING CENTRE
Figure 5.65 Figure 5.66
Figure 5.67 Figure 5.68
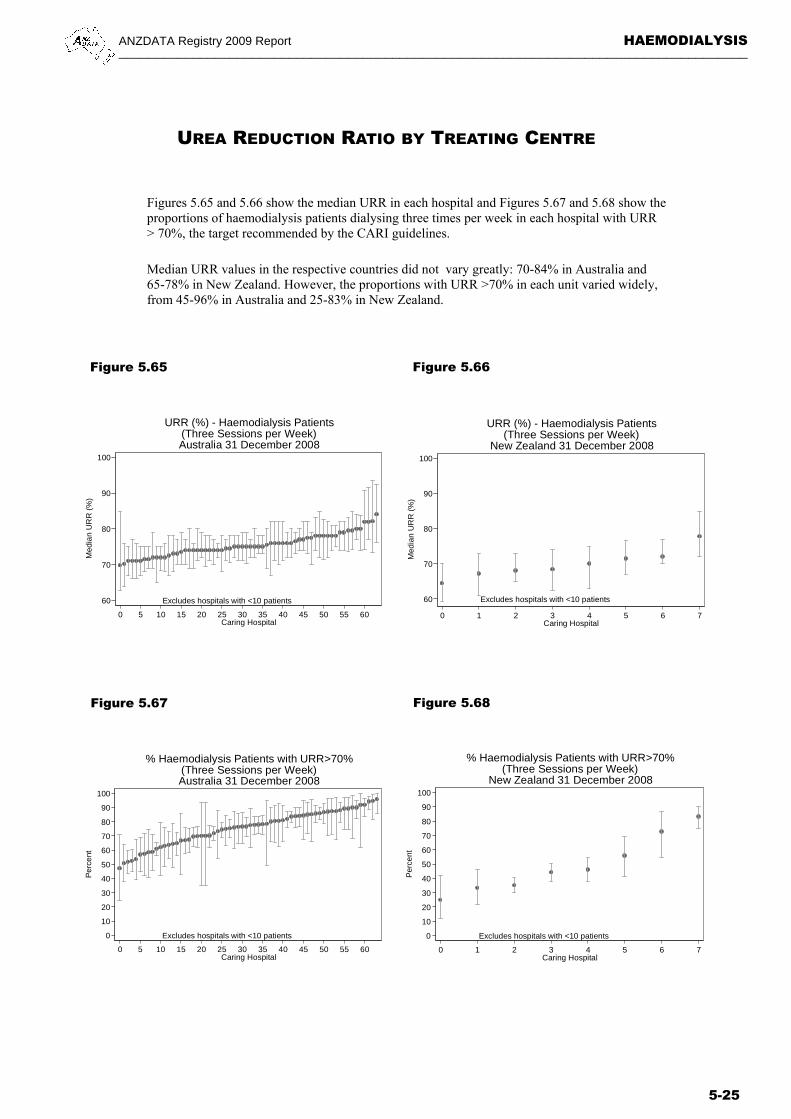
Figures 5.65 and 5.66 show the median URR in each hospital and Figures 5.67 and 5.68 show the proportions of haemodialysis patients dialysing three times per week in each hospital with URR > 70%, the target recommended by the CARI guidelines.
Median URR values in the respective countries did not vary greatly: 70-84% in Australia and 65-78% in New Zealand. However, the proportions with URR >70% in each unit varied widely, from 45-96% in Australia and 25-83% in New Zealand.
Excludes hospitals with <10 patients60
70
80
90
100
Med
ian
UR
R (
%)
0 5 10 15 20 25 30 35 40 45 50 55 60Caring Hospital
URR (%) - Haemodialysis Patients(Three Sessions per Week)Australia 31 December 2008
Excludes hospitals with <10 patients60
70
80
90
100
Med
ian
UR
R (
%)
0 1 2 3 4 5 6 7Caring Hospital
URR (%) - Haemodialysis Patients(Three Sessions per Week)
New Zealand 31 December 2008
Excludes hospitals with <10 patients0
10
20
30
40
50
60
70
80
90
100
Per
cent
0 5 10 15 20 25 30 35 40 45 50 55 60Caring Hospital
% Haemodialysis Patients with URR>70%(Three Sessions per Week)Australia 31 December 2008
Excludes hospitals with <10 patients0
10
20
30
40
50
60
70
80
90
100
Per
cent
0 1 2 3 4 5 6 7Caring Hospital
% Haemodialysis Patients with URR>70%(Three Sessions per Week)
New Zealand 31 December 2008
HAEMODIALYSIS ANZDATA Registry 2009 Report _____________________________________________________________________________________
5-26
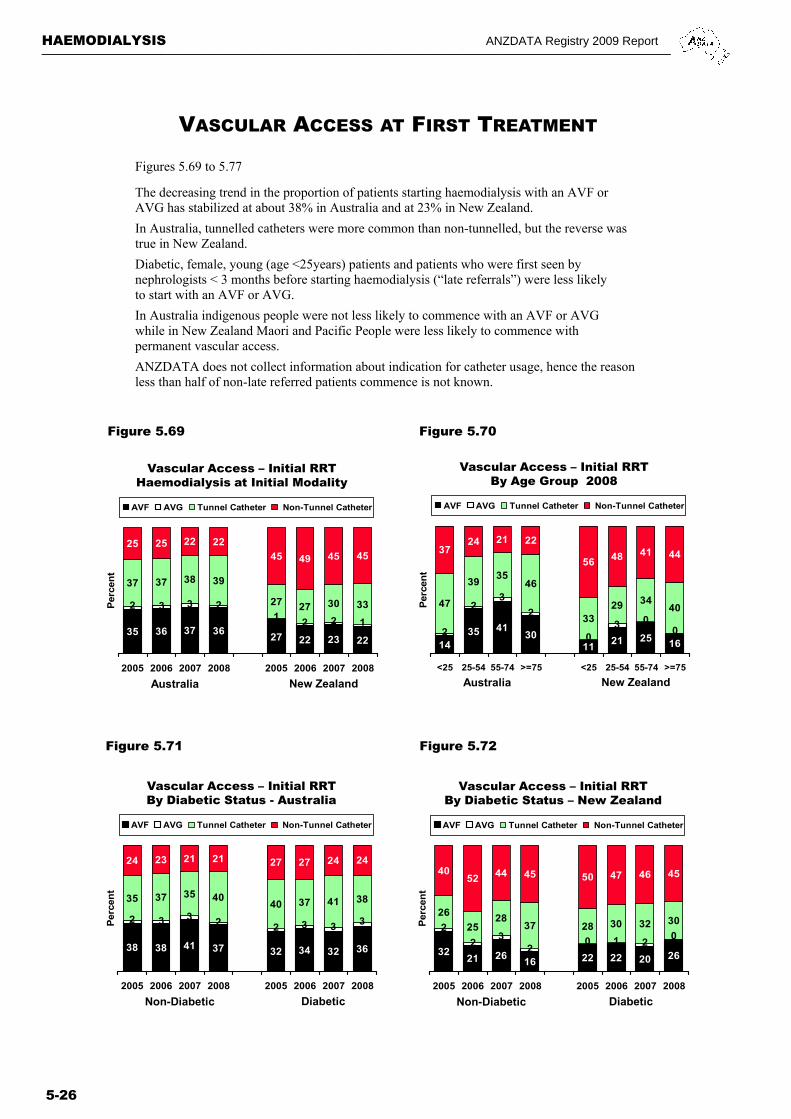
VASCULAR ACCESS AT FIRST TREATMENT
35 36 37 3627 22 23 22
37 37 38 39
27 27 30 33
25 25 22 22
45 49 45 45
1221
2332
2005 2006 2007 2008 2005 2006 2007 2008
Per
cen
t
AVF AVG Tunnel Catheter Non-Tunnel Catheter
Vascular Access – Initial RRTHaemodialysis at Initial Modality
Australia New Zealand
Figure 5.69 Figure 5.70
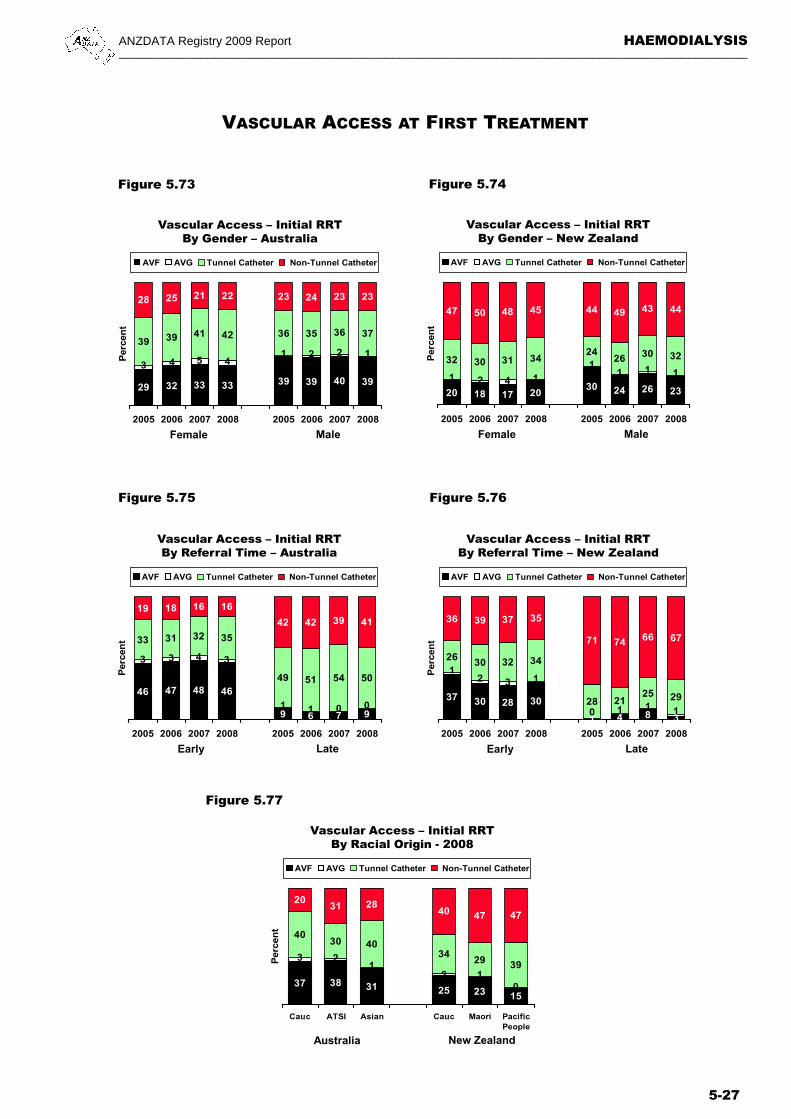
Figures 5.69 to 5.77
The decreasing trend in the proportion of patients starting haemodialysis with an AVF or AVG has stabilized at about 38% in Australia and at 23% in New Zealand.
In Australia, tunnelled catheters were more common than non-tunnelled, but the reverse was true in New Zealand.
Diabetic, female, young (age <25years) patients and patients who were first seen by nephrologists < 3 months before starting haemodialysis (“late referrals”) were less likely to start with an AVF or AVG.
In Australia indigenous people were not less likely to commence with an AVF or AVG while in New Zealand Maori and Pacific People were less likely to commence with permanent vascular access.
ANZDATA does not collect information about indication for catheter usage, hence the reason less than half of non-late referred patients commence is not known.
38 38 41 37 32 34 32 36
35 37 35 4040 37 41 38
24 23 21 21 27 27 24 24
2 3 3 2 2 3 3 3
2005 2006 2007 2008 2005 2006 2007 2008
Per
cen
t
AVF AVG Tunnel Catheter Non-Tunnel Catheter
Vascular Access – Initial RRTBy Diabetic Status - Australia
Non-Diabetic Diabetic
Figure 5.71 Figure 5.72
3221 26
16 22 22 20 26
26
2528
37 28 30 32 30
4052 44 45 50 47 46 45
2
23
20 1 2
0
2005 2006 2007 2008 2005 2006 2007 2008
Per
cen
t
AVF AVG Tunnel Catheter Non-Tunnel Catheter
Vascular Access – Initial RRTBy Diabetic Status – New Zealand
Non-Diabetic Diabetic
1435 41
3011
21 25 16
47
3935
46
3329 34
40
3724 21 22
56 48 41 44
3
003
02
22
<25 25-54 55-74 >=75 <25 25-54 55-74 >=75
Per
cen
t
AVF AVG Tunnel Catheter Non-Tunnel Catheter
Vascular Access – Initial RRTBy Age Group 2008
Australia New Zealand
ANZDATA Registry 2009 Report HAEMODIALYSIS _____________________________________________________________________________________
5-27
VASCULAR ACCESS AT FIRST TREATMENT
Figure 5.73 Figure 5.74
Figure 5.75 Figure 5.76
29 32 33 33 39 39 40 39
39 39 41 42 36 35 36 37
28 25 21 22 23 24 23 23
3 4 5 41 2 2 1
2005 2006 2007 2008 2005 2006 2007 2008
Per
cen
t
AVF AVG Tunnel Catheter Non-Tunnel Catheter
Vascular Access – Initial RRTBy Gender – Australia
Female Male
20 18 17 2030 24 26 23
32 30 31 3424
26 30 32
47 50 48 45 44 49 43 44
1 2 4 1
11 1 1
2005 2006 2007 2008 2005 2006 2007 2008P
erce
nt
AVF AVG Tunnel Catheter Non-Tunnel Catheter
Vascular Access – Initial RRTBy Gender – New Zealand
Female Male
46 47 48 46
9 6 7 9
33 31 32 35
49 51 54 50
19 18 16 16
42 42 39 41
3 3 4 3
1 1 0 0
2005 2006 2007 2008 2005 2006 2007 2008
Per
cen
t
AVF AVG Tunnel Catheter Non-Tunnel Catheter
Vascular Access – Initial RRTBy Referral Time – Australia
Early Late
37 30 28 30
1 4 8 3
2630 32 34
28 2125 29
36 39 37 35
71 74 66 67
12 3 1
0 1 1 1
2005 2006 2007 2008 2005 2006 2007 2008
Per
cen
t
AVF AVG Tunnel Catheter Non-Tunnel Catheter
Vascular Access – Initial RRTBy Referral Time – New Zealand
Early Late
37 38 31 25 23 15
2
4030 40
3429 39
2031 28
40 47 47
1
01
3 2
Cauc ATSI Asian Cauc Maori PacificPeople
Per
cen
t
AVF AVG Tunnel Catheter Non-Tunnel Catheter
Vascular Access – Initial RRTBy Racial Origin - 2008
Australia New Zealand
Figure 5.77
HAEMODIALYSIS ANZDATA Registry 2009 Report _____________________________________________________________________________________
5-28
VASCULAR ACCESS AT FIRST TREATMENT
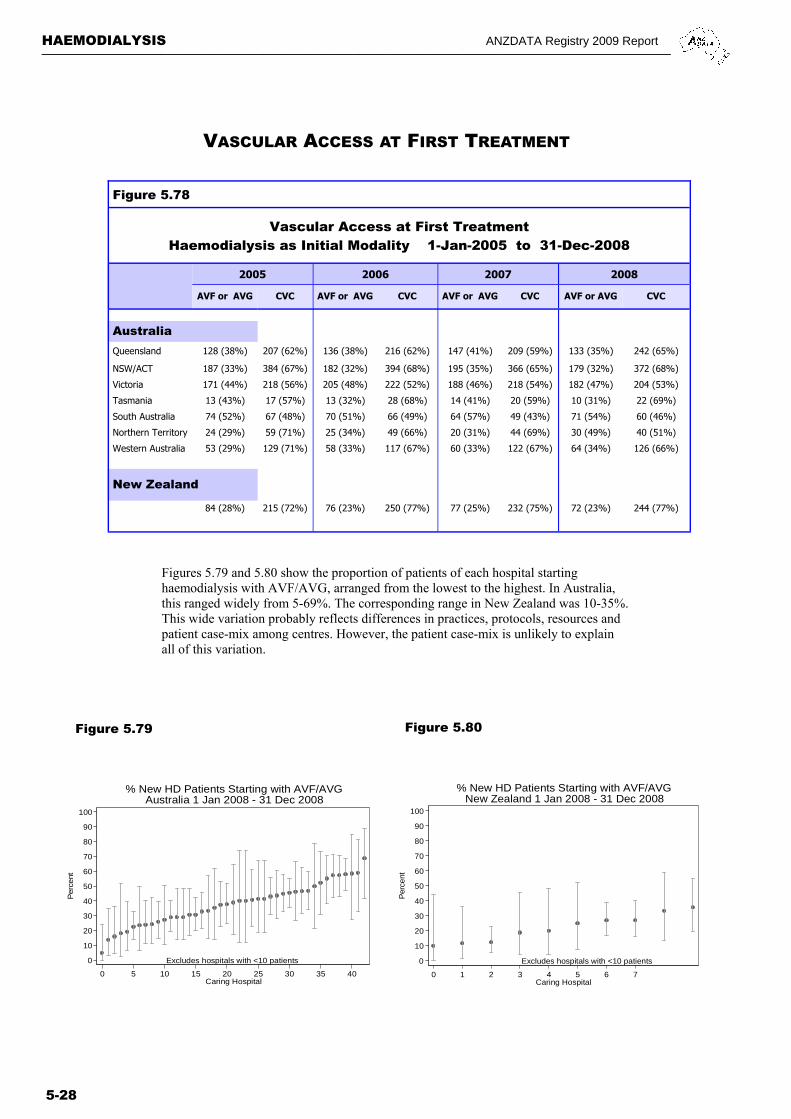
Figure 5.78
Vascular Access at First Treatment Haemodialysis as Initial Modality 1-Jan-2005 to 31-Dec-2008
2005 2006 2007 2008
AVF or AVG CVC AVF or AVG CVC AVF or AVG CVC AVF or AVG CVC
Australia
Queensland 128 (38%) 207 (62%) 136 (38%) 216 (62%) 147 (41%) 209 (59%) 133 (35%) 242 (65%)
NSW/ACT 187 (33%) 384 (67%) 182 (32%) 394 (68%) 195 (35%) 366 (65%) 179 (32%) 372 (68%)
Victoria 171 (44%) 218 (56%) 205 (48%) 222 (52%) 188 (46%) 218 (54%) 182 (47%) 204 (53%)
Tasmania 13 (43%) 17 (57%) 13 (32%) 28 (68%) 14 (41%) 20 (59%) 10 (31%) 22 (69%)
South Australia 74 (52%) 67 (48%) 70 (51%) 66 (49%) 64 (57%) 49 (43%) 71 (54%) 60 (46%)
Northern Territory 24 (29%) 59 (71%) 25 (34%) 49 (66%) 20 (31%) 44 (69%) 30 (49%) 40 (51%)
Western Australia 53 (29%) 129 (71%) 58 (33%) 117 (67%) 60 (33%) 122 (67%) 64 (34%) 126 (66%)
New Zealand
84 (28%) 215 (72%) 76 (23%) 250 (77%) 77 (25%) 232 (75%) 72 (23%) 244 (77%)
Figures 5.79 and 5.80 show the proportion of patients of each hospital starting haemodialysis with AVF/AVG, arranged from the lowest to the highest. In Australia, this ranged widely from 5-69%. The corresponding range in New Zealand was 10-35%. This wide variation probably reflects differences in practices, protocols, resources and patient case-mix among centres. However, the patient case-mix is unlikely to explain all of this variation.
Excludes hospitals with <10 patients0
10
20
30
40
50
60
70
80
90
100
Per
cent
0 5 10 15 20 25 30 35 40Caring Hospital
% New HD Patients Starting with AVF/AVGAustralia 1 Jan 2008 - 31 Dec 2008
Figure 5.79 Figure 5.80
Excludes hospitals with <10 patients0
10
20
30
40
50
60
70
80
90
100
Per
cent
0 1 2 3 4 5 6 7Caring Hospital
% New HD Patients Starting with AVF/AVGNew Zealand 1 Jan 2008 - 31 Dec 2008
ANZDATA Registry 2009 Report HAEMODIALYSIS _____________________________________________________________________________________
5-29
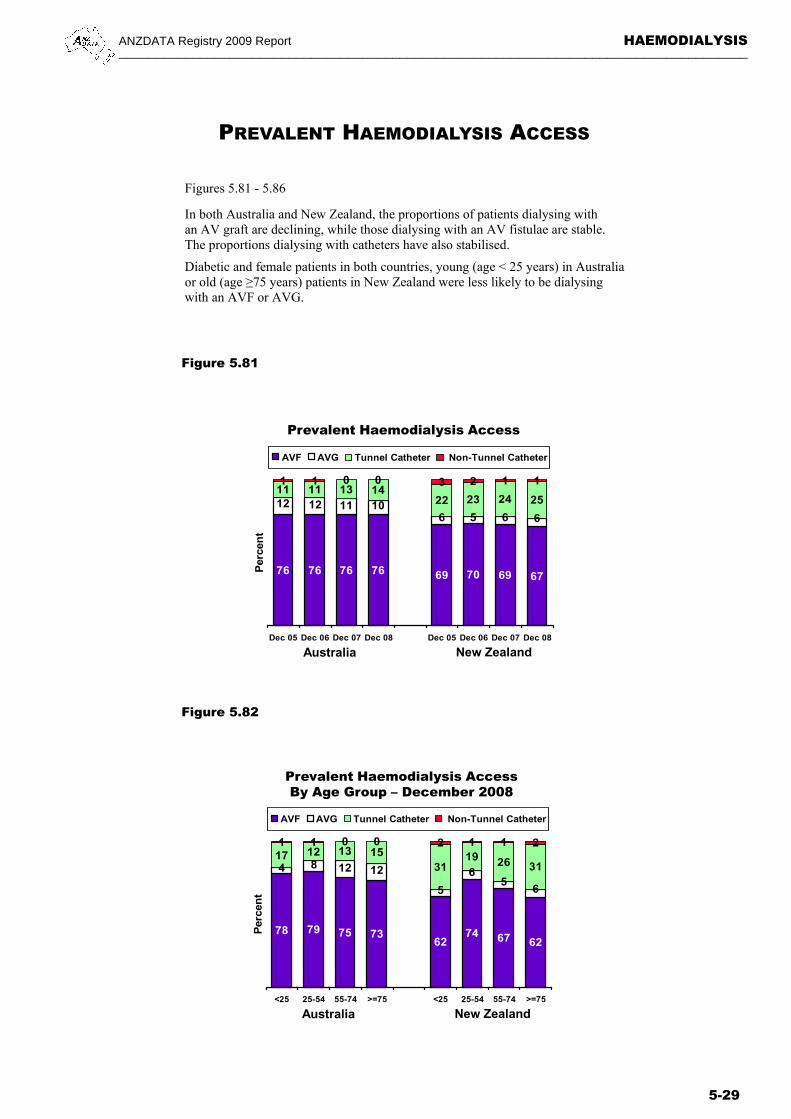
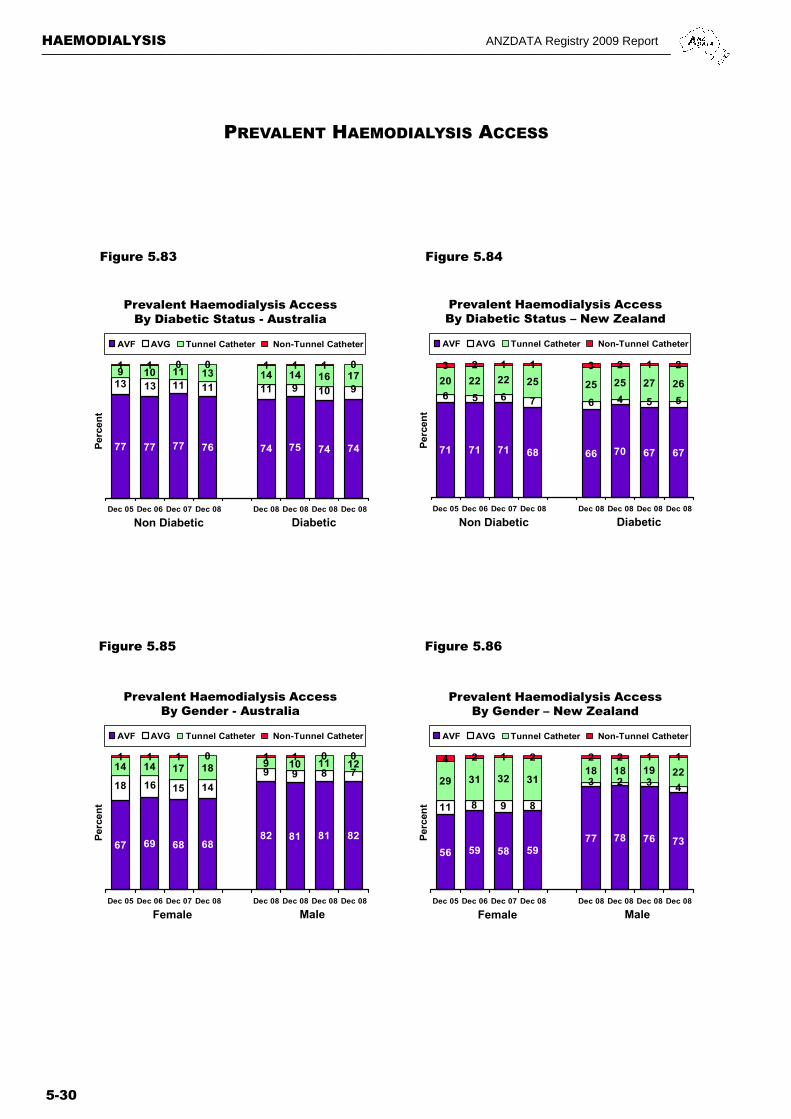
PREVALENT HAEMODIALYSIS ACCESS
Figures 5.81 - 5.86
In both Australia and New Zealand, the proportions of patients dialysing with an AV graft are declining, while those dialysing with an AV fistulae are stable. The proportions dialysing with catheters have also stabilised.
Diabetic and female patients in both countries, young (age < 25 years) in Australia or old (age ≥75 years) patients in New Zealand were less likely to be dialysing with an AVF or AVG.
Figure 5.81
Figure 5.82
78 79 75 7362
74 67 62
17 12 13 1531
19 26 31
1 1 0 0 2 1 1 2
65
6
5
121284
<25 25-54 55-74 >=75 <25 25-54 55-74 >=75
Per
cen
t
AVF AVG Tunnel Catheter Non-Tunnel Catheter
Prevalent Haemodialysis AccessBy Age Group – December 2008
Australia New Zealand
76 76 76 76 69 70 69 67
11 11 13 1422 23 24 25
1 1 0 0 3 2 1 1
665610111212
Dec 05 Dec 06 Dec 07 Dec 08 Dec 05 Dec 06 Dec 07 Dec 08
Per
cen
t
AVF AVG Tunnel Catheter Non-Tunnel Catheter
Prevalent Haemodialysis Access
Australia New Zealand
HAEMODIALYSIS ANZDATA Registry 2009 Report _____________________________________________________________________________________
5-30
Figure 5.83 Figure 5.84
Figure 5.85
PREVALENT HAEMODIALYSIS ACCESS
Figure 5.86
77 77 77 76 74 75 74 74
9 10 11 13 14 14 16 171 1 0 0 1 1 1 0
13 13 11 11 11 9 10 9
Dec 05 Dec 06 Dec 07 Dec 08 Dec 08 Dec 08 Dec 08 Dec 08
Per
cen
t
AVF AVG Tunnel Catheter Non-Tunnel Catheter
Prevalent Haemodialysis AccessBy Diabetic Status - Australia
Non Diabetic Diabetic
71 71 71 68 66 70 67 67
20 22 22 25 25 25 27 26
3 2 1 1 3 2 1 2
6 5 6 7 6 4 5 5
Dec 05 Dec 06 Dec 07 Dec 08 Dec 08 Dec 08 Dec 08 Dec 08
Perc
ent
AVF AVG Tunnel Catheter Non-Tunnel Catheter
Prevalent Haemodialysis AccessBy Diabetic Status – New Zealand
Non Diabetic Diabetic
67 69 68 6882 81 81 82
14 14 17 18 9 10 11 121 1 1 0 1 1 0 0
18 16 15 14
9 9 8 7
Dec 05 Dec 06 Dec 07 Dec 08 Dec 08 Dec 08 Dec 08 Dec 08
Perc
en
t
AVF AVG Tunnel Catheter Non-Tunnel Catheter
Prevalent Haemodialysis AccessBy Gender - Australia
Female Male
56 59 58 5977 78 76 73
29 31 32 3118 18 19 22
4 2 1 2 2 2 1 1
11 8 9 8
3 2 3 4
Dec 05 Dec 06 Dec 07 Dec 08 Dec 08 Dec 08 Dec 08 Dec 08
Perc
ent
AVF AVG Tunnel Catheter Non-Tunnel Catheter
Prevalent Haemodialysis AccessBy Gender – New Zealand
Female Male
ANZDATA Registry 2009 Report HAEMODIALYSIS _____________________________________________________________________________________
5-31
PREVALENT HAEMODIALYSIS ACCESS
Figure 5.87
Figure 5.88
74 83 7565 65
75
7
15 13 1426 27
210 0 0 2 2 0
46
11411
Cauc ATSI Asian Cauc Maori PacificPeople
Per
cen
t
AVF AVG Tunnel Catheter Non-Tunnel Catheter
Prevalent Haemodialysis AccessBy Racial Origin – December 2008
Australia New Zealand
6578
89
5275
864
2412
2
40
17 76
8
910
10
01 0 03 1
HospHD
Sat HD HomeHD
HospHD
Sat HD HomeHD
Per
cen
t
AVF AVG Tunnel Catheter Non-Tunnel Catheter
Prevalent Haemodialysis AccessBy Facility – December 2008
Australia New Zealand
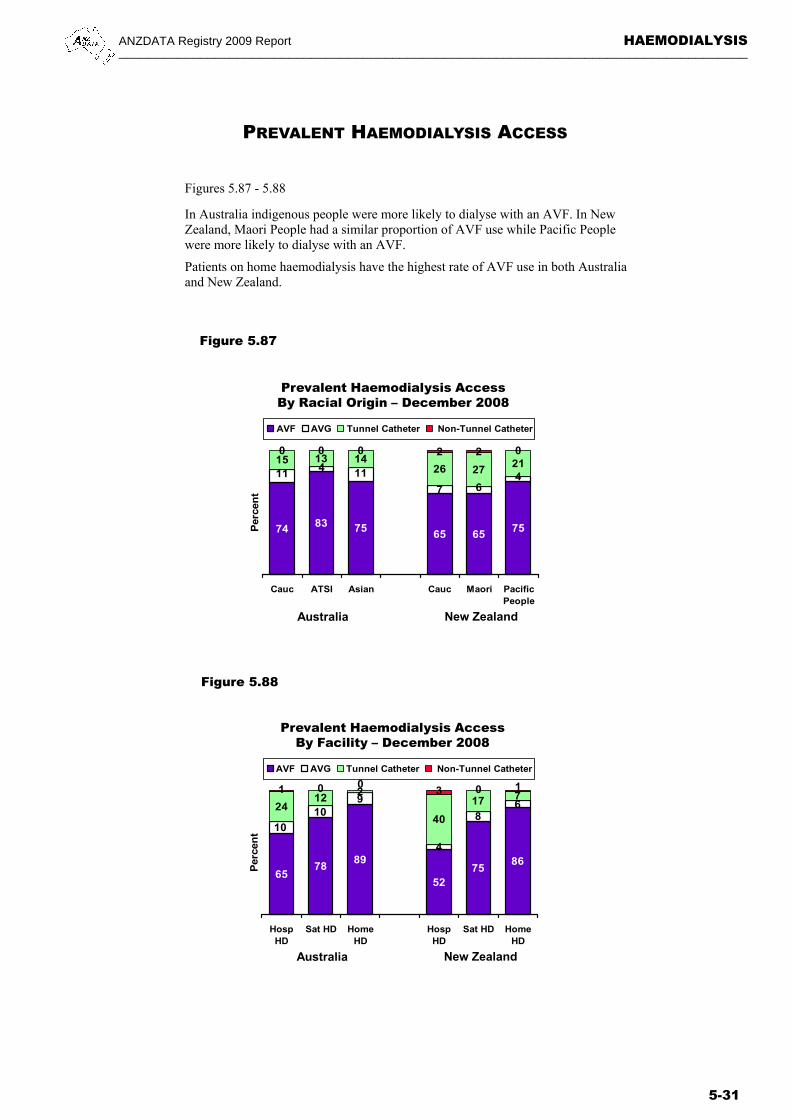
Figures 5.87 - 5.88
In Australia indigenous people were more likely to dialyse with an AVF. In New Zealand, Maori People had a similar proportion of AVF use while Pacific People were more likely to dialyse with an AVF.
Patients on home haemodialysis have the highest rate of AVF use in both Australia and New Zealand.
HAEMODIALYSIS ANZDATA Registry 2009 Report _____________________________________________________________________________________
5-32
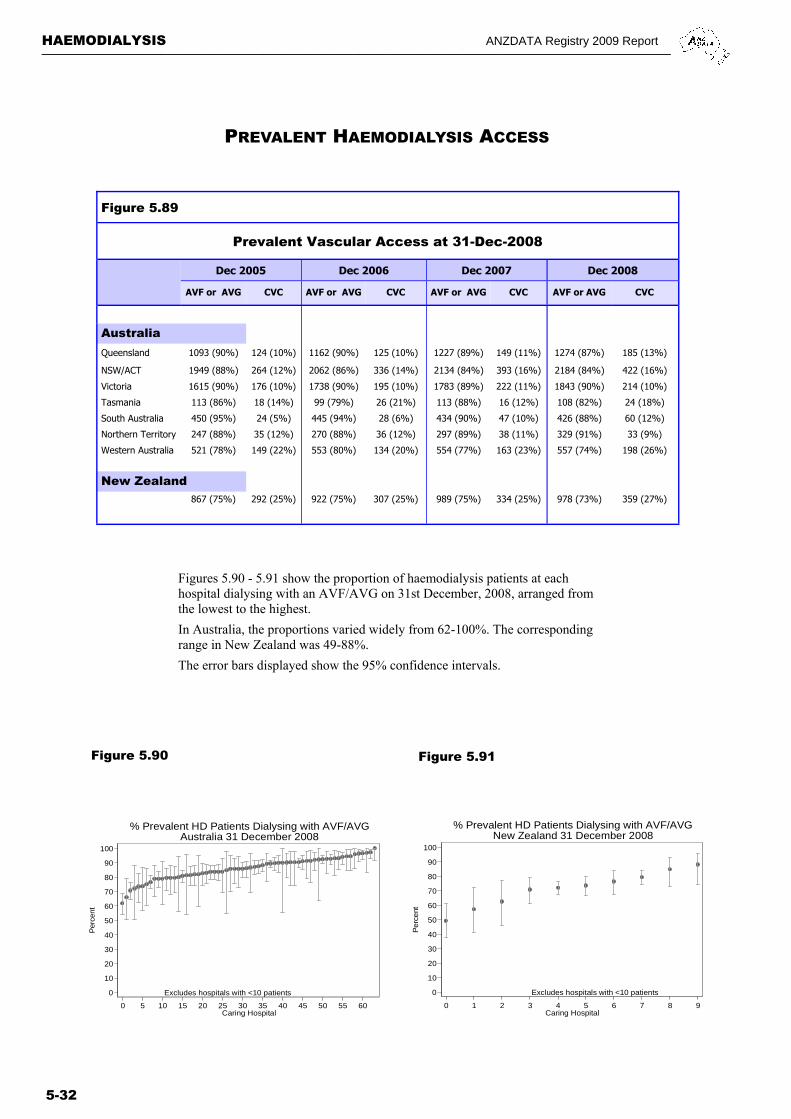
Figure 5.89
Prevalent Vascular Access at 31-Dec-2008
Dec 2005 Dec 2006 Dec 2007
AVF or AVG CVC AVF or AVG CVC AVF or AVG CVC AVF or AVG CVC
Australia
Queensland 1093 (90%) 124 (10%) 1162 (90%) 125 (10%) 1227 (89%) 149 (11%) 1274 (87%) 185 (13%)
NSW/ACT 1949 (88%) 264 (12%) 2062 (86%) 336 (14%) 2134 (84%) 393 (16%) 2184 (84%) 422 (16%)
Victoria 1615 (90%) 176 (10%) 1738 (90%) 195 (10%) 1783 (89%) 222 (11%) 1843 (90%) 214 (10%)
Tasmania 113 (86%) 18 (14%) 99 (79%) 26 (21%) 113 (88%) 16 (12%) 108 (82%) 24 (18%)
South Australia 450 (95%) 24 (5%) 445 (94%) 28 (6%) 434 (90%) 47 (10%) 426 (88%) 60 (12%)
Northern Territory 247 (88%) 35 (12%) 270 (88%) 36 (12%) 297 (89%) 38 (11%) 329 (91%) 33 (9%)
Western Australia 521 (78%) 149 (22%) 553 (80%) 134 (20%) 554 (77%) 163 (23%) 557 (74%) 198 (26%)
New Zealand
867 (75%) 292 (25%) 922 (75%) 307 (25%) 989 (75%) 334 (25%) 978 (73%) 359 (27%)
Dec 2008
Figures 5.90 - 5.91 show the proportion of haemodialysis patients at each hospital dialysing with an AVF/AVG on 31st December, 2008, arranged from the lowest to the highest.
In Australia, the proportions varied widely from 62-100%. The corresponding range in New Zealand was 49-88%.
The error bars displayed show the 95% confidence intervals.
PREVALENT HAEMODIALYSIS ACCESS
Figure 5.90 Figure 5.91
Excludes hospitals with <10 patients0
10
20
30
40
50
60
70
80
90
100
Per
cent
0 5 10 15 20 25 30 35 40 45 50 55 60Caring Hospital
% Prevalent HD Patients Dialysing with AVF/AVGAustralia 31 December 2008
Excludes hospitals with <10 patients0
10
20
30
40
50
60
70
80
90
100
Per
cent
0 1 2 3 4 5 6 7 8 9Caring Hospital
% Prevalent HD Patients Dialysing with AVF/AVGNew Zealand 31 December 2008