Keurig Dr Pepper Reports Q3 Results and Reaffirms Full ...
25
1 Keurig Dr Pepper Reports Q3 Results and Reaffirms Full-Year Adjusted Diluted EPS Guidance Strong Top-Line Growth and Margin Expansion Drive Performance BURLINGTON, MA and PLANO, TX (November 7, 2019) – Keurig Dr Pepper Inc. (NYSE: KDP) today reported financial results for the third quarter ended September 30, 2019 and reaffirmed guidance for Adjusted diluted EPS 1 growth of 15% to 17% for the full year. GAAP performance in the third quarter of 2019 was impacted by the merger between Keurig Green Mountain and Dr Pepper Snapple Group, which was completed on July 9, 2018. Compared to the prior year period, net sales advanced 5.1% to $2.87 billion, operating income increased 68% to $580 million and earnings per diluted share (“diluted EPS”) grew 91% to $0.21. The net sales of $2.87 billion in the third quarter of 2019 advanced 0.5%, compared to Adjusted pro forma net sales of $2.86 billion in the prior year period, reflecting strong underlying net sales growth of 3.1%, partially offset by the unfavorable impact of changes in the Company’s Allied Brands portfolio. Adjusted diluted EPS increased 6.7% to $0.32 in the third quarter, compared to Adjusted pro forma diluted EPS of $0.30 in the year-ago period. Commenting on the announcement, Keurig Dr Pepper Chairman and CEO Bob Gamgort stated, “KDP’s third quarter results continued to track well with the ambitious long-term targets we established nearly two years ago. Our underlying net sales growth in the quarter accelerated to 3.1%, with balanced contribution from volume/mix and pricing. Healthy underlying growth in all four segments, combined with margin expansion, enabled strong earnings growth, cash generation and continued debt reduction.” Third Quarter Consolidated Results The GAAP net sales growth of 5.1% to $2.87 billion in the third quarter of 2019, compared to $2.73 billion in the year-ago quarter, primarily reflected the impact of the merger. Compared to Adjusted pro forma net sales of $2.86 billion in the third quarter of 2018, net sales advanced 0.5%, reflecting strong underlying net sales growth of 3.1%, driven by increased volume/mix of 1.5% and higher net price realization of 1.6%. Also benefiting the quarter was a 0.3% impact from an additional shipping day. Partially offsetting these positive drivers was the unfavorable impact of changes in the Company’s Allied Brands portfolio totaling 2.7%, as well as unfavorable foreign currency translation of 0.2%. KDP in-market performance 2 was solid in the third quarter of 2019, growing dollar consumption and gaining market share in several key categories, including CSDs 3 , premium unflavored still water, shelf stable fruit drinks and shelf stable apple juice. This performance reflected the strength of Dr Pepper and Canada Dry CSDs, CORE Hydration, Snapple juice drinks and Motts apple juice. In coffee, retail consumption of single- 1 Adjusted financial metrics used in this release are non-GAAP measures and refer to results in 2019. Adjusted pro forma financial metrics also used in this release for results in 2018 are also non-GAAP measures and assume the merger occurred on December 31, 2016 and adjust for other items affecting comparability. See reconciliations of GAAP results to Adjusted results, in the case of 2019 metrics, and to Adjusted pro forma results, in the case of 2018 metrics, in the accompanying tables. 2 In-market performance (retail consumption; market share) based on Keurig Dr Pepper’s custom IRi category definitions. 3 CSD refers to “Carbonated Soft Drink”.
Transcript of Keurig Dr Pepper Reports Q3 Results and Reaffirms Full ...

1
Keurig Dr Pepper Reports Q3 Results and Reaffirms Full-Year Adjusted Diluted EPS Guidance
Strong Top-Line Growth and Margin Expansion Drive Performance
BURLINGTON, MA and PLANO, TX (November 7, 2019) – Keurig Dr Pepper Inc. (NYSE: KDP) today reported financial results for the third quarter ended September 30, 2019 and reaffirmed guidance for Adjusted diluted EPS1 growth of 15% to 17% for the full year. GAAP performance in the third quarter of 2019 was impacted by the merger between Keurig Green Mountain and Dr Pepper Snapple Group, which was completed on July 9, 2018. Compared to the prior year period, net sales advanced 5.1% to $2.87 billion, operating income increased 68% to $580 million and earnings per diluted share (“diluted EPS”) grew 91% to $0.21. The net sales of $2.87 billion in the third quarter of 2019 advanced 0.5%, compared to Adjusted pro forma net sales of $2.86 billion in the prior year period, reflecting strong underlying net sales growth of 3.1%, partially offset by the unfavorable impact of changes in the Company’s Allied Brands portfolio. Adjusted diluted EPS increased 6.7% to $0.32 in the third quarter, compared to Adjusted pro forma diluted EPS of $0.30 in the year-ago period. Commenting on the announcement, Keurig Dr Pepper Chairman and CEO Bob Gamgort stated, “KDP’s third quarter results continued to track well with the ambitious long-term targets we established nearly two years ago. Our underlying net sales growth in the quarter accelerated to 3.1%, with balanced contribution from volume/mix and pricing. Healthy underlying growth in all four segments, combined with margin expansion, enabled strong earnings growth, cash generation and continued debt reduction.” Third Quarter Consolidated Results
The GAAP net sales growth of 5.1% to $2.87 billion in the third quarter of 2019, compared to $2.73 billion in the year-ago quarter, primarily reflected the impact of the merger. Compared to Adjusted pro forma net sales of $2.86 billion in the third quarter of 2018, net sales advanced 0.5%, reflecting strong underlying net sales growth of 3.1%, driven by increased volume/mix of 1.5% and higher net price realization of 1.6%. Also benefiting the quarter was a 0.3% impact from an additional shipping day. Partially offsetting these positive drivers was the unfavorable impact of changes in the Company’s Allied Brands portfolio totaling 2.7%, as well as unfavorable foreign currency translation of 0.2%. KDP in-market performance2 was solid in the third quarter of 2019, growing dollar consumption and gaining market share in several key categories, including CSDs3, premium unflavored still water, shelf stable fruit drinks and shelf stable apple juice. This performance reflected the strength of Dr Pepper and Canada Dry CSDs, CORE Hydration, Snapple juice drinks and Motts apple juice. In coffee, retail consumption of single-
1 Adjusted financial metrics used in this release are non-GAAP measures and refer to results in 2019. Adjusted pro forma financial metrics also used in this release for results in 2018 are also non-GAAP measures and assume the merger occurred on December 31, 2016 and adjust for other items affecting comparability. See reconciliations of GAAP results to Adjusted results, in the case of 2019 metrics, and to Adjusted pro forma results, in the case of 2018 metrics, in the accompanying tables. 2 In-market performance (retail consumption; market share) based on Keurig Dr Pepper’s custom IRi category definitions. 3 CSD refers to “Carbonated Soft Drink”.
2
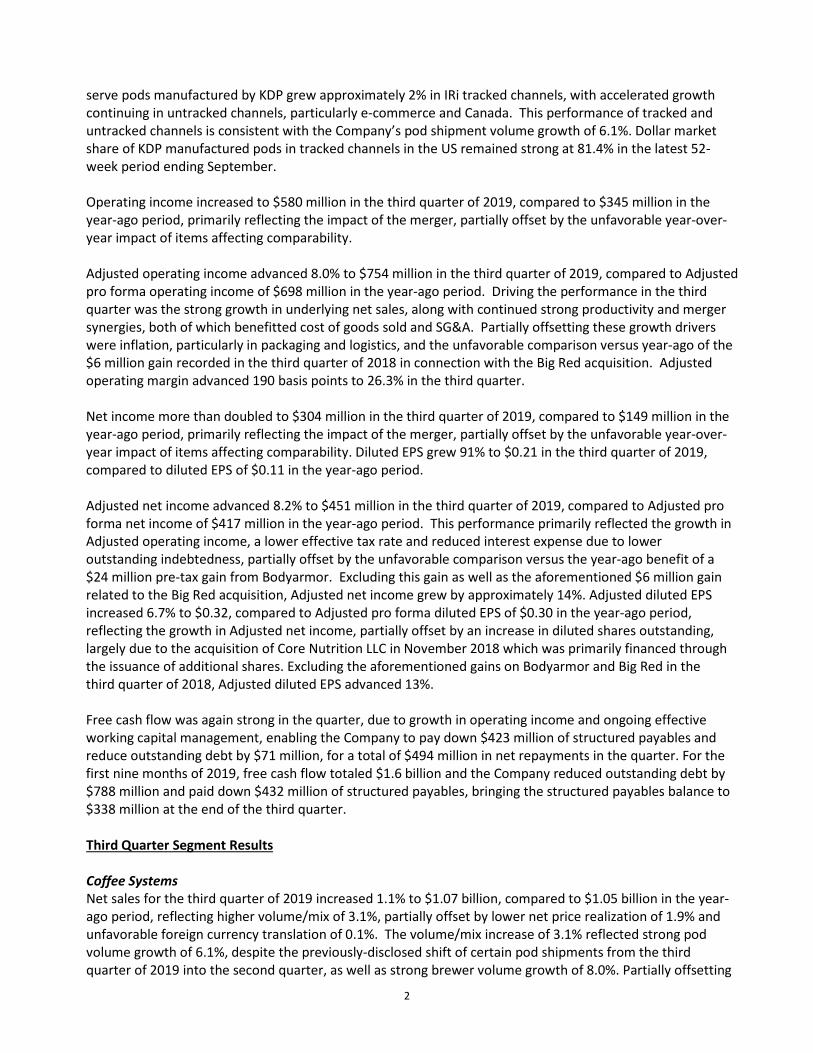
serve pods manufactured by KDP grew approximately 2% in IRi tracked channels, with accelerated growth continuing in untracked channels, particularly e-commerce and Canada. This performance of tracked and untracked channels is consistent with the Company’s pod shipment volume growth of 6.1%. Dollar market share of KDP manufactured pods in tracked channels in the US remained strong at 81.4% in the latest 52-week period ending September. Operating income increased to $580 million in the third quarter of 2019, compared to $345 million in the year-ago period, primarily reflecting the impact of the merger, partially offset by the unfavorable year-over-year impact of items affecting comparability. Adjusted operating income advanced 8.0% to $754 million in the third quarter of 2019, compared to Adjusted pro forma operating income of $698 million in the year-ago period. Driving the performance in the third quarter was the strong growth in underlying net sales, along with continued strong productivity and merger synergies, both of which benefitted cost of goods sold and SG&A. Partially offsetting these growth drivers were inflation, particularly in packaging and logistics, and the unfavorable comparison versus year-ago of the $6 million gain recorded in the third quarter of 2018 in connection with the Big Red acquisition. Adjusted operating margin advanced 190 basis points to 26.3% in the third quarter. Net income more than doubled to $304 million in the third quarter of 2019, compared to $149 million in the year-ago period, primarily reflecting the impact of the merger, partially offset by the unfavorable year-over-year impact of items affecting comparability. Diluted EPS grew 91% to $0.21 in the third quarter of 2019, compared to diluted EPS of $0.11 in the year-ago period. Adjusted net income advanced 8.2% to $451 million in the third quarter of 2019, compared to Adjusted pro forma net income of $417 million in the year-ago period. This performance primarily reflected the growth in Adjusted operating income, a lower effective tax rate and reduced interest expense due to lower outstanding indebtedness, partially offset by the unfavorable comparison versus the year-ago benefit of a $24 million pre-tax gain from Bodyarmor. Excluding this gain as well as the aforementioned $6 million gain related to the Big Red acquisition, Adjusted net income grew by approximately 14%. Adjusted diluted EPS increased 6.7% to $0.32, compared to Adjusted pro forma diluted EPS of $0.30 in the year-ago period, reflecting the growth in Adjusted net income, partially offset by an increase in diluted shares outstanding, largely due to the acquisition of Core Nutrition LLC in November 2018 which was primarily financed through the issuance of additional shares. Excluding the aforementioned gains on Bodyarmor and Big Red in the third quarter of 2018, Adjusted diluted EPS advanced 13%. Free cash flow was again strong in the quarter, due to growth in operating income and ongoing effective working capital management, enabling the Company to pay down $423 million of structured payables and reduce outstanding debt by $71 million, for a total of $494 million in net repayments in the quarter. For the first nine months of 2019, free cash flow totaled $1.6 billion and the Company reduced outstanding debt by $788 million and paid down $432 million of structured payables, bringing the structured payables balance to $338 million at the end of the third quarter. Third Quarter Segment Results Coffee Systems Net sales for the third quarter of 2019 increased 1.1% to $1.07 billion, compared to $1.05 billion in the year-ago period, reflecting higher volume/mix of 3.1%, partially offset by lower net price realization of 1.9% and unfavorable foreign currency translation of 0.1%. The volume/mix increase of 3.1% reflected strong pod volume growth of 6.1%, despite the previously-disclosed shift of certain pod shipments from the third quarter of 2019 into the second quarter, as well as strong brewer volume growth of 8.0%. Partially offsetting

3
the strong pod volume growth was unfavorable pod sales mix, primarily reflecting the mix impact of higher shipments to branded partners in the third quarter of 2019 versus year-ago. Operating income for Coffee Systems declined 7.2% to $310 million in the third quarter of 2019, compared to $334 million in the year-ago period. Adjusted operating income in the quarter declined 3.4% to $367 million, compared to Adjusted pro forma operating income of $380 million in the year-ago period, primarily reflecting unfavorable mix and pricing, inflation in packaging and logistics and higher brewer investments. Partially offsetting these drivers were the strong volume growth, productivity and merger synergies. Adjusted operating margin declined 160 basis points versus year-ago to 34.5%. On a nine month basis, which excludes the quarter-to-quarter timing impacts referenced above, net sales versus year-ago advanced 2.5% and operating income advanced 2.9%. On an Adjusted pro forma basis, net sales advanced 2.3% and Adjusted operating income advanced 3.7%. Packaged Beverages Net sales for the third quarter of 2019 increased 5.6% to $1.31 billion, compared to net sales of $1.24 million in the year-ago period, primarily reflecting the impact of the merger. Compared to Adjusted pro forma net sales of $1.34 billion in the third quarter of 2018, net sales decreased 2.2%, reflecting underlying net sales growth of 3.1%, driven by higher net price realization of 2.7% and increased volume/mix of 0.4%. Also benefiting the comparison was a 0.6% impact from an additional shipping day in the third quarter of 2019. More than offsetting these growth drivers was the unfavorable impact of changes in the Allied Brands portfolio totaling 5.8% and unfavorable foreign currency translation of 0.1%. Driving the underlying net sales growth in the quarter were CORE Hydration, Canada Dry, Dr Pepper, Motts, Sunkist and A&W, while Bai declined. Contract manufacturing also grew in the quarter. Operating income for Packaged Beverages was $196 million in the third quarter of 2019, compared to $61 million in the year-ago period. Adjusted operating income in the quarter advanced 23% to $201 million, compared to Adjusted pro forma operating income of $164 million in the year-ago period, largely reflecting strong productivity and merger synergies, the growth in underlying net sales and lower marketing expense due to timing. Partially offsetting these positive drivers was inflation, primarily in packaging, ingredients and logistics. Adjusted operating margin grew 310 basis points versus year-ago to 15.4%. Beverage Concentrates Net sales for the third quarter of 2019 increased 14% to $360 million, compared to net sales of $317 million in the year-ago period, primarily reflecting the impact of the merger. Compared to Adjusted pro forma net sales of $331 in the third quarter of 2018, net sales increased 8.8%, reflecting higher net price realization of 6.5% and favorable volume/mix of 2.3%. Dr Pepper continued to fuel the strong growth in net sales for the segment, along with the strength of Canada Dry, Big Red and Sunkist. Shipment volume increased 1.6% compared to the year-ago period and was also largely driven by Dr Pepper, Canada Dry, Big Red and Sunkist. Bottler case sales volume increased 2.1% in the quarter compared to the year-ago period. Operating income for Beverage Concentrates was $245 million in the third quarter of 2019, compared to $193 million in the year-ago period. Adjusted operating income in the quarter increased 20% to $244 million, compared to Adjusted pro forma operating income of $204 million in the year-ago period, primarily reflecting the strong growth in net sales as well as merger synergies and productivity. Adjusted operating margin grew 620 basis points versus year-ago to 67.8%.

4
Latin America Beverages Net sales for the third quarter of 2019 increased 11% to $138 million, compared to net sales of $124 million in the year-ago period, primarily reflecting the impact of the merger. Compared to Adjusted pro forma net sales of $136 million in the third quarter of 2018, net sales increased 1.5%, reflecting higher net price realization of 5.2%, partially offset by unfavorable volume/mix of 1.5% and unfavorable foreign currency translation of 2.2%. Operating income for Latin America Beverages totaled $25 million in the third quarter of 2019, compared to $15 million in the year-ago period. Adjusted operating income in the quarter totaled $25 million, compared to Adjusted pro forma operating income of $27 million in the year-ago period. The decline versus year-ago reflected inflation in logistics and ingredients and higher marketing investment, partially offset by the growth in net sales and productivity. KDP Adjusted Pro forma Outlook for 2019
The Company reaffirmed Adjusted diluted EPS growth in 2019 in the range of 15% to 17%, or $1.20 to $1.22 per diluted share, in line with its long-term merger target. Supporting this guidance are the following expectations:
• Underlying net sales growth approximating 3%, which is at the high end of the Company’s long-
term merger target of 2-3%, reflecting stronger performance of core brands, with a slower ramp of Allied Brands.
• Merger synergies of $200 million are expected in 2019, consistent with the Company’s long-term merger target for $200 million per year over the 2019-2021 period.
• Adjusted other (income)/expense, net is expected to approximate $30 million of expense in 2019 and assumes no gains related to changes in the Allied Brands portfolio.
• Adjusted interest expense is expected to be in the range of $550 million to $565 million, including the $40 million first-half 2019 benefit of unwinding interest rate swap contracts.
• The Adjusted effective tax rate is expected to be in the range of 25.0% to 25.5%. • Diluted weighted average shares outstanding are estimated to be approximately 1,420 million. • Free Cash Flow generation is expected to be in the range of $2.3 billion to $2.5 billion. • Management leverage ratio is expected to be in the range of 4.4x to 4.5x at year end 2019.
As a result of continued significant cash flow generation the Company expects, KDP also reaffirmed its guidance of achieving a management leverage ratio below 3.0x in two to three years from the July 2018 closing of the merger.
Investor Contacts: Tyson Seely Keurig Dr Pepper T: 781-418-3352 / [email protected]
Steve Alexander Keurig Dr Pepper T: 972-673-6769 / [email protected]
Media Contact: Katie Gilroy Keurig Dr Pepper T: 781-418-3345 / [email protected]

5
About Keurig Dr Pepper Keurig Dr Pepper (KDP) is a leading coffee and beverage company in North America, with annual revenue in excess of $11 billion. KDP holds leadership positions in soft drinks, specialty coffee and tea, water, juice and juice drinks and mixers, and markets the #1 single serve coffee brewing system in the U.S. The Company maintains an unrivaled distribution system that enables its portfolio of more than 125 owned, licensed and partner brands to be available nearly everywhere people shop and consume beverages. With a wide range of hot and cold beverages that meet virtually any consumer need, KDP key brands include Keurig®, Dr Pepper®, Green Mountain Coffee Roasters®, Canada Dry®, Snapple®, Bai®, Mott's®, CORE® and The Original Donut Shop®. The Company employs more than 25,000 employees and operates more than 120 offices, manufacturing plants, warehouses and distribution centers across North America. For more information, visit www.keurigdrpepper.com. FORWARD LOOKING STATEMENTS Certain statements contained herein are “forward-looking statements” within the meaning of applicable securities laws and regulations. These forward-looking statements can generally be identified by the use of words such as “outlook,” “guidance,” “anticipate,” “expect,” “believe,” “could,” “estimate,” “feel,” “forecast,” “intend,” “may,” “plan,” “potential,” “project,” “should,” “will,” “would,” and similar words, phrases or expressions and variations or negatives of these words, although not all forward-looking statements contain these identifying words. Forward-looking statements by their nature address matters that are, to different degrees, uncertain, such as statements regarding the estimated or anticipated future results of the combined company following the combination of Keurig Green Mountain, Inc. (“KGM”) and Dr Pepper Snapple Group, Inc. (“DPSG” and such combination, the “transaction”), the anticipated benefits of the transaction, including estimated synergies and cost savings, the long-term merger targets, and other statements that are not historical facts. These statements are based on the current expectations of our management and are not predictions of actual performance. These forward-looking statements are subject to a number of risks and uncertainties regarding the combined company’s business and the combination and actual results may differ materially. These risks and uncertainties include, but are not limited to: (i) the impact the significant additional debt incurred in connection with the transaction may have on our ability to operate our combined business, (ii) risks relating to the integration of the KGM and DPS operations, products and employees into the combined company and assumption of certain potential liabilities of KGM and the possibility that the anticipated synergies and other benefits of the combination, including cost savings, will not be realized or will not be realized within the expected timeframe, and (iii) risks relating to the combined businesses and the industries in which our combined company operates. These risks and uncertainties, as well as other risks and uncertainties, are more fully discussed in the Company’s filings with the SEC, including our Current Report on Form 10-K filed with the SEC on February 28, 2019, and our subsequent filings with the SEC. While the lists of risk factors presented here and in our public filings are considered representative, no such list should be considered to be a complete statement of all potential risks and uncertainties. Any forward-looking statement made herein speaks only as of the date of this document. We are under no obligation to, and expressly disclaim any obligation to, update or alter any forward-looking statements, whether as a result of new information, subsequent events or otherwise, except as required by applicable laws or regulations. NON-GAAP FINANCIAL MEASURES This release includes certain non-GAAP financial measures including Adjusted operating income, Adjusted net income, Adjusted pro forma net sales, Adjusted pro forma operating income, and Adjusted diluted EPS, which differ from results using U.S. Generally Accepted Accounting Principles (GAAP). These non-GAAP financial measures should be considered as supplements to the GAAP reported measures, should not be considered replacements for, or superior to, the GAAP measures and may not be comparable to similarly named measures used by other companies. Non-GAAP financial measures typically exclude certain charges, including one-time costs related to the transaction and integration activities, which are not expected to occur routinely in future periods. The Company uses non-GAAP financial measures internally to focus management on performance excluding these special charges to gauge our business operating performance, and to provide a meaningful comparison of the Company’s performance to periods prior to the transaction. Management believes this information is helpful to investors because it increases transparency and assists investors in understanding the underlying performance of the Company and in the analysis of ongoing operating trends. Additionally, management believes that non-GAAP financial measures are frequently used by analysts and investors in their evaluation of companies, and its continued inclusion provides consistency in financial reporting and enables analysts and investors to perform meaningful comparisons of past, present and future operating results. The most directly comparable GAAP financial measures and reconciliations to non-GAAP financial measures are set forth in the appendix to this presentation and included in the Company’s filings with the SEC.

6
See the attached schedules for the supplemental financial data and corresponding reconciliations of KDP Adjusted net income, Adjusted operating income, Adjusted pro forma net sales, Adjusted pro forma operating income, and Adjusted diluted EPS. To the extent that the Company provides guidance, it does so only on a non-GAAP basis and does not provide reconciliations of such forward-looking non-GAAP measures to GAAP due to the inability to predict the amount and timing of impacts outside of the Company’s control on certain items, such as non-cash gains or losses resulting from mark-to-market adjustments of derivative instruments, among others.

KEURIG DR PEPPER INC.
CONDENSED CONSOLIDATED STATEMENTS OF INCOMEFor the Third Quarter and First Nine Months of 2019 and 2018
(Unaudited)
Third Quarter First Nine Months(in millions, except per share data) 2019 2018 2019 2018Net sales $ 2,870 $ 2,732 $ 8,186 $ 4,629Cost of sales 1,245 1,367 3,537 2,292
Gross profit 1,625 1,365 4,649 2,337Selling, general and administrative expenses 1,012 1,028 2,951 1,649Other operating expense (income), net 33 (8) 33 (2)
Income from operations 580 345 1,665 690Interest expense 158 172 497 221Interest expense - related party — — — 51Loss on early extinguishment of debt — 11 9 13Other expense (income), net 9 (33) 15 (28)
Income before provision for income taxes 413 195 1,144 433Provision for income taxes 109 46 296 110Net income 304 149 848 323Less: Net income attributable to employee redeemable non-controlling interest and mezzanine equity awards — — — 3Net income attributable to KDP $ 304 $ 149 $ 848 $ 320
Earnings per common share:Basic $ 0.22 $ 0.11 $ 0.60 $ 0.33Diluted 0.21 0.11 0.60 0.32
Weighted average common shares outstanding:Basic 1,406.8 1,361.8 1,406.6 983.0Diluted 1,419.4 1,373.6 1,418.8 994.1
A-1

KEURIG DR PEPPER INC.CONDENSED CONSOLIDATED BALANCE SHEETS
As of September 30, 2019 and December 31, 2018(Unaudited)
September 30, December 31,(in millions, except share and per share data) 2019 2018
AssetsCurrent assets:
Cash and cash equivalents $ 74 $ 83Restricted cash and restricted cash equivalents 28 46Trade accounts receivable, net 1,090 1,150Inventories 751 626Prepaid expenses and other current assets 326 254
Total current assets 2,269 2,159Property, plant and equipment, net 2,236 2,310Investments in unconsolidated affiliates 164 186Goodwill 20,112 20,011Other intangible assets, net 24,031 23,967Other non-current assets 561 259Deferred tax assets 27 26
Total assets $ 49,400 $ 48,918Liabilities and Stockholders' Equity
Current liabilities:Accounts payable $ 2,976 $ 2,300Accrued expenses 1,066 1,012Structured payables 338 526Short-term borrowings and current portion of long-term obligations 1,761 1,458Other current liabilities 409 406
Total current liabilities 6,550 5,702Long-term obligations 13,147 14,201Deferred tax liabilities 6,022 5,923Other non-current liabilities 767 559
Total liabilities 26,486 26,385Commitments and contingenciesStockholders' equity:
Preferred stock, $0.01 par value, 15,000,000 shares authorized, no shares issued — —Common stock, $0.01 par value, 2,000,000,000 shares authorized, 1,406,787,332 and1,405,944,922 shares issued and outstanding as of September 30, 2019 and December 31,2018, respectively 14 14Additional paid-in capital 21,539 21,471Retained earnings 1,388 1,178Accumulated other comprehensive loss (27) (130)
Total stockholders' equity 22,914 22,533Total liabilities and stockholders' equity $ 49,400 $ 48,918
A-2

KEURIG DR PEPPER INC.
CONDENSED CONSOLIDATED STATEMENTS OF CASH FLOWSFor The First Nine Months of 2019 and 2018
(Unaudited)
First Nine Months(in millions) 2019 2018Operating activities:Net income $ 848 $ 323Adjustments to reconcile net income to net cash provided by operating activities:
Depreciation expense 271 150Amortization expense 259 144Provision for sales returns 25 38Deferred income taxes (5) (117)Employee stock based compensation expense 47 21Loss on early extinguishment of debt 9 13Gain on step acquisition of unconsolidated subsidiaries — (6)Unrealized (gain) or loss on foreign currency (22) 7Unrealized (gain) loss on derivatives 60 (6)Equity in loss of unconsolidated affiliates 38 12Other, net 14 21Changes in assets and liabilities, net of effects of acquisition:
Trade accounts receivable 36 48Inventories (124) 91Income taxes receivable, prepaid and payables, net (9) 34Other current and non-current assets (156) (108)Accounts payable and accrued expenses 561 391Other current and non-current liabilities (49) 7Net change in operating assets and liabilities 259 463
Net cash provided by operating activities 1,803 1,063Investing activities:Acquisitions of businesses (8) (19,124)Cash acquired in acquisitions — 150Issuance of related party note receivable (22) (6)Investments in unconsolidated affiliates (16) (23)Proceeds from capital distributions from investments in unconsolidated affiliates — 36Purchases of property, plant and equipment (208) (104)Proceeds from sales of property, plant and equipment 19 1Purchases of intangibles (4) —Other, net 23 —
Net cash used in investing activities (216) (19,070)Financing activities:Proceeds from issuance of common stock private placement — 9,000Proceeds from unsecured credit facility — 1,900Proceeds from senior unsecured notes — 8,000Proceeds from term loan 2,000 2,700Net Issuance of commercial paper 335 1,386Proceeds from structured payables 246 432Payments on structured payables (432) —Payments on senior unsecured notes (250) —Repayment of unsecured credit facility — (1,900)Repayment of term loan (2,873) (3,363)Payments on finance leases (29) (20)Deferred financing charges paid — (49)Cash contributions from redeemable non-controlling interest shareholders — 19Cash dividends paid (633) (23)Other, net 10 2
Net cash (used in) provided by financing activities (1,626) 18,084Cash, cash equivalents, restricted cash and restricted cash equivalents — net change from:Operating, investing and financing activities (39) 77Effect of exchange rate changes on cash, cash equivalents, restricted cash and restricted cash equivalents 12 (50)Cash, cash equivalents, restricted cash and restricted cash equivalents at beginning of period 139 95Cash, cash equivalents, restricted cash and restricted cash equivalents at end of period $ 112 $ 122
A-3

KEURIG DR PEPPER INC.RECONCILIATION OF SEGMENT INFORMATION
(Unaudited)
Third Quarter First Nine Months(in millions) 2019 2018 2019 2018Net Sales
Coffee Systems $ 1,065 $ 1,053 $ 3,023 $ 2,950
Packaged Beverages 1,307 1,238 3,734 1,238
Beverage Concentrates 360 317 1,034 317
Latin America Beverages 138 124 395 124
Total net sales $ 2,870 $ 2,732 $ 8,186 $ 4,629
Income from OperationsCoffee Systems $ 310 $ 334 $ 890 $ 865
Packaged Beverages 196 61 531 61
Beverage Concentrates 245 193 690 193
Latin America Beverages 25 15 62 15
Unallocated corporate costs (196) (258) (508) (444)
Total income from operations $ 580 $ 345 $ 1,665 $ 690
A-4

Unaudited Pro Forma Financial Information
On January 29, 2018, DPS entered into an Agreement and Plan of Merger (the "Merger Agreement") by and among DPS,Maple and Salt Merger Sub, Inc. (“Merger Sub”), whereby Merger Sub will be merged with and into Maple, with Maple survivingthe merger as a wholly-owned subsidiary of DPS (the “Transaction”). The Transaction was consummated on July 9, 2018 (the"Merger Date"), at which time DPS changed its name to "Keurig Dr Pepper Inc.".
Immediately prior to the consummation of the Transaction (the “Effective Time”), each share of common stock of Maple issuedand outstanding was converted into the right to receive a number of fully paid and nonassessable shares of common stock of MergerSub determined pursuant to an exchange ratio set forth in the Merger Agreement (the “Acquisition Shares”). As a result of theTransaction, the stockholders of Maple as of immediately prior to the Effective Time own approximately 87% of DPS common stockfollowing the closing and the stockholders of DPS as of immediately prior to the Effective Time own approximately 13% on a fullydiluted basis. Upon consummation of the Transaction, DPS declared a special cash dividend equal to $103.75 per share, subjectto any withholding of taxes required by law, payable to holders of its common stock as of the record date for the special dividend.
The following unaudited pro forma combined financial information for the third quarter and first nine months of 2018 is basedon the actual third quarter financial statements of KDP after giving effect to the Transaction and the assumptions, reclassificationsand adjustments described in the accompanying notes to this financial information. The financial information is presented as if theTransaction had been consummated on December 31, 2016, and combines the historical results of DPS and Maple. Refer to theSummary of Pro Forma Adjustments and Summary of Reclassifications below for details of the reclassifications and adjustmentsapplied to the historical financial statements of DPS and of Maple, which is now reflected under the KDP column.
The pro forma financial information was prepared using the acquisition method of accounting, which requires, among otherthings, that assets acquired and liabilities assumed in a business combination be recognized at their fair values as of the completionof the acquisition. We utilized fair values at the Merger Date for the allocation of consideration to the net tangible and intangibleassets acquired and liabilities assumed. The historical consolidated financial statements have been adjusted in the accompanyingfinancial information to give effect to unaudited pro forma events that are (1) directly attributable to the transaction, (2) factuallysupportable, and (3) are expected to have a continuing impact on the results of operations of KDP.
The financial information has been prepared based upon currently available information and assumptions deemed appropriateby the Company's management. This financial information is not necessarily indicative of what our results of operations actuallywould have been had the Transaction been completed as of December 31, 2016. In addition, the financial information is not indicativeof future results or current financial conditions and does not reflect any anticipated synergies, operating efficiencies, cost savingsor any integration costs that may result from the Transaction. The financial information should be read in conjunction with historicalfinancial statements and accompanying notes filed with the SEC.
A-5
Summary of Pro Forma Adjustments
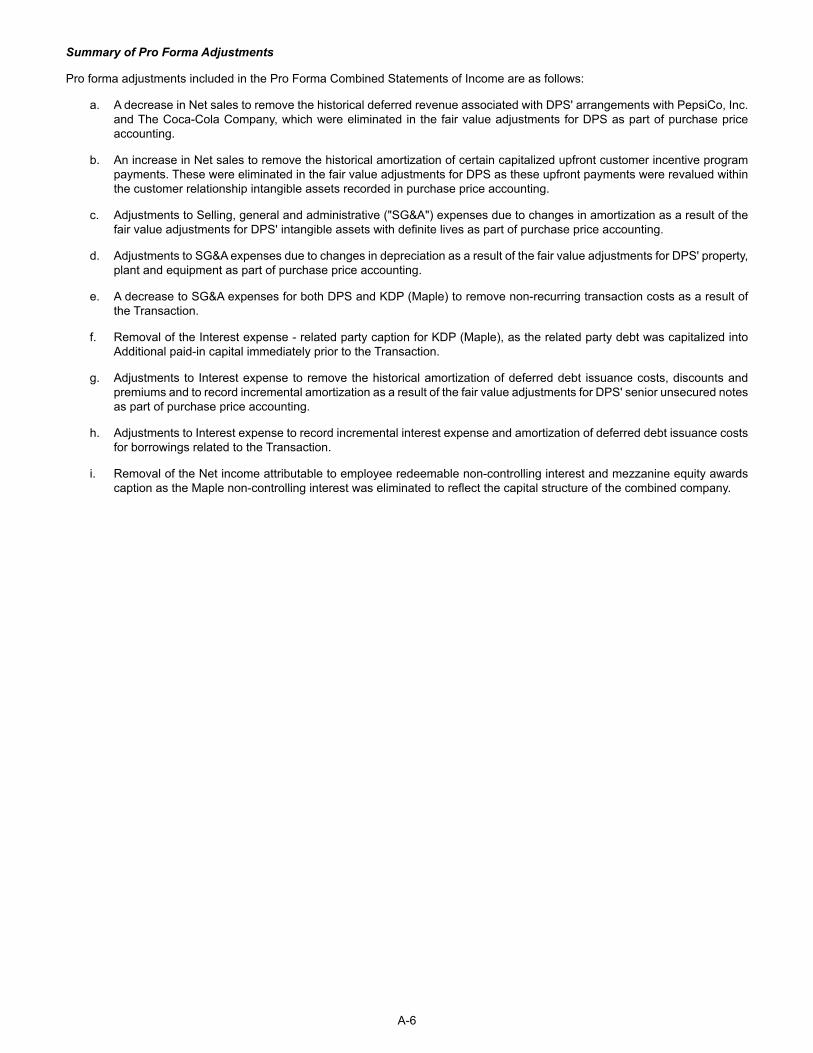
Pro forma adjustments included in the Pro Forma Combined Statements of Income are as follows:
a. A decrease in Net sales to remove the historical deferred revenue associated with DPS' arrangements with PepsiCo, Inc.and The Coca-Cola Company, which were eliminated in the fair value adjustments for DPS as part of purchase priceaccounting.
b. An increase in Net sales to remove the historical amortization of certain capitalized upfront customer incentive programpayments. These were eliminated in the fair value adjustments for DPS as these upfront payments were revalued withinthe customer relationship intangible assets recorded in purchase price accounting.
c. Adjustments to Selling, general and administrative ("SG&A") expenses due to changes in amortization as a result of thefair value adjustments for DPS' intangible assets with definite lives as part of purchase price accounting.
d. Adjustments to SG&A expenses due to changes in depreciation as a result of the fair value adjustments for DPS' property,plant and equipment as part of purchase price accounting.
e. A decrease to SG&A expenses for both DPS and KDP (Maple) to remove non-recurring transaction costs as a result ofthe Transaction.
f. Removal of the Interest expense - related party caption for KDP (Maple), as the related party debt was capitalized intoAdditional paid-in capital immediately prior to the Transaction.
g. Adjustments to Interest expense to remove the historical amortization of deferred debt issuance costs, discounts andpremiums and to record incremental amortization as a result of the fair value adjustments for DPS' senior unsecured notesas part of purchase price accounting.
h. Adjustments to Interest expense to record incremental interest expense and amortization of deferred debt issuance costsfor borrowings related to the Transaction.
i. Removal of the Net income attributable to employee redeemable non-controlling interest and mezzanine equity awardscaption as the Maple non-controlling interest was eliminated to reflect the capital structure of the combined company.
A-6

Keurig Dr Pepper Inc.Pro Forma Condensed Combined Statement of Income
For the Third Quarter of 2018(Unaudited)
(in millions, except per share data)Reported
KDP(1)July 1 - July 9,
2018(2)Pro Forma
Adjustments(3)Pro FormaCombined
Net sales $ 2,732 $ 125 $ (1) $ 2,856Cost of sales 1,367 58 (127) 1,298
Gross profit 1,365 67 126 1,558Selling, general and administrative expenses 1,028 237 (265) 1,000Other operating expense (income), net (8) — — (8)
Income from operations 345 (170) 391 566Interest expense 172 4 2 178Loss on early extinguishment of debt 11 — — 11Other expense (income), net (33) (1) — (34)
Income before provision for income taxes 195 (173) 389 411Provision for income taxes 46 (55) 120 111Net income $ 149 $ (118) $ 269 $ 300Net income attributable to employee redeemable non-controlling interest and mezzanine equity awards — — — —Net income attributable to KDP $ 149 $ (118) $ 269 $ 300Earnings per common share:
Basic $ 0.11 $ 0.22Diluted 0.11 $ 0.21
Weighted average common shares outstanding:Basic 1,361.8 27.2 1,389.0Diluted 1,373.6 27.1 1,400.7
(1) Refer to the Statements of Income at A-1.(2) Refers to DPS's activity during the three months ended September 30, 2018 prior to the Merger Date.(3) Refer to Summary of Pro Forma Adjustments at A-6.
Numbers may not foot due to rounding.
A-7

KEURIG DR PEPPER INC.PRO FORMA CONDENSED COMBINED STATEMENT OF INCOME
For the First Nine Months of 2018(Unaudited)
(in millions, except per share data)Reported
KDP(1)DPS Jan 1 -
July 8, 2018(2)Pro Forma
Adjustments(3)Pro FormaCombined
Net sales $ 4,629 $ 3,605 $ (27) $ 8,207Cost of sales 2,292 1,529 (155) 3,666
Gross profit 2,337 2,076 128 4,541Selling, general and administrative expenses 1,649 1,639 (364) 2,924Other operating expense (income), net (2) (14) 3 (13)
Income from operations 690 451 489 1,630Interest expense 221 88 184 493Interest expense - related party 51 — (51) —Loss on early extinguishment of debt 13 — — 13Other expense (income), net (28) 5 14 (9)
Income before provision for income taxes 433 358 342 1,133Provision for income taxes 110 82 107 299Net income 323 276 235 834Net income attributable to employee redeemable non-controllinginterest and mezzanine equity awards 3 — (3) —Net income attributable to KDP $ 320 $ 276 $ 238 $ 834Earnings per common share:
Basic $ 0.33 $ 0.60Diluted 0.32 0.60
Weighted average common shares outstanding:Basic 983.0 406.0 1,389.0Diluted 994.1 405.9 1,400.0
(1) Refer to the Statements of Income.(2) Refers to DPS's activity during the nine months ended September 30, 2018 prior to the Merger Date.(3) Refer to Summary of Pro Forma Adjustments on A-6.
Numbers may not foot due to rounding.
A-8

KEURIG DR PEPPER INC.RECONCILIATION OF PRO FORMA SEGMENT INFORMATION
(Unaudited)
(in millions)Reported
KDP(1)DPS July 1 - July
8, 2018(2)Pro Forma
Adjustments(3)Pro FormaCombined
For the Third Quarter of 2018Net Sales
Coffee Systems $ 1,053 $ — $ — $ 1,053Packaged Beverages 1,238 98 — 1,336Beverage Concentrates 317 15 (1) 331Latin America Beverages 124 12 — 136
Total net sales $ 2,732 $ 125 $ (1) $ 2,856
Income from OperationsCoffee Systems $ 334 $ — $ — $ 334Packaged Beverages 61 2 99 162Beverage Concentrates 193 (5) 16 204Latin America Beverages 15 2 10 27Unallocated corporate costs (258) (169) 266 (161)
Total income from operations $ 345 $ (170) $ 391 $ 566
(in millions)Reported
KDP(1)DPS Jan 1 - July
8, 2018(2)Pro Forma
Adjustments(3)Pro FormaCombined
For the First Nine Months of 2018Net Sales
Coffee Systems $ 2,950 $ — $ — $ 2,950
Packaged Beverages 1,238 2,654 — 3,892
Beverage Concentrates 317 689 (27) 979
Latin America Beverages 124 262 — 386
Total net sales $ 4,629 $ 3,605 $ (27) $ 8,207
Income from OperationsCoffee Systems $ 865 $ — $ (3) $ 862
Packaged Beverages 61 299 119 479
Beverage Concentrates 193 436 (11) 618
Latin America Beverages 15 42 8 65
Unallocated Corporate (444) (326) 376 (394)
Total income from operations $ 690 $ 451 $ 489 $ 1,630(1) Refer to the Statements of Income on A-1.(2) Refers to DPS's activity during the three months and nine months ended September 30, 2018 prior to the Merger Date.(3) Refer to Summary of Pro Forma Adjustments on A-6.
Numbers may not foot due to rounding.
A-9

KEURIG DR PEPPER INC.RECONCILIATION OF CERTAIN NON-GAAP INFORMATION
(Unaudited)
The company reports its financial results in accordance with U.S. GAAP. However, management believes that certain non-GAAP financial measures that reflect the way management evaluates the business may provide investors with additional informationregarding the company's results, trends and ongoing performance on a comparable basis.
For periods that occur in 2019, management compares the Adjusted GAAP, which is defined as U.S. GAAP results adjustedfor certain items affecting comparability, for the third quarter and first nine months of 2019 to Adjusted Pro Forma, which is definedas Pro Forma results adjusted for certain items affecting comparability, for the third quarter and first nine months of 2018. Pro Formainformation is no longer prepared as the third quarter and first nine months of 2019 reflects DPS and Maple as a combined companyfor the entire period.
Specifically, investors should consider the following with respect to our financial results:
Adjusted: Defined as certain financial statement captions and metrics adjusted for certain items affecting comparability.
Items affecting comparability: Defined as certain items that are excluded for comparison to prior year periods, adjusted forthe tax impact as applicable. Tax impact is determined based upon an approximate rate for each item. For each period, managementadjusts for (i) the unrealized mark-to-market impact of derivative instruments not designated as hedges in accordance with U.S.GAAP and do not have an offsetting risk reflected within the financial results; (ii) the amortization associated with definite-livedintangible assets; (iii) the amortization of the deferred financing costs associated with the DPS Merger and Keurig Acquisition; (iv)the amortization of the fair value adjustment of the senior unsecured notes obtained as a result of the DPS Merger; (v) stockcompensation expense attributable to the matching awards made to employees who made an initial investment in the Keurig GreenMountain, Inc. Executive Ownership Plan or the Keurig Dr Pepper Omnibus Incentive Plan of 2009; and (vi) other certain items thatare excluded for comparison purposes to prior year periods.
Prior to the second quarter of 2019, we did not add back the amortization of the fair value adjustment of the senior unsecureddebt recognized as a result of the purchase price allocation for the DPS Merger. As this item is similar to the amortization ofintangibles, we changed our method of computing Adjusted Pro Forma (2018) results to exclude the amortization of the fair valueadjustment of the senior unsecured notes in order to reflect how management views our business results on a consistent basis.
For the third quarter and first nine months of 2019, the other certain items excluded for comparison purposes include (i)restructuring and integration expenses; (ii) expenses associated with our productivity projects; (iii) transaction costs not associatedwith the DPS Merger; (iv) provision for legal settlements; (v) the impact of the step-up of acquired inventory not associated with theDPS Merger (vi) the loss on early extinguishment of debt related to the redemption of debt and (vii) the loss related to the malwareincident.
For the third quarter and first nine months of 2018, the other certain items excluded for comparison purposes include (i)restructuring and integration expenses; (ii) expenses associated with our productivity projects; (iii) provisions for legal settlements;(iv) the loss on early extinguishment of debt related to the redemption of debt; and (v) tax reform associated with the TCJA.
Reconciliations for these items are provided in the tables below.
A-10

KEURIG DR PEPPER INC.RECONCILIATION OF CERTAIN REPORTED ITEMS TO CERTAIN NON-GAAP ADJUSTED ITEMS
For the Third Quarter of 2019 (Unaudited, in millions, except per share data)
Cost of sales Gross profit Gross marginSelling, general and
administrative expenses
Other operatingexpense
(income), netIncome fromoperations
Operatingmargin
Reported $ 1,245 $ 1,625 56.6% $ 1,012 $ 33 $ 580 20.2%Items Affecting Comparability:
Mark to market (5) 5 (4) — 9Amortization of intangibles — — (31) — 31Stock compensation — — (3) — 3Restructuring and integration costs 1 (1) (54) (24) 77Productivity (10) 10 (12) (13) 35Transaction costs — — (7) — 7Provision for settlements — — (12) — 12
Adjusted GAAP $ 1,231 $ 1,639 57.1% $ 889 $ (4) $ 754 26.3%
Interestexpense
Income before provisionfor income taxes
Provision forincome taxes
Effectivetax rate Net income
WeightedAverage Diluted
sharesDiluted earnings
per shareReported $ 158 $ 413 $ 109 26.4% $ 304 1,419.4 $ 0.21Items Affecting Comparability:
Mark to market 1 8 — 8 0.01Amortization of intangibles — 31 9 22 0.02Amortization of deferred financing costs (3) 3 1 2 —Amortization of fair value debt adjustment (7) 7 3 4 —Stock compensation — 3 — 3 —Restructuring and integration costs — 77 13 64 0.04Productivity — 35 8 27 0.02Transaction costs (4) 11 3 8 0.01Provision for settlements — 12 3 9 0.01
Adjusted GAAP $ 145 $ 600 $ 149 24.8% $ 451 1,419.4 $ 0.32
Diluted earnings per common share may not foot due to rounding.
A-11

KEURIG DR PEPPER INC.RECONCILIATION OF CERTAIN REPORTED ITEMS TO CERTAIN NON-GAAP ADJUSTED ITEMS
For the Third Quarter of 2018 (Unaudited, in millions, except per share data)
Cost of sales Gross profit Gross marginSelling, general and
administrative expensesIncome fromoperations
Operatingmargin
Pro Forma $ 1,298 $ 1,558 54.6% $ 1,000 $ 566 19.8%Items Affecting Comparability:
Mark to market (27) 27 1 26Amortization of intangibles — — (30) 30Stock compensation — — (4) 4Restructuring and integration costs — — (47) 47Productivity (5) 5 (7) 12Transaction costs — — (2) 2Provision for settlements — — (11) 11
Adjusted Pro Forma $ 1,266 $ 1,590 55.7% $ 900 $ 698 24.4%
Interestexpense
Loss on earlyextinguishment
of debt
Otherexpense
(income), net
Income beforeprovision forincome taxes
Provisionfor income
taxesEffectivetax rate
Netincome
WeightedAverageDilutedshares
Dilutedearningsper share
Pro Forma $ 178 $ 11 $ (34) $ 411 $ 111 27.0% $ 300 1,400.7 $ 0.21Items Affecting Comparability:
Mark to market (7) — (2) 35 8 27 0.02Amortization of intangibles — — — 30 8 22 0.02Amortization of deferred financing costs (4) — — 4 1 3 —Amortization of fair value debt adjustment (6) — — 6 2 4 —Stock compensation — — — 4 1 3 —Restructuring and integration costs — — — 47 17 30 0.02Productivity 2 — — 10 3 7 —Transaction costs (1) — — 3 1 2 —Loss on early extinguishment of debt — (11) — 11 3 8 0.01Provision for settlements — — — 11 3 8 0.01Tax reform — — — — (3) 3 —
Adjusted Pro Forma $ 162 $ — $ (36) $ 572 $ 155 27.1% $ 417 1,400.7 $ 0.30
Numbers may not foot due to rounding.
A-12

KEURIG DR PEPPER INC.RECONCILIATION OF CERTAIN REPORTED ITEMS TO CERTAIN NON-GAAP ADJUSTED ITEMS
For the First Nine Months of 2019 (Unaudited, in millions, except per share data)
Cost of sales Gross profitGrossmargin
Selling, generaland administrative
expenses
Other operatingexpense
(income), net
Incomefrom
operationsOperating
marginReported $ 3,537 $ 4,649 56.8% $ 2,951 $ 33 $ 1,665 20.3%Items Affecting Comparability:
Mark to market (6) 6 5 — 1Amortization of intangibles — — (94) — 94Stock compensation — — (18) — 18Restructuring and integration costs (1) 1 (151) (24) 176Productivity (14) 14 (41) (22) 77Transaction costs — — (8) — 8Inventory Step-Up (3) 3 — — 3Provision for settlements — — (27) — 27Malware Incident (2) 2 (6) — 8
Adjusted GAAP $ 3,511 $ 4,675 57.1% $ 2,611 $ (13) $ 2,077 25.4%
Interestexpense
Loss on earlyextinguishment
of debt
Income beforeprovision forincome taxes
Provisionfor income
taxesEffectivetax rate
Netincome
WeightedAverageDilutedshares
Dilutedearningsper share
Reported $ 497 $ 9 $ 1,144 $ 296 25.9% $ 848 1,418.8 $ 0.60Items Affecting Comparability:
Mark to market (44) — 45 11 34 0.02Amortization of intangibles — — 94 26 68 0.05Amortization of deferred financing costs (10) — 10 3 7 0.01Amortization of fair value debt adjustment (20) — 20 5 15 0.01Stock compensation — — 18 4 14 0.01Restructuring and integration costs — — 176 39 137 0.10Productivity — — 77 17 60 0.04Transaction costs (16) — 24 6 18 0.01Loss on early extinguishment of debt — (9) 9 2 7 —Inventory Step-Up — — 3 1 2 —Provision for settlements — — 27 7 20 0.01Malware Incident — — 8 2 6 —
Adjusted GAAP $ 407 $ — $ 1,655 $ 419 25.3% $ 1,236 1,418.8 $ 0.87
Diluted earnings per common share may not foot due to rounding.
A-13

KEURIG DR PEPPER INC.RECONCILIATION OF CERTAIN REPORTED ITEMS TO CERTAIN NON-GAAP ADJUSTED ITEMS
For the First Nine Months of 2018 (Unaudited, in millions, except per share data)
Net sales Cost of sales Gross profitGrossmargin
Selling, general andadministrative
expenses
Other operatingexpense
(income), net
Incomefrom
operationsOperating
marginPro Forma $ 8,207 $ 3,666 $ 4,541 55.3% $ 2,924 $ (13) $ 1,630 19.9%Items Affecting Comparability:
Mark to market — (43) 43 10 — 33Amortization of intangibles — — — (89) — 89Stock compensation — — — (16) — 16Restructuring and integration costs — — — (86) — 86Productivity — (11) 11 (12) (4) 27Transaction costs — — — (2) — 2Provision for settlements 4 — 4 (11) — 15
Adjusted Pro Forma $ 8,211 $ 3,612 $ 4,599 56.0% $ 2,718 $ (17) $ 1,898 23.1%
Interestexpense
Loss on earlyextinguishment
of debt
Otherexpense
(income), net
Income beforeprovision forincome taxes
Provisionfor income
taxesEffectivetax rate
Netincome
WeightedAverageDilutedshares
Dilutedearningsper share
Pro Forma $ 493 $ 13 $ (9) $ 1,133 $ 299 26.4% $ 834 1,400.0 $ 0.60Items Affecting Comparability:
Mark to market 30 — 4 (1) (1) — —Amortization of intangibles — — — 89 23 66 0.05Amortization of deferred financing costs (5) — — 5 1 4 —Amortization of fair value debt adjustment (16) — — 16 4 12 0.01Stock compensation — — — 16 3 13 0.01Restructuring and integration costs — — — 86 23 63 0.05Productivity — — — 27 8 19 0.01Transaction costs (1) — — 3 1 2 —Loss on early extinguishment of debt — (13) — 13 3 10 0.01Provision for settlements — — — 15 4 11 0.01Tax reform — — — — 4 (4) —
Adjusted Pro Forma $ 501 $ — $ (5) $ 1,402 $ 372 26.5% $ 1,030 1,400.0 $ 0.74
Numbers may not foot due to rounding.
A-14

KEURIG DR PEPPER INC.RECONCILIATION OF SEGMENT ITEMS TO CERTAIN NON-GAAP ADJUSTED SEGMENT ITEMS
(Unaudited)
(in millions) ReportedItems AffectingComparability
AdjustedGAAP
For the third quarter of 2019:Net Sales
Coffee Systems $ 1,065 $ — $ 1,065
Packaged Beverages 1,307 — 1,307
Beverage Concentrates 360 — 360
Latin America Beverages 138 — 138
Total net sales $ 2,870 $ — $ 2,870
Income from OperationsCoffee Systems $ 310 $ 57 $ 367
Packaged Beverages 196 5 201
Beverage Concentrates 245 (1) 244
Latin America Beverages 25 — 25
Unallocated corporate costs (196) 113 (83)
Total income from operations $ 580 $ 174 $ 754
(in millions) Pro FormaItems AffectingComparability
Adjusted ProForma
For the third quarter of 2018:Net Sales
Coffee Systems $ 1,053 $ — $ 1,053
Packaged Beverages 1,336 — 1,336
Beverage Concentrates 331 — 331
Latin America Beverages 136 — 136
Total net sales $ 2,856 $ — $ 2,856
Income from OperationsCoffee Systems $ 334 $ 46 $ 380
Packaged Beverages 162 2 164
Beverage Concentrates 204 — 204
Latin America Beverages 27 — 27
Unallocated corporate costs (161) 84 (77)
Total income from operations $ 566 $ 132 $ 698
Numbers may not foot due to rounding.
A-15

KEURIG DR PEPPER INC.RECONCILIATION OF SEGMENT ITEMS TO CERTAIN NON-GAAP ADJUSTED SEGMENT ITEMS
(Unaudited)
(in millions) ReportedItems AffectingComparability
AdjustedGAAP
For the first nine months of 2019:Net Sales
Coffee Systems $ 3,023 $ — $ 3,023
Packaged Beverages 3,734 — 3,734
Beverage Concentrates 1,034 — 1,034
Latin America Beverages 395 — 395
Total net sales $ 8,186 $ — $ 8,186
Income from OperationsCoffee Systems $ 890 $ 143 $ 1,033
Packaged Beverages 531 20 551
Beverage Concentrates 690 1 691
Latin America Beverages 62 (5) 57
Unallocated corporate costs (508) 253 (255)
Total income from operations $ 1,665 $ 412 $ 2,077
(in millions) Pro FormaItems AffectingComparability
Adjusted ProForma
For the first nine months of 2018:Net Sales
Coffee Systems $ 2,950 $ 4 $ 2,954
Packaged Beverages 3,892 — 3,892
Beverage Concentrates 979 — 979
Latin America Beverages 386 — 386
Total net sales $ 8,207 $ 4 $ 8,211
Income from OperationsCoffee Systems $ 862 $ 134 $ 996
Packaged Beverages 479 6 485
Beverage Concentrates 618 1 619
Latin America Beverages 65 — 65
Unallocated corporate costs (394) 127 (267)
Total income from operations $ 1,630 $ 268 $ 1,898
Numbers may not foot due to rounding.
A-16

KEURIG DR PEPPER INC.RECONCILIATION OF ADJUSTED EBITDA AND MANAGEMENT LEVERAGE RATIO
(Unaudited)
(in millions, except for ratio)
ADJUSTED EBITDA RECONCILIATION - LAST TWELVE MONTHSNet income $ 1,111
Interest expense 675
Provision for income taxes 390
Loss on early extinguishment of debt 9
Other (income) expense, net 24
Depreciation expense 351
Amortization of intangibles 127
EBITDA $ 2,687
Items affecting comparability:Restructuring and integration expenses $ 260
Transaction costs 10
Productivity 72
Provision for settlements 34
Stock compensation 23
Malware incident 8
Mark to market 41
Step-up of acquired inventory 5
Adjusted EBITDA $ 3,140
September 30,2019
Principal amounts of:
Commercial paper $ 1,415
Term loan 1,710
Senior unsecured notes 11,975
Total principal amounts 15,100
Less: Cash and cash equivalents 74
Total principal amounts less cash and cash equivalents $ 15,026
September 30, 2019 Management Leverage Ratio 4.8
A-17

KEURIG DR PEPPER INC.RECONCILIATION OF ADJUSTED EBITDA - LAST TWELVE MONTHS
(Unaudited)
PRO FORMA
(in millions)
FOURTHQUARTEROF 2018
FIRST NINEMONTHSOF 2019
LASTTWELVEMONTHS
Net income $ 263 $ 848 $ 1,111
Interest expense 178 497 675
Provision for income taxes 94 296 390
Loss on early extinguishment of debt — 9 9
Other (income) expense, net 9 15 24
Depreciation expense 80 271 351
Amortization of intangibles 33 94 127
EBITDA $ 657 $ 2,030 $ 2,687
Items affecting comparability:Restructuring and integration expenses $ 84 $ 176 $ 260
Transaction costs 2 8 10
Productivity 3 69 72
Provision for settlements 7 27 34
Stock compensation 5 18 23
Malware incident — 8 8
Mark to market 40 1 41
Step-up of acquired inventory 2 3 5
Adjusted EBITDA $ 800 $ 2,340 $ 3,140
A-18
KEURIG DR PEPPER INC.RECONCILIATION OF NET CASH PROVIDED BY OPERATING ACTIVITIES TO FREE CASH FLOW
(Unaudited)
Free cash flow is defined as net cash provided by operating activities adjusted for purchases of property, plant and equipment,proceeds from sales of property, plant and equipment, and certain items excluded for comparison to prior year periods. For the firstnine months of 2019 and 2018, there were no certain items excluded for comparison to prior year periods.
First Nine Months(in millions) 2019 2018Net cash provided by operating activities 1,803 1,063
Purchases of property, plant and equipment (208) (104)Proceeds from sales of property, plant and equipment 19 1
Free Cash Flow $ 1,614 $ 960

RECONCILIATION OF CERTAIN ADJUSTED FINANCIAL RESULTS TO CERTAIN CURRENCY NEUTRAL ADJUSTED FINANCIAL RESULTS
(Unaudited)
Adjusted net sales, adjusted income from operations and adjusted earnings per share, as adjusted to currency neutral: Theseadjusted financial results are calculated on a currency neutral basis by converting our current-period local currency financial resultsusing the prior-period foreign currency exchange rates.
For the Third Quarter of 2019
Coffee Packaged BeverageLatin
AmericaPercent change Systems Beverages Concentrates Beverages Total
Adjusted net sales 1.1% (2.2)% 8.8% 1.5% 0.5%
Impact of foreign currency 0.1% 0.1 % —% 2.2% 0.2%Adjusted net sales, as adjusted to currency neutral 1.2% (2.1)% 8.8% 3.7% 0.7%
For the Third Quarter of 2019
Coffee Packaged BeverageLatin
AmericaPercent change Systems Beverages Concentrates Beverages TotalAdjusted income from operations (3.4)% 22.6% 19.6% (7.4)% 8.0%
Impact of foreign currency — % —% —% 3.7 % 0.2%Adjusted income from operations, as adjusted tocurrency neutral (3.4)% 22.6% 19.6% (3.7)% 8.2%
For the First Nine Months of 2019
Coffee Packaged BeverageLatin
AmericaPercent change Systems Beverages Concentrates Beverages Total
Adjusted net sales 2.3% (4.1)% 5.6% 2.3% (0.3)%
Impact of foreign currency 0.5% 0.1 % 0.2% 1.1% 0.3 %Adjusted net sales, as adjusted to currency neutral 2.8% (4.0)% 5.8% 3.4% — %
For the First Nine Months of 2019
Coffee Packaged BeverageLatin
AmericaPercent change Systems Beverages Concentrates Beverages TotalAdjusted income from operations 3.7% 13.6% 11.6% (12.3)% 9.4%
Impact of foreign currency 0.3% —% 0.3% — % 0.3%Adjusted income from operations, as adjusted to currencyneutral 4.0% 13.6% 11.9% (12.3)% 9.7%
For the ThirdQuarter of 2019
For the First NineMonths of 2019
Adjusted diluted earnings per share $ 0.32 $ 0.87Impact of foreign currency — —
Adjusted diluted earnings per share, as adjusted to currency neutral $ 0.32 $ 0.87
A-19