KETU NORTH DISTRICT
85
KETU NORTH DISTRICT
Transcript of KETU NORTH DISTRICT

KETU NORTH DISTRICT

ii
Copyright © 2014 Ghana Statistical Service

iii
PREFACE AND ACKNOWLEDGEMENT
No meaningful developmental activity can be undertaken without taking into account the
characteristics of the population for whom the activity is targeted. The size of the population
and its spatial distribution, growth and change over time, in addition to its socio-economic
characteristics are all important in development planning.
A population census is the most important source of data on the size, composition, growth
and distribution of a country’s population at the national and sub-national levels. Data from
the 2010 Population and Housing Census (PHC) will serve as reference for equitable
distribution of national resources and government services, including the allocation of
government funds among various regions, districts and other sub-national populations to
education, health and other social services.
The Ghana Statistical Service (GSS) is delighted to provide data users, especially the
Metropolitan, Municipal and District Assemblies, with district-level analytical reports based
on the 2010 PHC data to facilitate their planning and decision-making.
The District Analytical Report for the Ketu North District is one of the 216 district census
reports aimed at making data available to planners and decision makers at the district level. In
addition to presenting the district profile, the report discusses the social and economic
dimensions of demographic variables and their implications for policy formulation, planning
and interventions. The conclusions and recommendations drawn from the district report are
expected to serve as a basis for improving the quality of life of Ghanaians through evidence-
based decision-making, monitoring and evaluation of developmental goals and intervention
programmes.
For ease of accessibility to the census data, the district report and other census reports
produced by the GSS will be disseminated widely in both print and electronic formats. The
report will also be posted on the GSS website: www.statsghana.gov.gh.
The GSS wishes to express its profound gratitude to the Government of Ghana for providing
the required resources for the conduct of the 2010 PHC. While appreciating the contribution
of our Development Partners (DPs) towards the successful implementation of the Census, we
wish to specifically acknowledge the Department for Foreign Affairs, Trade and
Development (DFATD) formerly the Canadian International Development Agency (CIDA)
and the Danish International Development Agency (DANIDA) for providing resources for
the preparation of all the 216 district reports. Our gratitude also goes to the Metropolitan,
Municipal and District Assemblies, the Ministry of Local Government, Consultant Guides,
Consultant Editors, Project Steering Committee members and their respective institutions for
their invaluable support during the report writing exercise. Finally, we wish to thank all the
report writers, including the GSS staff who contributed to the preparation of the reports, for
their dedication and diligence in ensuring the timely and successful completion of the district
census reports.
Dr. Philomena Nyarko
Government Statistician
iv
TABLE OF CONTENTS
PREFACE AND ACKNOWLEDGEMENT ....................................................................... iii
LIST OF TABLES .................................................................................................................. vi
LIST OF FIGURES ............................................................................................................... vii
ACRONYMS AND ABBREVIATIONS ............................................................................ viii
EXECUTIVE SUMMARY .................................................................................................... ix
CHAPTER ONE: INTRODUCTION ................................................................................... 1 1.1 Background ................................................................................................................. 1 1.2 Physical features .......................................................................................................... 1
1.3 Political administration ............................................................................................... 3 1.4 Social and Cultural Structure ...................................................................................... 3
1.5 Economy...................................................................................................................... 4 1.6 Census Methodology, Concepts and Definitions ........................................................ 5 1.7 Organization of the Report ........................................................................................ 14
CHAPTER TWO: DEMOGRAPHIC CHARACTERISTICS ......................................... 16 2.1 Introduction ............................................................................................................... 16 2.2 Population size and distribution ................................................................................ 16
2.3 Age-dependency ratios .............................................................................................. 16 2.4 Age-sex structure....................................................................................................... 17 2.5 Fertility, Mortality and Migration ............................................................................. 18
CHAPTER THREE: SOCIAL CHARACTERISTICS .................................................... 23 3.1 Introduction ............................................................................................................... 23
3.2 Household size, composition and headship............................................................... 23 3.3 Marital status ............................................................................................................. 25
3.4 Nationality ................................................................................................................. 28 3.5 Religious affiliation ................................................................................................... 29 3.6 Literacy and education .............................................................................................. 29
CHAPTER FOUR: ECONOMIC CHARACTERISTICS ............................................... 33 4.1 Introduction ............................................................................................................... 33 4.2 Economic activity status............................................................................................ 33 4.3 Occupation ................................................................................................................ 36 4.4 Industry...................................................................................................................... 36
4.5 Employment status .................................................................................................... 37 4.6 Employment sector .................................................................................................... 38
CHAPTER FIVE: INFORMATION COMMUNICATION TECHNOLOGY .............. 39 5.1 Introduction ............................................................................................................... 39 5.2 Ownership of mobile phones..................................................................................... 39 5.3 Use of internet ........................................................................................................... 39 5.4 Household ownership of fixed telephone lines ......................................................... 39 5.4 Household ownership of desktop or laptop computer ............................................... 40
CHAPTER SIX: DISABILITY ........................................................................................... 41 6.1 Introduction .............................................................................................................. 41 6.2 Population with disability.......................................................................................... 41
6.3 Types of disability ..................................................................................................... 42 6.4 Distribution of Disability by type of locality ............................................................ 42
v
6.5 Disability and economic activity status ..................................................................... 43 6.6 Disability and level of education ............................................................................... 44
CHAPTER SEVEN: AGRICULTURAL ACTIVITY ...................................................... 46 7.1 Introduction ............................................................................................................... 46 7.2 Households in agriculture.......................................................................................... 46
7.3 Types of livestock and other animals ........................................................................ 47
CHAPTER EIGHT: HOUSING CONDITIONS ............................................................... 48 8.1 Introduction ............................................................................................................... 48 8.2 Housing stock ............................................................................................................ 48 8.3 Types of dwelling and ownership ............................................................................. 49
8.4 Construction materials............................................................................................... 50 8.5 Room occupancy ....................................................................................................... 52
8.6 Access to utilities and household facilities ............................................................... 53 8.7 Main source of water for drinking and other domestic use ....................................... 55 8.8 Bathing and toilet facilities ....................................................................................... 56 8.9 Method of waste disposal .......................................................................................... 57
CHAPTER NINE: SUMMARY OF FINDINGS, CONCLUSIONS AND POLICY
IMPLICATIONS ................................................................................. 58 9.1 Summary of findings ................................................................................................. 58
9.2 Conclusion ................................................................................................................. 64 9.3 Policy implications .................................................................................................... 65
9.4 Occupation and industry............................................................................................ 66
REFERENCES ....................................................................................................................... 68
APPENDICES ........................................................................................................................ 69
LIST OF CONTRIBUTORS ................................................................................................ 72

vi
LIST OF TABLES
Table 1.1: Major Festivals in the Ketu North District ............................................................. 3
Table 2.1: Population by age, sex and type of locality .......................................................... 17
Table 2.2: Reported total fertility rate, general fertility rate and crude birth rate by district . 19
Table 2.3: Female population 12 years and older by age, children ever born, children
surviving and sex of child .................................................................................... 20
Table 2.4: Total population, deaths in households and crude death rate, by district ............ 20
Table 2.5: Birthplace by duration of residence of migrants .................................................. 22
Table 3.1: Household population and size by locality .......................................................... 23
Table 3.2: Household composition and sex .......................................................................... 24
Table 3.3: Household structure by sex .................................................................................. 25
Table 3.4: Persons 12 and older by sex, age-group and marital status ................................. 26
Table 3.5: Persons 12 years and older by sex, marital status and level of education ........... 27
Table 3.6: Marital status of persons 12 years and older by sex and activity status .............. 28
Table 3.7: Population by nationality and sex ........................................................................ 29
Table 3.8: Population by religion and sex ............................................................................ 29
Table 3.9: Population 11 years and older by sex, age and literacy status ............................. 30
Table 3.10: Population 3 years and older by level of education, school attendance and sex . 33
Table 4.1: Population 15 years and older by activity status and sex .................................... 34
Table 4.2: Population 15 years and older by sex, age and activity status ............................. 35
Table 4.3: Employed population 15 years and older by occupation and sex ........................ 36
Table 4.4: Employed population 15 years and older by industry and sex ............................ 37
Table 4.5: Population 15 years and older by employment status and sex ............................ 38
Table 4.6: Employed population 15 years and older by employment sector and sex ........... 38
Table 5.1: Population 12 years and older by sex, mobile phone ownership and internet ..... 39
facility usage ........................................................................................................ 39
Table 5.2: Household heads by sex, ownership of desktop/laptop computers and fixed ...... 40
telephone lines ..................................................................................................... 40
Table 6.1: Disability status of population by type of locality and sex .................................. 42
Table 6.2: Persons 15 years and older with disability by sex and economic ........................ 43
activity status ....................................................................................................... 43
Table 6.3: Persons 3 years and older by sex, disability type and level of education ............ 45
Table 7.1: Agricultural activity of household members by locality ..................................... 46
Table 7.2: Distribution of livestock, other animals and keepers........................................... 47
vii
Table 8.1: Stock of houses and households .......................................................................... 48
Table 8.2: Type of dwelling by sex of household head and type of locality ........................ 49
Table 8.3: Ownership status of dwelling units by sex of household head and type.............. 50
of locality ............................................................................................................. 50
Table 8.4: Main construction material for outer wall .......................................................... 51
Table 8.5: Main construction materials for the floor ........................................................... 51
Table 8.6: Main construction material for roofing............................................................... 52
Table 8.7: Household size and number of sleeping rooms occupied in dwelling unit ........ 53
Table 8.8: Main source of lighting ....................................................................................... 53
Table 8.9: Main source of cooking fuel, and cooking space used by households ............... 54
Table 8.10: Main source of water for drinking and other domestic purposes ....................... 55
Table 8.11: Type of toilet facility and bathing facility used by household by type of .......... 56
locality................................................................................................................ 56
Table 8.12: Method of solid and liquid waste disposal by type of locality .......................... 57
Table A1: Household composition by type of locality ....................................................... 69
Table A2: Population by sex, number of households and houses in the 20 largest ............ 70
communities ....................................................................................................... 70
Table A3: Population by age group in the 20 largest communities .................................... 71
LIST OF FIGURES
Figure 1.1: Map of Ketu North District ................................................................................... 2
Figure 2.1: Population pyramid by age and sex ..................................................................... 18
Figure 2.2: Reported age specific death rate by sex .............................................................. 21
Figure 3.1: School attendance by sex .................................................................................... 31
viii
ACRONYMS AND ABBREVIATIONS
CBR: Crude Birth Rate
CDR: Crude Death Rate
CEB: Children Ever Born
CIDA: Canadian International Development Agency
CS: Children Surviving
CEDAW: Convention on Elimination of All forms of Discrimination
CERSGIS: Centre for Remote Sensing and Geographic Information Survey
DANIDA: Danish International Development Agency
DFID: Department for International Development
DPCU: District Planning and Coordinating Unit
ECOWAS: Economic Community of West African States
EA: Enumeration Area
EU: European Union
fCUBE: Free Compulsory Universal Basic Education
GDP: Gross Domestic product
GFR: General Fertility Rate
GSS: Ghana Statistical Service
GDHS: Ghana Demographic and Health Survey
ICT: Information Communication Technology
JSS: Junior Secondary School
JHS: Junior High School
SSS: Senior Secondary School
SHS: Senior High School
MDAs: Ministries, Departments and Agencies
MMDAs: Metropolitan, Municipal and District Assemblies
MDGs: Millennium Development Goals
NCSC: National Census Steering Committee
NGOs: Non-governmental Organisations
PDD: Portable Digital Device
PHC: Population and Housing Census
PES: Post Enumeration Survey
PWDs: Persons with disabilities
UN: United Nations
UNFPA: United Nations Population Fund
W.C: Water Closet

ix
EXECUTIVE SUMMARY
Introduction
The district census report is the first of its kind since the first post-independence census was
conducted in 1960. The report provides basic information about the district. It gives a brief
background of the district, describing its physical features, political and administrative
structure, socio-cultural structure and economy. Using data from the 2010 Population and
Housing Census (2010 PHC), the report discusses the population characteristics of the district,
fertility, mortality, migration, marital status, literacy and education, economic activity status,
occupation, employment; Information Communication Technology (ICT), disability,
agricultural activities and housing conditions of the district. The key findings of the analysis are
as follows (references are to the relevant sections of the report):
Population size, structure and composition
The population of Ketu North District, according to the 2010 Population and Housing Census,
is 99,913 representing 4.7 percent of the region’s total population. Males constitute 46.5 percent
and females represent 53.5 percent. Nearly Sixty-six percent (65.8%) of the population is rural.
The district has a sex ratio of 87.2. The population of the district is youthful (43.0%) depicting a
broad base population pyramid which tapers off with a small number of elderly persons (6.5%).
The total age dependency ratio for the District is 82.3, the age dependency ratio for males is
higher (87.3) than that of females (77.8).
Fertility, mortality and migration
The Total Fertility Rate for the district 3.4. The General Fertility Rate is 99.1 births per 1000
women aged 15-49 years which is among the highest in the region. The Crude Birth Rate
(CBR) is 24.4 per 1000 population. The crude death rate for the district is 9.1 per 1000. The
death rate for males is highest for age 70 and above representing 42 deaths per 1000 population
while for the females, the highest death rate of 25 deaths per 1000 population is for ages 65-69.
Majority of migrants (65.9 percent) living in the district were born in different localities in the
region, while 25.1 percent were born elsewhere in other regions including Greater Accra,
Eastern and Ashanti.
Household Size, composition and structure
The district has a household population of 98,571 with a total number of 26,437 households.
The average household size in the district is 3.7 persons per household. Children constitute the
largest proportion of the household structure accounting for 40.2 percent. Spouses form about
9.9 percent. Nuclear households (head, spouse(s) and children) constitute 28.0 percent of the
total number of households in the district.
Marital status
About five in ten (46.1%) of the population aged 12 years and older are married, 36.0 percent
have never married,10.0 percent are in consensual unions, 4.4 percent are widowed, 3.2
percent are divorced. By age 25-29 years, more than half of females (58.7%) are married
compared to a little above one-third of males (34.9%). At age 65 and above, widowed
females account for as high as 62.0 percent while widowed males account for only 14.1
percent. . Among the married, 38.8percent have no education while about 7.9 percent of the
unmarried have never been to school. More than eighty percent (85.6%) of the married
x
population are employed, 1.7 percent are unemployed and 12.6 percent are economically not
active. A greater proportion of those who have never married (66.5%) are economically not
active with 2.2 percent unemployed.
Nationality
The proportion of Ghanaians by birth in the district is 81.4 percent. Those who have
naturalised constitute 4.5 percent and the non-Ghanaian population in the district is 0.5
percent.
Literacy and education
Of the population 11 years and above, 69.5 percent are literate and 30.5 percent are non-
literate. The proportion of literate males is higher (83.7 %) than that of females (57.8%).
Eight out of ten people (71.5%) indicated they could speak and write both English and
Ghanaian languages. Of the population aged 3 years and above (110,282) in the district, 27.9
percent has never attended school, 37.7 percent are currently attending and 34.4 percent have
attended in the past.
Economic Activity Status
About 70.2 percent of the population aged 15 years and older are economically active while
29.8 per cent are economically not active. Of the economically active population, 97.2
percent are employed while 2.8 percent are unemployed. For those who are economically not
active, a larger percentage of them are students (47.7%), 20.3% perform household duties and
7.6 percent are disabled or too sick to work. Seven out of ten unemployed are seeking work
for the first time.
Occupation
Of the employed population, about 47.1 percent are engaged as skilled agricultural, forestry
and fishery workers, 16.7 percent in service and sales, 19.8 percent in craft and related trade,
and 6.5 percent are engaged as managers, professionals, and technicians.
Employment status and sector
Of the population 15 years and older 77.3 percent are self-employed without employees, 8.0
percent are contributing family workers, 1.9 percent are casual workers and 0.5 percent are
domestic employees (house helps). Overall, men constitute the highest proportion in each
employment category except self-employed without employees, the contributing family
workers and apprentices. The private informal sector is the largest employer in the district,
employing 93.3 percent of the population followed by the public sector with 4.2 percent.
Information and Communication Technology
Of the population 12 years and above, 36.9 percent have mobile phones. Men who own
mobile phones constitute 44.2 percent as compared to 30.9 percent of females. Nearly two
percent (1.7%) of the population 12 years and older use internet facilities in the district. Only
375 households representing 1.4 percent of the total households in the district have
desktop/laptop computers.
xi
Disability
About 4.0 percent of the district’s total population has one form of disability or the other. The
proportion of the female population with disability is slightly higher (4.2%) than males
(3.6%). The types of disability in the district include sight, hearing, speech, physical,
intellect, and emotion. Persons with sight disability recorded the highest of 49.7 percent
followed by physical disability (30.8%). About 4.8 percent of the population with disability
are in the rural localities. There are more females with sight, physical and emotional
disabilities than males in both the urban and rural localities. Of the population disabled, 53.6
percent have never been to school.
Agriculture
As high as 61.7 percent of households in the district are engage in agriculture. In the rural
localities, seven out of ten households (75.8%) are agricultural households while in the urban
localities, 37.2 percent of households are into agriculture. Most households in the district
(98.1%) are involved in crop farming. Poultry (chicken) is the dominant animal reared in the
district
Housing
The housing stock of Ketu North District is 23,701 representing 5.9 percent of the total
number of houses in the Volta Region. The average number of persons per house is 4.2.
Type, tenancy arrangement and ownership of dwelling units
Over half (45.4%) of all dwelling units in the district are compound houses; 39.4 percent are
separate houses and 5.9 percent are semi-detached houses. More than half (61.4%) of the
dwelling units in the district are owned by members of the household; 10.9 percent are owned
by private individuals; 25.1 percent are owned by a relative who is not a member of the
household and only 0.8 percent are owned by public or government. Exactly one percent
(1.0%) of the dwelling units is owned through mortgage schemes.
Material for construction of outer wall, floor and roof
The main construction material for outer walls of dwelling units in the district is cement
blocks/concrete accounting for 52.3 percent with those made of mud bricks/earth constituting
44.1 percent of outer walls of dwelling units in the district. Cement (85.5%) and mud/earth
(13.1%) are the two main materials used in the construction of floors of dwelling units in the
district. Metal sheets are the main roofing material (68.9 %) for dwelling units in the district.
Room occupancy
One room constitutes the highest percentage (84.0%) of sleeping rooms occupied by
households in housing units in the district. About 8.2 percent of households with 10 or more
members occupy single rooms.
Utilities and household facilities
The three main sources of lighting in dwelling units in the district are kerosene (63.7%),
electricity (33.2%) and flashlight (1.4%). The main source of fuel for cooking for most
households in the district is wood (63.0%). The proportion for rural (78.4%) is higher than
that of urban (36.3%). The four main sources of water in the district are rain water, public
tap/standpipe, and bore-hole. About twenty-six percent (25.4%) of households drink rain
water.

xii
The most important toilet facility used in the district is pit latrine accounting for 39.2 percent
followed public toilets with 24.2 percent. Households with no toilet facility account for 22.8
percent in the district. About twenty percent of households (20.2%) in the district share
separate bathrooms in the same house while 38.0 percent own bathrooms for their exclusive
use.
Waste disposal
The most widely method of solid waste disposal is by public dump in the open space
accounting for 34.8 percent. About 17.0 percent of households dump their solid waste
indiscriminately. House to house waste collection accounts for 7.4 percent. For liquid waste
disposal, throwing waste onto the compound (58.7%) and onto the street (32.6%) are the two
most common methods used by households in the district.
1
CHAPTER ONE
INTRODUCTION
1.1 Background
This chapter presents an overview of the Ketu North District. It discusses the physical
features, political administration, social and cultural structure and economy of the district.
Concepts and definitions as well as the organization of the report are also covered under this
chapter.
The Ketu North District is one of the 32 new districts created in Ghana in the year 2008. It
was carved out of the then Ketu District by a Legislative Instrument (LI 1841 of 2008) and
was inaugurated on the 29th
February, 2008. It has its administrative capital at Dzodze, which
lies about 80 kilometres south of Ho, the regional capital.
1.2 Physical features
1.2.1 Location and size
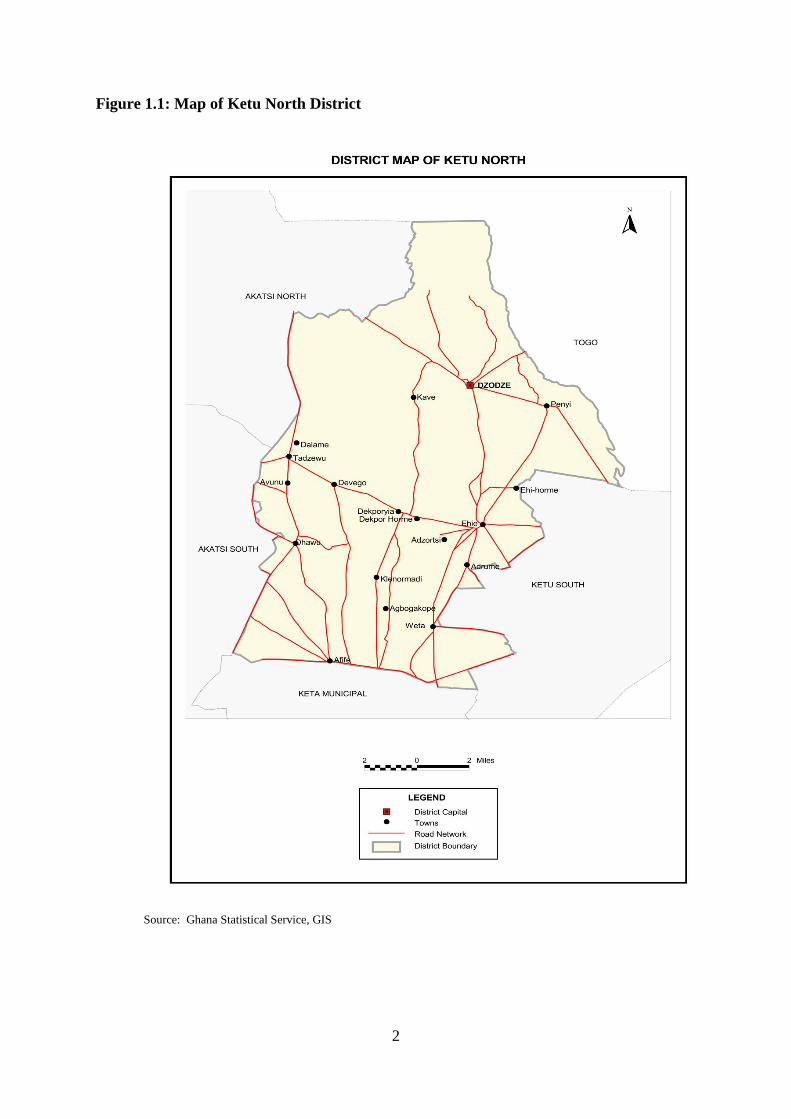
Ketu North District is located between Latitude 6o 03’N and 6
o 20’N and Longitude 0
o 49’E
and 1o 05’E. It shares boundaries with the Akatsi North District to the north, the Keta
Municipality to the south-west, Republic of Togo to the east. To the south, it is bounded by
the Ketu South Municipality and to the west by the Akatsi South District (see Figure 1.1).
The District covers a total surface area of 423.8 square kilometres representing 2.1 percent of
the total land area of the Volta Region.
1.2.2 Climate and vegetation
The District experiences dry Equatorial climate with a monthly temperature of 240C to 30
0C.
It has a double maxima rainfall pattern with the peak periods in June and October. The mean
annual rainfall ranges between 890mm and 1,270mm.
The vegetation of the District is Savannah woodland made up of short grassland with small
clump of bushes and trees as well as marshlands
1.2.3 Topography and drainage
The District is relatively low lying with an average altitude of 66 metres above sea level with
a generally flat landscape. The plain nature of the terrain makes movement within the
District relatively easier.
The drainage system is dominated by several seasonal streams that flow in wide valleys in the
southern part between Ohawu and Ehie; and ends in the swamplands of Afife. The major
rivers include Kplikpa and Tsiyi. There are six large fresh water reservoirs (dams) located in
the following communities: Ohawu, Kporkuve, Dzodze, Tadzewu, Dekpor-Adzotsi and
Larve and there are dugouts in some small communities in the District
.
2
Figure 1.1: Map of Ketu North District
Source: Ghana Statistical Service, GIS

3
1.2.4 Geology and soil
The District is underlain by two main geological formations: the Dahomenyan formation to
the north which is made up of soils such as Tropical Grey and Black Earths and the Tertiary
formation comprising Savannah Ochrosols for its soil type. This together with drainage,
vegetation and climatic conditions experienced in the District support the growing of some
food crops and the rearing of livestock.
1.3 Political administration
The District forms one constituency and is divided into four decentralized administrative and
political zones comprising three Area Councils and one Urban Council. The Ketu North
District has thirty-eight (38) electoral areas which are further divided into various unit
committees. The Ketu North District Assembly is the highest political authority in the District
with the mandate of the overall development of the district. At the top of the decentralized
system is the District Chief Executive who reports to the President through the Regional
Minister. Policies and programmes are implemented through eleven departments and
agencies of the district assembly.
1.4 Social and Cultural Structure
1.4.1 Ethnicity and religion
The major ethnic groups found in the District according to the 2010 PHC are Ewes, Akans,
Ga- Adangbe and Guan with the dominant tribe being Ewe (98.2%).
In terms of religion, Christians form the majority of the population (55.6%) while
traditionalists constitute 33.5 percent. Persons who profess no religion and other religions
constitute 10.0 percent of the total population while Muslims constitute less than one percent
(0.9%) of the population.
1.4.2 Chieftaincy
There are four traditional areas (namely, Dzodze, Penyi, Weta and Afife) in the District with
their respective paramount chiefs. The paramount chiefs have sub-chiefs who owe allegiance
to them and help in the day to day administration of their various areas jurisdiction.
1.4.3 Festivals
There are exciting traditional festivals celebrated by a good number of communities in the
District. Table 1.1 shows the major festivals, communities in which they are celebrated as
well as the reasons for the celebration.
Table 1.1: Major Festivals in the Ketu North District
Name of festival People /community Aim/significance
Anyigbla za Afife Traditional Area To offer sacrifice to the Anyigbla god for
protection and good farming season.
Daza Dzodze Traditional Area To revive the growing of palm nut in the area
Denyaza Weta Traditional Area To raise funds for the development of the area.
Nugoryiza Penyi Traditional Area To raise funds for the development of the area.
Source: DPCU, Ketu North District Assembly
4
1.5 Economy
1.5.1 Agriculture
Agriculture is the mainstay of the economy of the Ketu North District. Farming is largely
carried out on small-scale basis. The average acreage cultivated ranges from four to six acres
for all crops.
The District’s irrigation potential remains largely untapped. Apart from the Afife Irrigation
Project, there are numerous dams and dugouts which could be developed for use. The crop
sector accounts for about 60 percent of agricultural activities in the District. The soil types
favour the production of a variety of crops such as maize, cassava, sweet potato, cowpea and
rice.
As a result of the cross-border interchange with farmers from the Republic of Togo, there are
several varieties of cassava in the District. The Ohawu Agricultural College and its
experimental farms which are located in the District have helped to make available improved
cassava planting materials to the farmers.
The Kplikpa River dammed to irrigate rice farms at Avalavi also serves as site for inland
fishing at Dekpor. Currently, there are ten fishponds with a total area of 13.03 acres which
produces fish on commercial basis. Fish farming is integrated with vegetable production
(pepper and okro). There are other water bodies at Tadzewu, Devego, Dzodze, Ohawu and
Kporkuve, which are used for fishing purposes.
Livestock and poultry production forms an integral part of animal production in the District.
They serve as a means of storing wealth in times of bumper harvest of crops and provide cash
reserves for emergencies and guarantees of food security in times of crop failures. The main
animals reared in the District include cattle, sheep and goats, pigs, poultry and quite recently,
grass cutters.
1.5.2 Industry, commerce and service sector
The industrial sector in the District is less developed. There are currently no large industrial
holdings in the District. The sector is currently characterized by small scale businesses. Kente
weaving is a popular industrial activity especially for the youth. Kente from the District is
widely marketed at Kpetoe, Agbozume and as far as Kumasi. The kente weaving industry is a
potential tourist attraction in the District but needs to be developed.
The commercial sector is dominated by activities in the retail and to a limited extent,
wholesale activities in agricultural and industrial goods. Some of these commercial activities
include the sale of raw agricultural produce, food vending, household consumables, chemical
and the operation of electrical shops.
On the other hand, the services sector is dominated by small scale operators in activities such
as telecommunication services, hair dressing and barbering, electronic and vehicle repairs.
The District can boast of two renowned hospitals, which are the St. Anthony’s Catholic
Hospital and the International Health and Development Network Mission Hospital (IHDN)
located at Dzodze and Weta respectively.
5
1.6 Census Methodology, Concepts and Definitions
1.6.1 Introduction
Ghana Statistical Service (GSS) was guided by the principle of international comparability
and the need to obtain accurate information in the 2010 Population and Housing Census
(2010 PHC). The Census was, therefore, conducted using all the essential features of a
modern census as contained in the United Nations Principles and Recommendations for
countries taking part in the 2010 Round of Population and Housing Censuses.
Experience from previous post independence censuses of Ghana (1960, 1970, 1984 and 2000)
was taken into consideration in developing the methodologies for conducting the 2010 PHC.
The primary objective of the 2010 PHC was to provide information on the number,
distribution and social, economic and demographic characteristics of the population of Ghana
necessary to facilitate the socio-economic development of the country.
1.6.2 Pre-enumeration activities
Development of census project document and work plans
A large scale statistical operation, such as the 2010 Population and Housing Census required
meticulous planning for its successful implementation. A working group of the Ghana
Statistical Service prepared the census project document with the assistance of two
consultants. The document contains the rationale and objectives of the census, census
organisation, a work plan as well as a budget. The project document was launched in
November 2008 as part of the Ghana Statistics Development Plan (GSDP) and reviewed in
November 2009.
Census secretariat and committees
A well-structured management and supervisory framework that outlines the responsibilities
of the various stakeholders is essential for the effective implementation of a population and
housing census. To implement the 2010 PHC, a National Census Secretariat was set up in
January 2008 and comprised professional and technical staff of GSS as well as staff of other
Ministries, Departments and Agencies (MDAs) seconded to GSS. The Census Secretariat was
primarily responsible for the day-to-day planning and implementation of the census activities.
The Secretariat had seven units, namely; census administration, cartography, recruitment and
training, publicity and education, field operations and logistics management, data processing,
and data analysis and dissemination.
The Census Secretariat was initially headed by an acting Census Coordinator engaged by the
United Nations Population Fund (UNFPA) in 2008 to support GSS in the planning of the
Census. In 2009, the Census Secretariat was re-organised with the Government Statistician
as the National Chief Census Officer and overall Coordinator, assisted by a Census
Management Team and a Census Coordinating Team. The Census Management Team had
oversight responsibility for the implementation of the Census. It also had the responsibility of
taking critical decisions on the census in consultation with other national committees. The
Census Coordinating Team, on the other hand, was responsible for the day-to-day
implementation of the Census programme.
A number of census committees were also set up at both national and sub-national levels to
provide guidance and assistance with respect to resource mobilization and technical advice.
At the national level, the committees were the National Census Steering Committee (NCSC),
the National Census Technical Advisory Committee (NCTAC) and the National Census
6
Publicity and Education Committee (NCPEC). At the regional and district levels, the
committees were the Regional Census Implementation Committee and the District Census
Implementation Committee, respectively.
The Regional and District Census Implementation Committees were inter-sectoral in their
composition. Members of the Committees were mainly from decentralized departments with
the Regional and District Coordinating Directors chairing the Regional Census
Implementation Committee and District Census Implementation Committee, respectively.
The Committees contributed to the planning of district, community and locality level
activities in areas of publicity and field operations. They supported the Regional and District
Census Officers in the recruitment and training of field personnel (enumerators and
supervisors), as well as mobilizing logistical support for the census.
Selection of census topics
The topics selected for the 2010 Population and Housing Census were based on
recommendations contained in the UN Principles and Recommendations for 2010 Round of
Population and Housing Censuses and the African Addendum to that document as well as the
needs of data users. All the core topics recommended at the global level, i.e., geographical
and internal migration characteristics, international migration, household characteristics,
demographic and social characteristics such as age, date of birth, sex, and marital status,
fertility and mortality, educational and economic characteristics, issues relating to disability
and housing conditions and amenities were included in the census.
Some topics that were not considered core by the UN recommendations but which were
found to be of great interest and importance to Ghana and were, therefore, included in the
2010 PHC are religion, ethnicity, employment sector and place of work, agricultural activity,
as well as housing topics, such as, type of dwelling, materials for outer wall, floor and roof,
tenure/holding arrangement, number of sleeping rooms, cooking fuel, cooking space and
Information Communication Technology (ICT).
Census mapping
A timely and well implemented census mapping is pivotal to the success of any population
and housing census. Mapping delineates the country into enumeration areas to facilitate
smooth enumeration of the population. The updating of the 2000 Census Enumeration Area
(EA) maps started in the last quarter of 2007 with the acquisition of topographic sheets of all
indices from the Survey and Mapping Division of the Lands Commission. In addition, digital
sheets were also procured for the Geographical Information System Unit.
The Cartography Unit of the Census Secretariat collaborated with the Survey and Mapping
Division of the Lands Commission and the Centre for Remote Sensing and Geographic
Information Services (CERSGIS) of the Department of Geography and Resource
Development, University of Ghana, to determine the viability of migrating from analog to
digital mapping for the 2010 PHC, as recommended in the 2000 PHC Administrative Report.
Field cartographic work started in March 2008 and was completed in February 2010.
Development of questionnaire and manuals
For effective data collection, there is the need to design appropriate documents to solicit the
required information from respondents. GSS consulted widely with main data users in the
process of the questionnaire development. Data users including MDAs, research institutions,

7
civil society organisations and development partners were given the opportunity to indicate
the type of questions they wanted to be included in the census questionnaire.
Documents developed for the census included the questionnaire and manuals, and field
operation documents. The field operation documents included Enumerator’s Visitation
Record Book, Supervisor’s Record Book, and other operational control forms. These record
books served as operational and quality control tools to assist enumerators and supervisors to
control and monitor their field duties respectively.
Pre-tests and trial census
It is internationally recognized that an essential element in census planning is the pre-testing
of the questionnaire and related instructions. The objective of the pre-test is to test the
questionnaire, the definition of its concepts and the instructions for filling out the
questionnaire.
The census questionnaire was pre-tested twice in the course of its development. The first pre-
test was carried out in March 2009 to find out the suitability of the questions and the
instructions provided. It also tested the adequacy and completeness of the responses and how
respondents understood the questions. The second pre-test was done in 10 selected
enumeration areas in August, 2009. The objective of the second pre-test was to examine the
sequence of the questions, test the new questions, such as, date of birth and migration, and
assess how the introduction of ‘date of birth’ could help to reduce ‘age heaping’. With regard
to questions on fertility, the pre-tests sought to find out the difference, if any, between proxy
responses and responses by the respondents themselves. Both pre-tests were carried in the
Greater Accra Region. Experience from the pre-tests was used to improve the final census
questionnaire.
A trial census which is a dress rehearsal of all the activities and procedures that are planned
for the main census was carried out in October/November 2009. These included recruitment
and training, distribution of census materials, administration of the questionnaire and other
census forms, enumeration of the various categories of the population (household,
institutional and floating population), and data processing. The trial census was held in six
selected districts across the country namely; Saboba (Northern Region), Chereponi (Northern
Region), Sene (Brong Ahafo Region), Bia (Western Region), Awutu Senya (Central
Region), and Osu Klottey Sub-Metro (Greater Accra Region). A number of factors were
considered in selecting the trial census districts. These included: administrative boundary
issues, ecological zone, and accessibility, enumeration of floating population/outdoor-
sleepers, fast growing areas, institutional population, and enumeration areas with scattered
settlements.
The trial census provided GSS with an opportunity to assess its plans and procedures as well
as the state of preparedness for the conduct of the 2010 PHC. The common errors found
during editing of the completed questionnaires resulted in modifications to the census
questionnaire, enumerator manuals and other documents. The results of the trial census
assisted GSS to arrive at technically sound decisions on the ideal number of persons per
questionnaire, number of persons in the household roster, migration questions, placement of
the mortality question, serial numbering of houses/housing structures and method of
collection of information on community facilities. Lessons learnt from the trial census also
guided the planning of the recruitment process, the procedures for training of census field
staff and the publicity and education interventions.

8
1.6.3 Census Enumeration
Method of enumeration and field work
All post- independence censuses (1960, 1970, 1984, and 2000) conducted in Ghana used the
de facto method of enumeration where people are enumerated at where they were on census
night and not where they usually reside. The same method was adopted for the 2010 PHC.
The de facto count is preferred because it provides a simple and straight forward way of
counting the population since it is based on a physical fact of presence and can hardly be
misinterpreted. It is thought that the method also minimizes the risks of under-enumeration
and over enumeration. The canvasser method, which involves trained field personnel visiting
houses and households identified in their respective enumeration areas, was adopted for the
2010 PHC.
The main census enumeration involved the canvassing of all categories of the population by
trained enumerators, using questionnaires prepared and tested during the pre-enumeration
phase. Specific arrangements were made for the coverage of special population groups, such
as the homeless and the floating population. The fieldwork began on 21st September 2010
with the identification of EA boundaries, listing of structures, enumeration of institutional
population and floating population.
The week preceding the Census Night was used by field personnel to list houses and other
structures in their enumeration areas. Enumerators were also mobilized to enumerate
residents/inmates of institutions, such as, schools and prisons. They returned to the
institutions during the enumeration period to reconcile the information they obtained from
individuals and also to cross out names of those who were absent from the institutions on
Census Night. Out-door sleepers (floating population) were also enumerated on the Census
Night.
Enumeration of the household population started on Monday, 27th
September, 2010.
Enumerators visited houses, compounds and structures in their enumeration areas and started
enumerating all households including visitors who spent the Census Night in the households.
Enumeration was carried out in the order in which houses/structures were listed and where
the members of the household were absent, the enumerator left a call-back-card indicating
when he/she would come back to enumerate the household. The enumeration process took off
smoothly with enumerators poised on completing their assignments on schedule since many
of them were teachers and had to return to school. However, many enumerators ran short of
questionnaires after a few days’ work.
Enumeration resumed in all districts when the questionnaire shortage was resolved and by
17th
October, 2010, enumeration was completed in most districts. Enumerators who had
finished their work were mobilized to assist in the enumeration of localities that were yet to
be enumerated in some regional capitals and other fast growing areas. Flooded areas and
other inaccessible localities were also enumerated after the end of the official enumeration
period. Because some enumeration areas in fast growing cities and towns, such as, Accra
Metropolitan Area, Kumasi, Kasoa and Techiman were not properly demarcated and some
were characterized by large EAs, some enumerators were unable to complete their assigned
tasks within the stipulated time.
1.6.4 Post enumeration survey
In line with United Nations recommendations, GSS conducted a Post Enumeration Survey
(PES) in April, 2011 to check content and coverage error. The PES was also to serve as an

9
important tool in providing feedback regarding operational matters such as concepts and
procedures in order to help improve future census operations. The PES field work was
carried out for 21 days in April 2011 and was closely monitored and supervised to ensure
quality output. The main findings of the PES were that:
97.0 percent of all household residents who were in the country on Census Night (26th
September, 2010) were enumerated.
1.3 percent of the population was erroneously included in the census.
Regional differentials are observed. Upper East region recorded the highest coverage
rate of 98.2 percent while the Volta region had the lowest coverage rate of 95.7
percent.
Males (3.3%) were more likely than females (2.8%) to be omitted in the census. The
coverage rate for males was 96.7 percent and the coverage rate for females was 97.2
percent. Also, the coverage rates (94.1%) for those within the 20-29 and 30-39 age
groups are relatively lower compared to the coverage rates of the other age groups.
There was a high rate of agreement between the 2010 PHC data and the PES data for
sex (98.8%), marital status (94.6%), relationship to head of household (90.5%) and
age (83.0%).
1.6.5 Release and dissemination of results
The provisional results of the census were released in February 2011 and the final results in
May 2012. A National Analytical report, six thematic reports, a Census Atlas, 10 Regional
Reports and a report on Demographic, Social, Economic and Housing were prepared and
disseminated in 2013.
1.6.6 Concepts and Definitions
Introduction
The 2010 Population and Housing Census of Ghana followed the essential concepts and
definitions of a modern Population and Housing Census as recommended by the United
Nations (UN). It is important that the concepts, definitions and recommendations are adhered
to since they form the basis upon which Ghana could compare her data with that of other
countries.
The concepts and definitions in this report cover all sections of the 2010 Population and
Housing Census questionnaires (PHC1A and PHC1B). The sections were: geographical
location of the population, Household and Non-household population, Literacy and
Education, Emigration, Demographic and Economic Characteristics, Disability, Information
and Communication Technology (ICT), Fertility, Mortality, Agricultural Activity and
Housing Conditions.
The concepts and definitions are provided to facilitate understanding and use of the data
presented in this report. Users are therefore advised to use the results of the census within the
context of these concepts and definitions.
Region
There were ten (10) administrative regions in Ghana during the 2010 Population and Housing
Census as they were in 1984 and 2000.
10
District
In 1988, Ghana changed from the local authority system of administration to the district
assembly system. In that year, the then existing 140 local authorities were demarcated into
110 districts. In 2004, 28 new districts were created; this increased the number of districts in
the country to 138. In 2008, 32 additional districts were created bringing the total number of
districts to 170. The 2010 Population and Housing Census was conducted in these 170
administrative districts (these are made-up of 164 districts/municipals and 6 metropolitan
areas). In 2012, 46 new districts were created to bring the total number of districts to 216.
There was urgent need for data for the 46 newly created districts for planning and decision-
making. To meet this demand, the 2010 Census data was re-programmed into 216 districts
after carrying out additional fieldwork and consultations with stakeholders in the districts
affected by the creation of the new districts.
Locality
A locality was defined as a distinct population cluster (also designated as inhabited place,
populated centre, settlement) which has a NAME or LOCALLY RECOGNISED STATUS. It
included fishing hamlets, mining camps, ranches, farms, market towns, villages, towns, cities
and many other types of population clusters, which meet the above criteria. There were two
main types of localities, rural and urban. As in previous censuses, the classification of
localities into ‘urban’ and ‘rural’ was based on population size. Localities with 5,000 or more
persons were classified as urban while localities with less than 5,000 persons were classified
as rural.
Population
The 2010 Census was a “de facto” count and each person present in Ghana, irrespective of
nationality, was enumerated at the place where he/she spent the midnight of 26th September
2010.
Household
A household was defined as a person or a group of persons, who lived together in the same
house or compound and shared the same house-keeping arrangements. In general, a
household consisted of a man, his wife, children and some other relatives or a house help who
may be living with them. However, it is important to remember that members of a household
are not necessarily related (by blood or marriage) because non-relatives (e.g. house helps)
may form part of a household.
Head of Household
The household head was defined as a male or female member of the household recognised as
such by the other household members. The head of household is generally the person who has
economic and social responsibility for the household. All relationships are defined with
reference to the head.
Household and Non-household population
Household population comprised of all persons who spent the census night in a household
setting. All persons who did not spend the census night in a household setting (except
otherwise stated) were classified as non-household population. Persons who spent census
night in any of the under listed institutions and locations were classified as non-household
population:
11
a. Educational Institutions
b. Children's and Old People’s Homes
c. Hospitals and Healing Centres
d. Hotels
e. Prisons
f. Service Barracks
g. Soldiers on field exercise
h. Floating Population: The following are examples of persons in this category:
i. All persons who slept in lorry parks, markets, in front of stores and offices, public
bathrooms, petrol filling stations, railway stations, verandas, pavements, and all such
places which are not houses or compounds.
ii. Hunting and fishing camps.
iii. Beggars and vagrants (mentally sick or otherwise).
Age
The age of every person was recorded in completed years disregarding fractions of days and
months. For those persons who did not know their birthdays, the enumerator estimated their
ages using a list of district, regional and national historical events.
Nationality
Nationality is defined as the country to which a person belongs. A distinction is made
between Ghanaians and other nationals. Ghanaian nationals are grouped into Ghanaian by
birth, Ghanaian with dual nationality and Ghanaian by naturalization. Other nationals are
grouped into ECOWAS nationals, Africans other than ECOWAS nationals, and non-
Africans.
Ethnicity
Ethnicity refers to the ethnic group that a person belonged to. This information is collected
only from Ghanaians by birth and Ghanaians with dual nationality. The classification of
ethnic groups in Ghana is that officially provided by the Bureau of Ghana Languages and
which has been in use since the 1960 census.
Birthplace
The birthplace of a person refers to the locality of usual residence of the mother at the time of
birth. If after delivery a mother stayed outside her locality of usual residence for six months
or more or had the intention of staying in the new place for six or more months, then the
actual town/village of physical birth becomes the birthplace of the child.
Duration of Residence
Duration of residence refers to the number of years a person has lived in a particular place.
This question is only asked of persons not born in the place where enumeration took place.
Breaks in duration of residence lasting less than 12 months are disregarded. The duration of
residence of persons who made multiple movements of one (1) year or more is assumed to be
the number of years lived in the locality (town or village) since the last movement.
Religion
Religion refers to the individual’s religious affiliation as reported by the respondent,
irrespective of the religion of the household head or the head’s spouse or the name of the

12
person. No attempt was made to find out if respondents actually practiced the faith they
professed.
Marital Status
Marital status refers to the respondent’s marital status as at Census Night. The question on
marital status was asked only of persons 12 years and older. The selection of the age limit of
12 years was based on the average age at menarche and also on the practice in some parts of
the country where girls as young as 12 years old could be given in marriage.
Literacy
The question on literacy referred to the respondent's ability to read and write in any language.
A person was considered literate if he/she could read and write a simple statement with
understanding. The question on literacy was asked only of persons 11 years and older.
Education
School Attendance
Data was collected on school attendance for all persons three (3) years and older. School
attendance refers to whether a person has ever attended, was currently attending or has never
attended school. In the census, school meant an educational institution where a person
received at least four hours of formal education.
Although the lower age limit of formal education is six years for primary one, eligibility for
the school attendance question was lowered to three years because pre-school education has
become an important phenomenon in the country.
Level of education
Level of education refers to the highest level of formal school that a person ever attended or
was attending. This information was obtained for persons 3 years and older.
Activity status
Activity status refers to economic or non-economic activity of respondents during the 7 days
preceding census night. Information on type of activity was collected on persons 5 years and
older. A person was regarded as economically active if he/she:
a. Worked for pay or profit or family gain for at least 1 hour within the 7 days preceding
Census Night. This included persons who were in paid employment or self-
employment or contributing family workers.
b. Did not work, but had jobs to return to.
c. Were unemployed.
The economically not active were persons who did not work and were not seeking for work.
They were classified by reasons for not being economically active. Economically not active
persons included homemakers, students, retired persons, the disabled and persons who were
unable to work due to their age or ill-health.
Occupation
This referred to the type of work the person was engaged in at the establishment where he/she
worked. This was asked only of persons 5 years and older who worked 7 days before the

13
census night, and those who did not work but had a job to return to as well as those
unemployed who had worked before. All persons who worked during the 7 days before the
census night were classified by the kind of work they were engaged in. The emphasis was on
the work the person did during the reference period and not what he/she was trained to do.
For those who did not work but had a job to return to, their occupation was the job they
would go back to after the period of absence. Also, for persons who had worked before and
were seeking for work and available for work, their occupation was on the last work they did
before becoming unemployed. If a person was engaged in more than one occupation, only the
main one was considered.
Industry
Industry referred to the type of product produced or service rendered at the respondent’s work
place. Information was collected only on the main product produced or service rendered in
the establishment during the reference period.
Employment status
Employment status refers to the status of a person in the establishment where he/she currently
works or previously worked. Eight employment status categories were provided: employee,
self-employed without employees, self-employed with employees, casual worker,
contributing family worker, apprentice, domestic employee (house help). Persons who could
not be classified under any of the above categories were classified as “other”.
Employment sector
This refers to the sector in which a person worked. The employment sectors covered in the
census were public, private formal, private informal, semi-public/parastatal, NGOs and
international organizations.
Disability
Persons with disability were defined as those who were unable to or were restricted in the
performance of specific tasks/activities due to loss of function of some part of the body as a
result of impairment or malformation. Information was collected on persons with visual/sight
impairment, hearing impairment, mental retardation, emotional or behavioural disorders and
other physical challenges.
Information Communication Technology (ICT)
ICT questions were asked for both individuals and households. Persons having mobile
phones refer to respondents 12 years and older who owned mobile phones (irrespective of the
number of mobile phones owned by each person). Persons using internet facility refers to
those who had access to internet facility at home, internet cafe, on mobile phone or other
mobile device. Internet access is assumed to be not only via computer, but also by mobile
phones, PDA, game machine and digital television.
Households having Personal Computers/Laptops refer to households who own
desktops/laptop computers. The fixed telephone line refers to a telephone line connecting a
customer’s terminal equipment (e.g. telephone set, facsimile machine) to the public switch
telephone network.

14
Fertility
Two types of fertility data were collected: lifetime fertility and current fertility. Lifetime
fertility refers to the total number of live births that females 12 years and older had ever had
during their life time. Current fertility refers to the number of live births that females 12-54
years old had in the 12 months preceding the Census Night.
Mortality
Mortality refers to all deaths that occurred in the household during the 12 months preceding
the Census Night. The report presents information on deaths due to accidents, violence,
homicide and suicide. In addition, data were collected on pregnancy-related deaths of
females 12-54 years.
Agriculture
The census sought information on household members who are engaged in agricultural
activities, including the cultivation of crops or tree planting, rearing of livestock or breeding
of fish for sale or family consumption. Information was also collected on their farms, types of
crops and number and type of livestock.
Housing Conditions and Facilities
The UN recommended definition of a house as “a structurally separate and independent place
of abode such that a person or group of persons can isolate themselves from the hazards of
climate such as storms and the sun’’ was adopted. The definition, therefore, covered any type
of shelter used as living quarters, such as separate houses, semi-detached houses,
flats/apartments, compound houses, huts, tents, kiosks and containers.
Living quarters or dwelling units refer to a specific area or space occupied by a particular
household and therefore need not necessarily be the same as the house of which the dwelling
unit may be a part.
Information collected on housing conditions included the type of dwelling unit, main
construction materials for walls, floor and roof, holding/tenure arrangement, ownership type,
type of lighting, source of water supply and toilet facilities. Data was also collected on
method of disposal of solid and liquid waste.
1.7 Organization of the Report
The report consists of nine chapters. Chapter one provides basic information about the
district. It gives a brief background of the district, describing its physical features, political
and administrative structures, social and cultural structures, economy and the methodology
and concepts used in the report. Chapter two discusses the population size, composition and
age structure. It further discusses the migratory pattern in the district as well as fertility and
mortality.
The focus of chapter three is on household size, composition and headship as well as the
marital characteristics and nationality of the inhabitants of the district. The chapter also
discusses the religious affiliations and the educational statuses of the members of the district.
Chapter four focuses on economic characteristics such as economic activity status,
occupation, industries and the employment status and sectors that the people are employed in.
Information Communication Technology (ICT) is discussed in chapter five. It analyses
mobile phone ownership, internet use and ownership of desktop/laptop computers while

15
chapter six is devoted to Persons living with disabilities (PWDs) and their socio-demographic
characteristics. Chapter seven concentrates on the agricultural activities of the households,
describing the types of farming activities, livestock rearing and numbers of livestock reared.
In chapter eight, housing conditions such as housing stock, type of dwelling and construction
materials, room occupancy, holding and tenancy, lighting and cooking facilities, bathing and
toilet facilities, waste disposal and source of water for drinking or for other domestic use in
the district are discussed and analysed in detail. The final chapter, Chapter nine presents the
summary of findings and conclusions. It also discusses the policy implications of the findings
for the district.
16
CHAPTER TWO
DEMOGRAPHIC CHARACTERISTICS
2.1 Introduction
Demographic characteristics are essential aspects of a population. Age and sex influence
many demographic trends. An understanding of the age and sex structures of a population
give an in-depth knowledge into changing population composition and highlights social and
economic challenges. All levels of policy formulation need information on age and sex
composition of the population to facilitate planning to meet their development aspirations. An
important use of census data on age and sex for example, is the planning of adequate schools
for school going-age population.
This chapter describes the population size, age and sex composition of the Ketu North
District.
2.2 Population size and distribution
Table 2.1 shows the population of the Ketu North District. The total population of the District
is 99,913 which accounts for 4.7 percent of the total population of the Volta Region. The
District has a population density of about 234 persons per square kilometre, which is higher
than the regional average density of 103 persons per square kilometre.
2.2.1 Population distribution by locality
The results also indicate that majority of the people in the District live in rural areas (65.8%)
as compared to 34.2 percent in urban areas.
2.2.2 Age and sex structure
Table 2.1 also shows that the District has a sex ratio of 87.2 males to 100 females. The Table
also shows this trend for all the age cohorts except for the 0-19 year cohort where there are
more males (24,647) than females (23,158). The ratio is lowest for the 65 years and older age
group which exhibit a sex ratio of only 51.6 males to 100 females.
2.3 Age-dependency ratios
The age-dependency ratio is the ratio of the dependent population (those under age 15 and
those 65 years and older) to the working-age population (15 to 64 years). The age-
dependency ratio is often used as an indicator of the economic burden the productive
population must carry. Countries with very high birth rates usually have the high age-
dependency ratios because of the large proportion of children in the population. The higher
the age-dependency ratio, the more people a potential worker is assumed to be supporting and
the vice-versa. Table 2.1 indicates that the dependency ratio for the District is 82.3
dependants for every 100 working people. This is slightly higher in comparison with the
regional average of 81.3. A large proportion of the dependent population are children aged 0-
14 years as they form 82.3 percent of the dependants compared to those aged 65 years and
older who constitute 17.7 percent.

17
The sex aggregated dependency ratio shows a higher dependency ratio for males (87.73) than
females (77.81). The data in Table 2.1 show that there is a higher dependency burden on the
working population in rural areas (88.13) than their urban counterparts (72.05).
Table 2.1: Population by age, sex and type of locality
Age Group
Both
Sexes
Sex Sex
ratio
Type of locality
Male Female Urban Rural
All Ages 99,913 46,551 53,362 87.2 34,196 65,717
0 - 4 13,633 6,856 6,777 101 4,248 9,385
5-10 12,181 6,237 5,944 105 3,789 8,392
11-14 11,309 5,945 5,364 111 3,597 7,712
15 - 19 10,682 5,609 5,073 111 3,716 6,966
20 - 24 8,249 4,077 4,172 97.7 3,102 5,147
25 - 29 6,892 2,967 3,925 75.6 2,659 4,233
30 - 34 5,547 2,388 3,159 75.6 2,134 3,413
35 - 39 5,199 2,235 2,964 75.4 1,917 3,282
40 - 44 4,684 1,897 2,787 68.1 1,592 3,092
45 - 49 4,383 1,859 2,524 73.7 1,500 2,883
50 - 54 4,164 1,729 2,435 71 1,463 2,701
55 - 59 2,446 1,022 1,424 71.8 870 1,576
60 - 64 2,562 1,014 1,548 65.5 923 1,639
65 - 69 1,740 670 1,070 62.6 623 1,117
70 - 74 2,318 761 1,557 48.9 780 1,538
75 - 79 1,330 466 864 53.9 467 863
80 - 84 1,310 415 895 46.4 424 886
85 - 89 600 186 414 44.9 186 414
90 - 94 486 135 351 38.5 147 339
95 - 99 198 83 115 72.2 59 139
All Ages 99,913 46,551 53,362 87.2 34,196 65,717
0-14 37,123 19,038 18,085 105 11,634 25,489
15-64 54,808 24,797 30,011 82.6 19,876 34,932
65+ 7,982 2,716 5,266 51.6 2,686 5,296
Age-dependency
ratio 82.3 87.73 77.81 72.05 88.13 Source: Ghana Statistical Service, 2010 Population and Housing Census
2.4 Age-sex structure
An important tool for analyzing age and sex composition of a population is the age-sex
pyramid. Figure 2.1 shows the population pyramid of the Ketu North District. The shape of
the pyramid closely mirrors that of the national pyramid, and typical of developing countries.
It has a broad base gradually tapering off at the older ages. This is an indication of a youthful
population. With increasing age, the age –sex structure looks slightly slender for the males
than for the females. For ages 0-4 and 15-19 years, there are more males than females.

18
Figure 2.1: Population pyramid by age and sex
Source: Ghana Statistical Service, 2010 Population and Housing Census
2.5 Fertility, Mortality and Migration
2.5.1 Fertility
Fertility for the purposes of this report means the total number of live births that females 15
years and older ever had during their lifetime. Measures of fertility are important in
determining the size and structure of the population and therefore, critical for the
management of the population for social and economic development.
The commonly used measures of fertility are the Total Fertility Rate (the number of children
a woman would have by the end of her childbearing years if she were to experience the
currently observed age-specific fertility rates) and its component, Age-specific Fertility Rate
(the number of children a woman within a specific age group would have) for the purpose of
knowing differences in fertility behaviour in each age group). The Crude Birth Rate indicates
the number of live births per 1,000 populations in a given year.
Table 2.2 presents data on Total Fertility Rate, General Fertility Rate and Crude Birth Rate
for Districts in the Volta Region. The Table shows that the Ketu North District has a total of
24,604 women in the reproductive age group (15-49 years) who have delivered 2,439
children within the 12 months preceding the census night.
The District also recorded a Total Fertility Rate of 3.41 and Crude Birth Rate of 24.4 which
are both slightly higher than the regional averages of 3.38 and 24.6 respectively. Table 2.2
also shows a General Fertility Rate of 99.1 for the District which is slightly lower than the
regional rate of 99.2.
10,000 5,000 0 5,000 10,000
0-4
5-9
10-14
15-19
20-24
25-29
30-34
35-39
40-44
45-49
50-54
55-59
60-64
65-69
70-74
75-79
80-84
85+
Population
Age
Female Male

19
Table 2.2: Reported total fertility rate, general fertility rate and crude
birth rate by district
District Population
Number of
women 15-
49 years
Number
of births
in last 12
months
Total
Fertility
Rate
*General
Fertility
Rate
**Crude
Birth
Rate
All Districts 2,118,252 517,313 51,292 3.4 99.2 24.2
South Tongu 87,950 21,325 2,209 3.6 103.6 25.1
Keta Municapal 147,618 36,102 3,204 3.11 88.7 21.7
Ketu South 160,756 41,944 3,887 3.1 92.7 24.2
Ketu North 99,913 24,604 2,439 3.4 99.1 24.4
Akatsi South 98,684 24,782 2,389 3.4 96.4 24.2
Central Tongu 59,411 14,512 1,377 3.3 94.9 23.2
Agotime Ziope 28,013 6,843 747 3.8 109.2 26.7
Ho Municipal 177,281 49,729 3,702 2.6 74.4 20.9
South Dayi 46,661 11,048 1,052 3.3 95.2 22.5
Kpando Municipal 53,736 13,506 1,177 3 87.1 21.9
Hohoe Municipal 167,016 42,220 4,052 3.3 96 24.3
Biakoye 65,901 15,067 1,484 3.4 98.5 22.5
Jasikan 59,181 13,924 1,455 3.5 104.5 24.6
Kadjebi 59,303 13,652 1,430 3.6 104.7 24.1
Krachi East 116,804 26,146 3,319 4.3 126.9 28.4
Krachi West 49,417 11,225 1,245 3.7 110.9 25.2
Nkwanta South 117,878 27,226 3,304 4 121.4 28
Nkwanta North 64,553 14,758 2,043 4.6 138.4 31.6
North Tongu 89,777 22,874 1,931 2.9 84.4 21.5
Akatsi North 29,777 7,143 826 4.1 115.6 27.7
Adaklu 36,391 9,351 666 2.4 71.2 18.3
Afadzato South 95,030 21,842 2,373 3.9 108.6 25
North Dayi 39,913 9,115 865 3.3 94.9 21.7
Krachi Nchumuru 72,688 16,449 1,822 3.8 110.8 25.1 Source: Computed from the 2010 Population and Housing Census
Note: * Number of live births per 1,000 women aged 15-49 years
** Number of live births per 1,000 population
Table 2.3 indicates the fertility of women aged 12 years and older and compares the children
born alive to the children surviving at the time of the census night. The results of 2010 PHC
reveal that there are 38,391 women in this age category. It also recorded a total of 119,805
live births comprising 59,741 males and 60,064 females.
It came to light that there are a total of 6,814 women in the District aged 60 years and older
who have delivered a total of 42,112 live births while 3,114 girls in the age group 12-14 years
have delivered 20 children.
Table 2.3 shows that only 97,868 children comprising 48,238 males and 49,630 females out
of the 119,805 children ever born survived. In terms of comparison by sex, there is higher
survival rate for females (82.6%) than males (80.7%).
The relatively high levels of child survival in the District may be ascribed to improvements in
health facilities and health care deliveries such as the eradication of polio and other killer
diseases among children in the Region.

20
Table 2.3: Female population 12 years and older by age, children ever
born, children surviving and sex of child
Age
Number
of
Female
Children Ever Born Children Surviving
Both
Sexes Male Female
Both
Sexes Male Female
Total 38,391 119,805 59,741 60,064
97,868 48,238 49,630
12-14 3,114 20 14 6
17 11 6
15 - 19 5,073 663 325 338
601 299 302
20 - 24 4,172 3,333 1,658 1,675
3,011 1,480 1,531
25 - 29 3,925 6,918 3,488 3,430
6,311 3,127 3,184
30 - 34 3,159 9,138 4,666 4,472
8,254 4,164 4,090
35 - 39 2,964 11,153 5,632 5,521
9,859 4,907 4,952
40 - 44 2,787 12,641 6,300 6,341
10,990 5,395 5,595
45 - 49 2,524 12,661 6,389 6,272
10,790 5,431 5,359
50 - 54 2,435 13,340 6,611 6,729
10,992 5,386 5,606
55 - 59 1,424 7,826 3,898 3,928
6,402 3,131 3,271
60+ 6,814 42,112 20,760 21,352 30,641 14,907 15,734 Source: Ghana Statistical Service, 2010 Population and Housing Census
2.5.3 Mortality
Mortality provides an indication of the health status of the population and provides a measure
for assessing the living condition of the people. According to the 2010 PHC (National
Analytical Report, 2010), mortality relates to deaths that occurred in the household during the
12 months preceding the census night.
Death in households and crude death rate
Table 2.4 presents data on total deaths in households and the crude death rates for all districts
in the region. Ketu North District recorded a total of 908 household deaths within the twelve
months preceding the census. The crude death rate for the district is 9.1 deaths per 1,000
population. This crude death rate for the district is relatively higher than the regional average
of 8.8.
Table 2.4: Total population, deaths in households and
crude death rate, by district
District
Total
Population
Deaths in
households
*Crude
death rate
All District 2,118,252 18,596 8.8
South Tongu 87,950 1,025 11.7
Keta Municipal 147,618 1,819 12.3
Ketu South 160,756 1,160 7.2
Ketu North 99,913 908 9.1
Akatsi South 98,684 906 9.2
Central Tongu 59,411 590 9.9
Agotime Ziope 28,013 165 5.9
Ho Municipal 177,281 1,468 8.3
South Dayi 46,661 495 10.6
Kpando Municipal 53,736 478 8.9
Hohoe Municipal 167,016 1,458 8.7
Biakoye 65,901 414 6.3
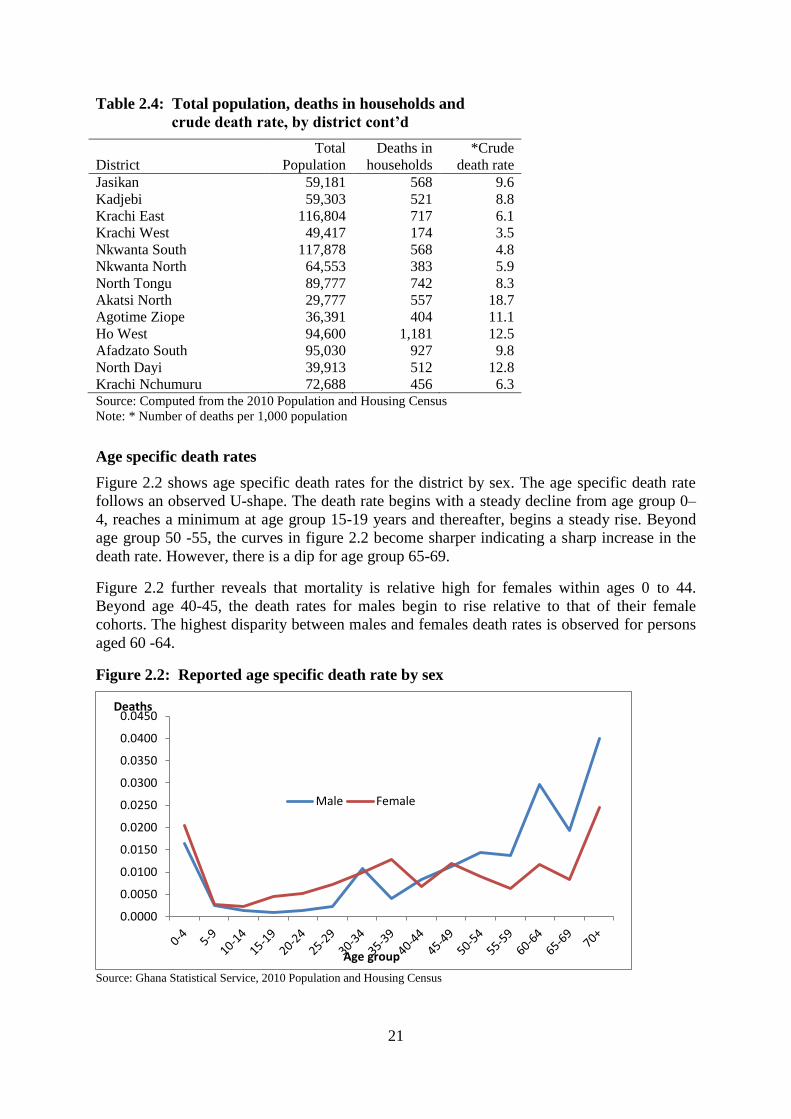
21
Table 2.4: Total population, deaths in households and
crude death rate, by district cont’d
District
Total
Population
Deaths in
households
*Crude
death rate
Jasikan 59,181 568 9.6
Kadjebi 59,303 521 8.8
Krachi East 116,804 717 6.1
Krachi West 49,417 174 3.5
Nkwanta South 117,878 568 4.8
Nkwanta North 64,553 383 5.9
North Tongu 89,777 742 8.3
Akatsi North 29,777 557 18.7
Agotime Ziope 36,391 404 11.1
Ho West 94,600 1,181 12.5
Afadzato South 95,030 927 9.8
North Dayi 39,913 512 12.8
Krachi Nchumuru 72,688 456 6.3 Source: Computed from the 2010 Population and Housing Census
Note: * Number of deaths per 1,000 population
Age specific death rates
Figure 2.2 shows age specific death rates for the district by sex. The age specific death rate
follows an observed U-shape. The death rate begins with a steady decline from age group 0–
4, reaches a minimum at age group 15-19 years and thereafter, begins a steady rise. Beyond
age group 50 -55, the curves in figure 2.2 become sharper indicating a sharp increase in the
death rate. However, there is a dip for age group 65-69.
Figure 2.2 further reveals that mortality is relative high for females within ages 0 to 44.
Beyond age 40-45, the death rates for males begin to rise relative to that of their female
cohorts. The highest disparity between males and females death rates is observed for persons
aged 60 -64.
Figure 2.2: Reported age specific death rate by sex
Source: Ghana Statistical Service, 2010 Population and Housing Census
0.0000
0.0050
0.0100
0.0150
0.0200
0.0250
0.0300
0.0350
0.0400
0.0450Deaths
Age group
Male Female
22
2.5.1 Migration
Migration refers to change in usual place of residence from one administrative district to
another for a period not less than six months. The importance of measuring migration lies in
its impact on population size, structure and distribution in a district.
Table 2.4 shows data on the birthplace of persons born outside the Ketu North District but are
residents of the district at the time of the census and the duration of their residence. It reveals
that a total of 13,380 persons representing 13.4 percent of the population in the district are
migrants. The Table further shows that 65.9 percent (8,815) of the migrants in the District
were born in different localities in the Volta Region.
Migrants who indicated that they were born in other regions in Ghana form 25.1 percent and
the majority of them were born in the Greater Accra, Eastern and Ashanti regions. It is noted
that a significant proportion (9.0%) of the migrants in the District were born outside Ghana.
This is not surprising since the Ketu North is situated along Ghana’s border with the Republic
of Togo.
In terms of duration of stay, Table 2.4 shows that 29.8 percent of the migrants have stayed
between 1 to 4 years, followed by those who have spent less than a year in the district
(20.5%) and over 20 years (20.6%). It is observed from the Table that almost half of the
migrants (49.8%) in the District have spent at least five years. Among persons born outside
Ghana, it was found that 46.6 percent have stayed for five years or more in the District.
Table 2.5: Birthplace by duration of residence of migrants
Birthplace
Migrants Duration of residence (%)
Total Percent
Less than
1 year
1-4
years
5-9
years
10-19
years
20+
years
Total 13,380 100.0
20.5 29.8 15.2 13.9 20.6
Different locality in this
region 8,815 100.0
19.4 28.5 15.9 13.9 22.3
Western 238 100.0
31.1 30.7 10.5 14.3 13.4
Central 238 100.0
24.4 39.5 12.6 12.2 11.3
Greater Accra 979 100.0
27.0 34.1 11.7 13.2 14.0
Volta 0 0.0
0.0 0.0 0.0 0.0 0.0
Eastern 948 100.0
21.1 25.0 14.2 13.0 26.7
Ashanti 616 100.0
20.8 31.8 16.6 10.9 20.0
Brong Ahafo 132 100.0
27.3 19.7 13.6 15.9 23.5
Northern 128 100.0
27.3 46.9 7.8 4.7 13.3
Upper East 55 100.0
49.1 10.9 10.9 16.4 12.7
Upper West 21 100.0
42.9 28.6 9.5 9.5 9.5
Outside Ghana 1,210 100.0 16.5 36.9 15.4 17.6 13.6 Source: Ghana Statistical Service, 2010 Population and Housing Census

23
CHAPTER THREE
SOCIAL CHARACTERISTICS
3.1 Introduction
The 2010 Population and Housing Census defines a household as a person or group of
persons who live together in the same house or compound and share the same catering
arrangement. Members of a household are not necessarily related by blood or marriage. The
structure of a household is a reflection of the social structure, in that living arrangements are
largely influenced by such socio-cultural factors as marriage, and the types of family and
kinship systems existing in a particular society.
Knowledge of household structure, composition, and headship provides important statistical
measure for social and economic planning. A study of households also provides the basis for
a reasonable projection of the future size of population, and planning of housing needs.
This chapter analyzes data on household structure, marital status, religious affiliation,
nationality as well as literacy and education in the Ketu North District
3.2 Household size, composition and headship
3.2.1 Household population and size
Table 3.1 presents information on the number of households in the district and the average
household size. The Table indicates that there are 26,437 households in the district with a
household population of 98,571. The average household size for the district is 3.7 which is
relatively lower than the regional average of 4.2. There are more persons in urban households
(1.4) than there are in rural households (1.0).
Table 3.1: Household population and size by locality
Categories Region
District
Total Urban Rural
Total household population 2,086,567 98,571 33,580 64,991
Number of households 495,600 26,437 9,666 16,771
Average households per
house 1.2 1.1 1.4 1
Average household size 4.2 3.7 3.5 3.9 Source: Ghana Statistical Service, 2010 Population and Housing Census.
The composition and relationship of members of households to the household heads are
presented in Table 3.1. Out of a total population of 98,571 persons who live in households,
the majority (40.2%) of them are children (sons and daughters) to the heads of households,
household heads (26.8%) and their spouses (9.9%).
Table 3.2 also show that significant percentages (10.6%) of the household population are
grandchildren to the heads of households. The total number of households in the District is
26,437 comprising 14,496 male headed households and 11,941 female headed households. In
percentage terms, the male headed households constitute 54.8 percent relative to 45.2 percent
for female headed households.
24
Table 3.2 further indicates that a varied number of extended family members and non-
relatives to the head of household stay in households in the District. It is remarkable to note
that extended family members form 22.1 percent. Thus, more than one out of every five
persons in a household is an extended family member of the head.
The Table further indicates that here are more sons (51.1%) than daughters (48.9%) and more
wives (17.4%) than husbands (1.3%) who are not heads of their households in the District.
This is not surprising since the District is traditionally a patrilineal society. Even the
percentage of female heads of households is remarkably high and could be due to male out-
migration, divorce, separation, widowhood, non-marriage, etc.
Table 3.2: Household composition and sex
Relationship to head
Total Male Female
Number Percent Number Percent Number Percent
Total 98,571 100.0
45,891 100.0
52,680 100.0
Head 26,437 26.8
14,496 31.6
11,941 22.7
Spouse
(wife/husband) 9,749 9.9
577 1.3
9,172 17.4
Child (son/daughter) 39,583 40.2
20,240 44.1
19,343 36.7
Parent/Parent in-law 1,094 1.1
163 0.4
931 1.8
Son/Daughter in-law 690 0.7
130 0.3
560 1.1
Grandchild 10,399 10.6
5,227 11.4
5,172 9.8
Brother/Sister 2,701 2.7
1,374 3.0
1,327 2.5
Step child 914 0.9
467 1.0
447 0.9
Adopted/Foster
child 306 0.3
155 0.3
151 0.3
Other relative 5,813 5.9
2,563 5.6
3,250 6.2
Non-relative 885 0.9 499 1.1 386 0.7 Source: Ghana Statistical Service, 2010 Population and Housing Census
3.2.2 Household structure
Table 3.3 provides information on household structure by sex. The Table shows a
preponderance of the nuclear family household system. The nuclear family (head, spouse(s)
and their children) constitutes almost one-third (28.0%) of the household population in the
District followed by the single parent extended (18.5%) and extended family (that is head,
spouse(s), children and head’s relatives) (16.4%). The least proportion of the household
structure is the extended and non-relative (0.6%) followed by head and spouse only (2.1%).
25
Table 3.3: Household structure by sex
Household structure
Total Male Female
Number Percent Number Percent Number Percent
Total 98,571 100.0
45,891 100.0
52,680 100.0
Head only 5,613 5.7
3,056 6.7
2,557 4.9
Head and a spouse only 2,052 2.1
1,030 2.2
1,022 1.9
Nuclear (Head spouse(s)
children) 27,604 28.0
14,286 31.1
13,318 25.3
Extended (Head spouse(s)
children Head's relatives) 16,117 16.4
8,066 17.6
8,051 15.3
Extended + non relatives 563 0.6
276 0.6
287 0.5
Head spouse(s) and other
composition 2,889 2.9
1,405 3.1
1,484 2.8
Single parent Nuclear 14,287 14.5
5,971 13.0
8,316 15.8
Single parent Extended 18,247 18.5
7,005 15.3
11,242 21.3
Single parent Extended + non
relative 825 0.8
347 0.8
478 0.9
Head and other composition but
no spouse 10,374 10.5 4,449 9.7 5,925 11.3 Source: Ghana Statistical Service, 2010 Population and Housing Census
However, Table 3.3 shows that 31.1 percent of the members of nuclear families (head,
spouse(s), and children) are males compared with 25.3 percent of females. It is worthy to note
that there is a higher percentage of females (21.3%) in the single-parent extended household
in the District than males (15.3%). Thus, the relatively high percentage of females in single
parent nuclear and single parent extended families could help explain the high percentage of
female household heads in the District.
3.3 Marital status
Marriage is one of the determinants of an individual’s social status and is also an indicator of
social responsibility, trust and achievement. Every adult, unless afflicted by serious illness or
deformity is expected to marry. Voluntary celibacy is frowned upon in traditional Ghanaian
society. Most adults would therefore wish to get married at one time or the other and this is
more so with females.
Age, Sex and Marital Status
Table 3.4 shows persons aged 12 years and older by sex, age group and marital status. The
data show that 46.1 percent of persons 12 years and older in the district are married, while
another 36.0 percent have never married. Divorce rate in the district is relatively low as only
3.2 percent of persons in the district are divorced. Table 3.4 further shows that 2.3 percent of
persons aged 12-14 are married with another 0.3 percent living in informal/consensual union
or living together as if married with their partners. More than half of all persons within ages
25-64 are married. Table 3.4 also indicates that the proportion of males who have never
married (47.5%) is relative higher than the proportion of males that are married (42.5%). On
the contrary, the proportion of females that is married is relatively higher (49.0%) than the
proportion that has never married (26.7%). The Table again shows that while 3.6 percent of
males aged 65 years and older have never married, only 0.9 percent of their female
counterparts have never married.

26
Table 3.4: Persons 12 and older by sex, age-group and marital status
Sex/Age-
group Number Total
Never
married
Informal/
Consensual
union/Living
together Married Separated Divorced Widowed
Both Sexes
Total 69,370 100.0 36.0 3.6 46.1 2.4 3.2 8.7
12-14 6,580 100.0 97.4 0.3 2.3 0.0 0.0 0.0
15 - 19 10,682 100.0 90.3 1.5 7.6 0.4 0.1 0.1
20 - 24 8,249 100.0 61.2 5.2 30.9 1.3 0.9 0.5
25 - 29 6,892 100.0 30.5 6.9 57.3 2.5 2.0 0.8
30 - 34 5,547 100.0 13.1 6.0 73.1 2.9 2.9 2.0
35 - 39 5,199 100.0 7.0 5.5 78.1 3.0 4.2 2.2
40 - 44 4,684 100.0 3.3 4.9 78.5 3.7 5.1 4.5
45 - 49 4,383 100.0 2.6 4.1 75.7 4.0 6.4 7.1
50 - 54 4,164 100.0 3.0 3.4 70.2 4.6 7.0 11.8
55 - 59 2,446 100.0 2.5 3.3 64.2 4.6 7.6 17.7
60 - 64 2,562 100.0 2.2 2.1 59.1 4.7 6.9 25.1
65+ 7,982 100.0 1.9 1.5 42.5 3.4 5.1 45.7
Male
Total 30,979 100.0 47.5 3.2 42.5 1.8 2.7 2.3
12-14 3,466 100.0 97.5 0.1 2.4 0.0 0.0 0.0
15 - 19 5,609 100.0 96.5 0.4 2.9 0.1 0.1 0.0
20 - 24 4,077 100.0 80.6 2.8 15.4 0.4 0.5 0.1
25 - 29 2,967 100.0 47.4 6.4 43.0 1.6 1.4 0.2
30 - 34 2,388 100.0 21.9 6.4 67.8 1.2 2.0 0.9
35 - 39 2,235 100.0 11.5 6.0 75.6 2.3 3.8 0.7
40 - 44 1,897 100.0 5.5 5.5 79.8 3.3 4.1 1.8
45 - 49 1,859 100.0 4.3 4.2 79.8 3.4 5.7 2.5
50 - 54 1,729 100.0 5.4 3.8 76.3 4.4 6.5 3.6
55 - 59 1,022 100.0 4.3 3.8 77.4 3.1 7.2 4.1
60 - 64 1,014 100.0 4.0 2.4 73.1 4.1 8.1 8.3
65+ 2,716 100.0 3.6 2.2 68.2 4.8 7.0 14.1
Female
Total 38,391 100.0 26.7 3.9 49.0 2.9 3.5 14.0
12-14 3,114 100.0 97.4 0.5 2.1 0.0 0.0 0.0
15 - 19 5,073 100.0 83.5 2.7 12.8 0.7 0.2 0.1
20 - 24 4,172 100.0 42.2 7.5 46.0 2.1 1.3 0.8
25 - 29 3,925 100.0 17.8 7.3 68.1 3.3 2.3 1.2
30 - 34 3,159 100.0 6.5 5.8 77.1 4.1 3.6 2.8
35 - 39 2,964 100.0 3.6 5.1 79.9 3.5 4.5 3.4
40 - 44 2,787 100.0 1.8 4.5 77.7 4.0 5.8 6.3
45 - 49 2,524 100.0 1.4 4.0 72.7 4.4 7.0 10.5
50 - 54 2,435 100.0 1.2 3.2 66.0 4.7 7.4 17.6
55 - 59 1,424 100.0 1.2 2.9 54.8 5.7 7.9 27.5
60 - 64 1,548 100.0 1.0 1.9 49.9 5.1 6.1 36.0
65+ 5,266 100.0 0.9 1.1 29.3 2.6 4.1 62.0 Source: Ghana Statistical Service, 2010 Population and Housing Census

27
Marital Status and Level of Education
Table 3.5 shows persons aged 12 years and older by sex, marital status and level of education
in the Ketu North District. The Table shows that the highest education attained for all the
marriage categories is basic education. For instance, majority of the never married (74.4%)
have attained basic education while more than half (51.0%) of the married have basic
education as their highest level of education attained. On the other hand, 79.0 percent of the
widowed have no education.
More than half of females and males (82.1% and 79.0% respectively) who are widowed have
no education. Among the married males, 1.7 percent has attained tertiary education as against
0.2 percent of their female cohorts who have attained tertiary education.
Table 3.5: Persons 12 years and older by sex, marital status and level of education
Sex/Marital status Number
All
levels
No
Education Basic1
Secon-
dary2
Voc/
Tech/
Comm
Post
middle/
secondary
certificate/
diploma3 Tertiary4
Both Sexes
Total 69,370 100.0 31.2 56.7 8.1 1.0 2.6 0.5
Never married 24,965 100.0 7.9 74.4 13.9 0.7 2.8 0.4
Informal/Consensual
union/Living together 2,506 100.0 27.5 60.8 7.1 1.6 2.7 0.3
Married 31,972 100.0 38.8 51.0 5.4 1.2 2.7 0.8
Separated 1,675 100.0 44.7 47.3 4.3 1.1 2.1 0.4
Divorced 2,189 100.0 47.0 45.8 3.4 1.4 1.9 0.5
Widowed 6,063 100.0 79.0 18.3 1.1 0.4 1.1 0.1
Male
Total 30,979 100.0 16.6 65.6 11.5 1.4 3.9 1.0
Never married 14,725 100.0 7.8 73.1 14.7 0.7 3.2 0.4
Informal/Consensual
union/Living together 992 100.0 13.1 67.2 11.3 3.2 4.4 0.7
Married 13,158 100.0 23.1 59.6 8.9 1.9 4.8 1.7
Separated 557 100.0 29.8 55.5 7.5 2.5 4.1 0.5
Divorced 844 100.0 30.3 59.7 5.1 1.3 2.4 1.2
Widowed 703 100.0 55.0 35.4 4.0 0.9 4.0 0.7
Female
Total 38,391 100.0 43.0 49.5 5.3 0.6 1.4 0.2
Never married 10,240 100.0 7.9 76.4 12.6 0.6 2.2 0.3
Informal/Consensual
union/Living together 1,514 100.0 36.9 56.6 4.4 0.5 1.5 0.0
Married 18,814 100.0 49.8 45.0 3.0 0.7 1.2 0.2
Separated 1,118 100.0 52.1 43.3 2.7 0.4 1.2 0.3
Divorced 1,345 100.0 57.4 37.0 2.4 1.5 1.6 0.1
Widowed 5,360 100.0 82.1 16.1 0.7 0.4 0.7 0.0 Source: Ghana Statistical Service, 2010 Population and Housing Census
Marital Status and Economic Activity
Table 3.6 provides information on economic activity status by marital status in the District.
The results reveal that a higher proportion (66.5%) of the never married is economically not
active with 31.2 percent being employed. Among the married, 85.6 percent are employed
while only 1.7 percent are unemployed. Table 3.6 further reveals that more married females
(14.4%) are economically not active as compared to their male counterparts (10.1%). Among
the never married males, 61.5 percent are economically not active with another 2.4 percent

28
being unemployed. On the other hand, 73.7 percent of never married females are
economically not active with 2.0 percent being unemployed.
Table 3.6: Marital status of persons 12 years and older by sex and activity status
Sex/Marital Status
All status Employed Unemployed
Economically not
active
Number Percent Number Percent Number Percent Number Percent
Both Sexes
Total 69,370 100.0
43,595 62.8
1,319 1.90
24,456 35.30
Never married 24,965 100.0
7,796 31.2
555 2.20
16,614 66.50
Informal/Consensual
union/Living
together 2,506 100.0
1,932 77.1
74 3.00
500 20.00
Married 31,972 100.0
27,379 85.6
557 1.70
4,036 12.60
Separated 1,675 100.0
1,321 78.9
30 1.80
324 19.30
Divorced 2,189 100.0
1,722 78.7
44 2.00
423 19.30
Widowed 6,063 100.0
3,445 56.8
59 1.00
2,559 42.20
Male
Total 30,979 100.0
19,362 62.5
554 1.80
11,063 35.70
Never married 14,725 100.0
5,313 36.1
349 2.40
9,063 61.50
Informal/Consensual
union/Living
together 992 100.0
872 87.9
14 1.40
106 10.70
Married 13,158 100.0
11,662 88.6
166 1.30
1,330 10.10
Separated 557 100.0
443 79.5
8 1.40
106 19.00
Divorced 844 100.0
660 78.2
11 1.30
173 20.50
Widowed 703 100.0
412 58.6
6 0.90
285 40.50
Female
Total 38,391 100.0
24,233 63.1
765 2.00
13,393 34.90
Never married 10,240 100.0
2,483 24.2
206 2.00
7,551 73.70
Informal/Consensual
union/Living
together 1,514 100.0
1,060 70.0
60 4.00
394 26.00
Married 18,814 100.0
15,717 83.5
391 2.10
2,706 14.40
Separated 1,118 100.0
878 78.5
22 2.00
218 19.50
Divorced 1,345 100.0
1,062 79.0
33 2.50
250 18.60
Widowed 5,360 100.0 3,033 56.6 53 1.00 2,274 42.40
Source: Ghana Statistical Service, 2010 Population and Housing Census.
3.4 Nationality
Table 3.7 shows the nationality of the population by sex in the Ketu North District. The
population of the District is dominated by Ghanaians (99.5%) as compared with an
insignificant proportion of non-Ghanaians (0.5%). Ghanaians by birth form majority (81.4%)
followed by Ghanaians with dual nationality (13.6%) and Ghanaians by naturalization
(4.5%). Of the non-Ghanaian population, ECOWAS nationals form an overwhelming
majority (92.0%).
There are more females with dual nationality (13.9%) than males (13.2%) in the same
category. Similarly, there are more female Ghanaians by naturalisation (4.6%) than males
with the same nationality (4.4%).

29
Table 3.7: Population by nationality and sex
Nationality
Both sexes Male Female
Number Percent Number Percent Number Percent
Total 99,913 100.0
46,551 100.0
53,362 100.0
Ghanaian by birth 81,326 81.4
38,000 81.6
43,326 81.2
Dual Nationality 13,553 13.6
6,153 13.2
7,400 13.9
Ghanaian by
Naturalisation 4,477 4.5
2,045 4.4
2,432 4.6
ECOWAS 513 0.5
318 0.7
195 0.4
African, other than
ECOWAS 13 0.0
8 0.0
5 0.0
Others 31 0.0 27 0.1 4 0.0 Source: Ghana Statistical Service, 2010 Population and Housing Census
3.5 Religious affiliation
Table 3.8 indicates the population of the district by religion and sex. The predominant
religion of the people in the Ketu North District is Christianity. The population who profess
to be Christians form the majority (55.6%) followed by traditionalists (33.5%) and Muslims
who constitute less than one percent (0.9%) of the district’s population. Table 3.8 further
reveals that 8.9 percent of the population are not affiliated to any religion.
Table 3.8 again shows that the Pentecost/Charismatic has the highest number of followers
(21.9%), followed by the Catholics with 12.3 percent. There are more females who are
Pentecostal/charismatic and Traditionalist (22.4% and 34.3% respectively) as compared to
their male counterparts (21.4% and 32.6% respectively).
Table 3.8: Population by religion and sex
Religious affiliation
Both sexes Male Female
Number Percent Number Percent Number Percent
Total 99,913 100.0
46,551 100.0
53,362 100.0
No religion 8,858 8.9
4,449 9.6
4,409 8.3
Catholic 12,245 12.3
5,881 12.6
6,364 11.9
Protestants 11,657 11.7
5,479 11.8
6,178 11.6
Pentecost/Charismatic 21,919 21.9
9,973 21.4
11,946 22.4
Other Christians 9,710 9.7
4,589 9.9
5,121 9.6
Islam 936 0.9
517 1.1
419 0.8
Traditionalist 33,505 33.5
15,183 32.6
18,322 34.3
Other 1,083 1.1 480 1.0 603 1.1 Source: Ghana Statistical Service, 2010 Population and Housing Census
3.6 Literacy and education
Literacy is defined here as the ability to read and write with understanding. In Ghana, most
people obtain this skill by enrolling in formal educational settings, although some obtain it
through informal evening or night classes. Table 3.9 presents the distribution of population
11 years and older by sex and literacy levels for the Ketu North District. The total population
aged 11 years and older in the District is 71,266 comprising of 44.9 percent males and 55.1
percent females. Generally, 30.5 percent of the population are not literate in any language
compared with 69.5 percent who are literate in at least one language. The analysis further
indicates that the proportion of the non-literate persons in the various age groups increase
with advancing age.. Only 4.8 percent of persons aged 11-14 years are non-literate in the

30
District. The highest proportion of the non-literate population is among those aged 65 years
and older.
In terms of sex, the majority of non-literate population are females. Table 3.9 reveals that
female non-literates are more than three times their male counterparts. In other words, three
out of every four non-literate persons in the District are females.
Among the literate population for both sexes, literacy in English and Ghanaian language is
dominant (71.5%) for all age groups. With the exception of 25-29 and 55-59 age groups, less
than one percent of the population in each of the other age categories are literate in all three
languages, namely English, French and Ghanaian language. Literacy in Ghanaian language
only is highest among the 40-44 years age group and 65 years and older age cohort with 24.8
percent and 23.8 percent respectively. Literacy in French Language is abysmally low across
all age groups and sex.
Table 3.9 again shows that a higher percentage of the females (42.1%) than the males
(16.3%) are non-literate in any language. It is also observed that among the literate
population, more males than females are literate in both English and Ghanaian language
(74.6% and 67.8% respectively), English and French (0.4% and 0.2% respectively), and all
the three languages (0.9% against 0.5%) while more females than their male counterparts are
literate in English only (9.4% against 6.7% respectively) and Ghanaian language only (22.1%
and 17.5% respectively).
Table 3.9: Population 11 years and older by sex, age and literacy status
Sex group
None
(not
literate)
Literate
(All) Total
English
only
Ghanaian
language
only
English
and
Ghanaian
language
English
and
French
English,
French and
Ghanaian
language
Both sexes
Total 21,749 49,517 100.0 7.9 19.6 71.5 0.3 0.7
12-14 387 8,089 100.0 12.5 23.7 63.2 0.2 0.3
15-19 760 9,922 100.0 9.0 15.7 74.6 0.2 0.6
20-24 1,148 7,101 100.0 7.7 14.0 77.0 0.3 0.9
25-29 1,363 5,529 100.0 7.8 18.8 71.9 0.4 1.0
30-34 1,549 3,998 100.0 6.4 20.6 71.7 0.5 0.9
35-39 1,812 3,387 100.0 6.2 22.6 70.2 0.3 0.7
40-44 2,078 2,606 100.0 5.8 24.8 68.3 0.5 0.7
45-49 1,942 2,441 100.0 4.9 23.7 70.8 - 0.6
50-54 1,992 2,172 100.0 4.9 20.9 72.8 0.6 0.8
55-59 1,143 1,303 100.0 4.6 20.3 73.5 0.2 1.5
60-64 1,485 1,077 100.0 4.3 19.5 75.1 0.3 0.8
65+ 6,090 1,892 100.0 5.0 23.8 70.2 0.1 0.8
Male
Total 5,207 26,768 100.0 6.7 17.5 74.6 0.4 0.9
12-14 210 4,252 100.0 12.2 24.2 63.1 0.2 0.4
15-19 313 5,296 100.0 8.1 16.0 75.1 0.2 0.6
20-24 357 3,720 100.0 5.9 11.1 81.5 0.3 1.2
25-29 367 2,600 100.0 6.3 14.7 77.0 0.7 1.3
30-34 344 2,044 100.0 5.8 16.2 76.0 0.7 1.3
35-39 347 1,888 100.0 4.9 19.1 74.8 0.4 0.8
40-44 436 1,461 100.0 4.2 20.7 73.4 0.6 1.0
45-49 405 1,454 100.0 4.3 18.8 75.9 - 0.9
50-54 444 1,285 100.0 3.4 17.4 77.2 0.9 1.1
55-59 265 757 100.0 3.6 15.5 78.9 0.3 1.8
60-64 313 701 100.0 2.7 16.7 79.5 0.4 0.7
65+ 1,406 1,310 100.0 3.6 20.9 74.3 0.2 1.1

31
Table 3.9: Population 11 years and older by sex, age and literacy status cont’d
Sex
group
None
(not
literate)
Literate
(All) Total
English
only
Ghanaian
language
only
English
and
Ghanaian
language
English
and
French
English,
French and
Ghanaian
language
Female
Total 16,542 22,749 100.0 9.4 22.1 67.8 0.2 0.5
12-14 177 3,837 100.0 12.8 23.2 63.4 0.3 0.3
15-19 447 4,626 100.0 10.1 15.3 73.9 0.1 0.6
20-24 791 3,381 100.0 9.8 17.2 72.1 0.3 0.6
25-29 996 2,929 100.0 9.2 22.5 67.4 0.2 0.8
30-34 1,205 1,954 100.0 7.0 25.3 67.1 0.2 0.5
35-39 1,465 1,499 100.0 7.8 27.1 64.4 0.2 0.5
40-44 1,642 1,145 100.0 7.7 29.9 61.7 0.3 0.4
45-49 1,537 987 100.0 5.8 30.8 63.2 - 0.2
50-54 1,548 887 100.0 7.1 25.9 66.5 0.1 0.3
55-59 878 546 100.0 6.0 26.9 66.1 - 0.9
60-64 1,172 376 100.0 7.2 24.7 67.0 - 1.1
65+ 4,684 582 100.0 8.1 30.4 61.2 - 0.3 Source: Ghana Statistical Service, 2010 Population and Housing Census
School attendance
Education plays a vital role in the development of a nation through human capital formation.
School enrolment and attendance ensures that the citizenry attain the needed level of
education for economic development. Figure 3.1 presents school attendance in the district by
sex. The figure shows that 27.9 percent of persons aged 3 years and older in the district have
never attended school. More females (37.3%) than males (17.0%) have never attended
school. Currently, 37.7 percent of persons 3 years and older in the district are attending
school.
Figure 3.1: School attendance by sex
Source: Ghana Statistical Service, 2010 Population and Housing Census
Table 3.10 shows the level of education for persons three years and older in the Ketu North
District. Over nine in every ten persons of the population currently attending school are at the
basic school level which comprises nursery, kindergarten, primary and JHS. Table 3.10
further shows that 92.9 percent of females in the District are currently in basic school
0.0
5.0
10.0
15.0
20.0
25.0
30.0
35.0
40.0
45.0
Total Male Female
27.9
17.0
37.3 37.7
43.6
32.6 34.4
39.4
30.1
Percent
Never
Now
Past

32
compared with 89.9 percent of males. Less than one percent (0.2%) of the population for
both males and females are in the technical/commercial school.
About four out of every five persons who have attended school in the past attained basic
education. It is observed that a relatively low proportion (3.2%) of the population has attained
tertiary education. With respect to secondary and tertiary level, analysis of the data in Table
3.10 shows that the trend is the same for the sexes. This could critically undermine quality
human resource supply in the District. Of the population who have attended school in the
past, technical/commercial has the least proportion (1.9%) and it is comparatively low for
females (1.5%) than their male counterparts (2.3%).
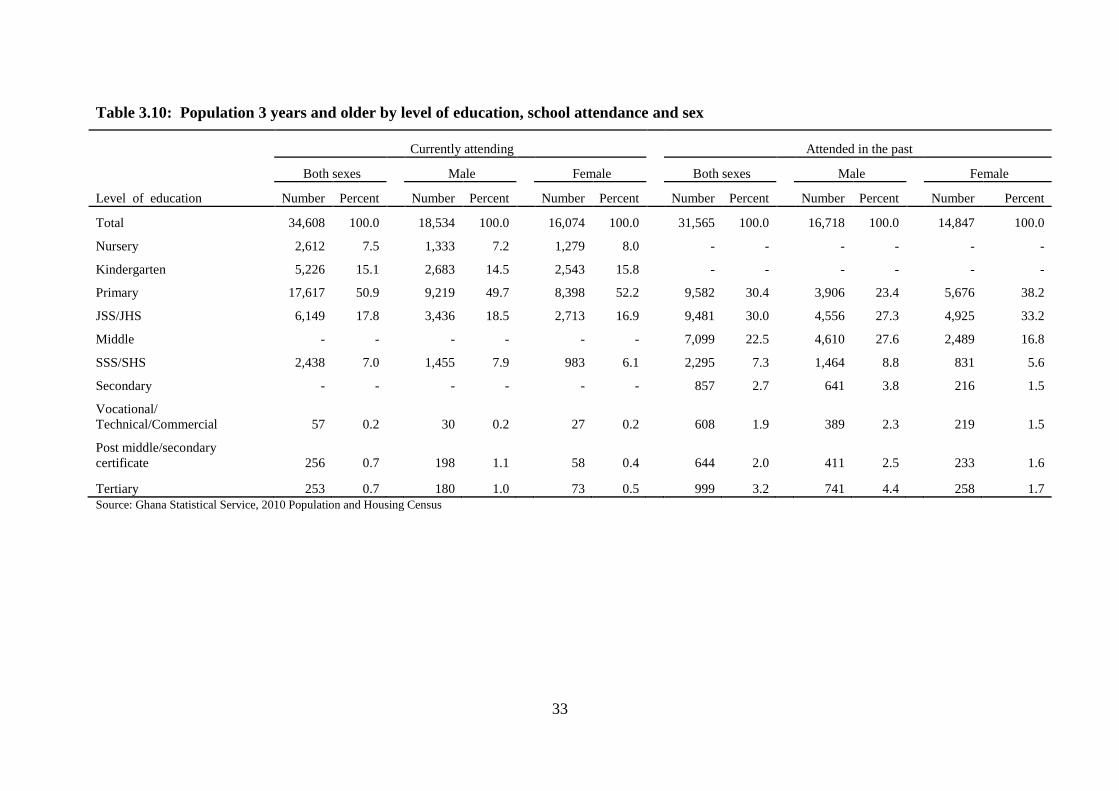
33
Table 3.10: Population 3 years and older by level of education, school attendance and sex
Level of education
Currently attending Attended in the past
Both sexes
Male
Female
Both sexes
Male
Female
Number Percent Number Percent Number Percent Number Percent Number Percent Number Percent
Total 34,608 100.0
18,534 100.0
16,074 100.0
31,565 100.0
16,718 100.0
14,847 100.0
Nursery 2,612 7.5
1,333 7.2
1,279 8.0
- -
- -
- -
Kindergarten 5,226 15.1
2,683 14.5
2,543 15.8
- -
- -
- -
Primary 17,617 50.9
9,219 49.7
8,398 52.2
9,582 30.4
3,906 23.4
5,676 38.2
JSS/JHS 6,149 17.8
3,436 18.5
2,713 16.9
9,481 30.0
4,556 27.3
4,925 33.2
Middle - -
- -
- -
7,099 22.5
4,610 27.6
2,489 16.8
SSS/SHS 2,438 7.0
1,455 7.9
983 6.1
2,295 7.3
1,464 8.8
831 5.6
Secondary - -
- -
- -
857 2.7
641 3.8
216 1.5
Vocational/
Technical/Commercial 57 0.2
30 0.2
27 0.2
608 1.9
389 2.3
219 1.5
Post middle/secondary
certificate 256 0.7
198 1.1
58 0.4
644 2.0
411 2.5
233 1.6
Tertiary 253 0.7 180 1.0 73 0.5 999 3.2 741 4.4 258 1.7
Source: Ghana Statistical Service, 2010 Population and Housing Census
33
CHAPTER FOUR
ECONOMIC CHARACTERISTICS
4.1 Introduction
The nature, type and size of the labour force are critical factors in the production of goods
and services. Labour force participation is a key element of economic growth and well-being
of a population.
As a result of the very important position of labour in the production process, knowledge of
the current size and characteristics of the labour force and its variation over time is vital for
policy interventions for maximum development and utilization of these human resources.
This chapter discusses data on the economic activity status of the population, occupation and
industry, employment status and sector of the employed population in the District.
4.2 Economic activity status
Table 4.1 presents the population distribution of persons aged 15 years and older by sex and
economic activity status. Out of the total population of persons aged 15 years and older, 70.2
percent are economically active while 29.8 percent are economically not active. Table 4.1
shows that the economically active population in the District is higher than the regional
average of 69.9 percent (GSS, 2013). Table 4.1 further shows that the proportion of persons
who are economically active is higher among males (70.4%) than their female counterparts
(69.9%).
In terms of employment status, Table 4.1 again shows that majority (97.2%) of the
economically active population are employed in the District. Further analysis shows that
slightly higher proportions of females than males are without employment (3.1% for females
and 2.8% for males).
More females (42.6%) than males (32.1%) who are unemployed during the Census have
worked before. Of the population who are economically not active, persons in full time
education (47.7%) and those considered as too old or too young to do any work (16.7%) form
the majority.
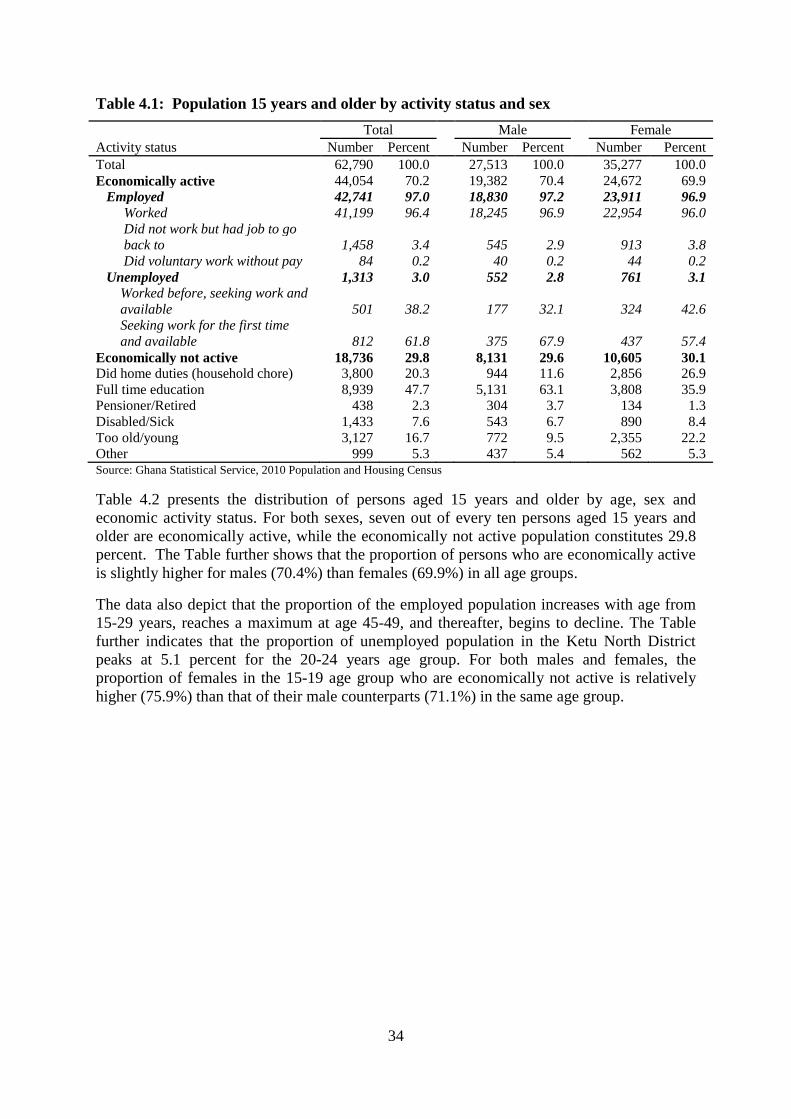
34
Table 4.1: Population 15 years and older by activity status and sex
Activity status
Total Male Female
Number Percent Number Percent Number Percent
Total 62,790 100.0
27,513 100.0
35,277 100.0
Economically active 44,054 70.2
19,382 70.4
24,672 69.9
Employed 42,741 97.0
18,830 97.2
23,911 96.9
Worked 41,199 96.4
18,245 96.9
22,954 96.0
Did not work but had job to go 1,458 3.4
545 2.9
913 3.8 back to
Did voluntary work without pay 84 0.2
40 0.2
44 0.2
Unemployed 1,313 3.0
552 2.8
761 3.1
Worked before, seeking work and
501 38.2
177 32.1
324 42.6 available
Seeking work for the first time
812 61.8
375 67.9
437 57.4 and available
Economically not active 18,736 29.8
8,131 29.6
10,605 30.1
Did home duties (household chore) 3,800 20.3
944 11.6
2,856 26.9
Full time education 8,939 47.7
5,131 63.1
3,808 35.9
Pensioner/Retired 438 2.3
304 3.7
134 1.3
Disabled/Sick 1,433 7.6
543 6.7
890 8.4
Too old/young 3,127 16.7
772 9.5
2,355 22.2
Other 999 5.3 437 5.4 562 5.3 Source: Ghana Statistical Service, 2010 Population and Housing Census
Table 4.2 presents the distribution of persons aged 15 years and older by age, sex and
economic activity status. For both sexes, seven out of every ten persons aged 15 years and
older are economically active, while the economically not active population constitutes 29.8
percent. The Table further shows that the proportion of persons who are economically active
is slightly higher for males (70.4%) than females (69.9%) in all age groups.
The data also depict that the proportion of the employed population increases with age from
15-29 years, reaches a maximum at age 45-49, and thereafter, begins to decline. The Table
further indicates that the proportion of unemployed population in the Ketu North District
peaks at 5.1 percent for the 20-24 years age group. For both males and females, the
proportion of females in the 15-19 age group who are economically not active is relatively
higher (75.9%) than that of their male counterparts (71.1%) in the same age group.

35
Table 4.2: Population 15 years and older by sex, age and activity status
Sex/Age
group
All status Employed Unemployed
Economically not
active
Number Percent Number Percent Number Percent Number Percent
Both Sexes
Total 62,790 100.0
42,741 68.1
1,313 2.1
18,736 29.8
15-19 10,682 100.0
2,651 24.8
192 1.8
7,839 73.4
20-24 8,249 100.0
4,412 53.5
419 5.1
3,418 41.4
25-29 6,892 100.0
5,428 78.8
253 3.7
1,211 17.6
30-34 5,547 100.0
4,816 86.8
142 2.6
589 10.6
35-39 5,199 100.0
4,736 91.1
76 1.5
387 7.4
40-44 4,684 100.0
4,326 92.4
51 1.1
307 6.6
45-49 4,383 100.0
4,056 92.5
30 0.7
297 6.8
50-54 4,164 100.0
3,829 92.0
35 0.8
300 7.2
55-59 2,446 100.0
2,186 89.4
17 0.7
243 9.9
60-64 2,562 100.0
2,036 79.5
32 1.2
494 19.3
65+ 7,982 100.0
4,265 53.4
66 0.8
3,651 45.7
Male
Total 27,513 100.0
18,830 68.4
552 2.0
8,131 29.6
15-19 5,609 100.0
1,546 27.6
74 1.3
3,989 71.1
20-24 4,077 100.0
2,113 51.8
180 4.4
1,784 43.8
25-29 2,967 100.0
2,376 80.1
111 3.7
480 16.2
30-34 2,388 100.0
2,146 89.9
63 2.6
179 7.5
35-39 2,235 100.0
2,089 93.5
35 1.6
111 5.0
40-44 1,897 100.0
1,792 94.5
15 0.8
90 4.7
45-49 1,859 100.0
1,757 94.5
12 0.6
90 4.8
50-54 1,729 100.0
1,603 92.7
19 1.1
107 6.2
55-59 1,022 100.0
943 92.3
4 0.4
75 7.3
60-64 1,014 100.0
819 80.8
19 1.9
176 17.4
65+ 2,716 100.0
1,646 60.6
20 0.7
1,050 38.7
Female
Total 35,277 100.0
23,911 67.8
761 2.2
10,605 30.1
15-19 5,073 100.0
1,105 21.8
118 2.3
3,850 75.9
20-24 4,172 100.0
2,299 55.1
239 5.7
1,634 39.2
25-29 3,925 100.0
3,052 77.8
142 3.6
731 18.6
30-34 3,159 100.0
2,670 84.5
79 2.5
410 13.0
35-39 2,964 100.0
2,647 89.3
41 1.4
276 9.3
40-44 2,787 100.0
2,534 90.9
36 1.3
217 7.8
45-49 2,524 100.0
2,299 91.1
18 0.7
207 8.2
50-54 2,435 100.0
2,226 91.4
16 0.7
193 7.9
55-59 1,424 100.0
1,243 87.3
13 0.9
168 11.8
60-64 1,548 100.0
1,217 78.6
13 0.8
318 20.5
65+ 5,266 100.0 2,619 49.7 46 0.9 2,601 49.4 Source: Ghana Statistical Service, 2010 Population and Housing Census
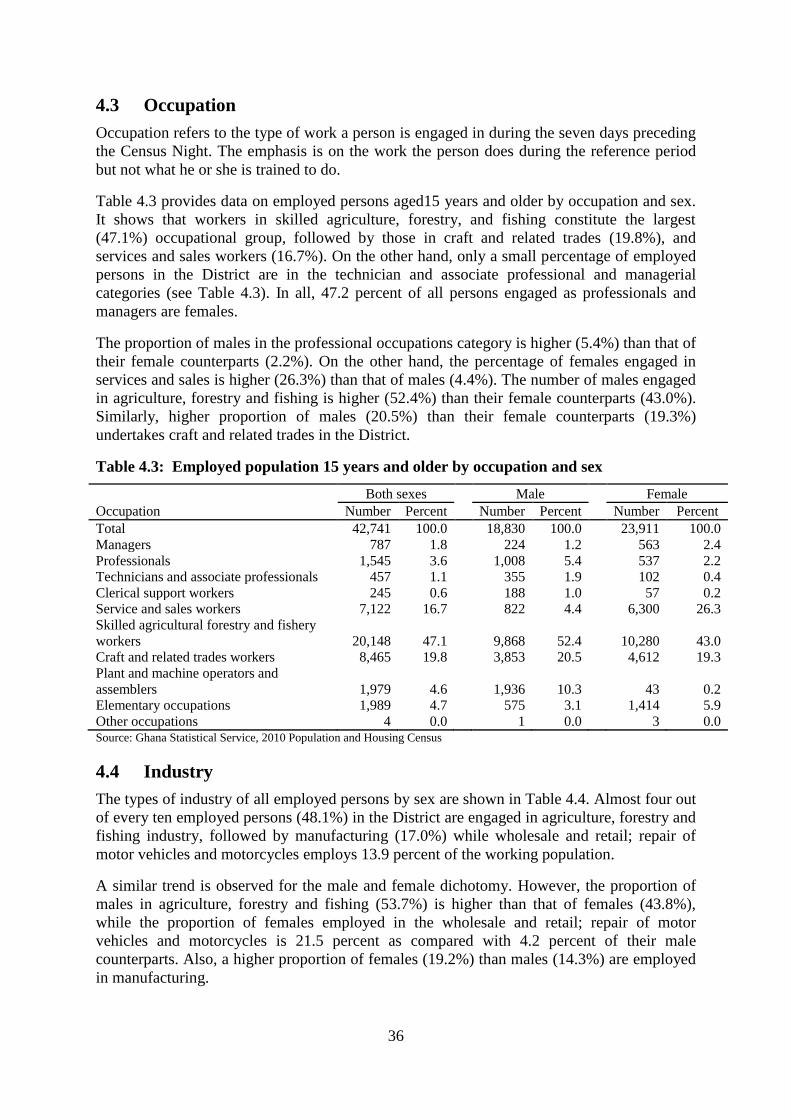
36
4.3 Occupation
Occupation refers to the type of work a person is engaged in during the seven days preceding
the Census Night. The emphasis is on the work the person does during the reference period
but not what he or she is trained to do.
Table 4.3 provides data on employed persons aged15 years and older by occupation and sex.
It shows that workers in skilled agriculture, forestry, and fishing constitute the largest
(47.1%) occupational group, followed by those in craft and related trades (19.8%), and
services and sales workers (16.7%). On the other hand, only a small percentage of employed
persons in the District are in the technician and associate professional and managerial
categories (see Table 4.3). In all, 47.2 percent of all persons engaged as professionals and
managers are females.
The proportion of males in the professional occupations category is higher (5.4%) than that of
their female counterparts (2.2%). On the other hand, the percentage of females engaged in
services and sales is higher (26.3%) than that of males (4.4%). The number of males engaged
in agriculture, forestry and fishing is higher (52.4%) than their female counterparts (43.0%).
Similarly, higher proportion of males (20.5%) than their female counterparts (19.3%)
undertakes craft and related trades in the District.
Table 4.3: Employed population 15 years and older by occupation and sex
Occupation
Both sexes Male Female
Number Percent Number Percent Number Percent
Total 42,741 100.0
18,830 100.0
23,911 100.0
Managers 787 1.8
224 1.2
563 2.4
Professionals 1,545 3.6
1,008 5.4
537 2.2
Technicians and associate professionals 457 1.1
355 1.9
102 0.4
Clerical support workers 245 0.6
188 1.0
57 0.2
Service and sales workers 7,122 16.7
822 4.4
6,300 26.3
Skilled agricultural forestry and fishery
workers 20,148 47.1
9,868 52.4
10,280 43.0
Craft and related trades workers 8,465 19.8
3,853 20.5
4,612 19.3
Plant and machine operators and
assemblers 1,979 4.6
1,936 10.3
43 0.2
Elementary occupations 1,989 4.7
575 3.1
1,414 5.9
Other occupations 4 0.0 1 0.0 3 0.0 Source: Ghana Statistical Service, 2010 Population and Housing Census
4.4 Industry
The types of industry of all employed persons by sex are shown in Table 4.4. Almost four out
of every ten employed persons (48.1%) in the District are engaged in agriculture, forestry and
fishing industry, followed by manufacturing (17.0%) while wholesale and retail; repair of
motor vehicles and motorcycles employs 13.9 percent of the working population.
A similar trend is observed for the male and female dichotomy. However, the proportion of
males in agriculture, forestry and fishing (53.7%) is higher than that of females (43.8%),
while the proportion of females employed in the wholesale and retail; repair of motor
vehicles and motorcycles is 21.5 percent as compared with 4.2 percent of their male
counterparts. Also, a higher proportion of females (19.2%) than males (14.3%) are employed
in manufacturing.

37
Table 4.4: Employed population 15 years and older by industry and sex
Industry
Both sexes Male Female
Number Percent Number Percent Number Percent
Total 42,741 100.0
18,830 100.0
23,911 100.0
Agriculture forestry and fishing 20,574 48.1
10,105 53.7
10,469 43.8
Mining and quarrying 14 0.0
9 0.0
5 0.0
Manufacturing 7,280 17.0
2,699 14.3
4,581 19.2
Electricity gas stream and air
conditioning supply 11 0.0
11 0.1
0 0.0
Water supply; sewerage waste
management and remediation
activities 80 0.2
40 0.2
40 0.2
Construction 1,187 2.8
1,164 6.2
23 0.1
Wholesale and retail; repair of
motor vehicles and motorcycles 5,948 13.9
800 4.2
5,148 21.5
Transportation and storage 1,769 4.1
1,740 9.2
29 0.1
Accommodation and food service
activities 1,924 4.5
132 0.7
1,792 7.5
Information and communication 16 0.0
13 0.1
3 0.0
Financial and insurance activities 61 0.1
47 0.2
14 0.1
Real estate activities 0 0.0
0 0.0
0 0.0
Professional scientific and
technical activities 77 0.2
65 0.3
12 0.1
Administrative and support service
activities 52 0.1
47 0.2
5 0.0
Public administration and defence;
compulsory social security 376 0.9
293 1.6
83 0.3
Education 1,279 3.0
840 4.5
439 1.8
Human health and social work
activities 341 0.8
195 1.0
146 0.6
Arts entertainment and recreation 168 0.4
158 0.8
10 0.0
Other service activities 1,419 3.3
421 2.2
998 4.2
Activities of households as
employers 165 0.4
51 0.3
114 0.5
Activities of extraterritorial
organizations and bodies 0 0.0 0 0.0 0 0.0 Source: Ghana Statistical Service, 2010 Population and Housing Census
4.5 Employment status
The employment status examines position of persons in the establishment where they work.
Table 4.5 shows that, 77.3 percent of the employed population is self-employed without
employees. The proportion of the people recorded as employee is 8.7 percent while 8.0
percent are contributing family workers. The proportion of male self-employed without
employees is 71.5 percent compared with 81.9 percent for females.
Table 4.5 shows that males who are self-employed with employees constitute 2.4 percent of
the employed as against 1.7 percent for their female counterparts.
The population who work as employees is significantly low for all sexes (8.7%) and it is
relatively low for females (4.1%) as compared with 14.1 percent for their male counterparts
(see Table 5.5). This is a situation that puts women at a disadvantage economically and
undermines their capacity to meet their household needs.
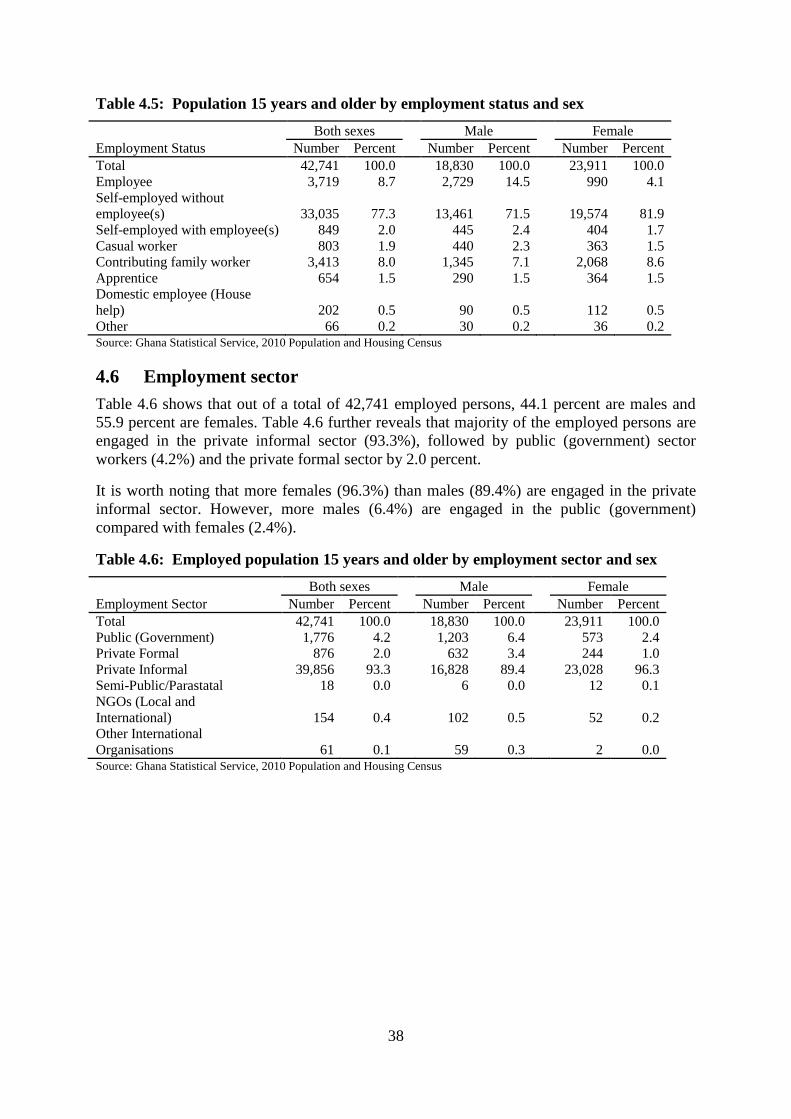
38
Table 4.5: Population 15 years and older by employment status and sex
Employment Status
Both sexes Male Female
Number Percent Number Percent Number Percent
Total 42,741 100.0
18,830 100.0
23,911 100.0
Employee 3,719 8.7
2,729 14.5
990 4.1
Self-employed without
employee(s) 33,035 77.3
13,461 71.5
19,574 81.9
Self-employed with employee(s) 849 2.0
445 2.4
404 1.7
Casual worker 803 1.9
440 2.3
363 1.5
Contributing family worker 3,413 8.0
1,345 7.1
2,068 8.6
Apprentice 654 1.5
290 1.5
364 1.5
Domestic employee (House
help) 202 0.5
90 0.5
112 0.5
Other 66 0.2 30 0.2 36 0.2 Source: Ghana Statistical Service, 2010 Population and Housing Census
4.6 Employment sector
Table 4.6 shows that out of a total of 42,741 employed persons, 44.1 percent are males and
55.9 percent are females. Table 4.6 further reveals that majority of the employed persons are
engaged in the private informal sector (93.3%), followed by public (government) sector
workers (4.2%) and the private formal sector by 2.0 percent.
It is worth noting that more females (96.3%) than males (89.4%) are engaged in the private
informal sector. However, more males (6.4%) are engaged in the public (government)
compared with females (2.4%).
Table 4.6: Employed population 15 years and older by employment sector and sex
Employment Sector
Both sexes Male Female
Number Percent Number Percent Number Percent
Total 42,741 100.0
18,830 100.0
23,911 100.0
Public (Government) 1,776 4.2
1,203 6.4
573 2.4
Private Formal 876 2.0
632 3.4
244 1.0
Private Informal 39,856 93.3
16,828 89.4
23,028 96.3
Semi-Public/Parastatal 18 0.0
6 0.0
12 0.1
NGOs (Local and
International) 154 0.4
102 0.5
52 0.2
Other International
Organisations 61 0.1 59 0.3 2 0.0 Source: Ghana Statistical Service, 2010 Population and Housing Census

39
CHAPTER FIVE
INFORMATION COMMUNICATION TECHNOLOGY
5.1 Introduction
Information communications technology (ICT) is recognized as an important component of
socio-economic development in contemporary times. ICT has been identified as a significant
factor to bring about transformation by creating an enabling environment. As a result of the
introduction of ICT, it is possible to quickly find and distribute information. It is in line with
this that the government has been implementing policies and programmes to expand access to
ICT infrastructure.
This chapter analyses ownership of mobile phones and usage of internet by persons aged 12
years and older as well as household ownership of fixed telephone lines and desktop or laptop
computers in the Ketu North District.
5.2 Ownership of mobile phones
Analysis of ownership of mobile phones covers persons aged 12 years and older in the
District. Table 5.1 shows that 36.9 percent of the population aged 12 years and older in the
District own mobile phones. This is lower than the regional average of 37.3 percent. The sex
composition of the ownership of mobile phones shows that a higher proportion of males
(44.2%) than females (30.9%) in the Ketu North District own mobile phones.
Table 5.1: Population 12 years and older by sex, mobile phone
Ownership and internet facility usage
Sex
Population 12
years and older
Population owing
mobile phone
Population using
internet facility
Number Percent Number Percent Number Percent
Total 69,370 100.0
25,564 36.9
1,149 1.7
Male 30,979 100.0
13,690 44.2
849 2.7
Female 38,391 100.0 11,874 30.9 300 0.8 Source: Ghana Statistical Service, 2010 Population and Housing Census
5.3 Use of internet
As indicated in Table 5.1 internet usage among persons 12 years and older in the Ketu North
District is only 1.7 percent as compared with the regional internet usage of 3.5 percent. The
results also show that a higher percentage of males (2.7%) have access to and use the internet
as compared with only 0.8 percent of their female counterparts.
5.4 Household ownership of fixed telephone lines
Data on household ownership of fixed telephone lines in the Ketu North District is shown in
Table 5.2. The data indicate that less than one percent (0.5%) of the 26,437 households in the
District has fixed telephone lines. The Table further shows that a higher proportion of male
headed households (0.5%) have fixed telephone lines as compared with female headed
households (0.4%) in the District.

40
Table 5.2: Household heads by sex, ownership of desktop/laptop computers
and fixed telephone lines
Sex
Number of
households
Households
having computers
Households having
fixed telephone
lines
Number Percent
Number Percent
Number Percent
Total 26,437 100.0
375 1.4
126 0.5
Male 14,496 54.8
275 1.9
78 0.5
Female 11,941 45.2 100 0.8 48 0.4 Source: Ghana Statistical Service, 2010 Population and Housing Census
5.4 Household ownership of desktop or laptop computer
As shown in Table 5.2, the percentage of households which own desktop or laptop computer
in the Ketu North District stands at 1.4 percent. In terms of sex composition, 1.9 percent of
males and 0.8% percent of females in the District own desktop or laptop computer.

41
CHAPTER SIX
DISABILITY
6.1 Introduction
Over the past few decades there has been an international consensus on the recognition of the
rights of persons with disabilities with emphasis on the promotion of their dignity, and
inclusive development. Evidence is needed to make informed decisions on policies and
programmes on people with disability. Knowing the characteristics and understanding the
number of people with disabilities and their circumstances can enhance policies that address
barriers that prevent persons with disabilities (PWDs) from participating more effectively in
national development.
Persons with disability are defined as those who are unable to or restricted in the performance
of specific tasks or activities due to loss of function of some part of the body as a result of
impairment or malformation. Information was collected on persons with visual or sight
impairment, hearing impairment, mental retardation, emotional or behavioural disorders and
other physical challenges. The 2010 Population and Housing Census is the first census in the
country to include questions on disabilities.
This chapter presents data on prevalence of disability, and the social-demographic
characteristics of people with disabilities in the Ketu North District.
6.2 Population with disability
According to the National Report on Disability (GSS, 2012) about two out of every five of
the population with disabilities (38.3%) have more than one type of disability condition
nationally. Similarly, almost the same proportions of males (38.2%) and females (38.5%)
have more than one type of disability.
The proportion of persons with disability by type of disability is shown in Table 6.1. The
Table shows that 3,956 persons constituting 4.0 percent of the total population in the Ketu
North District are experiencing one form of disability or the other. This figure is lower than
the regional average of 4.3 percent. Table 6.1 further shows that 4.2 percent of females in the
district are with disability as against 3.6 percent of males. In terms of the types of disabilities
by sex, relatively higher percentage of females reported multiple disabilities than males. A
number of people reported multiple disabilities.
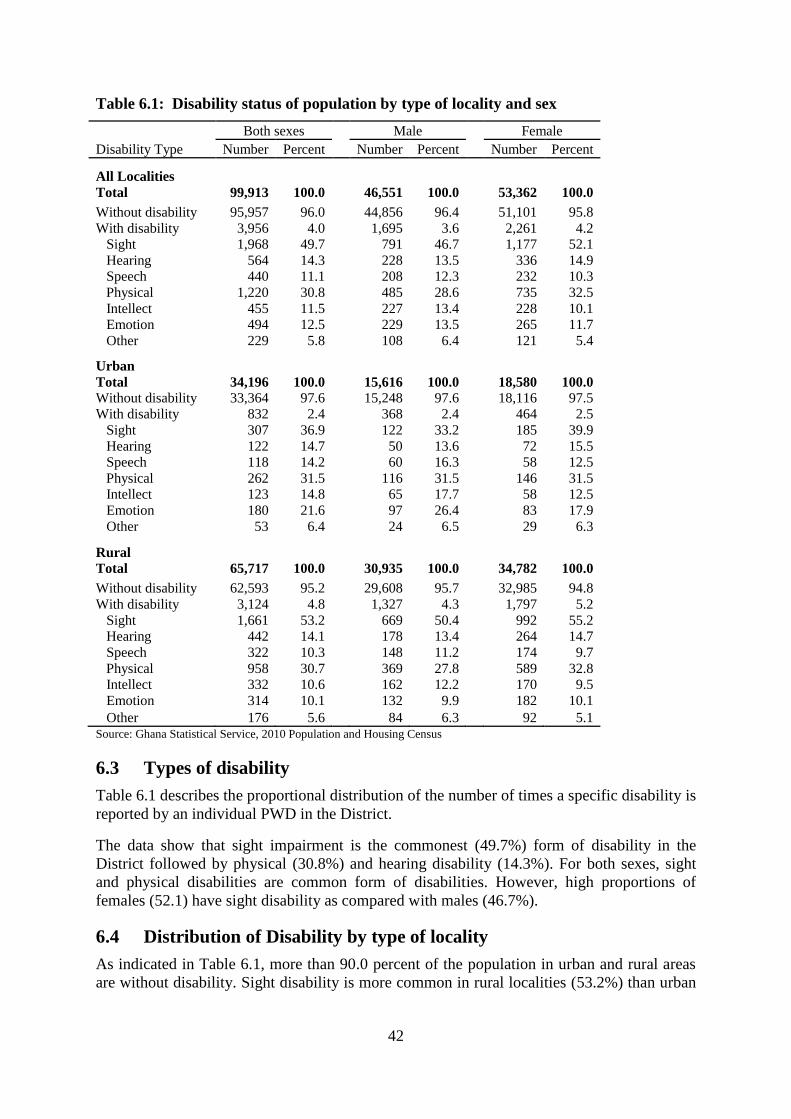
42
Table 6.1: Disability status of population by type of locality and sex
Disability Type
Both sexes Male Female
Number Percent Number Percent Number Percent
All Localities
Total 99,913 100.0
46,551 100.0
53,362 100.0
Without disability 95,957 96.0
44,856 96.4
51,101 95.8
With disability 3,956 4.0
1,695 3.6
2,261 4.2
Sight 1,968 49.7
791 46.7
1,177 52.1
Hearing 564 14.3
228 13.5
336 14.9
Speech 440 11.1
208 12.3
232 10.3
Physical 1,220 30.8
485 28.6
735 32.5
Intellect 455 11.5
227 13.4
228 10.1
Emotion 494 12.5
229 13.5
265 11.7
Other 229 5.8
108 6.4
121 5.4
Urban
Total 34,196 100.0
15,616 100.0
18,580 100.0
Without disability 33,364 97.6
15,248 97.6
18,116 97.5
With disability 832 2.4
368 2.4
464 2.5
Sight 307 36.9
122 33.2
185 39.9
Hearing 122 14.7
50 13.6
72 15.5
Speech 118 14.2
60 16.3
58 12.5
Physical 262 31.5
116 31.5
146 31.5
Intellect 123 14.8
65 17.7
58 12.5
Emotion 180 21.6
97 26.4
83 17.9
Other 53 6.4
24 6.5
29 6.3
Rural
Total 65,717 100.0
30,935 100.0
34,782 100.0
Without disability 62,593 95.2
29,608 95.7
32,985 94.8
With disability 3,124 4.8
1,327 4.3
1,797 5.2
Sight 1,661 53.2
669 50.4
992 55.2
Hearing 442 14.1
178 13.4
264 14.7
Speech 322 10.3
148 11.2
174 9.7
Physical 958 30.7
369 27.8
589 32.8
Intellect 332 10.6
162 12.2
170 9.5
Emotion 314 10.1
132 9.9
182 10.1
Other 176 5.6 84 6.3 92 5.1 Source: Ghana Statistical Service, 2010 Population and Housing Census
6.3 Types of disability
Table 6.1 describes the proportional distribution of the number of times a specific disability is
reported by an individual PWD in the District.
The data show that sight impairment is the commonest (49.7%) form of disability in the
District followed by physical (30.8%) and hearing disability (14.3%). For both sexes, sight
and physical disabilities are common form of disabilities. However, high proportions of
females (52.1) have sight disability as compared with males (46.7%).
6.4 Distribution of Disability by type of locality
As indicated in Table 6.1, more than 90.0 percent of the population in urban and rural areas
are without disability. Sight disability is more common in rural localities (53.2%) than urban
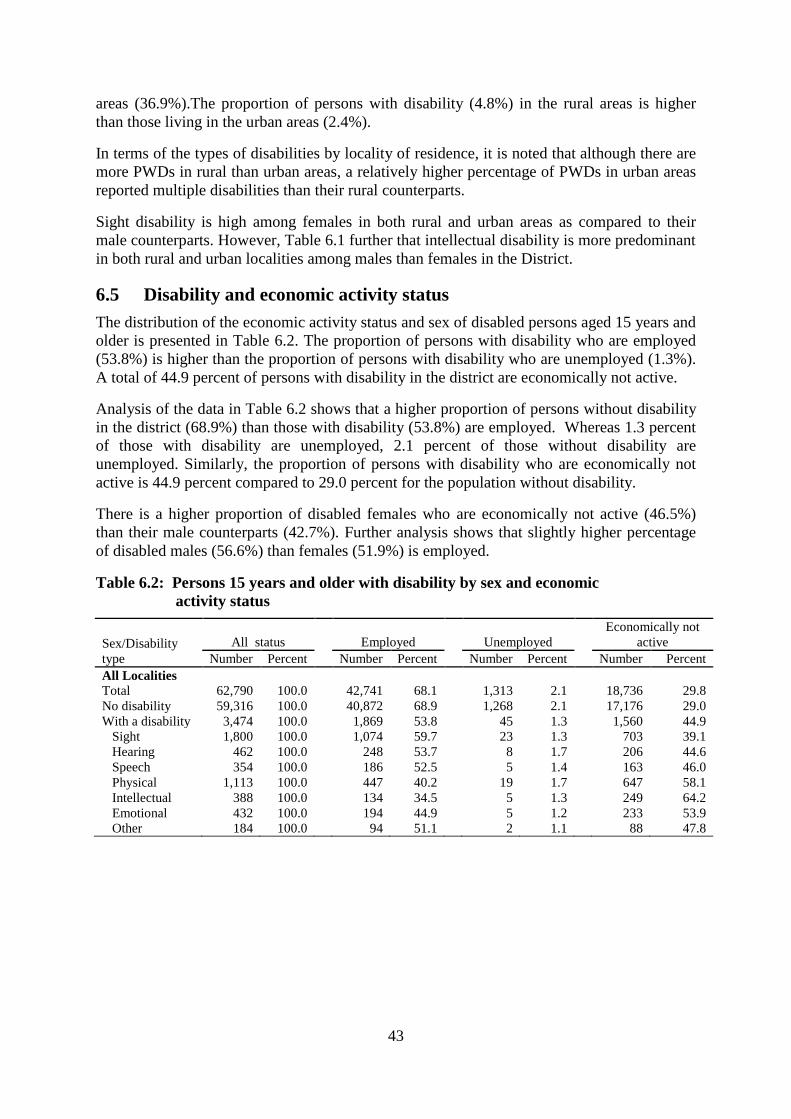
43
areas (36.9%).The proportion of persons with disability (4.8%) in the rural areas is higher
than those living in the urban areas (2.4%).
In terms of the types of disabilities by locality of residence, it is noted that although there are
more PWDs in rural than urban areas, a relatively higher percentage of PWDs in urban areas
reported multiple disabilities than their rural counterparts.
Sight disability is high among females in both rural and urban areas as compared to their
male counterparts. However, Table 6.1 further that intellectual disability is more predominant
in both rural and urban localities among males than females in the District.
6.5 Disability and economic activity status
The distribution of the economic activity status and sex of disabled persons aged 15 years and
older is presented in Table 6.2. The proportion of persons with disability who are employed
(53.8%) is higher than the proportion of persons with disability who are unemployed (1.3%).
A total of 44.9 percent of persons with disability in the district are economically not active.
Analysis of the data in Table 6.2 shows that a higher proportion of persons without disability
in the district (68.9%) than those with disability (53.8%) are employed. Whereas 1.3 percent
of those with disability are unemployed, 2.1 percent of those without disability are
unemployed. Similarly, the proportion of persons with disability who are economically not
active is 44.9 percent compared to 29.0 percent for the population without disability.
There is a higher proportion of disabled females who are economically not active (46.5%)
than their male counterparts (42.7%). Further analysis shows that slightly higher percentage
of disabled males (56.6%) than females (51.9%) is employed.
Table 6.2: Persons 15 years and older with disability by sex and economic
activity status
Sex/Disability
type
All status Employed Unemployed
Economically not
active
Number Percent Number Percent Number Percent Number Percent
All Localities
Total 62,790 100.0
42,741 68.1
1,313 2.1
18,736 29.8
No disability 59,316 100.0
40,872 68.9
1,268 2.1
17,176 29.0
With a disability 3,474 100.0
1,869 53.8
45 1.3
1,560 44.9
Sight 1,800 100.0
1,074 59.7
23 1.3
703 39.1
Hearing 462 100.0
248 53.7
8 1.7
206 44.6
Speech 354 100.0
186 52.5
5 1.4
163 46.0
Physical 1,113 100.0
447 40.2
19 1.7
647 58.1
Intellectual 388 100.0
134 34.5
5 1.3
249 64.2
Emotional 432 100.0
194 44.9
5 1.2
233 53.9
Other 184 100.0
94 51.1
2 1.1
88 47.8

44
Table 6.2: Persons 15 years and older with disability by sex and economic
activity status cont’d
Sex/Disability
type
All status Employed Unemployed
Economically not
active
Number Percent Number Percent Number Percent Number Percent
Male
Total 27,513 100.0
18,830 68.4
552 2.0
8,131 29.6
No disability 26,083 100.0
18,021 69.1
541 2.1
7,521 28.8
With a disability 1,430 100.0
809 56.6
11 0.8
610 42.7
Sight 702 100.0
441 62.8
4 0.6
257 36.6
Hearing 174 100.0
104 59.8
3 1.7
67 38.5
Speech 164 100.0
98 59.8
2 1.2
64 39.0
Physical 426 100.0
182 42.7
3 0.7
241 56.6
Intellectual 193 100.0
74 38.3
3 1.6
116 60.1
Emotional 197 100.0
95 48.2
4 2.0
98 49.7
Other 81 100.0
40 49.4
1 1.2
40 49.4
Female
Total 35,277 100.0
23,911 67.8
761 2.2
10,605 30.1
No disability 33,233 100.0
22,851 68.8
727 2.2
9,655 29.1
With a disability 2,044 100.0
1,060 51.9
34 1.7
950 46.5
Sight 1,098 100.0
633 57.7
19 1.7
446 40.6
Hearing 288 100.0
144 50.0
5 1.7
139 48.3
Speech 190 100.0
88 46.3
3 1.6
99 52.1
Physical 687 100.0
265 38.6
16 2.3
406 59.1
Intellectual 195 100.0
60 30.8
2 1.0
133 68.2
Emotional 235 100.0
99 42.1
1 0.4
135 57.4
Other 103 100.0 54 52.4 1 1.0 48 46.6
Source: Ghana Statistical Service, 2010 Population and Housing Census
6.6 Disability and level of education
Table 6.3 shows the level of education of persons three years and older with disability. It
emerged from the analysis that persons with disability generally have low levels of education.
For instance, 53.6 percent of persons with disability in the District have never been to school
as compared with 26.8 percent of those without disability who have never been to school. A
total of 38.3 percent of persons with disability in the District have basic education (primary,
JSS/JHS or middle school) compared to 55.1 percent of those without disability. Less than
10.0 percent (5.9%) of persons with disability have secondary/SHS or tertiary education as
against 9.3 percent of persons without disability. There is no significant variation between
males and females with disability in terms of education.
Table 6.3 shows that a higher proportion of females with disability (66.6%) than their male
counterparts (36.0%) have never attended school and only 28.4 percent of the females
attained basic education as compared to 51.7 percent for their male counterparts. At least two
reasons could be offered to explain the relatively low educational levels of persons with
disabilities. The major reason is the inadequate number of special schools for persons with
disabilities. Unlike conventional schools, the locations of special schools may be far from
where they reside and could pose some constraints. Those who enrol in conventional schools
are disadvantaged because facilities in such schools hardly facilitate teaching and learning for
persons with disabilities. It is also likely that some parents do not find the need to send their
children with disability to school, because of the nature and form of disability.
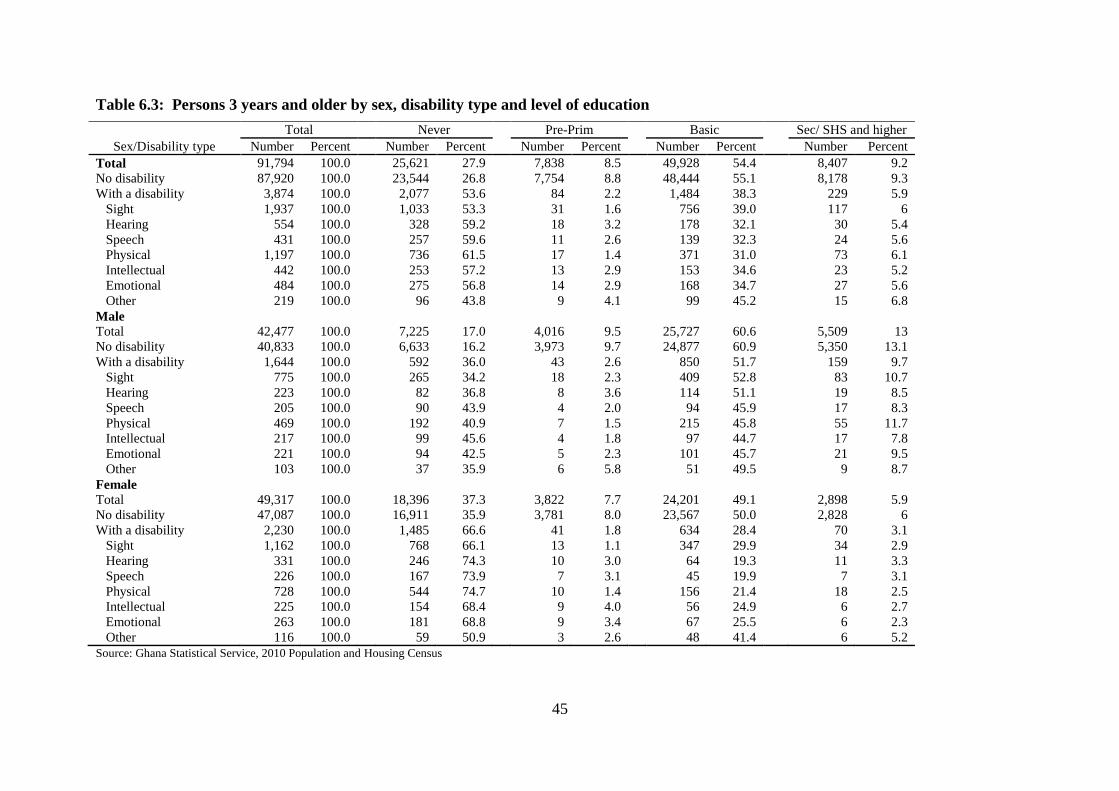
45
Table 6.3: Persons 3 years and older by sex, disability type and level of education
Sex/Disability type
Total Never Pre-Prim Basic
Sec/ SHS and higher
Number Percent Number Percent Number Percent Number Percent Number Percent
Total 91,794 100.0
25,621 27.9
7,838 8.5
49,928 54.4
8,407 9.2
No disability 87,920 100.0
23,544 26.8
7,754 8.8
48,444 55.1
8,178 9.3
With a disability 3,874 100.0
2,077 53.6
84 2.2
1,484 38.3
229 5.9
Sight 1,937 100.0
1,033 53.3
31 1.6
756 39.0
117 6
Hearing 554 100.0
328 59.2
18 3.2
178 32.1
30 5.4
Speech 431 100.0
257 59.6
11 2.6
139 32.3
24 5.6
Physical 1,197 100.0
736 61.5
17 1.4
371 31.0
73 6.1
Intellectual 442 100.0
253 57.2
13 2.9
153 34.6
23 5.2
Emotional 484 100.0
275 56.8
14 2.9
168 34.7
27 5.6
Other 219 100.0
96 43.8
9 4.1
99 45.2
15 6.8
Male
Total 42,477 100.0
7,225 17.0
4,016 9.5
25,727 60.6
5,509 13
No disability 40,833 100.0
6,633 16.2
3,973 9.7
24,877 60.9
5,350 13.1
With a disability 1,644 100.0
592 36.0
43 2.6
850 51.7
159 9.7
Sight 775 100.0
265 34.2
18 2.3
409 52.8
83 10.7
Hearing 223 100.0
82 36.8
8 3.6
114 51.1
19 8.5
Speech 205 100.0
90 43.9
4 2.0
94 45.9
17 8.3
Physical 469 100.0
192 40.9
7 1.5
215 45.8
55 11.7
Intellectual 217 100.0
99 45.6
4 1.8
97 44.7
17 7.8
Emotional 221 100.0
94 42.5
5 2.3
101 45.7
21 9.5
Other 103 100.0
37 35.9
6 5.8
51 49.5
9 8.7
Female
Total 49,317 100.0
18,396 37.3
3,822 7.7
24,201 49.1
2,898 5.9
No disability 47,087 100.0
16,911 35.9
3,781 8.0
23,567 50.0
2,828 6
With a disability 2,230 100.0
1,485 66.6
41 1.8
634 28.4
70 3.1
Sight 1,162 100.0
768 66.1
13 1.1
347 29.9
34 2.9
Hearing 331 100.0
246 74.3
10 3.0
64 19.3
11 3.3
Speech 226 100.0
167 73.9
7 3.1
45 19.9
7 3.1
Physical 728 100.0
544 74.7
10 1.4
156 21.4
18 2.5
Intellectual 225 100.0
154 68.4
9 4.0
56 24.9
6 2.7
Emotional 263 100.0
181 68.8
9 3.4
67 25.5
6 2.3
Other 116 100.0 59 50.9 3 2.6 48 41.4 6 5.2
Source: Ghana Statistical Service, 2010 Population and Housing Census
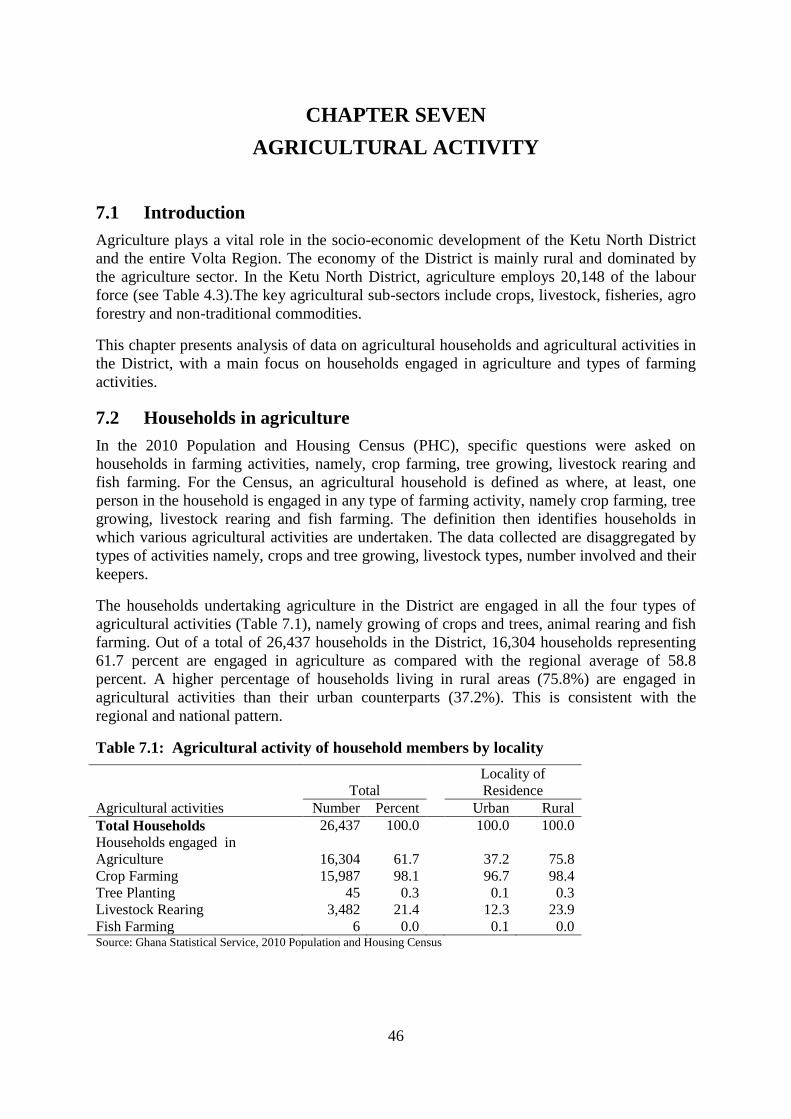
46
CHAPTER SEVEN
AGRICULTURAL ACTIVITY
7.1 Introduction
Agriculture plays a vital role in the socio-economic development of the Ketu North District
and the entire Volta Region. The economy of the District is mainly rural and dominated by
the agriculture sector. In the Ketu North District, agriculture employs 20,148 of the labour
force (see Table 4.3).The key agricultural sub-sectors include crops, livestock, fisheries, agro
forestry and non-traditional commodities.
This chapter presents analysis of data on agricultural households and agricultural activities in
the District, with a main focus on households engaged in agriculture and types of farming
activities.
7.2 Households in agriculture
In the 2010 Population and Housing Census (PHC), specific questions were asked on
households in farming activities, namely, crop farming, tree growing, livestock rearing and
fish farming. For the Census, an agricultural household is defined as where, at least, one
person in the household is engaged in any type of farming activity, namely crop farming, tree
growing, livestock rearing and fish farming. The definition then identifies households in
which various agricultural activities are undertaken. The data collected are disaggregated by
types of activities namely, crops and tree growing, livestock types, number involved and their
keepers.
The households undertaking agriculture in the District are engaged in all the four types of
agricultural activities (Table 7.1), namely growing of crops and trees, animal rearing and fish
farming. Out of a total of 26,437 households in the District, 16,304 households representing
61.7 percent are engaged in agriculture as compared with the regional average of 58.8
percent. A higher percentage of households living in rural areas (75.8%) are engaged in
agricultural activities than their urban counterparts (37.2%). This is consistent with the
regional and national pattern.
Table 7.1: Agricultural activity of household members by locality
Agricultural activities
Total
Locality of
Residence
Number Percent Urban Rural
Total Households 26,437 100.0
100.0 100.0
Households engaged in
Agriculture 16,304 61.7
37.2 75.8
Crop Farming 15,987 98.1
96.7 98.4
Tree Planting 45 0.3
0.1 0.3
Livestock Rearing 3,482 21.4
12.3 23.9
Fish Farming 6 0.0 0.1 0.0 Source: Ghana Statistical Service, 2010 Population and Housing Census

47
7.3 Types of livestock and other animals
Table 7.1 also shows the distribution of agricultural households in the district and types of
agricultural activities undertaken. The data show that some households undertake more than
one agricultural activity. One out of every five agricultural households engages in more than
one agricultural activity.
The least agricultural activity in the District is fish farming with less than 1.0 percent. The
Table further indicates that less than 1.0 percent of households in the District are engaged in
tree planting and fish farming. Activities related to crop farming is higher in the rural than in
the urban areas (98.4% and 96.7% respectively).
Table 7.2 captures information on the distribution of livestock and keepers in the District and
it shows that there is a total of 82,115 animals being reared by some 5,464 keepers. The data
show that there is no large scale commercial livestock rearing. On the average, each keeper
takes care of 15.5 animals in the District.
Poultry comprising chicken, guinea fowl, dove, duck, turkey and ostrich account for more
than half of all livestock (60.7%) in the District. Subsistence goat and sheep are also
prominent in the livestock rearing in the District with 16,163 and 4,300 respectively. Due to
the vast grasslands, the flat terrain and the absence of tsetseflies in the District, cattle rearing
have also shown a great potential as it records an average of 71 cattle per keeper. The
presence of the Ohawu Agricultural College could also have been a further boost for cattle
rearing as the Institution offers extension and veterinary services to the farmers. In terms of
keepers, a total of 44.7 percent of the animal farmers are engaged in poultry (chicken)
keeping.
Table 7.2: Distribution of livestock, other animals and keepers
Livestock/Keepers
Number of
Animals Number of keepers Average
Animal per
Keeper Number Percent Number Percent
Total 84,565 100.0
5,464 100.0 15.5
Beehives 16 0.0
2 0.0 8.0
Cattle 3,770 4.5
53 1.0 71.1
Chicken 49,806 58.9
2,444 44.7 20.4
Dove 128 0.2
9 0.2 14.2
Duck 1,117 1.3
133 2.4 8.4
Goat 16,163 19.1
1,901 34.8 8.5
Grass-cutter 763 0.9
15 0.3 50.9
Guinea fowl 1,179 1.4
79 1.4 14.9
Ostrich 53 0.1
7 0.1 7.6
Pig 3,484 4.1
98 1.8 35.6
Sheep 4,300 5.1
686 12.6 6.3
Silk worm 131 0.2
12 0.2 10.9
Turkey 132 0.2
4 0.1 33.0
Other (specify) 68 0.1
14 0.3 4.9
Fish farming 3,450 4.1
6 0.1 575.0
Marine fishing 5 0.0 1 0.0 5.0 Source: Ghana Statistical Service, 2010 Population and Housing Census
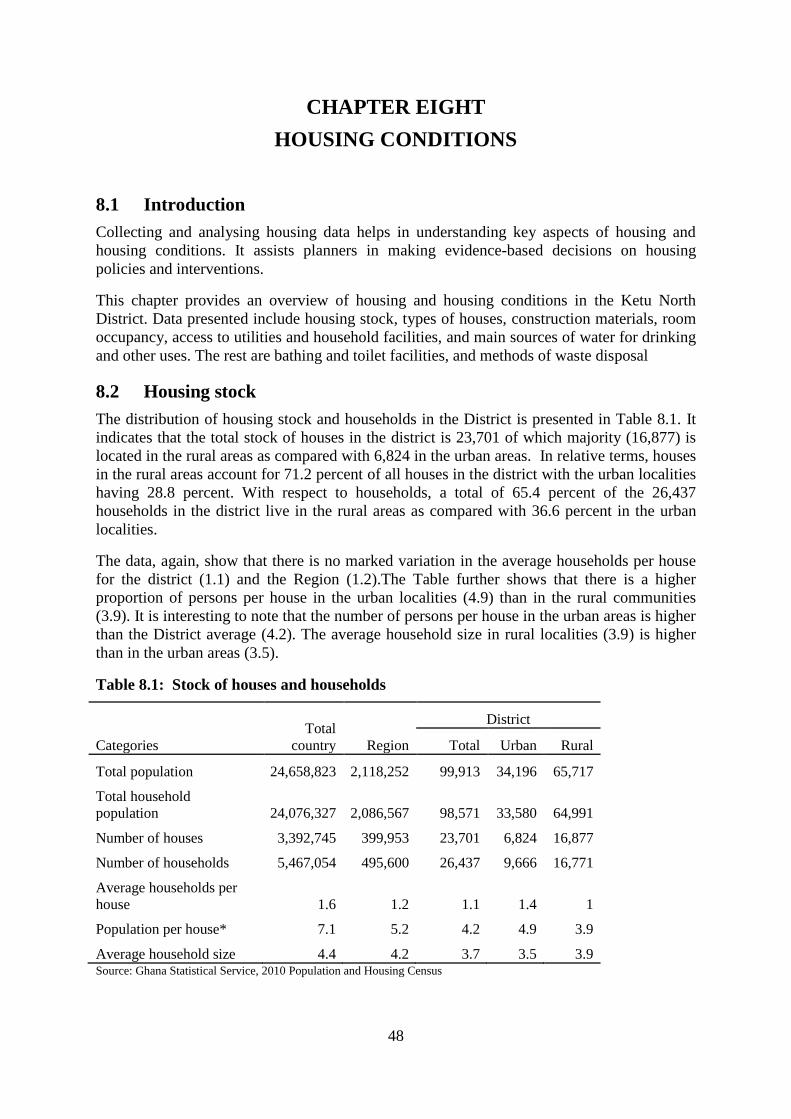
48
CHAPTER EIGHT
HOUSING CONDITIONS
8.1 Introduction
Collecting and analysing housing data helps in understanding key aspects of housing and
housing conditions. It assists planners in making evidence-based decisions on housing
policies and interventions.
This chapter provides an overview of housing and housing conditions in the Ketu North
District. Data presented include housing stock, types of houses, construction materials, room
occupancy, access to utilities and household facilities, and main sources of water for drinking
and other uses. The rest are bathing and toilet facilities, and methods of waste disposal
8.2 Housing stock
The distribution of housing stock and households in the District is presented in Table 8.1. It
indicates that the total stock of houses in the district is 23,701 of which majority (16,877) is
located in the rural areas as compared with 6,824 in the urban areas. In relative terms, houses
in the rural areas account for 71.2 percent of all houses in the district with the urban localities
having 28.8 percent. With respect to households, a total of 65.4 percent of the 26,437
households in the district live in the rural areas as compared with 36.6 percent in the urban
localities.
The data, again, show that there is no marked variation in the average households per house
for the district (1.1) and the Region (1.2).The Table further shows that there is a higher
proportion of persons per house in the urban localities (4.9) than in the rural communities
(3.9). It is interesting to note that the number of persons per house in the urban areas is higher
than the District average (4.2). The average household size in rural localities (3.9) is higher
than in the urban areas (3.5).
Table 8.1: Stock of houses and households
Categories
Total
country Region
District
Total Urban Rural
Total population 24,658,823 2,118,252 99,913 34,196 65,717
Total household
population 24,076,327 2,086,567 98,571 33,580 64,991
Number of houses 3,392,745 399,953 23,701 6,824 16,877
Number of households 5,467,054 495,600 26,437 9,666 16,771
Average households per
house 1.6 1.2 1.1 1.4 1
Population per house* 7.1 5.2 4.2 4.9 3.9
Average household size 4.4 4.2 3.7 3.5 3.9 Source: Ghana Statistical Service, 2010 Population and Housing Census
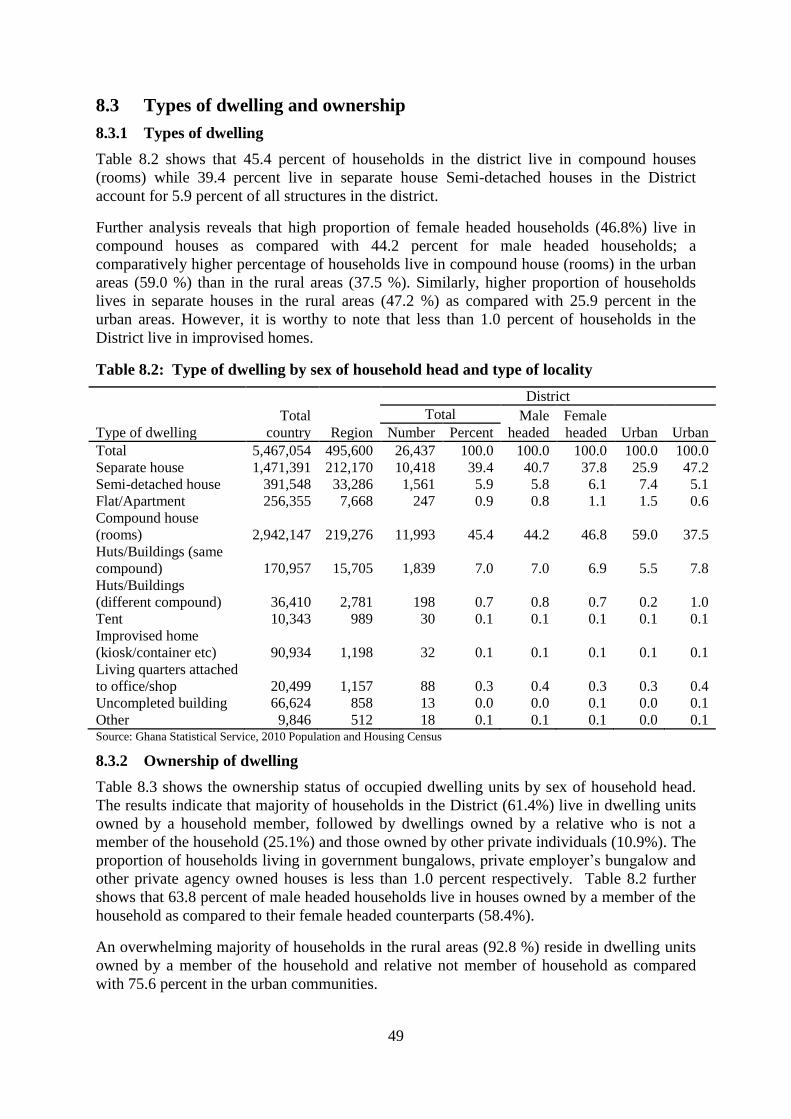
49
8.3 Types of dwelling and ownership
8.3.1 Types of dwelling
Table 8.2 shows that 45.4 percent of households in the district live in compound houses
(rooms) while 39.4 percent live in separate house Semi-detached houses in the District
account for 5.9 percent of all structures in the district.
Further analysis reveals that high proportion of female headed households (46.8%) live in
compound houses as compared with 44.2 percent for male headed households; a
comparatively higher percentage of households live in compound house (rooms) in the urban
areas (59.0 %) than in the rural areas (37.5 %). Similarly, higher proportion of households
lives in separate houses in the rural areas (47.2 %) as compared with 25.9 percent in the
urban areas. However, it is worthy to note that less than 1.0 percent of households in the
District live in improvised homes.
Table 8.2: Type of dwelling by sex of household head and type of locality
Type of dwelling
Total
country Region
District
Total Male
headed
Female
headed Urban Urban Number Percent
Total 5,467,054 495,600 26,437 100.0 100.0 100.0 100.0 100.0
Separate house 1,471,391 212,170 10,418 39.4 40.7 37.8 25.9 47.2
Semi-detached house 391,548 33,286 1,561 5.9 5.8 6.1 7.4 5.1
Flat/Apartment 256,355 7,668 247 0.9 0.8 1.1 1.5 0.6
Compound house
(rooms) 2,942,147 219,276 11,993 45.4 44.2 46.8 59.0 37.5
Huts/Buildings (same
compound) 170,957 15,705 1,839 7.0 7.0 6.9 5.5 7.8
Huts/Buildings
(different compound) 36,410 2,781 198 0.7 0.8 0.7 0.2 1.0
Tent 10,343 989 30 0.1 0.1 0.1 0.1 0.1
Improvised home
(kiosk/container etc) 90,934 1,198 32 0.1 0.1 0.1 0.1 0.1
Living quarters attached
to office/shop 20,499 1,157 88 0.3 0.4 0.3 0.3 0.4
Uncompleted building 66,624 858 13 0.0 0.0 0.1 0.0 0.1
Other 9,846 512 18 0.1 0.1 0.1 0.0 0.1 Source: Ghana Statistical Service, 2010 Population and Housing Census
8.3.2 Ownership of dwelling
Table 8.3 shows the ownership status of occupied dwelling units by sex of household head.
The results indicate that majority of households in the District (61.4%) live in dwelling units
owned by a household member, followed by dwellings owned by a relative who is not a
member of the household (25.1%) and those owned by other private individuals (10.9%). The
proportion of households living in government bungalows, private employer’s bungalow and
other private agency owned houses is less than 1.0 percent respectively. Table 8.2 further
shows that 63.8 percent of male headed households live in houses owned by a member of the
household as compared to their female headed counterparts (58.4%).
An overwhelming majority of households in the rural areas (92.8 %) reside in dwelling units
owned by a member of the household and relative not member of household as compared
with 75.6 percent in the urban communities.

50
Table 8.3: Ownership status of dwelling units by sex of household head
and type of locality
Ownership status
Total
country Region
District
Total Male
headed
Female
headed Urban Rural Number Percent
Total 5,467,054 495,600 26,437 100.0 100.0 100.0 100.0 100.0
Owned by household
member 2,883,236 304,481 16,225 61.4 63.8 58.4 47.1 69.6
Being purchased (e.g.
mortgage) 45,630 3,075 256 1.0 1.0 0.9 1.7 0.5
Relative not a household
member 851,630 91,956 6,638 25.1 21.0 30.1 28.5 23.2
Other private individual 1,439,021 81,191 2,888 10.9 12.2 9.4 20.7 5.3
Private employer 83,610 3,475 111 0.4 0.5 0.3 0.6 0.3
Other private agency 21,123 1,419 36 0.1 0.1 0.1 0.3 0.0
Public/Government
ownership 118,804 8,003 204 0.8 1.0 0.5 0.8 0.8
Other 24,000 2,000 79 0.3 0.3 0.3 0.3 0.3 Source: Ghana Statistical Service, 2010 Population and Housing Census
8.4 Construction materials
8.4.1 Main construction material for outer wall
Table 8.4 shows the main material used for outer walls of buildings in the District. The two
main construction materials for outer walls are cement blocks or concrete and mud, brick or
earth. The proportion of dwelling units whose outer walls are constructed with cement
blocks/concrete is 52.3 percent while the proportion of outer walls made of mud brick/earth is
44.1 percent. In rural areas, however, 55.8 percent of outer walls of dwellings are made of
mud brick/earth as compared to 22.0 percent in the urban areas. This pattern reflects the use
of available materials and technology in the rural environment. Also, 73.3 percent of outer
walls of houses occupied by urban households are made of cement blocks or concrete as
compared to 41.2 percent in the rural areas. The higher usage of cement blocks or concrete in
the urban areas could be as a result of an improvement in the economic conditions of the
urban working class. The District’s proximity to the Diamond Cement Factory at Aflao could
probably be responsible for the use of cement in the construction of outer walls in the urban
areas. Only 1.3 percent of outer walls of houses used by households are made of burnt bricks.
Other materials such as wood, stone and bamboo are hardly used in the construction of outer
walls in the District.
It should he noted that houses built with mud, brick or earth are of inferior quality and
therefore, less durable. By this observation, it could be stated that the majority of houses in
rural areas are less durable.

51
Table 8.4: Main construction material for outer wall
Material for Outer wall
Total
country Region
District
Total
Urban Rural Number Percent
Total 5,817,607 550,006 30,398 100.0 100.0 100.0
Mud brick/Earth 1,991,540 264,357 13,416 44.1 22.0 55.8
Wood 200,594 4,900 120 0.4 0.3 0.4
Metal sheet/Slate/Asbestos 43,708 3,131 113 0.4 0.8 0.2
Stone 11,330 1,172 34 0.1 0.1 0.1
Burnt bricks 38,237 3,183 387 1.3 3.0 0.3
Cement blocks/Concrete 3,342,462 250,762 15,896 52.3 73.3 41.2
Landcrete 104,270 7,772 69 0.2 0.2 0.2
Bamboo 8,206 819 26 0.1 0.0 0.1
Palm leaf/Thatch
(grass)/Raffia 38,054 11,454 115 0.4 0.1 0.5
Other 39,206 2,456 222 0.7 0.1 1.1 Source: Ghana Statistical Service, 2010 Population and Housing Census
8.4.2 Main construction material for floor
Table 8.5 shows the main construction materials used for the floor of houses in the District.
The floors of majority of houses are largely made of cement or concrete and earth or mud.
Almost four out of every five households use houses with floor made of cement or concrete
while a little over one in every ten (13.1%) of households live in houses constructed with
earth or mud floor. Although cement floors are most common type in both urban and rural
areas, the proportion of households living in such houses is higher in the urban localities
(93.0%) than in rural areas (81.3%). Nearly 18.0 percent of dwelling units occupied by
households in the rural areas have their floors made with earth or mud as compared with only
five percent in the urban areas.
Table 8.5: Main construction materials for the floor
Materials for the floor
Total
country Region
District
Total
Urban Rural Number Percent
Total 5,467,054 495,600 26,437 100.0 100.0 100.0
Earth/Mud 872,161 87,880 3,458 13.1 5.0 17.7
Cement/Concrete 4,255,611 397,467 22,616 85.5 93.0 81.3
Stone 32,817 1,842 94 0.4 0.6 0.2
Burnt brick 6,537 424 18 0.1 0.1 0.1
Wood 52,856 464 9 0.0 0.1 0.0
Vinyl tiles 57,032 1,237 38 0.1 0.3 0.0
Ceramic/Porcelain/Granite/Marble
tiles 88,500 3,754 147 0.6 0.7 0.5
Terrazzo/Terrazzo tiles 85,973 1,283 26 0.1 0.1 0.1
Other 15,567 1,249 31 0.1 0.1 0.1 Source: Ghana Statistical Service, 2010 Population and Housing Census

52
8.4.3 Main construction material for roofing
Table 8.6 shows the main construction material for roofing in the District; 68.9 percent of the
households live in dwelling units roofed with metal sheet, and this is lower than the regional
average of 70.7 percent (GSS, 2013). Table 8.6 further reveals that a total of 24.6 percent of
households live in dwelling units roofed with thatch, palm leaf or raffia.
The proportion of households that use thatch, palm leaf or raffia as roofing material is 35.8
percent and 3.6 percent in the rural and urban areas respectively. This is in sharp contrast to
the use of metal sheet as a material for roof in both rural and urban areas (57.0% and 91.4%
respectively). Dwelling units roofed with bamboo, mud, mud bricks, earth, wood and roofing
tiles are not common in the District.
Table 8.6: Main construction material for roofing
Main Roofing material
Total
country Region
District
Total
Urban Rural Number Percent
Total 5,817,607 550,006 30,398 100.0 100.0 100.0
Mud/Mud bricks/Earth 80,644 3,576 118 0.4 0.3 0.4
Wood 45,547 3,000 137 0.5 0.4 0.5
Metal sheet 4,152,259 388,664 20,952 68.9 91.4 57.0
Slate/Asbestos 759,039 41,055 1,280 4.2 2.9 4.9
Cement/Concrete 141,072 4,810 214 0.7 0.7 0.7
Roofing tile 31,456 1,603 89 0.3 0.1 0.4
Bamboo 71,049 1,254 20 0.1 0.1 0.1
Thatch/Palm leaf or
Raffia 500,606 102,769 7,483 24.6 3.6 35.8
Other 35,935 3,275 105 0.3 0.4 0.3 Source: Ghana Statistical Service, 2010 Population and Housing Census
8.5 Room occupancy
Results from the census show a dominance of small households in terms of size. For instance,
1-4 member households constitute 67.1 percent of the total households in the District.
Another 21.2 percent of the households in the District are single-member households.
A little over half of all households (51.2%) in the District occupy one sleeping room,
followed by two and three sleeping rooms with 30.9 percent and 10.2 percent respectively.
Households occupying seven sleeping rooms and more in the District account for less than
one percent of the total household population (see Table 8.7).
Table 8.7 also shows that the number of sleeping rooms occupied by households increase
with the household size. Single room occupancy is high among one-member household
(84.0%), two-member (61.9%) and three member households (55.1%). The Table further
reveals some level of overcrowding as majority of the 5-9 member households occupy two
sleeping rooms.
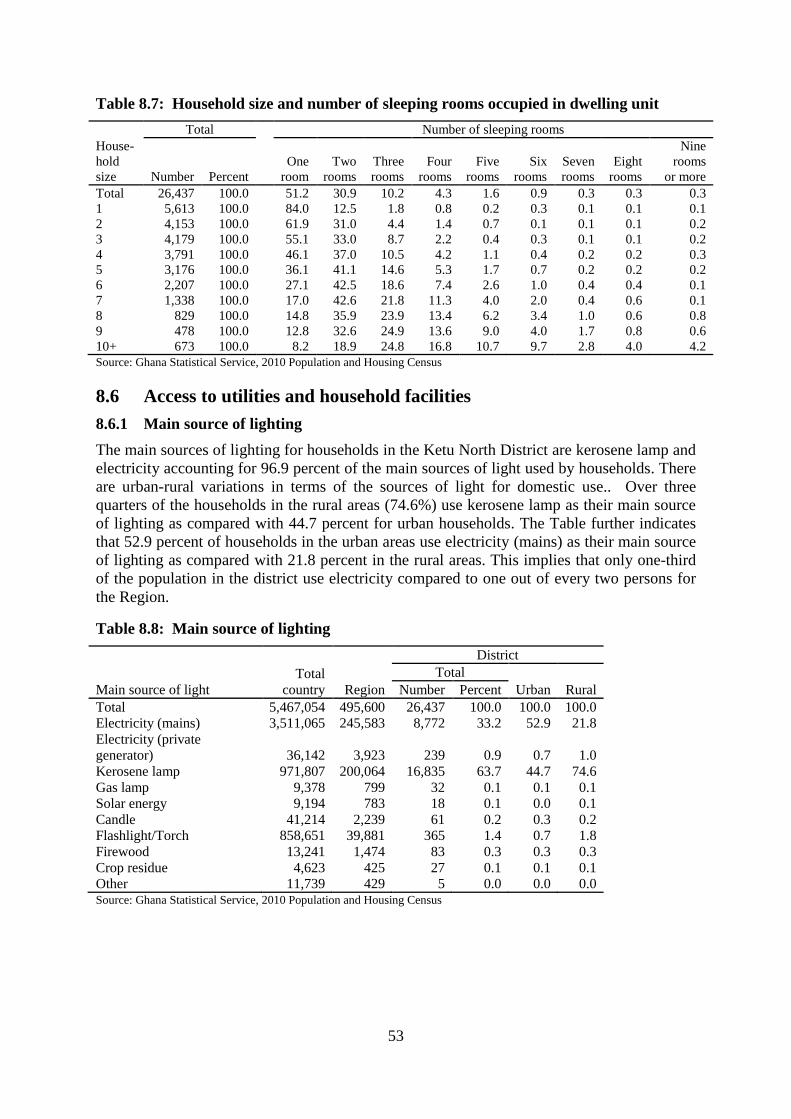
53
Table 8.7: Household size and number of sleeping rooms occupied in dwelling unit
House-
hold
size
Total Number of sleeping rooms
Number Percent
One
room
Two
rooms
Three
rooms
Four
rooms
Five
rooms
Six
rooms
Seven
rooms
Eight
rooms
Nine
rooms
or more
Total 26,437 100.0
51.2 30.9 10.2 4.3 1.6 0.9 0.3 0.3 0.3
1 5,613 100.0
84.0 12.5 1.8 0.8 0.2 0.3 0.1 0.1 0.1
2 4,153 100.0
61.9 31.0 4.4 1.4 0.7 0.1 0.1 0.1 0.2
3 4,179 100.0
55.1 33.0 8.7 2.2 0.4 0.3 0.1 0.1 0.2
4 3,791 100.0
46.1 37.0 10.5 4.2 1.1 0.4 0.2 0.2 0.3
5 3,176 100.0
36.1 41.1 14.6 5.3 1.7 0.7 0.2 0.2 0.2
6 2,207 100.0
27.1 42.5 18.6 7.4 2.6 1.0 0.4 0.4 0.1
7 1,338 100.0
17.0 42.6 21.8 11.3 4.0 2.0 0.4 0.6 0.1
8 829 100.0
14.8 35.9 23.9 13.4 6.2 3.4 1.0 0.6 0.8
9 478 100.0
12.8 32.6 24.9 13.6 9.0 4.0 1.7 0.8 0.6
10+ 673 100.0 8.2 18.9 24.8 16.8 10.7 9.7 2.8 4.0 4.2
Source: Ghana Statistical Service, 2010 Population and Housing Census
8.6 Access to utilities and household facilities
8.6.1 Main source of lighting
The main sources of lighting for households in the Ketu North District are kerosene lamp and
electricity accounting for 96.9 percent of the main sources of light used by households. There
are urban-rural variations in terms of the sources of light for domestic use.. Over three
quarters of the households in the rural areas (74.6%) use kerosene lamp as their main source
of lighting as compared with 44.7 percent for urban households. The Table further indicates
that 52.9 percent of households in the urban areas use electricity (mains) as their main source
of lighting as compared with 21.8 percent in the rural areas. This implies that only one-third
of the population in the district use electricity compared to one out of every two persons for
the Region.
Table 8.8: Main source of lighting
Main source of light
Total
country Region
District
Total
Urban Rural Number Percent
Total 5,467,054 495,600 26,437 100.0 100.0 100.0
Electricity (mains) 3,511,065 245,583 8,772 33.2 52.9 21.8
Electricity (private
generator) 36,142 3,923 239 0.9 0.7 1.0
Kerosene lamp 971,807 200,064 16,835 63.7 44.7 74.6
Gas lamp 9,378 799 32 0.1 0.1 0.1
Solar energy 9,194 783 18 0.1 0.0 0.1
Candle 41,214 2,239 61 0.2 0.3 0.2
Flashlight/Torch 858,651 39,881 365 1.4 0.7 1.8
Firewood 13,241 1,474 83 0.3 0.3 0.3
Crop residue 4,623 425 27 0.1 0.1 0.1
Other 11,739 429 5 0.0 0.0 0.0 Source: Ghana Statistical Service, 2010 Population and Housing Census

54
8.6.2 Main source of cooking fuel
As shown in Table 8.9, the three main sources of cooking fuel for households in the District
include wood, charcoal and gas. The use of other sources of energy such as kerosene, crop
residue and electricity is negligible and constitute less than 1.0 percent as sources of cooking
fuel for households in the District.
In rural areas, because wood is locally available, it is the main source of cooking fuel for 78.4
percent of households as compared to 36.3 percent of households in the urban areas who use
wood as their main source of cooking fuel. In contrast, charcoal which is often produced for
urban dwellers is used by 50.1 percent of households in the urban areas, and 16.3 percent of
households in the rural areas.
The type of cooking space used by households in the district is presented in Table 8.9. The
most common type of cooking space for households in the district is usually a structure with
roof but without walls in the house. Almost one in every three households (32.5 %) cook in a
structure with roof but without walls while more than one-quarter of the households (28.1%)
use open spaces in the compound as their kitchen.
In the urban areas, the proportion of households that use a structure with roof but without
walls is lower (20.4%) than in the rural (39.4%) localities. Similarly, the households that
cook in the open space are higher in urban areas (35.3%) than in the rural areas (24.0%).
Table 8.9: Main source of cooking fuel, and cooking space used by households
Source of cooking fuel/cooking space
Total
country Region
District
Total
Urban Rural Number Percent
Main source of cooking fuel for household
Total 5,467,054 495,600 26,437 100.0 100.0 100.0
None no cooking 306,118 12,888 431 1.6 2.0 1.4
Wood 2,197,083 283,048 16,664 63.0 36.3 78.4
Gas 996,518 46,084 1,510 5.7 10.4 3.0
Electricity 29,794 972 40 0.2 0.2 0.1
Kerosene 29,868 2,512 115 0.4 0.7 0.3
Charcoal 1,844,290 146,677 7,577 28.7 50.1 16.3
Crop residue 45,292 2,419 82 0.3 0.2 0.4
Saw dust 8,000 389 8 0.0 0.1 0.0
Animal waste 2,332 104 4 0.0 0.0 0.0
Other 7,759 507 6 0.0 0.0 0.0
Cooking space used by household
Total 5,467,054 495,600 26,437 100.0 100.0 100.0
No cooking space 386,883 21,127 728 2.8 2.7 2.8
Separate room for exclusive use of
household 1,817,018 173,544 4,899 18.5 19.0 18.3
Separate room shared with other
household(s) 410,765 17,362 595 2.3 1.0 3.0
Enclosure without roof 117,614 9,352 641 2.4 1.5 3.0
Structure with roof but without walls 349,832 97,942 8,586 32.5 20.4 39.4
Bedroom/Hall/Living room) 74,525 17,049 868 3.3 4.7 2.5
Verandah 1,173,946 51,288 2,630 9.9 15.3 6.8
Open space in compound 1,115,464 106,104 7,442 28.1 35.3 24.0
Other 21,007 1,832 48 0.2 0.1 0.2 Source: Ghana Statistical Service, 2010 Population and Housing Census

55
8.7 Main source of water for drinking and other domestic use
The sources of water for drinking and other domestic purposes for households in the Ketu
North District are presented in Table 8.10. The four main sources of water supply are rain
water, public tap/standpipe, pipe-borne outside dwelling and bore-hole pump/tube well.
Rainwater is one of the most widely used sources of water for both drinking (25.4%) and
domestic purposes (27.0%) respectively.
Table 8.10: Main source of water for drinking and other domestic purposes
Sources of water
Total
country Region
District
Total
Urban Rural Number Percent
Main source of drinking water for household
Total 5,467,054 495,600 26,437 100.0 100.0 100.0
Pipe-borne inside dwelling 790,493 36,536 319 1.2 2.5 0.4
Pipe-borne outside dwelling 1,039,667 93,019 3,729 14.1 18.8 11.4
Public tap/Standpipe 712,375 95,209 4,746 18.0 30.0 11.0
Bore-hole/Pump/Tube well 1,267,688 81,286 3,326 12.6 2.7 18.3
Protected well 321,091 22,577 2,306 8.7 4.2 11.3
Rain water 39,438 15,627 6,713 25.4 35.1 19.8
Protected spring 19,345 1,626 17 0.1 0.0 0.1
Bottled water 20,261 761 48 0.2 0.3 0.1
Satchet water 490,283 16,196 776 2.9 5.2 1.7
Tanker supply/Vendor
provided 58,400 2,120 164 0.6 0.8 0.5
Unprotected well 112,567 24,012 1,548 5.9 0.2 9.1
Unprotected spring 12,222 2,677 26 0.1 0.0 0.2
River/Stream 502,804 81,663 1,188 4.5 0.1 7.0
Dugout/Pond/Lake/Dam/Canal 76,448 21,897 1,514 5.7 0.0 9.0
Other 3,972 394 17 0.1 0.0 0.1
Main source of water for other domestic use of household
Total 5,467,054 495,600 26,437 100.0 100.0 100.0
Pipe-borne inside dwelling 905,566 36,186 382 1.4 3.0 0.6
Pipe-borne outside dwelling 1,089,030 74,062 3,415 12.9 18.5 9.7
Public tap/Standpipe 704,293 83,508 4,244 16.1 26.2 10.2
Bore-hole/Pump/Tube well 1,280,465 73,484 3,096 11.7 2.8 16.8
Protected well 465,775 38,510 2,230 8.4 4.6 10.7
Rain water 39,916 14,834 7,127 27.0 43.1 17.7
Protected spring 18,854 1,986 36 0.1 0.2 0.1
Tanker supply/Vendor
provided 100,048 2,325 181 0.7 0.8 0.6
Unprotected well 152,055 38,472 1,567 5.9 0.4 9.1
Unprotected spring 15,738 2,942 39 0.1 0.0 0.2
River/Stream 588,590 100,918 1,976 7.5 0.3 11.6
Dugout/Pond/Lake/Dam/Canal 96,422 27,098 2,104 8.0 0.0 12.5
Other 10,302 1,275 40 0.2 0.0 0.2 Source: Ghana Statistical Service, 2010 Population and Housing Census
Table 8.10 further shows that a high percentage (35.1%) of households in the urban areas
depends on rainwater for drinking as against 19.8 percent of households in the rural localities.
Also, public tap/standpipe is used by 30.0 percent of households in urban communities as
against 11.0 percent of households in rural localities. However, bore-hole/pump/tube well is
one of the common sources of water that households use for drinking (18.3%) and for other

56
domestic purposes (16.8%) in the rural areas.. There is variation between rural and urban
areas in terms of access to pipe-borne water for drinking; it is observed that rural areas lag
behind urban areas. Thus, while 51.3 percent of urban residents depend on pipe-borne water
and public standpipe for drinking, only 22.8 percent of households in the rural areas use pipe-
borne water. Similarly, a higher proportion of urban households (47.7%) than their rural
counterparts (20.5%) depend on pipe-borne water for other domestic uses.
8.8 Bathing and toilet facilities
Table 8.11 captures data on household sanitation in terms of toilet and bathing facilities by
type of locality of residence. The results show that pit latrines are the most dominant toilet
facility used by most households in the District; 39.2 percent of the households in the District
use pit latrines and 24.2 percent use public toilets. A further 22.8 percent of the households in
the District have no access to any type of toilet facility and therefore, have to resort to open
defecation. Open defecation is more pronounced in the rural (27.7%) than in the urban areas
(14.1%). The results of the 2010 PHC also show that 43.1 percent of urban households
depend on public toilets as compared with 13.4 percent in the rural areas, .The usage of pan
or bucket latrines by households in the District recorded an insignificant percentage (0.1%) in
both rural and urban households.
Table 8.11: Type of toilet facility and bathing facility used by household by
type of locality
Toilet facility/Bathing facility
Total
country Region
District
Total
Urban Rural Number Percent
Toilet facility used by household
Total 5,467,054 495,600 26,437 100.0 100.0 100.0
No facilities (bush/beach/field) 1,056,382 137,522 6,017 22.8 14.1 27.7
W.C. 839,611 29,799 498 1.9 3.4 1.0
Pit latrine 1,040,883 112,196 10,351 39.2 20.2 50.1
KVIP 572,824 63,237 3,050 11.5 18.7 7.4
Bucket/Pan 40,678 2,393 24 0.1 0.1 0.1
Public toilet (WC, KVIP, Pit, Pan
etc) 1,893,291 148,740 6,408 24.2 43.1 13.4
Other 23,385 1,713 89 0.3 0.3 0.4
Bathing facility used by household
Total 5,467,054 495,600 26,437 100.0 100.0 100.0
Own bathroom for exclusive use 1,535,392 168,731 8,681 32.8 24.6 37.6
Shared separate bathroom in the
same house 1,818,522 111,402 5,332 20.2 23.8 18.1
Private open cubicle 381,979 49,908 4,345 16.4 10.6 19.8
Shared open cubicle 1,000,257 98,801 5,465 20.7 32.5 13.9
Public bath house 140,501 3,408 212 0.8 1.6 0.3
Bathroom in another house 187,337 19,847 570 2.2 1.5 2.5
Open space around house 372,556 39,498 1,728 6.5 5.2 7.3
River/Pond/Lake/Dam 14,234 1,281 42 0.2 0.1 0.2
Other 16,276 2,724 62 0.2 0.1 0.3 Source: Ghana Statistical Service, 2010 Population and Housing Census

57
Table 8.11 also shows that almost one-third (32.8%) of the households in the District have
their own bathroom for exclusive use, 20.7 percent and 20.2 percent of the households use
private open cubicles and shared separate bathroom in the same house respectively. Nearly
38.0 percent of rural households in the District have exclusive use of their own bathrooms as
compared to 24.6 percent of urban households. A comparatively higher percentage of urban
(32.5%) than rural households (13.9%) share open cubicles for bathing.
8.9 Method of waste disposal
Table 8.12 indicates the method of solid and liquid waste disposal in the Ketu North District.
The common means of disposing solid waste is by public dump (open space and container),
burning of refuse and dumping of waste indiscriminately. In all, 86.1 percent of households
use these methods as their methods of waste disposal in the district.
Table 8.12 shows that only 5.9 percent of households dispose their solid waste by burying
them and 7.4 percent of the households have their waste collected. In urban areas, one of the
common means of waste disposal is by public dump (container) which is used by 35.7
percent of households as compared with the 1.8 percent of households in the rural areas.
However, 39.0 percent of households in the rural areas dispose off their solid waste at public
dump (open space) compared with 26.3 percent in the urban areas.
On liquid waste disposal, 58.7 percent of the households in the District dispose their waste by
throwing unto compound while 32.6 percent dispose of their liquid waste by throwing unto
the street/outside. In the rural areas, the proportion of households that dispose of liquid waste
by throwing unto compound (63.5%) is higher than those in urban areas (50.4%). Similarly,
about 46.6 percent of households in the urban areas dispose of liquid wastes by throwing unto
the street/outside and gutters as compared with 32.7 percent in the rural areas.
Table 8.12: Method of solid and liquid waste disposal by type of locality
Method of waste disposal
Total
country Region
District
Total
Urban Rural Number Percent
Solid waste
Total 5,467,054 495,600 26,437 100.0 100.0 100.0
Collected 785,889 30,430 1,950 7.4 3.9 9.4
Burned by household 584,820 78,604 5,315 20.1 17.7 21.5
Public dump (container) 1,299,654 82,361 3,762 14.2 35.7 1.8
Public dump (open space) 2,061,403 204,656 9,199 34.8 26.3 39.7
Dumped indiscriminately 498,868 67,801 4,484 17.0 12.9 19.3
Buried by household 182,615 26,014 1,557 5.9 3.1 7.5
Other 53,805 5,734 170 0.6 0.3 0.8
Liquid waste
Total 5,467,054 495,600 26,437 100.0 100.0 100.0
Through the sewerage system 183,169 4,906 115 0.4 0.3 0.5
Through drainage system into a gutter 594,404 12,540 165 0.6 1.1 0.3
Through drainage into a pit (soak away) 167,555 11,493 327 1.2 1.3 1.2
Thrown onto the street/outside 1,538,550 154,009 8,628 32.6 34.5 31.5
Thrown into gutter 1,020,096 46,100 1,373 5.2 12.1 1.2
Thrown onto compound 1,924,986 258,942 15,518 58.7 50.4 63.5
Other 38,294 7,610 311 1.2 0.2 1.7
Source: Ghana Statistical Service, 2010 Population and Housing Census

58
CHAPTER NINE
SUMMARY OF FINDINGS, CONCLUSIONS AND
POLICY IMPLICATIONS
9.1 Summary of findings
Population census is the primary source of information about the population and its
characteristics. The 2010 Population and Housing Census (PHC) collected data on the
demographic, social and economic characteristics, and housing conditions of the entire
population (including Ketu North District). Geographically, the census covered all localities,
towns, settlements, and residential areas within the District.
The 2010 PHC is the first census conducted since the Ketu North District was created. The
Ketu North District Analytical Report represents a collection of data on the twelve thematic
areas of the PHC. The report is designed to offer relevant and detailed information on the
population of the District covering all the thematic areas in the 2010 PHC. The Census which
was conducted with reference to midnight of September 26, 2010 covered the entire
population who answered questions posed to them by the enumerators is the primary source
of population and housing related information in the District.
This report on the Ketu North District provides detailed analysis of the 2010 census data at
the district level. The aim is to provide useful data and analysis for planners and policy
makers in crafting and implementing evidence-based strategies for development.
9.1.1 Population size, structure and density
According to the 2010 PHC, the population of the Ketu North District is 99,913 comprising
46,551 males and 53,362 females. The District has a sex ratio of 87.2 males to 100 females.
The proportion of the population in the District living in the urban areas is 34.2 percent and
65.8 percent in rural localities. This means that the District is more rural in nature. The
District generally depicts a typical youthful population with a median age of 20 years and
mean age of 26.6 years. The proportion of the population under 15 years is 37.2 percent
which is relatively lower in comparison with the regional average of 38.4 percent. The total
dependency ratio for the District is 82.3 which is slightly higher than the regional average of
83.1.
The District covers a total surface area of about 423.8 square kilometres representing 2.1
percent of the total land area of the Volta Region. The District has a population density of
235.7 persons per square kilometre which is higher than the regional average of 103.
9.1.2 Ethnicity
The major ethnic groups found in the District according to the 2010 PHC are Ewes, Akans,
Ga- Adangbes and Guans with the dominant tribe being Ewe (98.2%) with the remaining
tribes constituting less than two percent.

59
9.1.3 Nationality
Information gathered from the 2010 PHC indicates that the residents of the District are
mainly Ghanaians (99.5%) as compared with a few non-Ghanaians (0.5%). Ghanaians by
birth in the District formed majority followed by Ghanaians with dual nationality and
Ghanaians by naturalisation. Of the non-Ghanaian population, ECOWAS nationals form an
overwhelming majority (92.0%). Interestingly, the non-African immigrants outnumber the
Africans other than ECOWAS nationals. The percentage of males (63.4%) exceeds females
among immigrants in the District.
9.1.4 Migration, fertility and mortality
Fertility
There are 24604 women in the reproductive age group (15-49 years) who have delivered
2,439 children within the 12 months preceding the census night. The District also recorded a
Total Fertility Rate of 3.41 and Crude Birth Rate of 24.4 which are both slightly higher than
the regional averages of 3.38 and 24.6 respectively. General Fertility Rate of 99.1 for the
District is slightly lower than the regional rate of 99.2.
Mortality
A total of 38,391 women aged 12 years and above have delivered 119,805 live births
comprising of 59,741 males (49.9%) and 60,064 females (50.1%) with 81.7 percent of them
surviving.
Migration
Data from the 2010 PHC show that there are 13,380 migrants (representing 13.4 percent of
the District’s population) living in the District. The results of the census also show that 65.9
percent of the migrants in the District were born in other districts within the Volta Region. A
significant proportion (9.0%) of the migrants in the District was born outside Ghana. It is
noted that 20.6 percent of them have stayed in the District for more than 20 years.
9.1.5 Household size, structure and composition
According to the 2010 PHC, there are 26,437 households in the Ketu North District. In terms
of headship, the results show that 54.8 percent of the households are headed by males as
compared with the female heads (45.2%). The results also show that the proportion of sons is
higher than that of daughters. I In spite of the District being a rural district, there is a high
preponderance of the nuclear family households. The nuclear family (head, spouse and their
children) constitutes almost one-third of the household population in the District followed by
the single parent extended and extended family (that is head, spouse(s), children and head’s
relatives).This dominance of the nuclear family system could be a result of social change
being experienced in the country.
The data also show that a significant percentage of the household population are
grandchildren to the heads of household. It is remarkable to note that extended family
members form 22.1 percent of total household population.
There is a dominance of small households in the Ketu North District. Households with 1-4
members make up a total of 67.1 percent of all households in the District. The least dominant
household size in the District is the 9-member households with 1.8 percent followed by
households with more than 10 members which constitute 2.5 percent of the total household
population.

60
9.1.6 Marital status
Results on marital status indicate that 36.0 percent of the population 12 years and older have
never married; currently married (46.1%), consensual union (3.6%), separated (2.4%),
divorced (3.2%) and widowed (8.7%).
The data also show that the proportion of the population married increases with age and
peaks at the age groups 40-44. As expected, the proportions of persons who are widowed
increases with age and females form a relatively higher proportion of that category. This
means many females outlive their husbands (higher life expectancy for females in the
District).
9.1.7 Religion
The predominant religion of the people in the District is Christianity. The number of persons
who profess to be Christians constitutes 55.6 percent, followed by traditionalists (33.5%) and
Muslims constitute less than one percent (0.9%) of the total population. The data reveal that
8.9 percent of the population are not affiliated to any religion
9.1.8 Literacy and education
The 2010 Census data captured information on literacy of the population aged 11 years and
older and education for the population aged three years and older for the Ketu North District.
The data show that, 30.5 percent of the population are not literate in any language and 69.5
percent are literate in at least one language. . Literacy in Ghanaian language only is highest
among the 40-44 age group and 65 years and older age cohort with 24.8 percent and 23.8
percent respectively. Literacy in French language is abysmally low across all age groups and
sex.
In terms of education, 91.3 percent of the population currently attending school are at the
basic level comprising nursery, kindergarten, primary and JHS. The data further show that
higher proportion of females (51.8%) in the District are currently in the basic school than
males (48.2%).The data again show that the rest of the population currently enrolled in school
are in SSS/SHS (7.0%), secondary/vocational/technical/commercial (0.2%), post
middle/secondary certificate (0.7%) and tertiary (0.7%).
It is significant to note that only 0.7 percent of the population in the District have attained
tertiary education.
9.1.9 Economic activity
Information on the activity status of the population indicates that 70.2 percent of the
population aged 15 years and older are economically active. The proportion of persons who
are economically active is higher among males than among their female counterparts.
In terms of employment status, the results show that majority of the economically active
population are employed in the District. Further analysis shows that slightly higher
percentage of females than males is without employment. More females than males who are
unemployed during the census have worked before. Of the population who are economically
not active, persons in full time education and those considered as too old or too young to
work form the majority.

61
9.1.10 Occupation
Analysis of the 2010 PHC data show that workers in skilled agriculture, forestry, and fishing
constitute the largest occupational group (47.1%) followed by those in craft and related trades
(19.8%), and those in services and sales (16.7%). The proportion of males in the professional
occupations is higher (5.4%) than that of the females (2.2%). On the other hand, the
percentage of females engaged in services and sales is higher (26.3%) than that of males
(4.4%). The number of females engaged in agriculture, forestry and fishing is lower (43.0%)
than their male counterparts (52.4%).
9.1.11 Industry
Agriculture, forestry and fishing is the largest sector, employing 48.1 percent, followed by
manufacturing (17.0%) while wholesale and retail; repair of motor vehicles and motorcycles
employ 13.9 percent .
The proportion of males in agriculture, forestry and fishing (53.7%) is higher than that of
females (43.8%), while the wholesale and retail; repair of motor vehicles and motorcycles
employ a higher proportion of females (21.5%) compared to their male counterparts (4.2%).
9.1.12 Information and communications technology
The 2010 PHC results show that 36.9 percent of the population aged 12 years and older in the
District own mobile phones. The data further show that more males (44.2%) own mobile
phones than females (30.9%) in the Ketu North District. Internet usage among persons aged
12 years and older in the Ketu North District is relatively low with only 1.7 percent of the
population using it. Data on household ownership of fixed telephone lines indicates that less
than one percent of the 26,437 households have fixed telephone lines in the District. The
percentage of household owning desktop or laptop computer in the Ketu North District is 1.4
percent.
9.1.13 Disability
The data show that 3,956 persons constituting 4.0 percent of the population in the Ketu North
District are living with one form of disability or the other. The data further show that sight
impairment is the commonest form of disability in the District followed by physical and
hearing disability.
A higher proportion of the rural dwellers suffer disability than their urban counterparts.
About 53.8 percent of persons with disabilities are employed while 1.3 percent are
unemployed. Similarly, the proportion of disabled persons who are economically not active is
44.9 percent.
There is a higher proportion of females with disability who are economically not active
(46.5%) than their male counterparts (42.7%).
9.1.14 Agricultural activities
Households undertaking agriculture in the District are engaged in more than one type of
agricultural activity which includes growing of crops, trees, animal farming and fish farming.
A higher percentage of households living in rural areas (75.8%) are engaged in agricultural
activities than those in the urban areas (37.2%). This is consistent with the regional and
national structures. Information on livestock and their keepers in the District shows a total of

62
84,565 animals being reared by 5,454 farmers. On the average, each keeper takes care of 15.5
animals in the District.
9.1.15 Housing conditions
Housing stock
The total stock of houses in the Ketu North District is 23,701. Of this total, 71.2 percent are
located in the rural areas and 28.8 percent in urban areas. It is interesting to note that the
population per house in the urban areas (4.9) is higher than that of the rural areas (3.9).
The data show that the average household size in the rural localities (3.9) is higher than that
in the urban areas (3.5). The average household size in the rural areas is higher than the
District average of 3.7.
Dwelling units
The result show that 45.4 percent of the households live in compound houses while 39.4
percent of them live in separate houses. The data further indicate that a higher proportion of
households live in compound house (rooms) in the urban areas (59.0 %) as compared with
37.5 percent in the rural areas .
Construction materials
The two main construction materials for outer walls in the District are cement blocks or
concrete and mud, brick or earth. The data show that the proportion of outer walls
constructed with cement blocks or concrete is 52.3 percent while that of mud, brick or earth is
44.1 percent. Only 1.3 percent of outer walls in the District are made of burnt bricks. Other
materials such as wood, stone and bamboo are hardly used in the construction of outer walls
in the District.
In the rural areas, 55.8 percent of outer walls are made of mud, brick or earth as compared to
22.0 percent in the urban areas. Also, 73.3 percent of outer walls of houses used by
households in urban areas are made of cement blocks or concrete as compared with 41.2
percent in the rural areas.
Information from the 2010 PHC shows that 68.9 percent of dwelling units in the District are
roofed with metal sheet, which is lower than the regional average of 70.7 percent. The data
further reveals that a total of 24.6 percent of dwelling units are roofed with thatch, palm leaf
or raffia in the District.
Nearly 36.0 percent of the houses occupied by households in rural areas are roofed with
thatch, palm leaf or raffia as compared with 3.6 percent of those in the urban areas . This is in
sharp contrast to the use of metal sheet as material for roofing in both rural (57.0%) and
urban (91.4%) areas.
Materials for constructing floors in the District are largely cement or concrete and earth or
mud. Four out of every five households (85.5%) use cement or concrete while about one in
every ten households (13.1%) use earth/mud for floor construction. Although cement floors
are most common in both urban and rural areas, the proportion is higher in urban (93.0%)
than in rural areas (81.3%). Nearly 18.0 percent of floors in the rural areas are made of earth
or mud compared with only 5.0 percent in the urban areas.

63
Ownership of dwellings
Majority of the households (61.4%) live in dwelling units owned by a household member,
followed by dwelling units owned by a relative who is not a member of the household with
25.1 percent and those owned by other private individuals (10.9%). Households living in
government owned bungalows, private employer’s bungalow and private agency owned
houses is less than one percent.
Room occupancy
Slightly more than half (51.2%) of all the households in the District occupy one sleeping
room, followed by two and three sleeping rooms with 30.9 percent and 10.2 percent
respectively. Households occupying seven sleeping rooms and more in the District account
for less than one percent of the total household population. The data further show some level
of overcrowding as majority of the 5-9 member households occupy two sleeping rooms.
Household facilities and amenities
The main sources of lighting for households in the Ketu North District are kerosene lamp and
electricity (mains) accounting for 96.9 percent. There are urban-rural variations in the sources
of domestic lighting. Over three quarters of the households in the rural areas have kerosene
lamp as their main source of lighting compared with 44.7 percent in urban areas. The data
further indicate that 52.9 percent of households in the urban areas use electricity (mains) as
their main source of lighting as compared with 21.8 percent in the rural areas. Also, 1.8
percent of households in the rural areas use flashlight/torch as the main source of lighting
which is higher than the District average of (1.4%). Less than 1.0 percent of households use
gas lamp, solar energy, crop residue as their main source of lighting.
In terms of the sources of cooking fuel in the District, the data show that there are three main
sources of cooking fuel for households. The highest proportion of households use wood as
their main source of cooking fuel (63.0%), followed by charcoal (28.7%), and gas (5.7%).
The use of other sources such as kerosene, crop residue and electricity (private generator) as
the source of cooking fuel is negligible as less than 1.0 percent as of households in the
District use it.
In the rural areas, because wood is locally available, it is the main source of cooking fuel for
78.4 percent of households as compared to 36.3 percent in the urban areas. In contrast,
charcoal which is often produced for urban dwellers is used by 50.1 percent of households in
the urban areas, and 16.3 percent in the rural areas.
Structures with roof but without walls are the most common type of cooking space for the
households in the District. About one in every three households (32.5 %) use cooking spaces
that have structures with roof but without walls while more than one-quarter (28.1%) of
households use open spaces in their compounds as cooking space. In the urban areas, the
proportion of households that use structure with roof but without walls is lower (20.4%) than
in the rural areas (39.4%). Similarly, the households that cook in the open space within the
compound is higher in the urban areas (35.3%) than in the rural areas (24.0%).
In terms of sources for drinking water supply to households, it is noted that there are four
main sources. These include rainwater, public tap/standpipe, pipe-borne outside dwelling and
bore-hole pump/tube well. Rainwater is the most common source of water used by
households for both drinking (25.4%) and for other domestic purposes (27.0%) in the
District.

64
Also, public tap/standpipe, pipe-borne outside dwelling units are commonly used for both
drinking and domestic in urban and rural areas.
In terms of toilet and bathing facilities, pit latrine and public toilet facilities are the toilet
facility used by majority of households in the District. Pit latrines are used by 39.2 percent of
the households in the District and 24.2 percent use public toilet facilities. A further 22.8
percent of the households in the District have no access to any type of toilet facility and
therefore, resort to open defecation which is more prominent among households in the rural
areas (27.7%) than among the urban households (14.1%). The results also show that 43.1
percent of the urban households depend on public toilets as compared to 13.4 percent for their
rural counterparts.
The census also show that almost one-third of the households in the District have their own
bathroom for exclusive use. The data further show that 37.6 percent of the rural households in
the District have the exclusive use of their own bathroom as compared to their urban
counterparts with only 24.6 percent. A higher proportion of the urban households (32.5%)
than the rural households (13.9%) use shared open cubicles for bathing.
The most common method of solid wastes disposal in the Ketu North District is by public
dump/open space (34.8%), another 20.1 percent of households burn their refuse while about
17.0 percent also dump their waste indiscriminately. In the urban areas, the most common
means of waste disposal is by public dump (container) used by 35.7 percent of households as
compared to 1.8 percent in the rural areas.
On liquid waste disposal, 58.7 percent of households in the District disposed off their liquid
waste by throwing unto their compounds while 32.6 percent dispose of their liquid waste by
throwing unto the street/outside.
9.2 Conclusion
The population dynamics of the District may be determined largely by the fertility and
mortality processes. The majority of the population in the District resides in the rural areas.
There are disparities among the localities and socio-economic sub-groups regarding the
various aspects of life. Levels of education and literacy rate are lower among rural dwellers
and women.
Households in the District are predominantly male-headed. Differences, however, exist
among the various localities and seem to be due to variations in their levels of urbanization.
Household sizes are smaller in the District, with rural households having relatively larger
household sizes than their urban counterparts. Children and spouses constitute large
proportion of both rural and urban households, indicating that the nuclear family living
arrangements is gaining prominence in the District.
The prevalence of disability is low in the Ketu North District relative to the regional average.
Six major types of disabilities are reported in the District namely sight, hearing, speech,
physical, intellectual and emotional. A significant proportion of persons with disabilities
reported multiple disabilities.
The employment characteristics of the population indicate that the employed population is
mostly self-employed without employees. Such employment hardly generates employment
for others.
65
Agricultural production is the predominant economic activity in the District. Over half of all
the households in the District are engaged in crop farming and livestock rearing. The
proportion of agricultural activities in rural areas is quite high.
Most of the households in the District sleep in one or two sleeping rooms. On the average, the
majority of all dwelling units in the District are owned by private individual household
members but this is true among the rural households than among their urban counterparts.
Access to amenities and facilities such as water and electricity within the dwelling units is
limited.
Access to and usage of modern ICT facilities such as mobile phone, internet, fixed telephone
lines and computers in the District is very limited.
9.3 Policy implications
The formulation and implementation of development policies are often driven by data. The
District specific demographic and socio-economic information from the 2010 Population and
Housing Census could inform the goals and objectives of policies targets to be achieved, and
strategies adopted for achieving such targets.
The following recommendations are made based on the findings in this report:
9.2.1 Population size, growth and structure
Analysis of the District population size and structure indicates a relatively young population,
which has the potential for further growth. The results have implications for the planning of
social services, particularly education and health. It is therefore recommended that the
integration of population variables into District development planning should be given more
prominence.
Urbanization
Even though the District is more rural, there is enough evidence to show the potential of
urbanization. Urbanization has both development opportunities and serious challenges for
socio-economic growth. The opportunities offered by urbanization include sustained decrease
in fertility and mortality rates, cities serving as engines of growth, cost-effectiveness in the
provision of infrastructure and social services such as health and education, and more
efficient environmental management. The challenges on the other hand include development
of slums and squatter settlements, growth of urban poverty, deterioration of urban
environment, inadequate provision of social infrastructure and services, and urban
governance. These observations suggest the need for the adoption and implementation of a
comprehensive District Urban Policy.
Fertility
Total Fertility Rate (TFR) in the District is higher than both the regional and the national
averages. This means that there is a higher fertility among the women in the District which
have implications for population growth and the provision of services. To manage this
phenomenon, there is the need to continue with, and intensify education and family planning
programmes in the District.

66
Mortality
The results of this report show that mortality rate is quite high in the District. The
strengthening of initiatives aimed at improving family planning, girl child education and
maternal health services in the District could go a long way to reduce mortality.
Education
The report shows that illiteracy and lack of formal education are still high in the District
especially among adults. These compromise the quality of labour force in the District. The
policy of Free and Compulsory Universal Basic Education (fCUBE) should be vigorously
enforced and opportunities offered by educational initiatives such as the Ghana School
Feeding Programme, Capitation Grant and provision of free school uniforms and exercise
books to children of school-going age should be expanded in order to enrol and retain more
of them in school.
Even though the Ketu North District recorded a higher proportion of girls than boys in basic
school, gender specific educational initiatives need to be put in place to ensure that both boys
and girls enrol and remain in school. The District Assembly should consider the
establishment of educational fund to assist brilliant but needy students, especially girls, to
pursue senior high and tertiary education.
Non-formal or adult educational policies should be vigorously pursued to cover more of the
non-educated adults in basic literacy and numeracy skills. It is hoped that this programme
could whip-up the interest of adults in education and their children especially the girl-child.
9.4 Occupation and industry
Workers in skilled agriculture and related occupations are in the majority in the District and
agriculture, forestry and fishing is the largest sector employing more than 50.0 per cent of the
economically active population. On the basis of these results, the following are suggested:
Efforts to modernize agriculture using appropriate technologies to increase
productivity in the sector need to be intensified.
Farmers need to be supported to acquire implements and small to medium scale
irrigation equipment that will facilitate farming activities throughout the year in order
to improve their incomes and household welfare.
The linkage between agricultural related activities and local industries need to be
strengthened to create employment and ensure efficiency in both sectors.
The link between the Ohawu Agricultural College and local farmers should be
strengthened to ensure that extension services are provided to farmers on regular
basis.
Community facilities and amenities
The quality of life of the people in the communities in the District depends largely on access
to good drinking water, electricity, and adequate sanitary facilities among others. The report
shows however, that access to these facilities tends to be poor and non-existent in most
homes. It is therefore recommended that:

67
District Assembly in collaboration with non-governmental organizations operating in
the water sector target underserved communities to provide them with more bore-
holes. This will ensure access to portable water for those communities and reduce the
incidence of water-related diseases.
Households should be encouraged to construct their own toilet facilities within their
dwellings. Health and hygiene education should be intensified with the involvement
of the communities. This awareness can hopefully influence the attitude of the
households towards a more sustainable environmental hygiene.
Environmental Actors in the District Assembly should be supported to enforce by-
laws regarding building construction, solid and liquid waste disposal. The District
Assembly should ensure that all building plans submitted for permit incorporate toilet
facilities before granting such requests in order to reduce households without access
to toilet facilities.
An important concern is the use of wood as the main source of fuel for cooking with
its adverse impact on the vegetation in the District. The policy makers at the national
level need to devise strategies for households to cut down on the use of wood for
cooking and rather encourage use LPG as replacement.

68
REFERENCES
GSS (2013), 2010 PHC National Analytical Report, 2012
GSS (2013), 2010 PHC Volta Regional Analytical Report, 2013
Ketu North District Assembly (2010), Ketu North District Medium Term Development Plan
(MTDP) 2010-2013.

69
APPENDICES
Table A1: Household composition by type of locality
Household Composition
Total Urban Rural
Total Percent Urban Percent Rural Percent
Total 98,571 100.0
33,580 100.0
64,991 100.0
Nuclear family
Head only 5,613 5.7
2,358 7.0
3,255 5.0
Household with head and a spouse only 2,052 2.1
788 2.3
1,264 1.9
Household with head and
biological/adopted children only 14,287 14.5
4,831 14.4
9,456 14.5
Household with head spouse(s) and
biological/adopted children only 27,604 28.0
8,615 25.7
18,989 29.2
Extended family
Household with head spouse(s)
biological/adopted children and
relatives of the head only 16,117 16.4
5,122 15.3
10,995 16.9
Household with head spouse(s)
biological/adopted children relatives
and nonrelatives of the head 563 0.6
223 0.7
340 0.5
Household with head spouse(s) and
other composition 2,889 2.9
991 3.0
1,898 2.9
Household with head
biological/adopted children and
relatives of the head only 18,247 18.5
6,380 19.0
11,867 18.3
Household with head
biological/adopted children relatives
and nonrelatives of the head 825 0.8
414 1.2
411 0.6
Household with head and other
composition but no spouse 10,374 10.5 3,858 11.5 6,516 10.0 Source: Ghana Statistical Service, 2010 Population and Housing Census

70
Table A2: Population by sex, number of households and houses
in the 20 largest communities
Serial
No. Community Name
Sex
Households Houses Total Male Female
1 Dzodze 22,862 10,468 12,394 6,444 4,339
2 Penyi 6,078 2,797 3,281 1,720 1,214
3 Ehie 5,256 2,351 2,905 1,502 1,271
4 Tadzewu 3,465 1,560 1,905 912 762
5 Afife 2,590 1,217 1,373 685 606
6 Weta 2,494 1,145 1,349 682 534
7 Adrume 1,620 773 847 380 324
8 Ohawu 1,538 752 786 365 333
9 Dalame 1,368 651 717 353 343
10 Kave 1,283 616 667 240 234
11 Devego 1,222 555 667 374 398
12 Atravenu 1,187 521 666 333 265
13 Dekpor Horme 1,167 520 647 305 267
14 Agbogakope 1,048 508 540 218 225
15 Adzortsi 1,046 483 563 240 229
16 Dekporyia 1,030 450 580 268 252
17 Ehi-Horme 1,021 482 539 241 208
18 Sotaga 937 426 511 275 193
19 Klenormadi 906 450 456 215 206
20 Avunu 884 414 470 266 329 Source: Ghana Statistical Service, 2010 Population and Housing Census
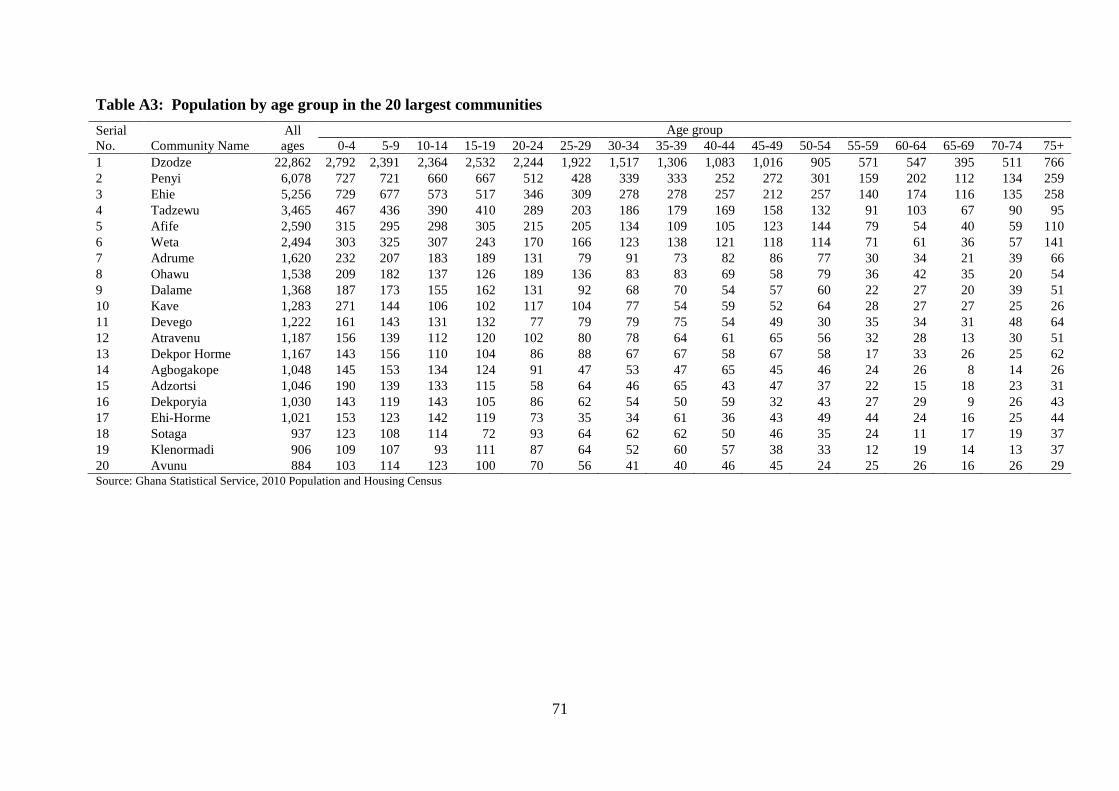
71
Table A3: Population by age group in the 20 largest communities
Serial
No. Community Name
All
ages
Age group
0-4 5-9 10-14 15-19 20-24 25-29 30-34 35-39 40-44 45-49 50-54 55-59 60-64 65-69 70-74 75+
1 Dzodze 22,862 2,792 2,391 2,364 2,532 2,244 1,922 1,517 1,306 1,083 1,016 905 571 547 395 511 766
2 Penyi 6,078 727 721 660 667 512 428 339 333 252 272 301 159 202 112 134 259
3 Ehie 5,256 729 677 573 517 346 309 278 278 257 212 257 140 174 116 135 258
4 Tadzewu 3,465 467 436 390 410 289 203 186 179 169 158 132 91 103 67 90 95
5 Afife 2,590 315 295 298 305 215 205 134 109 105 123 144 79 54 40 59 110
6 Weta 2,494 303 325 307 243 170 166 123 138 121 118 114 71 61 36 57 141
7 Adrume 1,620 232 207 183 189 131 79 91 73 82 86 77 30 34 21 39 66
8 Ohawu 1,538 209 182 137 126 189 136 83 83 69 58 79 36 42 35 20 54
9 Dalame 1,368 187 173 155 162 131 92 68 70 54 57 60 22 27 20 39 51
10 Kave 1,283 271 144 106 102 117 104 77 54 59 52 64 28 27 27 25 26
11 Devego 1,222 161 143 131 132 77 79 79 75 54 49 30 35 34 31 48 64
12 Atravenu 1,187 156 139 112 120 102 80 78 64 61 65 56 32 28 13 30 51
13 Dekpor Horme 1,167 143 156 110 104 86 88 67 67 58 67 58 17 33 26 25 62
14 Agbogakope 1,048 145 153 134 124 91 47 53 47 65 45 46 24 26 8 14 26
15 Adzortsi 1,046 190 139 133 115 58 64 46 65 43 47 37 22 15 18 23 31
16 Dekporyia 1,030 143 119 143 105 86 62 54 50 59 32 43 27 29 9 26 43
17 Ehi-Horme 1,021 153 123 142 119 73 35 34 61 36 43 49 44 24 16 25 44
18 Sotaga 937 123 108 114 72 93 64 62 62 50 46 35 24 11 17 19 37
19 Klenormadi 906 109 107 93 111 87 64 52 60 57 38 33 12 19 14 13 37
20 Avunu 884 103 114 123 100 70 56 41 40 46 45 24 25 26 16 26 29 Source: Ghana Statistical Service, 2010 Population and Housing Census

72
LIST OF CONTRIBUTORS
Project Secretariat
Dr. Philomena Nyarko, Government Statistician
Mr. Baah Wadieh, Deputy Government Statistician
Mr. David Yenukwa Kombat, Acting Census Coordinator
Mr. Sylvester Gyamfi, DISDAP Project Coordinator
Mrs. Abena A. Osei-Akoto, Data Processing
Mr. Rochester Appiah Kubi Boateng, Data Processing
Mrs. Jacqueline Anum, Data Processing
Mrs. Samilia Mintah, Data Processing
Mr. Yaw Misefa, Data Processing
Mr. Ernest Enyan, Data Processing
Mr. Chris Amewu, Regional Statistician
Ms. Hanna Frempong Konadu, Formatting/Typesetting
Ms. Katherine Henaku, Formatting/Typesetting
Writers
Mr. Louis Toboh
Mr. Seth Cephas Senyo
Consultant
Dr. John Agyei
Editor/ Reviewers
Prof. Samuel K. Gaisie
Mr. Emmanuel Boateng
Mr. John Foster Agyaho
Mr. Kobina Abaka Ansah