
Smile Makeover Solutions from Kerrisdale Dental in Vancouver
Upload
canadianvalueCategory
view
355download
1description
October 2013
Lindsay Corporation (LNN) Irrigating the Emerging Markets with a Modest Valuation
We are long shares of Lindsay Corporation (NYSE:LNN), a global irrigation business headquartered in
Omaha, Nebraska. Lindsay owns a world-renowned brand name (Zimmatic), sells into an under-
penetrated market and benefits from the secular trends of increasing global food scarcity and rising
protein consumption. Given this long-term growth opportunity, a robust capital efficiency profile (ROIC
of 25%+), and the stock trading at 13.7x net-cash P/E on trough FY 2014E earnings, we believe LNN
shares trade at a 50% discount to our conservative estimate of intrinsic value.
The mechanized irrigation business is a global duopoly, with Lindsay and Valmont Industries (VMI)
combining for about 75% of the global market share. During the 1970’s there were over thirty domestic
manufacturers of center pivot irrigation systems. But the market’s cycles eliminated most of the
competition and the past two decades saw Lindsay and Valmont emerge as the clear leaders.
Mechanized irrigation systems improve crop yields, enhance water efficiency, and provide a higher
return on investment for farmers than competing irrigation methods. Thanks to these benefits, market
penetration of mechanized systems has increased from 35% to 46% in the U.S. over the past decade.
This has driven 15% annualized revenue growth in Lindsay irrigation’s business over the same period.
Over the next decade, we believe attention will shift to the international market, where just ~2% of
irrigated fields employ mechanized systems. If market penetration reaches the level seen in the U.S.,
we believe Lindsay’s international opportunity exceeds $2.5bn in annual revenue, or about ten times
where its international business stands today.
The bear case contends that lower corn prices in 2014 will depress farmer sentiment and cause year-
over-year declines in pivot sales. But even if U.S. farmers temporarily defer purchases, in past cycles
Lindsay’s growth has historically returned after just a few quarters. Furthermore, continued growth in
Lindsay’s international segment, which contributed 58% of irrigation revenue in FQ4 2013, can work to
offset any short-term decline in U.S. farmer spending.
Looking beyond the next few quarters, Lindsay’s continued cash flow generation and projected return
to growth next year will compress the stock’s already cheap EV / EBITDA valuation to 6.0x in FY 2015
and 4.7x in FY 2016. Lindsay’s completely unlevered balance sheet, minimal capex requires, and
secular might also attract private equity interest. With the stock currently depressed because of the
market’s myopic focus on quarterly results, we believe today is an opportune time to acquire shares.
Disclaimer: As of the publication date of this report, Kerrisdale Capital Management, LLC ("Kerrisdale"), other research contributors, and others with whom we have shared our research (the “Authors”) have long positions in and may own option interests on the stock of the Company covered herein (Lindsay Corp) and stand to realize gains in the event that the price of the stock increases. Following publication, the Authors may transact in the securities of the Company. The Authors have obtained all information herein from sources they believe to be accurate and reliable. However, such information is presented “as is”, without warranty of any kind – whether express or implied. The Authors of this report make no representation, express or implied, as to the accuracy, timeliness, or completeness of any such information or with regard to the results obtained from its use. All expressions of opinion are subject to change without notice, and the Authors do not undertake to update this report or any information contained herein. Please read our full legal disclaimer at the end of the report.
Kerrisdale Capital Management, LLC | 1212 Avenue of the Americas, 3rd Floor | New York, NY 10036 | Tel: 212.792.7999 | Fax: 212.531.6153
3
Table of Contents
I. SITUATION OVERVIEW ..................................................................................................... 3
II. BUSINESS DESCRIPTION .................................................................................................. 8
THE BENEFITS OF MECHANIZED IRRIGATION OVER COMPETING TECHNIQUES .............................. 9
III. INTERNATIONAL OPPORTUNITY ................................................................................ 12
LINDSAY HAS A GLOBALLY RESPECTED BRAND NAME WITH A STICKY DEALER NETWORK ........ 15 EXPANDING PROTEIN CONSUMPTION IN EMERGING MARKETS DRIVES DEMAND FOR
FEEDSTOCK CROPS ......................................................................................................................................... 16 BRAZIL – ABUNDANT WATER SUPPLY AND WORLD’S LARGEST AREA OF ARABLE LAND.............. 19 UKRAINE – THE BREAD BASKET OF EUROPE ........................................................................................... 21 LINDSAY’S EFFORTS TO COMBAT GLOBAL FRESH WATER SHORTAGES ............................................. 22
IV. THE INFRASTRUCTURE BUSINESS .............................................................................. 23
V. ADDRESSING THE BEAR ARGUMENT ........................................................................ 25
LOWER CORN PRICES WILL LEAD TO A SHORT-TERM DECLINE IN LINDSAY’S PROFITS ................. 25 LINDSAY’S SHIFT TO THE INTERNATIONAL MARKETS COULD OFFSET U.S. SLOWDOWN .............. 28 THE VALUE OF IRRIGATED FARMLAND CONTINUES TO APPRECIATE................................................ 29 REGULATORY RISKS AND CONSIDERATIONS ............................................................................................ 30
VI. VALUATION ........................................................................................................................ 33
PRIVATE MARKET VALUATION .................................................................................................................... 35
VI. CONCLUSION ..................................................................................................................... 37
VII. FULL LEGAL DISCLAIMER .............................................................................................. 38
Kerrisdale Capital Management, LLC | 1212 Avenue of the Americas, 3rd Floor | New York, NY 10036 | Tel: 212.792.7999 | Fax: 212.531.6153
4
I. Situation Overview
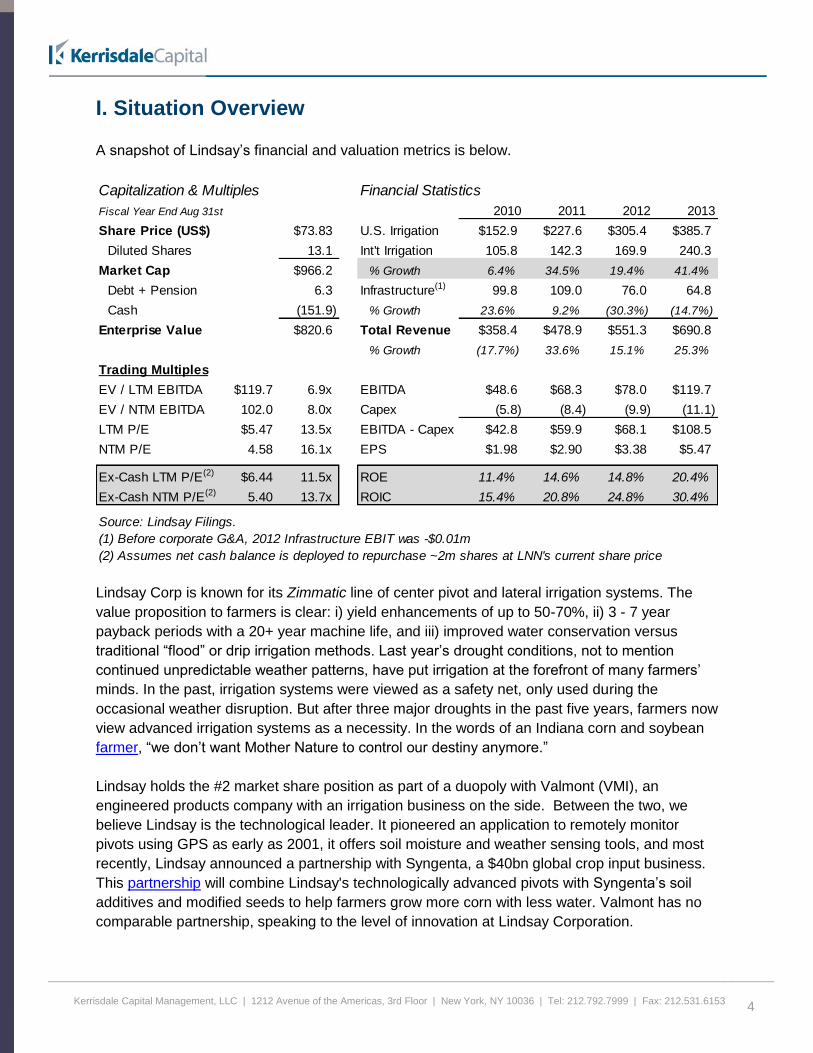
A snapshot of Lindsay’s financial and valuation metrics is below.
Lindsay Corp is known for its Zimmatic line of center pivot and lateral irrigation systems. The
value proposition to farmers is clear: i) yield enhancements of up to 50-70%, ii) 3 - 7 year
payback periods with a 20+ year machine life, and iii) improved water conservation versus
traditional “flood” or drip irrigation methods. Last year’s drought conditions, not to mention
continued unpredictable weather patterns, have put irrigation at the forefront of many farmers’
minds. In the past, irrigation systems were viewed as a safety net, only used during the
occasional weather disruption. But after three major droughts in the past five years, farmers now
view advanced irrigation systems as a necessity. In the words of an Indiana corn and soybean
farmer, “we don’t want Mother Nature to control our destiny anymore.”
Lindsay holds the #2 market share position as part of a duopoly with Valmont (VMI), an
engineered products company with an irrigation business on the side. Between the two, we
believe Lindsay is the technological leader. It pioneered an application to remotely monitor
pivots using GPS as early as 2001, it offers soil moisture and weather sensing tools, and most
recently, Lindsay announced a partnership with Syngenta, a $40bn global crop input business.
This partnership will combine Lindsay's technologically advanced pivots with Syngenta’s soil
additives and modified seeds to help farmers grow more corn with less water. Valmont has no
comparable partnership, speaking to the level of innovation at Lindsay Corporation.
Capitalization & Multiples Financial Statistics
Fiscal Year End Aug 31st 2010 2011 2012 2013
Share Price (US$) $73.83 U.S. Irrigation $152.9 $227.6 $305.4 $385.7
Diluted Shares 13.1 Int't Irrigation 105.8 142.3 169.9 240.3
Market Cap $966.2 % Growth 6.4% 34.5% 19.4% 41.4%
Debt + Pension 6.3 Infrastructure(1) 99.8 109.0 76.0 64.8
Cash (151.9) % Growth 23.6% 9.2% (30.3%) (14.7%)
Enterprise Value $820.6 Total Revenue $358.4 $478.9 $551.3 $690.8
% Growth (17.7%) 33.6% 15.1% 25.3%
Trading Multiples
EV / LTM EBITDA $119.7 6.9x EBITDA $48.6 $68.3 $78.0 $119.7
EV / NTM EBITDA 102.0 8.0x Capex (5.8) (8.4) (9.9) (11.1)
LTM P/E $5.47 13.5x EBITDA - Capex $42.8 $59.9 $68.1 $108.5
NTM P/E 4.58 16.1x EPS $1.98 $2.90 $3.38 $5.47
Ex-Cash LTM P/E(2) $6.44 11.5x ROE 11.4% 14.6% 14.8% 20.4%
Ex-Cash NTM P/E(2) 5.40 13.7x ROIC 15.4% 20.8% 24.8% 30.4%
Source: Lindsay Filings.
(1) Before corporate G&A, 2012 Infrastructure EBIT was -$0.01m
(2) Assumes net cash balance is deployed to repurchase ~2m shares at LNN's current share price
Kerrisdale Capital Management, LLC | 1212 Avenue of the Americas, 3rd Floor | New York, NY 10036 | Tel: 212.792.7999 | Fax: 212.531.6153
5
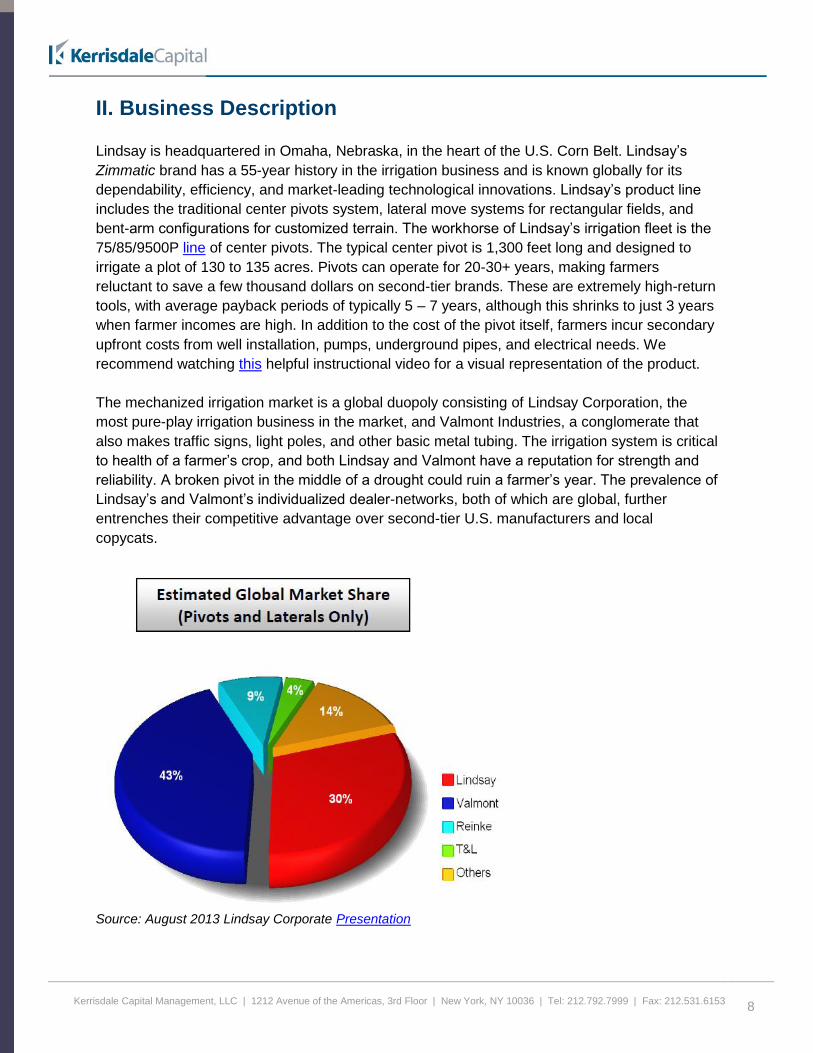
Lindsay currently controls 30% of the global market while Valmont owns 43%. Over the past
three, five, and ten-year periods, Lindsay’s irrigation business has grown more quickly, implying
relative market share gains for Lindsay. As part of our diligence, we spoke with industry
participants in emerging markets such as Brazil, Ukraine, and the Middle East. In each of these
geographies, we’ve found that Lindsay and Valmont split the #1 and #2 positions while local
competitors are relegated to the background. When asked about quality, farmers almost
unilaterally recommend Lindsay and Valmont with equal vigor. Lindsay’s brand reputation is
supported by a robust dealer network that would be very difficult to replicate. Irrigation dealers
typically trade in a single brand, much like a car dealership does, and these dealers are less
willing to hold inventory for a manufacturer that lacks an existing customer base. Proximity to a
local dealer is critical for the farmer. If a sprinkler breaks or a tire deflates, the farmer needs
immediate access to replacement parts. A combination of market-leading technology, global
mindshare built up over many decades, and an international dealer network gives Lindsay the
sustainable competitive advantage that it has enjoyed thus far.
Lindsay’s share price is depressed due to the market’s focus on short-term, cyclical trends in
U.S. agricultural spending. A fall in corn futures from $7 to $4.50/bushel on expectations of a
larger 2013 harvest means that farmers will have less disposable income next year, potentially
leading to a slowdown in capital equipment buying. The sellside has already adjusted their
guidance for this impact, predicting that Lindsay’s EPS will fall from $5.47 in FY 2013 to $4.58 in
FY 2014. Lindsay’s international segment should help mitigate a temporary U.S. slowdown. The
strength of the international segment was proven in FQ4, when international irrigation revenues
were 58% of the irrigation revenue mix, representing the first quarter ever in which international
sales exceeded 50% of the total revenue mix.
Lindsay’s historical financials, shown below, demonstrate that its business quickly recovers after
temporary disruptions in the corn cycle. There were meaningful disruptions in farmer income
once in 2005 and again in 2009 after the global recession. In both instances, Lindsay quickly
recovered to double-digit growth after two or three sluggish quarters. Viewed over the long-term,
Lindsay has compounded earnings at a 17% annualized growth rate going back to 2003.
For a business with a proven track record, sustainable competitive advantages, and a visible
path to further expansion, we believe a capitalized earnings valuation is appropriate. By building
this valuation on the consensus FY 2014 EBIT estimate of $90m, which would likely be trough
earnings, we have been quite conservative. For comparative purposes, we also calculate a
price target using the FY 2015 EBIT estimate of $100m. We assume Lindsay’s U.S. business
grows at just 2.5%, in-line with GDP forecasts. For Lindsay’s international business, we believe
earnings can compound at a double-digit rate well into the next two decades. Blending these
two assumptions together yields a long-term growth rate of 6%. When combined with a 10.5%
WACC, this works out to a 22x P/E multiple.
Note that we have excluded the infrastructure business from the target valuation, as we assume
it remains break-even on a cash flow basis. A potential turnaround of the business adds upside.
Kerrisdale Capital Management, LLC | 1212 Avenue of the Americas, 3rd Floor | New York, NY 10036 | Tel: 212.792.7999 | Fax: 212.531.6153
6
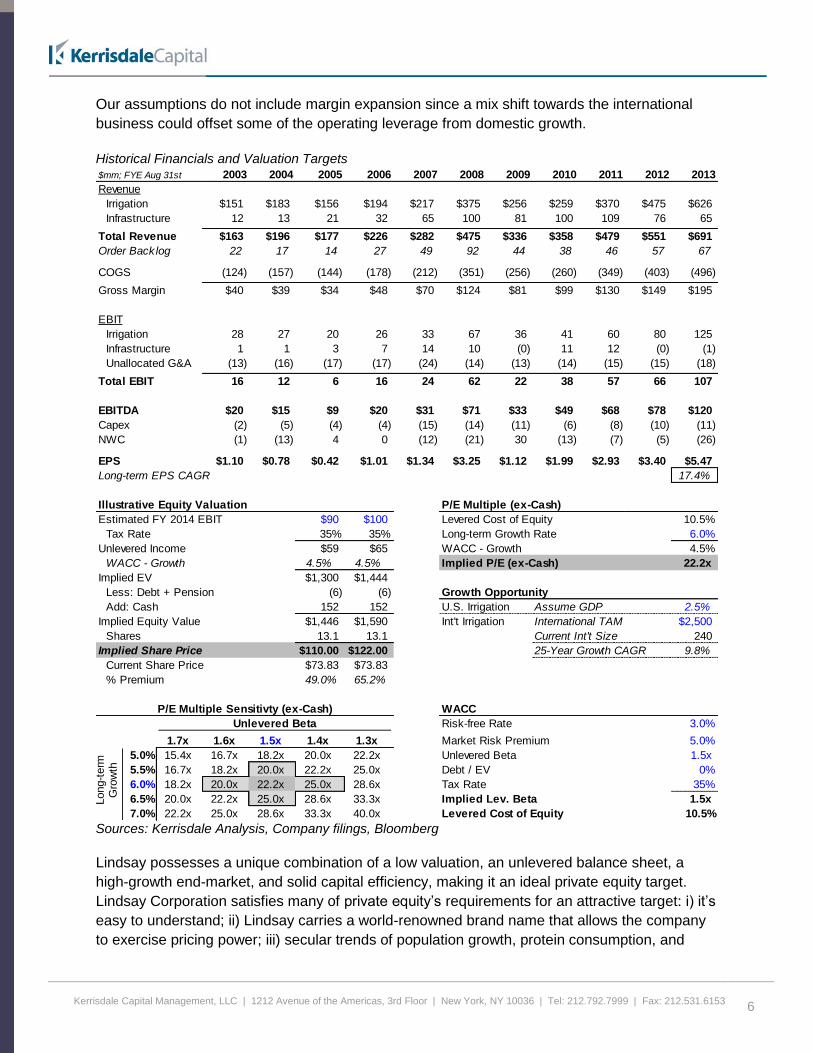
Our assumptions do not include margin expansion since a mix shift towards the international
business could offset some of the operating leverage from domestic growth.
Historical Financials and Valuation Targets
Sources: Kerrisdale Analysis, Company filings, Bloomberg
Lindsay possesses a unique combination of a low valuation, an unlevered balance sheet, a
high-growth end-market, and solid capital efficiency, making it an ideal private equity target.
Lindsay Corporation satisfies many of private equity’s requirements for an attractive target: i) it’s
easy to understand; ii) Lindsay carries a world-renowned brand name that allows the company
to exercise pricing power; iii) secular trends of population growth, protein consumption, and
$mm; FYE Aug 31st 2003 2004 2005 2006 2007 2008 2009 2010 2011 2012 2013
Revenue
Irrigation $151 $183 $156 $194 $217 $375 $256 $259 $370 $475 $626
Infrastructure 12 13 21 32 65 100 81 100 109 76 65
Total Revenue $163 $196 $177 $226 $282 $475 $336 $358 $479 $551 $691
Order Back log 22 17 14 27 49 92 44 38 46 57 67
COGS (124) (157) (144) (178) (212) (351) (256) (260) (349) (403) (496)
Gross Margin $40 $39 $34 $48 $70 $124 $81 $99 $130 $149 $195
EBIT
Irrigation 28 27 20 26 33 67 36 41 60 80 125
Infrastructure 1 1 3 7 14 10 (0) 11 12 (0) (1)
Unallocated G&A (13) (16) (17) (17) (24) (14) (13) (14) (15) (15) (18)
Total EBIT 16 12 6 16 24 62 22 38 57 66 107
EBITDA $20 $15 $9 $20 $31 $71 $33 $49 $68 $78 $120
Capex (2) (5) (4) (4) (15) (14) (11) (6) (8) (10) (11)
NWC (1) (13) 4 0 (12) (21) 30 (13) (7) (5) (26)
EPS $1.10 $0.78 $0.42 $1.01 $1.34 $3.25 $1.12 $1.99 $2.93 $3.40 $5.47
Long-term EPS CAGR 17.4%
Illustrative Equity Valuation P/E Multiple (ex-Cash)
Estimated FY 2014 EBIT $90 $100 Levered Cost of Equity 10.5%
Tax Rate 35% 35% Long-term Growth Rate 6.0%
Unlevered Income $59 $65 WACC - Growth 4.5%
WACC - Growth 4.5% 4.5% Implied P/E (ex-Cash) 22.2x
Implied EV $1,300 $1,444
Less: Debt + Pension (6) (6) Growth Opportunity
Add: Cash 152 152 U.S. Irrigation Assume GDP 2.5%
Implied Equity Value $1,446 $1,590 Int't Irrigation International TAM $2,500
Shares 13.1 13.1 Current Int't Size 240
Implied Share Price $110.00 $122.00 25-Year Growth CAGR 9.8%
Current Share Price $73.83 $73.83
% Premium 49.0% 65.2%
P/E Multiple Sensitivty (ex-Cash) WACC
Unlevered Beta Risk-free Rate 3.0%
22.2x 1.7x 1.6x 1.5x 1.4x 1.3x Market Risk Premium 5.0%
5.0% 15.4x 16.7x 18.2x 20.0x 22.2x Unlevered Beta 1.5x
5.5% 16.7x 18.2x 20.0x 22.2x 25.0x Debt / EV 0%
6.0% 18.2x 20.0x 22.2x 25.0x 28.6x Tax Rate 35%
6.5% 20.0x 22.2x 25.0x 28.6x 33.3x Implied Lev. Beta 1.5x
7.0% 22.2x 25.0x 28.6x 33.3x 40.0x Levered Cost of Equity 10.5%
Long-t
erm
G
row
th
Kerrisdale Capital Management, LLC | 1212 Avenue of the Americas, 3rd Floor | New York, NY 10036 | Tel: 212.792.7999 | Fax: 212.531.6153
7
water scarcity will drive long-term growth; and iv) the stock is cheap, satisfying a 10%+ pre-tax
return hurdle. Lindsay would also be a nice fit for Berkshire Hathaway, which we mention
because Warren Buffett’s son, Howard Buffet, has been a Lindsay board member since 1995.
Other than Lindsay, the only other board that Howard serves on is the Coca-Cola Corporation.
Howard is the future chairman of Berkshire Hathaway and was recently re-elected to the
Lindsay board for a three-year term through 2016.
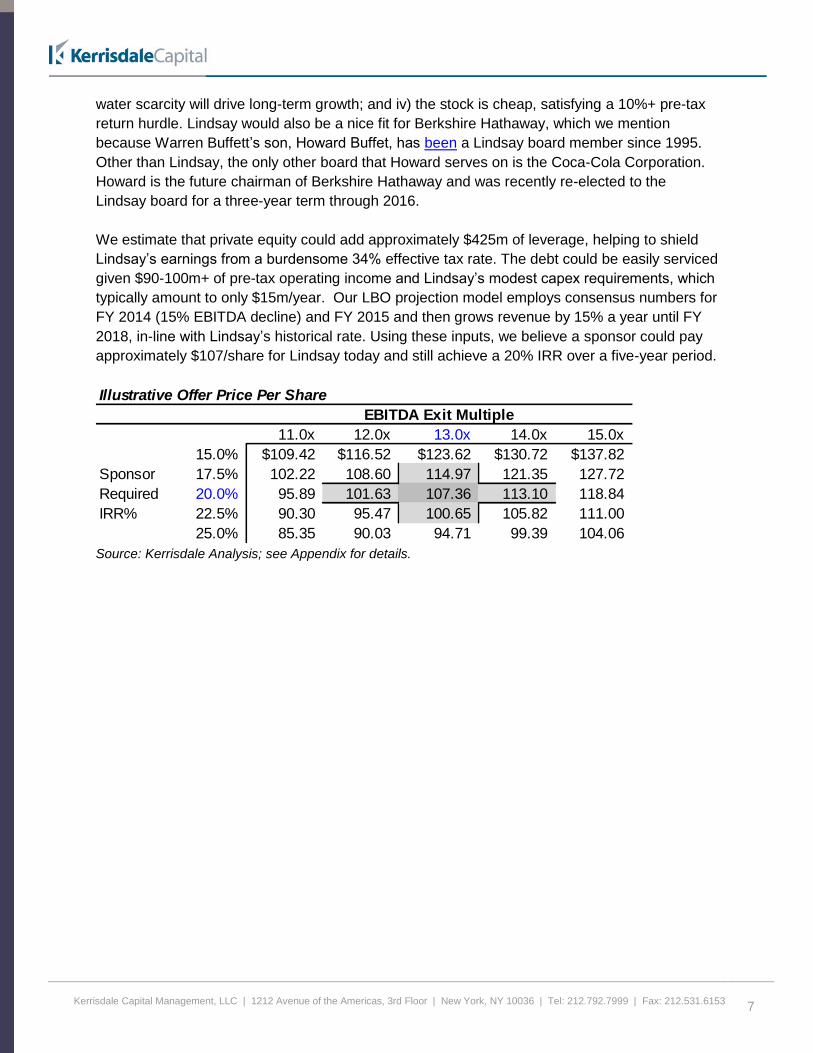
We estimate that private equity could add approximately $425m of leverage, helping to shield
Lindsay’s earnings from a burdensome 34% effective tax rate. The debt could be easily serviced
given $90-100m+ of pre-tax operating income and Lindsay’s modest capex requirements, which
typically amount to only $15m/year. Our LBO projection model employs consensus numbers for
FY 2014 (15% EBITDA decline) and FY 2015 and then grows revenue by 15% a year until FY
2018, in-line with Lindsay’s historical rate. Using these inputs, we believe a sponsor could pay
approximately $107/share for Lindsay today and still achieve a 20% IRR over a five-year period.
Source: Kerrisdale Analysis; see Appendix for details.
Illustrative Offer Price Per Share
EBITDA Exit Multiple
11.0x 12.0x 13.0x 14.0x 15.0x
15.0% $109.42 $116.52 $123.62 $130.72 $137.82
Sponsor 17.5% 102.22 108.60 114.97 121.35 127.72
Required 20.0% 95.89 101.63 107.36 113.10 118.84
IRR% 22.5% 90.30 95.47 100.65 105.82 111.00
25.0% 85.35 90.03 94.71 99.39 104.06
Kerrisdale Capital Management, LLC | 1212 Avenue of the Americas, 3rd Floor | New York, NY 10036 | Tel: 212.792.7999 | Fax: 212.531.6153
8
II. Business Description Lindsay is headquartered in Omaha, Nebraska, in the heart of the U.S. Corn Belt. Lindsay’s
Zimmatic brand has a 55-year history in the irrigation business and is known globally for its
dependability, efficiency, and market-leading technological innovations. Lindsay’s product line
includes the traditional center pivots system, lateral move systems for rectangular fields, and
bent-arm configurations for customized terrain. The workhorse of Lindsay’s irrigation fleet is the
75/85/9500P line of center pivots. The typical center pivot is 1,300 feet long and designed to
irrigate a plot of 130 to 135 acres. Pivots can operate for 20-30+ years, making farmers
reluctant to save a few thousand dollars on second-tier brands. These are extremely high-return
tools, with average payback periods of typically 5 – 7 years, although this shrinks to just 3 years
when farmer incomes are high. In addition to the cost of the pivot itself, farmers incur secondary
upfront costs from well installation, pumps, underground pipes, and electrical needs. We
recommend watching this helpful instructional video for a visual representation of the product.
The mechanized irrigation market is a global duopoly consisting of Lindsay Corporation, the
most pure-play irrigation business in the market, and Valmont Industries, a conglomerate that
also makes traffic signs, light poles, and other basic metal tubing. The irrigation system is critical
to health of a farmer’s crop, and both Lindsay and Valmont have a reputation for strength and
reliability. A broken pivot in the middle of a drought could ruin a farmer’s year. The prevalence of
Lindsay’s and Valmont’s individualized dealer-networks, both of which are global, further
entrenches their competitive advantage over second-tier U.S. manufacturers and local
copycats.
Source: August 2013 Lindsay Corporate Presentation
Kerrisdale Capital Management, LLC | 1212 Avenue of the Americas, 3rd Floor | New York, NY 10036 | Tel: 212.792.7999 | Fax: 212.531.6153
9
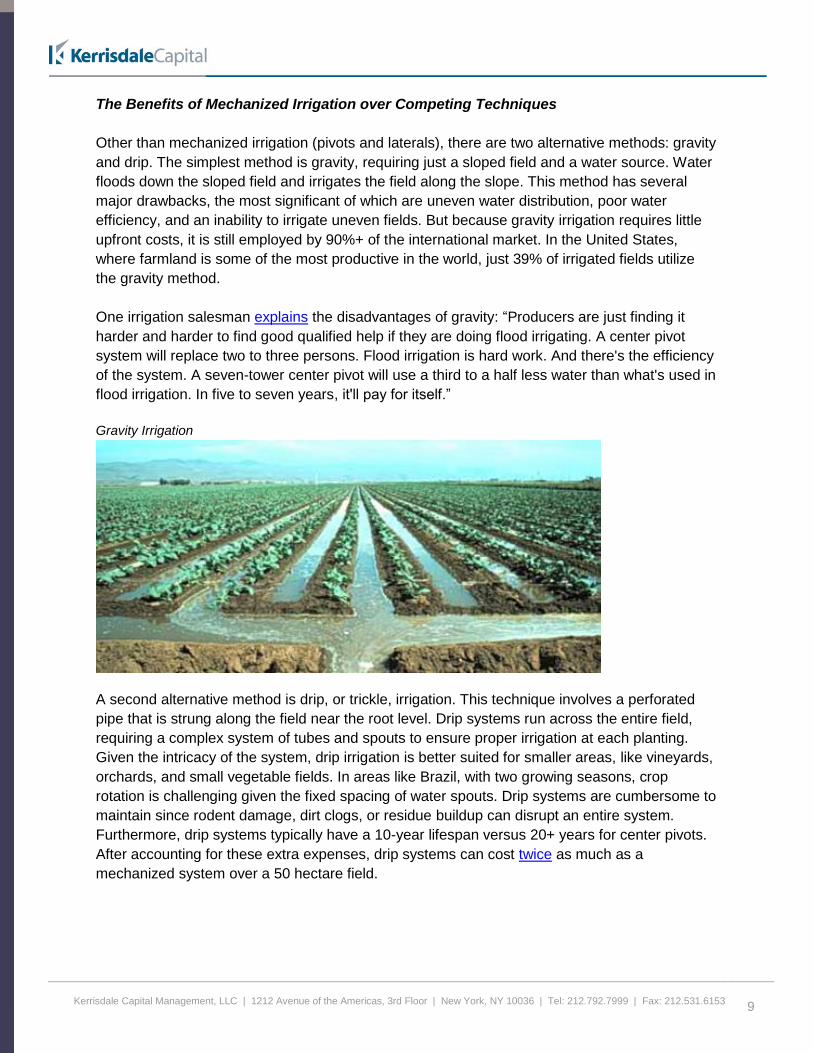
The Benefits of Mechanized Irrigation over Competing Techniques
Other than mechanized irrigation (pivots and laterals), there are two alternative methods: gravity
and drip. The simplest method is gravity, requiring just a sloped field and a water source. Water
floods down the sloped field and irrigates the field along the slope. This method has several
major drawbacks, the most significant of which are uneven water distribution, poor water
efficiency, and an inability to irrigate uneven fields. But because gravity irrigation requires little
upfront costs, it is still employed by 90%+ of the international market. In the United States,
where farmland is some of the most productive in the world, just 39% of irrigated fields utilize
the gravity method.
One irrigation salesman explains the disadvantages of gravity: “Producers are just finding it
harder and harder to find good qualified help if they are doing flood irrigating. A center pivot
system will replace two to three persons. Flood irrigation is hard work. And there's the efficiency
of the system. A seven-tower center pivot will use a third to a half less water than what's used in
flood irrigation. In five to seven years, it'll pay for itself.”
Gravity Irrigation
A second alternative method is drip, or trickle, irrigation. This technique involves a perforated
pipe that is strung along the field near the root level. Drip systems run across the entire field,
requiring a complex system of tubes and spouts to ensure proper irrigation at each planting.
Given the intricacy of the system, drip irrigation is better suited for smaller areas, like vineyards,
orchards, and small vegetable fields. In areas like Brazil, with two growing seasons, crop
rotation is challenging given the fixed spacing of water spouts. Drip systems are cumbersome to
maintain since rodent damage, dirt clogs, or residue buildup can disrupt an entire system.
Furthermore, drip systems typically have a 10-year lifespan versus 20+ years for center pivots.
After accounting for these extra expenses, drip systems can cost twice as much as a
mechanized system over a 50 hectare field.
Kerrisdale Capital Management, LLC | 1212 Avenue of the Americas, 3rd Floor | New York, NY 10036 | Tel: 212.792.7999 | Fax: 212.531.6153
10
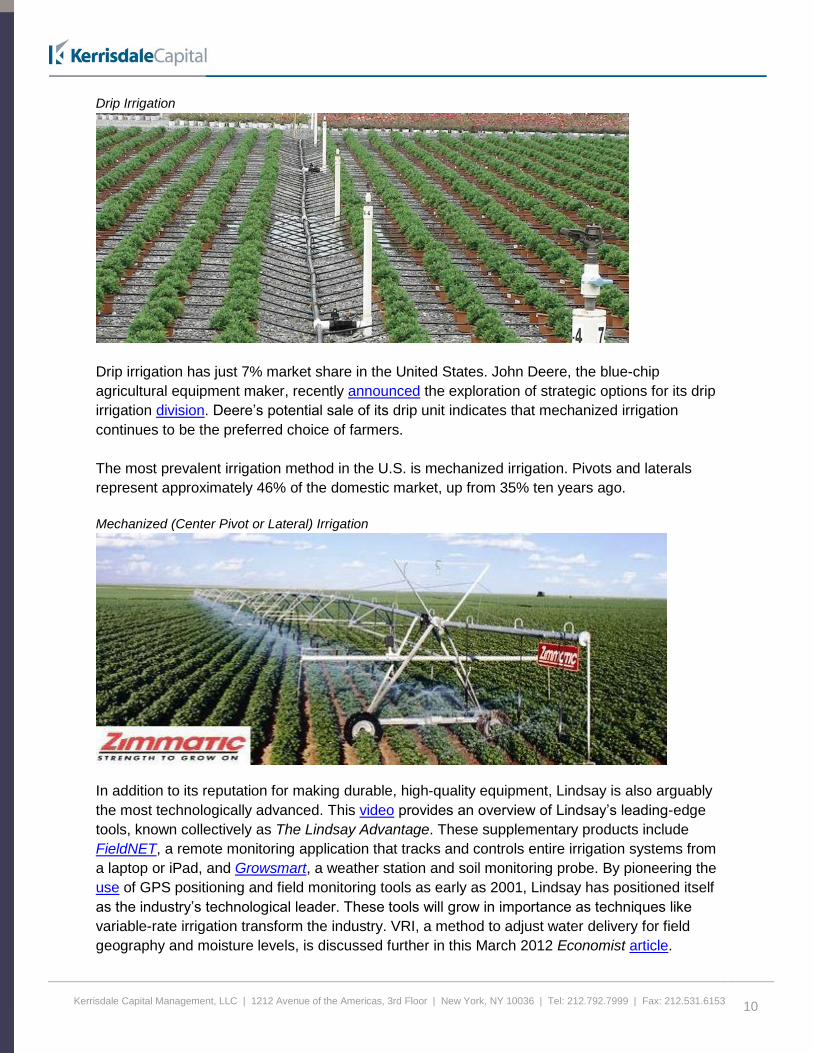
Drip Irrigation
Drip irrigation has just 7% market share in the United States. John Deere, the blue-chip
agricultural equipment maker, recently announced the exploration of strategic options for its drip
irrigation division. Deere’s potential sale of its drip unit indicates that mechanized irrigation
continues to be the preferred choice of farmers.
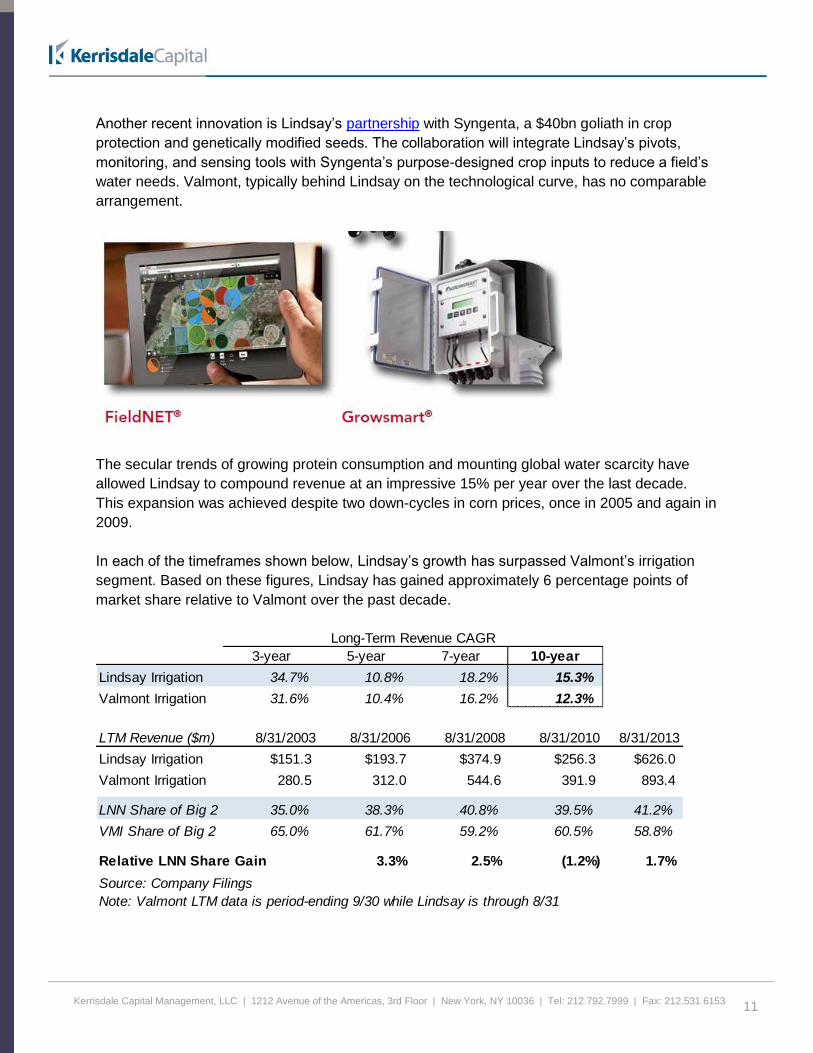
The most prevalent irrigation method in the U.S. is mechanized irrigation. Pivots and laterals
represent approximately 46% of the domestic market, up from 35% ten years ago.
Mechanized (Center Pivot or Lateral) Irrigation
In addition to its reputation for making durable, high-quality equipment, Lindsay is also arguably
the most technologically advanced. This video provides an overview of Lindsay’s leading-edge
tools, known collectively as The Lindsay Advantage. These supplementary products include
FieldNET, a remote monitoring application that tracks and controls entire irrigation systems from
a laptop or iPad, and Growsmart, a weather station and soil monitoring probe. By pioneering the
use of GPS positioning and field monitoring tools as early as 2001, Lindsay has positioned itself
as the industry’s technological leader. These tools will grow in importance as techniques like
variable-rate irrigation transform the industry. VRI, a method to adjust water delivery for field
geography and moisture levels, is discussed further in this March 2012 Economist article.
Kerrisdale Capital Management, LLC | 1212 Avenue of the Americas, 3rd Floor | New York, NY 10036 | Tel: 212.792.7999 | Fax: 212.531.6153
11
Another recent innovation is Lindsay’s partnership with Syngenta, a $40bn goliath in crop
protection and genetically modified seeds. The collaboration will integrate Lindsay’s pivots,
monitoring, and sensing tools with Syngenta’s purpose-designed crop inputs to reduce a field’s
water needs. Valmont, typically behind Lindsay on the technological curve, has no comparable
arrangement.
The secular trends of growing protein consumption and mounting global water scarcity have
allowed Lindsay to compound revenue at an impressive 15% per year over the last decade.
This expansion was achieved despite two down-cycles in corn prices, once in 2005 and again in
2009.
In each of the timeframes shown below, Lindsay’s growth has surpassed Valmont’s irrigation
segment. Based on these figures, Lindsay has gained approximately 6 percentage points of
market share relative to Valmont over the past decade.
Long-Term Revenue CAGR
3-year 5-year 7-year 10-year
Lindsay Irrigation 34.7% 10.8% 18.2% 15.3%
Valmont Irrigation 31.6% 10.4% 16.2% 12.3%
LTM Revenue ($m) 8/31/2003 8/31/2006 8/31/2008 8/31/2010 8/31/2013
Lindsay Irrigation $151.3 $193.7 $374.9 $256.3 $626.0
Valmont Irrigation 280.5 312.0 544.6 391.9 893.4
LNN Share of Big 2 35.0% 38.3% 40.8% 39.5% 41.2%
VMI Share of Big 2 65.0% 61.7% 59.2% 60.5% 58.8%
Relative LNN Share Gain 3.3% 2.5% (1.2%) 1.7%
Source: Company Filings
Note: Valmont LTM data is period-ending 9/30 while Lindsay is through 8/31
Kerrisdale Capital Management, LLC | 1212 Avenue of the Americas, 3rd Floor | New York, NY 10036 | Tel: 212.792.7999 | Fax: 212.531.6153
12
Growth over the past decade was largely driven by technology upgrades in the U.S. farming
industry. Looking out to the next ten 10 years, we believe much of Lindsay’s growth will be
abroad.
III. The International Opportunity
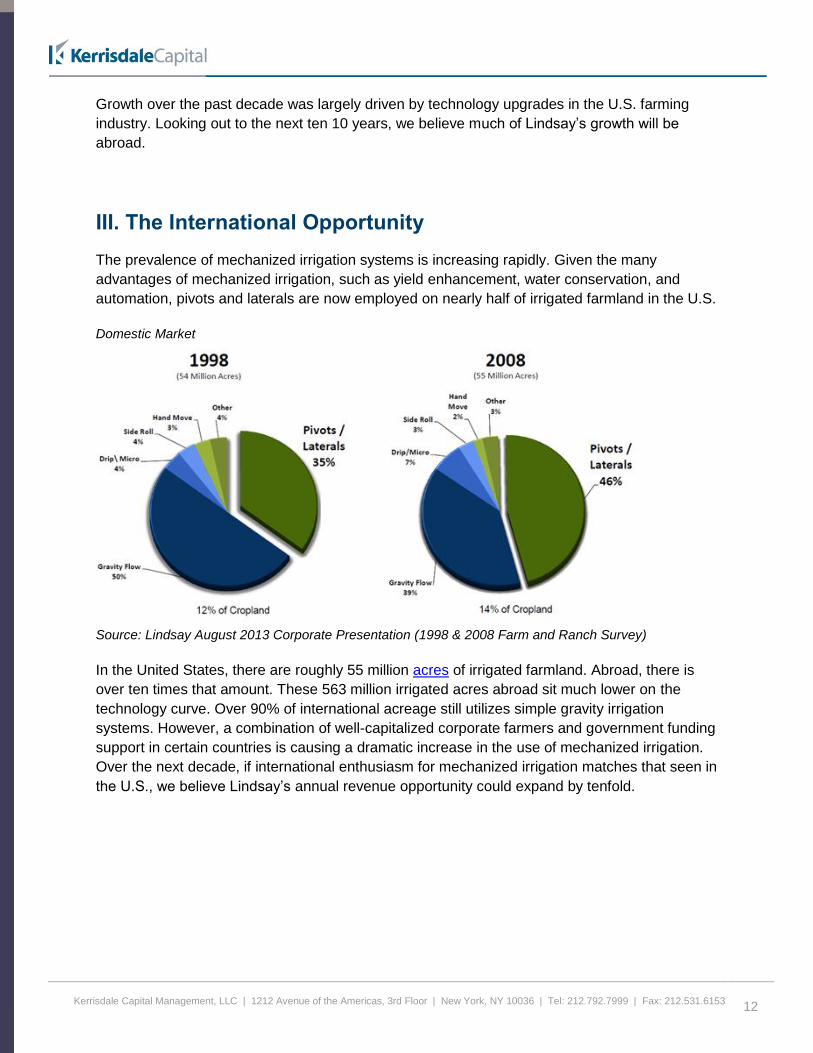
The prevalence of mechanized irrigation systems is increasing rapidly. Given the many
advantages of mechanized irrigation, such as yield enhancement, water conservation, and
automation, pivots and laterals are now employed on nearly half of irrigated farmland in the U.S.
Domestic Market
Source: Lindsay August 2013 Corporate Presentation (1998 & 2008 Farm and Ranch Survey)
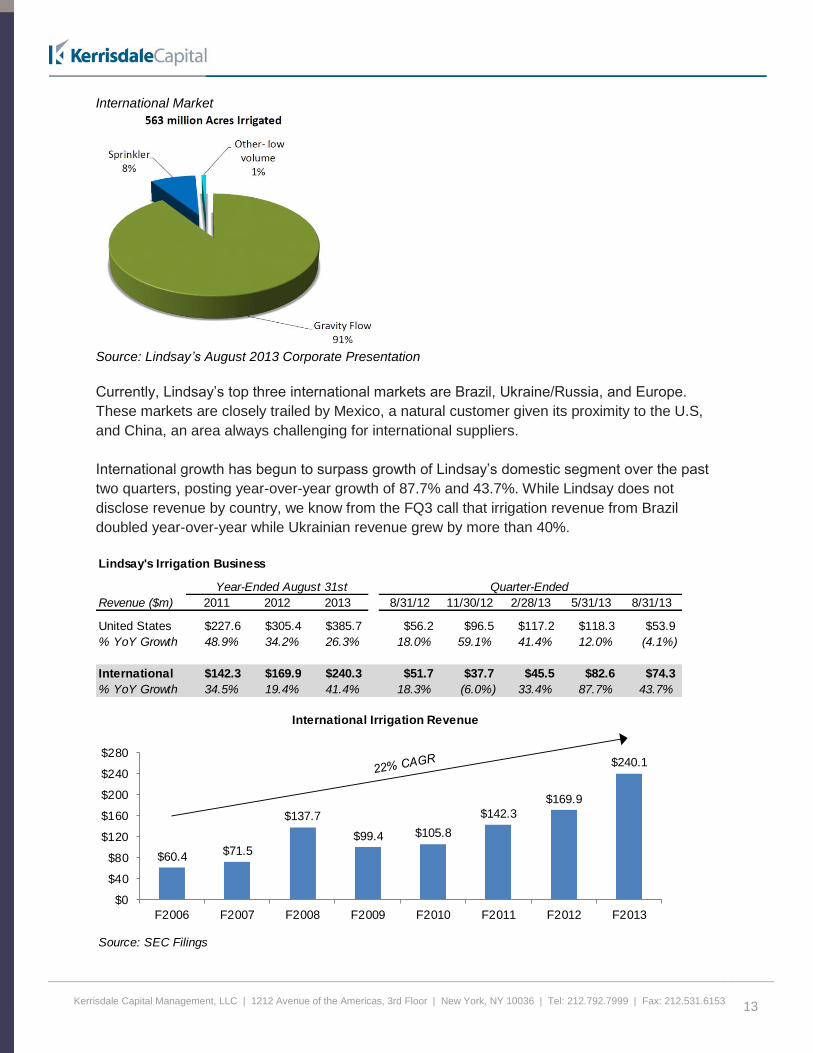
In the United States, there are roughly 55 million acres of irrigated farmland. Abroad, there is
over ten times that amount. These 563 million irrigated acres abroad sit much lower on the
technology curve. Over 90% of international acreage still utilizes simple gravity irrigation
systems. However, a combination of well-capitalized corporate farmers and government funding
support in certain countries is causing a dramatic increase in the use of mechanized irrigation.
Over the next decade, if international enthusiasm for mechanized irrigation matches that seen in
the U.S., we believe Lindsay’s annual revenue opportunity could expand by tenfold.
Kerrisdale Capital Management, LLC | 1212 Avenue of the Americas, 3rd Floor | New York, NY 10036 | Tel: 212.792.7999 | Fax: 212.531.6153
13
International Market
Source: Lindsay’s August 2013 Corporate Presentation
Currently, Lindsay’s top three international markets are Brazil, Ukraine/Russia, and Europe.
These markets are closely trailed by Mexico, a natural customer given its proximity to the U.S,
and China, an area always challenging for international suppliers.
International growth has begun to surpass growth of Lindsay’s domestic segment over the past
two quarters, posting year-over-year growth of 87.7% and 43.7%. While Lindsay does not
disclose revenue by country, we know from the FQ3 call that irrigation revenue from Brazil
doubled year-over-year while Ukrainian revenue grew by more than 40%.
Lindsay's Irrigation Business
Year-Ended August 31st Quarter-Ended
Revenue ($m) 2011 2012 2013 8/31/12 11/30/12 2/28/13 5/31/13 8/31/13
United States $227.6 $305.4 $385.7 $56.2 $96.5 $117.2 $118.3 $53.9
% YoY Growth 48.9% 34.2% 26.3% 18.0% 59.1% 41.4% 12.0% (4.1%)
International $142.3 $169.9 $240.3 $51.7 $37.7 $45.5 $82.6 $74.3
% YoY Growth 34.5% 19.4% 41.4% 18.3% (6.0%) 33.4% 87.7% 43.7%
Source: SEC Filings
$60.4$71.5
$137.7
$99.4 $105.8
$142.3
$169.9
$240.1
$0
$40
$80
$120
$160
$200
$240
$280
F2006 F2007 F2008 F2009 F2010 F2011 F2012 F2013
International Irrigation Revenue
Kerrisdale Capital Management, LLC | 1212 Avenue of the Americas, 3rd Floor | New York, NY 10036 | Tel: 212.792.7999 | Fax: 212.531.6153
14
While the sellside remains transfixed on the daily, weather-driven machinations in U.S. corn
prices, and its effect on next year’s earnings, we’re more interested in the long-term potential of
Lindsay’s international business. As of 2008, the most recent year with available data, only 2%
of international farmland employed mechanized irrigation. Lindsay’s CEO, Rick Parrod,
explained on their Q4 2008 call that “contrary to the U.S. market where we estimate that
between 40 and 50% of irrigated land is irrigated with mechanized systems, market penetration
of mechanized irrigation in the rest of the world is relatively low, estimated to be below 2% of
irrigated crop land.”
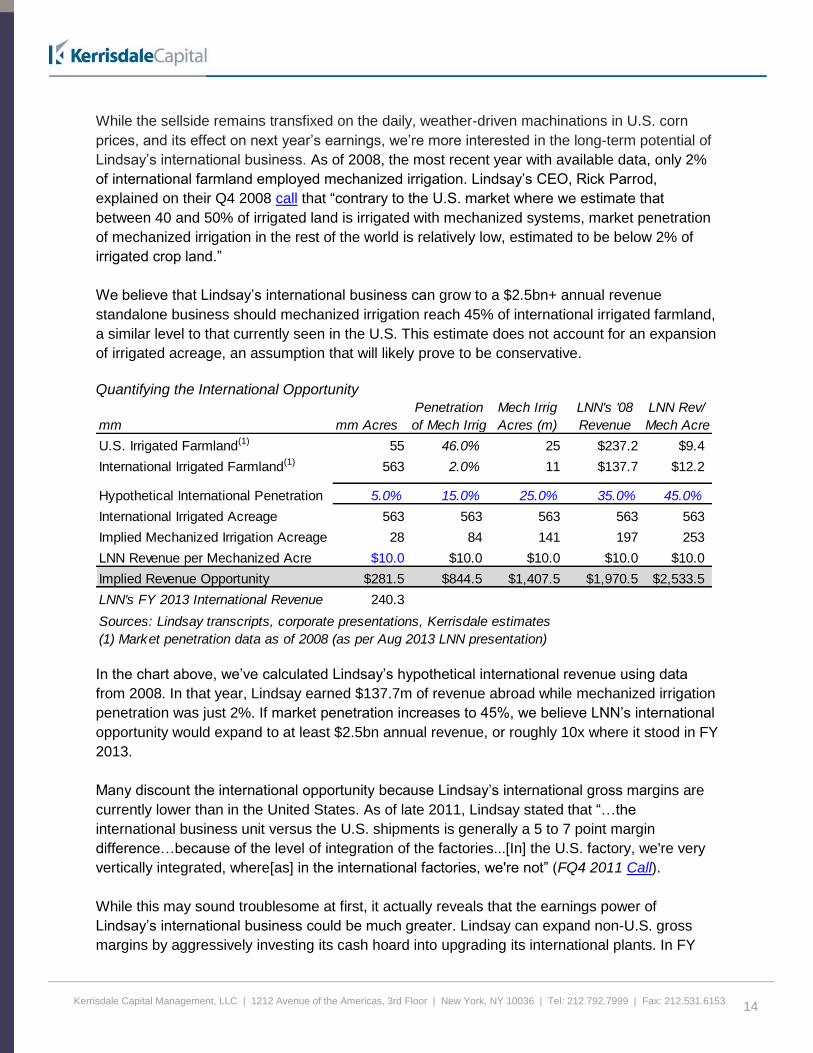
We believe that Lindsay’s international business can grow to a $2.5bn+ annual revenue
standalone business should mechanized irrigation reach 45% of international irrigated farmland,
a similar level to that currently seen in the U.S. This estimate does not account for an expansion
of irrigated acreage, an assumption that will likely prove to be conservative.
Quantifying the International Opportunity
In the chart above, we’ve calculated Lindsay’s hypothetical international revenue using data
from 2008. In that year, Lindsay earned $137.7m of revenue abroad while mechanized irrigation
penetration was just 2%. If market penetration increases to 45%, we believe LNN’s international
opportunity would expand to at least $2.5bn annual revenue, or roughly 10x where it stood in FY
2013.
Many discount the international opportunity because Lindsay’s international gross margins are
currently lower than in the United States. As of late 2011, Lindsay stated that “…the
international business unit versus the U.S. shipments is generally a 5 to 7 point margin
difference…because of the level of integration of the factories...[In] the U.S. factory, we're very
vertically integrated, where[as] in the international factories, we're not” (FQ4 2011 Call).
While this may sound troublesome at first, it actually reveals that the earnings power of
Lindsay’s international business could be much greater. Lindsay can expand non-U.S. gross
margins by aggressively investing its cash hoard into upgrading its international plants. In FY
Penetration Mech Irrig LNN's '08 LNN Rev/
mm mm Acres of Mech Irrig Acres (m) Revenue Mech Acre
U.S. Irrigated Farmland(1) 55 46.0% 25 $237.2 $9.4
International Irrigated Farmland(1) 563 2.0% 11 $137.7 $12.2
Hypothetical International Penetration 5.0% 15.0% 25.0% 35.0% 45.0%
International Irrigated Acreage 563 563 563 563 563
Implied Mechanized Irrigation Acreage 28 84 141 197 253
LNN Revenue per Mechanized Acre $10.0 $10.0 $10.0 $10.0 $10.0
Implied Revenue Opportunity $281.5 $844.5 $1,407.5 $1,970.5 $2,533.5
LNN's FY 2013 International Revenue 240.3
Sources: Lindsay transcripts, corporate presentations, Kerrisdale estimates
(1) Market penetration data as of 2008 (as per Aug 2013 LNN presentation)
Kerrisdale Capital Management, LLC | 1212 Avenue of the Americas, 3rd Floor | New York, NY 10036 | Tel: 212.792.7999 | Fax: 212.531.6153
15
2013, Lindsay budgeted $14 - $17m of capex for this task: “[capex is] largely focused on
manufacturing capacity expansion and productivity improvements” (FQ3 2013 Call). Such
investments can offer very attractive returns on capital, as partly evidenced by the increase in
Lindsay irrigation’s EBITDA margin from 17.6% in FY 2010 to over 20% today.
Lindsay has a Globally Respected Brand Name with a Sticky Dealer Network
Competition in the mechanized irrigation business has consolidated meaningfully over the past
40 years. During the 1970’s, there were over thirty domestic irrigation manufacturers (LNN 1999
10K). Today, that figure has been whittled down to just four: Lindsay, Valmont, Reinke, and T-L
Irrigation. Reinke has 9% global market share while T-L has 4%. Both businesses were founded
in the 1950s and neither has emerged as a preferred choice amongst farmers. Over the years,
there have been more than 80 individuals or companies that have tried to make and sell center
pivots, but only the four mentioned have had meaningful success.
One reason that so few have succeeded is the first-mover advantage afforded to incumbents.
Local dealer networks are critical to the success of a manufacturer, and dealers will only partner
with leading suppliers. Since these dealers typically trade in just one brand, it’s critical for a
manufacturer to attract the widest geographic spread of dealers. Generally, farmers won’t
consider a brand that doesn’t have a dealer location within driving distance. This is because
sprinklers, nozzles, and hoses must be periodically replaced. Farmers cannot afford to damage
a season’s crop while awaiting a spare part. This reliance on local dealers creates a network
effect for the largest manufacturers, namely Lindsay and Valmont, which partially insulates them
from new competition.
But a dealer network alone will not suffice if the product has a poor reputation. Much of our
diligence centered on reading online reviews and speaking to customers, dealers, and
consultants in the industry. Peer-to-peer online reviews by farmers indicate that Zimmatic
(Lindsay) and Valley (Valmont) are the only two brands one should consider:
“I just traded a 37 year [old] Zimmatic for a new one.... I've got no complaints.” – 5-11-
13, ”datyerdog”
“...anything here that is Reinke or is replaced either with Zimmatic or Valley.” – 2-12-13,
“Ron.Koster”
“Valley and Zimmatic are the leading pivot company's much in the same way that John
Deere and Case IH lead the market in ag equipment. And much in the same way with
green and red much depends on your dealer.....if you've got a good dealer then you will
most likely be happy with either one.” – 1-17-13, ”crabby”
“My preference would be a zimmatic with valley second. Valley's have a shorter wheel
base and seems to me like they blow over worse. T&L would not get on my list.” – 12-
17-12, “Nebraska Sandhiller”
Kerrisdale Capital Management, LLC | 1212 Avenue of the Americas, 3rd Floor | New York, NY 10036 | Tel: 212.792.7999 | Fax: 212.531.6153
16
"My choices for new, in order of preference, Zimmatic, basically cause I like the way
Lindsay has put everything under one umbrella, to stop the pass the buck game. Next
would be Valley” – 12-17-12, “ChrisTN”
“All the laterals around here have gone or been converted to center pivots. The best
system I've seen was a Zimmatic diesel powered unit that traveled along a canal.” – 5-3-
12, “offroadnt”
We would also note that discussion of lower-cost Chinese substitutes is non-existent on these
message boards. This is partially due to their reputation for being lower quality and partly
because they lack a domestic dealer network.
We also made dozens of calls to international market participants. The paraphrased quotes
from a few of these are below:
‘Valmont and Lindsay have pretty comparable products...we don’t deal with [Reinke and
T-L] because they don’t have critical market size.’ – Executive at a Global Agricultural
Business
‘All of [Brazil’s] corporate farms are well capitalized...some regions have more Lindsay
equipment and others have more Valmont...there is no local competition’ – Former
Farmer and Consultant in Brazil
‘[In my region] Valley is the market leader, followed by Lindsay, and then Irrigabras [local
competitor] with around 5% market share’ – Distributor in Brazil
‘Lindsay is the most successful brand in Ukraine...Valley isn’t getting the right dealers.’ –
Distributor in Ukraine
‘Russia is giving huge subsidies to agriculture...Valmont and Lindsay are both very
active in Russia’ – Distributor in Ukraine
This primary research helps confirm that Lindsay’s Zimmatic is a premium brand with a loyal
customer base.
Expanding Protein Consumption in Emerging Markets Drives Demand for Feedstock
Crops
The Organization for Economic Co-operation and Development (“OECD”) of the United Nations
has published many reports on global food scarcity issues. The OECD believes that worldwide
agricultural production needs to grow by 60% over the next forty years to meet increased
demand. This trend is linked to population growth, urban migration, and a rapidly expanding
middle class across the emerging markets. As living standards rise, people tend to consume
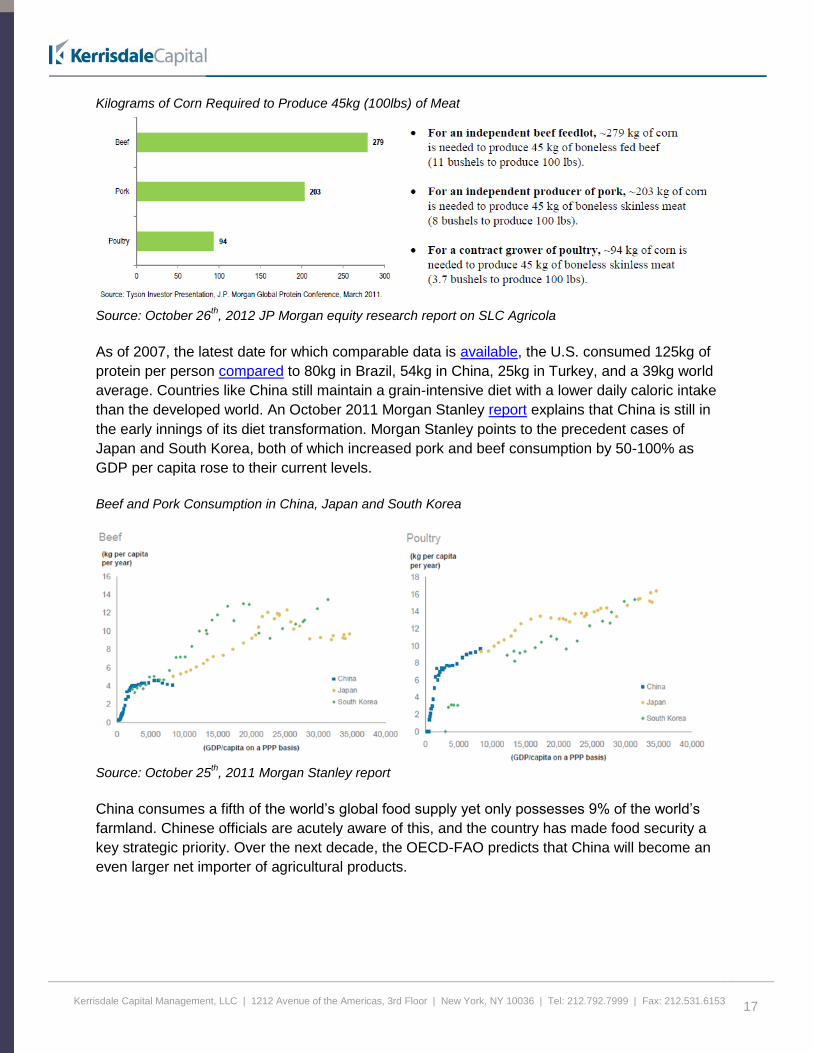
more meat in their diets. Meat-based diets increase demand for grain; it takes roughly 6kg of
corn to produce 1kg of beef. Therefore, growth in meat-based diets can have a logarithmic
impact on the demand for corn.
Kerrisdale Capital Management, LLC | 1212 Avenue of the Americas, 3rd Floor | New York, NY 10036 | Tel: 212.792.7999 | Fax: 212.531.6153
17
Kilograms of Corn Required to Produce 45kg (100lbs) of Meat
Source: October 26
th, 2012 JP Morgan equity research report on SLC Agricola
As of 2007, the latest date for which comparable data is available, the U.S. consumed 125kg of
protein per person compared to 80kg in Brazil, 54kg in China, 25kg in Turkey, and a 39kg world
average. Countries like China still maintain a grain-intensive diet with a lower daily caloric intake
than the developed world. An October 2011 Morgan Stanley report explains that China is still in
the early innings of its diet transformation. Morgan Stanley points to the precedent cases of
Japan and South Korea, both of which increased pork and beef consumption by 50-100% as
GDP per capita rose to their current levels.
Beef and Pork Consumption in China, Japan and South Korea
Source: October 25
th, 2011 Morgan Stanley report
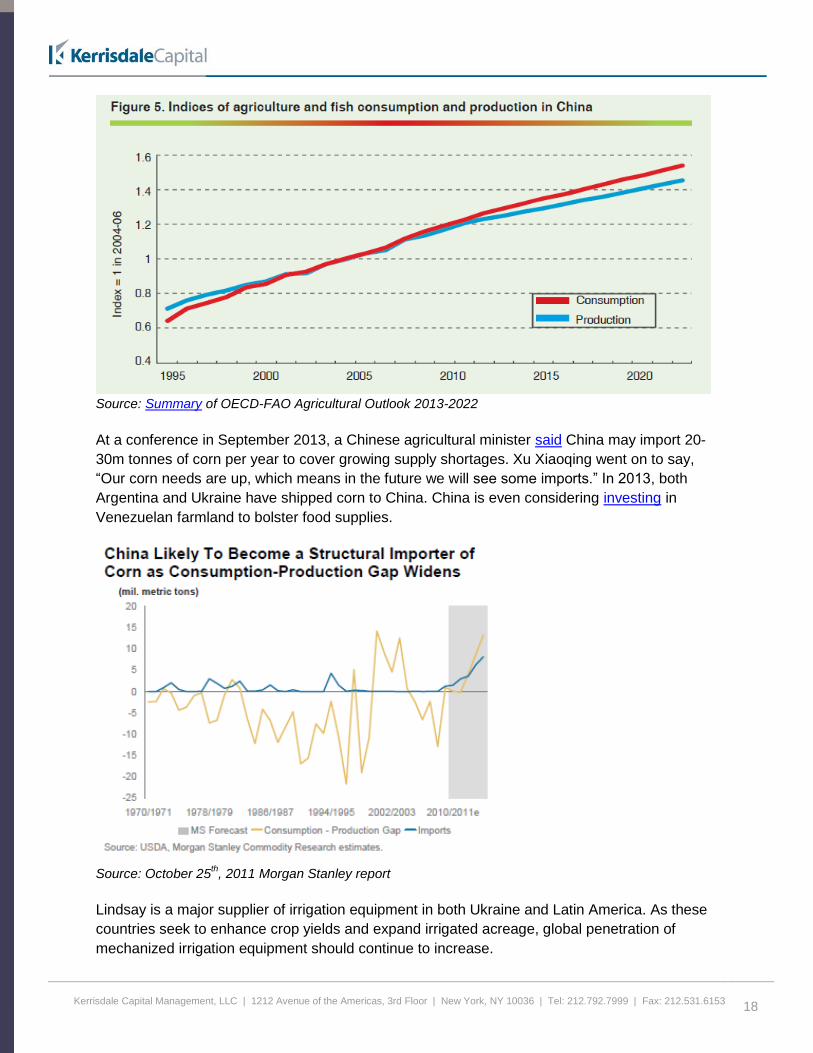
China consumes a fifth of the world’s global food supply yet only possesses 9% of the world’s
farmland. Chinese officials are acutely aware of this, and the country has made food security a
key strategic priority. Over the next decade, the OECD-FAO predicts that China will become an
even larger net importer of agricultural products.
Kerrisdale Capital Management, LLC | 1212 Avenue of the Americas, 3rd Floor | New York, NY 10036 | Tel: 212.792.7999 | Fax: 212.531.6153
18
Source: Summary of OECD-FAO Agricultural Outlook 2013-2022
At a conference in September 2013, a Chinese agricultural minister said China may import 20-
30m tonnes of corn per year to cover growing supply shortages. Xu Xiaoqing went on to say,
“Our corn needs are up, which means in the future we will see some imports.” In 2013, both
Argentina and Ukraine have shipped corn to China. China is even considering investing in
Venezuelan farmland to bolster food supplies.
Source: October 25
th, 2011 Morgan Stanley report
Lindsay is a major supplier of irrigation equipment in both Ukraine and Latin America. As these
countries seek to enhance crop yields and expand irrigated acreage, global penetration of
mechanized irrigation equipment should continue to increase.
Kerrisdale Capital Management, LLC | 1212 Avenue of the Americas, 3rd Floor | New York, NY 10036 | Tel: 212.792.7999 | Fax: 212.531.6153
19
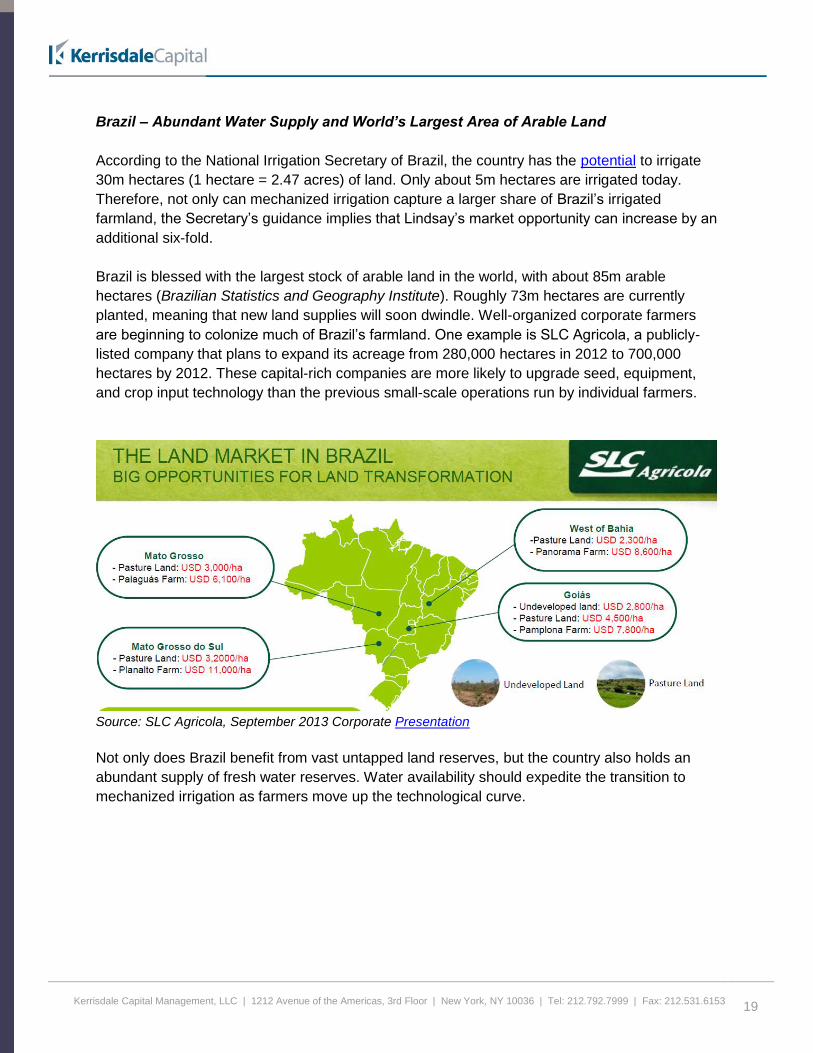
Brazil – Abundant Water Supply and World’s Largest Area of Arable Land
According to the National Irrigation Secretary of Brazil, the country has the potential to irrigate
30m hectares (1 hectare = 2.47 acres) of land. Only about 5m hectares are irrigated today.
Therefore, not only can mechanized irrigation capture a larger share of Brazil’s irrigated
farmland, the Secretary’s guidance implies that Lindsay’s market opportunity can increase by an
additional six-fold.
Brazil is blessed with the largest stock of arable land in the world, with about 85m arable
hectares (Brazilian Statistics and Geography Institute). Roughly 73m hectares are currently
planted, meaning that new land supplies will soon dwindle. Well-organized corporate farmers
are beginning to colonize much of Brazil’s farmland. One example is SLC Agricola, a publicly-
listed company that plans to expand its acreage from 280,000 hectares in 2012 to 700,000
hectares by 2012. These capital-rich companies are more likely to upgrade seed, equipment,
and crop input technology than the previous small-scale operations run by individual farmers.
Source: SLC Agricola, September 2013 Corporate Presentation
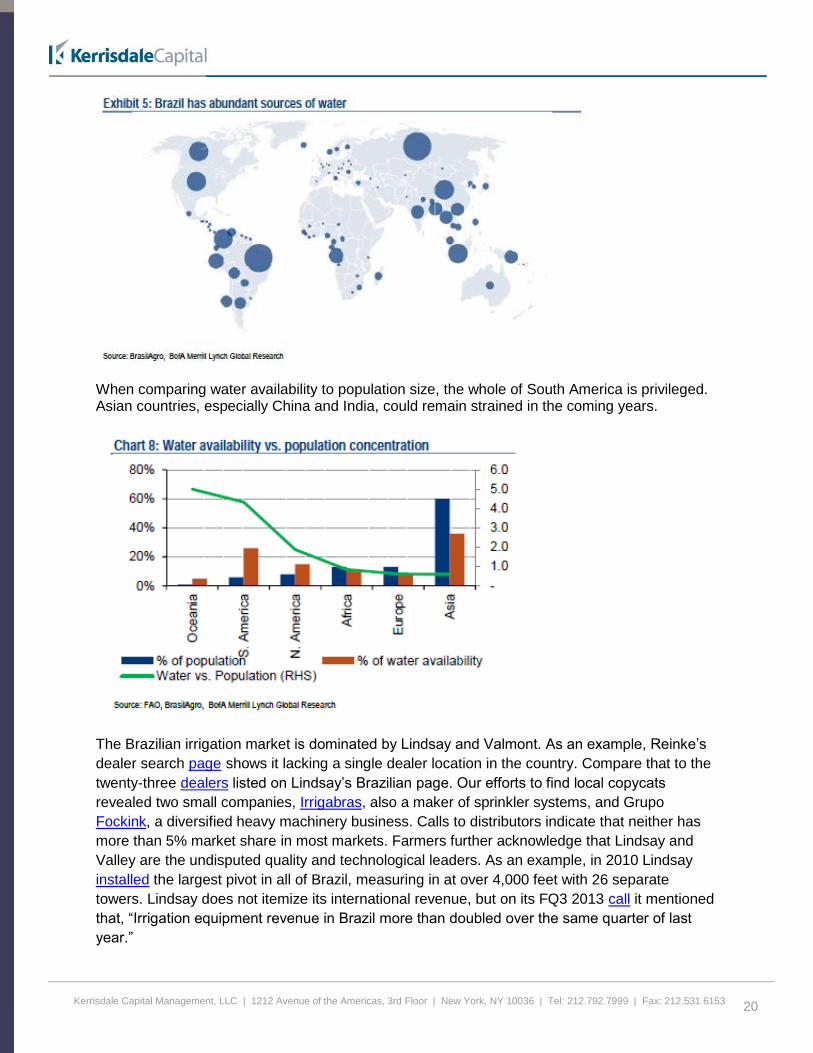
Not only does Brazil benefit from vast untapped land reserves, but the country also holds an
abundant supply of fresh water reserves. Water availability should expedite the transition to
mechanized irrigation as farmers move up the technological curve.
Kerrisdale Capital Management, LLC | 1212 Avenue of the Americas, 3rd Floor | New York, NY 10036 | Tel: 212.792.7999 | Fax: 212.531.6153
20
When comparing water availability to population size, the whole of South America is privileged. Asian countries, especially China and India, could remain strained in the coming years.
The Brazilian irrigation market is dominated by Lindsay and Valmont. As an example, Reinke’s
dealer search page shows it lacking a single dealer location in the country. Compare that to the
twenty-three dealers listed on Lindsay’s Brazilian page. Our efforts to find local copycats
revealed two small companies, Irrigabras, also a maker of sprinkler systems, and Grupo
Fockink, a diversified heavy machinery business. Calls to distributors indicate that neither has
more than 5% market share in most markets. Farmers further acknowledge that Lindsay and
Valley are the undisputed quality and technological leaders. As an example, in 2010 Lindsay
installed the largest pivot in all of Brazil, measuring in at over 4,000 feet with 26 separate
towers. Lindsay does not itemize its international revenue, but on its FQ3 2013 call it mentioned
that, “Irrigation equipment revenue in Brazil more than doubled over the same quarter of last
year.”
Kerrisdale Capital Management, LLC | 1212 Avenue of the Americas, 3rd Floor | New York, NY 10036 | Tel: 212.792.7999 | Fax: 212.531.6153
21
As is common in Brazil, logistical and regulatory issues are seen as the most significant
bottleneck to widespread adoption.
Ukraine – The Bread Basket of Europe
During Tsarist times, Ukraine was referred to as the Empire’s breadbasket. The country
remained an agricultural dynamo when it was part of the former Soviet Union, helping to feed
much of northern Asia. But upon the Soviet Union’s dissolution in 1991, Ukraine declared its
independence and took some of the world’s most fertile land along with it. Ukraine contains 30%
of the world’s black soil, a particularly fertile type of land that can grow cereals in abundance. In
the years after its independence, much of Ukraine’s mechanized farming equipment slowly
depreciated due to underinvestment and neglect. But over the past few years, Ukraine has
begun to make up for lost time, making large-scale investments to modernize its agricultural
industry. The country is now home to one of the fastest growing farming industries in the world.
In October 2013, Ukraine announced the receipt of a $3bn loan from the Export-Import Bank of
China to support irrigation projects for the country’s farmland. The President of Ukraine, Viktor
Yanukovych, further elaborated at the International Investment Forum:
“Ukraine is in active negotiations on the implementation of investment projects for
the rehabilitation of irrigation systems in the south of the country...Now we see
practical interest from the leading countries in irrigative agriculture. Ukraine is in
active talks with foreign partners on the terms of the realization of investment
projects to restore irrigation systems in the south of the country."
Ukraine’s Agricultural Minister believes that China will become a key export market for Ukrainian
cereal production.
The sparse press reports on the announcement indicate this will be a drip irrigation project, and
it’s possible that Chinese drip manufacturers will be a key beneficiary. However, for a project on
this type of scale, we suspect the installation is likely to contain a mix of drip and mechanized
systems, particularly because drip irrigation is challenging to install on a very large scale.
Lindsay’s CEO, Rick Parrod, recently deflected questions on the news report, but did mention
“we're definitely seeing more in opportunities in [Ukraine] than we did even one year ago. So I'm
more optimistic about it today than I have been in the past” (FQ4 2013 Call).
Be it this project or others, Ukraine should remain a robust end-market for Lindsay’s irrigation
systems.
Kerrisdale Capital Management, LLC | 1212 Avenue of the Americas, 3rd Floor | New York, NY 10036 | Tel: 212.792.7999 | Fax: 212.531.6153
22
Lindsay’s Efforts to Combat Global Fresh Water Shortages
Simply put, the world’s fresh water supplies are strained. Factors like a growing global
population, changing diets, climate change, and hydraulic fracturing have contributed to the
trend, and industry observers are growing increasingly alarmed. As an example, China feeds
one-fifth of the world’s population with only 6% of the world’s fresh water. Here in the U.S., the
2012 drought throughout the Corn Belt put pressure on underground aquifer supplies. Growing
more with less water is a challenge that irrigation manufacturers can help to solve.
Mechanized irrigation uses 45% less water than gravity, the method still practiced in 90% of the
world. Internationally, farmers can immediately achieve water savings by switching to Zimmatic
pivots. And because pivots apply water more evenly, customers also benefit from yield
enhancements. This helps solve both sides of the food demand/water scarcity problem.
In the U.S., where mechanized irrigation is more prevalent, farmers may seek out other
innovations. Lindsay has positioned itself as the technological leader in this emerging field by
forging a strategic partnership with Syngenta, a world leader in seed and agricultural chemicals.
Officially announced on July 11th, 2013, the Lindsay/Syngenta partnership is the first of its kind.
By combining Syngenta expertise in seed and crop input technology with Lindsay’s Zimmatic
pivots, FieldNET wireless irrigation management products, and Growsmart monitoring tools, the
Lindsay/Syngenta platform can improve corn yields in water stressed environments. Syngenta
told us that “we believe that the partnership can completely change the industry’s mindset.” The
joint press release explains,
“During the next 15 years, nearly 40 percent of the global population will be
experiencing severe water limitations, and a typical U.S. corn grower will face
water issues in two to three out of every five years. One of the major issues on
irrigated acres is making the best use of available water, and the Syngenta and
Lindsay initiative brings together a comprehensive approach that allows water
to be most efficiently used in irrigated programs”.
The Water Intelligent+ Irrigation Platform, as tested, includes locally adapted Syngenta corn
genetics, Syngenta’s water-resistant input chemicals (Agrisure), and Lindsay’s industry-leading
technologies, such as the FieldNET wireless irrigation management system and Growsmart soil
and weather sensors. The Syngenta seeds and inputs make the plant more water resistant
while Lindsay’s soil sensors ensure that water is delivered where and when it is needed. David
Elser, the head of water optimization at Syngenta, argues that:
“Our new irrigated corn solution is designed to take the worry out of water
efficiency and allow farmers to take control of their farming operations. It’s as
simple as receiving a text message or email alert. The alert shows up on your
smartphone, tablet or computer and tells you exactly what action you should take
on a specific pivot and when you should do it. So you can be at the soccer field
Kerrisdale Capital Management, LLC | 1212 Avenue of the Americas, 3rd Floor | New York, NY 10036 | Tel: 212.792.7999 | Fax: 212.531.6153
23
watching your child and turning on Pivot #60. It’s a lot more than a new
technology – it’s a life changer for farmers.”
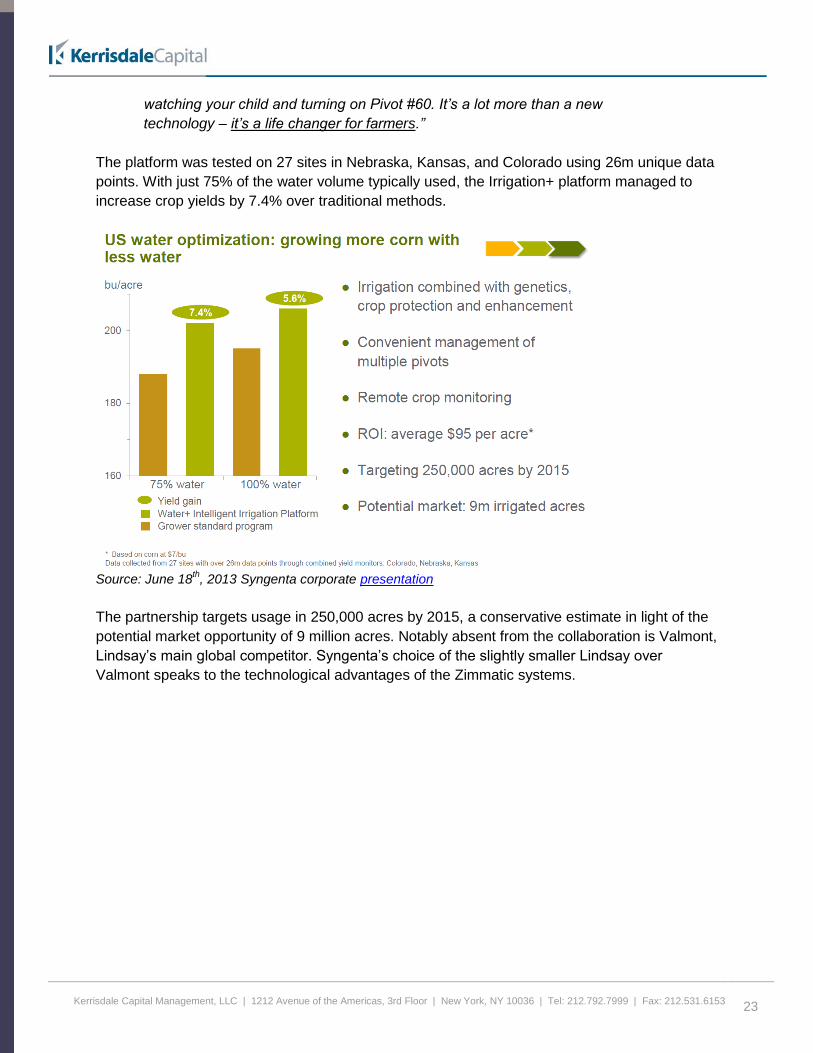
The platform was tested on 27 sites in Nebraska, Kansas, and Colorado using 26m unique data
points. With just 75% of the water volume typically used, the Irrigation+ platform managed to
increase crop yields by 7.4% over traditional methods.
Source: June 18
th, 2013 Syngenta corporate presentation
The partnership targets usage in 250,000 acres by 2015, a conservative estimate in light of the
potential market opportunity of 9 million acres. Notably absent from the collaboration is Valmont,
Lindsay’s main global competitor. Syngenta’s choice of the slightly smaller Lindsay over
Valmont speaks to the technological advantages of the Zimmatic systems.
Kerrisdale Capital Management, LLC | 1212 Avenue of the Americas, 3rd Floor | New York, NY 10036 | Tel: 212.792.7999 | Fax: 212.531.6153
24
IV. The Infrastructure Business
Throughout most of Lindsay’s history, their Infrastructure business was relegated to outsourced
manufacturing. Lindsay would divert its excess manufacturing capacity to sell steel tubing to
large industrial accounts. This sensible strategy lasted from 1987 to 2006 and was reported
under “Diversified Products” in Lindsay’s filings.
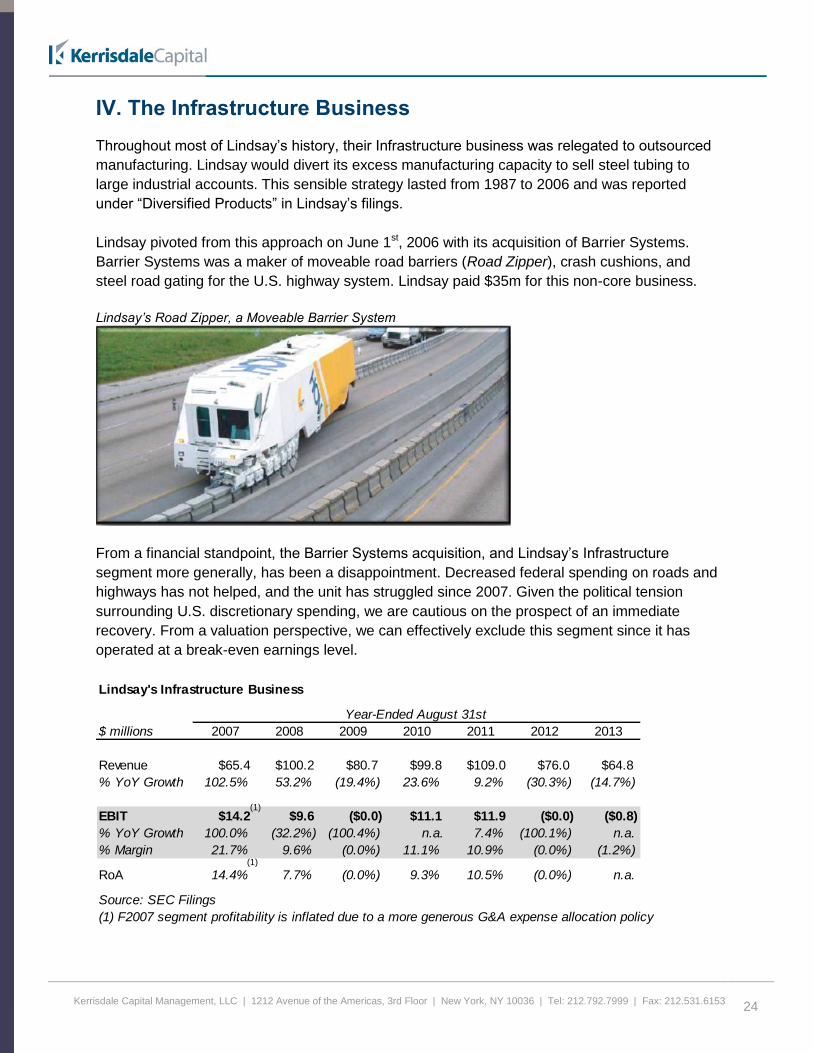
Lindsay pivoted from this approach on June 1st, 2006 with its acquisition of Barrier Systems.
Barrier Systems was a maker of moveable road barriers (Road Zipper), crash cushions, and
steel road gating for the U.S. highway system. Lindsay paid $35m for this non-core business.
Lindsay’s Road Zipper, a Moveable Barrier System
From a financial standpoint, the Barrier Systems acquisition, and Lindsay’s Infrastructure
segment more generally, has been a disappointment. Decreased federal spending on roads and
highways has not helped, and the unit has struggled since 2007. Given the political tension
surrounding U.S. discretionary spending, we are cautious on the prospect of an immediate
recovery. From a valuation perspective, we can effectively exclude this segment since it has
operated at a break-even earnings level.
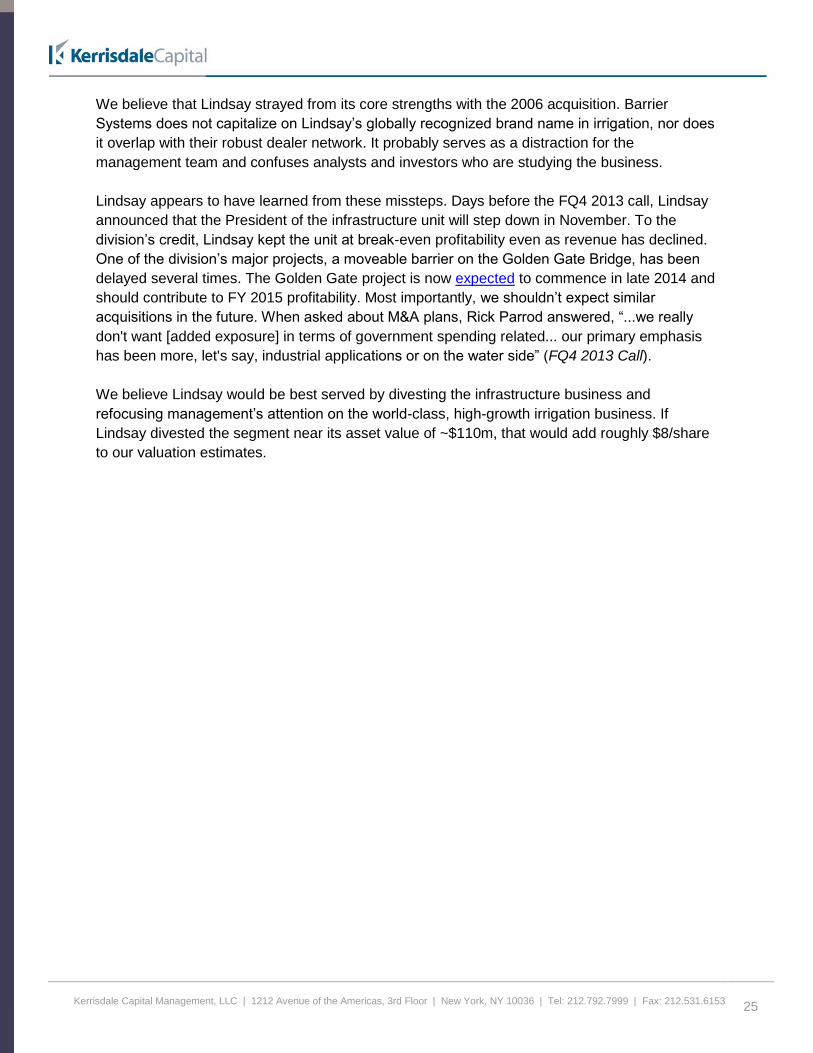
Lindsay's Infrastructure Business
Year-Ended August 31st
$ millions 2007 2008 2009 2010 2011 2012 2013
Revenue $65.4 $100.2 $80.7 $99.8 $109.0 $76.0 $64.8
% YoY Growth 102.5% 53.2% (19.4%) 23.6% 9.2% (30.3%) (14.7%)
EBIT $14.2 $9.6 ($0.0) $11.1 $11.9 ($0.0) ($0.8)
% YoY Growth 100.0% (32.2%) (100.4%) n.a. 7.4% (100.1%) n.a.
% Margin 21.7% 9.6% (0.0%) 11.1% 10.9% (0.0%) (1.2%)
RoA 14.4% 7.7% (0.0%) 9.3% 10.5% (0.0%) n.a.
Source: SEC Filings
(1) F2007 segment profitability is inflated due to a more generous G&A expense allocation policy
(1)
(1)
Kerrisdale Capital Management, LLC | 1212 Avenue of the Americas, 3rd Floor | New York, NY 10036 | Tel: 212.792.7999 | Fax: 212.531.6153
25
We believe that Lindsay strayed from its core strengths with the 2006 acquisition. Barrier
Systems does not capitalize on Lindsay’s globally recognized brand name in irrigation, nor does
it overlap with their robust dealer network. It probably serves as a distraction for the
management team and confuses analysts and investors who are studying the business.
Lindsay appears to have learned from these missteps. Days before the FQ4 2013 call, Lindsay
announced that the President of the infrastructure unit will step down in November. To the
division’s credit, Lindsay kept the unit at break-even profitability even as revenue has declined.
One of the division’s major projects, a moveable barrier on the Golden Gate Bridge, has been
delayed several times. The Golden Gate project is now expected to commence in late 2014 and
should contribute to FY 2015 profitability. Most importantly, we shouldn’t expect similar
acquisitions in the future. When asked about M&A plans, Rick Parrod answered, “...we really
don't want [added exposure] in terms of government spending related... our primary emphasis
has been more, let's say, industrial applications or on the water side” (FQ4 2013 Call).
We believe Lindsay would be best served by divesting the infrastructure business and
refocusing management’s attention on the world-class, high-growth irrigation business. If
Lindsay divested the segment near its asset value of ~$110m, that would add roughly $8/share
to our valuation estimates.
Kerrisdale Capital Management, LLC | 1212 Avenue of the Americas, 3rd Floor | New York, NY 10036 | Tel: 212.792.7999 | Fax: 212.531.6153
26
V. Addressing the Bear Argument
Lower Corn Prices will Lead to a Short-term Decline in Lindsay’s Profits
Like many companies in the agricultural sector, Lindsay's business can be cyclical. Farmers
typically upgrade and expand their equipment when crop prices are high and farmer sentiment
is strong. High prices cause farmers to plant more crop, leading to larger harvests the next
season and more supply. A larger supply leads to lower prices, which induces farmers to rotate
into other crops, and the cycle repeats.
In the United States, irrigation systems predominantly support corn fields. Corn requires more
water than soybeans and other staple crops, making corn sensitive to dry spells. According to
the National Agricultural Statistics Service, the largest corn producing states are Kansas (14%
of 2013 plantings), Illinois (12%), Nebraska (11%), Minnesota (9%), Iowa (6%), and South
Dakota (6%).
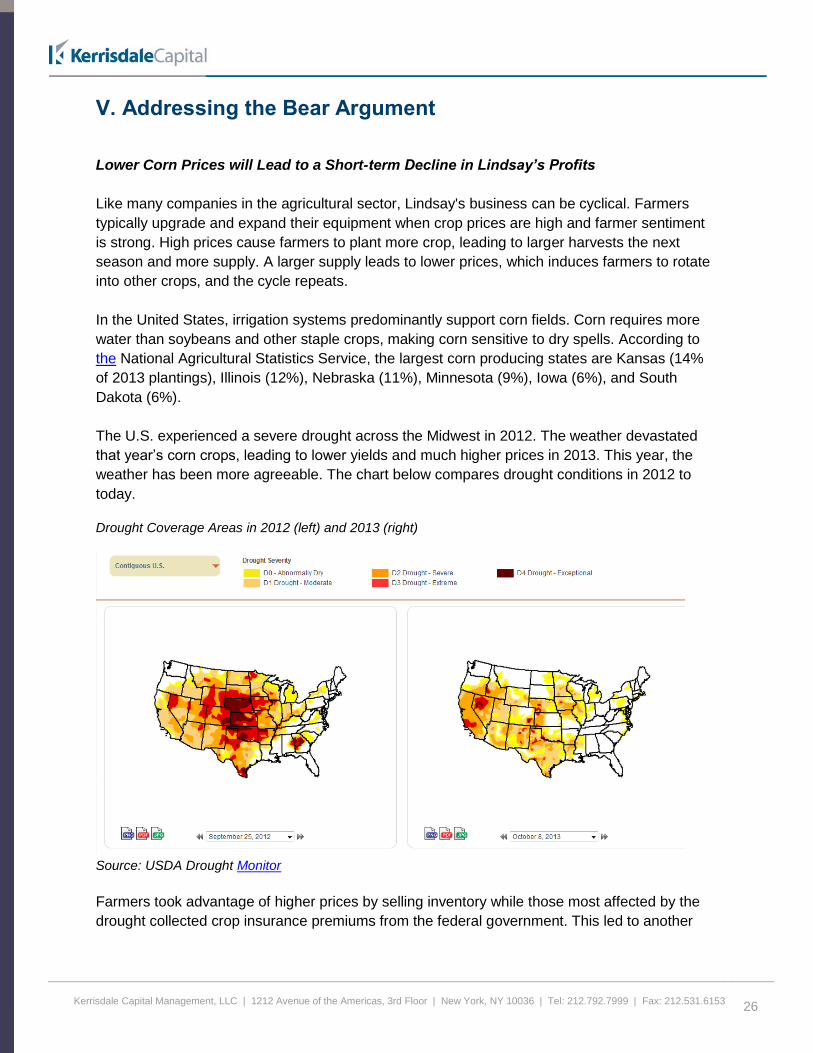
The U.S. experienced a severe drought across the Midwest in 2012. The weather devastated
that year’s corn crops, leading to lower yields and much higher prices in 2013. This year, the
weather has been more agreeable. The chart below compares drought conditions in 2012 to
today.
Drought Coverage Areas in 2012 (left) and 2013 (right)
Source: USDA Drought Monitor
Farmers took advantage of higher prices by selling inventory while those most affected by the
drought collected crop insurance premiums from the federal government. This led to another
Kerrisdale Capital Management, LLC | 1212 Avenue of the Americas, 3rd Floor | New York, NY 10036 | Tel: 212.792.7999 | Fax: 212.531.6153
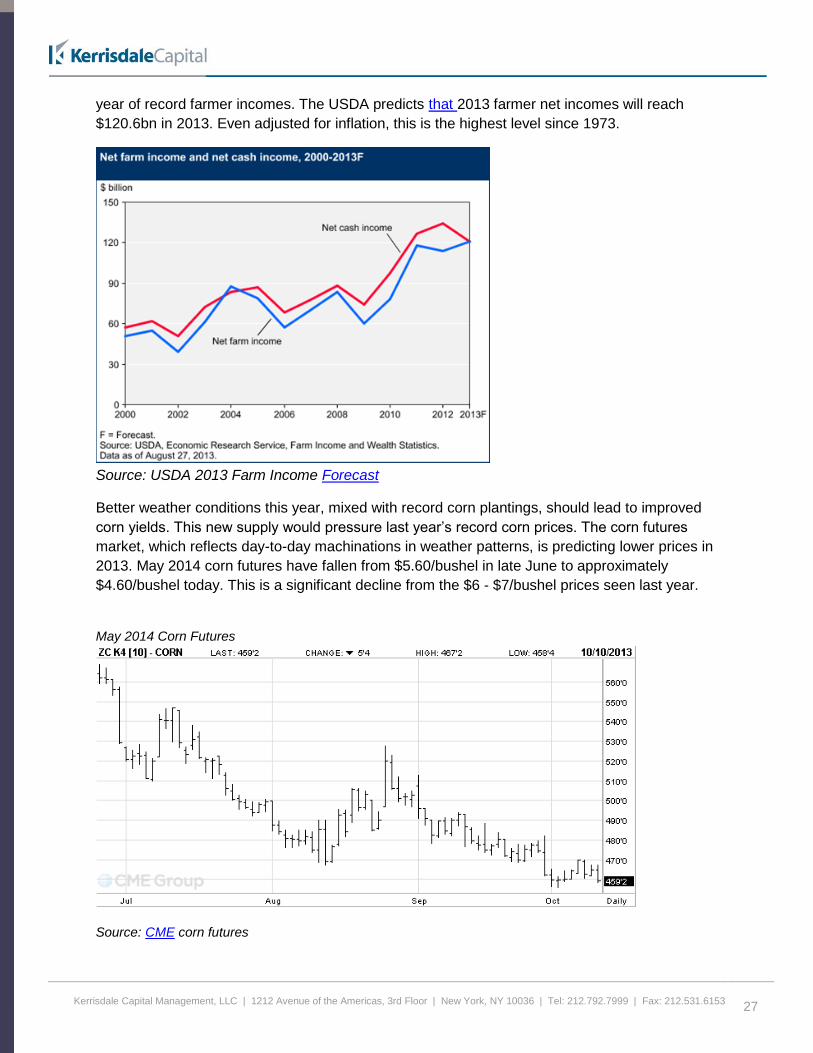
27
year of record farmer incomes. The USDA predicts that 2013 farmer net incomes will reach
$120.6bn in 2013. Even adjusted for inflation, this is the highest level since 1973.
Source: USDA 2013 Farm Income Forecast
Better weather conditions this year, mixed with record corn plantings, should lead to improved
corn yields. This new supply would pressure last year’s record corn prices. The corn futures
market, which reflects day-to-day machinations in weather patterns, is predicting lower prices in
2013. May 2014 corn futures have fallen from $5.60/bushel in late June to approximately
$4.60/bushel today. This is a significant decline from the $6 - $7/bushel prices seen last year.
May 2014 Corn Futures
Source: CME corn futures
Kerrisdale Capital Management, LLC | 1212 Avenue of the Americas, 3rd Floor | New York, NY 10036 | Tel: 212.792.7999 | Fax: 212.531.6153
28
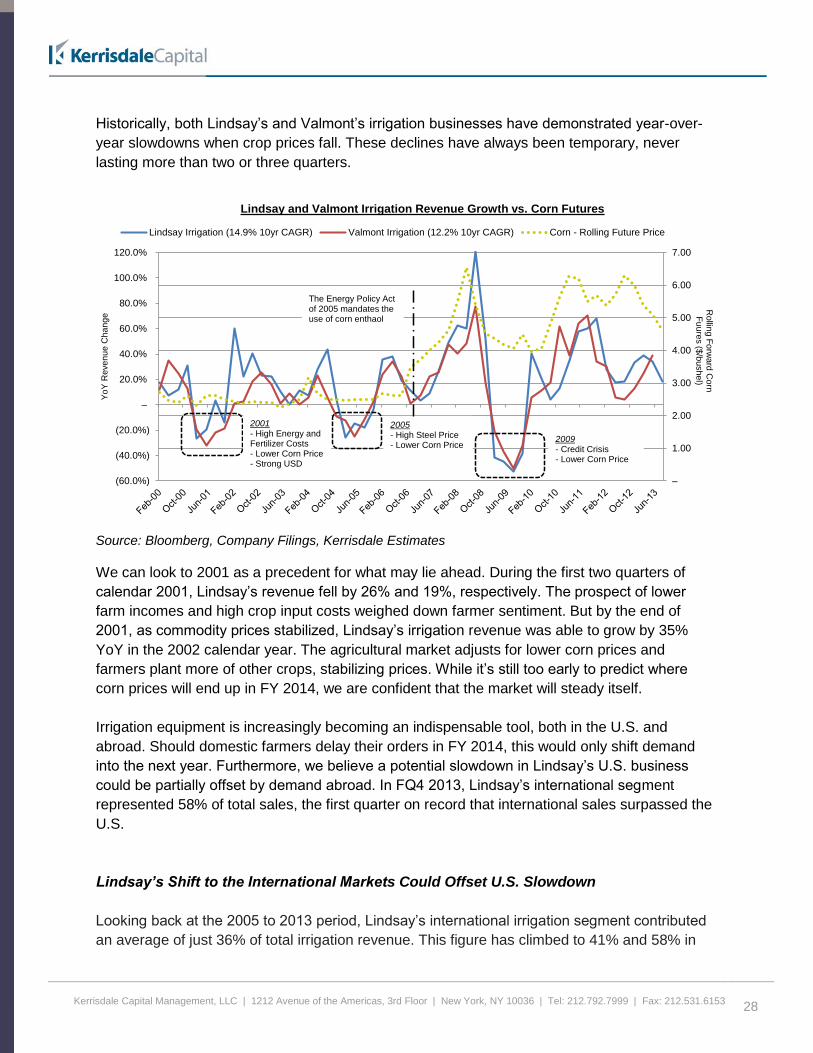
Historically, both Lindsay’s and Valmont’s irrigation businesses have demonstrated year-over-
year slowdowns when crop prices fall. These declines have always been temporary, never
lasting more than two or three quarters.
Source: Bloomberg, Company Filings, Kerrisdale Estimates
We can look to 2001 as a precedent for what may lie ahead. During the first two quarters of
calendar 2001, Lindsay’s revenue fell by 26% and 19%, respectively. The prospect of lower
farm incomes and high crop input costs weighed down farmer sentiment. But by the end of
2001, as commodity prices stabilized, Lindsay’s irrigation revenue was able to grow by 35%
YoY in the 2002 calendar year. The agricultural market adjusts for lower corn prices and
farmers plant more of other crops, stabilizing prices. While it’s still too early to predict where
corn prices will end up in FY 2014, we are confident that the market will steady itself.
Irrigation equipment is increasingly becoming an indispensable tool, both in the U.S. and
abroad. Should domestic farmers delay their orders in FY 2014, this would only shift demand
into the next year. Furthermore, we believe a potential slowdown in Lindsay’s U.S. business
could be partially offset by demand abroad. In FQ4 2013, Lindsay’s international segment
represented 58% of total sales, the first quarter on record that international sales surpassed the
U.S.
Lindsay’s Shift to the International Markets Could Offset U.S. Slowdown
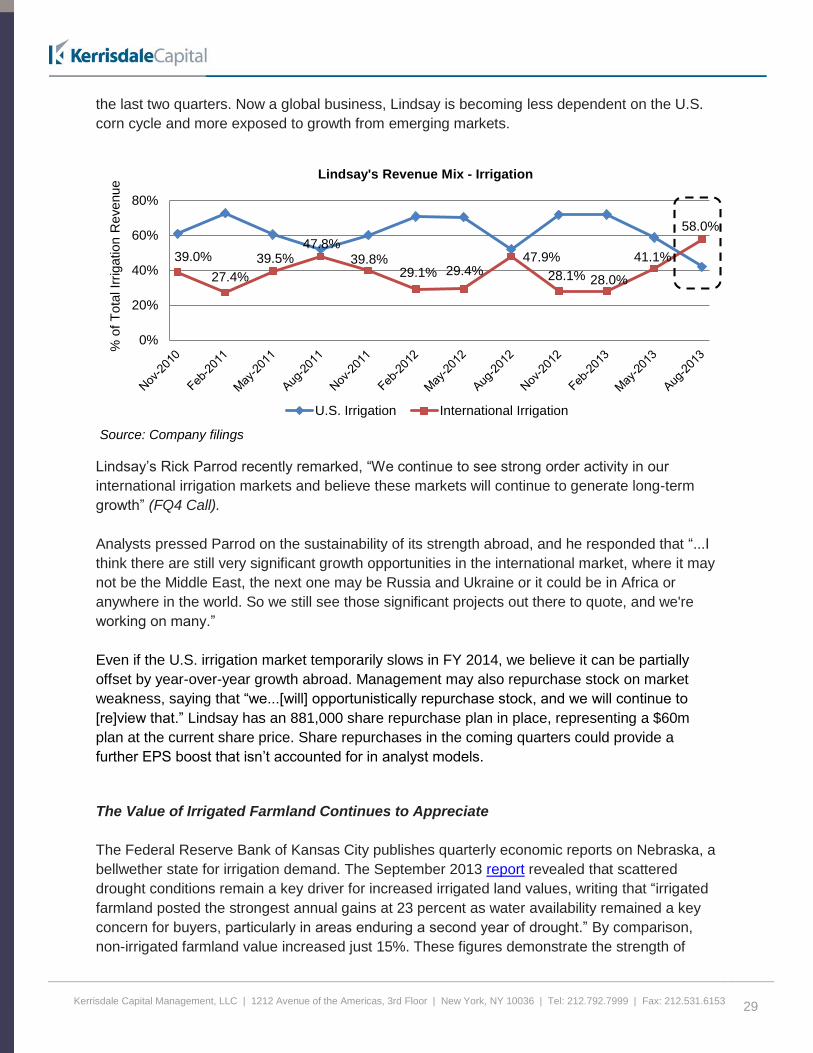
Looking back at the 2005 to 2013 period, Lindsay’s international irrigation segment contributed
an average of just 36% of total irrigation revenue. This figure has climbed to 41% and 58% in
–
1.00
2.00
3.00
4.00
5.00
6.00
7.00
(60.0%)
(40.0%)
(20.0%)
–
20.0%
40.0%
60.0%
80.0%
100.0%
120.0%
Lindsay Irrigation (14.9% 10yr CAGR) Valmont Irrigation (12.2% 10yr CAGR) Corn - Rolling Future Price
2009- Credit Crisis- Lower Corn Price
2005- High Steel Price- Lower Corn Price
2001- High Energy and Fertilizer Costs- Lower Corn Price- Strong USD
The Energy Policy Act of 2005 mandates the use of corn enthaol
Lindsay and Valmont Irrigation Revenue Growth vs. Corn Futures
Yo
Y R
eve
nu
e C
ha
ng
eR
ollin
g F
orw
ard
Corn
F
uu
res ($
/bu
sh
el)
Kerrisdale Capital Management, LLC | 1212 Avenue of the Americas, 3rd Floor | New York, NY 10036 | Tel: 212.792.7999 | Fax: 212.531.6153
29
the last two quarters. Now a global business, Lindsay is becoming less dependent on the U.S.
corn cycle and more exposed to growth from emerging markets.
Source: Company filings
Lindsay’s Rick Parrod recently remarked, “We continue to see strong order activity in our
international irrigation markets and believe these markets will continue to generate long-term
growth” (FQ4 Call).
Analysts pressed Parrod on the sustainability of its strength abroad, and he responded that “...I
think there are still very significant growth opportunities in the international market, where it may
not be the Middle East, the next one may be Russia and Ukraine or it could be in Africa or
anywhere in the world. So we still see those significant projects out there to quote, and we're
working on many.”
Even if the U.S. irrigation market temporarily slows in FY 2014, we believe it can be partially
offset by year-over-year growth abroad. Management may also repurchase stock on market
weakness, saying that “we...[will] opportunistically repurchase stock, and we will continue to
[re]view that.” Lindsay has an 881,000 share repurchase plan in place, representing a $60m
plan at the current share price. Share repurchases in the coming quarters could provide a
further EPS boost that isn’t accounted for in analyst models.
The Value of Irrigated Farmland Continues to Appreciate
The Federal Reserve Bank of Kansas City publishes quarterly economic reports on Nebraska, a
bellwether state for irrigation demand. The September 2013 report revealed that scattered
drought conditions remain a key driver for increased irrigated land values, writing that “irrigated
farmland posted the strongest annual gains at 23 percent as water availability remained a key
concern for buyers, particularly in areas enduring a second year of drought.” By comparison,
non-irrigated farmland value increased just 15%. These figures demonstrate the strength of
39.0%
27.4%
39.5% 47.8%
39.8% 29.1% 29.4%
47.9%
28.1% 28.0%
41.1%
58.0%
0%
20%
40%
60%
80%
% o
f T
ota
l Ir
rig
atio
n R
eve
nu
e
Lindsay's Revenue Mix - Irrigation
U.S. Irrigation International Irrigation
Kerrisdale Capital Management, LLC | 1212 Avenue of the Americas, 3rd Floor | New York, NY 10036 | Tel: 212.792.7999 | Fax: 212.531.6153
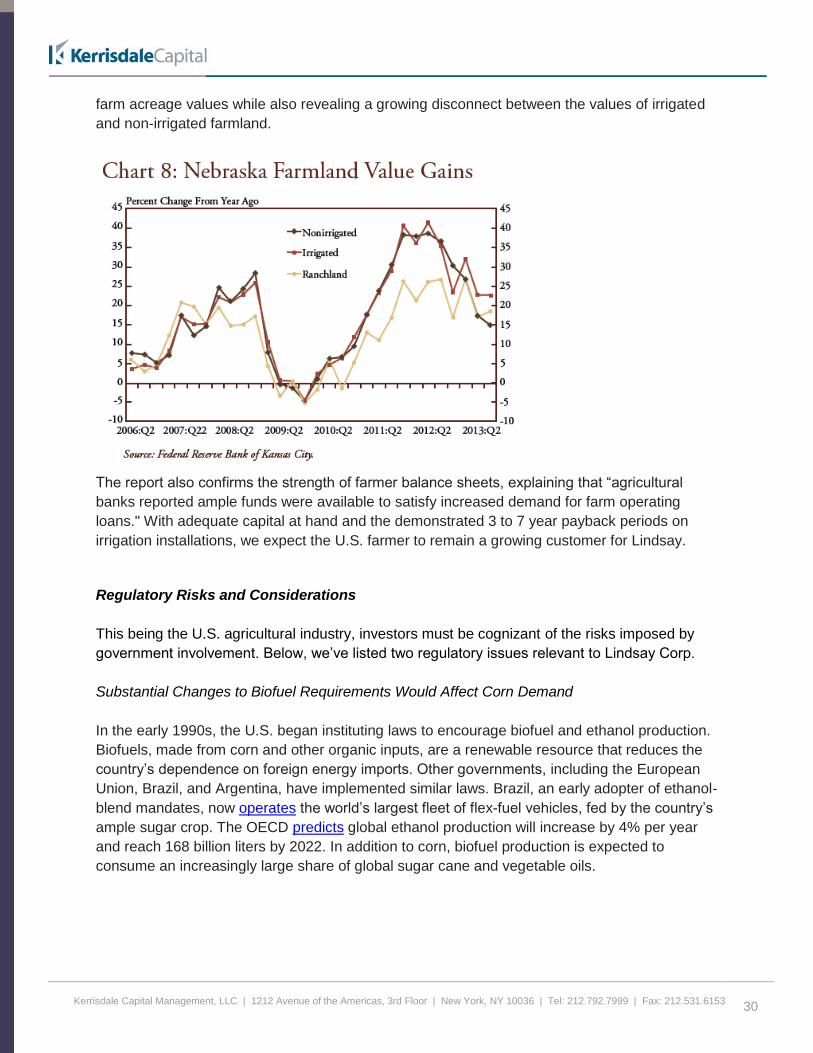
30
farm acreage values while also revealing a growing disconnect between the values of irrigated
and non-irrigated farmland.
The report also confirms the strength of farmer balance sheets, explaining that “agricultural
banks reported ample funds were available to satisfy increased demand for farm operating
loans." With adequate capital at hand and the demonstrated 3 to 7 year payback periods on
irrigation installations, we expect the U.S. farmer to remain a growing customer for Lindsay.
Regulatory Risks and Considerations
This being the U.S. agricultural industry, investors must be cognizant of the risks imposed by
government involvement. Below, we’ve listed two regulatory issues relevant to Lindsay Corp.
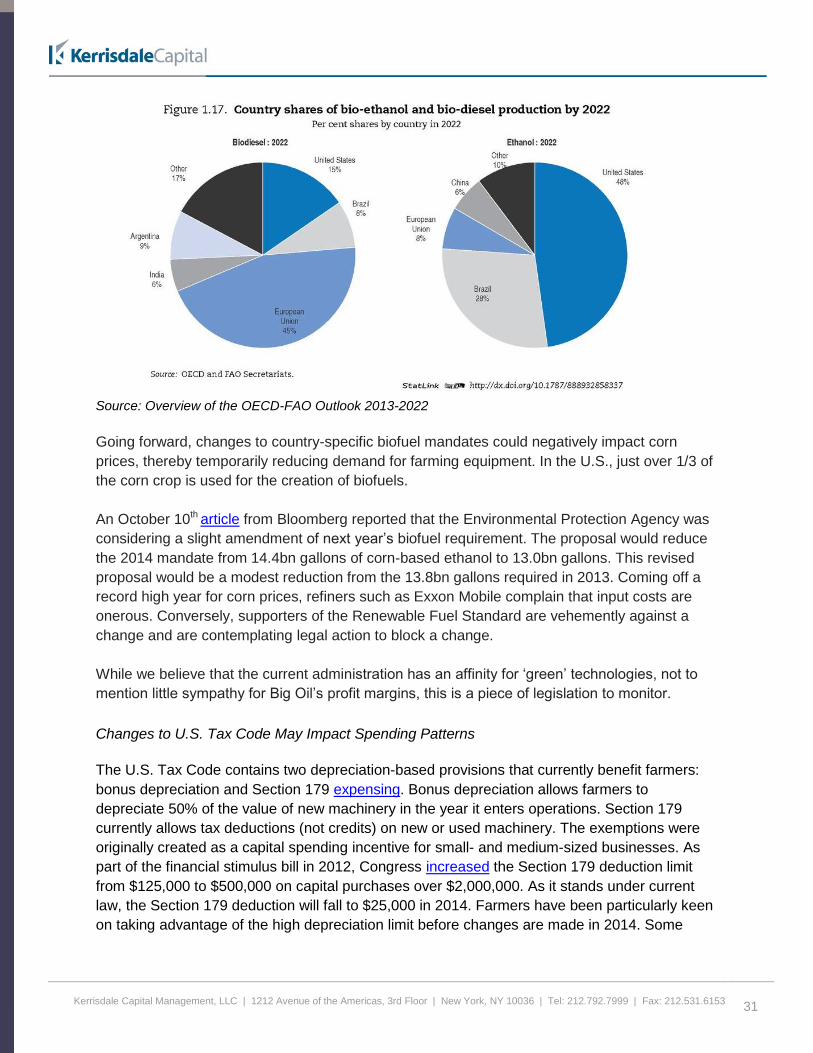
Substantial Changes to Biofuel Requirements Would Affect Corn Demand
In the early 1990s, the U.S. began instituting laws to encourage biofuel and ethanol production.
Biofuels, made from corn and other organic inputs, are a renewable resource that reduces the
country’s dependence on foreign energy imports. Other governments, including the European
Union, Brazil, and Argentina, have implemented similar laws. Brazil, an early adopter of ethanol-
blend mandates, now operates the world’s largest fleet of flex-fuel vehicles, fed by the country’s
ample sugar crop. The OECD predicts global ethanol production will increase by 4% per year
and reach 168 billion liters by 2022. In addition to corn, biofuel production is expected to
consume an increasingly large share of global sugar cane and vegetable oils.
Kerrisdale Capital Management, LLC | 1212 Avenue of the Americas, 3rd Floor | New York, NY 10036 | Tel: 212.792.7999 | Fax: 212.531.6153
31
Source: Overview of the OECD-FAO Outlook 2013-2022
Going forward, changes to country-specific biofuel mandates could negatively impact corn
prices, thereby temporarily reducing demand for farming equipment. In the U.S., just over 1/3 of
the corn crop is used for the creation of biofuels.
An October 10th article from Bloomberg reported that the Environmental Protection Agency was
considering a slight amendment of next year’s biofuel requirement. The proposal would reduce
the 2014 mandate from 14.4bn gallons of corn-based ethanol to 13.0bn gallons. This revised
proposal would be a modest reduction from the 13.8bn gallons required in 2013. Coming off a
record high year for corn prices, refiners such as Exxon Mobile complain that input costs are
onerous. Conversely, supporters of the Renewable Fuel Standard are vehemently against a
change and are contemplating legal action to block a change.
While we believe that the current administration has an affinity for ‘green’ technologies, not to
mention little sympathy for Big Oil’s profit margins, this is a piece of legislation to monitor.
Changes to U.S. Tax Code May Impact Spending Patterns
The U.S. Tax Code contains two depreciation-based provisions that currently benefit farmers:
bonus depreciation and Section 179 expensing. Bonus depreciation allows farmers to
depreciate 50% of the value of new machinery in the year it enters operations. Section 179
currently allows tax deductions (not credits) on new or used machinery. The exemptions were
originally created as a capital spending incentive for small- and medium-sized businesses. As
part of the financial stimulus bill in 2012, Congress increased the Section 179 deduction limit
from $125,000 to $500,000 on capital purchases over $2,000,000. As it stands under current
law, the Section 179 deduction will fall to $25,000 in 2014. Farmers have been particularly keen
on taking advantage of the high depreciation limit before changes are made in 2014. Some
Kerrisdale Capital Management, LLC | 1212 Avenue of the Americas, 3rd Floor | New York, NY 10036 | Tel: 212.792.7999 | Fax: 212.531.6153
32
believe that this has front-loaded capital spending into 2013, especially for more discretionary
equipment like high-end tractors.
Importantly, these incentives only affect the timing, and not the magnitude, of overall tax paid. A
recent Morgan Stanley report lays out an example:
“Suppose a farmer bought a new tractor for $300k in year 1 and depreciated the
full $300k value of the tractor in its year of purchase. Then, in year 2, suppose
that the farmer decided to pay $50k to trade in the old tractor for a new model
with a market value of $300k. When tax time comes in year 2, the farmer would
only be able to depreciate the $50k paid as a “boot” with the trade-in, and not the
full $300k purchase price of the new tractor, as the depreciation basis of the new
tractor would only be the $50k. Therefore, special depreciation allowances do not
substantively change how much the farmer can depreciate in year 2, nor do they
allow the farmer to realize a net gain by trading in used equipment.”
Many have misunderstood this point, instead believing that Section 179 offers a tax credit that
would not otherwise be available.
While some farmers may take advantage of the tax deferral opportunities in 2013, we don’t
believe a change in the code will have a substantial impact on longer-term buying behavior.
Additionally, many expect renewed calls for Congress to extend the break beyond 2013.
Kerrisdale Capital Management, LLC | 1212 Avenue of the Americas, 3rd Floor | New York, NY 10036 | Tel: 212.792.7999 | Fax: 212.531.6153
33
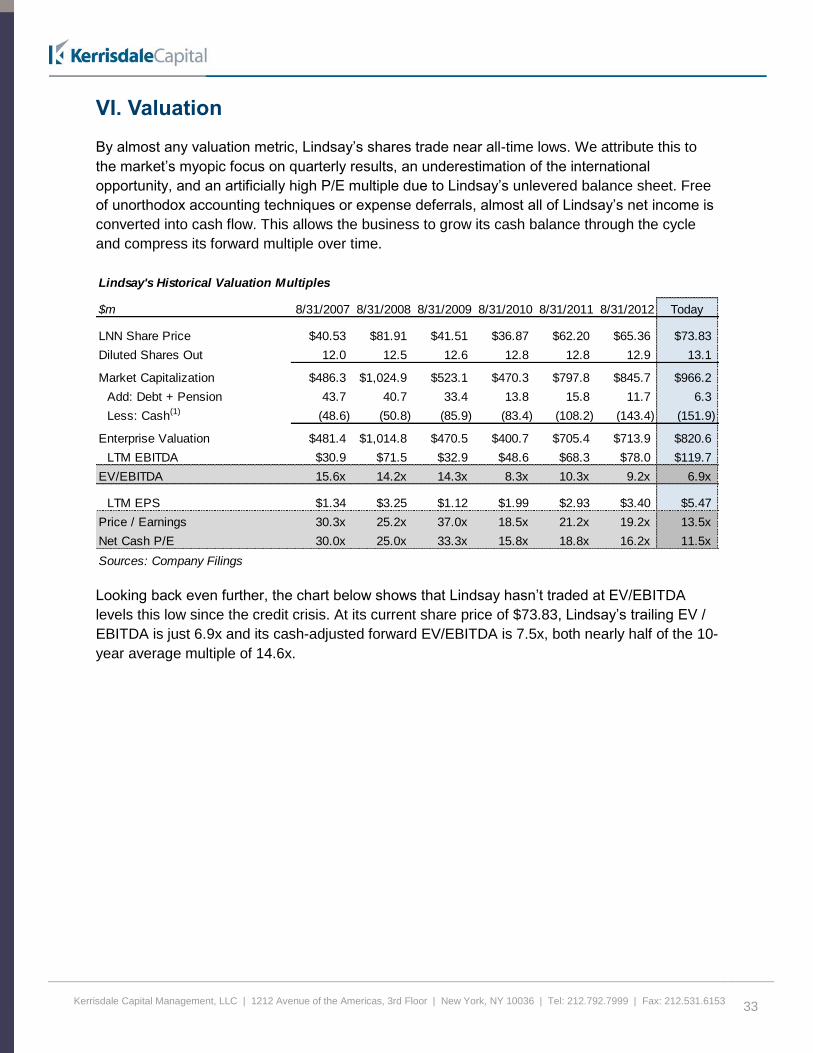
VI. Valuation By almost any valuation metric, Lindsay’s shares trade near all-time lows. We attribute this to
the market’s myopic focus on quarterly results, an underestimation of the international
opportunity, and an artificially high P/E multiple due to Lindsay’s unlevered balance sheet. Free
of unorthodox accounting techniques or expense deferrals, almost all of Lindsay’s net income is
converted into cash flow. This allows the business to grow its cash balance through the cycle
and compress its forward multiple over time.
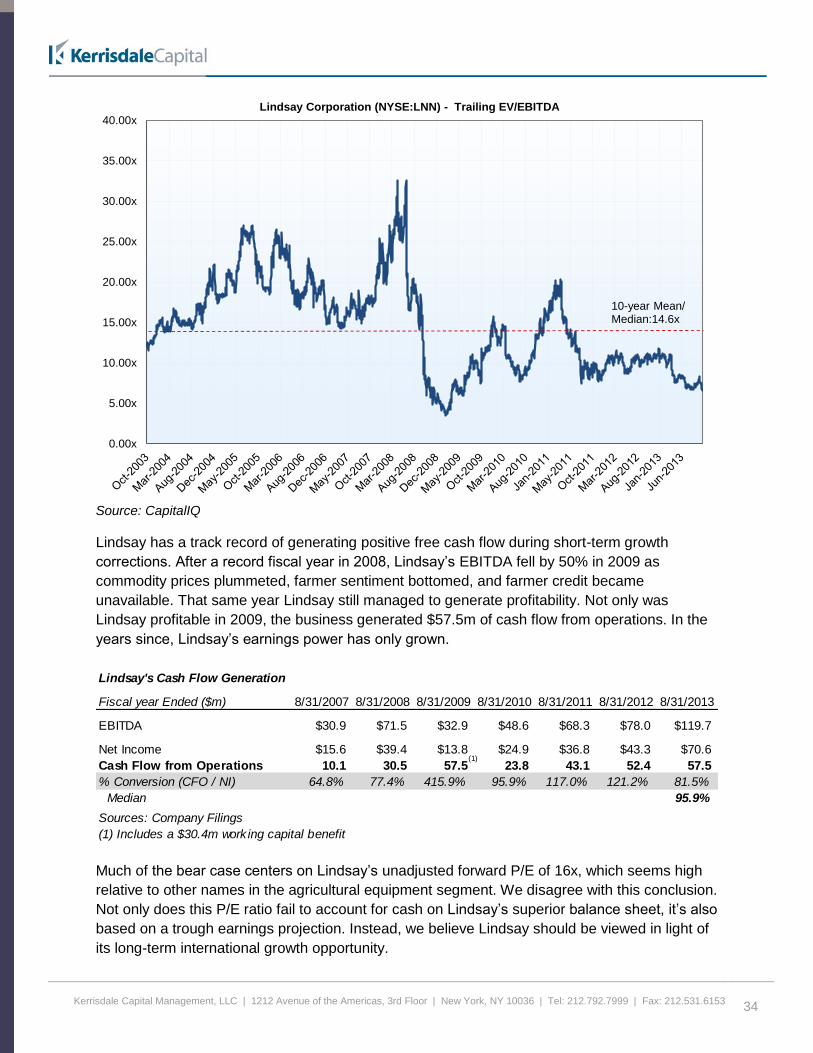
Looking back even further, the chart below shows that Lindsay hasn’t traded at EV/EBITDA
levels this low since the credit crisis. At its current share price of $73.83, Lindsay’s trailing EV /
EBITDA is just 6.9x and its cash-adjusted forward EV/EBITDA is 7.5x, both nearly half of the 10-
year average multiple of 14.6x.
Lindsay's Historical Valuation Multiples
$m 8/31/2007 8/31/2008 8/31/2009 8/31/2010 8/31/2011 8/31/2012 Today
LNN Share Price $40.53 $81.91 $41.51 $36.87 $62.20 $65.36 $73.83
Diluted Shares Out 12.0 12.5 12.6 12.8 12.8 12.9 13.1
Market Capitalization $486.3 $1,024.9 $523.1 $470.3 $797.8 $845.7 $966.2
Add: Debt + Pension 43.7 40.7 33.4 13.8 15.8 11.7 6.3
Less: Cash(1) (48.6) (50.8) (85.9) (83.4) (108.2) (143.4) (151.9)
Enterprise Valuation $481.4 $1,014.8 $470.5 $400.7 $705.4 $713.9 $820.6
LTM EBITDA $30.9 $71.5 $32.9 $48.6 $68.3 $78.0 $119.7
EV/EBITDA 15.6x 14.2x 14.3x 8.3x 10.3x 9.2x 6.9x
LTM EPS $1.34 $3.25 $1.12 $1.99 $2.93 $3.40 $5.47
Price / Earnings 30.3x 25.2x 37.0x 18.5x 21.2x 19.2x 13.5x
Net Cash P/E 30.0x 25.0x 33.3x 15.8x 18.8x 16.2x 11.5x
Sources: Company Filings
Kerrisdale Capital Management, LLC | 1212 Avenue of the Americas, 3rd Floor | New York, NY 10036 | Tel: 212.792.7999 | Fax: 212.531.6153
34
Source: CapitalIQ
Lindsay has a track record of generating positive free cash flow during short-term growth
corrections. After a record fiscal year in 2008, Lindsay’s EBITDA fell by 50% in 2009 as
commodity prices plummeted, farmer sentiment bottomed, and farmer credit became
unavailable. That same year Lindsay still managed to generate profitability. Not only was
Lindsay profitable in 2009, the business generated $57.5m of cash flow from operations. In the
years since, Lindsay’s earnings power has only grown.
Much of the bear case centers on Lindsay’s unadjusted forward P/E of 16x, which seems high
relative to other names in the agricultural equipment segment. We disagree with this conclusion.
Not only does this P/E ratio fail to account for cash on Lindsay’s superior balance sheet, it’s also
based on a trough earnings projection. Instead, we believe Lindsay should be viewed in light of
its long-term international growth opportunity.
0.00x
5.00x
10.00x
15.00x
20.00x
25.00x
30.00x
35.00x
40.00x
Lindsay Corporation (NYSE:LNN) - Trailing EV/EBITDA
10-year Mean/ Median:14.6x
Lindsay's Cash Flow Generation
Fiscal year Ended ($m) 8/31/2007 8/31/2008 8/31/2009 8/31/2010 8/31/2011 8/31/2012 8/31/2013
EBITDA $30.9 $71.5 $32.9 $48.6 $68.3 $78.0 $119.7
Net Income $15.6 $39.4 $13.8 $24.9 $36.8 $43.3 $70.6
Cash Flow from Operations 10.1 30.5 57.5 23.8 43.1 52.4 57.5
% Conversion (CFO / NI) 64.8% 77.4% 415.9% 95.9% 117.0% 121.2% 81.5%
Median 95.9%
Sources: Company Filings
(1) Includes a $30.4m work ing capital benefit
(1)
Kerrisdale Capital Management, LLC | 1212 Avenue of the Americas, 3rd Floor | New York, NY 10036 | Tel: 212.792.7999 | Fax: 212.531.6153
35
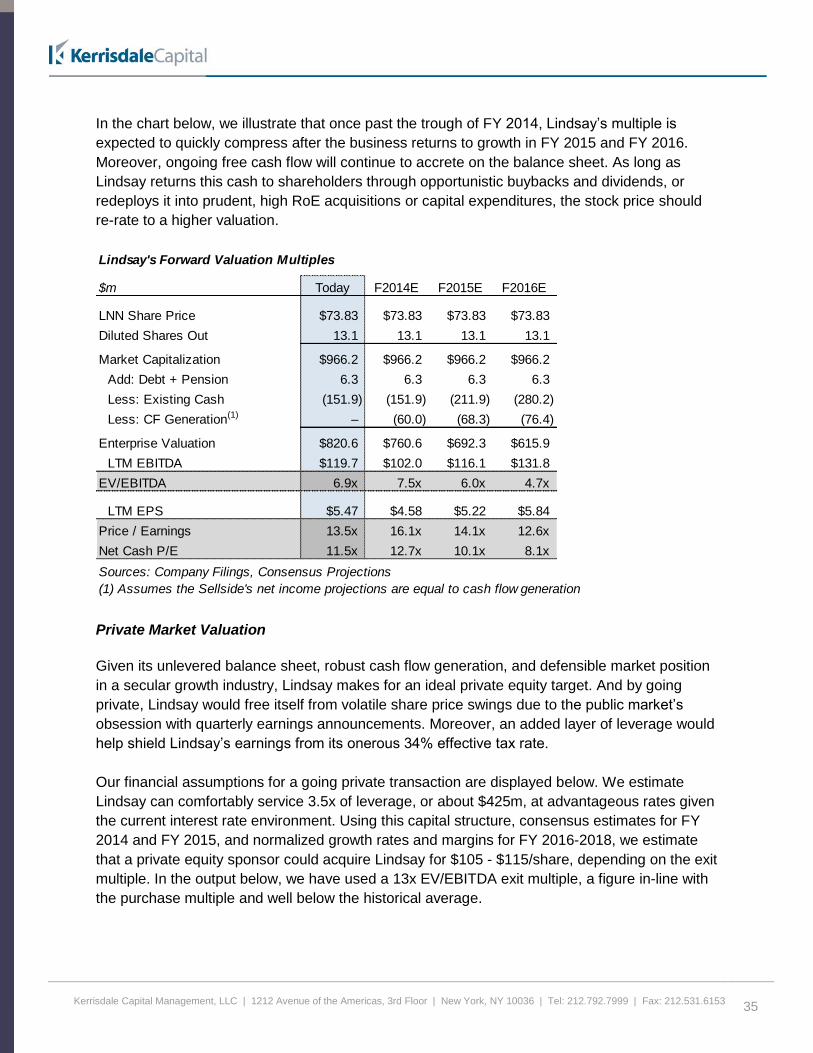
In the chart below, we illustrate that once past the trough of FY 2014, Lindsay’s multiple is
expected to quickly compress after the business returns to growth in FY 2015 and FY 2016.
Moreover, ongoing free cash flow will continue to accrete on the balance sheet. As long as
Lindsay returns this cash to shareholders through opportunistic buybacks and dividends, or
redeploys it into prudent, high RoE acquisitions or capital expenditures, the stock price should
re-rate to a higher valuation.
Private Market Valuation
Given its unlevered balance sheet, robust cash flow generation, and defensible market position
in a secular growth industry, Lindsay makes for an ideal private equity target. And by going
private, Lindsay would free itself from volatile share price swings due to the public market’s
obsession with quarterly earnings announcements. Moreover, an added layer of leverage would
help shield Lindsay’s earnings from its onerous 34% effective tax rate.
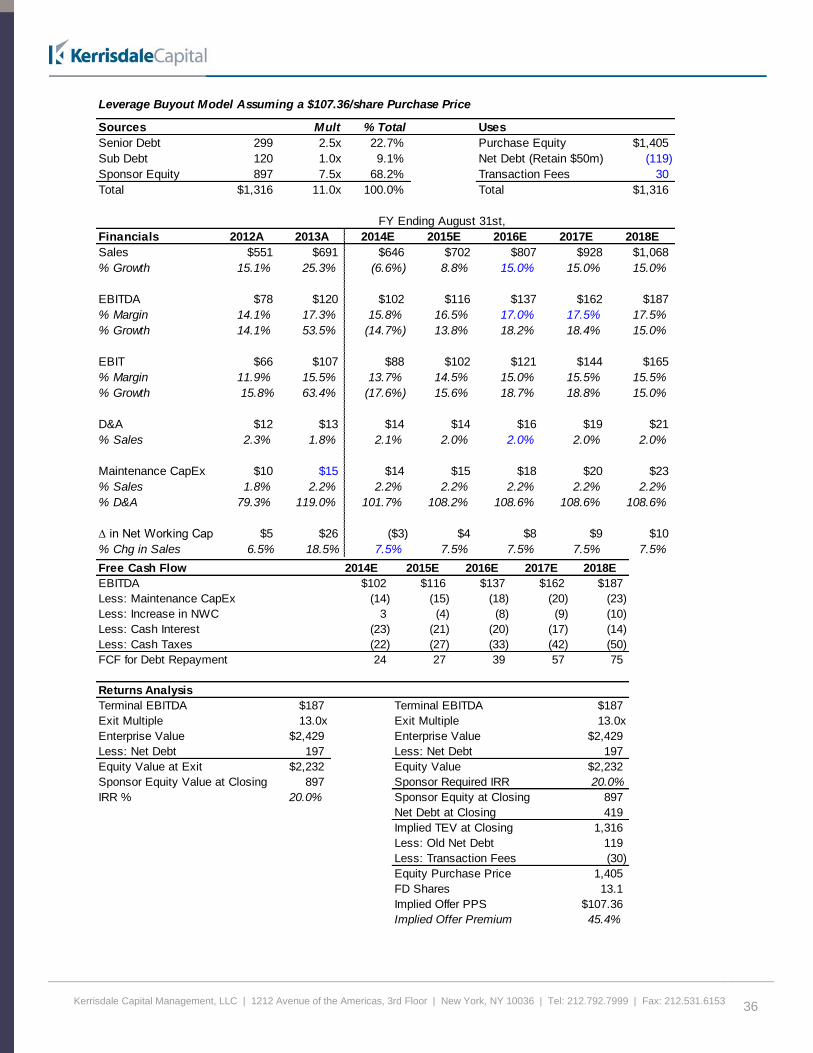
Our financial assumptions for a going private transaction are displayed below. We estimate
Lindsay can comfortably service 3.5x of leverage, or about $425m, at advantageous rates given
the current interest rate environment. Using this capital structure, consensus estimates for FY
2014 and FY 2015, and normalized growth rates and margins for FY 2016-2018, we estimate
that a private equity sponsor could acquire Lindsay for $105 - $115/share, depending on the exit
multiple. In the output below, we have used a 13x EV/EBITDA exit multiple, a figure in-line with
the purchase multiple and well below the historical average.
Lindsay's Forward Valuation Multiples
$m Today F2014E F2015E F2016E
LNN Share Price $73.83 $73.83 $73.83 $73.83
Diluted Shares Out 13.1 13.1 13.1 13.1– – –
Market Capitalization $966.2 $966.2 $966.2 $966.2
Add: Debt + Pension 6.3 6.3 6.3 6.3
Less: Existing Cash (151.9) (151.9) (211.9) (280.2)
Less: CF Generation(1) – (60.0) (68.3) (76.4)– – –
Enterprise Valuation $820.6 $760.6 $692.3 $615.9
LTM EBITDA $119.7 $102.0 $116.1 $131.8
EV/EBITDA 6.9x 7.5x 6.0x 4.7x
LTM EPS $5.47 $4.58 $5.22 $5.84
Price / Earnings 13.5x 16.1x 14.1x 12.6x
Net Cash P/E 11.5x 12.7x 10.1x 8.1x
Sources: Company Filings, Consensus Projections
(1) Assumes the Sellside's net income projections are equal to cash flow generation
Kerrisdale Capital Management, LLC | 1212 Avenue of the Americas, 3rd Floor | New York, NY 10036 | Tel: 212.792.7999 | Fax: 212.531.6153
36
Leverage Buyout Model Assuming a $107.36/share Purchase Price
Sources Mult % Total Uses
Senior Debt 299 2.5x 22.7% Purchase Equity $1,405
Sub Debt 120 1.0x 9.1% Net Debt (Retain $50m) (119)
Sponsor Equity 897 7.5x 68.2% Transaction Fees 30
Total $1,316 11.0x 100.0% Total $1,316
FY Ending August 31st,
Financials 2012A 2013A 2014E 2015E 2016E 2017E 2018E
Sales $551 $691 $646 $702 $807 $928 $1,068
% Growth 15.1% 25.3% (6.6%) 8.8% 15.0% 15.0% 15.0%
EBITDA $78 $120 $102 $116 $137 $162 $187
% Margin 14.1% 17.3% 15.8% 16.5% 17.0% 17.5% 17.5%
% Growth 14.1% 53.5% (14.7%) 13.8% 18.2% 18.4% 15.0%
EBIT $66 $107 $88 $102 $121 $144 $165
% Margin 11.9% 15.5% 13.7% 14.5% 15.0% 15.5% 15.5%
% Growth 15.8% 63.4% (17.6%) 15.6% 18.7% 18.8% 15.0%
D&A $12 $13 $14 $14 $16 $19 $21
% Sales 2.3% 1.8% 2.1% 2.0% 2.0% 2.0% 2.0%
Maintenance CapEx $10 $15 $14 $15 $18 $20 $23
% Sales 1.8% 2.2% 2.2% 2.2% 2.2% 2.2% 2.2%
% D&A 79.3% 119.0% 101.7% 108.2% 108.6% 108.6% 108.6%
∆ in Net Working Capital $5 $26 ($3) $4 $8 $9 $10
% Chg in Sales 6.5% 18.5% 7.5% 7.5% 7.5% 7.5% 7.5%
Free Cash Flow 2014E 2015E 2016E 2017E 2018E
EBITDA $102 $116 $137 $162 $187
Less: Maintenance CapEx (14) (15) (18) (20) (23)
Less: Increase in NWC 3 (4) (8) (9) (10)
Less: Cash Interest (23) (21) (20) (17) (14)
Less: Cash Taxes (22) (27) (33) (42) (50)
FCF for Debt Repayment 24 27 39 57 75
Returns Analysis
Terminal EBITDA $187 Terminal EBITDA $187
Exit Multiple 13.0x Exit Multiple 13.0x
Enterprise Value $2,429 Enterprise Value $2,429
Less: Net Debt 197 Less: Net Debt 197
Equity Value at Exit $2,232 Equity Value $2,232
Sponsor Equity Value at Closing 897 Sponsor Required IRR 20.0%
IRR % 20.0% Sponsor Equity at Closing 897
Net Debt at Closing 419
Implied TEV at Closing 1,316
Less: Old Net Debt 119
Less: Transaction Fees (30)
Equity Purchase Price 1,405
FD Shares 13.1
Implied Offer PPS $107.36
Implied Offer Premium 45.4%
Kerrisdale Capital Management, LLC | 1212 Avenue of the Americas, 3rd Floor | New York, NY 10036 | Tel: 212.792.7999 | Fax: 212.531.6153
37
Sources: Kerrisdale Analysis, Company filings
Note: Model Assumes 2.5x of Senior Debt with a 5% annual coupon rate and 1x of Subordinated with a 7% rate
VII. Conclusion Lindsay Corporation is a world-class, proven business with direct exposure to high-growth
international markets. The benefits of mechanized irrigation, along with the strength of Lindsay’s
market position, have been demonstrated over several decades. Secular trends such as global
population growth, rising protein consumption, and conversion from gravity to mechanized
irrigation in the emerging markets should power Lindsay’s growth for many years.
The public market’s obsession on quarterly results and year-over-year growth comparisons
currently affords investors the chance to invest in Lindsay at a bargain share price. At just a
13.7x net cash P/E, we believe that Lindsay’s shares are significantly undervalued. Current
projections indicate that an opportunistic private equity buyer could acquire Lindsay for a 45%
premium and still achieve a 20%+ IRR over a five-year period. Alternatively, a strategic buyer
may show interest in Lindsay’s industry-leading technology suite, global dealer network, and
established brand name. On a standalone basis, even a valuation based on Lindsay’s trough
earnings of FY 2014 supports a price target of over $110/share.
Viewed over the long-term, we believe Lindsay’s globally expanding, cash generative, industry-
leading business will reward investors well.
Kerrisdale Capital Management, LLC | 1212 Avenue of the Americas, 3rd Floor | New York, NY 10036 | Tel: 212.792.7999 | Fax: 212.531.6153
38
VIII. Full Legal Disclaimer
As of the publication date of this report, Kerrisdale Capital Management LLC and its affiliates
(collectively "Kerrisdale"), others that contributed research to this report and others that we have
shared our research with (collectively, the “Authors”) have long positions in and may own option
interests on the stock of the company covered herein (Lindsay Corporation) and stand to realize
gains in the event that the price of the stock increases. Following publication of the report, the
Authors may transact in the securities of the company covered herein. All content in this report
represent the opinions of Kerrisdale. The Authors have obtained all information herein from
sources they believe to be accurate and reliable. However, such information is presented “as
is”, without warranty of any kind – whether express or implied. The Authors make no
representation, express or implied, as to the accuracy, timeliness, or completeness of any such
information or with regard to the results obtained from its use. All expressions of opinion are
subject to change without notice, and the Authors do not undertake to update or supplement this
report or any information contained herein.
This document is for informational purposes only and it is not intended as an official
confirmation of any transaction. All market prices, data and other information are not warranted
as to completeness or accuracy and are subject to change without notice. The information
included in this document is based upon selected public market data and reflects prevailing
conditions and the Authors’ views as of this date, all of which are accordingly subject to change.
The Authors’ opinions and estimates constitute a best efforts judgment and should be regarded
as indicative, preliminary and for illustrative purposes only.
Any investment involves substantial risks, including, but not limited to, pricing volatility,
inadequate liquidity, and the potential complete loss of principal. This report’s estimated
fundamental value only represents a best efforts estimate of the potential fundamental valuation
of a specific security, and is not expressed as, or implied as, assessments of the quality of a
security, a summary of past performance, or an actionable investment strategy for an investor.
This document does not in any way constitute an offer or solicitation of an offer to buy or sell
any investment, security, or commodity discussed herein or of any of the affiliates of the
Authors. Also, this document does not in any way constitute an offer or solicitation of an offer to
buy or sell any security in any jurisdiction in which such an offer would be unlawful under the
securities laws of such jurisdiction. To the best of the Authors’ abilities and beliefs, all
information contained herein is accurate and reliable. The Authors reserve the rights for their
affiliates, officers, and employees to hold cash or derivative positions in any company discussed
in this document at any time. As of the original publication date of this document, investors
should assume that the Authors are long shares of LNN and stand to potentially realize gains in
the event that the market valuation of the company’s common equity is higher than prior to the
original publication date. These affiliates, officers, and individuals shall have no obligation to
inform any investor about their historical, current, and future trading activities. In addition, the
Authors may benefit from any change in the valuation of any other companies, securities, or
commodities discussed in this document. Analysts who prepared this report are compensated
Kerrisdale Capital Management, LLC | 1212 Avenue of the Americas, 3rd Floor | New York, NY 10036 | Tel: 212.792.7999 | Fax: 212.531.6153
39
based upon (among other factors) the overall profitability of the Authors’ operations and their
affiliates. The compensation structure for the Authors’ analysts is generally a derivative of their
effectiveness in generating and communicating new investment ideas and the performance of
recommended strategies for the Authors. This could represent a potential conflict of interest in
the statements and opinions in the Authors’ documents.
The information contained in this document may include, or incorporate by reference, forward-
looking statements, which would include any statements that are not statements of historical
fact. Any or all of the Authors’ forward-looking assumptions, expectations, projections, intentions
or beliefs about future events may turn out to be wrong. These forward-looking statements can
be affected by inaccurate assumptions or by known or unknown risks, uncertainties and other
factors, most of which are beyond the Authors’ control. Investors should conduct independent
due diligence, with assistance from professional financial, legal and tax experts, on all
securities, companies, and commodities discussed in this document and develop a stand-alone
judgment of the relevant markets prior to making any investment decision.