
Kermyt G. Anderson, Hillard Kaplan, and Jane B. Lancasterjlancas/AndersonKaplanLancaster_2001... ·...
31
Kermyt G. Anderson, Hillard Kaplan, and Jane B. Lancaster Men's Financial Expenditures on Genetic Children and Stepchildren from Current and Former Relationships PSC Research Report Report No. 01-484 September 2001 P OPULATION S TUDIES C ENTER AT THE I NSTITUTE FOR S OCIAL R ESEARCH U NIVERSITY OF M ICHIGAN PSC
Transcript of Kermyt G. Anderson, Hillard Kaplan, and Jane B. Lancasterjlancas/AndersonKaplanLancaster_2001... ·...

Kermyt G. Anderson, Hillard Kaplan, and Jane B. Lancaster
Men's Financial Expenditures on Genetic Children andStepchildren from Current and Former Relationships
PSC Research ReportReport No. 01-484
September 2001
P O P U L A T I O N S T U D I E S C E N T E RAT THE INSTITUTE FOR SOCIAL R ESEARCH
UNIVERSITY OF M ICHIGAN
PSC

PSC Publications Population Studies Center, University of Michiganhttp://www.psc.isr.umich.edu/pubs/ PO Box 1248, Ann Arbor, MI 48106-1248 USA
The Population Studies Center (PSC) at the University of Michigan is one of the oldestpopulation centers in the United States. Established in 1961 with a grant from the FordFoundation, the Center has a rich history as the main workplace for an interdisciplinarycommunity of scholars in the field of population studies. Today the Center is supported by aPopulation Research Center Core Grant from the National Institute of Child Health andHuman Development (NICHD) as well as by the University of Michigan, the National Instituteon Aging, the Hewlett Foundation, and the Mellon Foundation.
PSC Research Reports are prepublication working papers that report on currentdemographic research conducted by PSC associates and affiliates. These papers are written fortimely dissemination and are often later submitted for publication in scholarly journals. ThePSC Research Report Series was begun in 1981. Copyrights for all Reports are held by theauthors. Readers may quote from, copy, and distribute this work as long as the copyright holderand PSC are properly acknowledged and the original work is not altered.

Men's Financial Expenditures on Genetic Children and Stepchildren from Current and Former Relationships
Kermyt G. Anderson1, Hillard Kaplan2, and Jane B. Lancaster2
1 Postdoctoral Research Fellow, Population Studies Center, Institute for Social Research,
University of Michigan, [email protected]
2 Human Evolutionary Ecology Program, Department of Anthropology, University of New Mexico
Funding for the Albuquerque Men project on male fertility and parenting was provided by the National Science Foundation (#BNS-9011723 and #DBS-911552) and the William T. Grant Foundation (#89135089 and #91130501), as well as by the University of New Mexico Research Allocations Committee and the University of New Mexico Biomedical Research Grant.

Anderson, Kaplan and Lancaster Men's financial expenditures on children
2
ABSTRACT
This article investigates differential investment by men in their genetic children and stepchildren from current and former unions, using a sample of 635 children ages 0–24 drawn from the Albuquerque Men Study. We also examine selection effects by restricting the sample to men with children in more than one category, e.g., men with both genetic children and stepchildren in current unions, etc. Selection effects are important; men with both genetic offspring and stepoffspring in current relationships invest similarly in children, but the differences between offspring from current and previous unions are greater when comparing men with children in both categories. These results are consistent with the biosocial model advanced in the paper.
Datasets used: Albuquerque Men Survey, 1990-1993

Anderson, Kaplan and Lancaster Men's financial expenditures on children
3
INTRODUCTION
Men’s investment in children remains an important issue of concern to policy makers, researchers, and the general public. The complexities of the modern family pose challenges to children, fathers, and mothers, as well as to unrelated individuals who may assume parenting roles. Changing patterns in divorce, remarriage, and cohabitation mean that many American children do not reside with their biological fathers; while many live with single mothers, a significant fraction of live with a stepfather or cohabiting father figure (Bumpass, Raley, and Sweet, 1995; Cherlin and Furstenberg, 1994; Smock, 2000). From the male perspective, many men must juggle commitments and responsibilities to children living in several households, and to children from current and former relationships. Studying this aspect of modern fatherhood has been difficult, in part because traditional household surveys are not designed to track men’s involvement with children living in different locations (e.g., Greene and Biddlecom, 2000; Seltzer and Brandreth, 1994). The present study aims to clarify our understanding of men’s investments in children by using a biosocial perspective to examine men’s financial expenditures on their genetic children and stepchildren from both current and former relationships. Parental investment in genetic children and stepchildren
A large literature examines the differential treatment by parents in their stepchildren and genetic children from current unions, or in their genetic children from current and previous unions. Much of this literature is correlational, contrasting outcomes of children living in different family structures. These studies generally show that, compared to children living with two genetic parents, children living with a single mother or with a mother and stepfather are more likely to experience a number of adverse or socially undesirable outcomes, such as poorer academic achievements, criminal behavior, poverty, drug and alcohol abuse, adolescent nonmarital fertility, and marital instability (e.g., Biblarz and Raftery, 1999; Dawson, 1991; Harris and Marmer, 1996; Haveman and Wolfe, 1994, 1995; McLanahan and Bumpass, 1988; McLanahan and Sandefur, 1994). In addition to the correlational approach, a number of studies have analyzed direct measures of parental investment in or involvement with children, and found similar disparities. Among children of current unions, parents tend to invest more in genetic offspring than in stepoffspring; similarly, parents invest more in genetic children of current unions than in genetic children of previous unions (e.g., Amato, 1987; Anderson, Lam, Lancaster, and Kaplan, 1999; Anderson, Kaplan, and Lancaster, 1999; Case, Lin, and McLanahan, 1999; Cooksey and Fondell, 1996; Flinn, 1988; Hofferth and Anderson, 2001; Marsiglio, 1991; Zvoch, 1999).
Analyses of differential parental investment in offspring have focused separately on each of the parent/offspring relationship dyads already mentioned, that is, genetic children and stepchildren of current relationships, or genetic children or current and former relationships. To the best of our knowledge, simultaneous comparisons of these three groups of offspring have not been performed, nor have they been compared with stepchildren from previous unions. This paper will extend and contribute to the literature on men's investments in children by contrasting male parental investment across the four different types of offspring men have parented, and by presenting a theoretical model derived from evolutionary theory that accounts for these patterns of differential investment.

Anderson, Kaplan and Lancaster Men's financial expenditures on children
4
A biosocial model of parental care
An evolutionary perspective on parental care recognizes that investing in offspring is only one of several potential competing uses of an individual's time and resources. Individuals face trade-offs between investing in themselves (their own human capital, physical growth or immune system, etc.), in mating effort (initiating and/or maintaining a relationship with a sexual partner), or in parental effort (investments in existing offspring) (Hirshfield and Tinkle, 1975; Low, 1978; Trivers, 1972). Since mating effort reduces resources available for existing offspring and often results in the production of new offspring, the trade-off between mating effort and parental effort is analogous to the trade-off between offspring quantity and quality that has been recognized by many researchers in the social and biological sciences (e.g., Becker, 1991; Hill, 1993; Lam and Duryea, 1999; Powell and Steelman, 1989; Smith and Fretwell, 1974; Stearns, 1992; Willis, 1973). As a result of this trade-off, parental care can be treated as a collective good: each parent benefits from the investments the other makes in their joint children, but each parent is potentially able to defect or free-ride off the care provided by the other parent (or by other relatives, government welfare agencies, etc.) (Bergstrom, 1996; Chase, 1980; Kanazawa and Still, 2000; Noë, van Schaik, and van Hooff, 1991; Weiss and Willis, 1985, 1993). However, there are circumstances under which the trade-off between mating effort and parental effort do not occur, because investments in offspring may function as both mating effort and parental effort. Specifically, when both parents provide care for children, investment in offspring can be a basis for mate choice; in other words, individuals may select their partners on the basis of their partners’ ability or willingness to provide care for their offspring. Thus, the care that an individual provides to his or her offspring may influence not only the offspring's outcomes (health, survival, human capital, social status, etc.), but also the quality and duration of the relationship with the other parent (Anderson, Kaplan, and Lancaster, 1999; Rohwer, 1986; Rohwer, Herron, and Daly, 1999; Smuts and Gubernick, 1992).
This evolutionary perspective on parental care emphasizes two reasons for parental investment in offspring. First, parents invest in genetic offspring because doing so increases their own genetic fitness, i.e., the number of copies of their genes present in future generations. Daly and Wilson (1988, 1998) refer to this as discriminative parental solicitude, and note that parents in many species possess highly refined psychological mechanisms which result in them withholding care from individuals who are unlikely to be related to them, and preferentially directing care towards individuals who are likely to be their genetic offspring. Second, an individual may invest in an offspring because the investment influences that person's relationship with the offspring's other parent. For example, Kalmijn (1999) shows that fathers in the Netherlands who are involved with childrearing have happier marriages, largely because their involvement with childrearing increases their wives’ happiness with the relationship, while Flinn (1988) reports that men in Trinidad are much less aggressive towards stepchildren when the children’s mother are present (see also La Cerra, 1994).
By emphasizing the effect of parental care on the parental relationship, the model highlights a potentially important reason why men may decrease investments in children once a relationship has ended. After a union has dissolved, the care provider now faces resource allocation trade-offs; relationship benefits received from parental care in pre-existing offspring are no longer applicable, and the individual may respond by decreasing investments in children from previous unions in order to allocate resources to the initiation or maintenance of new relationships. This model is consistent with, and helps explain, the observations that men who

Anderson, Kaplan and Lancaster Men's financial expenditures on children
5
pay child support are less likely to have children within new marriages (Stewart, Manning, and Smock, 2001), and that the birth of a child within a subsequent relationship leads to decreased visitation (Manning and Smock, 1999) and child support payment (Manning and Smock, 2000) for children from men’s previous relationships.
Table 1 applies the logic of this biosocial framework to the four types of children men may have parented.1 Men receive both relationship and direct fitness benefits from investing in their genetic offspring through their current mates, and thus such investment can be categorized as both mating and parental investment. We expect men to invest the most in these children. Men receive neither relationship nor fitness benefits from allocating resources to stepchildren from previous unions, and we expect essentially no investment in such children. Investments in stepchildren of current relationships and in genetic children of previous relationships will be intermediate; the former group of children may receive high levels of investment, because doing so influences the man's relationship with the children's mother, while the latter group experiences decreased investment relative to genetic offspring of current mates, in part because men have reallocated the mating effort component of their investment in these children.
Additionally, we will examine the role of selection bias in generating differential investment patterns for different types of children. Stepfathers and biological fathers may differ from each other in unmeasurable ways, as may men who remain in a relationship with a child's mother versus those who terminate the relationship.2 Differential parental investment across the categories of children outlined in Table 1 could therefore be due to different qualities of the men providing the care, rather than the actual father/child relationship. All else being equal, the other parent should be more likely to dissolve the union if the individual decreases his or her level of parental care, or otherwise proves unwilling or unable to invest in offspring (Anderson, 2000; Anderson, Kaplan, and Lancaster, 1999). Additionally, stepfathers who go on to have genetic children within their new unions have probably been selected on the basis of being good caregivers (Hofferth and Anderson, 2001).
Several recent studies have compared differential parental investment in children and/or children's outcomes in blended families, that is, families in which a parent lives with both genetic offspring and stepoffspring (Case, Lin, and McLanahan, 2001; Evenhouse and Reilly, 2000; Ginther and Pollak, 1999; Hofferth and Anderson, 2001). Because the investment in both genetic offspring and stepoffspring comes from the same parent, differential investment patterns must be due to the relationship itself, rather than differences in the quality of the investor. These studies have found evidence for selection bias: the differences between resident stepchildren and genetic children in blended families are less than the difference measured across all families, although co-resident genetic children are often still favored. We will build upon earlier research examining selection biases by examining not only men with both resident genetic children and stepchildren, but by examining all possible pairs of father/offspring relationships in Table 1. Because of selection for more involved fathers in blended families, we expect to see smaller differences between investments in stepchildren and genetic children from a man's current relationship; however, because of trade-offs between investing in the children of current versus previous relationships, we expect to see greater differentials when comparing men who have
1 For the sake of simplicity, parenting relationships in which an offspring is not the child of the man's mate, such as adoption, fostering, or the raising of more distant kin, are not considered here. 2 Indirect support for this selection bias comes from Biblarz and Gottainer (2000), who find that children of widowed mothers are similar to children from two-parent families in terms of outcomes, while children of divorced parents experience disadvantaged outcomes.

Anderson, Kaplan and Lancaster Men's financial expenditures on children
6
genetic children and/or stepchildren by both current and previous partners. To the best of our knowledge, this comparison has not yet been performed. METHODS The Albuquerque Men dataset
The data with which we will to test our hypotheses come from a sample of men living in Albuquerque, New Mexico (USA), collected by Kaplan and Lancaster from 1990 through 1993. Two complementary interviews, short and long, were administered to participants recruited at the Bernalillo County (New Mexico) Motor Vehicle Division (MVD). The short interview, which took about seven minutes, was administered to approximately 7,100 participants in a private area at the MVD. All men who appeared to be over 18 years of age were considered eligible for initial contact. On the basis of information obtained in the short interview, eligible participants were invited to participate in the long interview. The criteria for eligibility were: 1) being age 25 or older, and 2) having come to the MVD for the purpose of license origination, renewal or for a photo ID. If the subject agreed to participate in the long interview, an appointment was made to conduct the interview either in a mobile office vehicle, in an office at the University of New Mexico, or at the subject’s home. Interviews were conducted in private by trained student interviewers. A total of 1,325 men participated in long interviews, for which they were paid $30 each. The long interviews took from two to six hours to administer. (For further details on the long interview methodology, see Kaplan, Lancaster, and Anderson, 1998.)
The long interview collected data on, among other things, each respondent’s marital, reproductive, and employment histories. Men were asked about their reproductive behavior in the context of legal and common-law marriages, as well as in cohabiting relationships. Men also provided parenting histories, listing each genetic offspring they had fathered as well as any more distantly related or unrelated children they had ever parented. For the current paper, we have restricted the sample of unrelated children to stepchildren (i.e., children from men’s partner's previous relationships). Children who were not the putative genetic descendent of either the respondent or of his partner (e.g., adopted children, other relatives such as nieces and nephews, etc.) are excluded from the present analysis. (See Lancaster and Kaplan, 2000 for a broader overview of men's parenting patterns, including adopted children and more distant kin.)
The parental investment variable used for analysis is a cross-sectional measure of the amount of money men spent of children during the year prior to being interviewed. Men were asked how much money they had spent over the last year on each child they had parented (excluding food and housing at home or child support for children who did not live with them), for each of the following specific categories: the child’s education (tuition, materials, books, etc.), clothing, hobbies (e.g., sports, ballet, collections, lessons, etc.), allowance (“pocket money”), medical expenses, and gifts. These categories were summed to create an aggregate estimate of the respondent’s financial expenditures on each of his offspring.
In calculating men's expenditures on children, it is important to ensure that measures for different categories of children are comparable. Because our financial expenditures variable excludes child support, it will underreport the financial support of non-custodial genetic fathers who paid child support. The long interview obtained data on men's child support payments; however, child support typically includes money for food and housing, two categories of expenditures that were not collected for custodial fathers. If we substitute men's child support

Anderson, Kaplan and Lancaster Men's financial expenditures on children
7
payments for their non-food and housing expenditures, the financial expenditures of non-custodial fathers will be exaggerated relative to custodial fathers. According to the Consumer Expenditure Survey, approximately 56.5% of expenditures on children by two-parent households went towards housing and food (U.S. Bureau of the Census, 1997: Table 711), suggesting that, on average, 43.5% of expenditures on children are for other non-food and non-housing expenditures. We therefore added 43.5% of men's reported child support payments3 to their other reported expenditures on non-custodial biological children age 18 or under, to derive a measure of financial expenditures on men's genetic children by previous mates. This measure probably overestimates men's expenditures on genetic children from former unions, because it is likely that a larger proportion of child support payments is allocated for food and housing than are expenditures by two-parent households. This will render our tests conservative, making us more likely not to find a difference where one exists, and less likely to falsely conclude there is a difference where one does not exist. We should note that, even counting child support, many men report spending no money on their genetic children from previous relationships; the results obtained by performing logistic analyses of whether or not men provided any money to children are similar to the results presented in this paper (not shown).
The long interviews provide data on financial expenditures on 1,513 children. Of these, 719 were age 25 or older at the time of interview, and were removed from the sample; a further 44 were dropped for not being genetic children of either the respondent or one of his mates (i.e., unrelated adopted children, foster children, more distant kin such as nieces or nephews, etc.). Another 66 children were dropped because their father's ethnic background was undefined or rare; the children who remained in the sample could all be classified as either Anglo or Hispanic.4 Finally, an additional 49 children were removed due to missing data for independent variables. The final sample contains 635 children ages zero through 24. Because men's expenditures on younger children may be constrained by legal requirements, and expenditures on older offspring may therefore more fully reflect actual parental preferences, we divide the sample into two groups for most analyses: dependent-aged offspring (ages 0 – 17, N = 419) and older offspring (ages 18 – 24, N = 216).
The outcome variable for all analyses is the natural log of men's reported financial expenditures on children.5 The unit of analysis is thus a child; it is important to note, however, that there are more children in the sample than fathers (635 offspring, 312 respondents). Where appropriate, we will note the number of respondents in the results, but "sample size" will always refer to the number of children receiving money. The analysis proceeds as follows. We compare average parental investment in each of the four offspring categories outlined in Table 1: genetic children from current unions, genetic children from previous unions, stepchildren from current unions, and stepchildren from previous unions. Mean expenditures are compared across children for each age group (dependent-aged offspring and older offspring), and evaluated using oneway ANOVAs, with the significance levels being Bonferroni-adjusted for multiple simultaneous
3 Of 102 genetic offspring from previous unions who were under age 18, men reported paying no child support for 43 of them (42%). For those children who did receive child support, men reported spending an average of $3,345 (in 1990 dollars) per child the previous year. 4 In New Mexico, the term "Anglo" refers to all individuals of non-Hispanic European descent, regardless of whether or not they are of Anglo-Saxon heritage. Most Hispanics in our sample were born in the United States and are not recent immigrants. The 66 excluded children included only 34 African-Americans, 4 Native Americans, and 28 undefined or "other," groups that were considered to small and/or heterogeneous to produce reliable parameter estimates if included in the analysis. 5 The unlogged expenditures variable contains several dozen extreme outliers at the upper end of the distribution, as revealed by a box plot (not shown); the logged variable has no such outliers, and is thus more appropriate for analysis. The logged variable retains the observed zero expenditures as the lowest (censored) value.

Anderson, Kaplan and Lancaster Men's financial expenditures on children
8
comparisons. Next, we use multivariate tobit regression to compare men's expenditures on different types of children while controlling for background characteristics. For children ages zero through 17, nine control variables will be added to the multivariate models: the child's gender and age6, the age, ethnicity, education, fertility, and income of the respondent, the education of the child's mother, and whether or not the respondent and the child's mother ever legally married.7 For offspring ages 18 through 24, these same control variables are used, with an additional indicator variable noting whether the offspring is attending college. This first set of analyses will include all children in the sample; because many men may have children in only one father-child category, this is the across men sample. Lastly, to control for men's self-selection into different father-child relationships, and the different trade-offs faced by men with different types of offspring, we will repeat the analyses for a sample of children whose fathers have children in more than one child-father category; this is the within men sample.
The means for all dependent and independent variables are presented for the full (across men) sample in Table 2, by respondent-offspring relationship category and offspring age group. The final column of the table reports the results of one-way ANOVAs comparing each variable across the four categories of children. The only variable that shows no significant variation across types of children is the child's gender; all other predictors are significant for at least one, and often both, age groups.
RESULTS Comparisons across men
The lower rows of Table 2 present means for three versions of the parental investment variable: whether the child received any money from the respondent, the amount of money spent on the child, and logged expenditures. Parental investment differs significantly across respondent-offspring relationship categories for all three measures of parental investment. Note that all genetic children of current mates receive money from their fathers, for both age groups. Among stepchildren of current mates, all younger children and 90% of older children also receive money from respondents. Thus, while the actual amount spent on genetic children and stepchildren from current unions may vary, nearly all men claim to be investing to some extent in the children of their current partners. Rates of investment in genetic offspring from former unions are also fairly high; men claim they spend some money (this includes child support) on over 80% of dependent-aged non-resident genetic offspring, and on over two thirds of older children. Men typically do not spend money on their stepchildren by former mates; only 21% of younger and 38% of older stepoffspring from dissolved unions receive any money from respondents.
Actual financial expenditures also vary significantly across the father-child relationship categories, in a manner consistent with the predicted levels (Table 2). Genetic children of current
6 In other models (not shown here), age squared terms added for both children and/or respondents were not significant, suggesting the relationship between age and expenditures on children is best modeled for our purposes as linear. 7 Several interesting and potentially important independent variables cannot be included because of the nature of the data collection methodology (i.e., the information comes from men who have parented these children, rather than mothers or through a more traditional household survey). For example, for women who are no longer in relationships with respondents, we have no data on whether or not the child's mother has remarried, what her current income is, etc. Nor do we have no information on the genetic fathers of respondents' stepchildren.

Anderson, Kaplan and Lancaster Men's financial expenditures on children
9
unions receive the most money, while stepchildren of previous unions receive the least; the other two groups of offspring receive similar intermediate levels of money. To further explore differential male parental investment, Bonferroni-adjusted pairwise comparisons are presented in Table 3, in which the observed significance level for each comparison has been adjusted for the fact that multiple comparisons being are made simultaneously. For children age 17 and under (Table 3, above the diagonal), there is no significant difference in the expenditures on genetic children and stepchildren of current partners; all other pairwise comparisons reveal statistically significant differences. Genetic children of previous mates receive significantly less money than both genetic children and stepchildren of current partners, while stepchildren of previous partners receive less money than all other offspring categories. Among older offspring (Table 3, below the diagonal), the difference between genetic children and stepchildren of current mates is marginally significant, with genetic children receiving more money, while the difference between stepchildren of current mates and genetic children of previous mates is not significant. Overall among older offspring, genetic children of current mates receive the most money, and stepchildren of previous mates receive the least.
Multivariate tobit models of logged financial expenditures are presented in Table 4. Children's relationships to respondents represented as a series of dummy variables, with genetic offspring of current unions as the omitted baseline. All else being equal, men spend significantly less money on their genetic children by former mates and on their stepchildren by former mates than they spend on genetic children of current mates. This result holds true for both younger and older offspring. Stepchildren of current mates do not receive significantly less money than genetic children of current mates for the sample of younger children, although the difference is significant for older offspring. Stepchildren of current mates receive more money than genetic children of former mates, for both age groups (see Table A1, which presents the same models from Table 4, with genetic children of former mates as the omitted baseline). Stepchildren of previous mates receive the least money of all children. These results suggest an ordered ranking of male financial investment in offspring, with genetic children of current mates receiving the most money, stepchildren of current mates receiving less than them, genetic children of former mates receiving even less, and stepchildren of previous mate receiving the least of all.
Comparisons within men
The results presented in Tables 2, 3 and 4 make comparisons across all men, including those who may have children in only a single father/offspring category. Because men choose to enter into those relationship categories, it is possible that the men in each category may differ in unobservable ways. To examine the role of self-selection in parental investment, we examine financial expenditures on children for men with children in at least two relationship categories.8 Because of the smaller sample size of both respondents and offspring, children ages zero through 24 are grouped together for these analyses. When comparing mean expenditures, all pairwise comparisons are significant, with the exception of expenditures on genetic children and stepchildren of current mates (Table 5). Genetic offspring of former mates receive significantly less money than either genetic offspring or stepoffspring of current mates, while stepoffspring of 8 Comparisons within respondents who have offspring in three categories are limited to between 1 to 5 respondents and 6 to 21 offspring per comparison, and are not presented here. The patterns are similar to those presented for men with children in two categories, and despite the small sample size most of the comparisons are statistically significant. There is only one respondent with children in all four categories (N = 9 children), but his distribution of parental investment is also similar to the patterns presented in the text.

Anderson, Kaplan and Lancaster Men's financial expenditures on children
10
former mates receive less money than all other children. These results are consistent with the comparisons made across the children of all men in Table 3: men are investing the most in the children (genetic and step) of their current relationships and the least in their stepchildren from former relationships, with genetic offspring of former partners receiving intermediate amounts.
Because of selection biases, contrasting the parental investment in stepchildren and genetic children from blended families reveals smaller differences than when stepchildren and genetic children of current relationships are compared across all families. Table 6 presents the mean differences for each pairwise comparison in our dataset; comparisons across all men are presented above the diagonal (these are equivalent to weighted averages of the mean differences for each age group presented in Table 3, but are re-calculated here with all ages grouped together), while comparisons within men (from Table 5) are presented below the diagonal. Because mean differences are calculated as column mean minus row mean, identical comparisons on the off diagonals will have opposite signs; what is important for our purposes is the magnitude of the difference, rather than the direction. Looking at the comparison for genetic children and stepchildren of current relationships, our results support earlier findings in that the difference in expenditures is smaller in blended families than it is across all stepchildren and genetic children of current mates (mean difference of 0.29 within families, 0.91 across families). The difference is also smaller when comparing investments in genetic children and stepchildren of previous mates (3.17 within families, 3.45 across families). All other differences, however, are greater when comparing investments by men with children in both of those categories with investments across all men. Note that these larger differences are all contrasts between children from current unions and children from previous ones—precisely the type of situation where trade-offs between mating and parental effort would be the most explicit.
The analyses in Tables 5 and 6 do not control for differences in background characteristics that are likely to influence men's expenditures on children. Because of the reduced sample size available for the comparisons within men, it is not practical to run the full multivariate models that were presented in Table 4; additionally, because these are comparisons within men, there is no variance in paternal variables (father's age, income, etc.). Examinations of the independent variables (not shown) revealed that the only two variables which showed consistent variation across different types of offspring were the age of the child, and whether or not the child was in college. Thus, to partially control for background effects on parental investment we ran separate multivariate tobit models on each of the six within-men offspring category pairs; each model includes the child's age and an indicator variable for whether the child was in college, in addition to an indicator variable for one of the father-child relationship categories. Results are presented in Table 7, which focuses on the relationship category variable (parameter estimates for child's age and whether in college are not shown). The results of these multivariate models are consistent with the simple comparisons of means presented in Table 5. All pairs of different types of offspring receive significantly different levels of investment, with the exception of genetic children and stepchildren of current mates. Genetic children and stepoffspring of current mates both receive more money than other offspring, stepchildren of previous mates receive less money than any other children, and genetic children of previous mates receive intermediate levels of investment.
Lastly, we again consider the effects of men's self-selection into these father-offspring categories by comparing the coefficients for respondent-child relationship obtained from tobit models, using a sample of children whose fathers/father figures have children in at least two categories (Table 7), and those whose fathers/father figures have children in at least one category
Anderson, Kaplan and Lancaster Men's financial expenditures on children
11
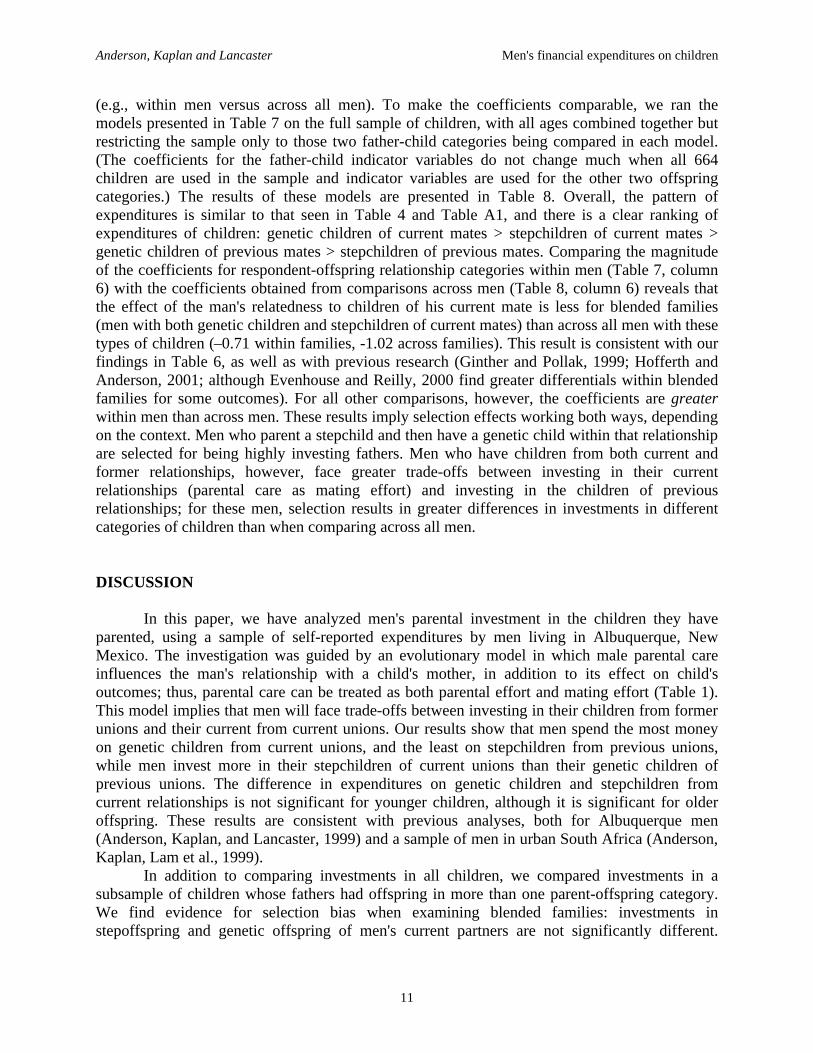
(e.g., within men versus across all men). To make the coefficients comparable, we ran the models presented in Table 7 on the full sample of children, with all ages combined together but restricting the sample only to those two father-child categories being compared in each model. (The coefficients for the father-child indicator variables do not change much when all 664 children are used in the sample and indicator variables are used for the other two offspring categories.) The results of these models are presented in Table 8. Overall, the pattern of expenditures is similar to that seen in Table 4 and Table A1, and there is a clear ranking of expenditures of children: genetic children of current mates > stepchildren of current mates > genetic children of previous mates > stepchildren of previous mates. Comparing the magnitude of the coefficients for respondent-offspring relationship categories within men (Table 7, column 6) with the coefficients obtained from comparisons across men (Table 8, column 6) reveals that the effect of the man's relatedness to children of his current mate is less for blended families (men with both genetic children and stepchildren of current mates) than across all men with these types of children (–0.71 within families, -1.02 across families). This result is consistent with our findings in Table 6, as well as with previous research (Ginther and Pollak, 1999; Hofferth and Anderson, 2001; although Evenhouse and Reilly, 2000 find greater differentials within blended families for some outcomes). For all other comparisons, however, the coefficients are greater within men than across men. These results imply selection effects working both ways, depending on the context. Men who parent a stepchild and then have a genetic child within that relationship are selected for being highly investing fathers. Men who have children from both current and former relationships, however, face greater trade-offs between investing in their current relationships (parental care as mating effort) and investing in the children of previous relationships; for these men, selection results in greater differences in investments in different categories of children than when comparing across all men.
DISCUSSION
In this paper, we have analyzed men's parental investment in the children they have
parented, using a sample of self-reported expenditures by men living in Albuquerque, New Mexico. The investigation was guided by an evolutionary model in which male parental care influences the man's relationship with a child's mother, in addition to its effect on child's outcomes; thus, parental care can be treated as both parental effort and mating effort (Table 1). This model implies that men will face trade-offs between investing in their children from former unions and their current from current unions. Our results show that men spend the most money on genetic children from current unions, and the least on stepchildren from previous unions, while men invest more in their stepchildren of current unions than their genetic children of previous unions. The difference in expenditures on genetic children and stepchildren from current relationships is not significant for younger children, although it is significant for older offspring. These results are consistent with previous analyses, both for Albuquerque men (Anderson, Kaplan, and Lancaster, 1999) and a sample of men in urban South Africa (Anderson, Kaplan, Lam et al., 1999).
In addition to comparing investments in all children, we compared investments in a subsample of children whose fathers had offspring in more than one parent-offspring category. We find evidence for selection bias when examining blended families: investments in stepoffspring and genetic offspring of men's current partners are not significantly different.
Anderson, Kaplan and Lancaster Men's financial expenditures on children
12
However, we found that the differences between investments in children from current and former unions were greater when examining men with children in both categories than when comparing across all men. These results suggests that differences in parental characteristics cannot explain decreased investment in children following divorce; parental/mating effort trade-offs appear to play a role as well.
Three features of this model strike us as particularly important. First, the model places parental care in the context of opportunity costs—the benefits that could be obtained by using the time and money allocated to parental care to other purposes. Many studies of parental care do not emphasize the potential benefits parents forego by providing care to their children. Second, while many models focus solely on the benefits that children receive from parental investment, our model allows the caregiver to receive benefits as well, by allowing the care provided to affect the quality and/or duration of the relationship with the child’s other parent. Third, the model draws attention to parental investment in stepchildren as a potential male mating strategy. While other authors have focused on the deficient aspects of relationships between stepfathers and stepoffspring, our model draws attention to the relatively high levels of care that men provide to their stepchildren, in the context of men’s overall reproductive patterns. Given that stepfathers are helping to raise other men’s children, one could say with respect to stepparental investment that the glass is half full rather than half empty.
We believe the model presented here provides useful insights into the dynamics of parental cooperation that might not be generated from other theoretical perspectives. For example, over the past several decades, despite the passage of increasingly strict laws to enforce its collection, child support compliance has actually decreased (although this decline is in part due to the changing nature of family structure, specifically the increase in nonmarital births) (Case, Lin, and McLanahan, 2000; Hanson, Garfinkel, McLanahan, and Miller, 1996; Robins, 1992). In determining child support levels, many states now require non-custodial parents to share the same proportion of their income with their children as they would have shared had they remained living with them (Hanson et al., 1996). In other words, men are required to pay their genetic children by former mates the same amount as they would pay genetic children of current mates. Although child support has positive effects on children’s wellbeing (Amato and Gilbreth, 1999), and non-custodial fathers can afford to pay significantly more child support than they actually do (Sorensen, 1997), non-custodial fathers often characterize the levels of child support they are required to pay as unfair (Dubey, 1995; Lin, 2000). By focusing on the opportunity costs of parental care that arise from the trade-offs between investments in mating effort and parental effort, our model provides insight into why many fathers, despite increasing legislative penalties, prove so resistant to paying their child support obligations in full. Competing hypotheses for patterning of parental care
We have presented results which are consistent with our evolutionary model of parental care. However, there are other theories which make similar predictions for the patterning of parental care, and which must be acknowledged and discussed. We will first discuss alternative explanations for differential investments in stepchildren versus genetic children of current relationships, then proceed to explanations for greater investment in biological children of current relationships than in biological children from previous unions. To the best of our knowledge, no body of theory has examined or made predictions about differential investments in the four other pairwise comparisons listed in Table 3.

Anderson, Kaplan and Lancaster Men's financial expenditures on children
13
Differential investment in biological offspring and stepoffspring of current unions
Several other explanations have been proposed for increased investments in biological children relative to stepchildren in current households. Cherlin (1978) argued that the role of stepparent is incompletely institutionalized, and lacks the routinization that provides normative guidelines for parental behavior. This ambiguity leads to parents in blended families treating all children equally. Our finding of equal financial expenditures on children in blended households is consistent with this model, although as Hofferth and Anderson (2001) note, investments in stepchildren in blended households tend to increase without reductions in biological children, suggesting strong positive selection for men who have both stepchildren and genetic children by their current partners. Incomplete institutionalization does not explain the differential investment between stepchildren of current unions and biological children or stepchildren of previous unions, among both all men and men who have parented both types of offspring.
Another explanation for why stepfathers might invest less than genetic fathers is that, because they were not present during infancy, stepfathers are less fully bonded with their stepchildren. We show elsewhere (Anderson, Kaplan, and Lancaster, 1999) that in the Albuquerque Men dataset, the stepchild's age when co-residence began is an important predictor of time involvement by stepfathers, but not of financial expenditures. Hofferth and Anderson (2001) do not find consistent significant effects of duration of co-residence on time involvement by stepfathers, in either all households or blended families. In a study of male investment in urban South Africa, Anderson, Kaplan, Lam, et al. (1999) do not find significant effects of duration of co-residence on stepparental investment. These findings suggest that it is the nature of the stepparental relationship, and not its duration, that most strongly influences investments in stepchildren.
A third explanation for decreased investments in coresident stepchildren is that stepfathers may adjust their investments in stepchildren if the children's biological fathers are still involved with them. This is consistent with the idea that parental care is a collective good; each investor may adjust his or her investment in response to care provided by other investors (Borgerhoff Mulder, 1992; Chase, 1980). We cannot test this hypothesis with the Albuquerque Men data, because nothing is known about the biological fathers of men's stepchildren. In their study of time involvement with fathers, Hofferth and Anderson (2001) find that although stepchildren spend less time with stepfathers than biological children do with their resident biological fathers, the difference decreases (though it is still significant) when considering the total amount of time stepchildren spend with father figures (i.e., summed stepfather plus biological father time involvement). Hofferth and Anderson (2001) surmise that stepfathers may have fewer opportunities to interact with stepchildren who are involved with nonresident biological fathers, in part because of the time the children spend traveling back and forth between households. Differential investment in biological children from current and previous unions
One simple reason that investments in children by noncustodial parents may decrease following divorce is that decreased proximity to children means fewer opportunities to invest in them. Social and emotional bonds with children can be renewed and reinforced more easily when a parent is in daily contact with children; this may also lead to decreased investment in

Anderson, Kaplan and Lancaster Men's financial expenditures on children
14
noncustodial offspring. Positive correlations have been found between child support compliance, joint parental custody, increased visitation frequency, and physical proximity between fathers and children (e.g., Arditti and Keith, 1993; Cooksey and Craig, 1998; Peters, Argys, Maccoby, and Mnookin, 1993; Seltzer, 1991, 1998; Sohenstein and Calhoun, 1990; Teachman, 1991), while the denial of visitation by custodial mothers is frequently cited by men as a reason for nonpayment (Dubey, 1995). Most of these investigations focus on younger children, so that coresidence with children is confounded with the status of the man's relationship with the children's mother. In the current paper, we find significant differences in the money spent on genetic children from current and former relationships, both among younger children (who are likely to reside with their mother) and older children (who are more likely to live with neither parent) (Table 4). This pattern holds for analyses of financial support for college among Albuquerque men (Anderson, Kaplan, and Lancaster, 1999), a result which is less likely to be due to coresidence because many college students live with neither parent. In a separate analysis of financial expenditures on offspring of Albuquerque men, we found no effect of the duration of coresidence on expenditures on children from former relationships (Anderson, Kaplan, and Lancaster, 1999). Co-residence clearly has strong impacts on time spent together, and on other forms of investment which require proximity; its importance as an explanation for decreased financial expenditures following divorce remains unclear.
Weiss and Willis (1985, 1993) propose another alternative explanation for decreased paternal care following divorce. In their model of child support as a collective good, married parents can monitor each other’s allocations to make sure the bargain is enforced; once parents divorce, however, they can neither monitor nor enforce the bargain as effectively. Because child support is a fungible resource, the money a non-custodial parent (typically the father) pays to the custodial parent (typically the mother) can be re-allocated by the custodial parent in ways the non-custodial parent does not condone, leading to a decrease in parental care after divorce. Weiss and Willis' model is formulated explicitly to explain child support compliance, and would not be expected to apply to the provision of non-fungible goods (such as clothing), or payments made to the child directly. Our measure of financial expenditures, which includes money spent directly on education, clothing, hobbies, allowances, medical expenses and gifts in addition to child support, shows significant differences between genetic offspring of current and previous relationships, even though many of these expenditures were likely made by the father directly on the goods purchased. We also find significant differences among older biological offspring (ages 18 - 24), even though our measure excludes child support for this age group, and payments in this age class are less likely to be made directly to the children's mother. In other analyses, we find that genetic offspring of current relationships are much more likely than genetic children of previous unions to receive financial support for college, even though men are likely to provide money directly to the offspring or to the offspring's university rather than to the offspring's mother (Anderson, Kaplan, and Lancaster, 1999).
These explanations for varied levels of parental care in different types of children are not mutually exclusive, nor are they necessarily inconsistent with the model presented in this paper. Distinguishing between these different explanations may be difficult, because they make similar predictions under similar conditions; ultimately, no one hypothesis is likely to explain all parental behavior under all conditions. However, we believe that these alternative hypotheses do not fully account for or predict the results we have obtained, thus lending credence to our model.

Anderson, Kaplan and Lancaster Men's financial expenditures on children
15
Selection effects on parental investment and child outcomes
Lastly, we have presented evidence that selection effects are important in analyzing male parental investment. Several previous studies have looked for selection effects in blended families, composed of stepchildren and genetic children in the same household. When examined in blended families, differential treatment of stepoffspring and genetic offspring decreased (Case et al., 2001; Evenhouse and Reilly, 2000; Hofferth and Anderson, 2001), disappeared (Ginther and Pollack, 1999), or in some cases increased (Evenhouse and Reilly, 2000). Ginther and Pollack (1999) argue that evidence in favor of discriminative parental investment is an artifact resulting from unobserved heterogeneity between households. We believe the weakened support for differential treatment of half-siblings within blended households does not mean that men do not favor genetic offspring over stepchildren; men in blended families are a selected group, who have successfully used investing in stepchildren as a means of mating effort to obtain further reproductive opportunities (Anderson, 2000; Hofferth and Anderson, 2001). Rather than using selection bias to explain away differential treatment of children, we embrace it as part of the process of parental care as a form of mating effort. The results presented in this paper, comparing not only blended families of genetic and stepchildren of current partners, but also within-men comparisons of children of current and previous partners, support the model and the role of relationship effort in the allocation of male parental investment. CONCLUSION
We have presented a biosocial model of male parental care, in which care provided to
offspring influences not only the offspring's outcomes but also the man's relationship with the offspring's mother. Trade-offs between investments in children from current and former relationships are emphasized. Our results support the model, and point to important selection effects as well. The paper focuses on financial expenditures on children, which represent only one dimension of parental investment in children; following Evenhouse and Reilly (2000), we caution against extrapolating too broadly from a single indicator of child wellbeing or parental investment. We note that the Albuquerque Men dataset is unusual in that it contains information on men's genetic offspring and stepoffspring from both current and former relationships. In this era of serial parenting, we believe more effort should be made to collect data on the recipients of parental support who are scattered across many households. Biosocial perspectives are showing increasing promise in the application to the study of human parental behavior and contemporary sociological problems (e.g., Biblarz and Raftery, 1999; Booth, Carver, and Granger, 2000; Freese and Powell, 1999). We hope that the results presented here will motivate others to further incorporate and evaluate biosocial models in their own research.
Anderson, Kaplan and Lancaster Men's financial expenditures on children
16
REFERENCES Amato, Paul R. 1987. Family processes in one-parent, stepparent, and intact families: The child’s
point of view. Journal of Marriage and the Family 49: 327-337. Amato, Paul R., and Joan G. Gilbreth. 1999. Nonresident fathers and children’s well-being: A
meta-analysis. Journal of Marriage and the Family 61: 557-573. Anderson, Kermyt G. 2000. The life histories of American stepfathers in evolutionary
perspective. Human Nature 11(4): 307-333. Anderson, Kermyt G., Hillard Kaplan, David Lam, and Jane B. Lancaster. 1999. Paternal care by
genetic fathers and stepfathers II: Reports by Xhosa high school students. Evolution and Human Behavior 20: 433-451.
Anderson, Kermyt G., Hillard Kaplan, and Jane B. Lancaster. 1999. Paternal care by genetic fathers and stepfathers I: Reports from Albuquerque Men. Evolution and Human Behavior 20: 405-431.
Arditti, Joyce A., and Timothy Z. Keith. 1993. Visitation frequency, child support payment, and the father-child relationship postdivorce. Journal of Marriage and the Family 55: 699-712.
Becker, Gary S. 1991. A Treatise on the Family (Enlarged Edition). Cambridge, MA: Harvard University Press.
Bergstrom, Theodore. 1996. Economics in a family way. Journal of Economic Literature 34: 1903-1935.
Biblarz, Timothy J., and Greg Gottainer. Family structure and children’s success: A comparison of widowed and divorced single-mother families. Journal of Marriage and the Family 62: 533-548.
Biblarz, Timothy J., and Adrian E. Raftery. 1999. Family structure, educational attainment, and socioeconomic success: Rethinking the “pathology of matriarchy.” American Journal of Sociology 105: 321-365.
Booth, Alan, Karen Carver, and Douglas A. Granger. 2000. Biosocial perspectives on the family. Journal of Marriage and the Family 62: 1018-1034.
Borgerhoff Mulder, Monique. 1992. Reproductive decisions. In Evolutionary Ecology and Human Behavior, E.A. Smith and B. Winterhalder, eds., pp. 339-374. New York: Aldine de Gruyter.
Bumpass, Larry L., R. Kelly Raley, and James A. Sweet. 1995. The changing nature of stepfamilies: Implications of cohabitation and nonmarital childbearing. Demography 32: 425-436.
Case, Anne, I-Fen Lin, and Sara McLanahan. 1999. Household resource allocation in stepfamilies: Darwin reflects on the plight of Cinderella. American Economic Review Papers and Proceedings 89: 234-238.
Case, Anne, I-Fen Lin, and Sara McLanahan. 2000. Understanding child support trends: economic, demographic, and political contributions. NBER Working Paper No. 8056.
Case, Anne, I-Fen Lin, and Sara McLanahan. 2001. Educational attainment in blended families. Evolution and Human Behavior 22: 26-289.
Chase, Ivan D. 1980. Cooperative and noncooperative behavior in animals. American Naturalist 115: 827-857.
Cherlin, Andrew. 1978. Remarriage as an incomplete institution. American Journal of Sociology 84: 634-650.

Anderson, Kaplan and Lancaster Men's financial expenditures on children
17
Cherlin, Andrew J., and Frank F. Furstenberg, Jr. 1994. Stepfamilies in the United States: A reconsideration. Annual Review of Sociology 20: 359-381.
Cooksey, Elizabeth C., and Patricia H. Craig. 1998. Parenting from a distance: The effects of paternal characteristics on contact between nonresidential fathers and their children. Demography 35: 187-200.
Cooksey, Elizabeth C., and Michelle M. Fondell. 1996. Spending time with his kids: Effects of family structure on fathers’ and children’s lives. Journal of Marriage and the Family 58: 693-707.
Daly, Martin, and Margo Wilson. 1988. Homicide. New York: Aldine de Gruyter. Daly, Martin, and Margo Wilson. 1998. The Truth About Cinderella: A Darwinian View of
Parental Love. New Haven, CT: Yale University Press. Dawson, Deborah A. 1991. Family structure and children’s health and well-being: Data from the
1988 National Health Interview Survey on Child Health. Journal of Marriage and the Family 53: 573-584.
Dubey, Sumati N. 1995. A study of reasons for non-payment of child-support by non-custodial parents. Journal of Sociology and Social Welfare 22(4): 115-131.
Evenhouse, Eirik, and Siobhan Reilly. 2000. Is the wicked stepmother just a fairytale? Working Paper No. 00-W49, Dept. of Economics, Vanderbilt University.
Flinn, Mark V. 1988. Step- and genetic parent/offspring relationships in a Caribbean village. Ethology and Sociobiology 9: 335-369.
Freese, Jeremy, and Brian Powell. 1999. Sociobiology, status, and parental investment in sons and daughters: Testing the Trivers-Willard hypothesis. American Journal of Sociology 106: 1704-1743.
Ginther, Donna K., and Robert A. Pollak. 1999. Does family structure affect children's educational outcomes? Manuscript, Department of Economics, Washington University.
Greene, Margaret E., and Ann E. Biddlecom 2000. Absent and problematic men: Demographic accounts of male reproductive roles. Population and Development Review 26: 81-115.
Hanson, Thomas L., Irwin Garfinkel, Sara S. McLanahan, and Cynthia K. Miller. 1996. Trends in child support outcomes. Demography 33: 483-496.
Harris, Kathleen M., and Jeremy K. Marmer. 1996. Poverty, paternal involvement, and adolescent well-being. Journal of Family Issues 17: 614-640.
Haveman, Robert, and Barbara Wolfe. 1994. Succeeding Generations: On the Effects of Investments in Children. New York: Russell Sage Foundation.
Haveman, Robert, and Barbara Wolfe. 1995. The determinants of children’s attainments: A review of methods and finding. Journal of Economic Literature 23: 1829-1878.
Hill, Kim. 1993. Life history theory and evolutionary anthropology. Evolutionary Anthropology 2: 78-88.
Hirshfield, Michael F., and Donald W. Tinkle. 1975. Natural selection and the evolution of reproductive effort. Proceedings of the National Academy of Sciences 72: 2227-2231.
Hofferth, Sandra L., and Kermyt G. Anderson. 2001. Biological and stepfather investment in children. Research Report No. 01-471, Population Studies Center, University of Michigan.
Kalmijn, Matthijs. 1999. Father involvement in childrearing and the perceived stability of marriage. Journal of Marriage and the Family 61: 409-421.
Kanazawa, Satoshi, and Mary C. Still. 2000. Parental investment as a game of chicken. Politics and the Life Sciences 19: 17-26.

Anderson, Kaplan and Lancaster Men's financial expenditures on children
18
Kaplan, Hillard, Jane B. Lancaster, and Kermyt G. Anderson. 1998. Human parental investment and fertility: The life histories of men in Albuquerque. In Men in Families: When Do They Get Involved? What Difference Does It Make?, A. Booth and N. Crouter, eds., pp. 55-111. New York: Lawrence Erlbaum.
La Cerra, Mary Margaret. 1994. Evolved mate preferences in women: Psychological adaptations for assessing a man’s willingness to invest in offspring. Unpublished Ph.D. dissertation. Department of Psychology, University of California, Santa Barbara.
Lam, David, and Suzanne Duryea. 1999. Effects of schooling on fertility, labor supply, and investments in children, with evidence from Brazil. Journal of Human Resources 34: 160-192.
Lancaster, Jane B., and Hillard Kaplan. 2000. Parenting other men’s children: Costs, benefits and consequences. In Human Behavior and Adaptation: An Anthropological Perspective, L. Cronk, W. Irons and N. Chagnon, eds., pp. 179-202. New York: Aldine de Gruyter.
Lin, I-Fen. 2000. Perceived fairness and compliance with child support obligations. Journal of Marriage and the Family 62: 388-398.
Low, Bobbi S. 1978. Environmental uncertainty and the parental strategies of marsupials and placentals. American Naturalist 112: 197-213.
Manning, Wendy D., and Pamela J. Smock. 1999. New families and nonresident father-child visitation. Social Forces 78: 87-116.
Manning, Wendy D., and Pamela J. Smock. 2000. “Swapping” families: Serial parenting and economic support for children. Journal of Marriage and the Family 62: 111-122.
Marsiglio, William. 1991. Paternal engagement activities with minor children. Journal of Marriage and the Family 53: 973-986.
McLanahan, Sara, and Larry Bumpass. 1988. Intergenerational consequences of family disruption. American Journal of Sociology 94: 130-152.
McLanahan, Sara, and Gary Sandefur. 1994. Growing Up with a Single Parent: What Hurts, What Helps. Cambridge, MA: Harvard University.
Noë, Ronald, Carel P. van Schaik, and Jan A.R.A.M. van Hooff. 1991. The market effect: an explanation for pay-off asymmetries among collaborating animals. Ethology 87: 97-118.
Peters, Elizabeth H., Laura M. Argys, Eleanor E. Maccoby, and Robert H. Mnookin. 1993. Enforcing divorce settlements: Evidence from child support compliance and award modifications. Demography 30: 719-735.
Powell, Brian, and Lala Carr Steelman. 1989. The liability of having brothers: paying for college and the sex composition of the family. Sociology of Education 62: 134-147.
Robins, Philip K. 1992. Why did child support award levels decline from 1978 to 1985? Journal of Human Resources 27: 362-379.
Rohwer, Sievert, Jon C. Herron, and Martin Daly. 1999. Stepparental behavior as mating effort in birds and other animals. Evolution and Human Behavior 20: 367-390.
Rohwer, Sievert. 1986. Selection for adoption versus infanticide by replacement “mates” in birds. Current Ornithology 3: 353-395.
Seltzer, Judith A. 1991. Relationships between fathers and children who live apart: The father’s role after separation. Journal of Marriage and the Family 53: 79-101.
Seltzer, Judith A. 1998. Father by law: Effects of joint legal custody on nonresident fathers’ involvement with children. Demography 35: 135-146.
Seltzer, Judith A., and Yvonne Brandreth. 1994. What fathers say about involvement with children after separation. Journal of Family Issues 15: 49-77.

Anderson, Kaplan and Lancaster Men's financial expenditures on children
19
Smith, Christopher C., and Stephen D. Fretwell. 1974. The optimal balance between size and number of offspring. American Naturalist 108: 499-506.
Smock, Pamela J. 2000. Cohabitation in the United States. Annual Review of Sociology 26: 1-20. Smuts, Barbara B., and David J. Gubernick. 1992. Male-infant relationships in nonhuman
primates: Paternal investment or mating effort? In Father-Child Relations: Cultural and Biosocial Contexts, Barry S. Hewlett, ed., pp. 1-30. New York: Aldine de Gruyter.
Sohenstein, Freya L., and Charles A. Calhoun. 1990. Determinants of child support: A pilot survey of absent parents. Contemporary Policy Issues 8: 75-94.
Sorensen, Elaine. 1997. A national profile of nonresident fathers and their ability to pay child support. Journal of Marriage and the Family 59: 785-797.
Stearns, Stephen C. 1992. The Evolution of Life Histories. New York: Oxford University Press. Stewart, Susan D., Wendy D. Manning, and Pamela J. Smock. 2001. Nonresident fathers' new
family formation: The effect of investments in nonresident children. Manuscript. Department of Sociology and Anthropology, University of Richmond.
Teachman, Jay D. 1991. Contributions to children by divorced fathers. Social Problems 38: 358-371.
Trivers, Robert L. 1972. Parental investment and sexual selection. In Sexual Selection and the Descent of Man 1871-1971, B. Campbell, ed., pp. 136-179. Chicago: Aldine.
U.S. Bureau of the Census. 1997. Statistical Abstract of the United States: 1997 (117th ed.). Washington, D.C.
Weiss, Yoram, and Robert J. Willis. 1985. Children as collective goods and divorce settlements. Journal of Labor Economics 3: 268-292.
Weiss, Yoram, and Robert J. Willis. 1993. Transfers among divorced couples: evidence and interpretation. Journal of Labor Economics 11: 629-679.
Willis, Robert J. 1973. A new approach to the economic theory of fertility behavior. Journal of Political Economy 81: S14-S69.
Zvoch, Keith. 1999. Family type and investment in education: A comparison of genetic and stepparent families. Evolution and Human Behavior 20: 453-464.

Table 1. Classifications of father-child relationships Relationship with child’s mother
Relatedness to child Current partner Previous partner
Genetic child Parental and relationship investment Parental investment
Stepchild Relationship investment Minimal investment

Table 2. Means (standard deviations) of variables used in analyses, by offspring relationship to respondent, across all men Ages 0 - 17
All offspring Genetic child, current mate
Genetic child, previous mate
Stepchild, current mate
Stepchild, previous mate
F3, 442 [p]
N (offspring) 446 282 102 38 24
Child’s is female 0.49 (0.50)
0.48 (0.50)
0.50 (0.50)
0.53 (0.51)
0.54 (0.51)
0.25 [0.864]
Child’s age (years) 9.87 (4.78)
8.86 (4.94)
11.71 (3.96)
10.63 (4.08)
12.79 (3.24)
13.57 [0.000]
Respondent's age (years) 40.14 (6.17)
40.38 (6.04)
39.68 (6.01)
40.92 (7.48)
37.96 (5.89)
1.55 [0.202]
Respondent is Anglo 0.54 (0.50)
0.59 (0.49)
0.42 (0.50)
0.55 (0.50)
0.54 (0.51)
2.84 [0.037]
Respondent’s education (years) 15.43 (2.70)
15.94 (2.70)
14.53 (2.65)
14.79 (2.36)
14.25 (1.59)
10.02 [0.000]
Child’s mother’s education (years) 15.24 (2.47)
15.77 (2.39)
14.36 (2.28)
15.18 (2.32)
12.79 (1.84)
18.40 [0.000]
Respondent, child’s mother ever married 0.90 (0.30)
0.98 (0.14)
0.77 (0.42)
0.74 (0.45)
0.75 (0.44)
20.33 [0.000]
Respondent's total number of genetic offspring (all ages)
33.95 (30.52)
2.73 (1.29)
2.42 (1.35)
1.79 (1.45)
1.08 (1.21)
15.94 [0.000]
Respondent’s income (in thousands of 1990 dollars)
2.49 (1.38)
40.06 (34.00)
23.11 (21.14)
28.03 (16.94)
17.60 (12.26)
11.61 [0.000]
Proportion of offspring receiving any money from respondent
0.91 (0.28)
1.00 (0.00)
0.81 (0.39)
1.00 (0.00)
0.21 (0.41)
116.41 [0.000]
Financial expenditures by respondent on child (1990 dollars)
2103.71 (2674.66)
2570.24 (2839.09)
1362.41 (2079.91)
1861.05 (2681.98)
156.58 (453.38)
10.44 [0.000]
Log of financial expenditures 6.64 (2.26)
7.44 (0.92)
5.68 (2.84)
6.76 (1.50)
1.22 (2.52)
112.63 [0.000]
Note: F statistic results from an ANOVA comparing differences across the four types of offspring Sample size for number of respondents in each category is 220, 152, 61, 26 and 16, respectively.

Table 2 (continued) Ages 18 - 24
All offspring Genetic child, current mate
Genetic child, previous mate
Stepchild, current mate
Stepchild, previous mate
F3, 212 [p]
N (offspring) 216 99 65 20 32
Child’s is female 0.50 (0.50)
0.51 (0.50)
0.46 (0.50)
0.40 (0.50)
0.625 (0.49)
1.06 [0.367]
Child is in college 0.30 (0.46)
0.43 (0.50)
0.17 (0.38)
0.25 (0.44)
0.19 (0.40)
5.63 [0.001]
Child’s age (years) 20.96 (1.99)
20.94 (1.89)
21.02 (2.00)
20.85 (2.08)
21.00 (2.30)
0.04 [0.988]
Respondent's age (years) 47.98 (6.57)
49.89 (5.92)
46.51 (5.97)
47.65 (9.75)
45.28 (5.71)
6.10 [0.001]
Respondent is Anglo 0.62 (0.49)
0.72 (0.45)
0.35 (0.48)
0.75 (0.44)
0.75 (0.444)
10.14 [0.000]
Respondent’s education (years) 15.74 (2.91)
16.07 (3.08)
15.08 (2.93)
15.75 (2.61)
16.06 (2.33)
1.70 [0.168]
Child’s mother’s education (years) 14.81 (3.15)
15.55 (3.19)
14.12 (3.28)
15.15 (2.60)
13.75 (2.50)
4.31 [0.006]
Respondent, child’s mother ever married 0.92 (0.28)
1.00 (0.00)
0.86 (0.35)
0.90 (0.31)
0.78 (0.42)
6.95 [0.000]
Respondent's total number of genetic offspring (all ages)
34.92 (28.61)
2.86 (1.58)
2.48 (1.35)
2.20 (1.20)
0.97 (1.23)
14.18 [0.000]
Respondent’s income (in thousands of 1990 dollars)
2.40 (1.56)
36.80 (24.10)
32.90 (36.69)
36.62 (33.34)
32.15 (18.71)
0.37 [0.774]
Proportion of offspring receiving any money from respondent
0.80 (0.40)
1.00 (0.00)
0.68 (0.47)
0.90 (0.31)
0.38 (0.49)
32.83 [0.000]
Financial expenditures by respondent on child (1990 dollars)
2670.44 (4077.67)
4293.08 (4626.27)
1535.23 (3275.97)
1828.00 (3067.40)
482.81 (1796.75)
11.81 [0.000]
Log of financial expenditures 5.72 (3.19)
7.59 (1.50)
4.50 (3.38)
6.04 (2.46)
2.19 (3.02)
44.08 [0.000]
Note: F statistic results from an ANOVA comparing differences across the four types of offspring Sample size for number of respondents in each category is 153, 72, 56, 17, and 22, respectively.

Table 3. Pairwise comparisons of mean differences (p values) of logged financial expenditures on children, by offspring relationship to respondent, across all men
Ages 0 - 17 [F(3, 442) = 112.6, p < 0.0001]
Genetic child, current mate
Genetic child, previous mate
Stepchild, current mate
Stepchild, previous mate
Genetic child, current mate — -1.76
(0.000) -0.68
(0.123) -6.22
(0.000)
Ages 18 - 24
Genetic child, previous mate
3.09 (0.000) — 1.078
(0.006) -4.46
(0.000)
[F(3, 212) = 32.8, p < 0.0001] Stepchild,
current mate 1.55
(0.079) -1.54
(0.108) — -5.54 (0.000)
Stepchild, previous mate
5.39 (0.000)
2.31 (0.000)
3.85 (0.000) —
Comparisons for ages 0 -17 shown in bold above the diagonal, ages 18-24 in italics below the diagonal. Mean differences are expressed in each cell as column mean minus row mean, and significance levels are Bonferroni-adjusted for multiple simultaneous comparisons.

Table 4. Tobit models of logged financial expenditures on children, across all men
Ages 0 - 17 Ages 18 - 24 Coeff. Std. error p Coeff. Std. error p
Intercept 4.07 0.83 0.000 9.38 2.75 0.001 Child’s is female -0.38 0.16 0.019 0.15 0.38 0.697 Child is in college — — — 1.34 0.49 0.006 Child’s age (years) 0.05 0.02 0.007 -0.27 0.11 0.015 Respondent's age (years) 0.03 0.02 0.039 -0.01 0.03 0.809 Respondent is Anglo -0.20 0.18 0.262 -0.36 0.43 0.403 Respondent’s education (years) 0.03 0.04 0.379 0.09 0.09 0.302 Child’s mother’s education (years) 0.00 0.04 0.958 -0.01 0.08 0.940 Respondent, child’s mother ever married 1.25 0.30 0.000 2.75 0.78 0.001 Respondent’s income (in thousands of 1990 dollars) 0.01 0.00 0.000 0.02 0.01 0.003 Respondent's total number of genetic offspring (all ages) -0.12 0.06 0.051 -0.33 0.14 0.021 Genetic child of current mate (omitted) — — — — — — Genetic child of previous mate -1.54 0.22 0.000 -2.86 0.50 0.000 Stepchild of current mate -0.42 0.31 0.174 -1.34 0.67 0.046 Stepchild of previous mate -6.98 0.46 0.000 -6.25 0.69 0.000
N = 446, 2χ (12) = 340.79 p < 0.0001
N = 216, 2χ (13) = 153.88 p < 0.0001
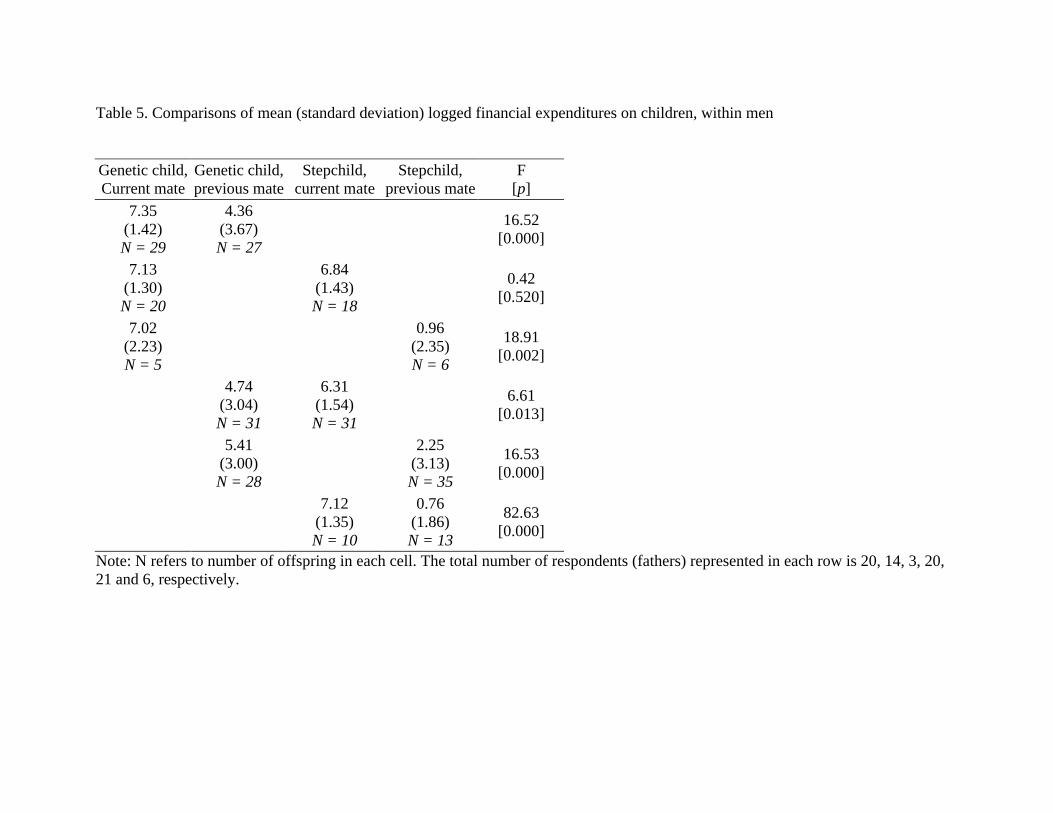
Table 5. Comparisons of mean (standard deviation) logged financial expenditures on children, within men Genetic child, Current mate
Genetic child, previous mate
Stepchild, current mate
Stepchild, previous mate
F [p]
7.35 (1.42) N = 29
4.36 (3.67) N = 27
16.52 [0.000]
7.13 (1.30) N = 20
6.84
(1.43) N = 18
0.42 [0.520]
7.02 (2.23) N = 5
0.96
(2.35) N = 6
18.91 [0.002]
4.74
(3.04) N = 31
6.31 (1.54) N = 31
6.61 [0.013]
5.41
(3.00) N = 28
2.25
(3.13) N = 35
16.53 [0.000]
7.12
(1.35) N = 10
0.76 (1.86) N = 13
82.63 [0.000]
Note: N refers to number of offspring in each cell. The total number of respondents (fathers) represented in each row is 20, 14, 3, 20, 21 and 6, respectively.

Table 6. Mean differences in logged financial expenditures on children, across all men and within men
ACROSS ALL MEN
Genetic child, current mate
Genetic child, previous mate
Stepchild, current mate
Stepchild, previous mate
Genetic child, current mate — -2.26 -0.97 -5.70
WITHIN
Genetic child, previous mate 2.98 — 1.29 -3.45
MEN Stepchild, current mate 0.29 -1.57 — -4.73
Stepchild, previous mate 6.06 3.17 6.36 —
Note: Ages zero through 24 combined in this analysis. Comparisons across all men are shown in bold above the diagonal, and comparisons within men having children in two categories are shown in italics below the diagonal. Mean differences are expressed in each cell as column mean minus row mean.

Table 7. Summaries of multivariate tobit models of logged financial expenditures on children, within men.
Offspring pair compared N ( )32χ Model p Indicator variable Coefficient for indicator
Standard error for indicator
Indicator partial p
Genetic child of current mate/ genetic child of previous mate 56 16.37 0.001 Genetic child of
previous mate -3.39 1.114 0.004
Genetic child of current mate/ stepchild of current mate 38 5.51 0.138 Stepchild of
current mate -0.71 0.561 0.212
Genetic child of current mate/ stepchild of previous mate 11 11.45 0.003 Stepchild of
previous mate -11.77 5.084 0.046
Genetic child of previous mate/ stepchild of current mate 62 9.16 0.027 Stepchild of
current mate 1.68 0.701 0.019
Genetic child of previous mate/ stepchild of previous mate 63 16.81 0.001 Stepchild of
previous mate -5.93 1.490 0.000
Stepchild of current mate/ stepchild of previous mate 23 28.77 0.000 Stepchild of
previous mate -8.67 1.525 0.000
Note: each line represents a separate multivariate model. Children ages 0 - 24 are grouped together. N refers to the total number of offspring in each cell; the number of respondents (fathers) represented in each row is 20, 14, 3, 20, 21 and 6, respectively. In addition to an indicator variable for respondent/child relationship category, each model includes an intercept term, the child's age, and whether he/she is in college.

Table 8. Summaries of multivariate tobit models of logged financial expenditures on children, for all men with a child in at least one category
Offspring pair compared N ( )32χ Model p Indicator variable Coefficient for indicator
Standard error for indicator
Indicator partial p
Genetic child of current mate/ genetic child of previous mate 548 140.43 0.000 Genetic child of
previous mate -2.40 0.204 0.000
Genetic child of current mate/ stepchild of current mate 439 46.50 0.000 Stepchild of
current mate -1.02 0.173 0.000
Genetic child of current mate/ stepchild of previous mate 437 478.26 0.000 Stepchild of
previous mate -6.49 0.248 0.000
Genetic child of previous mate/ stepchild of current mate 225 15.66 0.001 Stepchild of
current mate 1.46 0.512 0.006
Genetic child of previous mate/ stepchild of previous mate 223 56.63 0.000 Stepchild of
previous mate -5.50 0.797 0.000
Stepchild of current mate/ stepchild of previous mate 114 82.85 0.000 Stepchild of
previous mate -6.58 0.729 0.000
Note: each line represents a separate multivariate model. Children ages 0 - 24 are grouped together. Each model is restricted to children in the two categories being compared. N refers to the total number of offspring in each cell; the number of respondents (fathers) represented in each row is 288, 225, 232, 129, 124, and 70, respectively. In addition to an indicator variable for respondent/child relationship category, each model includes an intercept term, the child's age, and whether he/she is in college.

Table A1. Alternate tobit models of logged financial expenditures on children, with genetic children of previous mates as the omitted category, across all men
Ages 0 - 17 Ages 18 - 24 Coeff. Std. error p Coeff. Std. error p
Intercept 2.52 0.79 0.002 6.52 2.72 0.017 Child’s is female -0.38 0.16 0.019 0.15 0.38 0.697 Child is in college — — — 1.34 0.49 0.006 Child’s age (years) 0.05 0.02 0.007 -0.27 0.11 0.015 Respondent's age (years) 0.03 0.02 0.039 -0.01 0.03 0.809 Respondent is Anglo -0.20 0.18 0.262 -0.36 0.43 0.403 Respondent’s education (years) 0.03 0.04 0.379 0.09 0.09 0.302 Child’s mother’s education (years) 0.00 0.04 0.958 -0.01 0.08 0.940 Respondent, child’s mother ever married 1.25 0.30 0.000 2.75 0.78 0.001 Respondent’s income (in thousands of 1990 dollars) 0.01 0.00 0.000 0.02 0.01 0.003 Respondent's total number of genetic offspring (all ages) -0.12 0.06 0.051 -0.33 0.14 0.021 Genetic child of current mate 1.54 0.22 0.000 2.86 0.50 0.000 Genetic child of previous mate (omitted) — — — — — — Stepchild of current mate 1.12 0.32 0.001 1.52 0.71 0.032 Stepchild of previous mate -5.44 0.45 0.000 -3.39 0.69 0.000
N = 446, 2χ (12) = 340.79 p < 0.0001
N = 216, 2χ (13) = 153.88 p < 0.0001


![[Jonathan P. Goldstein, Michael G. Hillard] Heterodox Macroeconomic Keynes Marx Globalization](https://static.fdocuments.in/doc/165x107/55cf9499550346f57ba31bbe/jonathan-p-goldstein-michael-g-hillard-heterodox-macroeconomic-keynes.jpg)