Kerala Inland Fisheries Statistics 2013
69
1 Kerala inland Fisheries Statistics 2013 Department of Fisheries Government of Kerala Department of Fisheries Thiruvananthapuram Kerala Inland Fisheries Statistics 2013 Published by Director of Fisheries Prepared by Statistical cell, Directorate of Fisheries Vikas Bhavan, Thiruvananthapuram
Transcript of Kerala Inland Fisheries Statistics 2013

1
Kerala inland Fisheries Statistics 2013 Department of Fisheries
Government of Kerala
Department of Fisheries Thiruvananthapuram
Kerala Inland Fisheries Statistics
2013
Published by Director of Fisheries
Prepared by Statistical cell, Directorate of Fisheries
Vikas Bhavan, Thiruvananthapuram

2
Kerala Inland Fisheries statistics- 2013 Department of Fisheries

3
Kerala Inland Fisheries statistics- 2013 Department of Fisheries
Preface
Fisheries and aquaculture is an important sector of food production, providing nutritional security to the food basket Inland fish production provides significant contribution to animal protein supplies in rural areas of the state. Most of the inland production is consumed locally and marketed domestically. Production of quality fish seeds along with measures for seed certification, disease diagnosis and other measures for health management are also targeted during XIlth plan period. For increasing the inland production through the maximum utilization of the resources augmenting the aquaculture production and productivity through diversification and intensive aquaculture practices, ensuring conservation and management through responsible and participatory approaches , introduced the project Matsyasamrudhi during the XIlth Five Year Plan.
Kerala is blessed with a large number of water bodies both fresh water and brackish wate r-
rivers, interconnected backwaters (Kayals), estuaries & backwaters. The state is also endowed with vast resources in terms of ponds & tanks, rivers & canals, reservoirs, lakes and other water bodies having immense scope for development of fisheries to strengthen the food security, generate employment opportunities and earn foreign exchange with the ultimate objective of improving the socio economic status of fishers and other people engaged in the sector.
.The statistical details presented in the ensuing tables will give a bird’s eye view of the Inland
sector of Kerala. We hope this publication will be useful to the Planners, Researchers and other data users. Suggestions to improve the quality as well as the contents of this publication are most welcome.
Sd/-
Thiruvananthapuram Mini Antony IAS
25-08-2014 Director of Fisheries

4
Kerala Inland Fisheries statistics- 2013 Department of Fisheries

5
Kerala Inland Fisheries statistics- 2013 Department of Fisheries
Introduction
Kerala lies North Latitude between 08° 18’ and 12° 48’ East latitude between 74° 52’ and 77° 22’, is blessed with 44 rivers, reservoirs, number of irrigation tanks, streams, waterfalls, ponds backwaters etc. These water bodies make the land green and fertile and contribute a rich resource of inland production. Among the total inland production in India Kerala contributes more or less 2%. Due to the successful effort of the Fisheries Department by introducing modern technologies and popularising the aquaculture activities among common people, the inland fish production shows a considerable upward growth.
INLAND FISHERIES STATISTICS –ALL INDIA
Total inland water bodies (lakh Ha) 73.59
Rivers & canals (Km) 195210
Reservoirs (Lakh ha) 29.07
Tanks & ponds (lakh Ha) 24.14
Flood plain lakes/derelict waters (lakh Ha) 7.98
Brackish water (lakh Ha) 12.40
Fish production in 2012-13(lakh tonnes) 56.32
State-wise inland Fish Production 2010-11 (in ‘000 Tonnes)
Andhra Pradesh
Arunachal Pradesh
Assam
Bihar
Goa
Gujarat
Haryana
Himachal Pradesh
Jammu & Kashmir
6
Kerala Inland Fisheries statistics- 2013 Department of Fisheries
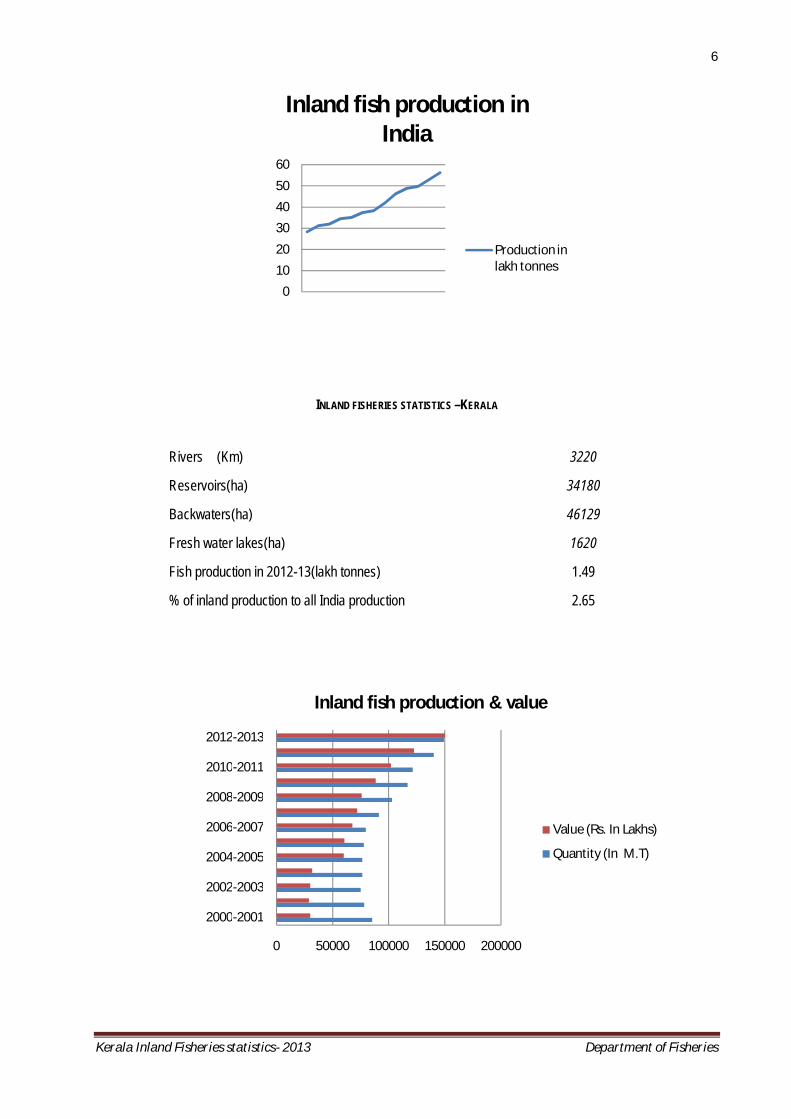
INLAND FISHERIES STATISTICS –KERALA
Rivers (Km) 3220
Reservoirs(ha) 34180
Backwaters(ha) 46129
Fresh water lakes(ha) 1620
Fish production in 2012-13(lakh tonnes) 1.49
% of inland production to all India production 2.65
0
10
20
30
40
50
60 2000
-01 2002
-03 2004
-05 2006
-07 2008
-09
2010
-11 2012
-…Axis Title
Inland fish production in India
Production in lakh tonnes
0 50000 100000 150000 200000
2000-2001
2002-2003
2004-2005
2006-2007
2008-2009
2010-2011
2012-2013
Inland fish production & value
Value (Rs. In Lakhs)
Quantity (In M.T)

7
Kerala Inland Fisheries statistics- 2013 Department of Fisheries
INDEX
Table No CONTENT Page No Table-1 Water resources for the development of inland fisheries in Kerala – at a glance 10
Table-2 Details of rivers in Kerala 11
Table-3 List of backwaters of Kerala 12
Table-4 District wise details of fresh water resources 14
Table-5 Details of reservoirs in Kerala 15
Table-6 State wise inland water resource in India 18
Table-7(A) District wise distribution of fishermen population (inland) in Kerala for 2010-11 & 2011-12 (estimated) 19
Table-7(B) District wise distribution of fishermen population (inland) in Kerala during 2012-13 (estimated) 19
Table-8(A) District wise break up of active fishermen population(inland) 2010-2011& 2011-12 20
Table-8(B) District wise break up of active fishermen population (inland) 2012-2013 20
Table-9(A) Percentage of active fishermen to the fishermen population (inland) during 2010-11 & 2011-12 21
Table-9(B) Percentage of active fishermen to the fishermen population (inland) during 2012-13 21
Table-10 Inland fishermen population (estimated) from 2010-11 to 2012-13 22
Table-11 List of inland fishing villages 22
Table-12 Fisheries farms & hatcheries in the public sector 25
Table-13 Details of hatcheries in Kerala 26
Table-14 Details of inland fish landing centers 28
Table-15 Species wise, inland fish landings in Kerala 2010-11 to 2012-13(Qty. in MT) 31
Table-16 Species wise, composition of inland fish landings in Kerala ( 2009-10 to 2012-13) 32
Table-17 Species wise, quarter wise inland fish production in Kerala during 2010 & 2011 33
Table-18 Species wise, quarter wise inland fish production in Kerala during 2012 & 2013 34
Table-19 Year wise species wise inland fish landings in Kerala 2010 to 2013 35
Table-20 Status of shrimp/prawn production in Kerala 36
Table-21 Inland fish production and value in Kerala from 1985-1986to 2012-2013 37
Table-22 Brackish water fish production from 2007-08 to 2012-13 in MT 38
Table-23 Landing value of inland fishes 2009-10 to 2012-13 (Rs. in lakhs) 38
Table-24 Average landing prices of inland fishes from 2010-11 to 2012-13 39
Table-25 (a) District wise species wise inland fish landings in Kerala for the year 2010-11(Qty in MT) 40
Table-25(b) District wise species wise values of inland fishes in Kerala for the year 2010-11(Rs in 000's) 41
Table-26(a) District wise species wise inland fish landings in Kerala for the year 2011-12 (Qty in MT) 42
Table-26(b) District wise species wise values of inland fishes in Kerala for the year 2011-12 (Rs in 000's) 43
Table-27(a) District wise species wise inland fish landings in Kerala for the year 2012-13 (qty in mt) 44
Table-27(b) District wise species wise values of inland fishes in Kerala for the year 2012-13 (Rs in 000's) 45
Table-28 Hatchery wise fish seed /fingerlings/prawn seed production from 2010-11 to 2012-13 46
Table-29 Fish/ prawn seed – production details 2010-11 to 2012-13 46

8
Kerala Inland Fisheries statistics- 2013 Department of Fisheries
Table-30 Progress of FFDA for the last 5 years- physical achievements from 2008-09 to 2012-13 49
Table-31 Average fish production of FFDA from 2008-09 to 2012-13 49
Table-32(a) Performance of FFDA in Kerala during 2010-11 50
Table-32(b) Performance of FFDA in Kerala during 2011-12 50
Table-32© Performance of FFDA in Kerala during 2012-13 51
Table-33 Details of production of prawn seeds from hatcheries of Matsyafed from 2010-11to 2012-13 51
Table-34 Details of production of fish from the farms of Matsyafed from 2010-11 to 2012-13 51
Table-35 Details of fish harvested from reservoirs from 2010-11 to 2012-13 52
Table-36 Matsysakeralam 1st phase harvest details (2009-10) 53
Table-37 Matsysakeralam 2nd phase harvest details (2010-11) 54
Table-38 Matsysakeralam 3rd phase harvest details (2011-12) 55
Table-39 Matsysakeralam area brought under fish culture ( 2009-10 to 2011-12) in Ha 56
Table-40 Matsya samrudhi -1st phase harvest details (2012-13) 57
Table-41 Prawn production in India - 1999-00 to 2010-11 58
Table-42 All India inland fish production 60
Table-43 State wise inland fish production 2008-09 to 2010-11 (in ‘000 Tonnes) 61
Table-44 Existing rates of user charges /fees of various services /facilities rendered by department of fisheries 62
Table-45 Fees for licensing (registration/re-registration) of fishing gears & chinese nets/ chemmeen vattt in the state 64
Table-46 Inland Fisheries – Annual Plan 2010-11 to 2012-13 64
Table-47 Contribution of fishing to the NSDP at factor cost for the years from 2008-2009 to 2012-2013 (at current price) (Base year: 2004-2005) 65
Table-48 Contribution of fishing to the NSDP at factor cost for the years from 2008-2009 to 2012-2013 (at constant price) (Base year: 2004-2005) 65
Table-49 Contribution of fishing to the GDP at factor cost for the years from 2008-2009 to 2012-2013(at current price) (Base year: 2004-2005) 66
Table-50 Contribution of fishing to the GDP at factor cost for the years from 2008-2009 to 2012-2013 (at constant price) (Base year: 2004-2005) 66
Table-51 Contribution of fishing to NDP estimates at current prices for the year 2009-2010 (District level break up) 67
Table-52 Contribution of fishing to NDP estimates at current prices for the year 2010-2011 (provisional)- (District level break up) 67
Table-53 Contribution of fishing to NDP estimates at current prices for the year 2011-2012 (quick) - District level break up 68
Table-54 Contribution of fishing to ndp estimates at constant prices for the year 2009-2010 (District level break up) 68
Table-55 Contribution of fishing to ndp estimates at constant prices for the year 2010-2011 (PROVISIONAL)- (District level break up) 69
Table-56 Contribution of fishing to ndp estimates at constant prices for the year 2011-2012 (QUICK)- District level break up 69

9
Kerala Inland Fisheries statistics- 2013 Department of Fisheries
KERALA INLAND FISHERIES STATISTICS – 2013
Selected indicators Area : 38863 Sq. Kms No of districts : 14 No of CD blocks : 152 No of Taluks : 63 No of grama panchayaths : 978 No of Municipalities : 60 No of Corporations : 5 Coastline of Kerala : 590 Kms No of Rivers : 44 :
Population (2011 census) Male : 16027412 Female : 17378649 Total : 33406061 Density of population : 859 per sq. km. :
Sex ratio : 1084 Literacy rate : 92.66% Fisheries Sector Fishing villages Inland : 113 Marine : 222 : Fishermen Population (estimated) during 2012-13 : 1006662 Marine 775130 Male : 303658 Female : 271989 Children : 199483 Inland 231532 Male : 89943
Female : 86515 Children : 55074
Active Fishermen (2012-13) : : 234904 Marine : 197921 Inland : 36983 Fish production 2012-13 : 6.80 Lakh MT Marine : 5.31 Lakh MT Inland : 1.49 Lakh MT

10
Kerala Inland Fisheries statistics- 2013 Department of Fisheries
Table-1
WATER RESOURCES FOR THE DEVELOPMENT OF INLAND FISHERIES IN KERALA – AT A GLANCE
Sl. No. Item Number Area (ha)
A. FRESHWATER RESOURCES
1 Private ponds 34447 8494.258
2 Panchayat Ponds 7340 1367
3 Quarry Ponds 1162 322.405
4 Holy Ponds 3224 400.427
5 Irrigation Tanks 1051 2313.27
6 Private Sector-Freshwater Fish Farms 4718 648
7 Public Sector-Freshwater Fish Farms 13 85
8 Freshwater springs 7 ..
9 Freshwater lakes 9 1620
10 Water Falls 11 ..
11 Rivers 44 85000
12 Reservoirs 49 34180
13 Check Dams 80 259
14 Bund/Barrier/Anicut/Shutter water holds 70 879
B. BRACKISHWATER RESOURCES
15 Brackish water Area .. 65213
16 Backwaters 53 46129
17 Prawn Filtration fields 474 4366
18 Public Sector Brackish water fish farms 12 227
19 Estuaries (Azhi / Pozhi) 84 ..
20 Mangrove Area .. 2189

11
Kerala Inland Fisheries statistics- 2013 Department of Fisheries
Table-2
DETAILS OF RIVERS IN KERALA
Sl. No. Name of Rivers Length
(Kms) Sl. No. Name of Rivers Length
(Kms)
1 Manjeswar 16 22 Tirur 48
2 Uppala 50 23 Bharathapuzha 209
3 Shriya 67 24 Kecheri 51
4 Mogral 34 25 Puzhakkal 29
5 Chandragiri 105 26 Karivannoor 48
6 Chittari 25 27 Chalakudy 130
7 Nileswar 46 28 Periyar 244
8 Kariyangode 64 29 Moovattupuzha 121
9 Kawayi 31 30 Meenachil 78
10 Peruvamba 51 31 Manimala 90
11 Ramapuram 19 32 Pamba 176
12 Kuppam 82 33 Achankoil 128
13 Valapattanam 110 34 Pallichal 42
14 Anjarakandi 48 35 Kallada 121
15 Tellichery 28 36 Ithikkara 56
16 Mahi 54 37 Ayirur 17
17 Kuttiyadi 74 38 Vamanapuram 88
18 Korapuzha 40 39 Mamam 27
19 Kallayi 22 40 Karamana 68
20 Chaliyar 169 41 Neyyar 56
21 Kadalundi 130 TOTAL 3092 East flowing Rivers:
Sl.No. Name of Rivers Length (Kms) Remarks
1 Kabani 63 Flows only a few kms through Kerala 2 Bhavani 39
3 Pampar 26

12
Kerala Inland Fisheries statistics- 2013 Department of Fisheries
Table-3
LIST OF BACKWATERS OF KERALA
Sl.No Name of District Nos. Name of Backwater Area (Ha)
1 Thiruvananthapuram
1 Poovar Kayal 30.93 2 Poonthura Kayal 97.59 3 Veli Kayal 22.48 4 Kadinamkulam Kayal 346.88 5 Anchuthengu Kayal 521.75 6 Edava – Nadayara Kayal 157.65
TOTAL 1177.28
2 Kollam
1 Paravoor Kayal 662.46 2 Ashtamudi Kayal 6424.15 3 Kayamkulam Kayal 140.58
TOTAL 7227.19
3 Alappuzha
1 Kayamkulam Kayal 1511.75 2 Poomeen Kayal 3.37 3 Vadakkal Kayal 1.46 4 Chethi Kayal 4.11 5 Arthungal Kayal 5.96 6 Pozhichal Kayal 20.41 7 Vettakkalchal Kayal 27.10 8 Vembanattu Kayal 10661.23
TOTAL 12235.39
4 Kottayam 1 Vembanattu Kayal 2926.77
TOTAL 2926.77
5 Ernakulam 1 Vembanattu Kayal 2257.89 2 Kochi Kayal 7503.80
TOTAL 9761.69
6 Thrissur
1 Azhikode Kayal 82.02 2 Kodungalloor Kayal 613.81 3 Chettuva Kayal 713.87 4 Pattikkara Kayal .. 5 Manakkady Kayal ..
TOTAL 1409.70
7 Malappuram
1 Puthupponnani 150.83 2 Ponnani Kayal 757.19 3 Poorappuzha 62.98 4 Kadalundi Kayal 323.56
TOTAL 1294.56

13
Kerala Inland Fisheries statistics- 2013 Department of Fisheries
Sl.No Name of District Nos. Name of Backwater Area (Ha)
8 Kozhikode
1 Kadalundi Kayal 83.85 2 Beypore Kayal 783.74 3 Kallai Kayal 160.13 4 Korappuzha 1038.08 5 Payyoli Puzha 26.70 6 Kottapuzha 584.12 7 Newmahe Puzha 88.28
TOTAL 2764.90
9 Kannur
1 Mahe 91.89 2 Dharmadam Kayal 359.06 3 Valappattanam 3077.64 3 Palakkode 598.25 4 Cheruvathur 30.58
TOTAL 4157.42
10 Kasaragode
1 Cheruvathur 1123.12 2 Nilewaram 824.69 3 Chittari Kayal 89.33 4 Bekal Kayal 43.37 5 Kappil Pozhi 2.22 6 Neembil Kayal 22.47 7 Chandragiri 575.81 8 Mogral Puthur 89.74 9 Kumbala 221.54 10 Suvarnagiri 6.22 11 Manjeswaram 158.41 12 Thalappady 17.12
TOTAL 3174.04 GRAND TOTAL 46128.94

14
Kerala Inland Fisheries statistics- 2013 Department of Fisheries
Table 4 DISTRICT WISE DETAILS OF FRESH WATER RESOURCES
Sl No District Panchayath ponds Holy ponds and
streams Village ponds
and other water holds
Irrigation tanks
No Area(Ha) No Area(Ha) No Area (Ha) No Area
(Ha) 1 Thiruvananthapuram 1706 297.25 67 20.03 .. .. 34 1.54
2 Kollam 589 62.93 188 24.96 16 35.55 17 150.26
3 Pathanamthitta 390 43.28 66 3.97 .. .. 6 15.48
4 Alappuzha 340 322.56 303 44.24 .. .. 3 16.18
5 Kottayam 226 19.05 207 25.53 7 0.40 75 19.07
6 Idukki 65 2.81 25 0.71 .. .. 47 4.03
7 Ernakulam 719 233.17 201 26.94 54 245.94 72 13.98
8 Thrissur 959 240.68 305 111.77 3 40.48 228 507.72
9 Palakkad 629 176.84 334 145.59 6 32.25 60 759.18
10 Malappuram 545 38.14 275 15.43 7 2.04 45 6.10
11 Kohikkode 96 13.53 264 17.64 11 2.10 24 1.11
12 Wayanad 28 5.16 5 2.08 22 10.66 61 5.44
13 Kannur 292 19.86 312 35.77 9 97.13 35 90.01
14 Kasargode 264 11.43 137 4.71 50 25.94 145 1244.28
Total 6848 1486.69 2689 479.37 185 492.49 852 2834.38

15
Kerala inland Fisheries Statistics 2013 Department of Fisheries
Table-5 DETAILS OF RESERVOIRS OF KERALA
District Block Panchayat Sl. No Name of the Reservoir Ownership
Name & Type of Barrier
constructed
Area (MWL)
Ha. Present Use
1 2 3 4 5 6 7 8 9
Thiruvananthapuram
Perunkadavila Kallikkadu 1 1 Neyyar Dam P.W.D Masonry 1500 Irrigation
Nedumangadu Aruvikkara 2 2 Aruvikkara Dam Water Authority Masonry 258 Water supply
Vellanadu Vithura 3 3 Peppara Dam Water Authority Masonry 582 Water supply & Power generation
Total 2340
Kollam Anchal Thenmala 4 1 Thenmala Dam State Govt. (KIP) Masonary 2590 Hydro Electric, Irrigation, Fish Culture
Total 2590
Pathanamthitta
Ranny Vadasserikara 5 1 Maniyar Minor Irrigation Department (P.I.P) Earthern 110
Seethathode 6 2 Pampa Electricity Board Masanry 570 Power generation
7 3 Kakki Electricity Board Concrete 1800
8 4 Gavi & Kullar Dam Kerala Forest Development & KSEB Earthern 25 Irrigation
Total 2505
Idukky
Adimali Konnathady 9 1 Ponmudi Dam K.S.E.B Concrete 260 Hydal Project
10 2 Neriyamangalam K.S.E.B Concrete 413 Hydal Project
11 3 Edamalayar Dam K.S.E.B Concrete 350 Hydal Project
Vellathooval 12 4 Chenkulam Dam K.S.E.B Concrete 33 Hydal Project
13 5 Kallarkutty Dam K.S.E.B Concrete 58 Hydal Project
Devikulam Munnar 14 6 Mattupetti Dam K.S.E.B Concrete 324 Hydal Project
Devikulam 15 7 Gundala Dam K.S.E.B Concrete 230 Hydal Project

16
Kerala Inland Fisheries statistics- 2013 Department of Fisheries
1 2 3 4 5 6 7 8 9
Chinnakanal 16 8 Munnar Head workers Dam K.S.E.B Concrete 250 Mini Diversion.
Idukky (cont’d) 17 9 Anayirankal Dam K.S.E.B Earthen 433 Diversion
Nedumkandam Nedumkandam 18 10 Kallar Division Dam K.S.E.B Concrete 220 Diversion
Idukki Kanjikuzhy 19 11 Lower Periyar Dam K.S.E.B Concrete 150 Hydal Project
20 12 Idukki Arch Dam K.S.E.B Concrete 6160 Hydal Project
21 13 Kulamavu Dam K.S.E.B Storage
22 14 Cheruthoni Dam K.S.E.B
Kattappana Erattayar 23 15 Erattayar Dam K.S.E.B 200
Thodupuzha Muttom 24 16 Malankara Dam MVIP concrete 120 Irrigation
Azhutha Kumily 25 17 Mullaperiyar Dam Kerala Forest Dept. surky 660 Irrigation
Total 9861
ERM Kothamangalam Pindimana 26 2 Bhothathan Kettu Irrigation Department concrete 608 Irrigation& fish culture
Total 608
Thrissur
Chalakkudy Athirappilly 27 1 Peringalkuthu dam K.S.E.B 280 Eletricity
Chalakkudy Athirappilly 28 2 Sholayar K.S.E.B 870 Eletricity
Kodakara Varantharappily 29 3 Chimminidam Irrigation Department 1000 irrigation
Puzhakkal Mulamkunnathukavu 30 4 Poomala Irrigation Department 75 irrigation
Ollukkara Pananchery 31 5 Peechi Irrigation Department 1200 irrigation
Wadakkanchery Thekkumkara 32 6 Pathazhakkunnu Irrigation Department 14 irrigation
Wadakkanchery Thekkumkara 33 7 Vazhani Irrigation Department 255 irrigation
Wadakkanchery Mullurkara 34 8 Asurankundu Irrigation Department 12 irrigation
Total 3706
Palakkad
Malampuzha Malampuzha 35 1 Malampuzha dam Irrigation Department Masonry 2313 Irrigation& fish culture
Alathur Vandazhy 36 2 Mangalam Dam Irrigation Department Earthern 393 irrigation

17
Kerala Inland Fisheries statistics- 2013 Department of Fisheries
1 2 3 4 5 6 7 8 9
Palakkad (cont’d)
Kollamcode Muthalamada 37 3 Meenkara dam Irrigation Department Masonry 259 Irrigation& fish culture
Kollamcode Muthalamada 38 4 Chulliyar Dam Irrigation Department Masonry 159
Nenmmara Nenmmara 39 5 Pothundy dam Earthern 363
Malampuzha Puthussery 40 6 Walayar Dam Masonry 289
Kollamcode Muthalamada 41 7 parambikulam Dam Forest Department stone 2092 Water released to Tamilnadu
42 8 Thunakkadavu Dam 283
Mannarkkad Kanjirappuzha 43 9 Kanjirappuzha Dam Irrigation Department Cement 512 Irrigation& fish culture
Nenmara Melorkavu 44 10 Cheramangalam PWD Irrigation ,wing Masonry 200 irrigation
Total 6863
Kozhicode
Kunnumel Kuttiyadi 45 1 Kakkayam K.S.E.B Concrete 1070 hydelproject
46 2 Peruvannamuzhi Irrigation Concrete 1052 Irrigation
Total 2122
Wayanad
Bathery Meenangadi, Ambalavayal, Mopainanad,Muttil
47 1 Karapuzha Reservoir Irrigation Department Earthern dam 1660 Irrigation,Fish Culture
Kalpatta Padinjaratara/ Thariod 48 2 Banasurasagar Reservoir KSEB Earthern dam 1277 Augmentation of Kuttyadi Project,Fish
Culture Total 2937
Kannur Irriti Payam/Keezhur/ Chavassery 49 1 Pazhashi Dam Irrigation Dept Concrete 648 Irrigation & Domestic Use
Total 648
Grand Total 34180

18
Kerala inland Fisheries Statistics 2013 Department of Fisheries
Table 6 STATE WISE INLAND WATER RESOURCE IN INDIA
Sl. No State/UTs
Length of Rivers
&Canals (Kms)
Area of Reservoirs
(Lakh Hect.)
Area under Tanks & Ponds
(Lakh Hect.)
Beels, Oxblow & Derelicts water (Lakh
Hect.)
Brackish water (Lakh
Hect.)
1 Andhra Pradesh 11514 2.24 5.17 0.00 0.79 2 Arunachal Pradesh 2000 0.00 2.76 0.42 0.00 3 Assam 4820 0.02 0.23 1.10 0.00 4 Bihar 3200 0.60 0.95 0.05 0.00 5 Goa 250 0.03 0.03 0.00 0.00 6 Gujarath 3865 3.48 0.22 0.12 3.76 7 Haryana 5000 0.00 0.10 0.10 0.00 8 Himachal Pradesh 3000 42.00 0.01 0.00 0.00 9 Jammu & Kashmir 27781 0.07 0.17 0.06 0.00 10 Karnataka 9000 2.11 2.90 0.00 0.08 11 Kerala 3092 0.43 0.28 2.43 0.65 12 Madhya Pradesh 20661 2.94 1.19 0.00 0.10 13 Maharashtra 16000 2.79 0.59 0.00 0.00 14 Manipur 3360 0.01 0.05 0.04 0.00 15 Meghalaya 5600 0.08 0.02 0.00 0.00 16 Mizoram 1395 0.00 0.02 0.00 0.00 17 Nagaland 1600 0.17 0.50 0.00 0.00 18 Orrissa 4500 2.56 1.14 1.80 4.17 19 Punjab 15270 0.00 0.07 0.00 0.00 20 Rajastan 5290 0.00 1.80 0.00 0.00 21 Sikkim 900 1.20 0.00 0.03 0.00 22 Tamilnadu 7420 0.52 0.56 0.07 0.56 23 Thripura 1200 0.05 0.13 0.00 0.00 24 Uttar Pradesh 31200 1.50 1.62 1.33 0.00 25 West Bengal (P) 2526 0.17 2.76 0.42 2.10 26 Anaman& Nicobar 115 0.01 0.03 0.00 0.37 27 Chandigadh 2 0.00 0.00 0.00 0.00 28 Delhi 150 0.04 0.00 0.00 0.00 29 Lakshadweep 0 0.00 0.00 0.00 0.00 30 Pondichery 247 0.00 0.00 0.01 0.01 31 Dadra & Nagar Haveli 54 0.05 0.00 0.00 0.00 32 Daman & Diu 12 0.00 0.00 0.00 0.00
Total 191024 63.07 23.3 7.98 12.59

19
Kerala Inland Fisheries statistics- 2013 Department of Fisheries
Table-7(A)
DISTRICT WISE DISTRIBUTION OF FISHERMEN POPULATION (INLAND) IN KERALA FOR 2010-11 & 2011-12 (ESTIMATED)
Sl. No Name of District
2010-2011 2011-2012 Male female Children Total Male Female Children Total
1 Thiruvananthapuram 505 585 500 1590 439 509 434 1382 2 Kollam 15203 14312 9179 38694 13215 12440 7979 33634 3 Pathanamthitta 1049 911 424 2384 912 792 369 2073 4 Alappuzha 28175 27002 14526 69703 24491 23472 12627 60590 5 Kottayam 11057 10496 6540 28093 9611 9124 5685 24420 6 Idukki 301 304 190 795 261 264 166 691 7 Ernakulam 26756 26168 18899 71823 23258 22746 16428 62432 8 Thris sur 8938 8172 5153 22263 7769 7104 4479 19352 9 Palakkad 974 957 983 2914 847 832 855 2534 10 Malappuram 2037 1774 960 4771 1771 1542 834 4147 11 Kozhikkode 4705 4957 3854 13516 4090 4309 3350 11749 12 Wayanad 85 92 88 265 74 80 76 230 13 Kannur 2725 2882 1549 7156 2369 2505 1346 6220 14 Kasaragode 444 420 195 1059 386 366 170 922
Total 102954 99032 63040 265026 89493 86085 54798 230376
Table-7(B)
DISTRICT WISE DISTRIBUTION OF FISHERMEN POPULATION (INLAND) IN KERALA DURING 2012-13 (ESTIMATED)
Sl. No Name of District 2012-13
Male Female Children Total
1 Thiruvananthapuram 441 511 437 1389 2 Kollam 13282 12503 8019 33804 3 Pathanamthitta 917 796 371 2084 4 Alappuzha 24614 23589 12690 60893 5 Kottayam 9659 9169 5714 24542 6 Idukki 263 265 167 695 7 Ernakulam 23374 22860 16510 62744 8 Thrissur 7808 7139 4501 19448 9 Palakkad 851 837 859 2547 10 Malappuram 1780 1550 838 4168 11 Kozhikkode 4110 4331 3367 11808 12 Wayanad 75 80 77 232 13 Kannur 2381 2518 1353 6252 14 Kasaragode 388 367 171 926
Total 89943 86515 55074 231532

20
Kerala Inland Fisheries statistics- 2013 Department of Fisheries
Table-8(A)
DISTRICT WISE BREAK UP OF ACTIVE FISHERMEN POPULATION (INLAND) 2010-2011 & 2011-12
Sl. No Name of District
2010-11 No. of family
2011-12 No. of family Population (No.)
Population (No.) Male Female Total Male Female Total
1 Thiruvananthapuram 0 0 0 0 0 0 2 Kollam 8174 1525 9699 6198 8171 1567 9738 6231 3 Pathanamthitta 292 292 162 268 12 280 275 4 Alappuzha 8857 3399 12256 7565 11939 3770 15709 11516 5 Kottayam 4394 2140 6534 1979 4258 2137 6395 3407 6 Idukki 153 12 165 158 158 128 7 Ernakulam 9719 1685 11404 19450 9950 1892 11842 9995 8 Thrissur 1050 289 1339 7599 990 100 1090 1066 9 Palakkad 479 479 463 467 467 454
10 Malappuram 1670 103 1773 1675 1762 100 1862 1560 11 Kozhikkode 1917 22 1939 1853 1942 18 1960 697 12 Wayanad 0 0 0 0 0 0 0 0 13 Kannur 1418 497 1915 1772 1471 503 1974 1831 14 Kasaragode 408 78 486 379 417 76 493 386
Total 38531 9750 48281 49095 41793 10175 51968 37546
Table 8-(B) DISTRICT WISE BREAK UP OF ACTIVE FISHERMEN POPULATION (INLAND) 2012-2013
Sl. No Name of District Population (No.) Total family
Male Female Total 1 Thiruvananthapuram 76 11 87 70 2 Kollam 6960 1407 8367 6749 3 Pathanamthitta 257 12 269 269 4 Alappuzha 3290 62 3352 2893 5 Kottayam 4323 2003 6326 3280 6 Idukki 188 3 191 164 7 Ernakulam 9067 1558 10625 9129 8 Thrissur 971 103 1074 1047 9 Palakkad 462 4 466 448
10 Malappuram 1726 96 1822 1480 11 Kozhikkode 1914 17 1931 669 12 Wayanad 0 0 0 0 13 Kannur 1480 492 1972 1877 14 Kasaragode 427 74 501 394
Total 31141 5842 36983 28469 Source: Kerala Fishermen welfare Fund Board
21
Kerala Inland Fisheries statistics- 2013 Department of Fisheries
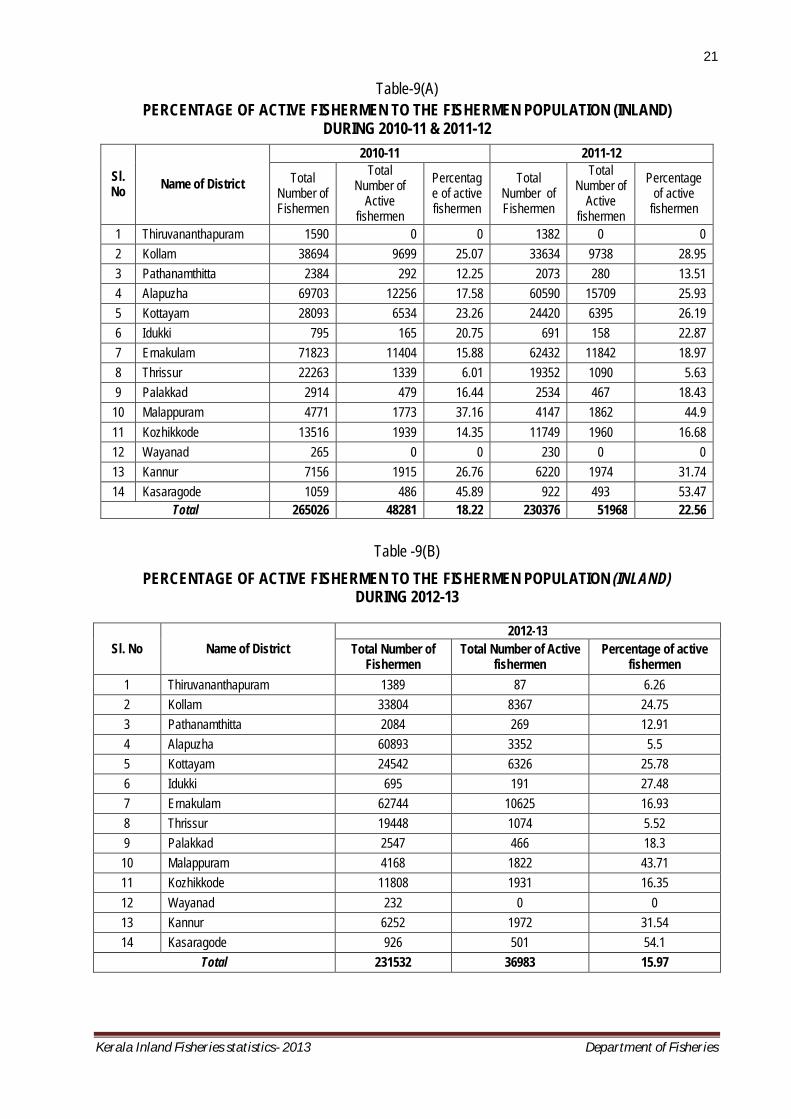
Table-9(A) PERCENTAGE OF ACTIVE FISHERMEN TO THE FISHERMEN POPULATION (INLAND)
DURING 2010-11 & 2011-12
Table -9(B) PERCENTAGE OF ACTIVE FISHERMEN TO THE FISHERMEN POPULATION (INLAND)
DURING 2012-13
Sl. No Name of District 2012-13
Total Number of Fishermen
Total Number of Active fishermen
Percentage of active fishermen
1 Thiruvananthapuram 1389 87 6.26 2 Kollam 33804 8367 24.75 3 Pathanamthitta 2084 269 12.91 4 Alapuzha 60893 3352 5.5 5 Kottayam 24542 6326 25.78 6 Idukki 695 191 27.48 7 Ernakulam 62744 10625 16.93 8 Thrissur 19448 1074 5.52 9 Palakkad 2547 466 18.3 10 Malappuram 4168 1822 43.71 11 Kozhikkode 11808 1931 16.35 12 Wayanad 232 0 0 13 Kannur 6252 1972 31.54 14 Kasaragode 926 501 54.1
Total 231532 36983 15.97
Sl. No Name of District
2010-11 2011-12
Total Number of Fishermen
Total Number of
Active fishermen
Percentage of active fishermen
Total Number of Fishermen
Total Number of
Active fishermen
Percentage of active
fishermen
1 Thiruvananthapuram 1590 0 0 1382 0 0 2 Kollam 38694 9699 25.07 33634 9738 28.95 3 Pathanamthitta 2384 292 12.25 2073 280 13.51 4 Alapuzha 69703 12256 17.58 60590 15709 25.93 5 Kottayam 28093 6534 23.26 24420 6395 26.19 6 Idukki 795 165 20.75 691 158 22.87 7 Ernakulam 71823 11404 15.88 62432 11842 18.97 8 Thrissur 22263 1339 6.01 19352 1090 5.63 9 Palakkad 2914 479 16.44 2534 467 18.43
10 Malappuram 4771 1773 37.16 4147 1862 44.9 11 Kozhikkode 13516 1939 14.35 11749 1960 16.68 12 Wayanad 265 0 0 230 0 0 13 Kannur 7156 1915 26.76 6220 1974 31.74 14 Kasaragode 1059 486 45.89 922 493 53.47
Total 265026 48281 18.22 230376 51968 22.56

22
Kerala Inland Fisheries statistics- 2013 Department of Fisheries
Table-10 INLAND FISHERMEN POPULATION (estimated)
from 2010-11 to 2012-13
Sl.No District No. of Villages
Population (estimated) 2010-11 2011-12 2012-13
1 Thiruvananthapuram 4 1590 1382 1389 2 Kollam 26 38694 33634 33804 3 Pathanamthitta 3 2384 2073 2084 4 Alappuzha 24 69703 60590 60893 5 Kottayam 8 28093 24420 24542 6 Idukki 1 795 691 695 7 Ernakulam 15 71823 62432 62744 8 Thrissur 8 22263 19352 19448 9 Palakkad 2 2914 2534 2547 10 Malappuram 6 4771 4147 4168 11 Kozhikode 8 13516 11749 11808 12 Wayanad 1 265 230 232 13 Kannur 5 7156 6220 6252 14 Kasaragode 2 1059 922 926
Total 113 265026 230376 231532
Table-11 LIST OF INLAND FISHING VILLAGES
Sl No Name of District Name of Villages (1) (2) (3) I
Thiruvananthapuram (4 Villages)
1 Attupuram 2 Hariharapuram 3 Chirayinkeezh 4 Vellayani
II
Kollam (26 Villages)
5 Prayar 6 Sastamkottah 7 Puthukkadu 8 Mangadu 9 Koyivila
10 Kadavoor 11 Aravila 12 Neendakara 13 Prakulam 14 Perumon 15 Mundakkal 16 Sinkarapally 17 Chavara South 18 Chavara North 19 Koduvila 20 Kumbalam 21 Muttom

23
Kerala Inland Fisheries statistics- 2013 Department of Fisheries
22 Chemmakkad 23 Kanjirakkodu 24 Manalikkadu 25 Kuripzha East 26 Mukkadu 27 Kottiyam 28 Padappakkara 29 Ayiramthengu 30 Arinelloor
III Pathanamthitta (3 Villages)
31 Paramala 32 Thiruvalla 33 Maramon
V
Alappuzha (24 Villages)
34 Kayamkulam 35 Kochiyard Jetty 36 Chodatheruvu 37 Payippadu 38 Karuvatta 39 Chenkole 40 Muhamma 41 Thirunellur 42 Panavally 43 Arukutty 44 Perumpalam 45 Aroor 46 Thuravoor (North) 47 Thuravoor (South) 48 Vayalar (East) 49 Mannar Sangham 50 Thalavady 51 Noornadu 52 Eraviperoor 53 Marakkattu Ward 54 Ramamkary 55 Kavalam 56 Thevarvattom 57 Thanneermukkom
IV
Kottyam (8 Villages)
58 Changanassery 59 Kumarakom 60 Thiruvarpu 61 Vaikom (Town) 62 Thalayazhom 63 Chempu 64 Kaduthuruthy 65 Kottayam
VI Idukki (1 Village) 66 Idukki
67 Kadamakudi 68 Ezhikkara 69 Mulavukadu

24
Kerala Inland Fisheries statistics- 2013 Department of Fisheries
VII
Ernakulam (15 Villages)
70 Cheranelloor 71 Maradu 72 Kumpalam 73 Udayamperoor 74 Ernakulam (West) 75 Poonithura 76 Nedamagramam 77 Ernakulam (East) 78 Kumpalangi 79 Palluruthy 80 Vadakkekkara 81 Puthenvelikkara
VIII
Thrissur (8 Villages)
82 Anappuzha 83 Pullute 84 Poyya 85 Puthenchira 86 Nedupuzha 87 Venkidangu 88 Karalam 89 Velloor
IX Palakkad (2 Villages)
90 Muthalamada 91 Palakkadu
X
Malappuram (6 Villages)
92 Kadavonadu (Ponnani) 93 Gomughom 94 Purathoor 95 Kutturapuzha (Poorapuzha) 96 Palathungal 97 Kadalundipuzha
XI
Kozhikode ( 8 Villages)
98 Karuvanthuruthy 99 Cheruvannoor
100 Eranjikal 101 Vengalam 102 Vellur 103 Teragi 104 Ullookadavu 105 Akalappuzha
XII Wayanad 106 Vythiri
XIII
Kannur (5 Villages)
107 Kurinjimangalam 108 Ezham 109 Kattampally 110 Mandalloor 111 Eranholi
XIV Kasaragode (2 Villages)
112 Peelikode 113 Thrikkaripur

25
Kerala Inland Fisheries statistics- 2013 Department of Fisheries
Table-12 FISHERIES FARMS & HATCHERIES IN THE PUBLIC SECTOR
Sl.no Name of Hatcheries/Farms Name of District
I. Hatcheries
a) Fisheries Department
1 Neyyar Dam ,National Fish Seed Farm Thiruvananthapuram
2 FFDA Hatchery, Neendakara Kollam
3 Fisheries Complex, Pannivelichira Pathanamthitta
4 National Fish Seed Farm, Polachira Pathanamthitta
5 Government Model Fish Farm,Pallam Kottayam
6 Regional Shrimp Hatchery, Azheekode Thrissur
7 National Fish Seed Farm, Malampuzha Palakkad
b) Hatchery of ADAK
8 ADAK Hatchery, Odayam, Varkala Thiruvananthapuram
c) Hatchery of FIRMA
9 FIRMA Hatchery Wayanad
d) Hatchery of Matsyafed
10 Fresh water Prawn Hatchery, Kaipamangalam Thrissur
11 Prawn Hatchery, Veliyamcode Malappuram
12 Prawn Hatchery, Kannur Kannur
13 Prawn Hatchery, Thirumullavaram Kollam
d) Hatchery of Fisheries University
14 Prawn Hatchery at Fisheries College, Panangad Eranakulam
II Farms
II a) Farms of the Department
1 Ullanam fish seed farm, Parappanangadi (Handed over to FIRMA as satellite farm of Kavvil) Malappuram
2 Kadappuram Fish Farm Thrissur
3 Peechi Dam ( Rearing farm) Thrissur
4 Chulliyar Dam ( Rearing farm) Palakkad
5 Walayar Dam ( Rearing farm) Palakkad
6 Mangalam Dam ( Rearing farm) Palakkad
7 Pothundi Dam ( Rearing farm) Palakkad
8 Meenkara Dam ( Rearing farm) Palakkad
9 Society Farm Kollam
10 Eastuarine Research Centre Kollam
11 Pulikeezh Fish Farm (not functioning) Pathanamthitta
12 Society farm, Kidangalloor (not functioning) Pathanamthitta

26
Kerala Inland Fisheries statistics- 2013 Department of Fisheries
13 Edathua farm Alappuzha
14 Eda kochi Fish Farm Ernakulam
15 Pookode Fish Farm Wayanad
16 Andalloor Brackish Water Farm, Thalassery (not functioning) Kannur
17 Palayad Brackish Water Farm, Thalassery (not functioning) Kannur
b) Farms of ADAK
18 Model Shrimp farm and Training centre, Poyya Thrissur
19 Fish Farm, Eranholi Kannur
20 Njarakkal farm Ernakulam
21 Ayiramthengu Government Fish farm Kollam
c) Farms of Matsyafed
22 Palikari fish farm Kottayam
23 Brackish water fish farm, Malippuram Ernakulam
24 Brackish water fish farm, Njarakkal Ernakulam
Table-13 PUBLIC & PRIVATE SECTOR HATCHERIES IN KERALA
Sl. No. District
Name of farm/hatchery
PUBLIC SECTOR PRIVATE SECTOR
1 Trivandrum 1 FFDA Hatchery, Neyyardam
Nil 2 ADAK Hatchery, Odayam
2 Kollam 1 BFFDA Hatchery, Neendakara
1 St.John Bosco Hatchery, Thirumullavaram 2 Matsyafed hatchery, Thirumullavaram
3 Pathanamthitta 1 Fisheries Complex, Pannivelichira
2 NFSF, Polachira
4 Alappuzha Nil
1 Natures Way Cherthala
2 Pamba hatchery, Alappuzha
3 Pulimughom Hatchery, Thakazhy
4 Rearing Farm. Nooranadu
5 Bastins Hatchery, Pallithidu
6 West- Cost Hatchery, Alappuzha
7 Travancore Hatchery, Thottappally
8 Maveli Hatchery, Pathiyamkara
5 Kottayam 1 Pallom Fish Farm Nil
6 Idukki Nil Nil

27
Kerala Inland Fisheries statistics- 2013 Department of Fisheries
7
Ernakulam
1
Fisheries College Panangad
1 Aqua Plaza Cherai
2 Abad Enterprises, Kannamali
3 Kalipparambil Tiger Shrimp Hatchery Chellanam
4 Kochin Aqua Hatchery Nayarambalam
5 Prakrithy Aquatics P.Ltd, Aluva
6 Kambivelikkakom Hatchery, Thiruvankulam
8
Thrissur
1
Prawn Hatchery, Kaipamangalam (Matsyafed)
1 Cresent Hatchery, Meathala
2 Water Fry hatchery, West Vamballoor
3 Sea view Hatchery, Thalikulam
2
Regional Shrimp Hatchery , Azhikode
4 Pattani Fisheries, Marathakara
5 Rosan Fisheries, Marathakara
6 Rency Hatchery, Mathilakam
7 Queens Fisheries Vemalloor
8 Peari Aqua Hatchery,Vemballoor
9 Divya Prabha, Kara
10 Vyasa Hatchery, Kaipamangalam
9
Palakkad
1
NFSF Malampuzha
1 Aqua Farm, Thenari
2 Chambath Fisheries, Polpully
3 MEFCO Farms(Society)
4 Santhosh Fisheries, Kollancode
5 King Fisheries, Kollancode
10
Malappuram
1 Ullanam Fish Farm (FFDA) Nil
2 Veliyamcode(Matsyafed)
11 Kozhikode
Nil 1 Kallanode Fish seed Farm,
Peruvannamoozhy 12 Wayanad 1 FIRMA Hatchery, Pookode Nil
13 Kannur 1 Matsyafed Hatchery, Moplabay 1 Pazhassiraja Hatchery , Eritty
14 Kasargode Nil Nil

28
Kerala Inland Fisheries statistics- 2013 Department of Fisheries
Table -14 DETAILS OF INLAND FISH LANDING CENTERS
Sl No District Taluk Panchayath Landing centre
Major Landing Centres
1
Kollam Kollam
Perayam 1 Onambalam
2 Thrikkadavur 2 Kureepuzha
3 Thrikkaruva 3 Manalikkada
4 Thrikkaruva 4 Sambranikodi
5 Thrikkaruva 5 Vadakkekkara
6 Karunagappally Thevalakkara 6 Kottapuram Kadavu
7
Eranakulam
Kochi
Elamkunnapuzha 1 Kalamukku
8 Elamkunnapuzha 2 Murikkumpadam
9 Kochi corporation 3 Thoppumpady
10 Kochi corporation 4 Fort kochi market
11 Njarakal 5 Manjanakkad jetty
12 Pallipuram 6 Munambam Mini harbour
13 Kanayannur
Kochi corporation 7 Chambakkara
14 Tripunithura 8 South paravur angadi stop
Minor Landing Centres
1
Kollam
Kollam Thrikkaruva 1 Ashtamudi
2
Karunagappally
Panmana 2 Kannittakadavu
3 Panmana 3 Kattilkadavu
4 Thevalakkara 4 Cherikadavu
5
Alappuzha
Ambalappuzha Alappuzha 1 Punnamadajettykadavu
6
Chengannur
pandanad 2 Pandanad
7 Mannar 3 Pavukkara
8 Budhannur 4 Ennakkattu
9
Karthikappally
Devikulangara 5 Muttathumannel Kadavu
10 Arattupuzha 6 Vettathukadavu
11 Arattupuzha 7 Kanakakkunnu
12 Veeyapuram 8 Paippad
13 Veeyapuram 9 Veeyapuram
14 Cheruthana 10 Karichal
15 Mavelikkara Chennithala-thripperuthra 11 Prayikkara
16 Mavelikkara
Chennithala-thripperuthra 12 Erakkadavu
17 Chennithala-thripperuthra 13 Munduvelikkadavu

29
Kerala Inland Fisheries statistics- 2013 Department of Fisheries
18
Alappuzha (cont’d) Sherthala
Thanneermukkam 14 Thanneermukkam Kadavu
19 Thanneermukkam 15 Kasnnankkarajetty kadavu
20 Thanneermukkam 16 Puthanangadi Kadavu
21 Muhamma 17 Depokadavu
22 Muhamma 18 S N Kavalayku kezhzkku
23 Muhamma 19 Muhamma panchayathu kadavu
24 Muhamma 20 Kovilakom Resort kadavu
25 Muhamma 21 Perumthuruthukadavu
26 Muhamma 22 Ambalakadavu
27 Muhamma 23 Kalluchirakadavu
28 Muhamma 24 Madayanthodukadavu
29 Muhamma 25 Shanmughanjettykadavu
30 Muhamma 26 Purity resort kadavu
31 Panavally 27 Panavally
32 Perumbalam 28 Perumbalam
33 Pallippuram 29 Makkekadavu
34 Pallippuram 30 Thavanakkadavu
35 Aroor 31 Arukkutty
36 Pathanamthitta Thiruvalla Kadapra 1 Kadapra
37
Kottayam
Vaikom Chempu 1 Murinjapuzha
38 Vaikom Udayanapuram 2 Nerekadavu
39 Vaikom Vaikom Muncipality 3 Kolothum Kadavu
40 Idukki 1 Mullakkanam
41
Eranakulam
Kochi
Nayarambalam 1 Nedungad palam
42 Kochi corporation 2 Edakochi
43 Kochi corporation 3 Palluruthy
44 Kochi corporation 4 Thoppumpady fishing harbour
45 Kochi corporation 5 Perumpadappu
46 Kochi corporation 6 Mattanchery
47 Nayarambalam 7 Nayarambalam
48 Njarakal 8 Njarakkal
49 Edavanakkad 9 Edavanakkad
50 Pallipuram 10 Cheray Karuthala
51 Pallipuram 11 Kambanikkadavu
52 Pallipuram 12 Raktheswary beach road
53
paravur
Vadakethara 13 Kunjittai
54 Ezhikkara 14 Kandekkavu
55 Ezhikkara 15 Chathanad
56 Varappuzha 16 Devaswam padam

30
Kerala Inland Fisheries statistics- 2013 Department of Fisheries
57
Eranakulam (cot’d) Kanayannur
Tripunithura 17 Thevara
58 Cheranelloore 18 Chittur fery
59 Udayam perur 19 Udayam perur
60 Kochi corporation 20 Manassery
61 Kochi corporation 21 Pachalam
62
Thrissur
Kodungallur
Kodungalur Muncipality 1 Anapuzha
63 Mala 2 Mala
64 Poyya 3 Poyya
65 Chavakkad Venkidangu 4 Kodamukku
66 Thrissur
Thrissur corporation 5 Nedupuzha
67 Pananchery 6 Peechi dam site
68 Thalappily Thekkumkara 7 Vazhani dam site
69 MLPM Ponnani Edakkad 1 Ayilakkad
70
Kozhikode
Koyilandi
Payyoli 1 Murad
71 Chemanchery 2 Korappuzha
72 Ullyery 3 Kanayamcode Bridge
73 4 Kuniyilkadavu palam
74
Kozhikode
Faroque 5 Odassery
75 Perumanna 6 Manakkadavu
76 Faroque 7 Petta(Faroqu)
77 Chelannur 8 Mukkathu thazham
78 Thalakkulathur 9 Pulikkal Kadavu
79
Kannur
Kannur Madai 1 Chempallikundu
80 Thalassery Pinarai 2 Pinarai(Kadiyil)
81 Thaliparamba Payyannur 3 Kavvayi
82 Thaliparamba Ramanthali 4 Kovvapuram
83 Thaliparamba Pattuvam 5 Pattuvam
84 KSRD Hosdurg Padne 1 Padne

31
Kerala Inland Fisheries statistics- 2013 Department of Fisheries
Table -15 SPECIES WISE INLAND FISH LANDINGS IN KERALA 2010-11 to 2012-13
(Qty. in Tonnes)
Sl. No. Name of Fish 2010-11 2011-12 2012-13
1 Prawn 22607 21270 23812
2 Etroplus 4941 5526 6290
3 Murrels 4623 4716 5174
4 Mullets 4906 5007 5540
5 Cat fish 5301 5409 6059
6 Jew fish 3046 3109 3397
7 Tilapia 8584 9200 10459
8 Labeo – fimbriatus 2313 2360 2643
9 Barbus 573 585 656
10 Mrigal 6017 8831 9317
11 Crabs 1006 1086 1323
12 Common carps 8508 9420 8818
13 Catla 10245 16558 17861
14 Chanos 488 498 558
15 Eels 70 71 79
16 Labeo - Rohitha 9316 15883 16998
17 Mussel 23172 23269 21231
18 Edible Oyster 1540 1545 1750
19 Miscellaneous 3959 5688 7133
TOTAL 121215 140031 149098

32
Kerala Inland Fisheries statistics- 2013 Department of Fisheries
Table-16 SPECIES WISE COMPOSITION OF INLAND FISH LANDINGS IN KERALA
(2009-10 to 2012-13)
Sl.No Species Inland fish landings in MT
2009-10 % 2010-11 % 2011-12 % 2012-13 %
1 Prawn 20031 17.14 22607 18.65 21270 15.19 23812 15.97
2 Etroplus 4858 4.16 4941 4.08 5526 3.95 6290 4.22
3 Murrels 4544 3.89 4623 3.81 4716 3.37 5174 3.47
4 Mullets 4821 4.13 4906 4.05 5007 3.58 5540 3.72
5 Cat fish 5211 4.46 5301 4.37 5409 3.86 6059 4.06
6 Jew fish 2994 2.56 3046 2.51 3109 2.22 3397 2.28
7 Tilapia 8440 7.22 8584 7.08 9200 6.57 10459 7.01
8 Labeo fimbriatus 2273 1.95 2313 1.91 2360 1.68 2643 1.77
9 Barbus 563 0.48 573 0.47 585 0.42 656 0.45
10 Mrigal 6479 5.55 6017 4.96 8831 6.31 9317 6.25
11 Crabs 988 0.85 1006 0.83 1086 0.78 1323 0.89
12 Common carps 8633 7.39 8508 7.02 9420 6.73 8818 5.91
13 Catla 10229 8.76 10245 8.45 16558 11.82 17861 11.98
14 Chamos 480 0.41 488 0.4 498 0.36 558 0.37
15 Eels 69 0.06 70 0.06 71 0.05 79 0.05
16 Labeo Rohitha 8486 7.26 9316 7.69 15883 11.34 16998 11.4
18 Mussel 22395 19.17 23172 19.12 23269 16.62 21231 14.24
19 Edible Oyster 1500 1.28 1540 1.27 1545 1.1 1750 1.17
20 Miscellaneous 3842 3.28 3959 3.27 5688 4.05 7133 4.79
Total 116836 100 121215 100 140031 100 149098 100

33
Kerala Inland Fisheries statistics- 2013 Department of Fisheries
Table-17
SPECIES WISE QUARTER WISE INLAND FISH PRODUCTION IN KERALA DURING 2010 & 2011
Sl. No Name of Species
2010 2011
Qtr I Qtr II Qtr III Qtr IV Total Qtr I Qtr II Qtr III Qtr IV Total
1 Prawn 4040 8710 4883 3673 21306 5341 7828 4975 3685 21829
2 Etroplus 1398 1178 949 1417 4942 1397 1240 1217 1422 5276
3 Murrels 1305 1078 923 1315 4621 1307 1144 940 1319 4710
4 Mullets 1341 1161 993 1409 4904 1343 1232 1011 1414 5000
5 Cat fish 1486 1243 1064 1506 5299 1488 1319 1084 1511 5402
6 Jew fish 866 727 574 878 3045 867 772 585 881 3105
7 Tilapia 2540 2002 1597 2442 8581 2543 2125 1627 2450 8745
8 Labeo-fimbriatus 647 544 466 655 2312 648 577 475 657 2357
9 Barbus 160 135 115 163 573 160 143 117 164 584
10 Mrigal 2732 1439 1096 1502 6769 1980 2856 1118 1507 7461
11 Crabs 332 197 247 230 1006 332 206 257 231 1026
12 Common crabs 3451 2582 1477 2103 9613 2346 3447 1505 2110 9408
13 Catla 4715 3369 1570 2240 11894 3066 5551 1601 2247 12465
14 Chanos 138 107 105 138 488 138 114 107 138 497
15 Eels 21 18 14 17 70 21 19 14 17 71
16 Labeo-Rohitha 3234 2535 1495 2136 9400 3150 5540 1527 2143 12360
17 Mussel 0 3067 0 20105 23172 0 0 3100 20169 23269
18 Edible Oyster 0 0 0 1540 1540 0 0 0 1545 1545
19 Miscellaneous 1076 997 855 986 3914 1121 1531 871 989 4512
TOTAL 29482 31089 18423 44455 123449 27248 35644 22131 44599 129622

34
Kerala Inland Fisheries statistics- 2013 Department of Fisheries
Table-18
SPECIES WISE QUARTER WISE INLAND FISH PRODUCTION IN KERALA DURING 2012 & 2013
Sl No Name of Species
2012 2013
Qtr I Qtr II Qtr III Qtr IV Total Qtr I Qtr II Qtr III Qtr IV Total
1 Prawn 4782 8819 5060 3696 22357 6237 7479 5212 3759 22687
2 Etroplus 1647 1314 1005 1438 5404 2533 1473 1023 1473 6502
3 Murrels 1313 1213 935 1323 4784 1703 1286 952 1346 5287
4 Mullets 1350 1306 972 1418 5046 1844 1385 989 1442 5660
5 Cat fish 1495 1398 1103 1516 5512 2042 1482 1123 1542 6189
6 Jew fish 871 818 595 884 3168 1100 867 606 889 3462
7 Tilapia 2998 2252 1655 2458 9363 4094 2388 1684 2490 10656
8 Labeo-fimbriatus 651 612 483 659 2405 889 649 492 670 2700
9 Barbus 161 152 119 165 597 220 161 121 168 670
10 Mrigal 3350 2355 1136 1512 8353 4314 3465 1426 1538 10743
11 Crabs 392 218 315 255 1180 535 306 608 259 1708
12 Common crabs 2358 1941 1530 2127 7956 3220 2058 1557 2163 8998
13 Catla 7159 4251 1626 2254 15290 9730 7035 2213 2303 21281
14 Chanos 139 121 109 138 507 190 128 111 140 569
15 Eels 21 19 14 17 71 29 20 14 17 80
16 Labeo-Rohitha 6673 4296 1550 2150 14669 9002 6857 1577 2187 19623
17 Mussel 0 0 0 21231 21231 0 1384 337 21594 23315
18 Edible Oyster 0 0 0 1750 1750 0 0 0 1780 1780
19 Miscellaneous 2297 2118 886 992 6293 3137 5611 902 1009 10659
TOTAL 37657 33203 19093 45983 135936 50819 44034 20947 46769 162569
35
Kerala Inland Fisheries statistics- 2013 Department of Fisheries
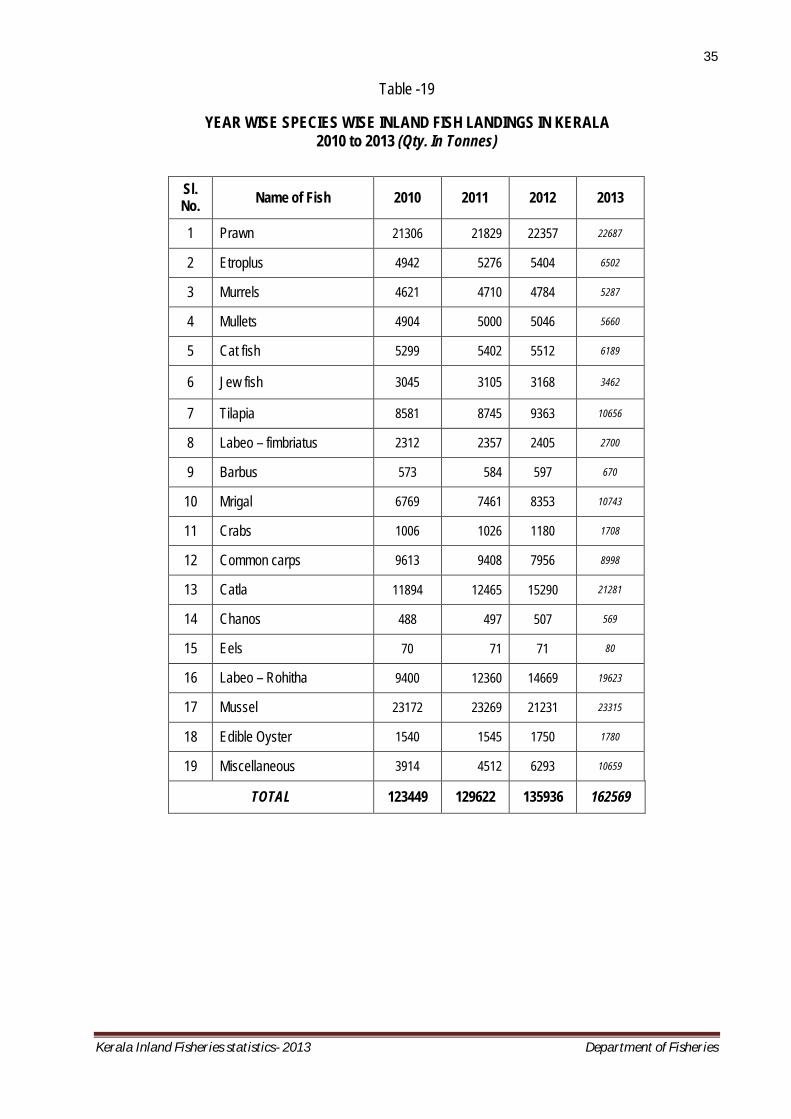
Table -19
YEAR WISE SPECIES WISE INLAND FISH LANDINGS IN KERALA 2010 to 2013 (Qty. In Tonnes)
Sl. No. Name of Fish 2010 2011 2012 2013
1 Prawn 21306 21829 22357 22687
2 Etroplus 4942 5276 5404 6502
3 Murrels 4621 4710 4784 5287
4 Mullets 4904 5000 5046 5660
5 Cat fish 5299 5402 5512 6189
6 Jew fish 3045 3105 3168 3462
7 Tilapia 8581 8745 9363 10656
8 Labeo – fimbriatus 2312 2357 2405 2700
9 Barbus 573 584 597 670
10 Mrigal 6769 7461 8353 10743
11 Crabs 1006 1026 1180 1708
12 Common carps 9613 9408 7956 8998
13 Catla 11894 12465 15290 21281
14 Chanos 488 497 507 569
15 Eels 70 71 71 80
16 Labeo – Rohitha 9400 12360 14669 19623
17 Mussel 23172 23269 21231 23315
18 Edible Oyster 1540 1545 1750 1780
19 Miscellaneous 3914 4512 6293 10659
TOTAL 123449 129622 135936 162569
36
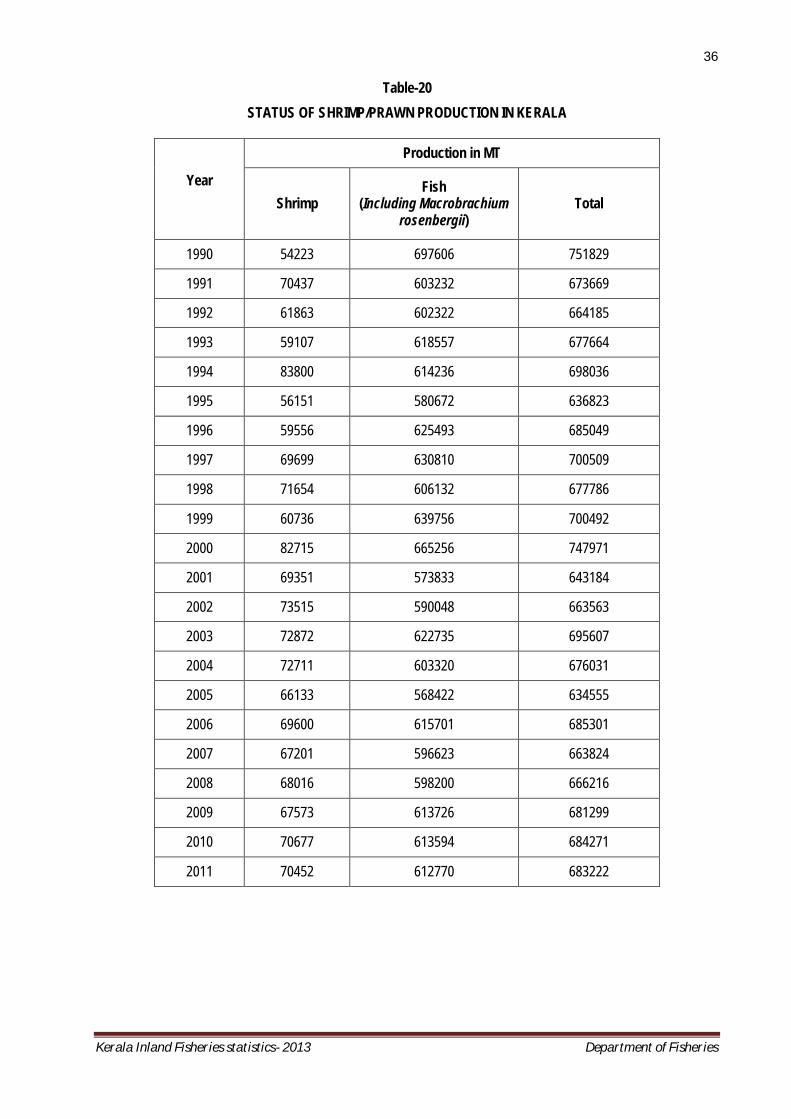
Kerala Inland Fisheries statistics- 2013 Department of Fisheries
Table-20 STATUS OF SHRIMP/PRAWN PRODUCTION IN KERALA
Year
Production in MT
Shrimp Fish
(Including Macrobrachium rosenbergii)
Total
1990 54223 697606 751829
1991 70437 603232 673669
1992 61863 602322 664185
1993 59107 618557 677664
1994 83800 614236 698036
1995 56151 580672 636823
1996 59556 625493 685049
1997 69699 630810 700509
1998 71654 606132 677786
1999 60736 639756 700492
2000 82715 665256 747971
2001 69351 573833 643184
2002 73515 590048 663563
2003 72872 622735 695607
2004 72711 603320 676031
2005 66133 568422 634555
2006 69600 615701 685301
2007 67201 596623 663824
2008 68016 598200 666216
2009 67573 613726 681299
2010 70677 613594 684271
2011 70452 612770 683222

37
Kerala Inland Fisheries statistics- 2013 Department of Fisheries
Table-21
INLAND FISH PRODUCTION AND VALUE IN KERALA from 1985-1986 to 2012-2013
Year Quantity (In M.T) Value (Rs. In Lakhs)
1985-1986 28578 1779.13
1986-1987 28194 2177.09
1987-1988 26932 2423.74
1988-1989 28475 3692.89
1989-1990 33312 4880.91
1990-1991 36342 5828.68
1991-1992 40365 7584.91
1992-1993 42390 9138.78
1993-1994 45482 9719.71
1994-1995 48192 13094.33
1995-1996 49586 14346.83
1996-1997 52105 15274.06
1997-1998 58215 17018.97
1998-1999 65855 24710.99
1999-2000 74130 30755.32
2000-2001 85234 29995.20
2001-2002 78039 28867.00
2002-2003 75036 30014.00
2003-2004 76279 31890.16
2004-2005 76451 59851.46
2005-2006 77980 60415.54
2006-2007 79647 67658.18
2007-2008 91085 71813.13
2008-2009 102842 75778.87
2009-2010 116836 88290.28
2010-2011 121215 102123.86
2011-2012 140031 122390.42
2012-2013 149098 149881.17
38
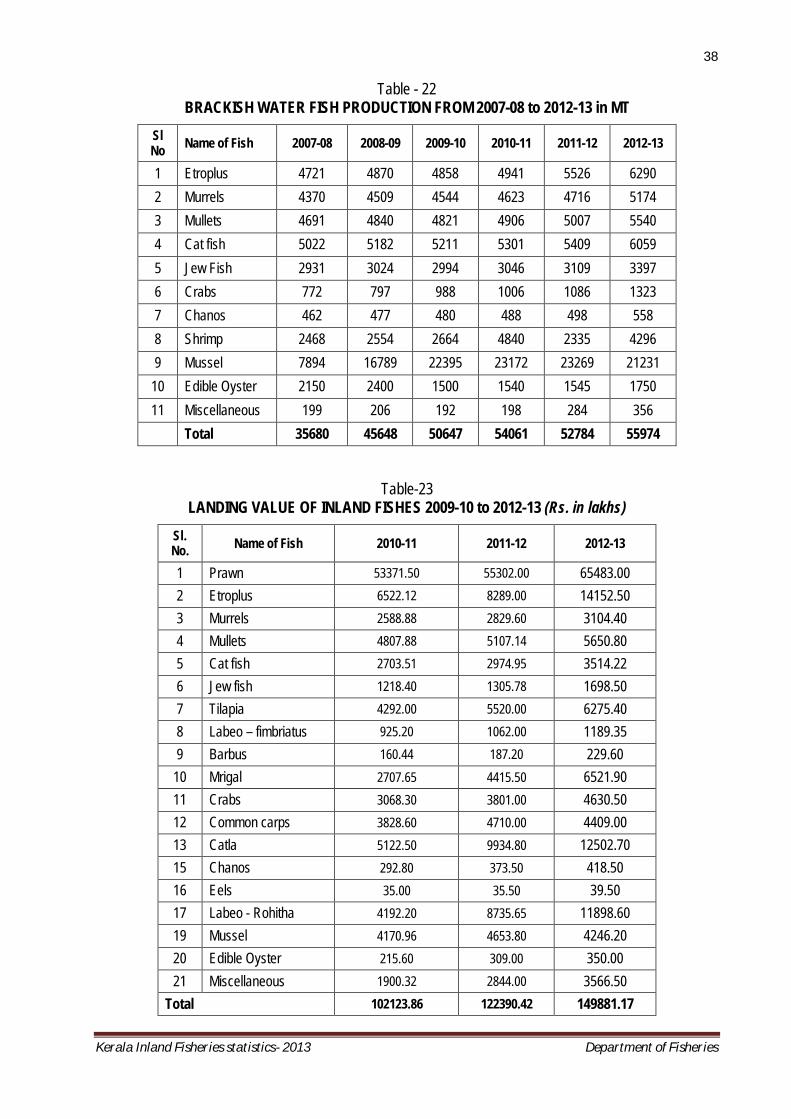
Kerala Inland Fisheries statistics- 2013 Department of Fisheries
Table - 22 BRACKISH WATER FISH PRODUCTION FROM 2007-08 to 2012-13 in MT
Sl No Name of Fish 2007-08 2008-09 2009-10 2010-11 2011-12 2012-13
1 Etroplus 4721 4870 4858 4941 5526 6290 2 Murrels 4370 4509 4544 4623 4716 5174 3 Mullets 4691 4840 4821 4906 5007 5540 4 Cat fish 5022 5182 5211 5301 5409 6059 5 Jew Fish 2931 3024 2994 3046 3109 3397 6 Crabs 772 797 988 1006 1086 1323 7 Chanos 462 477 480 488 498 558 8 Shrimp 2468 2554 2664 4840 2335 4296 9 Mussel 7894 16789 22395 23172 23269 21231
10 Edible Oyster 2150 2400 1500 1540 1545 1750 11 Miscellaneous 199 206 192 198 284 356
Total 35680 45648 50647 54061 52784 55974
Table-23 LANDING VALUE OF INLAND FISHES 2009-10 to 2012-13 (Rs. in lakhs)
Sl. No. Name of Fish 2010-11 2011-12 2012-13
1 Prawn 53371.50 55302.00 65483.00 2 Etroplus 6522.12 8289.00 14152.50 3 Murrels 2588.88 2829.60 3104.40 4 Mullets 4807.88 5107.14 5650.80 5 Cat fish 2703.51 2974.95 3514.22 6 Jew fish 1218.40 1305.78 1698.50 7 Tilapia 4292.00 5520.00 6275.40 8 Labeo – fimbriatus 925.20 1062.00 1189.35 9 Barbus 160.44 187.20 229.60
10 Mrigal 2707.65 4415.50 6521.90 11 Crabs 3068.30 3801.00 4630.50 12 Common carps 3828.60 4710.00 4409.00 13 Catla 5122.50 9934.80 12502.70 15 Chanos 292.80 373.50 418.50 16 Eels 35.00 35.50 39.50 17 Labeo - Rohitha 4192.20 8735.65 11898.60 19 Mussel 4170.96 4653.80 4246.20 20 Edible Oyster 215.60 309.00 350.00 21 Miscellaneous 1900.32 2844.00 3566.50
Total 102123.86 122390.42 149881.17

39
Kerala Inland Fisheries statistics- 2013 Department of Fisheries
Table -24
AVERAGE LANDING PRICES OF INLAND FISHES FROM 2010-11 to 2012-13
(Prices Rs./Kg) Sl No Name of Fish 2010-11 2011-12 2012-13
1 Prawn 236.08 260.00 275.00
2 Etroplus 132.00 150.00 225.00
3 Murrels 56.00 60.00 60.00
4 Mullets 98.00 102.00 102.00
5 Cat fish 51.00 55.00 58.00
6 Jew fish 40.00 42.00 50.00
7 Tilapia 50.00 60.00 60.00
8 Labeo – fimbriatus 40.00 45.00 45.00
9 Barbus 28.00 32.00 35.00
10 Mrigal 45.00 50.00 70.00
11 Crabs 305.00 350.00 350.00
12 Common carps 45.00 50.00 50.00
13 Catla 50.00 60.00 70.00
14 Chanos 60.00 75.00 75.00
15 Eels 50.00 50.00 50.00
16 Labeo - Rohitha 45.22 55.00 70.00
17 Mussel 18.00 20.00 20.00
18 Edible Oyster 14.00 20.00 20.00
19 Miscellaneous 48.00 50.00 50.00

40
Kerala inland Fisheries Statistics 2013 Department of Fisheries
Table-25(a)
DISTRICT-WISE, SPECIES-WISE INLAND FISH LANDINGS IN KERALA FOR THE YEAR 2010-11 (QTY IN MT)
Sl. No Name of fish TVPM KLM PTA ALP KTYM IDY EKM TCR PKD MLPM KKD WYD KNR KSD TOTAL
1 Prawn 44 897 206 3415 480 0 14875 2013 0 113 196 249 110 9 22607
2 Etroplus 44 574 107 1967 355 0 1508 165 0 21 112 0 88 0 4941
3 Murrels 119 530 41 800 445 77 1271 476 158 59 289 9 349 0 4623
4 Mullets 73 756 95 1052 432 38 1376 448 88 66 240 0 239 3 4906
5 Cat fish 83 796 94 1081 459 53 1440 475 49 24 358 8 372 9 5301
6 Jew fish 42 372 83 810 206 0 1093 114 0 45 139 0 138 4 3046
7 Tilapia 173 1372 167 1892 484 55 3002 359 338 120 302 42 261 17 8584
8 Labeo fimbriatus 0 0 203 262 329 0 0 0 1519 0 0 0 0 0 2313
9 Barbus 18 78 4 48 66 27 76 57 74 25 41 0 59 0 573
10 Mrigal 0 785 69 957 0 0 265 1429 1494 1006 0 12 0 0 6017
11 Crabs 11 123 19 276 2 429 16 0 4 69 0 53 4 0 1006
12 Common carps 537 1211 29 721 339 0 635 1727 2729 71 419 88 2 0 8508
13 Catla 604 1586 69 796 202 0 1524 2896 2472 0 0 96 0 0 10245
14 Chamos 9 74 8 119 26 4 198 8 5 3 26 0 8 0 488
15 Eels 1 8 1 15 2 0 31 3 4 0 3 0 2 0 70
16 Labeo Rohitha 167 2035 31 977 1075 0 244 2469 2179 67 0 72 0 0 9316
17 Mussel 0 657 0 18 0 0 247 16 0 388 774 0 62 21010 23172
18 Edible Oyster 0 197 0 55 0 0 112 0 0 0 409 0 301 466 1540
19 Miscellaneous 49 303 80 727 237 69 1698 275 81 22 191 0 184 43 3959
TOTAL 1974 12354 1306 15988 5139 752 29611 12930 11194 2099 3499 629 2179 21561 121215

41
Kerala Inland Fisheries statistics- 2013 Department of Fisheries
Table-25 (b)
DISTRICT WISE SPECIES WISE VALUES OF INLAND FISHES IN KERALA FOR THE YEAR 2010-11(Rs in 000's)
Sl. No Name of fish TVPM KLM PTA ALP KTYM IDY EKM TCR PKD MLPM KKD WYD KNR KSD TOTAL
1 Prawn 10870 213980 51500 782315 117985 0 3544095 475365 0 24025 41785 46065 27500 1665 5337150 2 Etroplus 5808 75768 14124 259644 46860 0 199056 21780 0 2772 14784 0 11616 0 652212 3 Murrels 6664 29680 2296 44800 24920 4312 71176 26656 8848 3304 16184 504 19544 0 258888 4 Mullets 7154 74088 9310 103096 42336 3724 134848 43904 8624 6468 23520 0 23422 294 480788 5 Cat fish 4233 40596 4794 55131 23409 2703 73440 24225 2499 1224 18258 408 18972 459 270351 6 Jew fish 1680 14880 3320 32400 8240 0 43720 4560 0 1800 5560 0 5520 160 121840 7 Tilapia 8650 68600 8350 94600 24200 2750 150100 17950 16900 6000 15100 2100 13050 850 429200 8 Labeo fimbriatus 0 0 8120 10480 13160 0 0 0 60760 0 0 0 0 0 92520 9 Barbus 504 2184 112 1344 1848 756 2128 1596 2072 700 1148 0 1652 0 16044 10 Mrigal 0 35325 3105 43065 0 0 11925 64305 67230 45270 0 540 0 0 270765 11 Crabs 3355 37515 5795 84180 610 130845 4880 0 1220 21045 0 16165 1220 0 306830 12 Common carps 24165 54495 1305 32445 15255 0 28575 77715 122805 3195 18855 3960 90 0 382860 13 Catla 30200 79300 3450 39800 10100 0 76200 144800 123600 0 0 4800 0 0 512250 14 Chamos 540 4440 480 7140 1560 240 11880 480 300 180 1560 0 480 0 29280 15 Eels 50 400 50 750 100 0 1550 150 200 0 150 0 100 0 3500 16 Labeo Rohitha 7515 91575 1395 43965 48375 0 10980 111105 98055 3015 0 3240 0 0 419220 17 Mussel 0 11826 0 324 0 0 4446 288 0 6984 13932 0 1116 378180 417096 18 Edible Oyster 0 2758 0 770 0 0 1568 0 0 0 5726 0 4214 6524 21560 19 Miscellaneous 2352 14544 3840 34896 11376 3312 81504 13200 3888 1056 9168 0 8832 2064 190032
TOTAL 113740 851954 121346 1671145 390334 148642 4452071 1028079 517001 127038 185730 77782 137328 390196 10212386

42
Kerala Inland Fisheries statistics- 2013 Department of Fisheries
Table 26(a) DISTRICT WISE SPECIES WISE INLAND FISH LANDINGS IN KERALA FOR THE YEAR 2011-12 (QTY IN MT)
Sl. No Name of fish TVPM KLM PTA ALP KTYM IDY EKM TCR PKD MLPM KKD WYD KNR KSD TOTAL
1 Prawn 41 844 194 3213 452 0 13995 1894 2 106 184 234 103 8 21270
2 Etroplus 49 642 120 2200 397 0 1687 185 0 23 125 0 98 0 5526
3 Murrels 121 541 42 816 454 79 1297 486 161 60 294 9 356 0 4716
4 Mullets 75 772 97 1074 441 39 1404 457 90 66 245 0 244 3 5007
5 Cat fish 85 812 96 1103 468 54 1469 485 50 24 366 8 380 9 5409
6 Jew fish 43 380 85 827 210 0 1116 116 0 46 141 0 141 4 3109
7 Tilapia 185 1470 179 2028 519 59 3217 385 362 129 324 45 280 18 9200
8 Labeo fimbriatus 0 0 207 267 336 0 0 0 1550 0 0 0 0 0 2360
9 Barbus 18 80 4 49 67 28 78 58 76 26 41 0 60 0 585
10 Mrigal 0 1152 101 1405 0 0 389 2097 2193 1476 0 18 0 0 8831
11 Crabs 12 133 21 298 2 463 17 0 4 74 0 58 4 0 1086
12 Common carps 595 1341 32 798 375 0 703 1912 3022 79 464 97 2 0 9420
13 Catla 976 2563 112 1286 326 0 2463 4681 3995 0 0 156 0 0 16558
14 Chamos 9 76 8 121 27 4 202 8 5 3 27 0 8 0 498
15 Eels 1 8 1 15 2 0 31 3 4 0 4 0 2 0 71
16 Labeo Rohitha 285 3470 53 1666 1833 0 416 4209 3715 113 0 123 0 0 15883
17 Mussel 0 660 0 18 0 0 248 16 0 390 777 0 62 21098 23269
18 Edible Oyster 0 198 0 55 0 0 112 0 0 0 410 0 302 468 1545
19 Miscellaneous 70 435 115 1045 341 99 2440 395 116 32 274 0 264 62 5688
TOTAL 2565 15577 1467 18284 6250 825 31284 17387 15345 2647 3676 748 2306 21670 140031

43
Kerala Inland Fisheries statistics- 2013 Department of Fisheries
Table 26(b) DISTRICT WISE SPECIES WISE VALUES OF INLAND FISHES IN KERALA FOR THE YEAR 2011-12 (Rs in 000's)
Sl. No Name of fish TVPM KLM PTA ALP KTYM IDY EKM TCR PKD MLPM KKD WYD KNR KSD TOTAL
1 Prawn 10660 219440 50440 835380 117520 0 3638700 492440 520 27560 47840 60840 26780 2080 5530200
2 Etroplus 7350 96300 18000 330000 59550 0 253050 27750 0 3450 18750 0 14700 0 828900
3 Murrels 7260 32460 2520 48960 27240 4740 77820 29160 9660 3600 17640 540 21360 0 282960
4 Mullets 7650 78744 9894 109548 44982 3978 143208 46614 9180 6732 24990 0 24888 306 510714
5 Cat fish 4675 44660 5280 60665 25740 2970 80795 26675 2750 1320 20130 440 20900 495 297495
6 Jew fish 1806 15960 3570 34734 8820 0 46872 4872 0 1932 5922 0 5922 168 130578
7 Tilapia 11100 88200 10740 121680 31140 3540 193020 23100 21720 7740 19440 2700 16800 1080 552000
8 Labeo fimbriatus 0 0 9315 12015 15120 0 0 0 69750 0 0 0 0 0 106200
9 Barbus 576 2560 128 1568 2144 896 2496 1856 2432 832 1312 0 1920 0 18720
10 Mrigal 0 57600 5050 70250 0 0 19450 104850 109650 73800 0 900 0 0 441550
11 Crabs 4200 46550 7350 104300 700 162050 5950 0 1400 25900 0 20300 1400 0 380100
12 Common carps 29750 67050 1600 39900 18750 0 35150 95600 151100 3950 23200 4850 100 0 471000
13 Catla 58560 153780 6720 77160 19560 0 147780 280860 239700 0 0 9360 0 0 993480
14 Chamos 675 5700 600 9075 2025 300 15150 600 375 225 2025 0 600 0 37350
15 Eels 50 400 50 750 100 0 1550 150 200 0 200 0 100 0 3550
16 Labeo Rohitha 15675 190850 2915 91630 100815 0 22880 231495 204325 6215 0 6765 0 0 873565
17 Mussel 0 13200 0 360 0 0 4960 320 0 7800 15540 0 1240 421960 465380
18 Edible Oyster 0 3960 0 1100 0 0 2240 0 0 0 8200 0 6040 9360 30900
19 Miscellaneous 3500 21750 5750 52250 17050 4950 122000 19750 5800 1600 13700 0 13200 3100 284400
TOTAL 163487 1139164 139922 2001325 491256 183424 4813071 1386092 828562 172656 218889 106695 155950 438549 12239042

44
Kerala Inland Fisheries statistics- 2013 Department of Fisheries
Table 27(a) DISTRICT WISE SPECIES WISE INLAND FISH LANDINGS IN KERALA FOR THE YEAR 2012-13 (QTY IN MT)
Sl. No Name of fish TVPM KLM PTA ALP KTYM IDY EKM TCR PKD MLPM KKD WYD KNR KSD TOTAL
1 Prawn 46 945 217 3597 506 0 15668 2120 2 119 206 262 115 9 23812
2 Etroplus 56 731 136 2504 452 0 1920 211 0 26 142 0 112 0 6290
3 Murrels 133 594 46 895 498 87 1423 533 176 65 323 10 391 0 5174
4 Mullets 83 854 108 1188 488 43 1553 506 100 73 271 0 270 3 5540
5 Cat fish 95 910 107 1236 524 60 1646 543 56 27 410 9 426 10 6059
6 Jew fish 47 415 93 904 229 0 1219 127 0 51 154 0 154 4 3397
7 Tilapia 210 1671 203 2306 590 67 3657 438 413 147 368 51 318 20 10459
8 Labeo fimbriatus 0 0 232 299 376 0 0 0 1736 0 0 0 0 0 2643
9 Barbus 20 90 4 56 75 31 87 66 85 29 46 0 67 0 656
10 Mrigal 0 1215 106 1484 0 0 410 2212 2314 1557 0 19 0 0 9317
11 Crabs 15 162 26 363 2 563 21 0 5 90 0 71 5 0 1323
12 Common carps 557 1255 30 747 351 0 658 1790 2829 74 434 91 2 0 8818
13 Catla 1053 2765 121 1387 352 0 2657 5049 4309 0 0 168 0 0 17861
14 Chamos 10 85 9 136 30 4 227 9 6 3 30 0 9 0 558
15 Eels 2 9 1 17 2 0 34 3 5 0 4 0 2 0 79
16 Labeo Rohitha 305 3714 57 1783 1962 0 445 4504 3975 121 0 132 0 0 16998
17 Mussel 0 602 0 16 0 0 226 15 0 356 709 0 57 19250 21231
18 Edible Oyster 0 224 0 62 0 0 127 0 0 0 464 0 342 531 1750
19 Miscellaneous 88 546 144 1310 428 124 3060 495 145 40 344 0 331 78 7133
TOTAL 2720 16787 1640 20290 6865 979 35038 18621 16156 2778 3905 813 2601 19905 149098

45
Kerala Inland Fisheries statistics- 2013 Department of Fisheries
Table 27(b) DISTRICT WISE SPECIES WISE VALUES OF INLAND FISHES IN KERALA FOR THE YEAR 2012-13 (Rs in 000's)
Sl. No Name of fish TVPM KLM PTA ALP KTYM IDY EKM TCR PKD MLPM KKD WYD KNR KSD TOTAL
1 Prawn 12650 259875 59675 989175 139150 0 4309250 583000 0 32725 56650 72050 31625 2475 6548300
2 Etroplus 12600 164475 30825 563400 101700 0 432000 47475 0 5850 31725 0 25200 0 1415250
3 Murrels 7980 35640 2760 53700 29880 5220 85380 31980 10620 3960 19260 600 23460 0 310440
4 Mullets 8466 87108 10914 121176 49776 4386 158406 51612 10200 7548 27642 0 27540 306 565080
5 Cat fish 5510 52780 6264 71688 30392 3480 95468 31494 3248 1566 23722 522 24708 580 351422
6 Jew fish 2350 20750 4650 45200 11450 0 60950 6350 0 2500 7750 0 7700 200 169850
7 Tilapia 12600 100260 12180 138360 35400 4020 219420 26280 24720 8820 22140 3060 19080 1200 627540
8 Labeo fimbriatus 0 0 10440 13455 16920 0 0 0 78120 0 0 0 0 0 118935
9 Barbus 700 3150 140 1925 2625 1085 3045 2275 2975 1050 1645 0 2345 0 22960
10 Mrigal 0 85050 7490 103740 0 0 28700 154840 161980 109060 0 1330 0 0 652190
11 Crabs 5250 56700 9100 127050 700 197400 7350 0 1750 31850 0 24150 1750 0 463050
12 Common carps 27850 62750 1500 37350 17550 0 32900 89500 141450 3700 21700 4550 100 0 440900
13 Catla 73710 193550 8470 97090 24640 0 185990 353430 301700 0 0 11690 0 0 1250270
14 Chamos 750 6375 675 10200 2250 300 16950 675 525 225 2250 0 675 0 41850
15 Eels 50 500 50 900 100 0 1700 150 250 0 150 0 100 0 3950
16 Labeo Rohitha 21350 259980 3990 124810 137340 0 31150 315280 278320 8540 0 9100 0 0 1189860
17 Mussel 0 12040 0 320 0 0 4520 300 0 7120 14180 0 1140 385000 424620
18 Edible Oyster 0 4480 0 1240 0 0 2540 0 0 0 9300 0 6840 10600 35000
19 Miscellaneous 4400 27300 7200 65500 21400 6200 153000 24750 7250 2000 17200 0 16550 3900 356650
TOTAL 196216 1432763 176323 2566279 621273 222091 5828719 1719391 1023108 226514 255314 127052 188813 404261 14988117

46
Kerala inland Fisheries Statistics 2013 Department of Fisheries
Table- 28 HATCHERY WISE FISH SEED /FINGERLINGS/PRAWN SEED PRODUCTION (lakhs of Nos)
FROM 2010-11TO 2012-13 Sl. No Name of Farm 2010-11 2011-12 2012-13
1 NFSF, Malampuzha 108.511 2.477 70.19
2 Govt. Model Fish Farm, Pallam 3.52 6.79
3 Fisheries Complex, Pannivelichira 10.391 16.43
4 Fish Seed Farm ,Neyyar Dam 3.92 4.79 4.70
5 NFSF, Polachira 9.16 7.40 18.91
6 Regional Shrimp Hatchery, Azhikode 10.38 17.95 32.62
7 Prawn hatchery, FFDA ,Kollam 50.21 17.33
Table-29 FISH/ PRAWN SEED – PRODUCTION DETAILS (lakh of Nos) 2010-11 to 2012-13
Year Name of species Spawn Fry Finger lings Hatch lings
(1) (2) (3) (4) (5) (6)
1. National Fish seed Farm, Malampuzha
2010-11
CATLA 89.65 17.41 89.65 ROHU 262.05 5 43.04 262.05 MRIGAL 219.25 5 40.74 219.25 LABEO 30 6.1 30 CYPRINUS 3 1.191 3.3 THILOPIA 0 0.03 TOTAL 603.95 10 108.511 604.25
2011-12
CATLA 26.75 9.8 0.59 22.48 ROHU 47.5 9.75 0.69 17.03 MRIGAL 33.5 22.5 0.61 18.27 LABEO 21 0.5 0.97 CYPRINUS 1.03 0.07 2.8 GRASS CARP 0.15 THILOPIA 0.017 0.021 TOTAL 128.75 43.08 2.477 61.721
2012-13
CATLA 0.806 27.36 6.78 ROHU 15.5 0.706 22.02 5.32 MRIGAL 26.5 0.706 18.12 LABEO 10 CYPRINUS 2.41 GRASS CARP 0.1 THILOPIA 0.18 0.06 TOTAL 52 2.218 70.19 12.16

47
Kerala Inland Fisheries statistics- 2013 Department of Fisheries
(1) (2) (3) (4) (5) (6) 2. Government Model Fish Farm, Pallom
2011-12
ROHU 0.9 LABEO 1.16 MRIGAL 1.46 TOTAL 3.52
2012-13
ROHU 2.21 LABEO 2.63 MRIGAL 1.1 CATLA 0.85 TOTAL 6.79
3. Fisheries Complex, Pannivelichira
2010-11
CATLA 12.9 10.23 2.05 16.8 ROHU 17.6 16.38 4.29 21.5 MRIGAL 31.5 10.37 3.051 37 LABEO 26.5 3 0.976 31.5 CYPRINUS 0.5 0.088 0.024 0.9 TOTAL 89 40.068 10.391 107.7
2011-12
CATLA 12.5 22.5 ROHU 31.75 3.32 MRIGAL 38.75 4.19 LABEO 2.76 1.5 CYPRINUS 4 0 TOTAL 89.76 31.51
2012-13
CATLA 14.75 2.73 ROHU 16 4.17 MRIGAL 34.25 7.53 LABEO 11.25 1.7 CYPRINUS 3 0.3 TOTAL 79.25 16.43
4. Fish Seed Farm, Neyyar Dam
2010-11
ROHU 20 10 1.3 MRIGAL 10 5 1.27 LABEO 5 2.5 1 GRASS CARP 1 0.3 0.1 CYPRINUS 1 0.3 0.25 TOTAL 37 18.1 3.92
2011-12
ROHU 1.13 MRIGAL 0.59 LABEO 2.77 GRASS CARP 0.3 TOTAL 4.79
48
Kerala Inland Fisheries statistics- 2013 Department of Fisheries
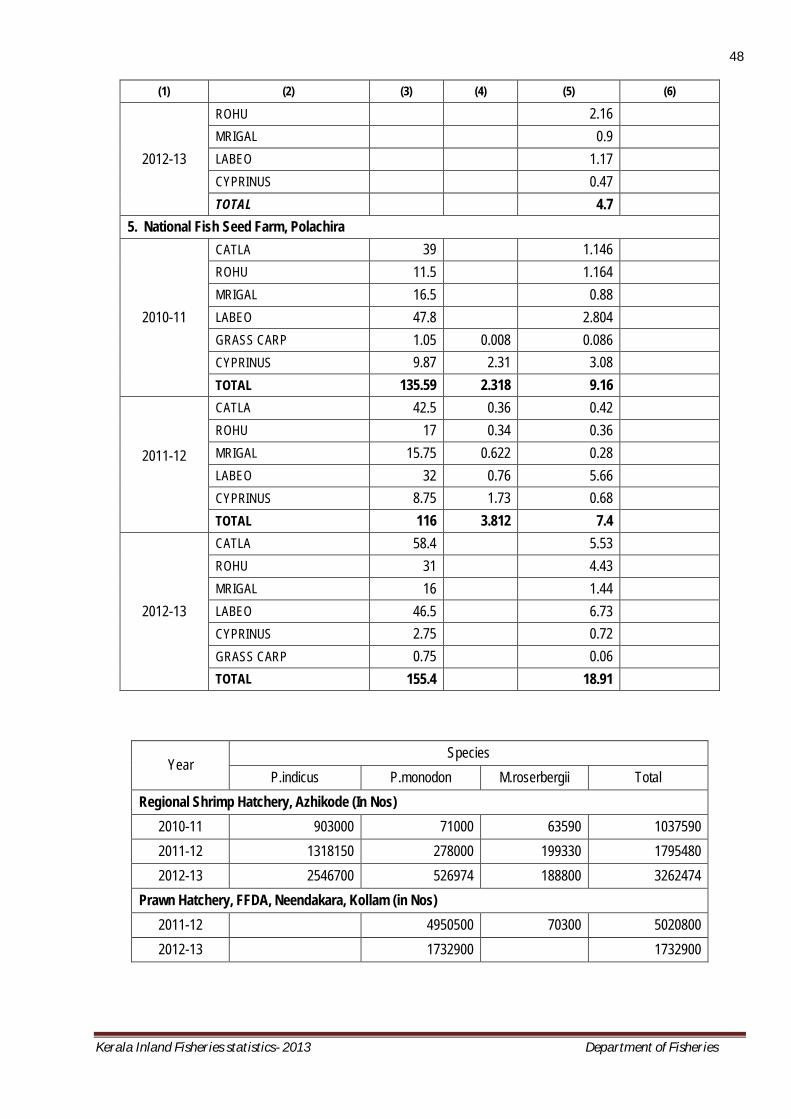
(1) (2) (3) (4) (5) (6)
2012-13
ROHU 2.16 MRIGAL 0.9 LABEO 1.17 CYPRINUS 0.47 TOTAL 4.7
5. National Fish Seed Farm, Polachira
2010-11
CATLA 39 1.146 ROHU 11.5 1.164 MRIGAL 16.5 0.88 LABEO 47.8 2.804 GRASS CARP 1.05 0.008 0.086 CYPRINUS 9.87 2.31 3.08 TOTAL 135.59 2.318 9.16
2011-12
CATLA 42.5 0.36 0.42 ROHU 17 0.34 0.36 MRIGAL 15.75 0.622 0.28 LABEO 32 0.76 5.66 CYPRINUS 8.75 1.73 0.68 TOTAL 116 3.812 7.4
2012-13
CATLA 58.4 5.53 ROHU 31 4.43 MRIGAL 16 1.44 LABEO 46.5 6.73 CYPRINUS 2.75 0.72 GRASS CARP 0.75 0.06 TOTAL 155.4 18.91
Year Species
P.indicus P.monodon M.roserbergii Total Regional Shrimp Hatchery, Azhikode (In Nos)
2010-11 903000 71000 63590 1037590 2011-12 1318150 278000 199330 1795480 2012-13 2546700 526974 188800 3262474
Prawn Hatchery, FFDA, Neendakara, Kollam (in Nos) 2011-12 4950500 70300 5020800 2012-13 1732900 1732900

49
Kerala Inland Fisheries statistics- 2013 Department of Fisheries
Table-30
PROGRESS OF FFDA FOR THE LAST 5 YEARS- PHYSICAL ACHIEVEMENTS from 2008-09 to 2012-13
Year
Area surveyed (in ha.)
Area brought under fish culture
(in ha.) No. Of
beneficiaries No. Of farmers trained
Production / ha. (in Kg.)
2008-2009 1355.58 656.13 2982 3037 2949
2009-2010 4213.69 2468.63 20123 8731 2960
2010-2011 5395.07 4748.22 24998 9289 2492
2011-2012 7110.18 5984.35 37953 9313 2631
2012-2013 6790.30 5897.056 41419 11510 2460
Table -31
AVERAGE FISH PRODUCTION OF FFDA from 2008-09 to 2012-13
Year Average Fish
Production (Kg /Ha)
Production in Tonnes
2008-2009 2949 907.92
2009-2010 2960 3107.838
2010-2011 2492 6276
2011-2012 2631 7294.98
2012-2013 2460 12148.60

50
Kerala Inland Fisheries statistics- 2013 Department of Fisheries
Table 32 (a) PERFORMANCE OF FFDA IN KERALA DURING 2010-11
Sl No District
No.of
mem
bers
durin
g the
year
Total
area
su
rveye
d(Ha
)
Area
brou
ght u
nder
fis
h cult
ure (
ha)
No. o
f ben
eficia
ries
Distr
ibutio
n of fi
sh
seed
(No.)
Harve
sted a
rea
(Ha)
Harve
sted Q
uanti
ty (in
tonn
e)
No. o
f farm
ers
traine
d
1 Thiruvananthapuram 50 25 126 659 540200 85 221 37 2 Kollam 352 189 187 958 2300785 38.32 60.02 228 3 Pathanamthitta 757 120 113 757 665450 101.08 280.278 546 4 Alappuzha 5610 811 666 4168 3227700 665.7 1930.53 1012 5 Kottayam 2670 802 800 2160 3959800 529 1490.85 343 6 Idukki 4012 266 266 4212 911875 90 201 4212 7 Ernakulam 734 334 183 734 902500 20 58 694 8 Thrissur 625 509 634 2490 2015548 426 810 528 9 Palakkad 1691 1683 1059 2070 3647311 0 0 206
10 Malappuram 2512 400 353 2547 1735100 331 780 165 11 Kozhikode 883 72 72 883 361750 72.35 151.93 357 12 Wayanad 935 32 101 1851 506380 65 165 399 13 Kannur 618 39 75 729 375380 52.9 65 266 14 Kasaragode 780 114 114 780 322000 42 62 296
Total 22229 5396 4749 24998 21471779 2518.35 6275.61 9289
Table 32 (b) PERFORMANCE OF FFDA IN KERALA DURING 2011-12
Sl No District
No.of
mem
bers
durin
g the
year
Total
area
su
rveye
d(Ha
)
Area
brou
ght u
nder
fis
h cult
ure (
ha)
No. o
f ben
eficia
ries
Distr
ibutio
n of fi
sh
seed
(No.)
Harve
sted a
rea
(Ha)
Harve
sted Q
uanti
ty (in
tonn
e)
No. o
f farm
ers
traine
d 1 Thiruvananthapuram 1066 233.94 394.791 1436 1457520 126 365.96 379 2 Kollam 633 239.00 235.04 805 1973300 166.87 640.00 93 3 Pathanamthitta 298 25.248 151.02 151 818600 166.00 556.002 246 4 Alappuzha 6131 1610.66 809.285 6131 8092425 98.00 203.00 221 5 Kottayam 2571 1061.00 1014.086 2571 5398349 206.50 516.00 453 6 Idukki 7424 523.082 630.10 7424 1763225 85.00 212.00 4405 7 Ernakulam 849 662.96 242.01 1007 1235300 182.50 525.40 327 8 Thrissur 897 184.628 529.658 3282 2633900 426.50 1242.0 324 9 Palakkad 1901 1564.32 851.56 1691 4203370 171.034 511.612 106 10 Malappuram 3822 601.00 594.08 3822 2970400 830.08 1749.00 71 11 Kozhikode 1974 257.68 215.50 2488 1140500 80.50 187.10 532 12 Wayanad 641 16.46 125.00 3033 630750 132.00 381.20 425 13 Kannur 1701 40.10 102.116 1664 510580 11.40 27.70 1322 14 Kasaragode 3880 90.10 90.10 2448 1219000 90.10 178.0 409
Total 33788 7110.178 5984.346 37953 34047219 2772.484 7294.974 9313

51
Kerala Inland Fisheries statistics- 2013 Department of Fisheries
Table 32 (c) PERFORMANCE OF FFDA IN KERALA DURING 2012-13
Sl No District
No.of
mem
bers
durin
g the
year
Total
area
su
rveye
d(Ha
)
Area
brou
ght
unde
r fish
cu
lture
(ha)
No. o
f be
nefic
iaries
Distr
ibutio
n of
fish s
eed (
No.)
Harve
sted a
rea
(Ha)
Harve
sted
Quan
tity (in
ton
ne)
No. o
f far
mers
traine
d
1 Thiruvananthapuram 979 285.12 278.615 979 14052 250.00 750.00 877 2 Kollam 1930 340 333.43 1930 1672700 230.00 796.00 1245 3 Pathanamthitta 1584 225 214.384 1625 1134020 214.00 510.00 1862 4 Alappuzha 4529 1000 900.94 4529 4530700 900.00 2700.00 1004 5 Kottayam 3212 1065.15 565.1 3212 3283115 420.00 1302.00 2032 6 Idukki 8337 343.82 342.6 0 1948800 173.00 289.00 490 7 Ernakulam 2715 320.66 266.534 2715 1244086 266.00 665.00 609 8 Thrissur 573 1003 896 6204 4483250 578.00 11.84 1075 9 Palakkad 2685 927.524 929.931 2685 4543320 921.83 1907.92 505 10 Malappuram 6559 711.88 643.4 6559 3217000 440.00 1050.00 118 11 Kozhikode 2262 174.4 162.192 2409 807430 159.84 399.80 140 12 Wayanad 2846 160.43 150.93 2846 761420 151.06 377.50 325 13 Kannur 2100 129 113 2100 564630 113.00 47.00 625 14 Kasaragode 3626 104.32 100 3626 1004500 121.00 1342.74 603
Total 43937 6790.301 5897.056 41419 29209023 4937.73 12148.60 11510
Table 33 Details of production of prawn seeds from MATSYAFED hatcheries from 2010-11 to 2012-13
Hatchery Kannur Kaipamangalam Veliyamcode Thirumullavaram Total
Year
Prod
uctio
n (N
o. in
lakh)
Value
(R
s in
lakh)
Prod
uctio
n (N
o. in
lakh)
Value
(R
s in
lakh)
Prod
uctio
n (N
o. in
lakh)
Value
(R
s in
lakh)
Prod
uctio
n (N
o. in
lakh)
Value
(R
s in
lakh)
Prod
uctio
n (N
o. in
lakh)
Value
(R
s in
lakh)
2010-11 176.92 54.77 26.17 8.70 0.25 0.10 227.28 82.18 430.62 145.75
2011-12 151.14 54.27 22.73 6.84 26.44 13.05 246.90 85.81 447.21 159.97
2012-13 74.10 30.69 155.90 58.43 33.00 10.04 252.26 108.40 515.26 207.56
Table 34 Details of production of fish from the MATSYAFED fish farms from 2010-11 to 2012-13
Name of farm Njarakkal Palaikari Malippuram Total
Year Production (in MT)
Value (Rs. in lakh)
Production (in MT)
Value (Rs. in lakh)
Production (in MT)
Value (Rs. in lakh)
Production (in MT)
Value (Rs. in lakh)
2010-11 7.77 9.30 8.60 7.34 7.79 10.42 24.16 27.06
2011-12 8.23 10.62 7.14 8.41 7.97 14.67 23.34 33.70
2012-13 8.18 12.00 13.78 11.36 7.58 13.80 29.54 37.16
52
Kerala Inland Fisheries statistics- 2013 Department of Fisheries
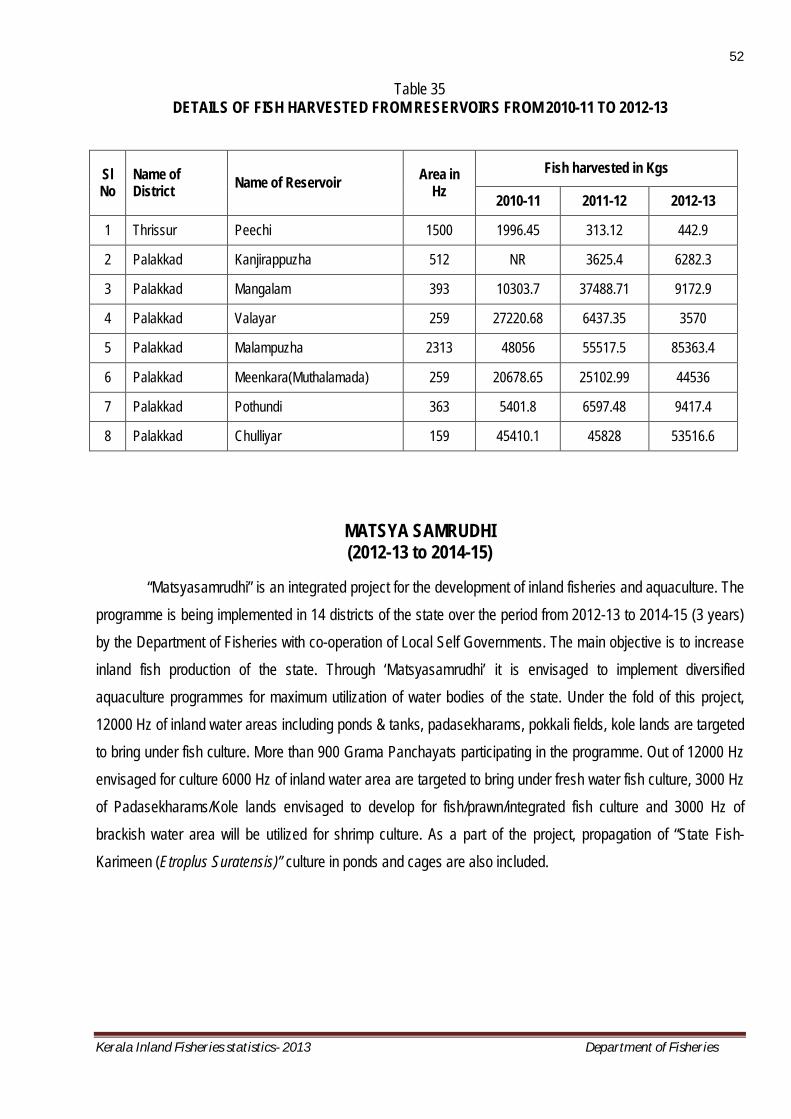
Table 35 DETAILS OF FISH HARVESTED FROM RESERVOIRS FROM 2010-11 TO 2012-13
Sl No
Name of District Name of Reservoir Area in
Hz Fish harvested in Kgs
2010-11 2011-12 2012-13
1 Thrissur Peechi 1500 1996.45 313.12 442.9
2 Palakkad Kanjirappuzha 512 NR 3625.4 6282.3
3 Palakkad Mangalam 393 10303.7 37488.71 9172.9
4 Palakkad Valayar 259 27220.68 6437.35 3570
5 Palakkad Malampuzha 2313 48056 55517.5 85363.4
6 Palakkad Meenkara(Muthalamada) 259 20678.65 25102.99 44536
7 Palakkad Pothundi 363 5401.8 6597.48 9417.4
8 Palakkad Chulliyar 159 45410.1 45828 53516.6
MATSYA SAMRUDHI (2012-13 to 2014-15)
“Matsyasamrudhi” is an integrated project for the development of inland fisheries and aquaculture. The
programme is being implemented in 14 districts of the state over the period from 2012-13 to 2014-15 (3 years) by the Department of Fisheries with co-operation of Local Self Governments. The main objective is to increase inland fish production of the state. Through ‘Matsyasamrudhi’ it is envisaged to implement diversified aquaculture programmes for maximum utilization of water bodies of the state. Under the fold of this project, 12000 Hz of inland water areas including ponds & tanks, padasekharams, pokkali fields, kole lands are targeted to bring under fish culture. More than 900 Grama Panchayats participating in the programme. Out of 12000 Hz envisaged for culture 6000 Hz of inland water area are targeted to bring under fresh water fish culture, 3000 Hz of Padasekharams/Kole lands envisaged to develop for fish/prawn/integrated fish culture and 3000 Hz of brackish water area will be utilized for shrimp culture. As a part of the project, propagation of “State Fish-Karimeen (Etroplus Suratensis)” culture in ponds and cages are also included.
53
Kerala inland Fisheries Statistics 2013 Department of Fisheries
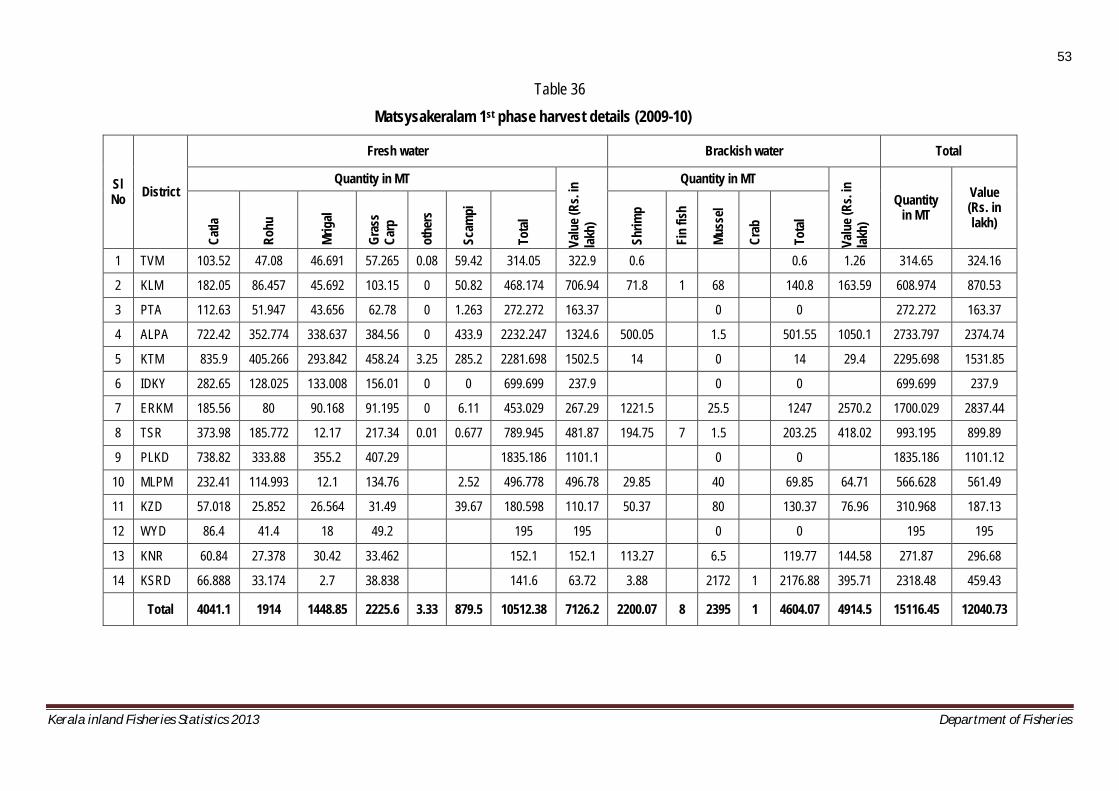
Table 36 Matsysakeralam 1st phase harvest details (2009-10)
Sl No District
Fresh water Brackish water Total
Quantity in MT
Valu
e (Rs
. in
lakh)
Quantity in MT
Valu
e (Rs
. in
lakh)
Quantity in MT
Value (Rs. in lakh)
Catla
Rohu
Mrig
al
Gras
s Ca
rp
othe
rs
Scam
pi
Tota
l
Shrim
p
Fin
fish
Muss
el
Crab
Tota
l
1 TVM 103.52 47.08 46.691 57.265 0.08 59.42 314.05 322.9 0.6 0.6 1.26 314.65 324.16
2 KLM 182.05 86.457 45.692 103.15 0 50.82 468.174 706.94 71.8 1 68 140.8 163.59 608.974 870.53
3 PTA 112.63 51.947 43.656 62.78 0 1.263 272.272 163.37 0 0 272.272 163.37
4 ALPA 722.42 352.774 338.637 384.56 0 433.9 2232.247 1324.6 500.05 1.5 501.55 1050.1 2733.797 2374.74
5 KTM 835.9 405.266 293.842 458.24 3.25 285.2 2281.698 1502.5 14 0 14 29.4 2295.698 1531.85
6 IDKY 282.65 128.025 133.008 156.01 0 0 699.699 237.9 0 0 699.699 237.9
7 ERKM 185.56 80 90.168 91.195 0 6.11 453.029 267.29 1221.5 25.5 1247 2570.2 1700.029 2837.44
8 TSR 373.98 185.772 12.17 217.34 0.01 0.677 789.945 481.87 194.75 7 1.5 203.25 418.02 993.195 899.89
9 PLKD 738.82 333.88 355.2 407.29 1835.186 1101.1 0 0 1835.186 1101.12
10 MLPM 232.41 114.993 12.1 134.76 2.52 496.778 496.78 29.85 40 69.85 64.71 566.628 561.49
11 KZD 57.018 25.852 26.564 31.49 39.67 180.598 110.17 50.37 80 130.37 76.96 310.968 187.13
12 WYD 86.4 41.4 18 49.2 195 195 0 0 195 195
13 KNR 60.84 27.378 30.42 33.462 152.1 152.1 113.27 6.5 119.77 144.58 271.87 296.68
14 KSRD 66.888 33.174 2.7 38.838 141.6 63.72 3.88 2172 1 2176.88 395.71 2318.48 459.43
Total 4041.1 1914 1448.85 2225.6 3.33 879.5 10512.38 7126.2 2200.07 8 2395 1 4604.07 4914.5 15116.45 12040.73

54
Kerala Inland Fisheries statistics- 2013 Department of Fisheries
Table-37 Matsysakeralam 2nd phase harvest details (2010-11)
Sl No District
Fresh water (in MT) Brackish water (in MT) Total harvest(in MT)
Quantity in MT
Valu
e (Rs
. in
lakh)
Quantity in MT
Valu
e (Rs
. in
lakh)
Quantity in MT
Value (Rs. in lakh)
Catla
Rohu
Mrig
al
Gras
s Ca
rp
othe
rs
Scam
pi
Tota
l
Shrim
p
Finf
ish
Muss
el
Crab
Tota
l
1 TVM 84 160 52 64 20 380 323 3.61 2.55 6.16 12.68 386.16 335.68
2 KLM 96 166 82.25 182 48 574.25 516.82 150.41 150.41 323.02 724.66 839.84
3 PTA 73 100 75 52 30 330 231 47.79 47.79 0 1586.24 231
4 ALPA 433 895 70 405 315 70 2188 1969.2 752.07 2.288 1 755.558 1586.2 3555.44
5 KTM 802 870 15 440 115 205 2447 1957 20.79 20.79 43.66 2467.79 2000.66
6 IDKY 239 236 320 795 596 0 795 596
7 ERKM 157 228 92 70 547 437 1184.75 67.57 1 1252.82 2502.4 1799.82 2939.38
8 TSR 437 450 316 62 1265 1138 265.7 3.857 1.5 1 272.057 567.87 1537.057 1705.87
9 PLKD 1065 800 570 2435 1948 0 2435 1948
10 MLPM 353 245 258 87 80 1023 920 37.62 5.72 43.34 72.33 1066.34 992.33
11 KZD 75 94 31 26 226 180 84.92 190.8 275.69 144.3 501.69 324.3
12 WYD 123 92 35 60 310 232 0 310 232
13 KNR 48 74 68 32 5 227 181 148.12 18.2 0 166.62 190.09 393.62 371.09
14 KSRD 82 59 54 195 156 147.7 0.805 2736 2884.315 565.62 3079.315 721.62
ADAK 391 260 559 300 1510 1057 0 1510 1057
Total 4458 4729 2038.25 1891 516 820 14452.25 11842.02 2795.69 9.5 3067 3 5875.55 6008.2 20327.8 17850.21

55
Kerala Inland Fisheries statistics- 2013 Department of Fisheries
Table-38
Matsysakeralam 3rd phase harvest details (2011-12)
Sl No District
Fresh water (in MT) Brackish water (in MT) Total
Quantity in MT
Valu
e (Rs
. in
lakh)
Quantity in MT
Valu
e (Rs
. in
lakh)
Quantity in MT
Value (Rs. in lakh)
Catla
Rohu
Mrig
al
Gras
s Ca
rp
othe
rs
Scam
pi
Tota
l
Shrim
p
Muss
el
Crab
Tota
l
1 TVM 108 150 82 90 31 461 345.75 12.122 12.122 22.2 473.122 367.95
2 KLM 121 216 109 231 37 714 535.5 214.364 214.364 392.57 928.364 928.07
3 PTA 114 144 94 65 40 457 342.75 0 0 342.75
4 ALPA 464 1168 118 423 126 72 2371 1896 884.581 2 886.581 1623.95 3519.95
5 KTM 949 1090 40 600 134 185 2998 2398.4 27.275 27.275 49.95 3025.275 2448.35
6 IDKY 202 193 375 770 577.5 0 0 770 577.5
7 ERKM 165 368 99 98 730 547.5 596.018 104 1 701.018 1112.22 1431.018 1659.72
8 TSR 568 596 367 69 1600 1280 209.374 1 210.374 385.43 1810.374 1665.43
9 PLKD 1380 818 366 2564 1923 0 0 2564 1923
10 MLPM 650 426 463 157 90 1786 1339.5 41.862 108 149.862 76.66 1935.862 1416.16
11 KZD 85 113 34 19 251 188.25 62.309 62.309 133.54 313.309 321.79
12 WYD 161 122 36 71 390 292.5 0 0 390 292.5
13 KNR 68 123 68 43 10 312 234 286.139 100.59 1 387.729 544.01 699.729 778.01
14 KSRD 109 92 82 283 212.25 30.306 2788 2818.306 2357.34 3101.306 2569.59
ADAK 430 292 426 218 1366 1024.5 429.941 429.941 787.36 1795.941 1811.86
Total 5574 5911 2333 2133 350 752 17053 13137.4 2794.291 3100.59 5 5899.881 7485.23 22952.88 20622.63

56
Kerala Inland Fisheries statistics- 2013 Department of Fisheries
Table-39 Matsyakeralam – Area brought under fish culture (2009-10 to 2011-12) in Ha
Sl No District
Fresh water Brackish water Total
1st phase 2nd phase 3rd phase Total 1st phase 2nd phase 3rd phase Total
1 Trivandrum 104.68 127.00 151.60 383.28 1.016 6.016 12.000 19.03 402.31
2 Kollam 153.50 189.90 235.09 578.49 75.788 156.680 212.200 444.67 1023.16
3 Pathanamthitta 90.76 109.49 151.02 351.27 0.00 351.27
4 Allappzha 725.61 665.74 783.00 2174.35 506.792 751.500 875.650 2133.94 4308.29
5 Kottayam 738.82 800.00 996.58 2535.40 18.480 27.000 27.000 72.48 2607.88
6 Iduky 229.41 266.00 251.58 746.99 0.00 746.99
7 Eranakulam 151.01 180.50 240.62 572.13 1122.857 1118.850 590.000 2831.71 3403.84
8 Thrissur 259.00 426.60 523.00 1208.60 195.685 262.880 207.260 665.83 1874.43
9 Palakkad 592.00 737.58 851.56 2181.14 0.00 2181.14
10 Malappuram 165.59 347.22 594.08 1106.89 35.358 44.000 41.440 120.80 1227.69
11 Kozhicode 60.20 72.35 78.79 211.34 46.460 77.200 61.680 185.34 396.68
12 Wayanad 65.00 101.27 125.00 291.27 0.00 291.27
13 Kannur 50.70 75.07 102.12 227.89 138.102 178.450 283.250 599.80 827.69
14 Kasaragode 47.20 64.40 90.00 201.60 4.950 18.460 30.000 53.41 255.01
ADAK 395.00 452.70 847.70 425.600 425.60 1273.30
Total 3433.48 4558.12 5626.74 13618.34 2145.488 2641.036 2766.080 7552.60 21170.94

57
Kerala Inland Fisheries statistics- 2013 Department of Fisheries
Table -40 Matsya Samrudhi -1st phase harvest details (2012-13)
Sl No
Name of District
Fresh water Brackish water
Total production
(MT) Area
harvested (in ha)
Weight obtained (in MT) Shrimp Mussel
Catla
Rohu
Mrig
al
Gras
s Car
p
Cypr
inus
Scam
pi
Carp
by m
eans
of
ope
n wa
ter
ranc
hing
Total Area
harvested (in ha)
Weight obtained
(MT)
Weight obtained
(MT)
1 Trivandrum 278.615 233 285 172 154 0 0 75 919 10 11.04 0 930.04 2 Kollam 330.4 171 330 32 332 140.5 0 84 1089.5 165 181.45 200 1471 3 Pathanamthitta 214.384 182.08 238.4 178.98 35.25 0 0 106 740.71 0 0 0 740.71 4 Allappzha 1450.32 911.9 1705 0 1465 0 0 72 4153.9 778.068 848.9 0 5002.8 5 Kottayam 1153.6 678 986 293 1113 135 0 85 3290 20 21.75 0 3311.8 6 Iduky 340.28 310 278 0 279 178 0 72 1117 0 0 0 1117 7 Eranakulam 261.48 253 241 156 187 0 0 77 914 658.4 722.52 5 1641.5 8 Thrissur 893 792 768 452 506 0 0 84 2602 125 131.42 0 2733.4 9 Palakkad 921 1455 739 718 0 0 0 90 3002 0 0 0 3002 10 Malappuram 643.4 560 492 509 340 0 22 93 2016 9.62 9.7 68 2093.7 11 Kozhicode 159.84 159 150 100 58 107 0 74 648 51.514 55.98 15 718.98 12 Wayanad 112.926 99 91 91 80 0 0 60 421 0 0 0 421 13 Kannur 151.072 181 136 0 0 165 0 71 553 60 63 80 696 14 Kasaragode 100 132 101 93 0 0 0 72 398 20 22.05 1352.56 1772.6
Total 7010.317 6116.98 6540.4 2794.98 4549.25 725.5 22 1115 21864.11 1897.602 2067.81 1720.56 25652.53

58
Kerala Inland Fisheries statistics- 2013 Department of Fisheries
Table -41 PRAWN PRODUCTION IN INDIA: STATES / UNION TERRITORIES - 1999-00 to 2010-11
Year P/ NP/T A.P Goa Gujarat Karnataka Kerala Mahara
shtra Odisha Tamil Nadu
West Bengal
A & N Islands
Daman & Diu
Pudu cherry
Total for INDIA
1999
-00 P 19009 2651 50627 4699 73317 36325 9984 20093 11387 - 215 2615 230,922
NP 7719 - - - 520 82219 4310 4843 3950 601 290 1116 105,568
Total 26728 2651 50627 4699 73837 118544 14294 24936 15337 601 505 3731 336490
2000
-01 P 17162 2284 53983 2913 58275 28206 14585 20257 11760 298 196 3316 213,235
NP 8181 - - 8951 10892 70051 3887 4594 5900 53 395 1177 114,081
Total 25343 2284 53983 11864 69167 98257 18472 24851 17660 351 591 4493 327316
2001
-02 P 16450 2483 48773 2248 49151 33654 15105 21079 11700 434 135 3312 204,524
NP 7729 - - 6496 3615 75875 4064 4671 6000 100 379 108,929
Total 24179 2483 48773 8744 52766 109529 19169 25750 17700 534 514 3312 313453
2002
-03 P 1160 2284 6710 15251 53490 45442 18398 13151 12730 418 89 3430 172,553
NP 1061 - 42794 318 3342 56965 2213 10875 6110 71 302 1560 125,611
Total 2221 2284 49504 15569 56832 102407 20611 24026 18840 489 391 4990 298164
2003
-04 P 1160 2284 46330 10826 53437 45442 21228 16848 13050 560 46 2398 213,609
NP 1061 - 9150 464 3364 56965 3023 11755 7950 128 126 1072 95,058
Total 2221 2284 55480 11290 56801 102407 24251 28603 21000 688 172 3470 308667
2004
-05 P 21507 7703 9302 11841 57252 31537 23398 18636 23780 560 33 2348 207,897
NP 12185 - 53303 12655 68634 2031 4263 20000 128 89 1435 174,723
Total 33692 7703 62605 11841 69907 100171 25429 22899 43780 688 122 3783 382620

59
Kerala Inland Fisheries statistics- 2013 Department of Fisheries
Year P/ NP/T A.P Goa Gujarat Karnataka Kerala Mahara
shtra Odisha Tamil Nadu
West Bengal
A & N Islands
Daman & Diu
Pudu cherry
Total for INDIA
2005
-06 P 157094 5837 15683 11690 47752 58670 22790 42096 63297 568 127 1386 426,990
NP 28769 - 57378 1398 11713 67696 2429 1250 57000 128 207 270 228,238
Total 185863 5837 73061 13088 59465 126366 25219 43346 120297 696 334 1656 655228
2006
-07 P 22160 10250 18449 7500 58008 42519 24968 44454 52001 407 103 79 280,898
NP 9834 - 58217 351 11592 51801 3161 1342 27967 158 107 255 164,785
Total 31994 10250 76666 7851 69600 94320 28129 45796 79968 565 210 334 445,683
2007
-08 P 24987 9545 19088 8251 55619 45352 26255 21701 54044 412 103 1674 267,031
NP 11745 - 54980 549 11582 53869 2820 949 32851 173 107 609 170,234
Total 36732 9545 74068 8800 67201 99221 29075 22650 86895 585 210 2283 437265
2008
-09 P 27742 8693 13509 9071 68016 55956 28879 29863 43452 416 113 1578 287,288
NP 18494 - 27591 741 36231 2774 7982 25596 172 117 648 120,346
Total 46236 8693 41100 9812 68016 92187 31653 37845 69048 588 230 2226 407634
2009
-10 P 24329 11029 17488 16443 67573 38657 25603 30085 49734 349 139 1743 283,172
NP 19860 - 30383 166 68743 3974 8062 20988 150 34 717 153,077
Total 44189 11029 47871 16609 67573 107400 29577 38147 70722 499 173 2460 436249
2010
-11 P 28324 8584 22223 19873 70677 35091 27095 31947 67194 468 367 1018 312,861
NP 18884 - 37182 3366 67936 5281 8539 25105 184 110 467 167,054
Total 47208 8584 59405 23239 70677 103027 32376 40486 92299 652 477 1485 479915 Source- Fishery Survey of India

60
Kerala inland Fisheries Statistics 2013 Department of Fisheries
Table-42
ALL INDIA INLAND FISH PRODUCTION (in lakh MT)
Year Quantity % of Variation 1980-81 8.87 1981-82 9.99 +12.6 1982-83 9.4 -5.9 1983-84 9.87 +5 1984-85 11.03 +11.8 1985-86 11.6 +5.2 1986-87 12.29 +5.9 1987-88 13.01 +5.9 1988-89 13.35 +2.6 1989-90 14.02 +5 1990-91 15.36 +9.6 1991-92 17.1 +11.3 1992-93 17.89 +4.6 1993-94 19.95 +11.5 1994-95 20.97 +5.1 1995-96 22.42 +6.9 1996-97 23.81 +6.2 1997-98 24.38 +2.4 1998-99 26.02 +6.7 1999-00 28.23 +8.5 2000-01 28.45 +0.8 2001-02 31.26 +9.9 2002-03 32.1 +2.7 2003-04 34.58 +7.7 2004-05 35.25 +1.9 2005-06 37.56 +6.6 2006-07 38.45 +2.4 2007-08 42.07 +9.4 2008-09 46.38 +10.2 2009-10 48.94 +5.5 2010-11 49.81 +1.8 2011-12 52.95 +6.3
2012-13(Provisional) 56.32 +6.4 Source: Department of Animal Husbandry, Dairying & Fisheries, Ministry of Agriculture, New Delhi

61
Kerala Inland Fisheries statistics- 2013 Department of Fisheries
Table-43 STATE WISE INLAND FISH PRODUCTION 2008-09 to 2010-11 (in ‘000 Tonnes)
Sl. No. State/Uts 2008-09 % 2009-10 % 2010-11 %
1 Andhra Pradesh 961.62 20.7 1012.71 20.7 1079.56 21.7 2 Arunachal Pradesh 2.88 0.1 2.65 0.1 3.15 0.1 3 Assam 206.15 4.4 218.82 4.5 227.24 4.6 4 Bihar 300.65 6.5 297.4 6.1 299.91 6.0 5 Goa 3.08 0.1 3.44 0.1 3.31 0.1 6 Gujarat 142.85 3.1 84.07 1.7 85.97 1.7 7 Haryana 76.28 1.6 100.46 2.1 96.19 1.9 8 Himachal Pradesh 7.79 0.2 7.85 0.2 7.38 0.1 9 Jammu & Kashmir 19.27 0.4 19.3 0.4 19.7 0.4 10 Karnataka 143.72 3.1 171.33 3.5 186.01 3.7 11 Kerala 102.84 2.2 128.84 2.6 121.21 2.4 12 Madhya Pradesh 68.47 1.5 66.12 1.4 56.45 1.1 13 Maharashtra 127.14 2.7 134.59 2.8 148.55 3.0 14 Manipur 18.8 0.4 19.2 0.4 20.2 0.4 15 Meghalaya 3.96 0.1 4.33 0.1 4.56 0.1 16 Mizoram 2.89 0.1 3.25 0.1 2.9 0.1 17 Nagaland 6.17 0.1 6.36 0.1 6.58 0.1 18 Orissa 239.33 5.2 253.22 5.2 252.71 5.1 19 Punjab 86.21 1.9 122.86 2.5 97.04 1.9 20 Rajasthan 24.1 0.5 26.91 0.5 28.2 0.6 21 Sikkim 0.16 0.0 0.16 0.0 0.18 0.0 22 Tamil Nadu 168.88 3.6 181.8 3.7 210.2 4.2 23 Tripura 36 0.8 42.28 0.9 49.23 1.0 24 Uttar Pradesh 349.27 7.5 392.93 8.0 417.48 8.4 25 West Bengal 1294.71 27.9 1338 27.3 1246.15 25.0 26 A& N Islands 0.16 0.0 0.17 0.0 0.19 0.0 27 Chandigarh 0.24 0.0 0.24 0.0 0.24 0.0 28 D & N Haveli 0.05 0.0 0.05 0.0 0.05 0.0 29 Daman & Diu 0.08 0.0 0 0.0 0.12 0.0 30 Delhi 0.71 0.0 0.71 0.0 0.82 0.0 31 Lakshadweep 0 0.0 0 0.0 0 0.0 32 Pondicherry 5.75 0.1 5.85 0.1 5.85 0.1 33 Chhattisgarh 158.7 3.4 174.25 3.6 228.21 4.6 34 Uttaranchal 3.16 0.1 3.49 0.1 3.82 0.1 35 Jharkhand 75.8 1.6 70.5 1.4 71.89 1.4
Total 4637.87 100 4894.14 100 4981.25 100
Source: Department of Animal Husbandry, Dairying & Fisheries, Ministry of Agriculture.

62
Kerala Inland Fisheries statistics- 2013 Department of Fisheries
Table -44 Existing rates of user charges /fees of various services /facilities
rendered by Department of Fisheries a) Selling price of Fish/shrimp seed in government hatcheries and farms in Kerala
(as per G.O(Ms) No.62/12/F&PD dated 31/07/2012)
Sl No Species Average size Rate
Rs per 100 No. 1 White prawn (P.Indicus) PL 20 11.00 2 Tiger Prawn(P.Monodon) PL 20 45.00 3 Scampi ( Macrobrachium romsenbergii) PL 20 60.00
4 Catla ( Catla Catla)
<8mm 1.60 8-25mm 23.00
25-40mm 35.00 40-100mm 50.00
100-150mm 65.00
5 Rohu( Labeo rohita)
<8mm 1.60 8-25mm 23.00
25-40mm 35.00 40-100mm 50.00
100-150mm 65.00
6 Mrigal(Cirrithinus mrigala)
<8mm 1.60 8-25mm 12.00
25-40mm 23.00 40-100mm 35.00
100-150mm 45.00
7 Labeo (Labeo fimbriatus)
<8mm 1.60 8-25mm 12.00
25-40mm 23.00 40-100mm 25.00
100-150mm 40.00
8 Common Carp (Cyprinus carpio)
<8mm 1.60 8-25mm 12.00
25-40mm 30.00 40-100mm 35.00
100-150mm 40.00
9 Silver carp (Hypophthalmichthys molitrix)
<8mm 6.00 8-25mm 50.00
25-40mm 55.00 40-100mm 70.00
100-150mm 100.00
10 Grass carp (Ctenopharyngodon idella)
<8mm 6.00 8-25mm 50.00
25-40mm 60.00 40-100mm 75.00
100-150mm 100.00 11 Milk fish (Chanos chanos) 25mm 300.00

63
Kerala Inland Fisheries statistics- 2013 Department of Fisheries
12 Pearl spot (Etroplus suratensis) 20mm 600.00 30mm 800.00
13 Murrels ( Ophiocephalus Spp.) 300.00 14 Sea bass (Lates calcarifer) 300.00 15 Grey mullet (Mugil cephalus ) 400.00
16 Tilapia(Oreochromis mossambicus) 25-40mm 25.00 40-100mm 30.00
100-150mm 40.00 17 Oxygen packing charges Rs 7.00 per packet
b) Selling price of Ornamental Fish in government hatcheries and farms of Kerala
Sl No Species Rs per pair
Up to 2 months 2-4 months 4 months & above 1 Gold fish 20 30 40 2 Angel fish 20 30 40 3 Golden moly 15 20 30 4 Black moly 10 15 25 5 Black moor 50 75 100 6 Golden rosse 10 15 25 7 Blue gourami 15 25 40 8 Snow white gouramy 15 25 40 9 Coie carp 10 15 25 10 Red thilapia 20 25 30 11 Red sword tail 10 25 40 12 Widow tetra 10 15 25 13 Platy 10 15 25 14 Guppy 5 10 15 15 Half black guppy 10 15 20 16 German guppy 15 20 25 17 Moscow blue(Gu ppy) 10 15 20 18 Tiger barb 10 15 25 19 Silver moli 10 15 25 20 Zebra line 10 15 25 21 Sunlight platy 5 15 25 22 White moly 10 15 25 23 Fitter (One) 10 15 25 24 Rosy barb 10 20 30 25 Sucker fish 30 50 80 26 Miss Kerala 20 40 70

64
Kerala Inland Fisheries statistics- 2013 Department of Fisheries
Table -45 Fees for licensing (Registration/Re-Registration)
of fishing geers & chinese nets/chemmeen vatt in the state (as per G.O (Rt) No.257/10/F&PD ,dated 29.03.09)
Sl
No. Description of Gear Rate (Rs.)
A Chinese Nets
1 Annual Income - Above Rs.1000 200
2 Between Rs.750 & 1000 150
3 Below Rs.750 100
B Free Nets
1 Class I 100
2 Class II 100
3 Class III 100
4 Class IV 100
5 Class V 50
6 Class VI 50
C Kole Net, Kodinet and other nets (Per year) 250
D Chemmeen Vatt (Per Acre) 150
Tabe-46
INLAND FISHERIES – ANNUAL PLAN 2010-11 to 2012-13 (Rs in lakhs)
Name of Scheme Head of Account
Outla
y for
An
nual
Plan
20
10-1
1 Ex
pend
iture
du
ring
20
10-1
1
Outla
y for
2011
-12
Expe
nditu
re
durin
g
2011
-12
Outla
y for
2012
-13
Expe
nditu
re
durin
g
2012
-13
Ranching of Open Water Bodies & Reservoirs 2405-101-74 15 15 15 14.44
Patrolling in Backwaters 2405-101-94 15 3.16 75 72.89 Fish Seed Farms, Nurseries & Hatcheries 2405-101-87 30 20.35 50 24.97 300 187.98
Integrated Scampi/ Fish Culture in kole lands of Thrissur and Paddy fields of Kuttanad
2405-101-71
40 40 100 100 400 400
Integrated Prawn Culture Development Project in Pokkali Lands 2405-101-76 0 100 100
NFDB Assisted scheme for inland fisheries /production enhancement 2405-00-101-66 400 395 400 400 800 800
Conservation and management of fish resources 2405-00-101-62 200 154.87
Matsya Samrudhi 2405-00-101-61 400 400
* Including Central Share

65
Kerala Inland Fisheries statistics- 2013 Department of Fisheries
Table -47
Contribution of fishing to the NSDP at factor cost for the years from 2008-2009 to 2012-2013
(at current price) (Base year: 2004-2005)
Items 2008-09 2009-10 2010-11 2011-12 (Provisional)
2012-13 (Quick)
NET DOMESTIC PRODUCT (RS. in lakh) * 18013436 20606979 23317749 27206498 30933162
Fishing (RS. in Lakh) * 230677 270607 290812 321539 436212
Percentage share of Fisheries to NSDP 1.28 1.31 1.25 1.18 1.41
Growth rate in % 0.04 17.31 7.47 10.57 35.66
Population ('000) * 33958 34216 34467 34708 34942
Per capita income (in Rupees) * 53046 60226 67652 78387 88527
Per capita income of fishermen (Rupees) 20367 23683 25237 32102 43333
* Source: State income Figures – Directorate of Economics & Statistics
Table 48 Contribution of fishing to the NSDP at factor cost for the years
from 2008-2009 to 2012-2013 (at constant price) (Base Year: 2004-2005)
Items 2008-09 2009-10 2010-11 2011-12 (Provisional)
2012-13 (Quick)
NET DOMESTIC PRODUCT (RS. in Lakh) * 14409392 15712270 16717844 18081208 19607691
Fishing (RS. In Lakh) * 147008 146344 141052 145156 141099
Percentage share of Fisheries to NSDP 1.02 0.93 0.84 0.80 0.72
Growth rate in % -0.17 -0.45 -3.62 2.91 -2.79
Population ('000) * 33958 34216 34467 34708 34942
Per capita income (in Rupees) * 42433 45921 48504 52095 56115
Per capita income of fisherman(in Rs.) 12980 12808 12241 14493 14017 * Source: State income Figures – Directorate of Economics & Statistics

66
Kerala Inland Fisheries statistics- 2013 Department of Fisheries
Table 49 Contribution of fishing to the GDP at factor cost for the years
from 2008-2009 to 2012-2013 (at currrent price) (Base year: 2004-2005)
Items 2008-09 2009-10 2010-11 2011-12 (Provisional)
2012-13 (Quick)
GROSS DOMESTIC PRODUCT (RS. in Lakh) * 20278279 23199867 26377330 30790606 34933832
Fishing (RS. in Lakh) * 268413 323461 340990 377018 511478
Growth rate in % 1.89 20.51 5.42 10.57 35.66
Percentage share of Fisheries to GDP 1.32 1.39 1.29 1.22 1.46
Population ('000) * 33958 34216 34467 34708 34942
Per capita income (in Rupees) * 59716 67804 76529 88713 99977
Per capita income of fisherman(in rupees) 23700 28309 29592 37640 50809
* Source: State income Figures – Directorate of Economics & Statistics
Table 50 Contribution of fishing to the GDP at factor cost for the years
from 2008-09 to 2012-13 (at constant price) (Base year: 2004-2005)
Items 2008-09 2009-10
2010-11
2011-12 (Provisional)
2012-13 (Quick)
GROSS DOMESTIC PRODUCT (RS. IN LAKH) * 16265920 17757135 18985071 20495672 22184990
Fishing (RS. IN LAKH) * 178403 188681 179413 184354 181918
Growth rate in % -0.64 5.76 -4.91 2.75 -1.32
Percentage share of Fisheries to GDP 1.1 1.06 0.95 0.9 0.82
Population ('000) * 33958 34216 34467 34708 34942
Per capita income (in Rupees) * 47900 51897 55082 59052 63491
Per capita income of fisherman(in rupees) 15752 16513 15557 18405 18071 * Source: State income Figures – Directorate of Economics & Statistics
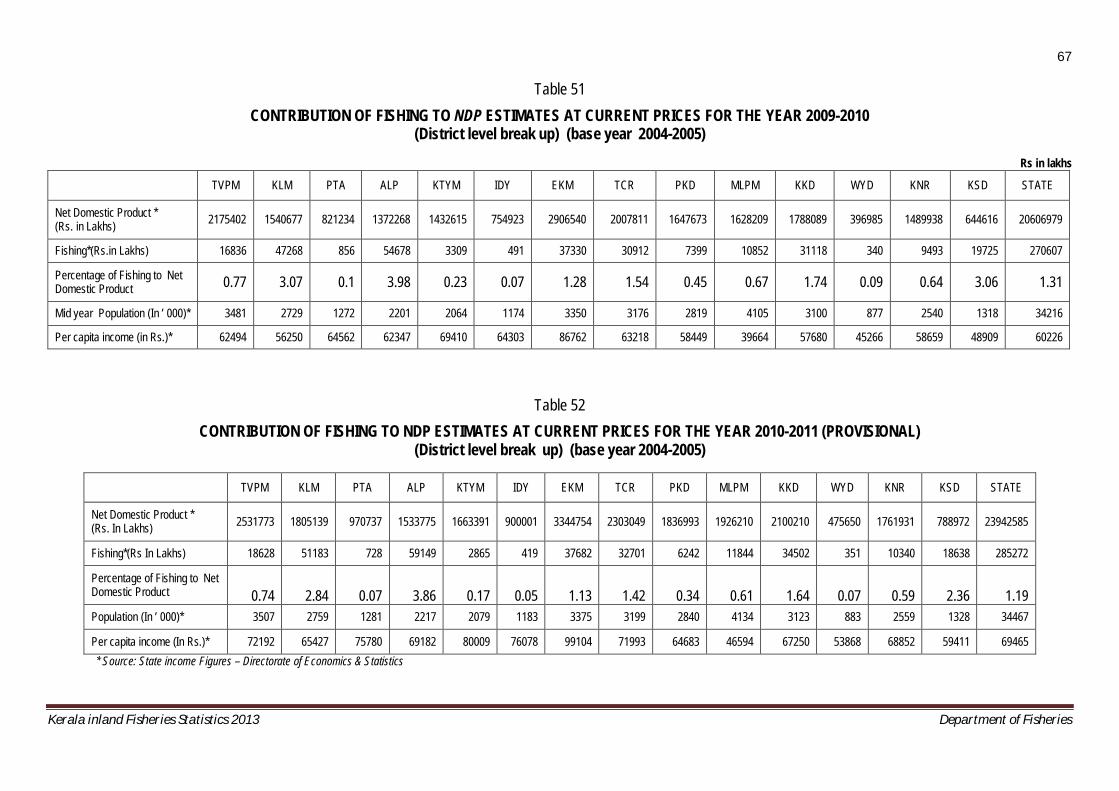
67
Kerala inland Fisheries Statistics 2013 Department of Fisheries
Table 51 CONTRIBUTION OF FISHING TO NDP ESTIMATES AT CURRENT PRICES FOR THE YEAR 2009-2010
(District level break up) (base year 2004-2005)
Rs in lakhs
TVPM KLM PTA ALP KTYM IDY EKM TCR PKD MLPM KKD WYD KNR KSD STATE
Net Domestic Product * (Rs. in Lakhs) 2175402 1540677 821234 1372268 1432615 754923 2906540 2007811 1647673 1628209 1788089 396985 1489938 644616 20606979
Fishing*(Rs.in Lakhs) 16836 47268 856 54678 3309 491 37330 30912 7399 10852 31118 340 9493 19725 270607
Percentage of Fishing to Net Domestic Product 0.77 3.07 0.1 3.98 0.23 0.07 1.28 1.54 0.45 0.67 1.74 0.09 0.64 3.06 1.31
Mid year Population (In ’ 000)* 3481 2729 1272 2201 2064 1174 3350 3176 2819 4105 3100 877 2540 1318 34216
Per capita income (in Rs.)* 62494 56250 64562 62347 69410 64303 86762 63218 58449 39664 57680 45266 58659 48909 60226
Table 52 CONTRIBUTION OF FISHING TO NDP ESTIMATES AT CURRENT PRICES FOR THE YEAR 2010-2011 (PROVISIONAL)
(District level break up) (base year 2004-2005)
TVPM KLM PTA ALP KTYM IDY EKM TCR PKD MLPM KKD WYD KNR KSD STATE
Net Domestic Product * (Rs. In Lakhs) 2531773 1805139 970737 1533775 1663391 900001 3344754 2303049 1836993 1926210 2100210 475650 1761931 788972 23942585
Fishing*(Rs In Lakhs) 18628 51183 728 59149 2865 419 37682 32701 6242 11844 34502 351 10340 18638 285272
Percentage of Fishing to Net Domestic Product 0.74 2.84 0.07 3.86 0.17 0.05 1.13 1.42 0.34 0.61 1.64 0.07 0.59 2.36 1.19 Population (In ’ 000)* 3507 2759 1281 2217 2079 1183 3375 3199 2840 4134 3123 883 2559 1328 34467
Per capita income (In Rs.)* 72192 65427 75780 69182 80009 76078 99104 71993 64683 46594 67250 53868 68852 59411 69465 * Source: State income Figures – Directorate of Economics & Statistics

68
Kerala inland Fisheries Statistics 2013 Department of Fisheries
Table 53 Contribution of fishing to NDP estimates at current prices for the year 2011-2012 (QUICK)
District level break up (base year 2004-2005)
TVPM KLM PTA ALP KTYM IDY EKM TCR PKD MLPM KKD WYD KNR KSD STATE
Net Domestic Product * (Rs. In Lakhs) 2973945 2115450 1139625 1798969 1954513 1054626 3913382 2704849 2152917 2258892 2466923 557834 2069825 925334 28087084
Fishing*(Rs In Lakhs) 20021 55013 783 63575 3080 451 40501 35147 6709 12731 37083 377 11114 20033 306617
Percentage of Fishing to Net Domestic Product 0.67 2.6 0.07 3.53 0.16 0.04 1.03 1.3 0.31 0.56 1.5 0.07 0.54 2.16 1.09
Population (In ’ 000)* 3531 2778 1290 2233 2094 1191 3398 3222 2859 4164 3145 890 2576 1337 34708
Per capita income (In Rs.)* 84224 76150 88343 80563 93339 88550 115167 83949 75303 54248 78440 62678 80350 69210 80924 * Source: State income Figures – Directorate of Economics & Statistics
Table 54 Contribution of fishing to NDP estimates at constant prices for the year 2009-2010
(District level break up) (base year 2004-2005)
TVPM KLM PTA ALP KTYM IDY EKM TCR PKD MLPM KKD WYD KNR KSD STATE
Net Domestic Product * (Rs. In Lakhs) 1684765 1155840 637943 1043510 1099252 545316 2261351 1556704 1225430 1219160 1363644 292779 1137309 489268 15712270
Fishing*(Rs In Lakhs) 10904 28749 259 33050 983 138 18044 17406 1967 6685 20052 65 5828 3968 148098
Percentage of Fishing to Net Domestic Product 0.65 2.49 0.04 3.17 0.09 0.03 0.8 1.12 0.16 0.55 1.47 0.02 0.51 0.81 0.94

69
Kerala Inland Fisheries statistics- 2013 Department of Fisheries
Table 55 Contribution of fishing to NDP estimates at constant prices for the year 2010-2011 (provisional)
(District level break up) (base year 2004-2005)
TVPM KLM PTA ALP KTYM IDY EKM TCR PKD MLPM KKD WYD KNR KSD STATE
Net Domestic Product * (Rs. in Lakhs) 1847688 1259004 696740 1101741 1173633 576400 2434249 1691398 1278344 1332342 1505876 320638 1255520 550117 17023691
Fishing*(Rs in Lakhs) 9087 24967 355 28853 1398 205 18381 15951 3045 5778 16830 171 5044 9092 139155
Percentage of Fishing to Net Domestic Product 0.49 1.98 0.05 2.62 0.12 0.04 0.76 0.94 0.24 0.43 1.12 0.05 0.4 1.65 0.82
Population (in ’ 000)* 3507 2759 1281 2217 2079 1183 3375 3199 2840 4134 3123 883 2559 1328 34467
Per capita income (in Rs.)* 52686 45633 54390 49695 56452 48724 72126 52873 45012 32229 48219 36312 49063 41424 49391
* Source: State income Figures – Directorate of Economics & Statistics
Table 56
Contribution of fishing to NDP estimates at constant prices for the year 2010-2011 (provisional) (District level break up) (base year 2004-2005)
TVPM KLM PTA ALP KTYM IDY EKM TCR PKD MLPM KKD WYD KNR KSD STATE
Net Domestic Product * (Rs. In Lakhs) 2039737 1379699 769696 1211688 1290904 621518 2679942 1868740 1395852 1454271 1655976 348946 1379615 603173 18699759
Fishing*(Rs In Lakhs) 8908 24476 348 28285 1370 201 18020 15638 2985 5664 16499 168 4945 8913 136419
Percentage of Fishing to Net Domestic Product 0.44 1.77 0.05 2.33 0.11 0.03 0.67 0.84 0.21 0.39 1 0.05 0.36 1.48 0.73
Population (In ’ 000)* 3531 2778 1290 2233 2094 1191 3398 3222 2859 4164 3145 890 2576 1337 34708
Per capita income (In Rs.)* 57767 49665 59666 54263 61648 52185 78868 57999 48823 34925 52654 39207 53556 45114 53877
* Source: State income Figures – Directorate of Economics & Statistics