KEO Mooring Engineering Analysis - NOAA Pacific Marine ... · KEO Mooring Engineering Analysis Noah...
34
NOAA Technical Memorandum OAR PMEL-130 KEO Mooring Engineering Analysis Noah Lawrence-Slavas, Christian Meinig, and Hugh Milburn Pacific Marine Environmental Laboratory 7600 Sand Point Way NE Seattle, WA 98115-6349 June 2006 Contribution 2930 from NOAA/Pacific Marine Environmental Laboratory
Transcript of KEO Mooring Engineering Analysis - NOAA Pacific Marine ... · KEO Mooring Engineering Analysis Noah...

NOAA Technical Memorandum OAR PMEL-130
KEO Mooring Engineering Analysis
Noah Lawrence-Slavas, Christian Meinig, and Hugh Milburn
Pacific Marine Environmental Laboratory7600 Sand Point Way NESeattle, WA 98115-6349
June 2006
Contribution 2930 from NOAA/Pacific Marine Environmental Laboratory

NOTICE
Mention of a commercial company or product does not constitute an endorsement byNOAA/OAR. Use of information from this publication concerning proprietary productsor the tests of such products for publicity or advertising purposes is not authorized.
Contribution No. 2930 from NOAA/Pacific Marine Environmental Laboratory
For sale by the National Technical Information Service, 5285 Port Royal RoadSpringfield, VA 22161
ii

Contents iii
Contents
1. Introduction . . . . . . . . . . . . . . . . . . . . . . . . . . . . 11.1 Mooring History . . . . . . . . . . . . . . . . . . . . . . . . . 11.2 Mooring Design . . . . . . . . . . . . . . . . . . . . . . . . . . 5
1.2.1 2004 (Initial) Deployment . . . . . . . . . . . . . . . 51.2.2 2005 Buoy Turn-Around . . . . . . . . . . . . . . . 6
2. Environmental Conditions and Load Cell Data Leading toFailure . . . . . . . . . . . . . . . . . . . . . . . . . . . . . . . . 72.1 Environmental Conditions . . . . . . . . . . . . . . . . . . . . 72.2 2005 Load Cell Post calibration . . . . . . . . . . . . . . . . . 8
3. Mooring Failure Analysis . . . . . . . . . . . . . . . . . . . . 83.1 Line Failure . . . . . . . . . . . . . . . . . . . . . . . . . . . . 83.2 Mooring Wear Analysis . . . . . . . . . . . . . . . . . . . . . 113.3 Shock Loading Analysis . . . . . . . . . . . . . . . . . . . . . 11
4. WHOI CABLE Analysis . . . . . . . . . . . . . . . . . . . . . 174.1 Initial Mooring Analysis . . . . . . . . . . . . . . . . . . . . . 174.2 Post Failure Mooring Analysis . . . . . . . . . . . . . . . . . 18
5. Conclusions . . . . . . . . . . . . . . . . . . . . . . . . . . . . . 255.1 Line Failure . . . . . . . . . . . . . . . . . . . . . . . . . . . . 255.2 2006 KEO Mooring Design . . . . . . . . . . . . . . . . . . . 27
6. Acknowledgments . . . . . . . . . . . . . . . . . . . . . . . . . 29
List of Figures
1 Kess observing array. . . . . . . . . . . . . . . . . . . . . . . . . . . . 22 Buoy positions. . . . . . . . . . . . . . . . . . . . . . . . . . . . . . . 23 2004 mooring configuration. . . . . . . . . . . . . . . . . . . . . . . . 34 2005 mooring configuration. . . . . . . . . . . . . . . . . . . . . . . . 45 NOAA PMEL 3/8′′ jacketed wire rope fairing. . . . . . . . . . . . . . 56 2005 KEO buoy. . . . . . . . . . . . . . . . . . . . . . . . . . . . . . 77 KEO site current profiles. . . . . . . . . . . . . . . . . . . . . . . . . 88 Physical conditions for the 6 months leading to failure. . . . . . . . . 99 Physical conditions for the week prior to failure. . . . . . . . . . . . 1010 Pre and post-2005 deployment load cell calibration curve. . . . . . . 1111 3/4′′ 8-strand plaited nylon: section A change in pik length. . . . . . 1212 3/4′′ 8-strand plaited nylon line structure in vicinity of break. . . . . 1313 3/4′′ 8-strand plaited nylon: section C pik detail. . . . . . . . . . . . . 1414 3/4′′ 8-strand plaited nylon: section C kink. . . . . . . . . . . . . . . 1415 3/4′′ 8-strand plaited nylon: section F (top view). . . . . . . . . . . . 1516 3/4′′ 8-strand plaited nylon: section F (bottom view). . . . . . . . . . 1517 3/4′′ 8-strand plaited nylon: section F–G parted end. . . . . . . . . . 1618 3/4′′ 8-strand plaited nylon: section G parted end. . . . . . . . . . . . 1619 3/4′′ 8-strand plaited nylon: KEO recovered nylon cut fiber patch. . . 1720 Clevis wear between the 2004 deployment and the 2005 deployment. 1721 Archived WW3 satellite wave data for wave heights. . . . . . . . . . 1822 CABLE static line tension vs. water depth, 2004 deployment. . . . . 1923a Physical conditions for 6 days bracketing 2005156190000. . . . . . . 2123b CABLE dynamic line tension vs. time for 2005156190000. . . . . . . 2124a Physical conditions for 6 days bracketing 2005187190000. . . . . . . 22

iv Contents
24b CABLE dynamic line tension vs. time for 2005187190000. . . . . . . 2225a Physical conditions for 6 days bracketing 2005197130000. . . . . . . 2325b CABLE dynamic line tension vs. time for 2005197130000. . . . . . . 2326a Physical conditions for 6 days bracketing 2005285070000. . . . . . . 2426b CABLE dynamic line tension vs. time for 2005285070000. . . . . . . 2427 CABLE dynamic line tension vs. time for the week preceding failure. 2528 Damage to 3/8′′ jacketed wire rope at a depth of ∼547 m. . . . . . . 2629 Damage to 3/8′′ jacketed wire rope at a depth of ∼547 m. . . . . . . 2630 TAO 3/4′′ 8-strand plaited nylon: pic length change (E927). . . . . . 2631 WHOI CABLE dynamic line tension vs. time, 2006 deployment vs.
2005 deployment. . . . . . . . . . . . . . . . . . . . . . . . . . . . . . 2732 WHOI cable dynamic line tension vs. time, 2006 deployment, for
mean currents, max currents, and max currents +30% . . . . . . . . 2833 KEO 2006 deployment mooring profile during max currents. . . . . . 2834 KEO 2006, mooring configuration. . . . . . . . . . . . . . . . . . . . 30

KEO Mooring Engineering Analysis
Noah Lawrence-Slavas, Christian Meinig, and Hugh Milburn
Abstract. As a contribution to the global network of OceanSITES time series reference sites aKuroshio Extension Observatory (KEO) mooring was deployed by NOAA/PMEL in the recircula-tion gyre in June 2004. The low-cost KEO mooring includes a suite of meteorological, chemical,subsurface, and engineering instrumentation reporting in real time. The mooring was designed towithstand the strong and deep western ocean boundary currents, and the harsh surface conditionsfound in the Kuroshio Extension region. The observatory returned near 100% data return for 18months, providing an important data set in an area that is sparsely sampled and has the largestair-sea fluxes in the Pacific. On 6 November 2005, in relatively benign conditions, the KEO buoybroke loose from its mooring and fortuitously was recovered 2 days later. Post failure inspectionof the mooring line revealed the mooring had parted in the middle of a continuous section of 3/4′′
nylon, 300 m below the lower terminus of the jacketed wire rope, ∼1000 m below the surface. Ad-ditionally, analysis of the load cell data exposed concerning patterns of shock loading throughoutthe deployment period. This report focuses on the KEO mooring design and failure analysis. Thewealth of environmental and engineering data available for this mooring gave PMEL engineers arare opportunity to compare model results with actual observations.
1. Introduction
1.1 Mooring History
The KEO (Kuroshio Extension recirculation gyre Observatory, www.pmel.noaa.gov/keo) buoy was deployed by PMEL in the North Pacific Ocean,southeast of Yokohama, Japan in 5685 m of water on 16 June 2004 at32◦21.0′N, 144◦ 38.2′E (see Fig. 1). The buoy and upper 700 m of moor-ing were replaced in May 2005 (see Figs. 3 and 4). The KEO mooring is amodified TAO mooring, designed for the harsh conditions of the KuroshioExtension region (see Fig. 3 (2004) and Fig. 4 (2005)). Modifications include:
• Slack line reverse catenary mooring design, with scope (mooring line/water depth) of 1.4
• Sonic anemometer
• Modifications to the buoy platform and mooring line for added buoy-ancy and reduced drag
• 3100 kg anchor
The KEO mooring carries a suite of meteorological sensors to measure pCO2,winds, air temperature, relative humidity, rainfall, and solar and longwaveradiation. Additionally, the KEO mooring carries surface and subsurfaceinstrumentation for measuring temperature and salinity and currents from1 m to 500 m, and a load cell located at the upper terminus of the mooring,between the buoy bridle and inductive cable. Sensor information is trans-mitted back to PMEL in “near real time” using satellite communications.
The KEO buoy, sensors, and the upper 700 m (inductive cable) of themooring were replaced on 28 May 2005 as part of the regularly scheduled

2 N. Lawrence-Slavas et al.
maintenance cycle. PMEL’s pCO2 (air-sea CO2 flux) measurement systemwas added to the instrumentation suite during this platform swap, three Son-tek current sensors were added to the inductive cable, 17 additional temper-ature/salinity modules, and a 2nd-generation load cell (IPS V918) replacedthe 1st-generation load cell on the original mooring. The 1st-generation loadcell (IPS1/V910) recovered during the May swap had failed after ∼6 months,when the data cable connecting the load cell to the CPU package failed dueto bending fatigue acting on a small section of unsupported cable. Addi-tionally, post deployment calibration showed that the 1st-generation load
Figure 1: Kess observing array.
Figure 2: Buoy positions.

KEO Mooring Engineering Analysis 3
2,279 METERS BOUYANT POLYOLEFIN MOORING LINE
4,900 METERSNYLON LINE,CONTINUOUS
700 METERS
KEO
1 MAY 2004Rick Miller
7600 Sandpoint Way NESeattle, Wa. 98115(206) 526-6149
DRAWN BY:
APPROVED BY:
DATE:
DATE:
MOORING:
SCOPE:
NOAA-PMEL-KE
1.4:1
TC5 METERS
700 METERS WIRE ROPE
FAIRING TO 500 METERS
TC10 METERS
50 METERS
25 METERS TC
TC
75 METERS TC
100 METERS TP
150 METERS TC
200 METERS TC
300 METERS TP
400 METERS TC
500 METERS TP
5/8" SAS
5/8" SAS WITH BUSHING.5 METER CHAIN
5/8" SAS5 TON SWIVEL
IRIDIUM/POSITIONING BEACON GPS
SHORT ANDLONG WAVERADIATION
AIR TEMPERATURE,RELATIVE HUMIDITY
RAIN GAGE
HANDAR 425 SONIC ANEMOMETER
KEO
RADAR REFLECTOR
DEPTH: 5650 METERS
10 METERS NYLONSTIFFENER
3/4" SAS
.5 M 1/2" CHAIN
5/8" SAS
4 M 1/2" CHAIN
5/8" SAS
ANCHOR WEIGHT6,820#
1 M 1/2" CHAIN
5/8" SAS
EYE INTO EYESPLICE
17" GLASS BALL FLOATS
5/8" SAS
5/8" SAS3 TON SWIVEL
ACOUSTIC RELEASE
20 METERS 1 1/8"NYLON
5/8" SAS
5/8" SAS
3/4" SAS.5 METER CHAIN
5/8" SAS2 METER CHAIN
.5 METER CHAIN3/4" SAS WITH BUSHING
INDUCTIVE CABLE BREAKOUT
1 METER
2 LINKS 1" CHAIN1" SAS
1 1/8" SASLOAD CELL
SSC
1" SAS
CABLE BRACKET
Figure 3: 2004 mooring configuration.

4 N. Lawrence-Slavas et al.
2,279 METERS BOUYANT POLYOLEFIN MOORING LINE
10 METERS NYLONSTIFFENER
3/4" SAS
.5 M 1/2" CHAIN
5/8" SAS
4 M 1/2" CHAIN
5/8" SAS
ANCHOR WEIGHT6,820#(3,100 KG)
1 M 1/2" CHAIN
5/8" SAS
EYE INTO EYESPLICE
17" GLASS BALL FLOATS
5/8" SAS
5/8" SAS3 TON SWIVEL
ACOUSTIC RELEASE
20 METERS 1 1/8"NYLON
5/8" SAS
5/8" SAS
3/4" SAS.5 METER CHAIN
5/8" SAS2 METER CHAIN
.5 METER CHAIN3/4" SAS WITH BUSHING
TC INVERTED5 METERS
697.4 METERS WIRE ROPE
FAIRING TO 525 METERS
SONTEK7 METERS
10 METERS8.3 METERS TV
TC INVERTED
37 METERS
75 METERS
100 METERS
TC INVERTED
125 METERS
TP
225 METERS
300 METERS
TC INVERTED
15 METERS
17 METERS SONTEK
25 METERS
TC INVERTED
TC INVERTED
35 METERS
SONTEK
18.3 METERS TV
38.3 METERS TV
TC INVERTED50 METERS
150 METERS
TC
TC
175 METERS
200 METERS
250 METERS
275 METERS
325 METERS
TP
TC
T
TP
TC
TP
TC
700 METERS5/8" SAS
5/8" SAS WITH BUSHING.5 METER CHAIN
5 TON SWIVEL
4,900 METERSNYLON LINE,CONTINUOUS
INDUCTIVE CABLE BREAKOUT
IRIDIUM/POSITIONING BEACON GPS
SHORT ANDLONG WAVERADIATION
AIR TEMPERATURE,RELATIVE HUMIDITY
RAIN GAGE
GILL SONIC ANEMOMETER
KEO
RADAR REFLECTOR
1 METER
2 LINKS 1" CHAIN1" SAS
1 1/8" SASLOAD CELL
SSC
1" SAS
CABLE BRACKETTORQUE load celland isolator platebolts to 120 lb. ft.
INDUCTIVE CABLE BREAKOUT
SOLID CORE CO2 BUOY
375 METERS
400 METERS
425 METERS
450 METERS
475 METERS
500 METERS
525 METERS
TP
TC
TP
T
TC
TP
TC525 METERS
T350 METERS
KEO
20 MAY, 2005Rick Miller
7600 Sandpoint Way NESeattle, Wa. 98115(206) 526-6149
DRAWN BY:
APPROVED BY:
DATE:
DATE:
MOORING:
SCOPE:
NOAA-PMEL-KE
1.4:1
DEPTH: 5650 METERSMOORING LINE FAILURE350m below upper nylon termination
DRAWING NOT TO SCALE
Nylon Segment Lower Splice250m below failure point
Nylon Segment Upper Splice300m above failure point
550m Fish Bite Damage
Figure 4: 2005 mooring configuration.

KEO Mooring Engineering Analysis 5
cell had “drifted” during deployment, and that all of the recovered load celldata was corrupt. The 2nd-generation load cell addresses the issues withthe 1st-generation load cell, including replacing the 1st generation’s voltageoutput with a current output.
On 12 October 2005 the pCO2 system ceased transmitting (see pCO2
KEO Failure.doc), and at ∼1510Z 6 November 2005 position data indicatedthat the KEO mooring had gone adrift (see Fig. 2). Before the pCO2 systemceased transmitting, the lab was receiving GPS position data on the KEOmooring every 3 hours. After the pCO2 system failed, GPS position datawas received every 3 days via the IPS-load cell instrument, and 11 times perday via Argos.
The buoy, 700 m of inductive cable, 350 m of nylon mooring line, andall instruments were recovered by the RV Kaiyo on 8 November 2005, only2 days after the mooring went adrift. The recovered mooring was thentransported fully assembled to Japan, where it was carefully broken downby a PMEL mooring technician, packaged, and shipped back to Seattle,Washington.
1.2 Mooring Design
1.2.1 2004 (Initial) Deployment
The KEO mooring was designed as a slack line reverse catenary mooring.The mooring was designed to have a scope of 1.4 to survive in harsh currentregimes, and the reverse catenary design keeps the upper segment of themooring fairly vertical. The mooring is composed of the following segments(top to bottom):
1. The KEO buoy is a 2.3 m ATLAS toroid with the center “donut” holeglassed over and filled with foam. The gross displacement of the buoyis ∼5600 lbs, and the net positive displacement of the entire mooringsystem is ∼5040 lbs.
2. Non-rotating 3/8′′ (0.92 cm) diameter wire rope jacketed to 1/2′′ (1.27 cm)is used in the upper 700 m to guard against damage from fish bite, andto form the inductive loop. The upper 500 m of this cable are fairedwith PMEL’s extruded plastic snap on fairings (see Fig. 5). The fairingdesign is based on a standard airfoil shape with a t/c (width/length)around 0.25.
Figure 5: NOAA PMEL 3/8′′ jacketed wire rope fairing.

6 N. Lawrence-Slavas et al.
3. Plaited 8-strand 3/4′′ (11/16′′ nom., 1.9 cm) diameter nylon line is usedfor the next 4900 m of the mooring (composed of ∼550 m line segments“end to end braided short spliced” together). The upper 10 m is coatedwith polyurethane nylon stiffener.
4. The nylon is then “end to end braided short spliced” to 2280 m ofbuoyant 7/8′′ polyolefin line.
5. The anchor is fabricated from scrap railroad wheels and weighs∼3100 kg.
All hardware is standard equipment as used in other PMEL moorings anddeployments follow the traditional anchor last routine. Subsurface modulesare clamped around the jacketed cable, and are standard TAO instrumenta-tion.
For the 2004 deployment, the mooring was rigged as shown in Fig. 3.The mooring modeling program, WHOI CABLE, was used to evaluate themooring design prior to the initial deployment.
1.2.2 2005 Buoy Turn-Around
The KEO mooring survived for 18 months before failure. After 12 monthsthe mooring was serviced. Servicing was performed by lifting the buoy out ofthe water with the ship’s crane, and then recovering the 700 m of wire ropewith a capstan. The procedure was designed to recover and replace onlythe buoy and wire rope, not the nylon. Excellent ship handling, centeringthe ship directly above the anchor using the signal from the acoustic release,and the 1.4:1 scope of the mooring, allowed the recovery to be accomplished,while keeping the load below the SWL of the wire and nylon. Redeploymentconsisted of substituting a new buoy, a new piece of 700 m of wire andattached instruments, a new swivel and 1/2 m piece of chain, above the nylon.Additionally the following changes were made (see Fig. 4):
• Added 3 Sontek current sensors to the inductive cable (within the top37 m of mooring, ∼ neutrally buoyant).
• Added 17 temperature/salinity modules to the inductive cable (+17lbs. wet weight).
• Added a buoy mounted pCO2 system (+150 lbs. embedded in buoy∼12′′ above waterline) (see Fig. 6).
• Replaced 1st-generation load cell with 2nd-generation load cell (phys-ical dimensions nearly identical).

KEO Mooring Engineering Analysis 7
2. Environmental Conditions and Load Cell DataLeading to Failure
2.1 Environmental Conditions
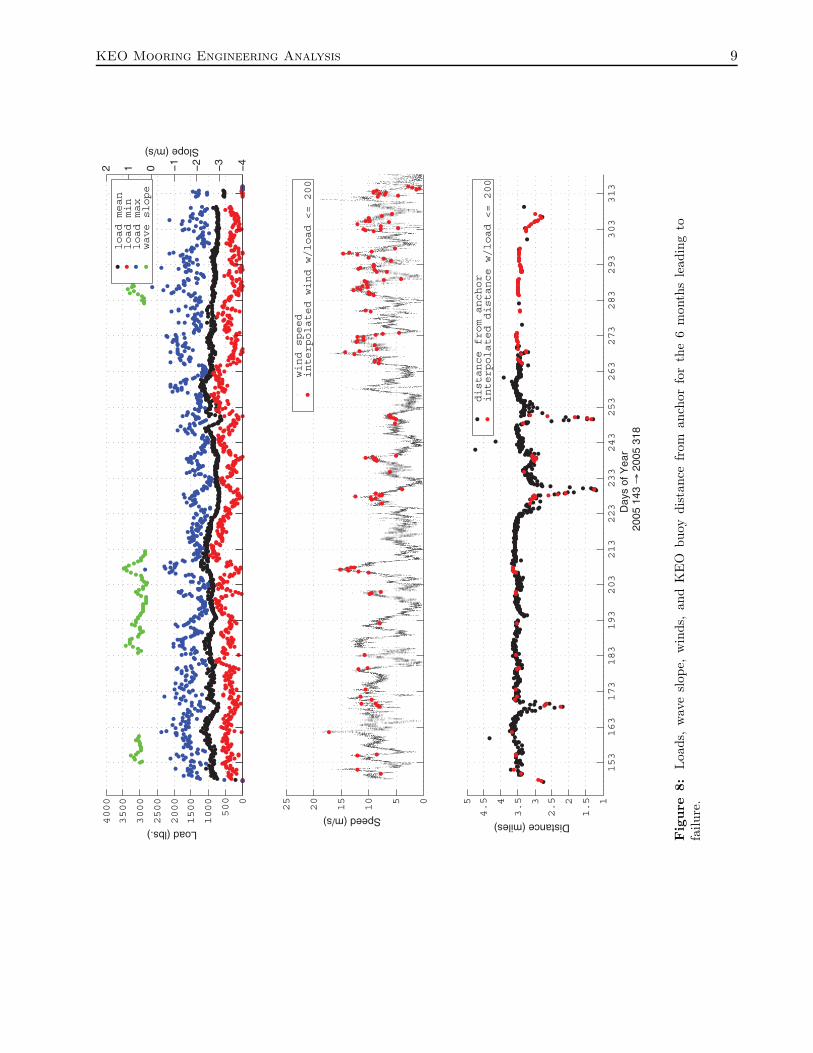
The following figures (Figs. 7–8) show the environmental conditions observedat the KEO mooring site for the 6-month period ending in the mooringfailure. The load cell data (upper terminus of the mooring, between thebuoy bridle and inductive cable) collected during this time is of particularinterest.
The KEO mooring was subjected to disturbingly high levels of “shockloading” during the last 6 months of its life. Since the 2004 deploymentload cell failed during deployment, it is possible the mooring may have beenexperiencing shock loading over its entire 18-month life. Shock loading oc-curs when the tension within a segment of the mooring line drops to zero,causing the line to momentarily go slack. When the tension is re-appliedto the line, the slack is rapidly taken in, causing an abrupt increase in linetension. The instances of shock loading can be directly related to periods ofhigh wind at the mooring site (see Fig. 8). A comparison of wave “slopes”(Wave Height/1/2 * Wave Period, obtained from WW3 satellite wave maps)at the mooring site during these periods of high shock loading is shown inFigs. 8 and 9. Additionally, Fig. 9 shows the loads and conditions seen by the
05/06XX
D
C
B
A
B
C
D
678
8 7 6 5 4 3 2 1
5 4 3 2 1
AAPPROVALS
1
NOAA-PMELCAD GENERATED DRAWING,DO NOT MANUALLY UPDATE
SCALE:
CAD FILE:
SHEET:
OF
DATE
DRAWN CHECKED
UNLESS OTHERWISE SPECIFIEDDIMENSIONS ARE IN INCHES
B
TOLERANCES ARE:
FRACTIONS ANGLES
NAME:
DECIMALS SIZE:1 2005 KEO Buoy
PROJECT:
Engineering Division
Sheet1
Seattle, WA 98115
0.002DO NOT SCALE DRAWING 1
1/16
.XXX
206-526-6175
NTS
7600 Sand Point Wy NE
.X 0.05.XX 0.02
SHEET
NLS
2005 KEO BUOY COMPONENTS
TAO - KEO
pCO2 SystemLoad Cell
Electronics Tube
Upper Terminusof Mooring
Figure 6: 2005 KEO buoy.

8 N. Lawrence-Slavas et al.
mooring during the week prior to failure. The red dots labeled “interpolatedwind with load ≤200 lbs” correspond to the times at which the minimummooring line tension fell below 200 lbs.
2.2 2005 Load Cell Post calibration
Upon recovery, a post calibration routine was run on the load cell. Com-paring this post-calibration to the pre-deployment calibration showed thatsometime during the KEO deployment the load cell drifted ∼75 lbs. in thepositive (heavy) direction (see Fig. 10). After consideration, it was deter-mined that this drift could be attributed to errors in the calibration process,and that a 75-lb. error would be lost in the “noise” during deployment andconsidered insignificant to the overall load cell results.
3. Mooring Failure Analysis
3.1 Line Failure
The KEO mooring line parted at a point 350 m below the junction betweenthe inductive cable and the plaited 8-strand 3/4′′ (11/16′′ nom.) nylon line,approximately 1050 m below the surface (see Fig. 4). The mooring linefailed approximately in the middle of a 550 m piece of nylon (∼300 m below
0
1000
2000
3000
4000
5000
6000
7000
0 0.2 0.4 0.6 0.8 1 1.2 1.4 1.6 1.8
Current Velocity (m/s)
Wat
er D
epth
(m)
Design Current
0
200
400
600
800
1000
1200
1400
1600
1800
2000
0 0.5 1 1.5 2 2.5
Current Velocity (m/s)
Wat
er D
epth
(m)
Max +50% Current
Max +30% Current
Max Current
Mean Current
(a) (b)
Figure 7: (a) Initial “best guess” current profile, used to design the 2004–2005 KEO mooring. (b) Observed2005 current profile at KEO site (please note that the current profile is only shown to 2000 m; beyond 2000 mthe current remains constant all the way to the bottom at ∼5650 m).
KEO Mooring Engineering Analysis 9
0
500
1000
1500
2000
2500
3000
3500
4000
Load (lbs.)
4321
012
Slope (m/s)
05
10
15
20
25
Speed (m/s)
153
163
173
183
193
203
213
223
233
243
253
263
273
283
293
303
313
1
1.52
2.53
3.54
4.55
Distance (miles)
Day
s of
Yea
r20
05 1
43
200
5 31
8
load mean
load min
load max
wave slope
wind speed
interpolated wind w/load <= 200
distance from anchor
interpolated distance w/load <= 200
Fig
ure
8:Loa
ds,
wav
esl
ope,
win
ds,
and
KE
Obu
oydi
stan
cefr
oman
chor
for
the
6m
onth
sle
adin
gto
failu
re.

10 N. Lawrence-Slavas et al.
0
500
1000
1500
2000
2500
3000
3500
4000
Load
(lb
s.)
4
3
2
1
0
1
2
Slo
pe (
m/s
)
0
5
10
15
20
25
Spe
ed (
m/s
)
304 305 306 307 308 309 310 3112.7
2.8
2.9
3
3.1
3.2
3.3
3.4
3.5
Dis
tanc
e (m
iles)
Days of Year2005 303 2005 311
load meanload minload maxwave slope
wind speedinterpolated wind w/load <= 200
distance from anchorinterpolated distance w/load <= 200
Adrift!Adrift!
Figure 9: Loads, wave slope, winds, and KEO buoy distance from anchor for the week prior to failure.
the upper line segment splice, and ∼250 m above the lower splice). Therecovered inductive cable did show apparent fish bite damage at ∼547 m ofwater depth (Figs. 28 and 29).
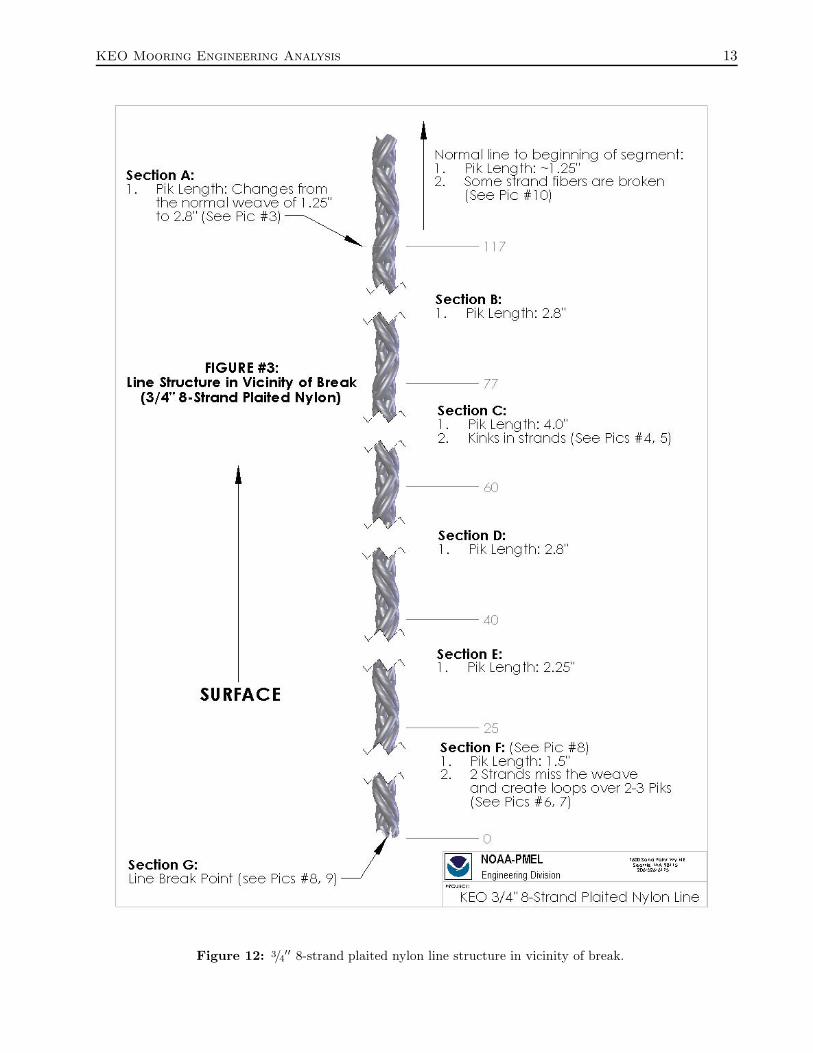
The cause of the line failure is not readily apparent; the unusual mooringline structure in the vicinity of the break is summarized below, and shownin the following figure and photos (Fig. 12).
1. Variable pik lengths of the nylon weave in the segment of line within∼3.0 m of the break (see Figs. 11, 13, 14, and 17). Visual inspectionof the rest of the 350 m of nylon line recovered did not show thisstructural abnormality in any other location.
2. Strange loops in the line just before the break point that seem to becaused by two strands of the 8-strand line getting hung on each otherand missing the weave for 2–3 pik lengths (see Figs. 15 and 16).
3. Kinks in the individual line strands in the areas of the line that havean especially long (∼4′′) pik length (see Fig. 14)

KEO Mooring Engineering Analysis 11
-1000
0
1000
2000
3000
4000
0 200 400 600 800 1000
0 200 400 600 800 1000
IPS V918 &LCA0502075 postcal 1_20_2006
1/06 postcal4/05
y = 65.361 + 4.6757x R= 1
y = -9.9079 + 4.6803x R= 0.99999
1/06
pos
tcal
B
E
Figure 10: Pre and post-2005 deployment load cell calibration curve.
In addition to the unusual line structure in the vicinity of the break,the rest of the 350 m of recovered line exhibited regularly spaced patchesof cut fibers along the outside of the woven strands (see Fig. 19). Studyingpictures and notes of the deployment layout failed to yield an explanation forthese cut fibers, although the line could have been damaged during recoveryoperations.
3.2 Mooring Wear Analysis
The clevis is the uppermost terminus of the KEO mooring line, and is hardbolted to the buoy bridle just below the load cell (see Fig. 4). Previousobservations indicate that of all the components within the mooring system,the clevis exhibits the highest amount of wear. A comparison of the wearpatterns between the initial (12 month) KEO deployment and the second (6month) deployment showed that the respective clevises exhibited approxi-mately the same amount (∼1/32′′) of wear for both deployments. Since the2nd deployment’s duration was half that of the first deployment, it is as-sumed that the 2nd deployment’s mooring system experienced significantlyhigher levels of “working” than the initial KEO deployment’s mooring (seeFig. 20).
3.3 Shock Loading Analysis
A careful comparison of the KEO load cell data to the wind data, and theWW3 satellite (NOGAPS) wave data (see Fig. 21, and https://navy.ncdc.noaa.gov/products/products.html) shows that the KEO mooring beginsto experience shock type loading when the wave slope becomes steeper than

12 N. Lawrence-Slavas et al.
∼0.70 m/s, and the worst shock loading occurs in wave slopes greater than∼1 m/s (see Fig. 8).
A rough numerical calculation of the terminal vertical velocity of theupper 700 m of the mooring was determined using the following equation:
Fdt = 1/2 *(Cdtflat plate)*(ρ)*(A)*(μ2) + 1/2 *(Cdtcable)*(ρ)*(A)*(μ2) +1/2 *(Cdtline)*(ρ)*(A)*(μ2)
The drag force was assumed to be the weight of the mooring in water, theend effects of the instruments were calculated by assuming the instrumentsapproximated a single flat plate (Cdtflat plate = 1.17), the tangential drag ofthe faired cable was calculated using a drag coefficient (Cdtcable) of 0.03, andthe tangential drag coefficient (Cdtline) of the mooring line was assumed to be0.003. The Cdtcable value of 0.03 was a best guess, “dart throw,” 0.03 being afactor of 10 greater then the Cdt of bare cable. The results of this calculationsuggested that the instruments and the mooring line contribute relativelylittle tangential (vertical) drag to the mooring system when compared tothe tangential drag of the faired cable, and that the calculated terminalvelocity of the upper 700 m of mooring is ∼1.10 m/s.
To calculate the mooring’s terminal velocity with the wave slope data,it was assumed that the wave slope approximates the vertical rise and fallvelocity of the KEO buoy in a given sea state. Therefore it appears that theterminal velocity of the KEO mooring is approximately 0.7 m/s (wave slopeat which shock loading begins to occur), not the 1.10 m/s calculated above.This error can probably be attributed to an error in the initial guess for theCdt of the faired cable (0.03 should be higher), and the fact that in real lifethe nylon and polyolefin segments of the mooring line are not truly vertical,thus the Cdtline of 0.003 that was used for the line drag calculation shouldbe higher. Shock loading occurs when the KEO buoy, traveling down thebackside of a wave, falls faster than the mooring line, causing the mooring
Figure 11: 3/4′′ 8-strand plaited nylon: section A change in pik length.
KEO Mooring Engineering Analysis 13
Figure 12: 3/4′′ 8-strand plaited nylon line structure in vicinity of break.

14 N. Lawrence-Slavas et al.
Figure 13: 3/4′′ 8-strand plaited nylon: section C pik detail.
Figure 14: 3/4′′ 8-strand plaited nylon: section C kink.

KEO Mooring Engineering Analysis 15
Figure 15: 3/4′′ 8-strand plaited nylon: section F (top view).
Figure 16: 3/4′′ 8-strand plaited nylon: section F (bottom view).

16 N. Lawrence-Slavas et al.
Figure 17: 3/4′′ 8-strand plaited nylon: section F–G parted end.
Figure 18: 3/4′′ 8-strand plaited nylon: section G parted end.

KEO Mooring Engineering Analysis 17
Figure 19: 3/4′′ 8-strand plaited nylon: KEO recovered nylon cut fiber patch.
Figure 20: Clevis wear between the 2004 (12-month) deployment and the 2005 (6-month) deployment.
to go momentarily slack. When the buoy begins to climb the face of thenext wave this slack is abruptly taken in, causing the shock loading seen inthe load cell data. After running many iterations of the KEO mooring in atime domain numerical model, it was determined that the Cdt of the fairedcable is ∼0.0501 (see: 4.2, “Post Failure Mooring Analysis”).
4. WHOI CABLE Analysis
4.1 Initial Mooring Analysis
Before the initial deployment, the mooring was statically analyzed in WHOICABLE using a “best guess” current profile (see Fig. 7a), and without theaddition of the subsurface instrumentation (see Fig. 22). WHOI CABLE is atime domain numerical simulation of moored and towed oceanographic sys-

18 N. Lawrence-Slavas et al.
Figure 21: Archived WW3 satellite wave data for wave heights.
tems developed at WHOI. Unfortunately, the load cell deployed during theinitial deployment failed, so we were unable to compare the initial CABLEmodel with measured load data.
4.2 Post Failure Mooring Analysis
After the KEO mooring failed, a concerted effort was made to build an accu-rate KEO mooring model in WHOI CABLE. During this modeling processall mooring material properties were double checked for accuracy, and thesubsurface instruments were modeled as materials and added to the mooringmodel. Special attention was paid to the faired inductive cable, which wasassumed to be the most important unknown variable in the mooring system.
The effects of changing different WHOI CABLE input variables werecarefully studied during the model development process. The results ofmodeling the subsurface instruments as “connectors” vs. “materials” waslooked at and found to increase the mooring line tension results in the lineabove the instruments by ∼6% when using “connectors.” The effects ofwind forcing upon the model was found to be negligible (>3%) to overallresults. Varying the tangential drag coefficient of the faired cable was foundto greatly impact the tension “spread” (max-min) of the mooring line, whilehaving a minimal impact on mean mooring tension. Manipulating the waveforcing inputs was also found to impact the mooring tension “spread,” al-though to a lesser extent than the tangential drag coefficient. Varying thenormal drag coefficient of the faired cable by a factor of 10, using a currentprofile of ∼(0, 0.10) (280, 0.83) (500, 0.75) (2000, 0.38) (6000, 0), was foundto have only a minimal impact on the mean mooring tension (∼100 lbs.).The current forcing input was found to have significant impact on the mean

KEO Mooring Engineering Analysis 19
1900
2000
2100
2200
2300
2400
2500
2600
2700
0 500 1000 1500 2000 2500 3000 3500 4000 4500 5000 5500 6000
Water Depth (meters)
Tens
ion
(Lbs
)
Figure 22: CABLE static line tension vs. water depth, 2004 deployment no instruments.
tension of the mooring, and it is one of the most important forcing inputsin the CABLE model.
In order to attempt to obtain more accurate tangential and normal dragcoefficients for the faired cable, a test procedure was developed in which theterminal velocity of the faired inductive cable was obtained experimentallythrough repetitive vertical and horizontal faired cable drops in the NOAAdive tower. Unfortunately, while this method yielded accurate numbers forthe drag on an un-faired cable, the fairings reduced the drag force to suchan extent that noise in the data caused by the experimental techniques over-whelmed the drag caused by the faired cable, yielding erroneous results.Equating the observed terminal fall velocity of the mooring to the calcu-lated velocity (see 3.3, “Shock Loading Analysis”) yielded a tangential dragcoefficient for the faired inductive cable of ∼0.108.
Once the KEO mooring was built in CABLE (see: {KEO}{KEO2}{xxxx}{0}.cab), the model was verified for accuracy. This was accomplished bycomparing the static mooring tensions, the tension “spread,” instrumentdepths, and the horizontal distances of the buoy from the anchor obtainedfrom the CABLE model during four, distinct, real-life environmental condi-tions, to the actual load cell data, instrument depth recordings, and buoypositions seen during these environmental conditions. These deployment“snapshots” were picked to cover the range of environmental conditions ob-served at the deployment site, and special care was taken to eliminate theeffects of changing conditions by taking these “snapshots” in the middleof times of relatively stable environmental conditions. The KEO mooring

20 N. Lawrence-Slavas et al.
presented PMEL with a unique post analysis opportunity, due to the largeamount of data available on the current profile (primary forcing function) atthe buoy site. The complete current profile at the KEO site was collectedfrom WHOI’s ADCP profiling buoy array (see Fig. 1). Inputting the meancurrent profile at the KEO site from 2005 as the primary CABLE forcingfunction (see Fig. 7b), yielded mean tension results within 60 lbs. for all snap-shots except 20051871900. For that snapshot, the mean current profile wasadjusted by increasing the current profile by 0.1 m/s to yield accurate ten-sion results. A study of the Navy’s current forecast model, NLOM (http://www7320.nrlssc.navy.mil/global_nlom32/kur.html), did not yield con-clusive evidence as to why snapshot 20051871900 had higher mean tensionsthan the other periods sampled. However, NLOM did indicate that themooring site may have encountered a “spin off” current during that time.
The faired inductive cable’s normal and tangential drag coefficients werethen adjusted (starting at the guess of 0.108, from above) so the CABLEresults were in line with the measured results. Since the normal and tangen-tial drag coefficients of circular line are well known, these numbers were notadjusted. The final normal drag coefficient for the faired cable was set at 0.3,and the tangential drag coefficient was set at 0.0501. The “instruments asmaterials” model was used to mimic the KEO mooring because “materials”more accurately mimic actual bodies in WHOI CABLE dynamic solutions(materials treat drag forces based on shape, not the “approximate sphere”used for connectors). CABLE model results for instrument depth comparedto within 2.5% of observed instrument depth (CABLE was always on thedeep side), and CABLE results for the horizontal distance from the anchorwere within 10% (CABLE always showed the buoy closer to the anchor thenobserved results). It should be noted that the CABLE results for distancefrom anchor were almost always ∼10% under, and might be due to a differ-ence in actual deployment depth compared to designed deployment depth.Tension “spread” results were within 8% (∼70 lbs.) of overall tension, aswere the mean tension results (∼60 lbs.).
The dynamic results of these mooring models, and the actual conditionsobserved, are shown below (See Figs. 23–27). The dynamic output of thisCABLE file for the time frame in the vicinity of the break is shown in Fig. 27(see Fig. 9 for observed forces).

KEO Mooring Engineering Analysis 21
0
500
1000
1500
2000
2500
3000
3500
4000
Load
(lb
s.)
4
3
2
1
0
1
2
Slo
pe (
m/s
)
0
2
4
6
8
10
12
14
16
Spe
ed (
m/s
)
153 154 155 156 157 158 159 1603.2
3.4
3.6
3.8
4
4.2
4.4
4.6
Dis
tanc
e (m
iles)
Days of Year2005 152 2005 160
load meanload minload maxwave slope
wind speedinterpolated wind w/load <= 200
distance from anchorinterpolated distance w/load <= 200
Figure 23a: Loads, wave slope, winds, and KEO buoy distance from anchor for 6 days bracketing2005156190000.
Snapshot 20051561900
0
500
1000
1500
2000
2500
3000
051001050
Time
Tens
ion
(lbs)
Tension at BuoyTension at Nylon Break
Figure 23b: CABLE dynamic line tension vs. time, 2005 deployment instruments modeled as materials for2005156190000.

22 N. Lawrence-Slavas et al.
0
500
1000
1500
2000
2500
3000
3500
4000
Load
(lb
s.)
–4
–3
–2
–1
0
1
2
Slo
pe (
m/s
)
0
2
4
6
8
10
12
14
Spe
ed (
m/s
)
184 185 186 187 188 189 190 1913.4
3.45
3.5
3.55
3.6
3.65
Dis
tanc
e (m
iles)
Days of Year2005 183 2005 191
load meanload minload maxwave slope
wind speedinterpolated wind w/load <= 200
distance from anchorinterpolated distance w/load <= 200
Figure 24a: Wave slope, winds, and KEO buoy distance from anchor for 6 days bracketing 2005187190000.
Snapshot 20051871900
0
500
1000
1500
2000
2500
3000
003052002051
Time
Tens
ion
(lbs)
Tension at BuoyTension at Nylon Break
Figure 24b: CABLE dynamic line tension vs. time, 2005 deployment instruments modeled as materials for2005187190000.

KEO Mooring Engineering Analysis 23
0
500
1000
1500
2000
2500
3000
3500
4000
Load
(lb
s.)
–4
–3
–2
–1
0
1
2
Slo
pe (
m/s
)
0
2
4
6
8
10
12
14
Spe
ed (
m/s
)
194 195 196 197 198 199 200 2013.2
3.25
3.3
3.35
3.4
3.45
3.5
3.55
3.6
Dis
tanc
e (m
iles)
Days of Year2005 193 2005 201
load meanload minload maxwave slope
wind speedinterpolated wind w/load <= 200
distance from anchorinterpolated distance w/load <= 200
Figure 25a: Wave slope, winds, and KEO buoy distance from anchor for 6 days bracketing 2005197130000.
Snapshot 20051971300
0
500
1000
1500
2000
2500
3000
005054004053
Time
Tens
ion
(lbs)
Tension at BuoyTension at Nylon Break
Figure 25b: CABLE dynamic line tension vs. time, 2005 deployment instruments modeled as materials for2005197130000.

24 N. Lawrence-Slavas et al.
0
500
1000
1500
2000
2500
3000
3500
4000
Load
(lb
s.)
–4
–3
–2
–1
0
1
2
Slo
pe (
m/s
)
0
2
4
6
8
10
12
14
Spe
ed (
m/s
)
282 283 284 285 286 287 288 2893.45
3.46
3.47
3.48
3.49
3.5
3.51
3.52
Dis
tanc
e (m
iles)
Days of Year2005 281 2005 289
load meanload minload maxwave slope
wind speedinterpolated wind w/load <= 200
distance from anchorinterpolated distance w/load <= 200
Figure 26a: Wave slope, winds, and KEO buoy distance from anchor for 6 days bracketing 2005285070000.
Snapshot 20052850700
-200
300
800
1300
1800
2300
2800
572522571521 Time
Tens
ion
(lbs)
Tension at BuoyTension at Nylon Break
Figure 26b: CABLE dynamic line tension vs. time, 2005 deployment instruments modeled as materials for2005285070000.

KEO Mooring Engineering Analysis 25
Week to Failure
0
500
1000
1500
2000
2500
3000
005054004053
Time
Tens
ion
(lbs)
Tension at BuoyTension at Nylon Break
Figure 27: CABLE dynamic line tension vs. time, 2005 deployment instruments modeled as materials forthe week preceding failure. Note the many instances of zero tension.
5. Conclusions
5.1 Line Failure
The cause of the line failure is still unknown. Discussions with the ropemanufacturer on the baffling line structure in the vicinity of the break haveyielded inconclusive results. It is believed that at some point during thedeployment some (∼1/5) of the outer strand fibers line were cut and this,combined with the strange line structure, and shock loading eventually re-sulted in line failure. The strange cuts to the outside of the rope fibers(see Fig. 19) could have been a result of deployment/recovery operations, ordamage due to fishing gear. Fish bite at the depth of the break location,∼1000 m, seems unlikely, however we did see heavy fish bite damage to theinductive cable at ∼547 m (see Figs. 28 and 29). It is still a mystery as towhy the line pik lengths varied so substantially (300%) in the vicinity of thebreak, why there were the strange braiding problems at the point of failure,and why even with these cut fibers the line failed under such low loads. It isimportant to note that this change in pik length was also recently observed(to a much less extreme extent) in a small (0.25 m) segment of nylon linerecovered off of a taught line TAO buoy moored at 0◦, 125◦W (see Fig. 30).The TAO line was also 3/4′′ 8-strand plaited nylon. However, the TAO linewas in no way related to the KEO line, having been made by a differentmanufacturer.
Segments from both of these recovered lines were tested to determine ifthe pik length could have been caused during the line stretching and mea-surement operations. Tests proved that stretching the line to 3500 lbs. and

26 N. Lawrence-Slavas et al.
Figure 28: Damage to 3/8′′ jacketed wire rope at a depth of ∼547 m.
Figure 29: Damage to 3/8′′ jacketed wire rope at a depth of ∼547 m.
Figure 30: TAO 3/4′′ 8-strand plaited nylon: pic length change (E927).
wrapping it around blocks could not cause the change in pik length that wasobserved. The segments of the nylon line were also pulled to failure, result-ing in a 10,300 lb. breaking strength (vs. 15,000 lb. RBS), these numbers areprobably not valid, due to the test piece not being long enough (end effectsof splices).
The effects of shock loading on the nilspin cable were studied by testingto failure the upper section of nilspin from both KEO deployments. Thisresulted in an ultimate breaking strength of ∼15,400 lbs. (vs. 13,900 lb.RBS), so there was no strength degradation due to shock loading duringdeployment.
For future KEO deployments the primary design issue that needs to be

KEO Mooring Engineering Analysis 27
-100
400
900
1400
1900
160 165 170 175 180 185 190 195 200 205 210 215 220 225 230
Time
Tens
ion
(lbs) 2005 Tension at Buoy
2005 Tension at Break
2006 Tension at Buoy
2006 Tension at Locationof 2005 Break
Figure 31: WHOI CABLE dynamic line tension vs. time, 2006 deployment vs. 2005 deployment, in-struments modeled as materials for worst case environmental conditions seen at site last year (snapshot285070000), mean currents, harmonic wave.
addressed is the shock loading of the mooring system. Addressing this designproblem, as well as performing a careful physical inspection of the mooringline structure prior to deployment, and tailoring the deployment deck layoutto eliminate possible line abrasion, should result in a survivable mooring.
5.2 2006 KEO Mooring Design
In order to alleviate the shock loading on the KEO mooring system, thevertical fall velocity of the inductive cable must be increased. As shown pre-viously (see 3.3, “Shock Loading”), the primary factor impacting the verticalvelocity of the inductive cable is the tangential drag on the faired inductivecable, not the vertical drag from the subsurface instruments. Because thecurrents at the KEO deployment site are in reality much lower than themooring was initially designed for, fairings can be removed from the in-ductive cable, decreasing the tangential drag of the cable. After carefullystudying the current data for the deployment site (see Fig. 7b), 275 m offairings were removed from the inductive cable, and the remaining 250 m offairings were placed, based on the 2005 current profile, between 0–140 m and240–350 m. WHOI CABLE predicts that the 2006 KEO mooring will sur-vive current conditions up to the maximum currents seen at the site last year+20% (over entire current profile, ∼4 knt surface current, 0.8 knt currentto the bottom). The dynamic output of the KEO CABLE mooring model,for both random and harmonic wave states, after the fairings have been re-

28 N. Lawrence-Slavas et al.
-250
750
1750
2750
3750
4750
5750
6750
-100 0 100 200 300 400 500
Time
Tens
ion
(lbs) Mean Current
Max CurrentMax+30% CurrentBuoy Displacement
Figure 32: WHOI cable dynamic line tension vs. time, 2006 deployment, instruments modeled as materialsfor worst case environmental conditions seen at site in 2005, mean currents, max currents, and max currents+30%, random wave.
0
1000
2000
3000
4000
5000
0 1000 2000 3000 4000 5000 6000
Horizontal Distance from Anchor
Wat
er D
epth
(m)
KEO Mooring Catenary
Figure 33: KEO 2006 deployment mooring profile (catenary) during max currents.

KEO Mooring Engineering Analysis 29
moved from the cable, is shown in Figs. 31 and 32. Figure 32 shows thatthe 2006 mooring might experience shock loading under extreme wave con-ditions. However, a direct comparison of harmonic wave CABLE output forworst cast shock loading conditions from 2005 to the 2006 model illustrateshow removing 275 m of fairings have decreased the overall tension spread,greatly reducing possible instances of shock loading, while maintaining themean tension from the 2005 deployment (see Fig. 31). Figure 33 shows the2006 mooring’s catenary under maximum current conditions, and the newand improved mooring diagram is shown in Fig. 34.
6. Acknowledgments
The authors would like to thank the following people, for their valuablecontributions to this paper: Dr. Meghan Cronin, for her scientific leader-ship, encouragement, and enthusiasm; Rick Miller, for his mooring expertiseand his thorough inspection and analysis of the KEO mooring components;Curran Fey, for his invaluable help in filtering and graphing the various KEOdata sets; Ryan Layne Whitney for his help turning this report into a co-hesive document; and everybody at PMEL EDD for their comments andsuggestions. Thank You!

30 N. Lawrence-Slavas et al.
2,279 METERS BOUYANT POLYOLEFIN MOORING LINE
10 METERS NYLONSTIFFENER
3/4" SAS
.5 M 1/2" CHAIN
5/8" SAS
4 M 1/2" CHAIN
5/8" SAS
ANCHOR WEIGHT6,820#(3,100 KG)
1 M 1/2" CHAIN
5/8" SAS
EYE INTO EYESPLICE
17" GLASS BALL FLOATS
5/8" SAS
5/8" SAS3 TON SWIVEL
ACOUSTIC RELEASE
20 METERS 1 1/8"NYLON
5/8" SAS
5/8" SAS
3/4" SAS.5 METER CHAIN
5/8" SAS2 METER CHAIN
.5 METER CHAIN3/4" SAS WITH BUSHING
TC INVERTED5 METERS
SONTEK7 METERS
10 METERS8.3 METERS TV
TC INVERTED
37 METERS
75 METERS
100 METERS
TC INVERTED
125 METERS
TP
225 METERS
300 METERS
TC INVERTED
15 METERS
17 METERS SONTEK
25 METERS
TC INVERTED
TC INVERTED
35 METERS
SONTEK
18.3 METERS TV
38.3 METERS TV
TC INVERTED50 METERS
150 METERS
TC
TC
175 METERS
200 METERS
250 METERS
275 METERS
325 METERS
TP
TC
T
TP
TC
TP
TC
700 METERS5/8" SAS
5/8" SAS WITH BUSHING.5 METER CHAIN
5 TON SWIVEL
4,900 METERSNYLON LINE,CONTINUOUS
INDUCTIVE CABLE BREAKOUT
IRIDIUM/POSITIONING BEACON GPS
SHORT ANDLONG WAVERADIATION
AIR TEMPERATURE,RELATIVE HUMIDITY
RAIN GAGE
GILL SONIC ANEMOMETER
KEO
RADAR REFLECTOR
1 METER
2 LINKS 1" CHAIN1" SAS
1 1/8" SASLOAD CELL
SSC
1" SAS
CABLE BRACKETTORQUE load celland isolator platebolts to 120 lb. ft.
INDUCTIVE CABLE BREAKOUT
SOLID CORE CO2 BUOY
375 METERS
400 METERS
425 METERS
450 METERS
475 METERS
500 METERS
525 METERS
TP
TC
TP
T
TC
TP
TC525 METERS
T350 METERS
KEO
March, 2006Rick Miller
7600 Sandpoint Way NESeattle, Wa. 98115(206) 526-6149
DRAWN BY:
APPROVED BY:
DATE:
DATE:
MOORING:
SCOPE:
NOAA-PMEL-KE
1.4:1
DEPTH: 5650 METERS
DRAWING NOT TO SCALE
FAIRINGS:0 - 140 METERS
697.4 METERSWIRE ROPE
FAIRINGS:240 - 350 METERS
Add an Additional Pair (2) Glass Balls
Figure 34: KEO 2006, mooring configuration.