KENYA OIL & GAS FISCAL REGIME: AN ECONOMIC ANALYSIS … 2016/Kenya oil an… · ·...
39
KENYA OIL & GAS FISCAL REGIME: AN ECONOMIC ANALYSIS ON ATTAINMENT OF THE GOVERNMENT OBJECTIVES Karembu Antony Njeru ABSTRACT: The recent discoveries of oil and gas in East Africa’s neighbouring countries have drawn attention to the Kenya Oil & Gas Fiscal Regime. Despite the marginality of Kenya’s hydrocarbons, the Government of Kenya has signed 16 Production Sharing Contracts (PSCs) and are now planning a licensing round for the remaining 20. The division of profits under the Kenya system has been based on daily production since the embedment of the Model PSC in the Petroleum (Exploration and Production) Act, Cap 308 in 1982. Using a quantitative approach, the paper aims to determine whether the current system facilitates the attainment of the Government of Kenya (GoK) objectives. The methodology employed allows the paper to critically test the system under high and low oil price and costs and establish its degree of flexibility to this changes. The conclusion ascertains that the system is regressive through the interpretation of key results such as Undiscounted Government Take, Net Present Value of project cash flows, Internal Rate of Return, Saving Index, Access to Gross Revenues and Effective Royalty Rate. The Author holds a Msc. Energy Studies with specialization in Oil and Gas Economics from the Centre for Energy, Petroleum and Mineral Law and Policy, University of Dundee, Scotland. He is a member of the Kenya Government National Fossil Fuels Advisory Committee (NAFFAC) under the Ministry of Energy, PSC Negotiations and Evaluation Sub Committee. He works for the National Oil Corporation of Kenya as a Management Accountant. His dissertation centred on the quantitative evaluation of Kenya’s fiscal regime for the petroleum sector and assessed its sensitivity to different scenarios and what impact each of these has on supporting proclaimed government objectives. E-Mail: [email protected]
Transcript of KENYA OIL & GAS FISCAL REGIME: AN ECONOMIC ANALYSIS … 2016/Kenya oil an… · ·...

KENYA OIL & GAS FISCAL REGIME: AN ECONOMIC ANALYSIS ON ATTAINMENT OF THE GOVERNMENT OBJECTIVES Karembu Antony Njeru
ABSTRACT: The recent discoveries of oil and gas in East Africa’s neighbouring countries have drawn attention to the Kenya Oil & Gas Fiscal Regime. Despite the marginality of Kenya’s hydrocarbons, the Government of Kenya has signed 16 Production Sharing Contracts (PSCs) and are now planning a licensing round for the remaining 20. The division of profits under the Kenya system has been based on daily production since the embedment of the Model PSC in the Petroleum (Exploration and Production) Act, Cap 308 in 1982. Using a quantitative approach, the paper aims to determine whether the current system facilitates the attainment of the Government of Kenya (GoK) objectives. The methodology employed allows the paper to critically test the system under high and low oil price and costs and establish its degree of flexibility to this changes. The conclusion ascertains that the system is regressive through the interpretation of key results such as Undiscounted Government Take, Net Present Value of project cash flows, Internal Rate of Return, Saving Index, Access to Gross Revenues and Effective Royalty Rate.
The Author holds a Msc. Energy Studies with specialization in Oil and Gas Economics from the Centre for Energy, Petroleum and Mineral Law and Policy, University of Dundee, Scotland. He is a member of the Kenya Government National Fossil Fuels Advisory Committee (NAFFAC) under the Ministry of Energy, PSC Negotiations and Evaluation Sub Committee. He works for the National Oil Corporation of Kenya as a Management Accountant. His dissertation centred on the quantitative evaluation of Kenya’s fiscal regime for the petroleum sector and assessed its sensitivity to different scenarios and what impact each of these has on supporting proclaimed government objectives. E-Mail: [email protected]

II
ABBREVIATIONS ....................................................................................................... III LIST OF FIGURES ...................................................................................................... IV
LIST OF TABLES………………………………………………………………………...V 1. INTRODUCTION .................................................................................................... 1
2. PETROLEUM FISCAL SYSTEMS ........................................................................ 3 2.1 CLASSIFICATION OF FISCAL REGIMES ............................................................... 4
2.1.1 Concession Systems........................................................................................ 5 2.1.2 Contractual Systems ....................................................................................... 5 2.1.3 Fiscal Components of Contractual Systems ................................................... 6
2.1.3.1 Royalty ................................................................................................... 6 2.1.3.2 Cost Recovery Limit ............................................................................. 6 2.1.3.3 Profit Oil ................................................................................................ 8 2.1.3.4 Government Participation .................................................................... 9 2.1.3.5 Others Fiscal Instruments .................................................................... 9
3. AN OVERVIEW OF KENYA ............................................................................... 10 3.1 BACKGROUND .................................................................................................. 10
3.1.1 Economy ...................................................................................................... 10 3.1.2 Geology & Hydrocarbon Development ........................................................ 10 3.1.3 Petroleum (Exploration and Production ) Act Cap 308 ............................... 11
3.2 MODEL PRODUCTION SHARING CONTRACT ..................................................... 11 3.2.1 Fiscal Instruments ....................................................................................... 12
3.2.1.1 Profit Oil Split ..................................................................................... 12 3.2.1.2 Cost Recovery ...................................................................................... 12 3.2.1.3 Government Participation .................................................................. 12
3.3 GOVERNMENT OBJECTIVES ............................................................................. 13 3.3.1 Attract Foreign Direct Investments .............................................................. 13 3.3.2 Fair Share of Return.................................................................................... 14
4. MODEL ASSUMPTIONS...................................................................................... 15 4.1 PRODUCTION ASSUMPTIONS ............................................................................ 15
4.1.1 Production Profile ........................................................................................ 15 4.1.2 Production Profile ........................................................................................ 15
4.2 ECONOMIC ASSUMPTIONS ................................................................................ 16 4.2.1 Oil Price ....................................................................................................... 16 4.2.2 Capital and Operating Expenditure ............................................................. 17 4.2.3 Other Assumptions ....................................................................................... 18
5. ANALYSIS & RESULTS ....................................................................................... 19 5.1 ATTRACT FOREIGN DIRECT INVESTMENTS ...................................................... 19
5.1.1 NPV Sensitivity Analysis .............................................................................. 19 5.1.2 IRR Sensitivity Analysis ............................................................................... 21 5.1.3 Other Sensitivity Analysis ............................................................................ 23
5.2 FAIR SHARE OF RETURN .................................................................................. 25 5.2.1 Undiscounted Government Take – High and Low Oil Prices ...................... 25 5.2.2 Undiscounted Government Take – High and Low CAPEX & OPEX .......... 27 5.2.3 Undiscounted Government Take – Field Size Sensitivity ............................. 28
6. CONCLUSION ....................................................................................................... 29

III
BIBLIOGRAPHY .......................................................................................................... 30 APPENDICES ................................................................................................................ 32
FIELD CASH FLOW MODEL – KENYA “BOPD BASED” SYSTEM ................................... 32
LIST OF ABBREVIATIONS
AGR Access to Gross Revenues
BOPD Barrels of Oil per Day
CAPEX Capital Costs
EIA Energy International Agency
ERR Effective Royalty Rate
FRS Financial Reporting System
GDP Gross Domestic Product
GOK Government of Kenya
GoK Government of Kenya
GT Undiscounted Government Take
HG Host Government
IOC International Oil Company
IRR Internal Rate of Return
MMBBLS Millions of Barrels
NEP National Energy Policy
OL Operating Leverage
OPEX Operating Costs
PPP Purchasing Power Parity
PSC Production Sharing Contract
ROR Rate of Return
SI Saving Index
US$ US Dollar
US$M Millions of US Dollars WTI West Texas Intermediate

IV
LIST OF FIGURES
Figure 1: Oil field Ricardian Rent
Figure 2: Classification of Petroleum Fiscal Regimes
Figure 3: Kenya Sedimentary Basins
Figure 5: NPV Sensitivity Analysis – Spider Diagram
Figure 6: Contractor IRR Sensitivity – Spider Diagram
Figure 6: Undiscounted Government Take Sensitivity to High and Low Oil Prices
Figure 8: Undiscounted Government Take under Field Size Sensitivity
Figure 7: Undiscounted Government Take under High and Low CAPEX & OPEX

V
LIST OF TABLES
Table 1: Profit Oil for IOCs
Table 2: Classification of Field Size
Table 3: Total CAPEX & OPEX per barrel
Table 4: Base Case Scenario Investor Results
Table 5: Sensitivity Scenarios on Net Present Value
Table 6: Sensitivity Scenarios on IRR
Table 8: Sensitivity Scenarios on Operating Leverage
Table 7: Sensitivity Scenarios on Saving Index
Table 9: Sensitivity Scenarios on AGR

1
1. INTRODUCTION
Petroleum fuels are the main source of commercial energy in Kenya and are mainly used in
the transport, commercial and industrial sector. In 2007 the consumption of petroleum fuels
in Kenya was 65,530bbl/day, all imported from the Middle East1. Kenya has a Gross
Domestic Product (GDP) of US$25.20 billion and highly dependent on tourism and
agriculture as its main source of government revenues. Kenya’s search for oil and gas has
been unsuccessful even though some of the 34 wells drilled since 1954 within its four
sedimentary basins showed traces of oil and gas which was not commercially viable.
Despite this hydrocarbon marginality, the country has signed production sharing contracts
(PSC) for 16 blocks while the remaining 20 blocks are being considered for a licensing
round. The government’s optimism of attracting reputable International Oil Companies
(IOC) to the licensing round would highly depend on the attractiveness of the fiscal regime
taking into consideration the geological and political risk of the country. The Kenya fiscal
system employs a sliding scale linked to daily production targets to determine the profit oil
split between the IOC and Government of Kenya (GoK), where the latter expects a
sustainable fair share of return upon discovery of commercial quantities of hydrocarbons.
This paper intends to provide an economic analysis of the current Kenya Oil and Gas Fiscal
Regime and determine whether it facilitates the achievement of the GoK’s objectives.
Chapter 2 presents an overview of petroleum fiscal systems by describing the concept of
economic rent, and classification of the fiscal regimes. A short review of Kenya’s fiscal
regime and the GoK’s objectives are discussed in Chapter 3, while Chapter 4 outlines the
production and economic assumptions made in developing a stand alone cash flow model.
Chapter 5 provides an analysis of the system under different scenarios of high and low oil
prices and costs. The results are measured in terms of Undiscounted Government Take
1 Central Intelligence Agency “Fact Book” at https://www.cia.gov/library/publications/the-world-factbook/geos/ke.html (Last visited on Jan 10th, 2009)

2
(GT), Effective Royalty Rate (ERR), Saving Index (SI), Internal Rate of Return (IRR), Net
Present Value (NPV), Access to Gross Revenues (AGR) and Operating Leverage (OL).
Finally Chapter 6 concludes whether the economic analysis of the system enables the GoK
achieve objectives set out under its National Energy Policy (NEP).

3
2. PETROLEUM FISCAL SYSTEMS
The concept of economic rent originates from the fundamentals of economic theory and the
produce of the earth that is derived from the factors of production namely labour, capital
and machinery2. It represents the surplus revenue realised after accounting for the all the
costs incurred by these factors of production3. There are several types of economic rent i.e.
the Scarcity rent4, Differential or Ricardian rent5 and the Quasi rent6. The Differential rent
is generally used in the oil and gas industry because extraction costs typically depend on
differences in the quality of the resource and location of the hydrocarbons7. (Figure 1)
Figure 1: Oil field Ricardian Rent
Source: Adapted from Nakhle (2008)
2 Johnston. D., The International Exploration Economics Risk, and Contract Analysis, ( USA, Tulsa, Oklahoma: PennWell, 2003) 3 Nakhle. C., Petroleum Taxation: Sharing the oil wealth – A study of petroleum taxation yesterday, today and tomorrow, (USA, New York: Routledge, 2008). 4 Scarcity rent is the rent derived from the natural scarcity of a resource thus available output is limited. 5 Differential or Ricardian rent named after the British economist David Ricardo, is the value of the difference in productivity between a given piece of land and the poorest, most costly piece of land producing the same goods under the same conditions (of labour, capital, technology, etc.). at http://eh.net/coursesyllabi/syllabi/munro/ECONRENT.htm (last visited on Jan 14th ,2009) 6 Quasi rent represents the returns that accrue to firms as a result of changes in the market in the short run 7 See Nakhale Supra note 3
A
E
F
Oil Fields
Fiel
d In
put C
osts
, Mar
ket P
rice
B
C
D Marginal
Field RENT
Market Price
CA
CB

4
2.1 Classification of Fiscal Regimes
In the global oil and gas industry, host governments (HG) seek economic rent on their
resources through the enactment of a hydrocarbon law that establishes the legal and fiscal
basis of granting exploration, development and production rights in particular areas or
blocks by means of concessions or contracts8. The development of these legal and fiscal
systems is essential because they address the rights and obligations of the (HG) and the
IOC9. The fiscal regimes are typically grouped into two main families i.e. “contractual
based” systems and “concessionary” systems10. Figure 2 illustrates the classification of
petroleum fiscal regimes
Figure 2: Classification of Petroleum Fiscal Regimes
Source: Adapted from Johnson (1994)
.
8 Tordo. S., Fiscal Systems for Hydrocarbons- Design Issues, (USA ,Washington D.C: World Bank Working Paper No 123,,August 2007 ) 9 Ibid 10 Johnson. D., International Fiscal Systems and Production Sharing Contracts (USA, Tulsa, PennWell:Oklahoma, 1994)
Petroleum Fiscal Regimes
Concessionary Contractual
Service Contracts Production Sharing Contracts
Risk Service Pure Service Hybrids

5
2.1.1 Concession Systems
Concessions were the first systems used in petroleum agreements worldwide and originated
from the Greek silver mining operations in 480 B.C.11
Under a concessionary system (also referred to as royalty/tax system), the land owner
normally transfers title of the minerals to the IOC at the well head and in return the IOC
pays royalties and taxes specified in the HG’s state legislation12. However, upon
termination or expiry of the concession, the title and ownership of the equipment and
permanent installations used for exploration and production of oil and gas, reverts back to
the state while the contractor is responsible for decommissioning13. The royalty calculation
is based on a percentage applied to the gross revenues of the recovered hydrocarbon
resources and payable by the IOC in form of “cash” or “in kind”14.
2.1.2 Contractual Systems
Contractual systems originated from the Napoleonic era and were based on the French legal
concept that all mineral resources are owned by the HG for the benefit of all its citizens15.
Under a contractual systems, the HG transfers title of the mineral resource to the IOC at the
delivery point. However, the ownership of the exploration and production equipment
reverts to the HG immediately and as a result; the HG becomes responsible for
decommissioning or abandonment of the block areas16. The “contractual based systems”
include both the PSCs and service contracts where the latter consists of risk service
contracts, pure service contracts and hybrid contracts.
11 Anderson, O.L., Royalty valuation: Should royalty obligations be determined intrinsically, theoretically, or realistically? Natural Resources Law Journal 37:611, 1998 12 Kaiser. M, ,Pulsipher. A.G, Fiscal System Analysis: Concessionary and Contractual Systems Used in Offshore Petroleum Arrangements. US Department of the Interior, Minerals Management Service, Gulf of Mexico OCS, New Orleans, La. OCS Study MMS 2004-016. 78pp 13See Tordo Supra note 8 14 Gallun. R. A, Wright. C. J., Nichols. L. M, Stevenson J. W, Fundamentals of Oil & Gas Accounting, 5th (USA, Tulsa, Oklahoma: Edition, PennWell, 2005 ) 15See Johnston Supra note 10 16 See Tordo, Supra note 8

6
The PSC is a contractual agreement between the HG and IOC whereby the contractor bears
all the costs and risks of exploration, development and production in return for a specified
split of the production17.
2.1.3 Fiscal Components of Contractual Systems
2.1.3.1 Royalty
It is a payment to the HG calculated as a fixed percentage of gross revenue adjusted for the
cost of transportation and basic processing18. PSCs typically contain royalty provisions that
range from 0% - 15% and can either be “fixed” or based on a “sliding scale” attached to the
production level of a field19. The formula below illustrates how a royalty is calculated20;
ROY = R*(Gr – Allow),
Where Roy = Royalty R = Royalty rate Gr = Gross Revenues Allow = Total allowance cost i.e. transport & basic processing
2.1.3.2 Cost Recovery Limit
It is the means by which IOCs recover costs incurred in exploration, development and
production from available gross revenues. Globally, most PSCs place a limit on the amount
of costs the IOC can recover from the revenues. This limit also referred to as a “cost
ceiling” typically ranges from 40% to 100%21 and considered as one of the ways in which
the HG is guaranteed a share of production in any given accounting period22. The
17 See Johnston, Supra note 2 18 See Gullan, Supra note 14 19 See Johnston, Supra note 2 20 See Kaiser, Supra note 12 21 The world average for cost recovery limit is 65% 22 See Johnston, Supra note 2

7
unrecovered costs are then carried forward and recouped the following accounting period
in the order below23;
Unrecovered exploration expenditures
Unrecovered development expenditures
Current year operating costs
Current year Depreciation
Interest on financing (if allowed)
Investment credit or capital uplift (defined later)
Future abandonment cost fund
Approximately 85% of the cost recovery limits in the world are based on ‘gross production
or revenues’ while the remaining 15% are based on ‘net production’ after deducting
royalty. The most basic form of cost recovery is computed as follows24 ;
Cr =U + CAPEX / I + OPEX + DEP + INT + INV + DECOM,
Where, CR = Cost recovery in year t, U = Unrecovered cost carried over from previous year, CAPEX =/ I Intangible capital expenditures in year t, DEP = Depreciation in current year INT = Interest on financing in year t, INV = Investment credits and uplift in year t, DECOM= Abandonment cost recovery fund apportionment in year t.
23 Ibid 24 See Kaiser, Supra note 12

8
2.1.3.3 Profit Oil
It is the amount of revenues or production that the government shares with the IOC after
royalties and cost oil are recovered from the gross revenues.
PO=GR – ROY - CO,
Where, PO = Profit Oil GR = Gross Revenues CO = Cost Oil
A study by Bidermann (1999) indicated that 45 of the 268 PSCs worldwide had a “fixed”
profit oil share while the rest applied a “sliding scale” which was based on the oil
production or rate of return (ROR)25. Table 1 illustrates the profit oil for IOCs
Table 1: Profit Oil for IOCs
Average Pofit Oil (%) Max Profit Oil (%) Min Profit Oil (%)Max Min Highest Lowest Highest Lowest
Asia 44.15 28.51 100.00 15.00 60.00 10.00 Centra America 64.71 36.57 95.00 40.00 85.00 20.00 South America 48.00 38.38 50.00 40.00 50.00 30.00 Europe 51.93 37.00 80.00 40.00 60.00 10.00 Middle East 27.80 15.75 60.00 11.80 40.00 7.50 North Africa 38.67 18.00 100.00 19.00 50.00 10.00 South & Central Africa 55.69 29.17 100.00 15.00 75.00 5.00
Source: Adapted from Bidermann (1999)
Out of the PSCs based on sliding scales, 75% have a production-based sliding scale while
the remaining 25% are based on the ROR or R factor26. The production-based sliding scales
are typically popular with the HG because they offer a greater share of profit oil at higher
rates of production. However, these sliding scales (unlike the R factor and ROR systems27)
are totally insensitive to fluctuations of oil prices28.
25 Bindemann. K., Production Sharing Agreements : An Economic Analysis (UK, Oxford,:Oxford Institute for Energy Studies, 1999) 26 Johnston, D. Economic Modelling and Risk Analysis Handbook (UK, University of Dundee, Dundee,2002) 27 The R Factor, ROR systems divide ‘profit oil’ based on a profit-based mechanism tied to a payout formula or internal rate of return threshold. 28 See Johnston Supra note 26

9
2.1.3.4 Government Participation
PSCs provide an option for the state-owned oil company to participate in development of
the oil project. While the contractor bears the cost and risk of exploration, the government
through the national oil company can elect to participate at a level of working interest up to
a maximum of 51% upon the discovery of oil and gas. Normally, the government
participation is automatically assumed whenever a percentage of it is quoted, although
some key aspects of it should be first determined i.e.29.
The point at which the government backs in (usually at commerciality)
The scale of participation in management of the venture ( large range)
The costs to be bore by the government (usually prorated share of development
costs)
The ways of funding the government portion of costs (often out of production) split
2.1.3.5 Others Fiscal Instruments
A number of PSCs have several other fiscal instruments like bonuses30, investment
credits31, tax holidays32, income tax and domestic market obligations33.
29 Ibid 30 These are up front monies paid by the IOC to the government for signing the PSC agreement 31 Investment credits encourage the oil companies to recover an additional percentage of capital expenditure over and above the actual amounts spent. 32 Tax holidays are used by governments to attract additional investment thus encouraging IOCs to maximize investments in the early years of production. 33 The DMO would normally be included where the demand for crude oil in the country is greater than the government’s share of production consequently reducing the shortfall and decreasing the government’s need to import oil.

10
3. AN OVERVIEW OF KENYA
3.1 Background
3.1.1 Economy
In 2007, Kenya’s GDP was approximately US$25.20 billion with a per capita GDP in
purchasing power parity (PPP) terms of $1,700 the same year34. The economy comprises of
16.7% agriculture, 23.8% industry and 59.5% services sector although highly dependent on
tourism and agriculture as the main source of government revenues35.
3.1.2 Geology & Hydrocarbon Development
Geologically, the country has four sedimentary basins; Anza, Mandera, Tertiary Rift and
Lamu which measure 94 200 km², 51 920 km², 40 000 km² and 132 720 km² respectively36.
Petroleum exploration in Kenya began in 1954 and since then thirty four (34) wells have
been drilled within the four sedimentary basins. Traces of oil and gas were encountered but
none was commercially viable.
34 Central Bank of Kenya, Monthly Economic Review , November 2008 at http://www.centralbank.go.ke/downloads/publications/mer/nov08.pdf (last visited on jan 10th, 2009) 35 Central Intelligence Agency Fact Book at https://www.cia.gov/library/publications/the-world-factbook/geos/ke.html (Last visited on Jan 10th, 2009) 36 National Oil Corporation of Kenya website at www.nockenya.co.ke (last visited on Jan 26th, 2009)

11
Figure 3: Kenya Sedimentary Basins
3.1.3 Petroleum (Exploration and Production ) Act Cap 308
Petroleum exploration and production in Kenya is governed by the Petroleum (Exploration
& Production) Act, Cap 308 enacted in 1982 and further revised in 1986 to regulate the
negotiation and conclusion of petroleum agreements by GoK37.
3.2 Model Production Sharing Contract
Prior to 1981, exploration and production was carried out under a Royalty/Tax based
system that was provided for under the Mining Act, Cap 306. However, Kenya changed to
37Republic of Kenya, Ministry of Energy, Petroleum (Exploration and Production) Cap 308 www.energy.go.ke (last visited on Jan 16th, 2009).

12
a PSC based system after the enactment of the Petroleum Exploration and Production Act
in 198238.
3.2.1 Fiscal Instruments
Kenya is considered to have one of the toughest fiscal regimes in Africa because of its high
government take and its classification as a frontier area where no commercial discoveries
are yet to be made39.
3.2.1.1 Profit Oil Split
The division of profits is centred on a daily production-based sliding scale system which
assumes the first tranche at 20000 barrels of oil per day (BOPD) whilst the last tranche
being 100,000 BOPD. The profit splits are negotiable at each tranche as shown below40
Increments of Profit Oil Government share Contractors share
First 20,000 BOPD % %
Next 30,000 BOPD % %
Next 50.000 BOPD % %
Over 100,000 BOPD % %
3.2.1.2 Cost Recovery
The cost recovery limit is negotiable under the Kenya model PSC although some of the
PSCs have been signed at a cost recovery limit of 75%41.
3.2.1.3 Government Participation
Under the Kenya model PSC, the Government may elect to participate in the petroleum
operations in any development area and acquire an interest of up to certain negotiable
38 Republic of Kenya , Ministry of Energy (MOE), National Energy Policy Sessional Paper No. 4 of 2004 on Energy, October 2004 Republic of Kenya 39 Barrows, G.H., World Fiscal Systems for Oil, Van Meurs & Associates Limited, Calgary, Alberta, 1997 40 See MOE Supra note 37 41 Conversation with Lois Allela ,Legal Officer, National Oil Corporation of Kenya

13
participating interest. The GoK can participate directly or through a wholly owned body
corporate appointed by the state42.
3.3 Government Objectives
3.3.1 Attract Foreign Direct Investments
The commercial energy sector in Kenya is dominated by petroleum and electricity as the
prime movers of the modern sector of the economy. The accelerated search for
hydrocarbons and potential success is seen as one of the solutions that can mitigate the
adverse effects of oil importation on the Kenya economy. For this reason, the NEP states
that the GoK objective as regards hydrocarbons is “to enhance an enabling environment
through which petroleum exploration and associated resource development activities can
be undertaken”43. This means stimulating exploration activities in the country by providing
favourable fiscal terms to the IOCs while taking into consideration the geological
uncertainty of the country. In addition, the NEP strategy on how to enhance the enabling
environment involves:
Collection and analysis of primary data in areas designated for licensing through
service contracts so as to reduce the exploration risk undertaken by the IOCs.
Reducing the size of exploration blocks in order to attract domestic and small IOCs.
Enhance the regional cooperation in data acquisition and exchange so as to reduce
the exploration cost.
Building local content internally to undertake exploration so as to complement
external efforts by the IOCs.
42 See MOE Supra note 37 43 ibid

14
Countries like Kenya however, have a limited leeway in attracting IOCs to undertake
exploration activities because they have no commercially proven reserves of hydrocarbons
44.
3.3.2 Fair Share of Return
'The art of taxation consists of plucking the goose so as to obtain the largest amount of
feathers with the least possible amount of hissing'
Loius XIV's Controller-General of Finance, J.B.Colbert (1619- 1683)45:
True to the statement above, the GoK should strive to ensure that the current fiscal regime
responds to its intended objectives as well as the IOC’s in a ‘fair and equitable way’. This
means that the GoK should seek to maximize the wealth from its natural resources and
attract foreign direct investments at the same time.
Therefore, if the first NEP objective is achieved, the GoK is expected to have negotiated
the fiscal terms on assumption that the project would go into production. The next objective
would be to ensure that the Kenya fiscal regime appropriately provides a fair share of
return from successful exploration once production commences. This is achieved by
adjusting the GoK share of fiscal benefits to changes in market conditions. Consequently,
undiscounted government “take” would rise or fall to correspond to changes in the levels of
profitability actually achieved.
44 See Johnston Supra note 26 45 ibid

15
4. MODEL ASSUMPTIONS
The methodology applied in the paper is quantitative and intends to use a Model Cash Flow
based on different production and economic assumptions. The Kenya fiscal system was
subjected to two development scenarios of high and low oil price and cost environments to
assess whether it attained the GoK objectives. The results were measured in terms of
Undiscounted Government Take (GT)46, Net Present Value (NPV) of the project’s cash
flow47, Internal Rate of Return (IRR)48, Operating Leverage49, and Saving Index (SI)50.
4.1 Production Assumptions
4.1.1 Production Profile
The model assumes a production profile of 25 years with a peak production of 10% in the
third year after production starts followed by an exponential decline rate of 10% over the
life of the project51.
4.1.2 Production Profile
Different sizes of fields generate different levels of profitability. The classification of three
generic offshore fields was based on literature by Nakhle (2008) reflecting different field
sizes. The recoverable oil field size assumed in the model would range from 100MMBBLS
46 Government Take is the government share of gross cash flow from royalties, taxes, bonuses and profit oil 47 The Net Present Value (NPV) is the sum of net cash flow stream when discounted at a specified rate which equates to the company’s cost of capital. Decision rule is that if NPV is positive the project is accepted and vice versa. 48 The Internal Rate of Return (IRR) is the percentage rate that will discount a net cash flow stream to a cumulative present value of zero. It is a prime indicator of a project’s attractiveness 49 The operating leverage is the ratio of the net present value of total cost to the net value of gross income. The higher the operating leverage, the more exposed the project profitability is likely to be to a drop in oil prices. 50 The Saving Index (SI) is a measure (from an undiscounted point of view) of how much a company gets to keep if it saves one dollar. It quantifies the incentives companies get to keep costs down. 51 See Johnston Supra note 27

16
to 400MMBBLS. The base case was 200MMBBLS52. Table 2 illustrates the classification
of field size
Table 2: Classification of Field Size
Field SizeRecoverable Reserves mmbbls
Very Small < 100
Small 100-200
Medium 200-400
Large 400-500
Very Large > 500
Source: Adapted from Nakhle (2008)
4.2 Economic Assumptions
4.2.1 Oil Price
The model assumes crude oil spot price range between US$20 and US$160 per barrel
based on the West Texas Intermediate (WTI). The base case is US$80 per barrel. Figure 4
illustrates the movement of WTI crude price in 2008.
Figure 4: Crude Oil Spot Price (WTI)
Source: WRTG Economics
52 See Nakhle Supra note 3
17
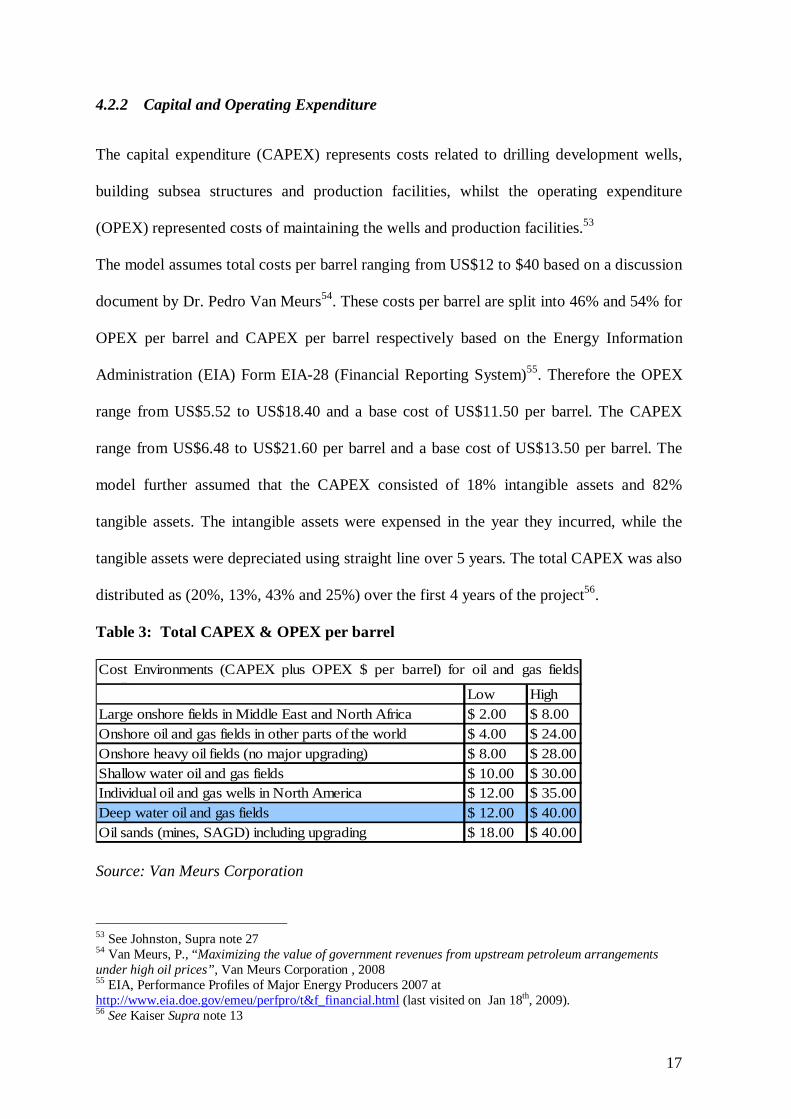
4.2.2 Capital and Operating Expenditure
The capital expenditure (CAPEX) represents costs related to drilling development wells,
building subsea structures and production facilities, whilst the operating expenditure
(OPEX) represented costs of maintaining the wells and production facilities.53
The model assumes total costs per barrel ranging from US$12 to $40 based on a discussion
document by Dr. Pedro Van Meurs54. These costs per barrel are split into 46% and 54% for
OPEX per barrel and CAPEX per barrel respectively based on the Energy Information
Administration (EIA) Form EIA-28 (Financial Reporting System)55. Therefore the OPEX
range from US$5.52 to US$18.40 and a base cost of US$11.50 per barrel. The CAPEX
range from US$6.48 to US$21.60 per barrel and a base cost of US$13.50 per barrel. The
model further assumed that the CAPEX consisted of 18% intangible assets and 82%
tangible assets. The intangible assets were expensed in the year they incurred, while the
tangible assets were depreciated using straight line over 5 years. The total CAPEX was also
distributed as (20%, 13%, 43% and 25%) over the first 4 years of the project56.
Table 3: Total CAPEX & OPEX per barrel
Low HighLarge onshore fields in Middle East and North Africa $ 2.00 $ 8.00Onshore oil and gas fields in other parts of the world $ 4.00 $ 24.00Onshore heavy oil fields (no major upgrading) $ 8.00 $ 28.00Shallow water oil and gas fields $ 10.00 $ 30.00Individual oil and gas wells in North America $ 12.00 $ 35.00Deep water oil and gas fields $ 12.00 $ 40.00Oil sands (mines, SAGD) including upgrading $ 18.00 $ 40.00
Cost Environments (CAPEX plus OPEX $ per barrel) for oil and gas fields(wells)
Source: Van Meurs Corporation
53 See Johnston, Supra note 27 54 Van Meurs, P., “Maximizing the value of government revenues from upstream petroleum arrangements under high oil prices”, Van Meurs Corporation , 2008 55 EIA, Performance Profiles of Major Energy Producers 2007 at http://www.eia.doe.gov/emeu/perfpro/t&f_financial.html (last visited on Jan 18th, 2009). 56 See Kaiser Supra note 13

18
4.2.3 Other Assumptions
The model assumed a 35% p.a. corporate tax, 10% government participation and the profit
oil split was based on the PSC signed between the Republic of Kenya and Amoco57.
57 See Barrows, Supra note 39

19
5. ANALYSIS & RESULTS58
5.1 Attract Foreign Direct Investments
Several key economic performance indicators were used to determine whether the Kenya
Fiscal Regime is attractive to the IOCs. These are the Project NPV, the Project IRR, the
Saving Index (SI), Operating Leverage and Access to Gross Revenues (AGR).
Based on the assumptions stated in Chapter 4, the Kenya “BOPD based” system produced
the following results from an investor’s perspective on the attractiveness of the system
under the base scenario59.
Table 4: Base Case Scenario Investor Results
Investor Results NPV Project AGR Operating Leverage Saving IndexUS$M IRR US cents
727.32 16.32% 62.98% 0.36 0.42
A sensitivity analysis addressing variations of crude oil price, CAPEX per barrel and
OPEX per barrel was conducted on the above mentioned results.
5.1.1 NPV Sensitivity Analysis
The spider diagram represents the different sensitivity scenarios that were developed to
evaluate how the NPV under the Kenya BOPD based system varies with changes in the
various economic parameters. This will also provide an in-depth understanding of the
different variables that significantly affect the reported NPV of US$ 273.81M.
58 See appendices for the spreadsheets 59 Please note that in the event of a dry hole, the contractor will bear the risks and costs of exploration.

20
Figure 5: NPV Sensitivity Analysis – Spider Diagram
NPV Sensitivity Analysis - Spider DiagramKenya BOPD Based System
-4,000
-3,000
-2,000
-1,000
-
1,000
2,000
3,000
4,000
5,000
2% 26% 51% 75% 100% 125% 149% 174% 198%
Sensitivity Range %
Net
Pre
sent
Val
ue (U
S$m
)
Oil Price Sensitivity
Capital Expenditure
Operating Expenditure
Discount Rate
Cost Limit Recovery
Field Size Sensitivity
Government Participation
Source: Author’s Computation
The sensitivity scenarios results were as follows
The crude oil price reflected the second strongest relationship with the NPV whereby, a
25% increase in the base crude oil price of US$80 per barrel represented an 86% increase
in the NPV from US$ 273.81M to US$ 687.51M. Conversely, a crude price of US$20 per
barrel returned a negative NPV of US$ 1878.34M.
The CAPEX sensitivity showed that a 12.5% reduction in the prevailing CAPEX per
barrel of US$13.50 per barrel resulted to an NPV of US$ 510.68M
The NPV was equally sensitive to the OPEX whereby a 1% increase in the base OPEX of
US$ 11.50 per barrel resulted to a decrease in the NPV by US$13.52M.

21
The NPV was not as sensitive to the field size as the variables mentioned above but the
discovery of a field that is 50% larger than the base case of 200MMBBLS would result to
an NPV of US$505.89M
The NPV was similarly sensitive to the discount rate whereby a 1% increase in the base
discount rate of 10% resulted to a decrease in the NPV by US$9.96M
The variable that least affected the NPV was the cost recovery limit where an increase in
the recovery limit from the base 65% to 100% would only reflect an NPV of US$310.55M
Table 5 illustrates the sensitivity scenarios on the NPV.
Table 5: Sensitivity Scenarios on Net Present Value
Net Present ValueSensitivity 2% 26% 51% 75% 100% 125% 149% 174% 198%Oil Price Sensitivity (1,599.31) (1,878.34) (822.56) (186.52) 273.81 687.51 1,091.68 1,490.91 1,884.45 Capital Expenditure 1,311.36 1,244.98 1,062.99 747.55 273.81 (432.83) (1,446.89) (2,890.93) (4,768.47) Operating Expenditure 566.72 546.82 491.79 401.97 273.81 98.18 (143.66) (592.43) (1,349.35) Discount Rate 2,441.69 1,627.52 1,037.30 601.18 273.81 24.92 (166.17) (313.97) (428.83) Cost Limit Recovery (672.07) (306.10) 44.33 220.21 273.81 296.78 310.55 310.55 310.55 Field Size Sensitivity 4.28 56.67 112.02 183.29 273.81 382.86 505.89 638.81 777.82 Government Participation 303.62 296.17 288.71 281.26 273.81 266.35 258.90 251.45 243.99
Source: Author’s Computation
5.1.2 IRR Sensitivity Analysis
The Internal Rate of Return is a widely used economic indicator that assesses the
performance and attractiveness of a project. Projects that return higher IRR are normally
preferred thus a sensitivity analysis on the IRR with respect to the Kenya BOPD system
was conducted and the results were as follows. The following spider diagram represents the
different sensitivity scenarios that were developed (Figure 6).
22
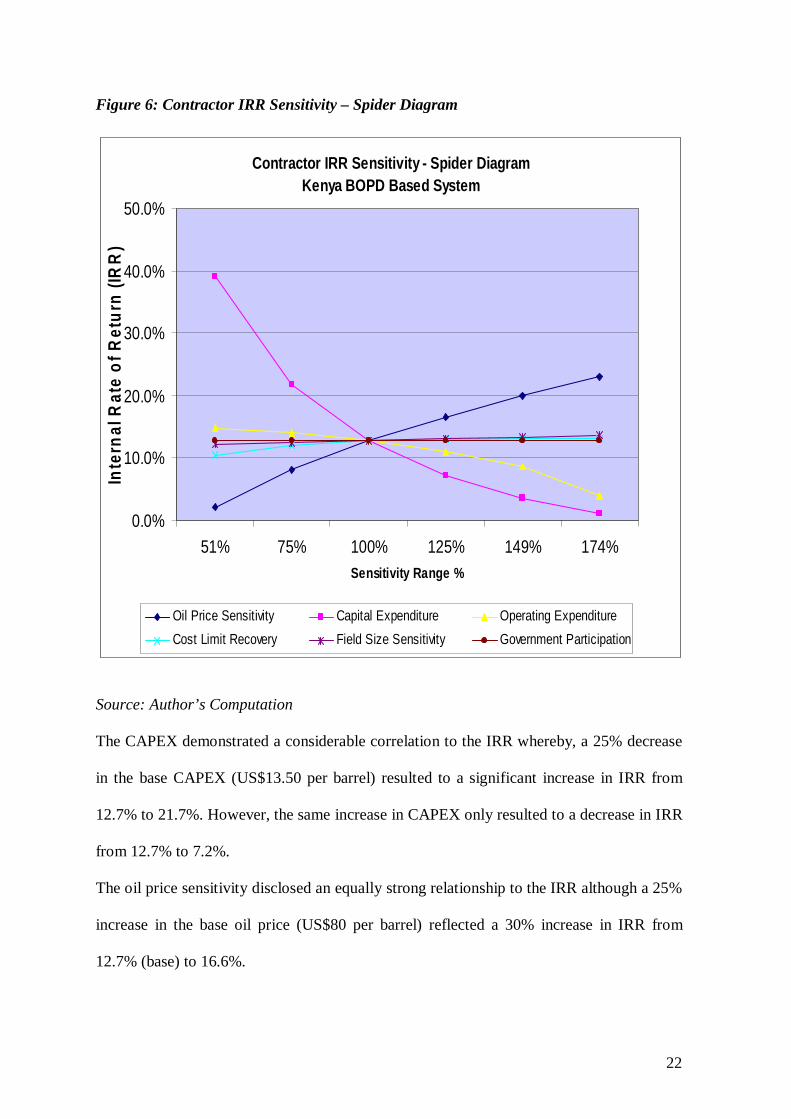
Figure 6: Contractor IRR Sensitivity – Spider Diagram
Contractor IRR Sensitivity - Spider Diagram Kenya BOPD Based System
0.0%
10.0%
20.0%
30.0%
40.0%
50.0%
51% 75% 100% 125% 149% 174%Sensitivity Range %
Inte
rnal
Rat
e of
Ret
urn
(IRR
)
Oil Price Sensitivity Capital Expenditure Operating ExpenditureCost Limit Recovery Field Size Sensitivity Government Participation
Source: Author’s Computation
The CAPEX demonstrated a considerable correlation to the IRR whereby, a 25% decrease
in the base CAPEX (US$13.50 per barrel) resulted to a significant increase in IRR from
12.7% to 21.7%. However, the same increase in CAPEX only resulted to a decrease in IRR
from 12.7% to 7.2%.
The oil price sensitivity disclosed an equally strong relationship to the IRR although a 25%
increase in the base oil price (US$80 per barrel) reflected a 30% increase in IRR from
12.7% (base) to 16.6%.

23
Nonetheless, the other sensitivity scenarios particularly the field size, OPEX and discount
rate did not significantly shift the IRR. Table 6 illustrates sensitivity of the IRR to the
different economic parameters
Table 6: Sensitivity Scenarios on IRR
Contractor IRRSensitivity 2% 26% 51% 75% 100% 125% 149% 174% 198%Oil Price Sensitivity 0.0% 0.0% 2.1% 8.1% 12.7% 16.6% 20.0% 23.0% 25.8%Capital Expenditure 717.9% 84.3% 39.0% 21.7% 12.7% 7.2% 3.7% 1.0% -1.5%Operating Expenditure 15.5% 15.3% 14.8% 14.0% 12.7% 11.0% 8.6% 4.0% -8.7%Cost Limit Recovery 3.4% 7.1% 10.4% 12.1% 12.7% 13.0% 13.2% 13.2% 13.2%Field Size Sensitivity 12.2% 12.2% 12.2% 12.4% 12.7% 13.1% 13.3% 13.6% 13.8%Government Participation 12.7% 12.7% 12.7% 12.7% 12.7% 12.7% 12.7% 12.7% 12.7%
Source: Author’s Computation
5.1.3 Other Sensitivity Analysis
The SI, Operating Leverage and AGR results were subjected to a sensitivity analysis that
took into consideration the changes in oil price, OPEX, CAPEX, field size, cost recovery
limit and government participation and the following results were achieved. (Table 7)
Table 7: Sensitivity Scenarios on Saving Index
Saving IndexSensitivity 2% 26% 51% 75% 100% 125% 149% 174% 198%Oil Price Sensitivity 0.28 0.28 0.28 0.27 0.27 0.28 0.28 0.28 0.28 Capital Expenditure 0.28 0.28 0.28 0.28 0.27 0.27 0.27 0.28 0.28 Operating Expenditure 0.27 0.27 0.27 0.27 0.27 0.27 0.28 0.28 0.28 Cost Limit Recovery 0.28 0.28 0.28 0.27 0.27 0.27 0.27 0.27 0.27 Field Size Sensitivity 0.26 0.26 0.26 0.27 0.27 0.28 0.29 0.30 0.31 Government Participation 0.27 0.27 0.27 0.27 0.27 0.27 0.27 0.27 0.27
Source: Author’s Computation
The SI only responded to the field size whereby as the size of the field increased, the IOC
was bound to save more from every dollar spent on the project. This is as a result of the

24
economies of scale that is characterized in oil projects because of their capital intensity
nature. Table 8
Table 8: Sensitivity Scenarios on Operating Leverage
Operating LeverageSensitivity 0.02 0.26 0.51 0.75 1.00 1.25 1.49 1.74 1.98 Oil Price Sensitivity 32.50 2.45 1.27 0.63 0.36 0.23 0.16 0.12 0.09 Capital Expenditure 0.18 0.19 0.23 0.28 0.36 0.46 0.58 0.65 0.65 Operating Expenditure 0.18 0.19 0.23 0.28 0.36 0.46 0.58 0.65 0.65 Cost Limit Recovery 0.01 0.17 0.33 0.36 0.36 0.36 0.36 0.36 0.36 Field Size Sensitivity 0.36 0.36 0.36 0.36 0.36 0.36 0.36 0.36 0.36 Government Participation 0.36 0.36 0.36 0.36 0.36 0.36 0.36 0.36 0.36
Source: Author’s Computation
The operating leverage was highly sensitive to the volatility of the oil price whereby a 25%
decrease in the oil price resulted to a 75% increase in the operating leverage from the base
0.36 to 1.27. Therefore the project profitability is highly exposed to a drop in crude oil
prices under the Kenya BOPD based system.
Table 9: Sensitivity Scenarios on AGR
AGRSensitivity 0.02 0.26 0.51 0.75 1.00 1.25 1.49 1.74 1.98 Oil Price Sensitivity 3997.6% 301.7% 156.8% 92.3% 63.0% 47.4% 37.8% 31.4% 26.8%Capital Expenditure 53.0% 53.7% 55.7% 58.8% 63.0% 68.7% 75.9% 80.0% 80.0%Operating Expenditure 52.7% 53.4% 55.4% 58.6% 63.0% 68.7% 75.7% 80.0% 80.0%Cost Limit Recovery 43.5% 52.6% 61.7% 63.1% 63.0% 63.0% 63.1% 63.1% 63.1%Field Size Sensitivity 61.6% 61.6% 61.7% 62.2% 63.0% 63.8% 64.7% 65.5% 66.2%Government Participation 63.0% 63.0% 63.0% 63.0% 63.0% 63.0% 63.0% 63.0% 63.0%
Source: Author’s Computation
The Access to Gross Revenues (AGR) for the IOC increased from the base 63% to 92.3%
following a drop in prices from US$80 per barrel (Base) to US$60 per barrel based on the

25
assumption that the recovery of OPEX and CAPEX in a given accounting period relative to
gross revenues is unlimited.
5.2 Fair Share of Return
If Kenya discovers hydrocarbons, it would be in the best interest for the government to
secure a fair share of return from the discovery. Therefore, several key economic indicators
were used to determine whether the Kenya Fiscal Regime meets this objective in the event
of a discovery of oil and gas. They are the Government Take and the Effective Royalty
Rate (ERR)
The Kenya BOPD based system generated the following results from the government’s
perspective in achieving a fair share of return.
Government ResultsGovt Take ERRUndiscounted
75.36% 37.02%
A similar sensitivity analysis addressing variations of crude oil price, CAPEX, OPEX was
conducted on the above mentioned results. The sensitivity sole aim was to determine how
the Kenya BOPD based system would under the conditions mentioned and if at all the
government objective of a fair share of return was achieved.
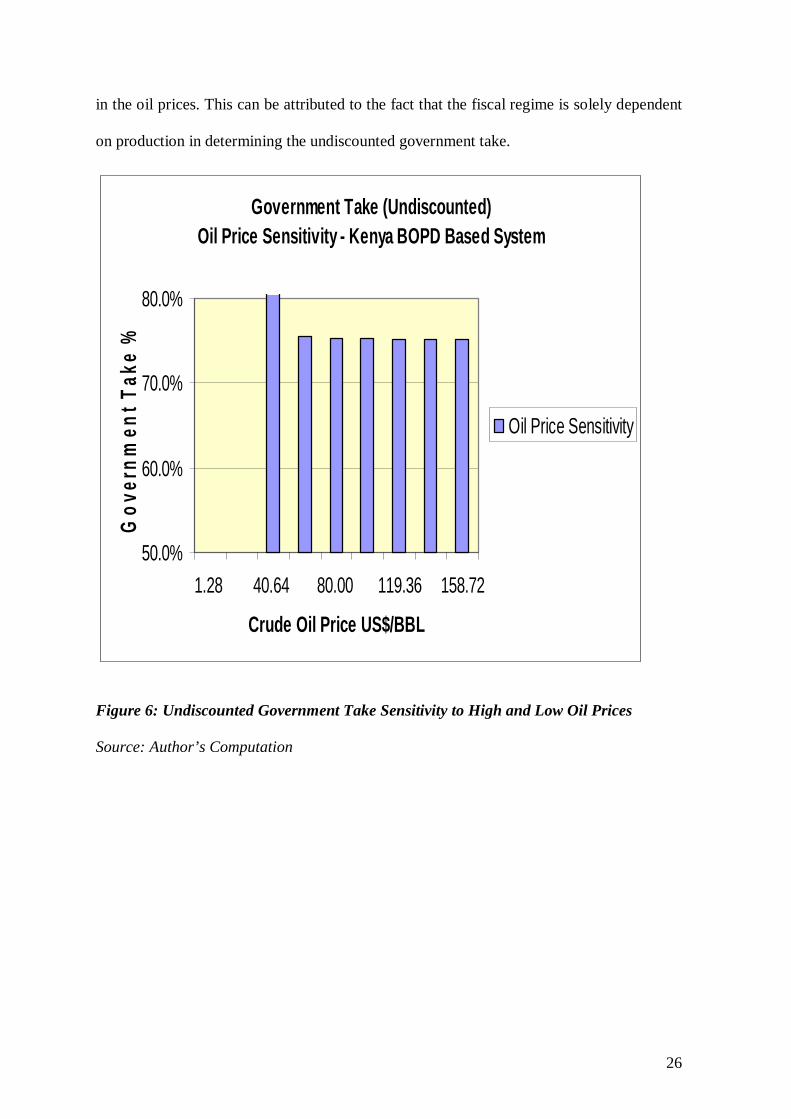
5.2.1 Undiscounted Government Take – High and Low Oil Prices
The graph below represents the sensitivity of the undiscounted government take to
fluctuations of the oil price. It was observed that a 50% increase in the base crude oil price
US$80 per barrel to US$120 per barrel insignificantly reduced the undiscounted
government take from 75.36% to 75.15%. However, a decrease in oil prices increased the
government take from 75.36% to 81.50%. This result demonstrated that the undiscounted
government take under the Kenya BOPD based system does not correspond to movements
26
in the oil prices. This can be attributed to the fact that the fiscal regime is solely dependent
on production in determining the undiscounted government take.
Government Take (Undiscounted)Oil Price Sensitivity - Kenya BOPD Based System
50.0%
60.0%
70.0%
80.0%
1.28 40.64 80.00 119.36 158.72
Crude Oil Price US$/BBL
Gov
ernm
ent T
ake
%
Oil Price Sensitivity
Figure 6: Undiscounted Government Take Sensitivity to High and Low Oil Prices
Source: Author’s Computation
27
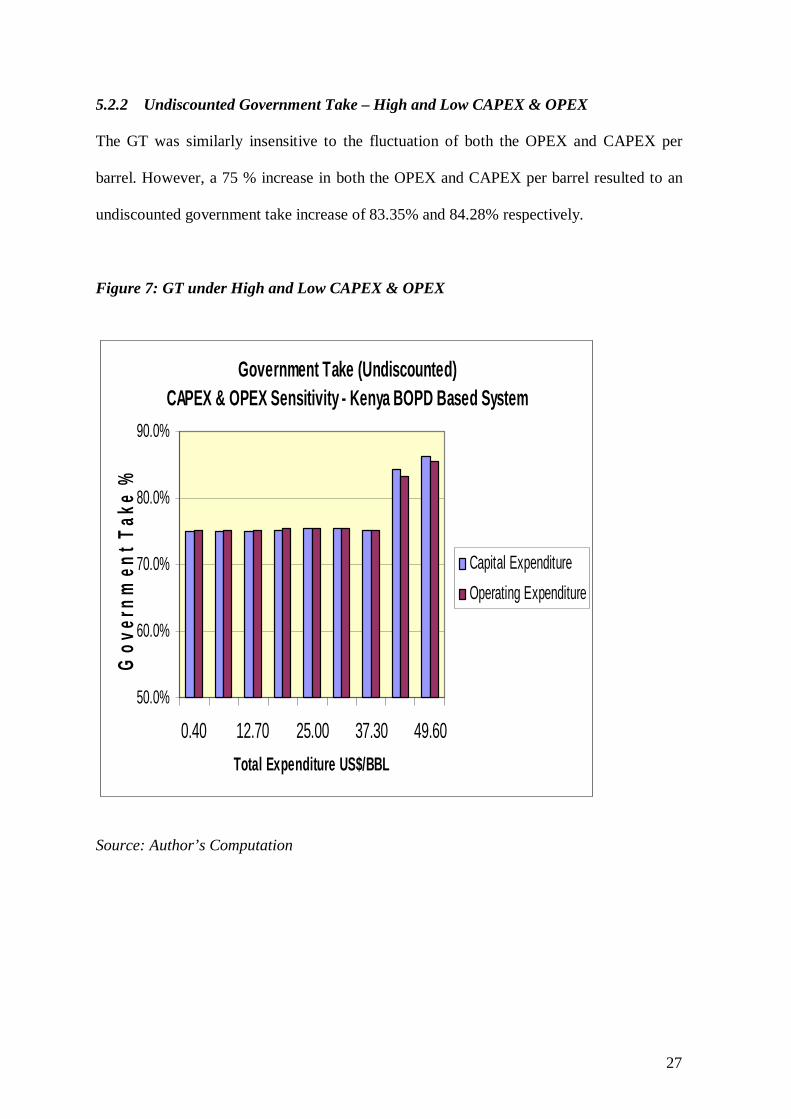
5.2.2 Undiscounted Government Take – High and Low CAPEX & OPEX
The GT was similarly insensitive to the fluctuation of both the OPEX and CAPEX per
barrel. However, a 75 % increase in both the OPEX and CAPEX per barrel resulted to an
undiscounted government take increase of 83.35% and 84.28% respectively.
Figure 7: GT under High and Low CAPEX & OPEX
Government Take (Undiscounted) CAPEX & OPEX Sensitivity - Kenya BOPD Based System
50.0%
60.0%
70.0%
80.0%
90.0%
0.40 12.70 25.00 37.30 49.60Total Expenditure US$/BBL
Gov
ernm
ent T
ake
%
Capital ExpenditureOperating Expenditure
Source: Author’s Computation

28
5.2.3 Undiscounted Government Take – Field Size Sensitivity
It was observed that the GT illustrated the strongest relationship with the increase or
decrease of field size although, the bigger the field, the lower the GT.
Government Take (Undiscounted) Field Size Sensitivity - Kenya BOPD Based System
50.0%
60.0%
70.0%
80.0%
3.2 101.6 200.0 298.4 396.8
Recoverable Oil (MMBBLS)
Gov
ernm
ent T
ake
%
Field Size Sensitivity
Figure 8: GT under Field Size Sensitivity
Source: Author’s Computation
The other sensitivity scenarios are reflected below.
Undiscounted Government TakeSensitivity 2% 26% 51% 75% 100% 125% 149% 174% 198%Oil Price Sensitivity 7.172% -40.675% 81.508% 75.423% 75.361% 75.249% 75.158% 75.099% 75.074%Capital Expenditure 75.0% 75.0% 75.0% 75.1% 75.4% 75.5% 75.3% 84.28% 86.28%Operating Expenditure 75.3% 75.3% 75.3% 75.3% 75.4% 75.4% 75.2% 83.35% 85.35%Cost Limit Recovery 93.2% 84.9% 76.5% 75.3% 75.4% 75.3% 75.3% 75.3% 75.3%Field Size Sensitivity 76.6% 76.6% 76.5% 76.0% 75.4% 74.6% 73.8% 73.1% 72.5%Government Participation 72.7% 73.3% 74.0% 74.7% 75.4% 76.0% 76.7% 77.4% 78.0%

29
6. CONCLUSION
Recent discovery of oil and gas in the East Africa region (Uganda and Tanzania) has put
the Kenya Fiscal Regime on the spotlight. The statistical results demonstrated that the
system attractiveness is doubtful because of its failure to effectively adjust to the ebb and
flow of oil prices and costs. Evidently, in the low oil price era, the IRR and project NPV
decrease although the GT comparatively remains the same and vice versa. This is because
the division of profits is entirely based on daily oil production instead of linking aspects of
the profit-sharing mechanism to profitability of the project through oil prices or ROR.
Therefore, the overall conclusion is that the Kenya Fiscal Regime does not meet the GoK
objectives because it is regressive and inflexible to fluctuations of oil prices and costs. It is
recommended that revision of the system is done to include sensitivity to oil prices and
costs hence avoid issues of alignment of interests that lead to renegotiation of existing
contracts in the future upon discovery of commercial quantities of oil and gas.

30
BIBLIOGRAPHY
1. PRIMARY SOURCES 1.1. Legislation
Republic of Kenya, Ministry of Energy, Petroleum (Exploration and Production) Act Cap 308, August 1986 Republic of Kenya, Ministry of Energy (MOE), National Energy Policy, Sessional Paper No. 4 of 2004 on Energy, October 2004 2. SECONDARY SOURCES 2.1 Books Barrows, G.H. World Fiscal Systems for Oil, Van Meurs & Associates Limited, Calgary, Alberta, 1997 Bindemann. K, Production Sharing Agreements : An Economic Analysis, (UK, Oxford: Oxford Institute for Energy Studies, 1999) Gallun. R. A, Wright. C. J., Nichols. L. M, Stevenson J. W, Fundamentals of Oil & Gas Accounting,(USA, Tulsa, Oklahoma: 5th Edition, PennWell, 2005). Johnson. D, International Fiscal Systems and Production Sharing Contracts ,(USA, Tulsa, Oklahoma:PennWell, 1994 ) Johnston, D. Economic Modelling and Risk Analysis Handbook ,(UK , Scotland, University of Dundee:Dundee, 2002). Johnston. D, The International Exploration Economics Risk, and Contract Analysis, (USA, Tulsa, Oklahoma:PennWell, 2003). Nakhle. C, Petroleum Taxation: Sharing the oil wealth – A study of petroleum taxation yesterday, today and tomorrow, (USA, New York:Routledge, 2008). 2.2 Articles Anderson, O.L. “ Royalty valuation: Should royalty obligations be determined intrinsically, theoretically, or realistically?” Natural Resources Law Journal 37:611, 1998 Kaiser. M, Pulsipher. A.G, “Fiscal System Analysis: Concessionary and Contractual Systems Used in Offshore Petroleum Arrangements” US Department of the Interior,

31
Minerals Management Service, Gulf of Mexico OCS, New Orleans, La. OCS Study MMS 2004-016. 78pp Tordo. S, Fiscal Systems for Hydrocarbons- Design Issues, World Bank Working Paper No 123, (USA, Washington D.C,( August, 2007)). 2.3 Other Sources 2.3.1 Internet Blaug. M, Economic Theory in Retrospect, 3rd edn. (Cambridge and New York: Cambridge University Press, 1978), chapter 4: 'Ricardo's System,' pp. 91-112. At http://eh.net/coursesyllabi/syllabi/munro/ECONRENT.htm (last visited on Jan 14th, 2009). Central Bank of Kenya, Monthly Economic Review, November 2008 at http://www.centralbank.go.ke/downloads/publications/mer/nov08.pdf (last visited Jan 10, 2009).

32
APPENDICES
Field Cash flow Model – Kenya “BOPD based” system

KENYA "BOPD BASED" SYSTEM
Government Take Contractor Group
Unrecovrd. Company Company Govt Govt Company Cash Flow Cash FlowOil OIL Gross Net Capital Operating Deprn & Costs Cost Profit Participation Profit Taxable Income Net DCF Net DCF
Production Price Revenues Royalty Revenue Costs Costs Ammortn C/Fwd Recovery Oil 10% Oil Income Taxes After-Tax 10.0% After-Tax 10.0% Yr (MBBLS) $/bbl US$m US$m US$m US$m US$m US$m US$m US$m US$m US$m US$m US$m US$m US$m US$m US$m US$m
100% 100% 100% 100% 100% 100% 100% 100% 11 - $80.00 - - - 540,000 - - - - - -54,000 - -97,200 - -54,000 -51,487 -486,000 -463,3832 - $80.00 - - - 358,020 - - 97,200 - - -35,802 - -161,644 - -35,802 -31,033 -322,218 -279,2933 - $80.00 - - - 1,207,904 - - 161,644 - - -120,790 - -379,066 - -120,790 -95,181 -1,087,114 -856,6304 5,429 $80.00 434,322 - 434,322 802,273 66,255 476,944 379,066 282,309 60,805 -52,541 91,208 -723,561 - 38,666 27,699 -472,873 -338,7435 12,668 $80.00 1,013,418 - 1,013,418 - 157,687 476,944 784,366 658,722 151,798 65,283 202,898 -547,673 - 268,181 174,647 587,549 382,6286 20,000 $80.00 1,600,000 - 1,600,000 - 253,939 476,944 760,276 1,040,000 264,460 104,145 295,540 25,904 9,066 408,752 241,991 937,309 554,9117 18,097 $80.00 1,447,740 - 1,447,740 - 234,369 476,944 451,159 941,031 232,700 77,752 274,009 462,418 161,846 513,607 276,426 699,764 376,6178 16,375 $80.00 1,309,969 - 1,309,969 - 216,307 476,944 221,441 851,480 206,179 71,381 252,310 364,408 127,543 451,234 220,778 642,429 314,3269 14,816 $80.00 1,185,309 - 1,185,309 - 199,637 - 63,212 262,849 405,092 30,440 517,368 468,304 163,906 711,714 316,569 273,958 121,856
10 13,406 $80.00 1,072,512 - 1,072,512 - 184,252 - - 184,252 383,671 24,939 504,589 383,671 134,285 663,813 268,420 224,448 90,75811 12,131 $80.00 970,449 - 970,449 - 170,052 - - 170,052 339,990 22,099 460,407 339,990 118,997 601,503 221,113 198,894 73,11412 10,976 $80.00 878,099 - 878,099 - 156,947 - - 156,947 300,623 19,541 420,528 300,623 105,218 545,287 182,226 175,865 58,77113 9,932 $80.00 794,536 - 794,536 - 144,852 - - 144,852 268,482 17,451 381,203 268,482 93,969 492,623 149,660 157,062 47,71614 8,987 $80.00 718,926 - 718,926 - 133,689 - - 133,689 239,587 15,573 345,651 239,587 83,855 445,079 122,924 140,158 38,71015 8,131 $80.00 650,511 - 650,511 - 123,386 - - 123,386 213,545 13,880 313,581 213,545 74,741 402,202 100,983 124,924 31,36516 7,358 $80.00 588,607 - 588,607 - 113,877 - - 113,877 190,078 12,355 284,652 190,078 66,527 363,535 82,977 111,196 25,38117 6,657 $80.00 532,594 - 532,594 - 105,101 - - 105,101 170,997 11,115 256,496 170,997 59,849 327,459 67,948 100,033 20,75718 6,024 $80.00 481,911 - 481,911 - 97,001 - - 97,001 153,964 10,008 230,946 153,964 53,887 294,841 55,618 90,069 16,99019 5,451 $80.00 436,051 - 436,051 - 89,526 - - 89,526 138,610 9,010 207,915 138,610 48,514 265,438 45,520 81,087 13,90520 4,932 $80.00 394,555 - 394,555 - 82,626 - - 82,626 124,771 8,110 187,157 124,771 43,670 238,937 37,250 72,991 11,37921 4,463 $80.00 357,008 - 357,008 - 76,259 - - 76,259 112,300 7,299 168,450 112,300 39,305 215,054 30,479 65,695 9,31122 4,038 $80.00 323,034 - 323,034 - 70,382 - - 70,382 101,061 6,569 151,592 101,061 35,371 193,532 24,935 59,121 7,61723 3,654 $80.00 292,294 - 292,294 - 64,958 - - 64,958 90,934 5,911 136,402 90,934 31,827 174,139 20,397 53,197 6,23124 3,306 $80.00 264,478 - 264,478 - 59,952 - - 59,952 81,811 5,318 122,716 81,811 28,634 156,667 16,682 47,859 5,09625 3,171 $80.00 253,676 - 253,676 - 58,653 - - 58,653 78,009 5,071 117,014 78,009 27,303 149,387 14,461 45,635 4,418
200,000 16,000,000 - 16,000,000 2,908,198 2,859,705 2,384,722 2,918,365 5,767,903 4,309,467 280,115 5,922,630 2,400,324 1,508,314 7,711,059 2,522,002 2,521,038 273,806
Undiscounted Take US$m 14,545,455 5,243,548 10232097.18 # Contractor Group 24.6% 2,521,038 Internal Rate of Return 12.7% Government 75.4% 7,711,059 80.0$ /BBL
Total 100% 10,232,097 Discounted Take Present Value SummaryInvestor Results Government Results Profit Oil Split Assumptions Assumptions (Base Case)
NPV Project Access to Gross Operating Saving Index Lifting Entitlement Govt Take ERR Bopd Govt Contractor Production Assumptions Economic Assumptions Fiscal TermsUS$m IRR Revenues Leverage US cents Entitlement Undiscounted First 20000 60% 40% Field Size 200mbbls Currency US $ Cost Oil 65%
273.81 12.74% 62.98% 0.36 0.27 62.98% 75.36% ### 37.02% Next 30000 55% 45% Peak Prod. 10% Oil Price $ 80.00 Inc Tax 35%Next 40000 50% 50% Decline Rate 10% Capex $/bbl 13.50 Govt Part 10%Next 50000 45% 55% Opex $/bbl 11.50Over 100000 40% 60%

34