
Kenya Marine and Fisheries Research Institute Freshwater ... · Variations in Total Ammonia and...
40
Kenya Marine and Fisheries Research Institute Freshwater Systems Assessment of the fisheries status in River Molo to guide the management on its fisheries Technical Report KMF/RS/2018/ C1.7. 31 st March, 2018
Transcript of Kenya Marine and Fisheries Research Institute Freshwater ... · Variations in Total Ammonia and...

Kenya Marine and Fisheries Research Institute
Freshwater Systems
Assessment of the fisheries status in River Molo to guide the management on its
fisheries
Technical Report
KMF/RS/2018/ C1.7.
31st March, 2018
1
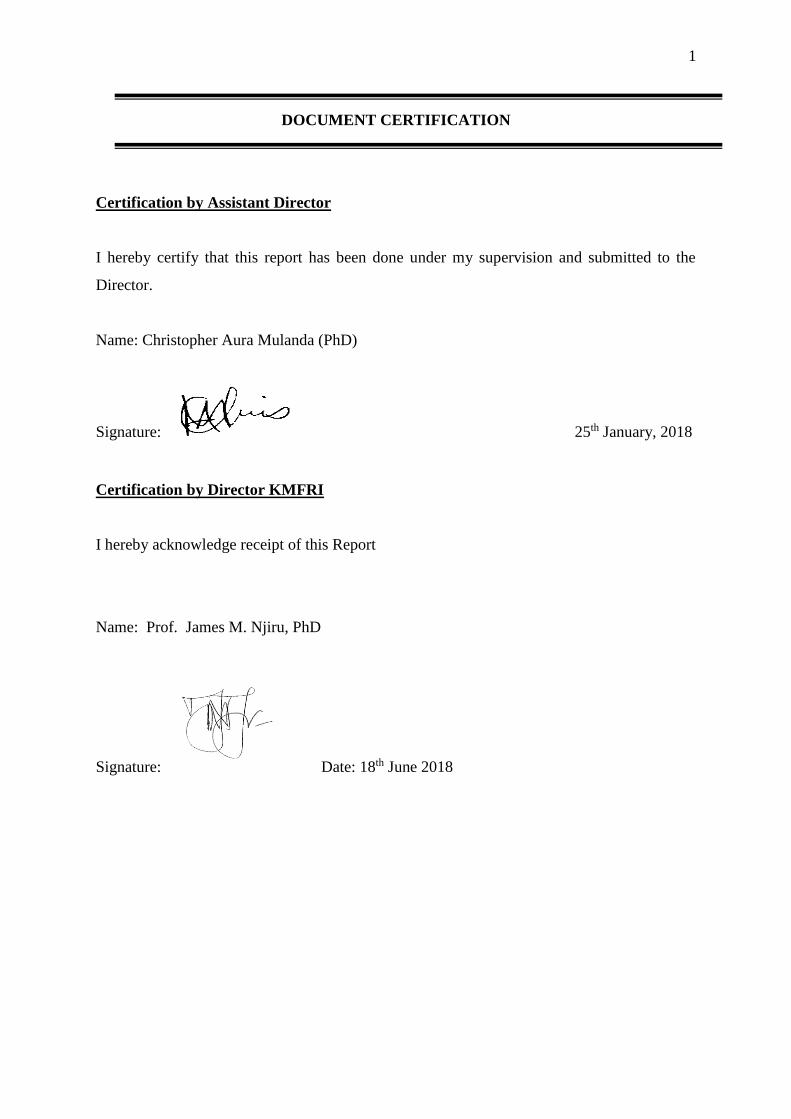
DOCUMENT CERTIFICATION
Certification by Assistant Director
I hereby certify that this report has been done under my supervision and submitted to the
Director.
Name: Christopher Aura Mulanda (PhD)
Signature: 25th January, 2018
Certification by Director KMFRI
I hereby acknowledge receipt of this Report
Name: Prof. James M. Njiru, PhD
Signature: Date: 18th June 2018

2
Produced by:
Kenya Marine and Fisheries Research Institute
P. O. Box 81651 Mombasa
Kenya
Website: www.kmfri.co.ke
Email: [email protected]
Tel: 254 (041) 475151/4
Suggested citation formats:
Nyakeya, K., Jembe T., Miruka, J. B., Mugo, J., and Odoli, C. (2018). Assessment of the
fisheries status in River Molo to guide the management on its fisheries. KMF/RS/2018/ C1.7.

3
Acknowledgements
We would like to acknowledge the government support through KMFRI under the
GoK seed fund in supporting the field activity and development of this report. Much
appreciation to the scientific and technical teams at KMFRI involved in the data collection
and analysis without which this exercise would not have succeeded.
4
Table of Contents
DOCUMENT CERTIFICATION .............................................................................................. 1
Table of Contents ....................................................................................................................... 4
List of Tables ............................................................................................................................. 5
List of Figures ............................................................................................................................ 6
Abstract ...................................................................................................................................... 7
1. Introduction ............................................................................................................................ 8
1.1 Background of the study .................................................................................................. 8
1.2 Objectives of the report .................................................................................................. 10
2. Materials and methods ......................................................................................................... 10
2.1 Study area ...................................................................................................................... 10
Figure 1: Map showing the location of the sampled locations along River Molo ............... 11
2.2 Selection of study sites .................................................................................................. 11
2.3 Measurement of the physical and chemical parameters ................................................ 12
2.4 Fish sampling and processing ........................................................................................ 13
2.5 Macro-invertebrate sampling and laboratory processing ............................................... 14
2.7 Data analysis .................................................................................................................. 14
3. Results and Discussion ........................................................................................................ 15
3.1 Water quality parameters ............................................................................................... 15
3.3 Fish abundance and distribution .................................................................................... 23
3.3.1 Food and feeding habits .............................................................................................. 24
3.3.2 Length/Weight relationships ....................................................................................... 25
3.3.3 Breeding ...................................................................................................................... 27
3.4 Macroinvertebrate distribution data of River Molo ....................................................... 28
Fig.8. Shannon-Weiner diversity index for macroinverterbreates in River Molo ................... 30
4. Conclusions .......................................................................................................................... 30
4.1 Management recommendations ..................................................................................... 31
References ................................................................................................................................ 32
Appendix I: Submission Letter ................................................................................................ 34
Appendix II. Letter of invitation .............................................................................................. 35
Appendix III. Approval for sampling ...................................................................................... 36

5
List of Tables
Table 1: Description sampling sites ......................................................................................... 12
Table 2. Fish composition and catch data ................................................................................ 24
Table 3: Dietary status of fish sampled along different locations of River Molo .................... 25
Table 4: Sex ratios of fish sampled along different locations of River Molo .......................... 27
Table 5: Data on the macro invertebrate species composition during the study along River
Molo ............................................................................................................................. 29

6
List of Figures
Fig. 1. Map showing the location of the sampled locations along River Molo ....................... 11
Fig. 2. Water quality parameters along the sampling locations of River Molo ....................... 16
Fig. 3. Variations in Total Ammonia and Total Nitrogen at River Molo ................................ 17
Fig. 4. Variations in Soluble Reactive Phosphorus (SRP) and Total Phosphorus (TP) at River
Molo ............................................................................................................................. 18
Fig. 5. Variation in TN/TP ratios of River Molo sites ............................................................. 19
Fig. 6. Phytoplankton cell density (cells x 106) as recorded at different stations of the river. 20
Fig. 7. Percentage phytoplankton composition (mm3 l-1) assigned to phytoplankton classes or
families as recorded at different sites of River Molo ................................................... 21
Fig. 8. Length Weight relationships of the fish species sampled from River Molo ................ 26
Fig. 9. Shannon-Weiner diversity index for macroinverterbreates in River Molo .................. 30
7
Abstract
Rivers provide a suite of ecosystem goods and services to fisheries, as well as water that
benefit the domestic and industrial use of the riparian communities. The increasing
intensification of human activities along River Molo in the Rift Valley, Kenya continues to
affect the diversity of aquatic life including fish. Whereas, information on the status and
changes in fish population and ecological attributes along the river that is fundamental,
knowledge is currently lacking. The study evaluated the status of River Molo fisheries and
the environmental conditions longitudinally along the river. All the physicochemical water
quality parameters demonstrated significant (P < 0.05) spatial variations in the sampled
stations of River Molo. There were 54 different species of algae identified in this study and
the average algal density fluctuated between 2 to 16 cells ml-1. Significant differences were
recorded in the macroinvertebrate occurrence along the river (Chi-square; 2 = 20.1121, df =
3, P = 0.0031). Fisheries data depicted minimum sizes at which the species mature to be 24
cm for Clarias theodorae, 25 cm for Oreochromis niloticus baringoensis, 17 cm for Barbus
altenialis, 23 cm for Labeo cylindricus and 13.5 cm for Barbus cercops. There were
differences in the sex ratios of fish species with Barbus altenialis and Barbus neumayeri
being the only species where males dominated over the female. Only Labeo cylindricus
exhibited a positive allometric growth (b < 3). Variations in fish community attributes
associated with longitudinal anthropogenic and environmental factors were reported.
Although overfishing was not prominent, an analysis of the breeding trends indicated
recruitment overfishing took place sometimes in the past few years. These observations
suggest that less favorable hydrological conditions coupled with coincidental high fishing
pressure could have impacted the river’s population biomass. The need for River Molo
fisheries management plan with a single economic vision of the resource use based on an
ecosystem-oriented approach cannot be overstated. The plan should capture among other
components, the hydrological regime, and species life history traits, fishing impacts and
stakeholders socioeconomic requirements as key elements for fishery sustainability.
Key words: Riverine fisheries, Water quality, River Molo, management initiatives,
anthropogenic influences
8
1. Introduction
1.1 Background of the study
Rivers provide a suite of ecosystem goods and services to fisheries as well as water that
benefit the domestic and industrial use of the riparian communities. Dominance of small scale
fisheries in the rivers plays a critical role in local livelihoods, mainly as food sources and
poverty relief (Béné et al., 2016). However, unsustainable land use due to several human
activities including agriculture, deforestation, input of nutrients from domestic and municipal
sewage, overfishing and illegal fishing methods etc pose threats to the biological integrity of
riverine environments (Arthington et al., 2006; Acreman et al., 2014; Oeding et al. 2018).
Each of these human activities may invariably affect the riverine ecosystems based on the
intensity of the human activities, size of the catchment as well as volume of water discharged
(Tonkin et al., 2018). Changes in the riverine ecosystem further fuel changes in ecosystem
structure, affects aquatic assemblages, and aquatic community structures (Hering et al.,
2016). Therefore information on the changes of riverine biological indicators is urgently
needed.
Despite the significance of riverine fisheries in Kenya, there are very few or no
previous studies that have been conducted on population assessments/changes, feeding habits
and breeding stages in rivers in Kenya. Few previous reports presented a broad picture of
catch trends, and how they are affected by human activities, albeit they are decadal old
literature (e.g Whitehead, 1959; Cadwalladr, 1965; Ochumba and Ala, 1992). Lack of a
comprehensive analysis, however, is not surprising since only irregular landing records are
available, and additional relevant fishing parameters - such as effort, catch per unit effort and
length structure data – are rarely collected on temporal basis. In absence of suitable
information, several indicators could be applied to assess fishery status and trends. The
development of valid indicators and their respective reference values, however, still represent
a major challenge for rivers in Kenya, due to the current lack of reliable fishery information
and the expected dependence of species abundance on the hydrological regime. Fishery
management in most rivers is becoming a relevant and demanding issue. In recent years,
however, a decrease in the fish catch in several rivers in Kenya, have been noted as a result of
overexploitation and augmented pollution due to anthropogenic activities in the catchment
areas. Simple indicators based on length structure monitoring, common fish biological
characteristics - such as growth parameters, natural mortality, and reproductive patterns - and
9
basic fishery information, coupled with hydrological information and human activities, can
be integrated and used to follow fishery trends and to predict how management directions
could affect stock sustainability.
Flowing down from the Mau Complex, the Molo River has served citizens of the Rift
Valley for several years. Over the approximately 100 km length that the river covers from the
Mau Forest to Lake Baringo, this waterway is a primary source of livelihood amongst the
communities it flows through. The constituencies that the Molo River serves along its
coverage include: Kuresoi, Molo, Rongai, Mogotio, and Baringo Central. Up to 1985, the
water in Molo River remained clean, safe, and sufficient for communities in the region and
for fisheries. However, in the recent past the water has decreased substantially in volume and
became polluted resulting to the fishery decline being observed. These problems have been
exacerbated, as community settlement and extreme drought conditions worsen, threatening
the continued existence of the River Molo itself. Human activities in the upper catchment
have had severe impacts on the flow of the Molo River. Starting in the region of Kuresoi,
massive deforestation of the Mau Complex has lead to a decrease in the forest cover causing
many other issues such as soil erosion, reduced rainfall, and a general decrease in water.
These issues cause problems that affect the River Molo throughout its course, as muddy
water with a decreased flow have become common in many areas. Another key component of
the degradation has been the community re-settlement that has occurred in the past few years.
Due to poor land allocation systems, and the lack of implementation when dealing with land
policies and laws, individuals have encroached into forest land, clearing the trees and
destroying the local environment. Additionally, poor farming methods, and a lack of
conservation among community individuals in the region, have had dramatic effects on the
river. These methods include farming on sloped lands, farming into river banks, planting of
inappropriate species such as Eucalyptus, and lack of soil conservation measures. However,
knowledge on the status of fisheries in this important riverine environment continues to
languish behind other riverine environments and thus posing great challenge to prescribing
the management strategies for restoration of the river. On the basis of the foregoing, this
study assessed the fish species diversity and fisheries longitudinally along River Molo.
10
1.2 Objectives of the report
The main objective of the current study was to assess the status of River Molo fisheries and
its characteristics. The specific objectives were:
i. To assess the environmental status along selected sites along River Molo.
ii. To describe the abundance and composition of fish species in River Molo.
iii. To describe the abundance and composition of fish species in River Molo.
iv. To determine the macroinvertebrate community structure along River Molo.
2. Materials and methods
2.1 Study area
This study was conducted longitudinally along River Molo (Figure 1). The upper catchment
in the Molo and Kuresoi areas, functions as the primary source of the Molo River. Several
streams that begin in the Mau Complex flow into the Molo River and are depended upon all
the way down to Lake Baringo. An important aspect of the upper catchment is the Mau
Complex, which is among the major water towers in the country with numerous rivers, other
than Molo, emanating from it such as, Njoro River and Mara River. It is important to focus
on the upper catchment when viewing the River Molo as a whole, because of the effects and
problems upstream have to the rest on downstream communities. The catchment of River
Molo is a highland plateau with altitude ranging between 2400 to 3100 m asl. Rainfall in
Molo is reliable and evenly distributed with two peaks in April to May and November to
December and a drier spell from November to February. The region has a mean annual
rainfall of 1100 mm although some areas receive up to 1500 mm. The average temperature is
23°C during the wet season with a maximum of 27C during the dry season and a minimum
of 12C in the coolest season. February is the hottest month, and June is the coolest. Soils in
the area are typically reddish to brown volcanic soils. They are thin, drain freely and have a
friable texture with layers of cellular ironstone. Brown loam soils occur in high altitude areas
and they are derived from both volcanic and basement complex rocks.
11
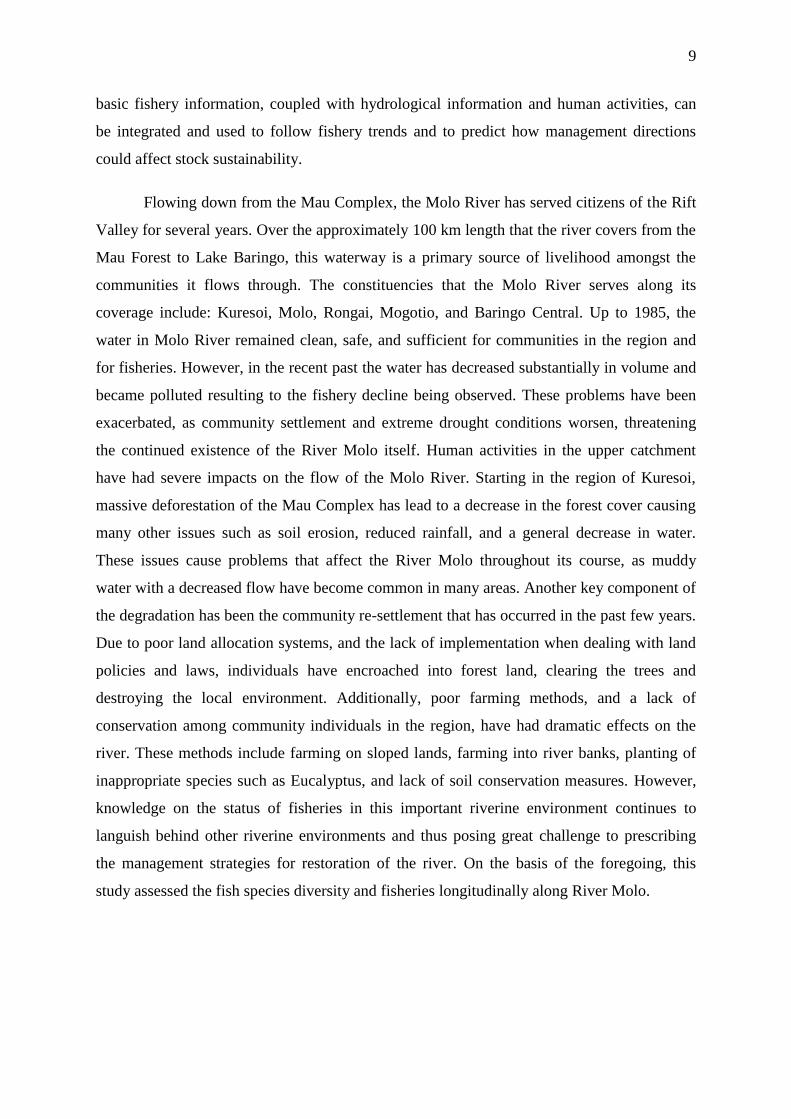
Fig. 1. Map showing the location of the sampled locations along River Molo. Ten sampled
stations were: F1, Sirindet; T1, Kibunja Molo Bridge; T3, Sangwani; C1, Molo Quarry
Mkinyai; C2, Salgaa Bridge; C3, Ravine Nakuru Bridge; U1, Mogotio Bangra; U2, Mogotio
Bridge/Upper; U3, Sirwe; and C4. Lororo Bridge (the rest of the stations were not sampled
due to inaccessibility).
2.2 Selection of study sites
Sampling sites were selected randomly based on a number of factors: accessibility, proximity,
habitat diversity and riparian land uses. The Geographical Position System (GPS) was used to
mark the sampled points during sampling. Sites with differing riparian land uses activities
were selected in current study, and their characteristics described as depicted in Table 1.
Watershed delineation and classification were conducted in ArcGIS version 3.2. Based on
topographic maps at a scale of 1:250,000, the watersheds were delineated and overlain on
aerial photos then divided into polygons of different land use type. The areas of the polygons
12
were calculated to determine the dominant land use type. Only the watershed areas upstream
of the sampling locations were considered.
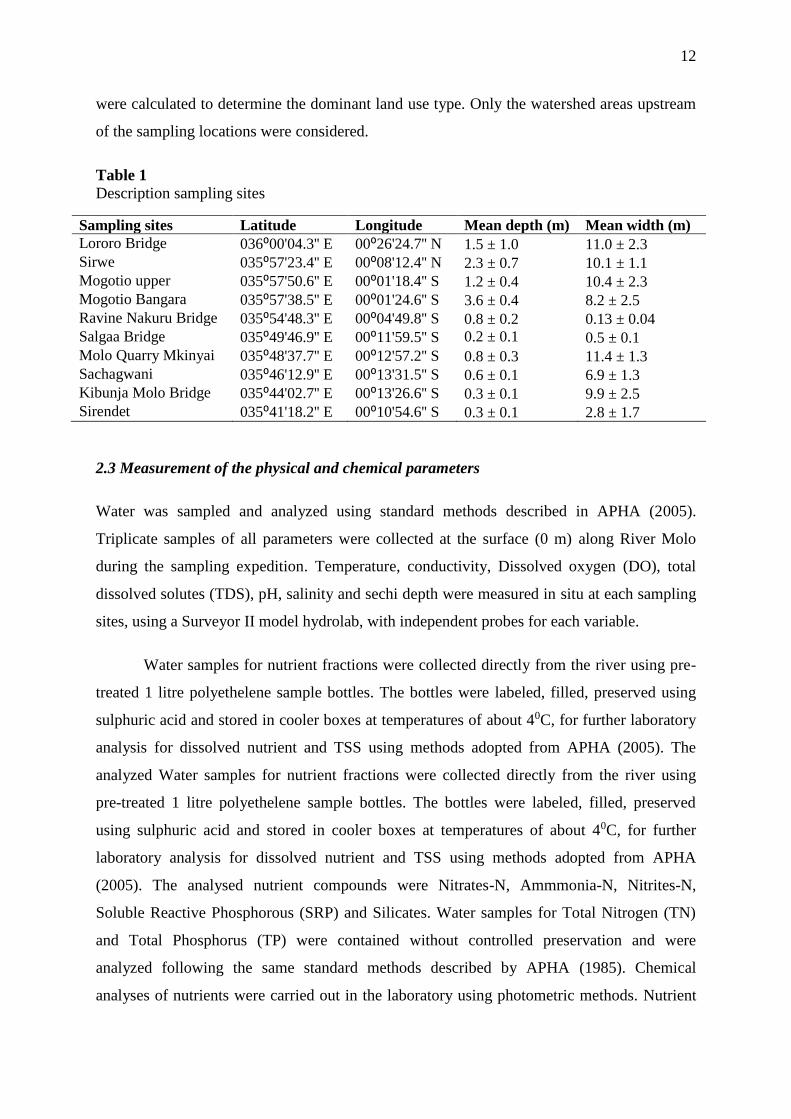
Table 1
Description sampling sites
Sampling sites Latitude Longitude Mean depth (m) Mean width (m)
Lororo Bridge 036⁰00'04.3'' E 00⁰26'24.7'' N 1.5 ± 1.0 11.0 ± 2.3
Sirwe 035⁰57'23.4'' E 00⁰08'12.4'' N 2.3 ± 0.7 10.1 ± 1.1
Mogotio upper 035⁰57'50.6'' E 00⁰01'18.4'' S 1.2 ± 0.4 10.4 ± 2.3
Mogotio Bangara 035⁰57'38.5'' E 00⁰01'24.6'' S 3.6 ± 0.4 8.2 ± 2.5
Ravine Nakuru Bridge 035⁰54'48.3'' E 00⁰04'49.8'' S 0.8 ± 0.2 0.13 ± 0.04
Salgaa Bridge 035⁰49'46.9'' E 00⁰11'59.5'' S 0.2 ± 0.1 0.5 ± 0.1
Molo Quarry Mkinyai 035⁰48'37.7'' E 00⁰12'57.2'' S 0.8 ± 0.3 11.4 ± 1.3
Sachagwani 035⁰46'12.9'' E 00⁰13'31.5'' S 0.6 ± 0.1 6.9 ± 1.3
Kibunja Molo Bridge 035⁰44'02.7'' E 00⁰13'26.6'' S 0.3 ± 0.1 9.9 ± 2.5
Sirendet 035⁰41'18.2'' E 00⁰10'54.6'' S 0.3 ± 0.1 2.8 ± 1.7
2.3 Measurement of the physical and chemical parameters
Water was sampled and analyzed using standard methods described in APHA (2005).
Triplicate samples of all parameters were collected at the surface (0 m) along River Molo
during the sampling expedition. Temperature, conductivity, Dissolved oxygen (DO), total
dissolved solutes (TDS), pH, salinity and sechi depth were measured in situ at each sampling
sites, using a Surveyor II model hydrolab, with independent probes for each variable.
Water samples for nutrient fractions were collected directly from the river using pre-
treated 1 litre polyethelene sample bottles. The bottles were labeled, filled, preserved using
sulphuric acid and stored in cooler boxes at temperatures of about 40C, for further laboratory
analysis for dissolved nutrient and TSS using methods adopted from APHA (2005). The
analyzed Water samples for nutrient fractions were collected directly from the river using
pre-treated 1 litre polyethelene sample bottles. The bottles were labeled, filled, preserved
using sulphuric acid and stored in cooler boxes at temperatures of about 40C, for further
laboratory analysis for dissolved nutrient and TSS using methods adopted from APHA
(2005). The analysed nutrient compounds were Nitrates-N, Ammmonia-N, Nitrites-N,
Soluble Reactive Phosphorous (SRP) and Silicates. Water samples for Total Nitrogen (TN)
and Total Phosphorus (TP) were contained without controlled preservation and were
analyzed following the same standard methods described by APHA (1985). Chemical
analyses of nutrients were carried out in the laboratory using photometric methods. Nutrient
13
compounds were Nitrates-N, Ammmonia-N, Nitrites-N, Soluble Reactive Phosphorous (SRP)
and Silicates. Water samples for Total Nitrogen (TN) and Total Phosphorus (TP) were
contained without controlled preservation and were analyzed following the same standard
methods described by APHA (1985).
2.4 Sampling for phytoplankton
Water samples for phytoplankton analysis were collected from the surface. A portion of the
water sample (25 mls) was preserved in acidic Lugol’s solution. A 2 ml phytoplankton sub-
sample was placed in an Utermöhl sedimentation chamber and left to settle for at least three
hours. Phytoplankton species identification and enumeration were done using a Zeiss
Axioinvert 35 inverted microscope at 400x magnification. At least, ten fields of view were
counted for the very abundant coccoid cyanobacteria and a 12.42 mm2 transect was counted
for the abundant and large algae. The whole bottom area of the chamber was examined for
the big and rare taxa under low (100x) magnification. Phytoplankton taxa were identified
using the methods of Huber –Pestalozzi (1968) as well as some publications on East African
lakes (Cocquyt et al., 1993). Phytoplankton were estimated by counting all the individuals
whether these organisms were single cells, colonies or filaments.
2.4 Fish sampling and processing
Fish were sampled at each sampling site using electro-fisher along the river. At each of the
sampling site, electro-fishing time was about 10 minutes covering an area of approximately
100 m for each sampling site. Sampling gears were deployed proportionally according to
habitats suitability within each bend. After capture, the fork length (FL) and standard length
(SL) were measured to the nearest 0.1 mm and the eviscerated body weight (W) to the nearest
0.01 g. The specimens were dissected to expose the viscera where the dominant food items
were recorded. The total catch from each gear was weighed in g, using a digital weighing
scale (5kg Vibra Model from Shinko Devshi Co. Ltd, Japan).
Upon data collection, fish specimens were immediately tagged and gut content
extracted and preserved in 5% formalin for laboratory examination. The frequency of
occurrence was used to compute the individual food items sorted and identified. The number
of stomachs where the food item occurred was recorded and expressed as a percentage of all
the stomachs being analyzed. The index of occurrence (Io): Io = Na/Nt × 100 (%), (Windell,
14
1968; Hyslop, 1980) (Na = the number of stomachs where a food category is recorded, NT =
a total number of stomach).
2.5 Macro-invertebrate sampling and laboratory processing
A total of 10 benthic samples in triplicate were collected at random locations in each of the
selected sites with a Surber sampler (0.09 m2, 250’’ mesh size). The Surber was placed on the
stream bottom in a shallow flowing habitat. For each site, invertebrates were sampled at sites
according to guidelines of the “Indice Biologique Global Normalise” (hereafter IBGN), a
normalised tool commonly used for monitoring biotic integrity in several rivers. Substratum
inside the frame was agitated by hand to collect invertebrates into the net; larger pebbles were
removed and scrubbed to detach the invertebrates residing on them. This was done three
times at each site. Samples were preserved using ethanol (70% v/v) until analyzed in the
laboratory. The containers were carefully labeled to maintain identity giving details such as
site, date, code and location. In the laboratory, each sample was handled individually. The
samples were washed through a 250’’ mesh size sieve to remove mud, sand and other debris.
The benthic macro-invertebrates were transferred to labeled bottles and preserved in 70%
ethanol until identified whereas the inorganic debris components were discarded. The
samples for lipid analysis were not preserved in ethanol in the field and in the laboratory, but
were analyzed immediately. The macro-invertebrates were removed from the bottle one after
the other and identified to the lowest-possible taxonomic level with the aid of several keys
and illustration and counted using a stereomicroscope and dissecting microscope at ×50
magnifications.
2.7 Data analysis
All statistical analyses were performed with a STATISTICA 6.0. Normality and
homoscedasticity of data distribution was checked by means of the skewness and kurtosis. In
case where data was found not to follow normal distribution (heteroscedastic), log
transformation was used to normalize all the biological data. For each tested data set,
between-site differences in concentrations of abundances of benthic invertebrates, fish
species and taxonomic richness were tested using one way analysis of variance (ANOVA),
the assumption of normality prior to ANOVA was verified using the Shapiro–Wilk test. Fish
species distribution was analyzed using two-way interaction where sampling location and fish
species were factors. Abundance data were not normally distributed even after log-
15
transformation, and between-sites differences were tested using the non-parametric Kruskall–
Wallis test. All results were declared significant at P < 0.05.
3. Results and Discussion
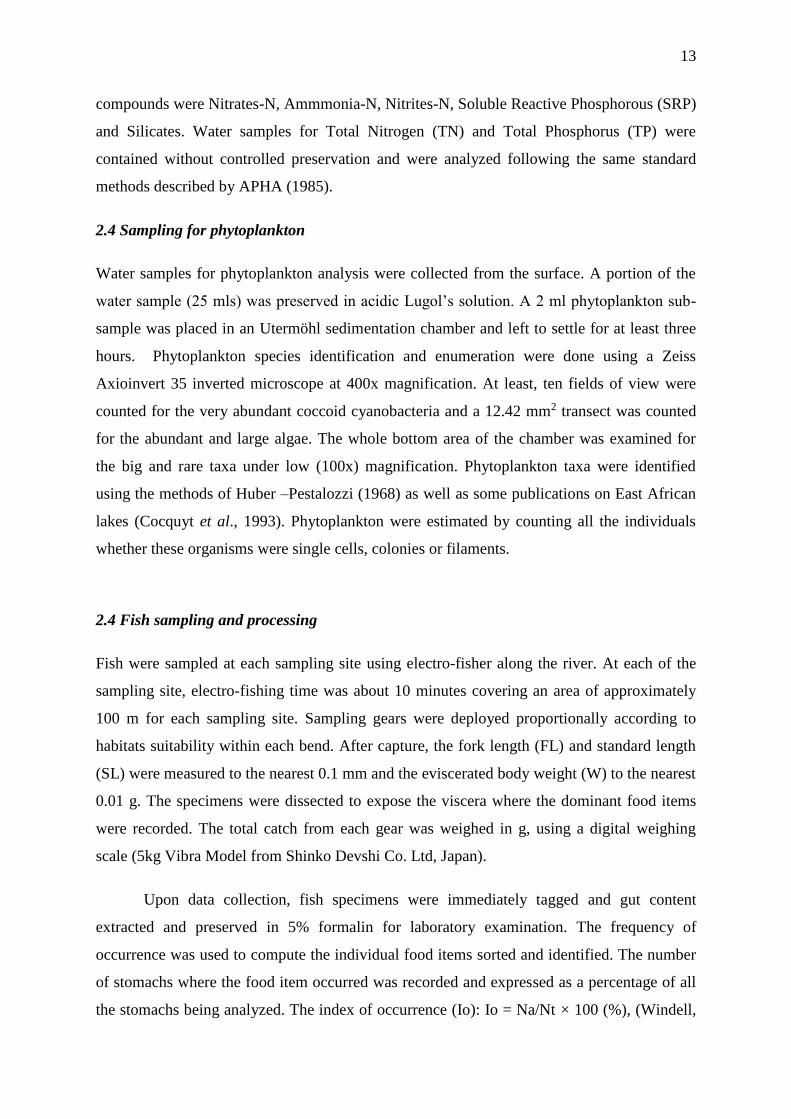
3.1 Water quality parameters
3.1.1 Physico-chemical
An overview of the physical and chemical water quality parameters along River Molo are
provided in Figure 2. All the physicochemical water quality parameters demonstrated
significant (P < 0.05) spatial variations. The physicochemical environment along River Molo
displayed significant spatial variation which is thought be exacerbated by the diverse human
activities along the river. Lororo Bridge exhibited significantly (P < 0.05) higher temperature
values than other sites. This was associated with discharge of warm water from a factory
within the area. The variation in temperature along the river could as well be attributed to
differences in water depth such that the deep and shallow water in the sites translates to
relatively larger water mass which takes longer to warm up or cool down. Conductivity
values were highest in the upstream station of Lororo and Sirwe. This is probably associated
with factory effluents discharged into the within the area resulting into high amount of total
dissolved solids
Meanwhile the pH was found to be relatively high which is common for River Molo
that is of volcanic origin (Rad et al., 2007), the high pH was recorded in Molo Quarry
Mkinyai followed by Ravine Nakuru Bridge and lowest at Kibunja Molo Bridge. Higher pH
levels were suspected to be due to mining activities within the area. The pH in the lower parts
of the River Molo was somewhat lower compared to the other sites, a statement attributed to
the high influx of fresh water from the incoming tributaries (Ol Arabe, Endau and Kapthurin)
of river Molo. Sirwe had the highest TDS and salinity among all the sites. Sachang’wan and
the upper reaches of Mogotio had the highest DO and a part from upper Mogotio, DO levels
were high at the lower reaches of the river. Lororo Bridge, Ravine Nakuru Bridge and Salgaa
Bridge all recorded DO levels <6.0 mg/l. However, DO levels at Salgaa Bridge/upper had
levels below 4.9 mg L-1 which, could be attributed to decomposing of organic matter and
detritus hence proliferation of blue green algae and diatoms.
The preferred optimal temperature range for good fish health especially Oreochromis
niloticus baringoensis, growth and reproductive performance range between 23 and 320C.
16
The river is within the tropical region; thus provide good ambient water temperature for fish.
The observed water temperatures were good for tilapia’s overall performance, but when
considered alongside water pH may change the ambient environmental conditions from
acceptable to unacceptable.
Temperature and pH vary temporally depending on climatic variability especially wet
season; these two variables increase during the dry season. The variation in temperature
within the River Molo could also be attributed to differences in the water depth such that the
deep and shallow water in the sites translates to relatively larger water mass which takes
longer to warm up and cool down. In addition to the foregoing, the relatively high pH values
observed in R. Molo could be associated with the volcanic origin (Costantini et al., 2007).
The pH at the upper parts of the river was somewhat lower in comparison to the other
sites which can be attributed to the high influx of fresh surface water run-off during spates.
Fig. 2. Water quality parameters along the sampling locations of River Molo
Temperature
0
5
10
15
20
25
Tem
pp
eratu
re (
C)
.
Conductivity
0
100
200
300
400
500
600
700
Con
du
ctiv
ity (
ms/
cm)
.
pH
4.0
5.0
6.0
7.0
8.0
pH
TDS
0
30
60
90
120
150
TD
S (
mg/L
)
DO
0
3
6
9
12
15
Loror
o Brid
ge
Sirwe
Mog
otio
Upp
er
Mog
otio
Ban
gara
Rav
ine N
akur
u Brid
ge
Salga
a Brid
ge
Mol
o Qua
rry
Mki
nyai
Sacha
gwan
i
Kib
unja
Mol
o Brid
ge
Sirend
et
DO
(m
g/L
)
Salinity
0
0.2
0.4
0.6
0.8
Loror
o Brid
ge
Sirwe
Mog
otio
Upp
er
Mog
otio
Ban
gara
Rav
ine N
akur
u Brid
ge
Salga
a Brid
ge
Mol
o Qua
rry
Mki
nyai
Sacha
gwan
i
Kib
unja
Mol
o Brid
ge
Sirend
et
Salin
ity (
mg/L
)
17
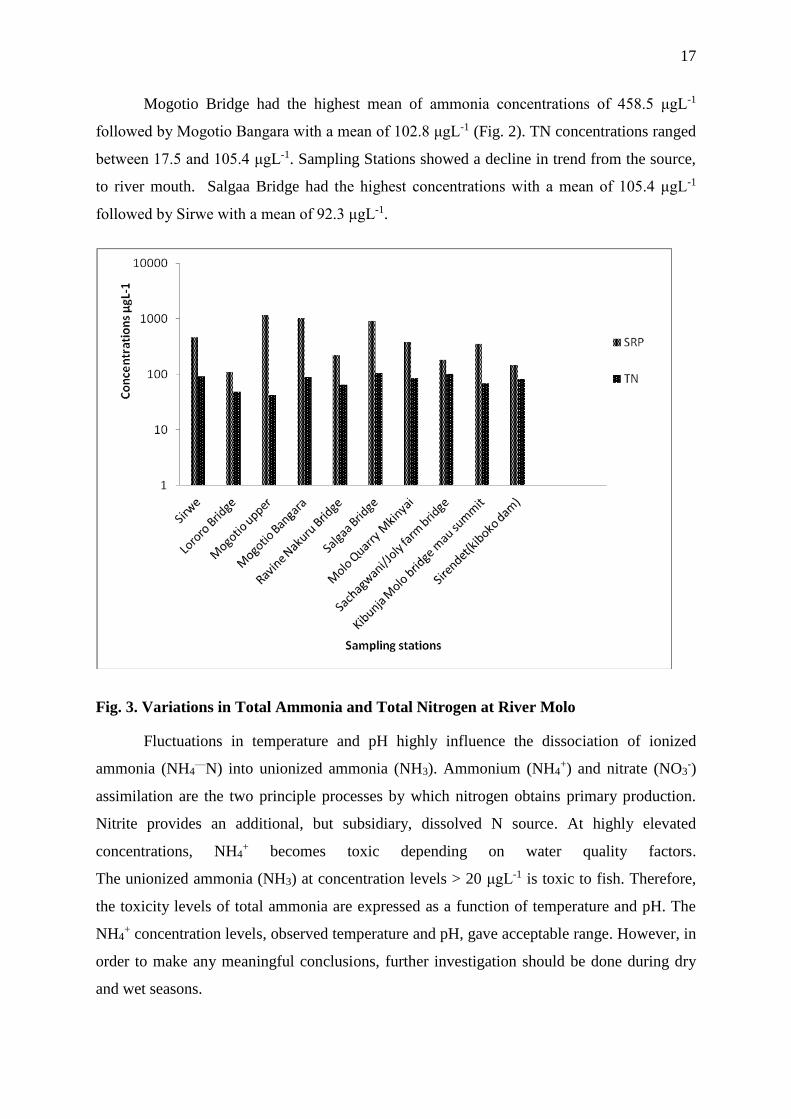
Mogotio Bridge had the highest mean of ammonia concentrations of 458.5 μgL-1
followed by Mogotio Bangara with a mean of 102.8 μgL-1 (Fig. 2). TN concentrations ranged
between 17.5 and 105.4 μgL-1. Sampling Stations showed a decline in trend from the source,
to river mouth. Salgaa Bridge had the highest concentrations with a mean of 105.4 μgL-1
followed by Sirwe with a mean of 92.3 μgL-1.
Fig. 3. Variations in Total Ammonia and Total Nitrogen at River Molo
Fluctuations in temperature and pH highly influence the dissociation of ionized
ammonia (NH4—N) into unionized ammonia (NH3). Ammonium (NH4
+) and nitrate (NO3-)
assimilation are the two principle processes by which nitrogen obtains primary production.
Nitrite provides an additional, but subsidiary, dissolved N source. At highly elevated
concentrations, NH4+ becomes toxic depending on water quality factors.
The unionized ammonia (NH3) at concentration levels > 20 μgL-1 is toxic to fish. Therefore,
the toxicity levels of total ammonia are expressed as a function of temperature and pH. The
NH4+ concentration levels, observed temperature and pH, gave acceptable range. However, in
order to make any meaningful conclusions, further investigation should be done during dry
and wet seasons.
18
3.1.2 Nutrients
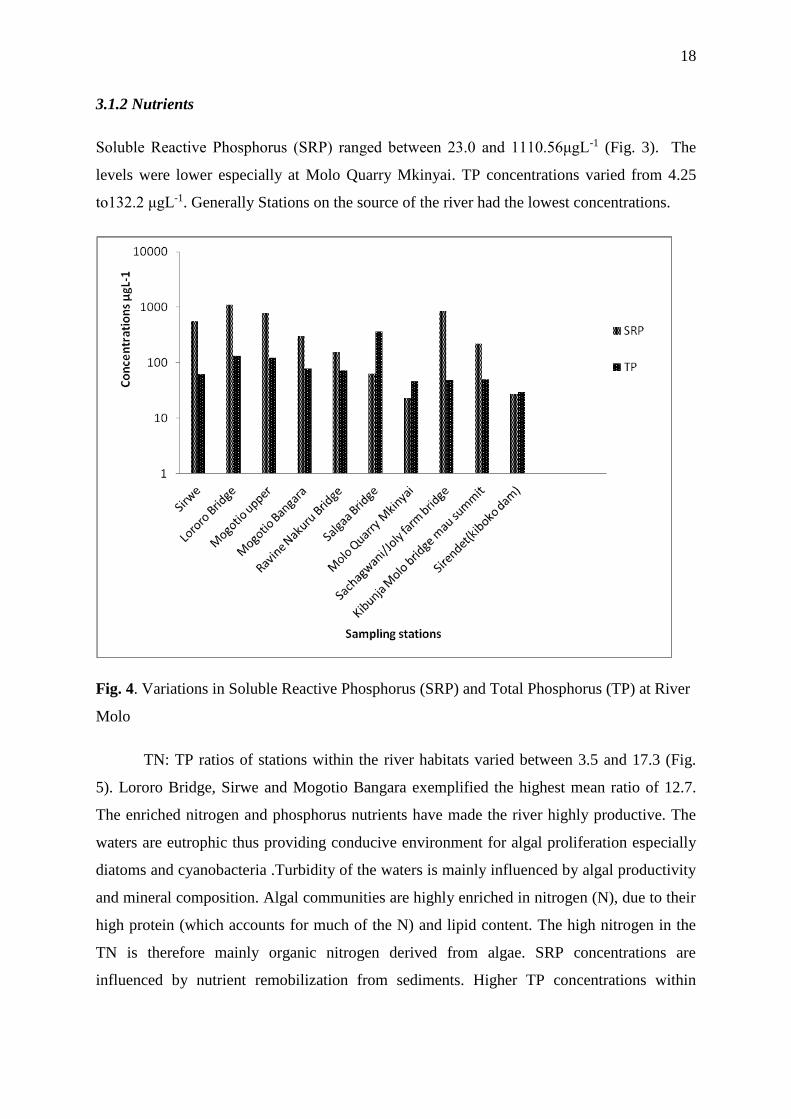
Soluble Reactive Phosphorus (SRP) ranged between 23.0 and 1110.56μgL-1 (Fig. 3). The
levels were lower especially at Molo Quarry Mkinyai. TP concentrations varied from 4.25
to132.2 μgL-1. Generally Stations on the source of the river had the lowest concentrations.
Fig. 4. Variations in Soluble Reactive Phosphorus (SRP) and Total Phosphorus (TP) at River
Molo
TN: TP ratios of stations within the river habitats varied between 3.5 and 17.3 (Fig.
5). Lororo Bridge, Sirwe and Mogotio Bangara exemplified the highest mean ratio of 12.7.
The enriched nitrogen and phosphorus nutrients have made the river highly productive. The
waters are eutrophic thus providing conducive environment for algal proliferation especially
diatoms and cyanobacteria .Turbidity of the waters is mainly influenced by algal productivity
and mineral composition. Algal communities are highly enriched in nitrogen (N), due to their
high protein (which accounts for much of the N) and lipid content. The high nitrogen in the
TN is therefore mainly organic nitrogen derived from algae. SRP concentrations are
influenced by nutrient remobilization from sediments. Higher TP concentrations within

19
stations are an indication that the agricultural farm practices are impacting negatively on the
environment. TN/TP ratios observed within the study sites indicated nitrogen limitation.
Fig. 5. Variation in TN/TP ratios of River Molo sites
3.2 Phytoplankton results
There were 54 different species of algae identified from River Molo during this survey. Of
the 9 different species of cyanophytes encountered, Chroococcus, Anabaena and
Aphanocapsa were the most common genera especially in Mogotio upper/bridge. Similarly,
there were 15 species of chlorophytes encountered of which Scenedesmus, Ankistrodemus
and Tetraedron were the most frequently encountered genera. Only one species of
dinoflagellates (glenoridinium spp.) was encountered in Kasamoyo station. Seventeen
different species of diatoms, mainly represented by Nitzschia, Surillella, Navicula and
Cyclotella genera were also observed. The 5th major algal groups encountered were the
euglenophytes which were represented by 8 genera with 10 different species.
20
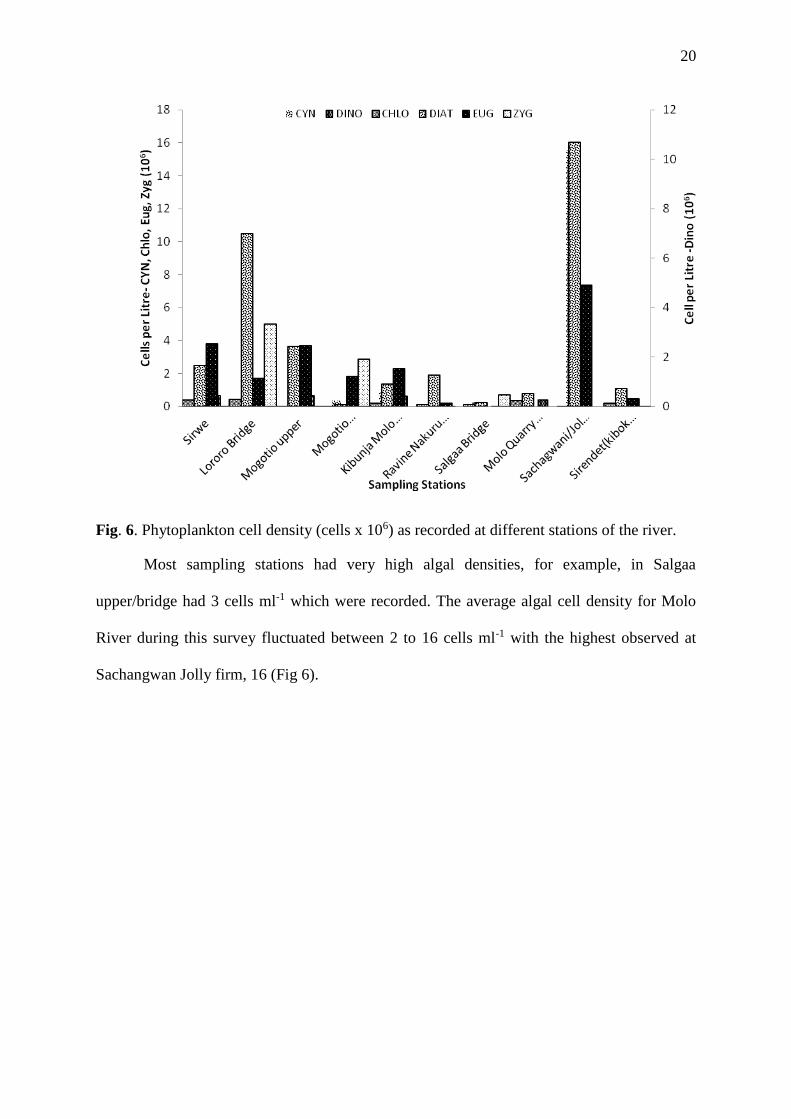
Fig. 6. Phytoplankton cell density (cells x 106) as recorded at different stations of the river.
Most sampling stations had very high algal densities, for example, in Salgaa
upper/bridge had 3 cells ml-1 which were recorded. The average algal cell density for Molo
River during this survey fluctuated between 2 to 16 cells ml-1 with the highest observed at
Sachangwan Jolly firm, 16 (Fig 6).
21
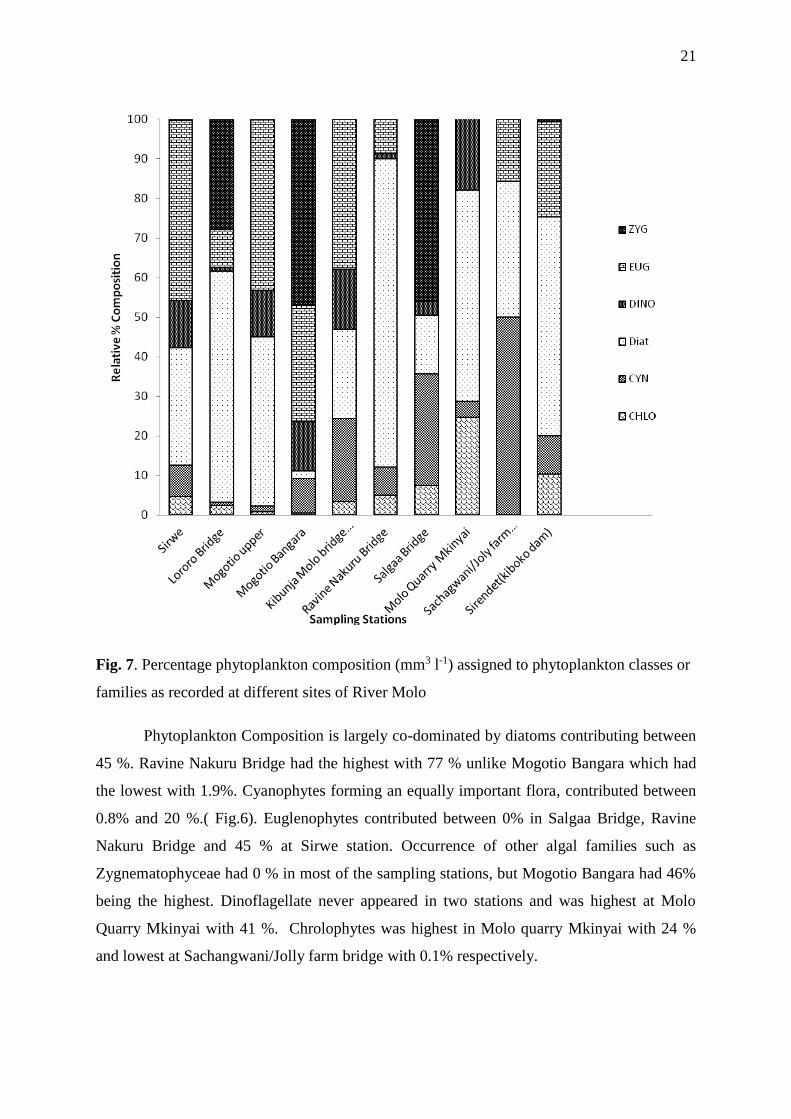
Fig. 7. Percentage phytoplankton composition (mm3 l-1) assigned to phytoplankton classes or
families as recorded at different sites of River Molo
Phytoplankton Composition is largely co-dominated by diatoms contributing between
45 %. Ravine Nakuru Bridge had the highest with 77 % unlike Mogotio Bangara which had
the lowest with 1.9%. Cyanophytes forming an equally important flora, contributed between
0.8% and 20 %.( Fig.6). Euglenophytes contributed between 0% in Salgaa Bridge, Ravine
Nakuru Bridge and 45 % at Sirwe station. Occurrence of other algal families such as
Zygnematophyceae had 0 % in most of the sampling stations, but Mogotio Bangara had 46%
being the highest. Dinoflagellate never appeared in two stations and was highest at Molo
Quarry Mkinyai with 41 %. Chrolophytes was highest in Molo quarry Mkinyai with 24 %
and lowest at Sachangwani/Jolly farm bridge with 0.1% respectively.
22
Results from the present study showed temporal changes of phytoplankton community
structure which is influenced by anthropogenic inputs of nutrients from agricultural flower
firms from Mau catchment areas. Diatoms were dominant by over 45 %, because of a direct
result of supply of nutrients from agricultural lands that surround the river. It was noted that
Mogotio bridge/upper and Mogotio Bangara had the highest mean concentration of ammonia
(92.3 μgL-1 ) this may be a result of dinoflagellates and blue green algae which causes
depletion of oxygen thus reducing habitats for living organisms especially fish and other
aquatic organisms.
Flower firms deposits high amounts of waste for the rapid proliferation of the
phytoplankton. The study observed high concentrations of algal families especially, Diatoms,
Cynophyceae, Euglenophytes and Chlorophytes, which were mainly dominant in the survey.
Although diatoms dominates, it appears to be some pockets of other algal groups such as
Chlorophytes and Cynobacteria which also contribute significantly to phytoplankton
community although this varies with time and space. The most significant driving forces that
cause predictable variations in phytoplankton composition is due to algal species occupying
different ecological niches within the river. The high abundance of diatom families is an
indication of cultural eutrophication which is a clear indication of trophic status of the river.
This is correlated with the high physio-chemical parameters recorded in the stations
sampled. Turbidity favours the dominance of cynobacteria which are able to fix nitrogen
from the atmosphere. The high nutrients enrichment seems to enhance growth and is
responsible for the increased algal density and more especially diatoms which are
proportionately high in most of the stations. The greens and diatoms species are known to
prevail in nutrient rich (Wetzel, 1991) and high light intensity areas and can attain high
photosynthetic efficiencies. Thus, physiochemical parameters such as temperature, dissolved
oxygen (DO), river depth and size affect the abundance, species composition, stability,
productivity, and physiological condition of indigenous populations of aquatic organisms.
Thus, the nature and health of aquatic communities is an expression of the limnological status
of water body. Changes in these water quality variables bring about changes in phytoplankton
communities and consequently affect the quantity and quality of food items available for
invertebrates as well as fish, thus, affecting fish production. Phytoplankton studies, therefore,
help to explain the distribution and abundance of fishes in a particular environment.
23
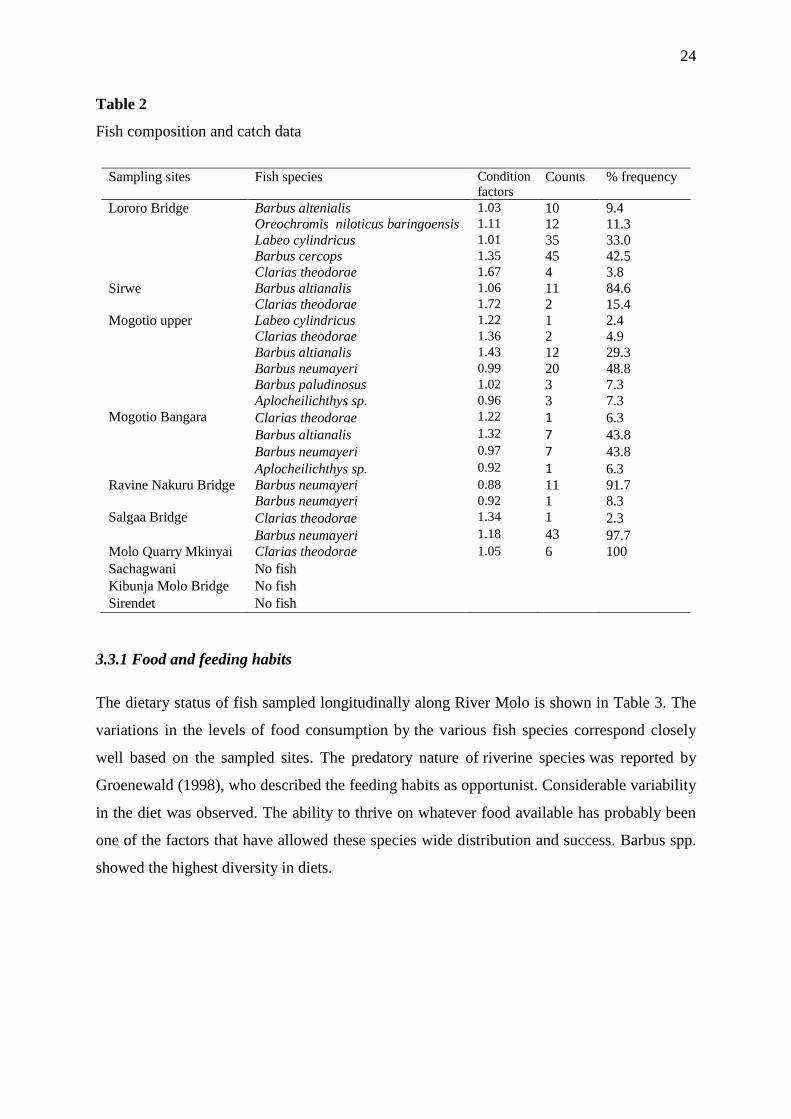
3.3 Fish abundance and distribution
A total of 7 fish species were collected during the longitudinal River Molo sampling
expedition (Table 2). There was a significant difference in the fish catch data based on the
sampling location and fish species (P < 0.05). Meanwhile the interaction between sampling
location and fish species resulted in difference in the catch data. Mogotio upper had the
highest number of sampled species at 6 followed Lororo Bridge where 5 species were
sampled while Sirwe, Ravine Nakuru Bridge, Salgaa Bridge contained only two species of
fish, Molo Quarry Mkinyai Bridge had one species of fish with no observation of any fish
species in Sachagwani, Kibunja Molo Bridge and Sirendet. It’s therefore worth highlighting
that the river had very low species diversity at the upper reaches, and the fish were small in
size making commercial fisheries exploitation not feasible. However, the upper river section
can be very useful in recruitment into the fisheries downstream and eventually into the Lake
Baringo. Therefore, the results shows that species diversity of the river increased as one
moved from upstream to downstream. In terms of species distribution, Barbus spp. especially
Barbus altianalis was the most widely distributed species in river.
There were also differences in the sex ratios of the species with Barbus altenialis and
Barbus neumayeri being the only species where males dominated over the female, while most
of the species had higher proportion of females than males.
24
Table 2
Fish composition and catch data
Sampling sites Fish species Condition
factors Counts % frequency
Lororo Bridge Barbus altenialis 1.03 10 9.4
Oreochromis niloticus baringoensis 1.11 12 11.3
Labeo cylindricus 1.01 35 33.0
Barbus cercops 1.35 45 42.5
Clarias theodorae 1.67 4 3.8
Sirwe Barbus altianalis 1.06 11 84.6
Clarias theodorae 1.72 2 15.4
Mogotio upper Labeo cylindricus 1.22 1 2.4
Clarias theodorae 1.36 2 4.9
Barbus altianalis 1.43 12 29.3
Barbus neumayeri 0.99 20 48.8
Barbus paludinosus 1.02 3 7.3
Aplocheilichthys sp. 0.96 3 7.3
Mogotio Bangara Clarias theodorae 1.22 1 6.3
Barbus altianalis 1.32 7 43.8
Barbus neumayeri 0.97 7 43.8
Aplocheilichthys sp. 0.92 1 6.3
Ravine Nakuru Bridge Barbus neumayeri 0.88 11 91.7
Barbus neumayeri 0.92 1 8.3
Salgaa Bridge Clarias theodorae 1.34 1 2.3
Barbus neumayeri 1.18 43 97.7
Molo Quarry Mkinyai Clarias theodorae 1.05 6 100
Sachagwani No fish
Kibunja Molo Bridge No fish
Sirendet No fish
3.3.1 Food and feeding habits
The dietary status of fish sampled longitudinally along River Molo is shown in Table 3. The
variations in the levels of food consumption by the various fish species correspond closely
well based on the sampled sites. The predatory nature of riverine species was reported by
Groenewald (1998), who described the feeding habits as opportunist. Considerable variability
in the diet was observed. The ability to thrive on whatever food available has probably been
one of the factors that have allowed these species wide distribution and success. Barbus spp.
showed the highest diversity in diets.
25
Table 3
Dietary status of fish sampled along different locations of River Molo
Sampling sites Stomach fullness Dominant food type
Lororo Bridge Barbus altenialis 0.5 Plant materials, Coleoptera
remains, insect remains, plant seeds
Oreochromis niloticus
baringoensis
0.7 Plant materials, detritus, Coleoptera
remains, insect remains
Labeo cylindricus 0.58 Plant materials, detritus
insect remains, plant seeds
Barbus cercops 0.65 Insect remains, Coleoptera remains,
plant seeds
Clarias theodorae 0.75 Coleoptera remains
Sirwe Barbus altianalis 0.65 Plant materials
Clarias theodorae 1.00 Coleoptera remains, Ephemeroptera
remains, Chironomids
Mogotio upper Barbus altenialis 0.75 Plant materials
Labeo cylindricus 0.5 Chironomids, detritus
Clarias theodorae 0.85 Plant materials, insect remains
Barbus neumayeri 0.75 Coleoptera remains, plant seeds,
Odonata, insect remains
Barbus paludinosus 0.55 Plant seeds
Aplocheilichthys sp. 0.45 Plant remains
Mogotio Bangara Clarias theodorae 0.52 Plant remains
Barbus altianalis 0.75 Plant materials, detritus Barbus neumayeri 0.42 Plant materials Aplocheilichthys sp. 0.55 Plant materials Ravine Nakuru Bridge Barbus neumayeri 0.35 Detritus
Barbus neumayeri 0.45 Detritus
Salgaa Bridge Clarias theodorae 0.85 Plant materials, insect remains,
simulium, Chironomids
Barbus neumayeri 0.82 Plant remains
Molo Quarry Mkinyai Clarias theodorae 0.72 Plant materials
Sachagwani No fish
Molo Bridge No fish
Sirendet No fish
3.3.2 Length/Weight relationships
The length/weight relationships of the fish species sampled during the study is provided in
Figure 3. The b exponent value of the relationship show the type growth exhibited by the fish
species in River Molo. For instance only Labeo cylindricus had b < 3, an indication that the
species exhibited a positive allometric growth. L. cylindricus were plumb a pointer to the
river being ideal for the species growth. The rest of the groups’ exhibited negative allometry
which represents skinny fish.
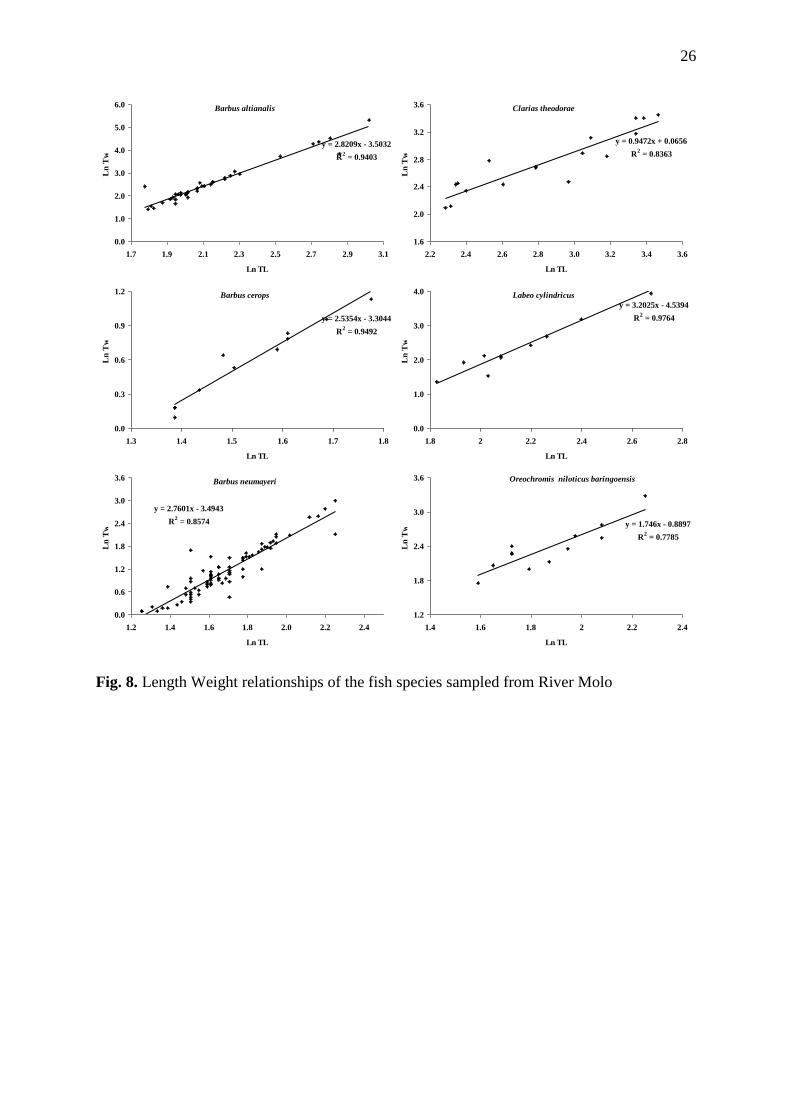
26
Fig. 8. Length Weight relationships of the fish species sampled from River Molo
Barbus altianalis
y = 2.8209x - 3.5032
R2 = 0.9403
0.0
1.0
2.0
3.0
4.0
5.0
6.0
1.7 1.9 2.1 2.3 2.5 2.7 2.9 3.1
Ln TL
Ln
Tw
Barbus cerops
y = 2.5354x - 3.3044
R2 = 0.9492
0.0
0.3
0.6
0.9
1.2
1.3 1.4 1.5 1.6 1.7 1.8
Ln TL
Ln
Tw
Barbus neumayeri
y = 2.7601x - 3.4943
R2 = 0.8574
0.0
0.6
1.2
1.8
2.4
3.0
3.6
1.2 1.4 1.6 1.8 2.0 2.2 2.4
Ln TL
Ln
Tw
Clarias theodorae
y = 0.9472x + 0.0656
R2 = 0.8363
1.6
2.0
2.4
2.8
3.2
3.6
2.2 2.4 2.6 2.8 3.0 3.2 3.4 3.6
Ln TL
Ln
Tw
Labeo cylindricus
y = 3.2025x - 4.5394
R2 = 0.9764
0.0
1.0
2.0
3.0
4.0
1.8 2 2.2 2.4 2.6 2.8
Ln TL
Ln
Tw
Oreochromis niloticus baringoensis
y = 1.746x - 0.8897
R2 = 0.7785
1.2
1.8
2.4
3.0
3.6
1.4 1.6 1.8 2 2.2 2.4
Ln TL
Ln
Tw
27
3.3.3 Breeding
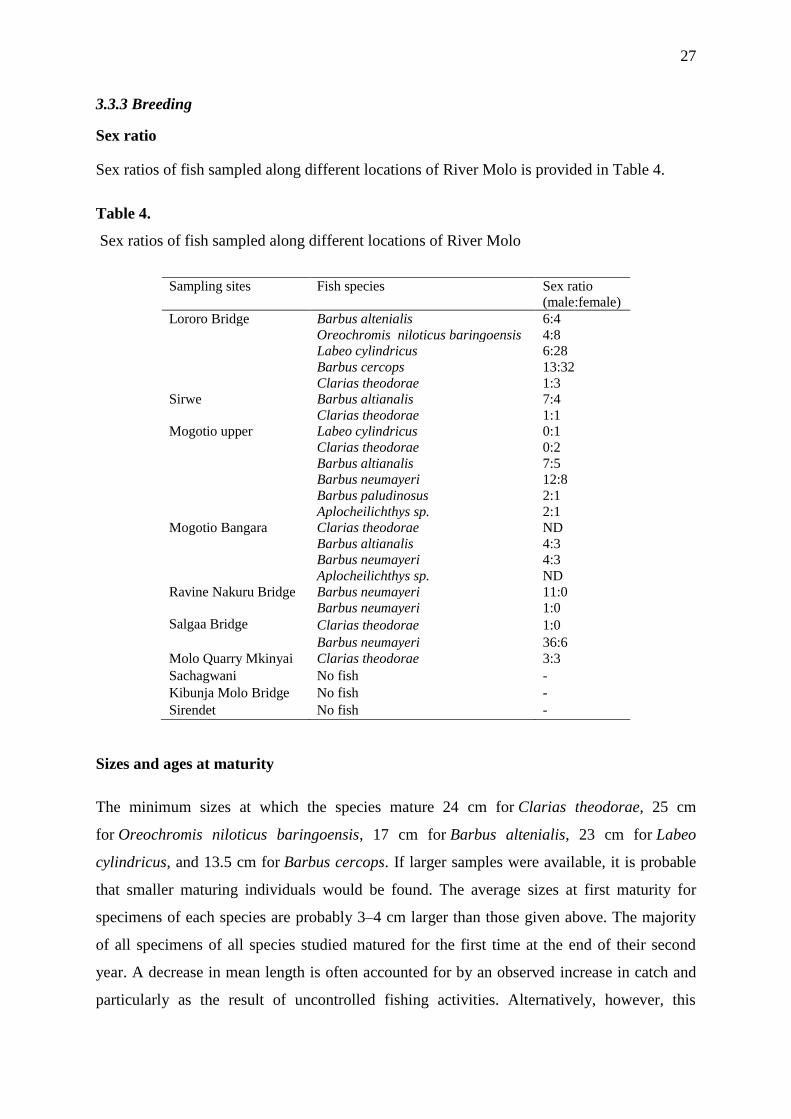
Sex ratio
Sex ratios of fish sampled along different locations of River Molo is provided in Table 4.
Table 4.
Sex ratios of fish sampled along different locations of River Molo
Sampling sites Fish species Sex ratio
(male:female)
Lororo Bridge Barbus altenialis 6:4
Oreochromis niloticus baringoensis 4:8
Labeo cylindricus 6:28
Barbus cercops 13:32
Clarias theodorae 1:3
Sirwe Barbus altianalis 7:4
Clarias theodorae 1:1
Mogotio upper Labeo cylindricus 0:1
Clarias theodorae 0:2
Barbus altianalis 7:5
Barbus neumayeri 12:8
Barbus paludinosus 2:1
Aplocheilichthys sp. 2:1
Mogotio Bangara Clarias theodorae ND
Barbus altianalis 4:3
Barbus neumayeri 4:3
Aplocheilichthys sp. ND
Ravine Nakuru Bridge Barbus neumayeri 11:0
Barbus neumayeri 1:0
Salgaa Bridge Clarias theodorae 1:0
Barbus neumayeri 36:6
Molo Quarry Mkinyai Clarias theodorae 3:3
Sachagwani No fish -
Kibunja Molo Bridge No fish -
Sirendet No fish -
Sizes and ages at maturity
The minimum sizes at which the species mature 24 cm for Clarias theodorae, 25 cm
for Oreochromis niloticus baringoensis, 17 cm for Barbus altenialis, 23 cm for Labeo
cylindricus, and 13.5 cm for Barbus cercops. If larger samples were available, it is probable
that smaller maturing individuals would be found. The average sizes at first maturity for
specimens of each species are probably 3–4 cm larger than those given above. The majority
of all specimens of all species studied matured for the first time at the end of their second
year. A decrease in mean length is often accounted for by an observed increase in catch and
particularly as the result of uncontrolled fishing activities. Alternatively, however, this
28
diminution could also be explained by an increase in recruitment success through the
sporadic flooding events. A common observation was that fish of 30 cm length were being
harvested, implying that the corresponding changes in the gill net selectivity had resulted in
the removal of a significant number of immature fish that were accordingly smaller than size
at first maturation. We therefore support the notion that a minimum legal size of 42 cm is an
appropriate catch limit. Such a minimum size would guarantee that recently recruited
individuals in the fishery have the opportunity to reproduce completely at least once.
3.4 Macroinvertebrate distribution data of River Molo
During the study, 39 species belonging to 12 families of benthic macroinvertebrates were
observed at the 10 sampling sites having variant land use activities. There were significant
differences in the occurrence of macroinvertebrate among sites (Chi-square; 2 = 20.1121, df
= 3, P = 0.0031). Baetidae were the most abundant in the samples and appeared in all the
sampling sites. Tricorythidae, Naucoridae, Limnephilidae larvae, Dytiscidae,
Ceratopogonidae, Lymnaeidae, Crab and Grasshopper were found in only one sampling site
perhaps due to the limited number of sampling and suggest that these species display
seasonality in occurrence. There were significant differences in abundance of all species
among the sampling sites (One-Way ANOVA; P < 0.05), which seems to vary based on
differing land use activities. Upper reaches stations had the highest abundance of Hemiptera
of genus Veliidae, Gerridar and coleopteran of genus Gyrinidae Agrion, Planorbis,
Lumbricus, Heptogenia, Collicorixa and Gyrinus. Meanwhile the mid reaches of the river
was dominated by macroinveterbrate of genera: Baetidae, Limnaea, Gerris, Agrion,
Platambus and Ilybius. The lower reaches were dominated by Heptogenia, Chironomus and
Haliplus. The areas with most human activities were dominated by: Baetis, Tipula, Caenis,
Epeorus and Ephemeralla.
29
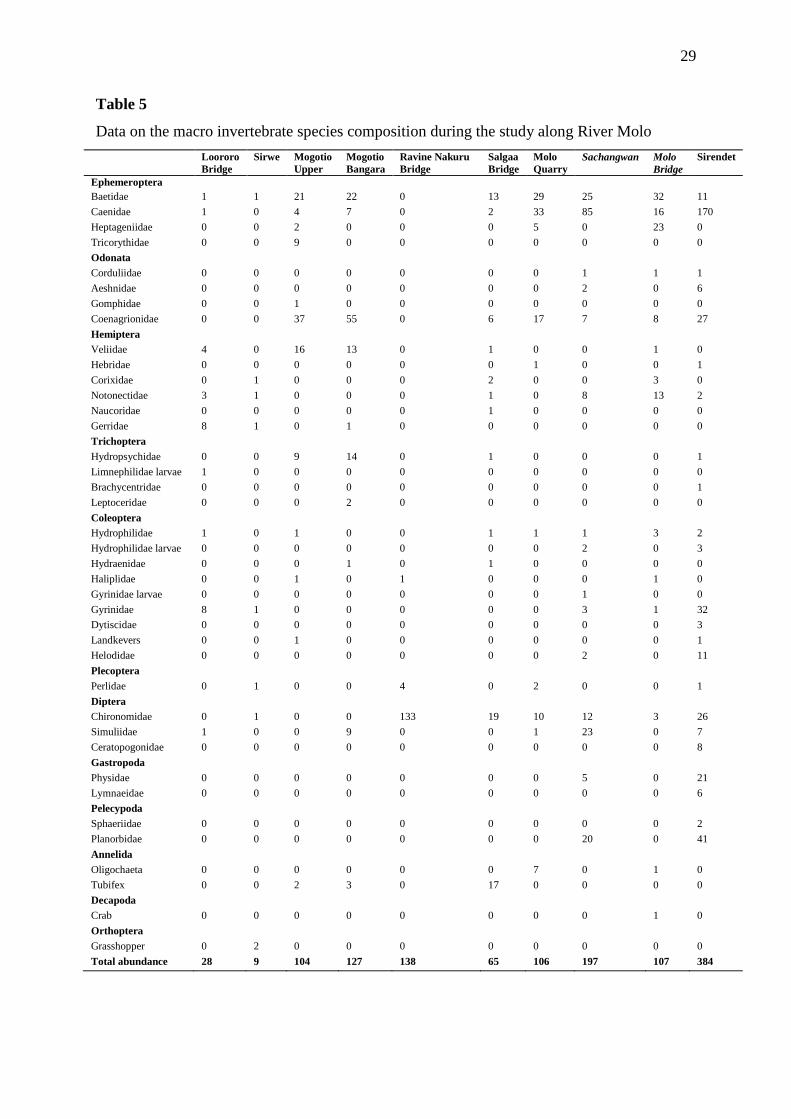
Table 5
Data on the macro invertebrate species composition during the study along River Molo
Loororo
Bridge
Sirwe Mogotio
Upper
Mogotio
Bangara
Ravine Nakuru
Bridge
Salgaa
Bridge
Molo
Quarry
Sachangwan Molo
Bridge
Sirendet
Ephemeroptera
Baetidae 1 1 21 22 0 13 29 25 32 11
Caenidae 1 0 4 7 0 2 33 85 16 170
Heptageniidae 0 0 2 0 0 0 5 0 23 0
Tricorythidae 0 0 9 0 0 0 0 0 0 0
Odonata
Corduliidae 0 0 0 0 0 0 0 1 1 1
Aeshnidae 0 0 0 0 0 0 0 2 0 6
Gomphidae 0 0 1 0 0 0 0 0 0 0
Coenagrionidae 0 0 37 55 0 6 17 7 8 27
Hemiptera
Veliidae 4 0 16 13 0 1 0 0 1 0
Hebridae 0 0 0 0 0 0 1 0 0 1
Corixidae 0 1 0 0 0 2 0 0 3 0
Notonectidae 3 1 0 0 0 1 0 8 13 2
Naucoridae 0 0 0 0 0 1 0 0 0 0
Gerridae 8 1 0 1 0 0 0 0 0 0
Trichoptera
Hydropsychidae 0 0 9 14 0 1 0 0 0 1
Limnephilidae larvae 1 0 0 0 0 0 0 0 0 0
Brachycentridae 0 0 0 0 0 0 0 0 0 1
Leptoceridae 0 0 0 2 0 0 0 0 0 0
Coleoptera
Hydrophilidae 1 0 1 0 0 1 1 1 3 2
Hydrophilidae larvae 0 0 0 0 0 0 0 2 0 3
Hydraenidae 0 0 0 1 0 1 0 0 0 0
Haliplidae 0 0 1 0 1 0 0 0 1 0
Gyrinidae larvae 0 0 0 0 0 0 0 1 0 0
Gyrinidae 8 1 0 0 0 0 0 3 1 32
Dytiscidae 0 0 0 0 0 0 0 0 0 3
Landkevers 0 0 1 0 0 0 0 0 0 1
Helodidae 0 0 0 0 0 0 0 2 0 11
Plecoptera
Perlidae 0 1 0 0 4 0 2 0 0 1
Diptera
Chironomidae 0 1 0 0 133 19 10 12 3 26
Simuliidae 1 0 0 9 0 0 1 23 0 7
Ceratopogonidae 0 0 0 0 0 0 0 0 0 8
Gastropoda
Physidae 0 0 0 0 0 0 0 5 0 21
Lymnaeidae 0 0 0 0 0 0 0 0 0 6
Pelecypoda
Sphaeriidae 0 0 0 0 0 0 0 0 0 2
Planorbidae 0 0 0 0 0 0 0 20 0 41
Annelida
Oligochaeta 0 0 0 0 0 0 7 0 1 0
Tubifex 0 0 2 3 0 17 0 0 0 0
Decapoda
Crab 0 0 0 0 0 0 0 0 1 0
Orthoptera
Grasshopper 0 2 0 0 0 0 0 0 0 0
Total abundance 28 9 104 127 138 65 106 197 107 384

30
Species diversity of macroinvetebrates are shown in Figure 4. Highest diversity of
macroinvetebrates occurred in Sirwe and Lororo Brige probably due to the undisturbed nature
of these stations and the lowest was in Ravine Nakuru Bridge where there was discharge of
several pollutants from the flower farms, agricultural runoffs from the nearby commercial
farms and defecation by livestock.
0.00
0.50
1.00
1.50
2.00
2.50
3.00
3.50
4.00
Looro
ro B
ridge
Sirwe
Mog
otio
Upp
er
Mog
otio
Ban
gara
Rav
ine N
akur
u Brid
ge
Salga
a Brid
ge
Mol
o Qua
rry
Sacha
ngw
an
Mol
o Brid
ge
Sirend
et
Sampling locations
Sh
an
no
n W
ein
er I
nd
ex (
H')
Fig. 9. Shannon-Weiner diversity index for macroinvertebrates in River Molo
4. Conclusions
The River Molo fisheries study constitutes the first documented example within the Mau
Catchment Basin where the fish status has been assessed under changing land use patterns.
Therefore, the results presented can be termed as preliminary taking into consideration the
few specimens recorded for some species and study duration. More so, the factors affecting
River Molo fisheries are not clear at the moment, even though anthropogenic activities in the
catchment could be among the factors. A comprehensive study conducted throughout the year
capturing seasonality patterns need to be done since the present study was accomplished
during the wet season. The fisheries of River Molo were observed be low and unsustainable
with fish showing poor living conditions and restricted feeding habits.
31
4.1 Management recommendations
i. There is need to allocate more funds for regular monitoring exercises in the river’s
aquatic ecosystem to enhance the protection of its biota and propose appropriate
mitigation measures.
ii. The River Molo and its catchment areas are considered Environmentally
Significant Areas, and established governmental policies should strictly be
enforced to ensure all effluent from individual farms adhere to EMCA standards.
iii. WRMA should take lead in developing policy framework governing resource use
across the river basin based on integrated management of water and resources.
iv. Communities’ awareness creation is emphasized for re-evaluation of ways to
sustainably utilize the river Molo with minimal adverse effects on its biota.
32
References
Acreman, M., Arthington, A.H., Colloff, M.J., Couch, C., Crossman, N.D., Dyer, F., Overton,
I., Pollino, C.A., Stewardson, M.J. and Young, W. (2014). Environmental flows for
natural, hybrid, and novel riverine ecosystems in a changing world. Frontiers in
Ecology and the Environment. 12: 466‒473.
APHA (2005). Standard Methods for the Examination of Water and Wastewater. American
Public Health Association, Washington, DC.
Arthington, A.H., Bunn, S.E., Poff, N.L. and Naiman, R.J. (2006). The challenge of
providing environmental flow rules to sustain river ecosystems. Ecological
Applications. 16: 1311‒1318.
Béné, C., Arthur, R., Norbury, H., Allison, E.H., Beveridge, M., Bush, S., Campling, L.,
Leschen, W., Little, D., Squires, D. and Thilsted, S.H. (2016). Contribution of
fisheries and aquaculture to food security and poverty reduction: assessing the current
evidence. World Development. 79: 177‒196.
Boerema, L.K. and Gulland, J.A. (1973). Stock assessment of the Peruvian anchovy
(Engraulis ringens) and management of the fishery. Journal of the Fisheries Board of
Canada. 30: 2226‒2235.
Cadwalladr, D.A. (1965). The decline in the Labeo victorianus Blgr.(Pisces: Cyprinidae)
fishery of Lake Victoria and an associated deterioration in some indigenous fishing
methods in the Nzoia River, Kenya. East African Agricultural and Forestry
Journal. 30: 249‒256.
Hering, D., Carvalho, L., Argillier, C., Beklioglu, M., Borja, A., Cardoso, A.C., Duel, H.,
Ferreira, T., Globevnik, L., Hanganu, J. and Hellsten, S. (2016). Managing aquatic
ecosystems and water resources under multiple stress—An introduction to the MARS
project. Science of the total environment. 503: 10‒21.
Ochumba, P.B.O. and Ala, J. (1992). Distribution of fishes along the Sondu‐Miriu River of
Lake Victoria, Kenya with special reference to upstream migration, biology and
yield. Aquaculture Research. 23: 701‒719.
Oeding, S., Taffs, K.H., Cox, B., Reichelt-Brushett, A. and Sullivan, C. (2018). The influence
of land use in a highly modified catchment: Investigating the importance of scale in
riverine health assessment. Journal of Environmental Management. 206: 1007‒1019.
Rad, S.D., Allègre, C.J. and Louvat, P. (2007). Hidden erosion on volcanic islands. Earth and
Planetary Science Letters. 262: 109‒124.

33
Tonkin, J.D., Merritt, D.M., Olden, J.D., Reynolds, L.V. and Lytle, D.A. (2018). Flow regime
alteration degrades ecological networks in riparian ecosystems. Nature Ecology &
Evolution. 2: 86.
Welcomme, R.L. (1985). River fisheries [Pesca fluvial]. FAO fisheries technical paper, 262,
p. 330.
Whitehead, P.J.P. (1959). The River Fisheries of Kenya I—Nyanza Province. The East
African Agricultural Journal. 24: 274‒278.
34
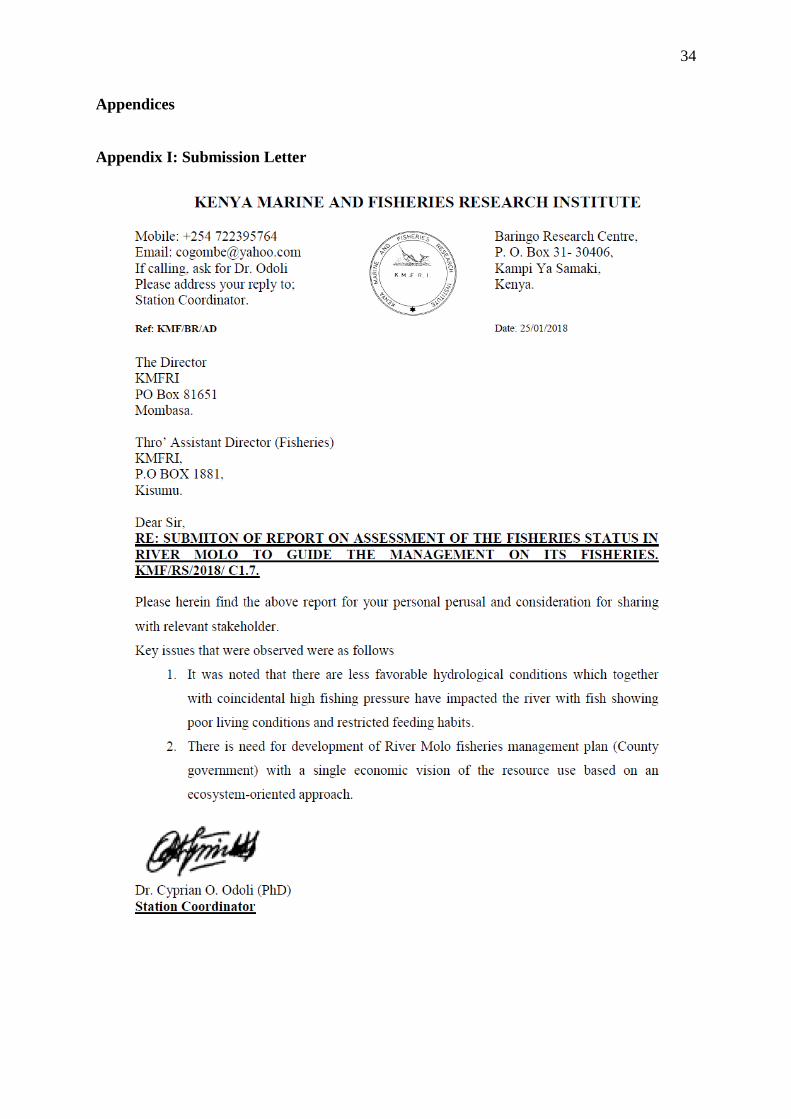
Appendices
Appendix I: Submission Letter
35
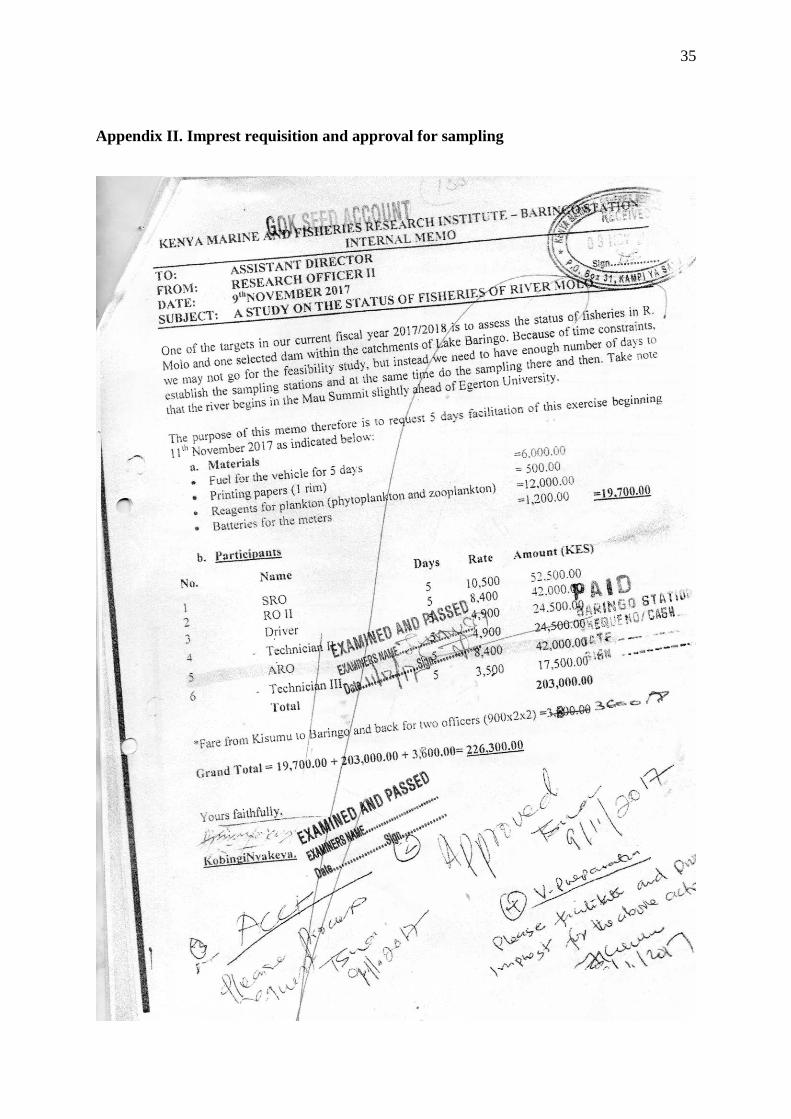
Appendix II. Imprest requisition and approval for sampling

36
Appendix III: Participants Invitation Letter
37
Appendix IV: Further dissemination
38

39


